Embed Size (px)
Citation preview

Prepared by:
ACKNOWLEDGEMENTS
BC Ferries Commissioners’ Review of BC Ferries’ Annual Customer Satisfaction Tracking Survey FINAL REPORT – October 17, 2017 FIN

Review of BC Ferries’ Annual Customer Satisfaction Tracking Survey
2
TABLE OF CONTENTS
1. Executive Summary .......................................................................................... 3
2. Introduction ....................................................................................................... 8
2.1. Background .................................................................................................................................... 8 2.2. Objectives and Scope of the Review .............................................................................................. 9
3. Approach to the Review ................................................................................... 9
3.1. Approach ........................................................................................................................................ 9 3.2. Limitations .................................................................................................................................... 11
4. Leading Practices in Customer Satisfaction Tracking ................................. 12
4.1. Measuring Customer Satisfaction ................................................................................................ 12
5. Summary of Stakeholder Feedback ............................................................... 16
6. General Conclusion and Considerations for Improvement ......................... 22
7. Appendices ...................................................................................................... 25

Review of BC Ferries’ Annual Customer Satisfaction Tracking Survey
3
1. EXECUTIVE SUMMARY
In July 2017, MNP was engaged to conduct a third-party
review of BC Ferries’ Customer Satisfaction Tracking Survey
(CST) on behalf of the BC Ferries Commissioner (BCFC).
MNP worked collaboratively with BC Ferries, the BCFC, and
several stakeholders to collect and analyse information
related to the CST. The BC Ferries’ CST Survey has been
conducted annually since 2003. MNP reviewed the annual
surveys, execution methodology and resulting information for
all available data from 2003 to present, and supplemented
that analysis with primary and secondary research to develop
this report. Following is a summary of MNP’s responses to the
overarching questions used for the review as well as future
considerations for potential improvement that are expanded
upon throughout this report.
1. Is a reasonably representative group of Designated Ferry Routes being engaged through the survey, and are any significant ferry user groups1 being excluded from the survey?
In terms of the total population of ferry users and their
experiences, the CST Survey is reasonably representative by
virtue of surveying routes carrying approximately 75% to 80%
of the overall number of ferry passengers each year. The
surveys are typically conducted on 8 to 10 out of 24 routes2.
While the data can be considered reasonably representative
in terms of total population, the consolidated reporting of the
survey results is more reflective of the experiences of those
on major and southern routes. As each route has its own
distinctions in terms of ridership, schedules and available
services, the data as presented in the annual CST Survey
reports may not fully represent the views along with
experiences of northern and other specific commuter-based
passengers3.
2. Does the survey cover the full range of activities, as set out in Section 6.02 of the contract, and are there any gaps that should be addressed?
The CST Survey does address the range of activities as set out in Section 6.02 of the Coastal Ferry
Services Contract. However, the survey results are for the current trip only, with limited opportunity to
1 Ferry users are considered to include, but not be limited to, residents, commuters, tourists, commercial operators, dependent businesses, and emergency service providers. 2 BC Ferries commented that they launched a pilot project in 2015 to re-introduce the CST survey on Routes 10 and 11 (Port Hardy – Mid Coast – Prince Rupert; Haida Gwaii to Prince Rupert). 3 BC Ferries stated that they rely on survey results from commuter routes such as Route 3, which has the largest commuter segment in the system, as well as other surveyed routes with commuter traffic, to be representative of non-surveyed routes.
Article 6 of the Coastal Ferry Services Contract sets out terms for the customer satisfaction survey program:
6.01 During the first year of the Term and continuing in each calendar year thereafter, BC Ferries will engage a professional consulting organization, independent of BC Ferries, to conduct and complete a customer satisfaction survey with respect to Designated Ferry Routes.
6.02 The survey will be undertaken using a representative group of Designated Ferry Routes and will measure the full range of activities in respect of which a customer is engaged with BC Ferries in some way, including the following service components: prior to arriving at the terminal (e.g., contact via website or phone); at the terminal, before boarding; on board the vessel, before disembarking; pertaining to loading/unloading from the vessel; overall safety of operations; and, value for money for fare paid.
6.03 Within three months after its fiscal year-end, BC Ferries will prepare a customer satisfaction survey report, which will include the following components: a copy of the questionnaire used in the study; a summary of the methodology; year end results of the study in table format; a comparison between benchmark measures and stated objectives; deliver a copy of the customer satisfaction survey report to the Province and the Commissioner; and, post a copy of the customer satisfaction survey report on the BC Ferries website.
Review of BC Ferries’ Annual Customer Satisfaction Tracking Survey
4
comment on prior or collective experiences within the survey. According to BC Ferries, the purpose of this
survey method is to gain trip-experience feedback. The survey is conducted three times per year,
providing information to BC Ferries at the end of each research wave. The aggregate results though, are
only published annually in the publicly released report4 It is in this sense that the annual reporting is of
less value from the perspective of informing decisions on emerging trends or issues during the year.
3. Is the methodology appropriate in terms of the intended purpose of the survey and for ensuring the engagement of ferry user groups?
The intended purpose of the CST Survey is not clearly indicated in the contract. If it can be assumed that
the intention is to ensure engagement of all ferry user groups and to gauge BC Ferries’ performance
regarding customer satisfaction, the CST Survey can be considered somewhat appropriate. The current
data collection effort exclusively uses the intercept methodology, with screeners on board who are trained
to randomly approach every fifth passenger with a request to complete the survey. The advantage to this
methodology is that the results can be considered to be taken from a random sample. Because this
methodology can be costly to carry out, routes with the highest population of travellers are selected.
Additionally, when the intercept methodology was employed on northern commuter routes in the past, it
was not well received by passengers who were repeatedly approached by screeners over a brief period.
4. Can the results of the survey be considered representative in terms of adequately reflecting the views of ferry users, all for the purpose of measuring customer satisfaction with the service?
The survey can be considered representative of the views of ferry users, but not all. To adequately reflect
the views of all ferry users, greater sampling from routes not surveyed currently and/or information from
other sources such as community engagements as well as customer service research would need to be
included. In its Annual Report to the Commissioner5, BC Ferries does include service quality information
taken from the most recent CST Survey results combined with other information on complaints resolution.
It is in this regard that the CST Survey results should be taken as one source of measurement for
customer satisfaction, but not necessarily the most representative or comprehensive unto itself.
CONCLUSION / RECOMMENDATION
While the current CST Survey is somewhat representative in its findings and has been useful in the past,
the time is appropriate for BC Ferries to address aspects of customer satisfaction in an integrated,
outcome-driven and comprehensive manner that is conducive to results-oriented management along with
governance. The CST Survey approach should be revised or augmented with other measurement tools
(information sources) to reasonably cover all routes and all customer segments. In doing so, BC Ferries
should also provide for more comprehensive and consolidated reporting. Communicating customer
satisfaction measures, along with resulting actions taken by BC Ferries, needs to be more prominent and
more frequent. Improvements to the current reporting frequency, along with expanded communication
efforts, will help strengthen oversight and better highlight actions taken by BC Ferries to respond to
customer satisfaction results on an ongoing basis.
4 Customer Satisfaction Tracking Reports” are posted on both BC Ferries’ and BCFC’s websites
5 Annual Reports to the Commissioner” are also posted on both BC Ferries’ and BCFC’s websites
Review of BC Ferries’ Annual Customer Satisfaction Tracking Survey
5
CONSIDERATIONS FOR IMPROVEMENT
Consideration #1. Provide for a Consolidated View on the State of, and Responses to, Customer Satisfaction6
The existing CST Survey and associated methodology have
captured consistent baseline along with trend information for
more than a decade. Over the same period, practices have
continued to evolve around collecting data related to
satisfaction levels. For example, customer data can be
collected in an ongoing and dynamic manner at each service
touchpoint, as evidenced through familiar phrases such as
“how did we do today?” and, “tell us about your experience”.
Electronic and in-person opportunities to provide feedback
about customer satisfaction have become more commonplace
and data collected is typically used as one facet in multi-
dimensional customer service measurement.
The CST Survey results do not represent the range of
opinions, both positive and negative, across all customer types
and service touchpoints that BC Ferries receives in other
ways. Nor do the CST Survey results necessarily reflect the
needs and views of customers travelling on all minor and
northern routes. Minor and northern route passengers can
consist of daily commuters, carriers of essential commercial
goods for community livelihood, and people travelling for
medical appointments. Their frequency of travel and reliance
upon BC Ferry services can be quite different than those
travelling on southern and major routes. This is in opposition
to the concept of sampling some routes to extrapolate
opinions and experiences representative for all. In addition, of
the commercial vehicle passengers engaged in this review,
none could recall ever being approached to complete a
survey. This means it is possible that important feedback from
customer groups such as commercial or dependent
businesses is not being consistently captured through the
current CST Survey.7
Feedback from the regional Ferry Advisory Committees (FACs) indicated that customer satisfaction
should be measured on all routes during peak, shoulder and slow periods over the year, and should
6 The BC Ferries’ Business Plan for the year ending March 31, 2018 indicates actions toward many of the considerations for
improvement outlined in this report. The BC Ferries business plan can be found at http://www.bcferries.com/files/PDFs/2018_Business_Plan.pdf 7 It is also possible that company drivers surveyed did not report that fact and as such, the business representatives interviewed were
not aware. BC Ferries relies upon their Customer Care Team to communicate and respond to concerns or feedback from commercial clients. Commercial operators engaged during this review were highly complimentary of the responsiveness and service provided by the Commercial Care Team.
BC Ferries’ Business Plan for the Year ending March 31, 2018 (pg. 23) states:
CUSTOMER ENGAGEMENT
We have an active public consultation program and continue to work closely with 13 Ferry Advisory Committees that represent the ferry dependent communities we serve. These committees are appointed in cooperation with local governments, the Islands Trust and First Nations, and discuss day-to-day operations, planned improvements, broader policy issues and strategic planning.
We will continue to engage with stakeholders to improve service and better align customer needs with sailing schedules as well as balance seasonal service, capacity and demand with operating efficiencies through the use of surveys, open houses, public meetings, community working groups, Ferry Advisory Committees and meetings with community leaders.
We are consulting with stakeholders and asking for their input on such areas as amenities, lounge configuration, accessibility and car deck arrangement of two new minor class vessels. These vessels will be the first two of six vessels of this type to be built in the coming ten years. Feedback and operational experience will be incorporated into the design of the vessels to ensure high levels of safety, customer service, environmental leadership and reliability.

Review of BC Ferries’ Annual Customer Satisfaction Tracking Survey
6
extend beyond service offerings (e.g., washrooms, catering, etc.) to also include feedback on matters of
operational policy.
While expanding the CST Survey research to meet these expectations would require additional funding,
customer feedback is being obtained by BC Ferries through other sources. For example, throughout the
year, there is the BC Ferries’ customer comment tracking system known as ResponseTek (which allows
for online and call-in comments). BC Ferries also conducts regular meetings with FACs to provide an
opportunity to directly engage with the challenges and concerns of the communities they represent.
Added to this are regular meetings between staff from BC Ferries’ Commercial Services Division and the
BC Trucking Association, to understand and incorporate the needs of the commercial segment.
With respect to reporting, BC Ferries provides the
CST Survey results in its Annual Report to the BC
Ferries Commissioner. BC Ferries details areas
where an indexed score for specific services falls
below a 3.00 rating out of 5.00. Furthermore, in its
Annual Reports to the BC Ferries Commissioner, BC
Ferries describes how underperforming services are
being addressed. BC Ferries maintains though, that it
is through the key performance indicators as well as
the CST Survey results from each research wave and
other sources of data as noted above that decisions
are being informed including on changes to customer
services along with operations. As publicly reported,
the CST Survey results are stand alone and except
for some information included in BC Ferries’ Annual
Report to the Commissioner, are not shown in
conjunction with other relevant information be it from
social media monitoring, reports from service line
managers and staff, feedback from the FACs, or data
from BC Ferries Vacations. By providing for more
consolidated reporting using these various sources of
information, and possibly revising the frequency to
match each CST research wave (which currently
coincide with peak, shoulder and slow periods), a
complete view of customer satisfaction and actions
taken in response can be produced.
Consideration #2. Focus on Outcomes and
Accountability
The Coastal Ferry Service Contract states that an
annual representative survey must be carried out.
However, the contract language is focused on the
means and not on the outcomes or actions that are
expected. The contract also does not specify any
accountability to the public for relatively low or
declining satisfaction levels other than what is
represented in Section 6.03, calling for “a comparison
BC Ferries’ Business Plan for the Year ending March 31, 2018 (pg. 50) states:
Strategic Objective 2: Deliver a customer-focussed travel experience
OBJECTIVE: Provide a compelling travel, shopping and dining experience through personalized service, selection, quality and value.
STRATEGIES AND TACTICAL STEPS:
• Implement a more proactive approach to community and customer relations, working collaboratively with Ferry Advisory Committees;
• Optimize technology at all touch points throughout a customer’s journey to create a unified and seamless customer experience; explore and develop customer self-serve opportunities throughout;
• Develop and implement revised route service schedules where appropriate; and explore opportunities with other transportation providers to improve the customer end-to-end experience;
• Strengthen the customer-centric service culture through employee training initiatives, including the Customer Service Enhancement Program and improve accessibility of onboard customer communication by using captions and symbols;
• Leverage customer research and analytics to evolve customer service strategies; develop innovative solutions to meet changing and evolving customer travel needs; and continue to offer variable pricing options;
• Continue to survey our customers to understand and to identify ways to enhance their experience and strive for an average customer satisfaction rating of 4.20; and
• Strive to maintain the vessel reliability index target of between 99.55% and 99.74%, improve on-time performance and maximize ticketing throughput to accommodate increasing reservation usage.

Review of BC Ferries’ Annual Customer Satisfaction Tracking Survey
7
between benchmark measures and stated objectives” in the annual reporting of the CST Survey.
Assuming the intent behind Section 6 of the contract was not only to administer a customer satisfaction
survey, but also to ensure that BC Ferries is aware of, and publicly responding to, the expressed
experiences across its broad customer base, the BCFC may wish to consider engaging BC Ferries in a
process that focuses more on outcomes, with greater insight and public accountability on customer
satisfaction.
Consideration #3. Strengthen the Oversight
Those stakeholders consulted felt, for the most part, that BC Ferries needs to strengthen oversight toward
customer satisfaction. While the current annual reporting on the CST Survey provides both baseline and
trend data, it does not capture the more specific context of changes or granular trends in satisfaction
levels beyond what is afforded from the limited number of open-ended questions. Taken by itself, the CST
Survey limits the ability of BC Ferries to demonstrate how it will address potential service gaps and
complaints to improve their customer services and improve customer satisfaction.8 BC Ferries has stated
that it uses the CST Survey reports for trend analysis and, in some cases, a confirmation point for
information that is drawn from other sources such as:
• Community engagements;
• Online surveys;
• Phone surveys;
• Focus groups;
• Brand research;
• Other intercept surveys;
• Customer service research; and
• Specific community engagement to inform projects such as terminal upgrades or vessel new-
builds or acquisitions (including First Nations groups).
The results of these additional points of research are not, for the most part, included in the BC Ferries’
Annual Report to the Commissioner. BC Ferries states that it currently provides the overall satisfaction
score as a corporate key performance indicator and the BC Ferries’ Board of Directors receive quarterly
along with annual updates on the overall satisfaction ratings.
Accountability would be strengthened with more holistic reporting. A consolidated report that brings
together multiple sources of relevant information may help strengthen oversight and provide greater
assurance that there is a focus being put toward customer satisfaction, assuming the related data is
representative of the range of experiences and that relatively low ratings as well as noted issues are
being resolved.
8 It is worth noting that BC Ferries has a very comprehensive customer complaint process that stakeholders engaged throughout
this review commented on very positively. However, the same provisions for accountability do not appear to be transposed to the
CST Program. The Complaint Resolution Report is submitted to the BC Ferries Commissioner quarterly, and the CST Key Findings
Report is submitted annually.

Review of BC Ferries’ Annual Customer Satisfaction Tracking Survey
8
2. INTRODUCTION
2.1. BACKGROUND
British Columbia Ferry Services Inc. (BC Ferries) is a dynamic and multifaceted business. The ferry
services it operates provide transportation for not only residents and tourists, but commuters and
commercial clients as well. In this sense, BC Ferries not only moves people but also ensures the flow of
commercial goods to communities up and down BC’s coastline.
As a customer-focused organization, BC Ferries is driven by expectations and experience. One of the
tools that BC Ferries uses to ensure it is meeting these expectations while gauging actual experiences is
an annual customer satisfaction survey. This Customer Satisfaction Tracking Survey was implemented in
2003 in response to a requirement within the Coastal Ferry Services Contract, the agreement between
BC Ferries and the BC Ministry of Transportation and Infrastructure, to provide ferry services on
designated routes.
As a service provider, BC Ferries
continues to evolve, including the
utilization of modern technology and data
on the state and drivers of customer
satisfaction.
Specifically, BC Ferries has launched
significant undertakings, including the
Digital Customer Experience and BC
Ferries Vacations, which provide more
direct opportunities for one-to-one
customer relationships, data utilisation
and feedback. Additionally, BC Ferries
has noted plans to implement a new
customer relationship management
system to store, organize and more
effectively use the customer-focused data
it collects.
Considering this, it is an optimal time to
revisit how the company gauges as well
as reports on customer satisfaction and
service experience.
Review of BC Ferries’ Annual Customer Satisfaction Tracking Survey
9
2.2. OBJECTIVES AND SCOPE OF THE REVIEW
Scope
The Office of the BC Ferries Commissioner has responsibility for overseeing compliance by BC Ferries
with the terms of the Coastal Ferry Services Contract. Since the inception of the customer satisfaction
survey in 2003, BC Ferries has engaged the Mustel Group, a market research firm based in Vancouver,
BC, to conduct and complete the annual survey of designated ferry routes.
MNPLLP (MNP) was engaged by the BC Ferries Commissioners to carry out a third-party review of BC
Ferries’ Customer Satisfaction Tracking Survey. The scope of the review included:
• Planning along with delivery of the annual survey;
• Providing an opinion on the adequacy of the objectives, protocols and processes governing the annual survey;
• Determining whether opportunities for improvement exist; and
• Providing recommendations to the Commissioners.
It is important to note that the scope of this review only includes the Customer Satisfaction Tracking
Survey as specified in the Coastal Ferry Services Contract. Actions or changes implemented by BC
Ferries from consultations with committees, community groups, associations or other such interests are
not specifically within the scope of this review, although references to such means of engagement are
included for context.
Review Questions
The review addressed the following questions:
1. Is a reasonably representative group of Designated Ferry Routes being engaged through the survey, and are any significant ferry user groups being excluded from the survey?9
2. Does the survey cover the full range of activities, as set out in Section 6.02 of the contract, and are there any gaps that should be addressed?
3. Is the methodology appropriate in terms of the intended purpose of the survey and for ensuring the engagement of ferry user groups?
4. Can the results of the survey be considered representative in terms of adequately reflecting the views of ferry users, all for the purpose of measuring customer satisfaction with the service?
3. APPROACH TO THE REVIEW
3.1. APPROACH
In conducting the third-party review of BC Ferries’ Customer Satisfaction Tracking Survey, MNP
undertook the following approach:
9 Ferry users are considered to include, but not be limited to, residents, commuters, tourists, commercial operators, dependent businesses, and emergency service providers.

Review of BC Ferries’ Annual Customer Satisfaction Tracking Survey
10
Reviewing Background Documentation
MNP reviewed background documents provided by BC Ferries, the BC Ferries Commissioner and other stakeholders. The review included both publicly available and confidential documents. In addition, the team conducted supplementary desk-based research on customer satisfaction survey best practices, which informed the development of the recommendations that can be found in Section 5 of this report.
Secondary Research Methods
Desk-based research on customer satisfaction survey best practices
Review of relevant documentation
Consulting with Internal and External Stakeholders
MNP consulted with internal and external stakeholders, by conducting interviews, group meetings and webinars to gather insight and develop an understanding of opinions as they relate to the Customer Satisfaction Tracking Survey. These consultations provided for a clear understanding of the planning and delivery of the survey, as well as the associated needs and perspectives of multiple stakeholders, notably:
• BC Ferries
• BC Ferries Commissioner
• BC Ministry of Transportation and Infrastructure
• BC Ferries Terminal Liaison Committees
• BC Ferry Advisory Committee Members
• BC Trucking Association
• Emergency Responders
• The Mustel Group
Primary Research Methods
Individual and group interviews
Web-enabled group discussions
Presentation by BC Ferries
Meetings with BC Ferries
Analyzing and Interpreting Findings
MNP analyzed the data from the document review and stakeholder consultations, extrapolating themes and consolidating the findings.
A summary of the findings can be found in Section 5 of this report, which addresses the findings in relation to the review questions (Section 2.2).
Reporting and Developing Recommendations
Following the analysis and interpretation of the findings, MNP prepared the concise report, outlining key recommendations.

Review of BC Ferries’ Annual Customer Satisfaction Tracking Survey
11
3.2. LIMITATIONS
This report has been prepared for the exclusive use of the BC Ferries Commissioner.
MNP’s work was planned and conducted to assess the efficiency and effectiveness of the BC Ferries
Customer Satisfaction Tracking Survey. MNP’s findings are based on analysis of the data provided by
BC Ferries and the BC Ferries Commissioner, as well as interviews conducted with stakeholders
determined by both BC Ferries and the BC Ferries Commissioner.
The work to provide this report was carried out based on the assumption that information made available
to MNP was reliable, accurate and complete. We did not subject the information contained in the report to
checking or verification procedures except to the extent expressly stated. In no circumstances shall MNP
be responsible for any loss or damage, of whatsoever nature, arising from information material to our work
being withheld or concealed from us or misrepresented to us by management and employees of BC Ferries
or any other person of whom we may make enquiries.
MNP did not examine, compile or apply procedures over financial information used for this report under
the requirements of the Chartered Professional Accountants of Canada. As a result, MNP is unable to
express assurances on such information except where expressly stated in the report to form part of the
scope of our work. Further, this report does not constitute a legal opinion on any matters including the
interpretation of the Coastal Ferry Act (2003).

Review of BC Ferries’ Annual Customer Satisfaction Tracking Survey
12
4. LEADING PRACTICES IN CUSTOMER SATISFACTION TRACKING
4.1. MEASURING CUSTOMER SATISFACTION
The measurement of customer satisfaction is intended to inform decisions
along with reporting on expectations and ways to maintain if not improve
loyalty as well as advocacy.10 It is a critical metric used by organizations
to gauge performance. It can be tracked over time to determine changes
in the trend, and applied in a way that enables comparisons to similar
organizations or competitors across a given sector.
It is often used as a leading indicator to assist in identifying areas of
success or aspects of the organization that can be improved, and it is
regularly used to inform management decisions. While the approach in
measuring customer satisfaction can differ between organizations and
across sectors, there is a shared focus on the overall customer
experience.
Research has shown a high level of customer satisfaction to be a good predictor of loyalty and retention.
Insights into customer satisfaction resulting from well-designed surveys can help organizations to
reinforce positive experiences and perceptions over time.11
The level of customer satisfaction is based, in part, on expectations of service. Such expectations are influenced by service guarantees and performance norms as well as by technology, interpersonal interactions, or specific situations.12
Collecting Customer Satisfaction Data
Organizations collect customer data through a variety of methods, typically integrating multiple sources to ensure a balanced collection of views and opinions.
Common methods for collecting data on customer satisfaction include:
• In-person surveys (e.g., intercept method)
• Phone surveys
• Web-based text analytics
• Social media
• Email (online) surveys
• Focus groups
• Mobile surveys
• Kiosk based surveys
• Paper surveys
Survey and Questionnaire Design
An important part of effective customer satisfaction tracking is survey design. To ensure the design of a questionnaire or survey is effective, the American Customer Satisfaction Index (ACSI) recommends adherence to the following principles: 13
10 Gartner, The Definition of Customer Experience Management 11 Qualtrics, Customer Satisfaction Surveys 12 Qualtrics, Customer Satisfaction Surveys 13 ASCI, The Science of Customer Satisfaction
“Satisfaction is an overall customer attitude towards a service provider, or an emotional reaction to the difference between what customers anticipate and what they receive, regarding the fulfillment of some need, goal or desire.”
Managing Service Quality, 2004

Review of BC Ferries’ Annual Customer Satisfaction Tracking Survey
13
1. Determine how the survey results will be used and factor this into the design of questions and selection of survey methodology.
2. Keep the questionnaire short, as the more questions that are asked, the lower the completion rate.
3. Measure what matters (e.g., what drives customers to purchase your service?).
4. Use a scale with enough precision.
Measures of Customer Satisfaction
Customer satisfaction itself is reported to be the most traditional and widely used metric by executives in over 70% of all organizations.14 However, there are also many other measures that can be used to report on overall customer satisfaction, such as Net Promoter Score (NPS). The NPS has been identified as the second most commonly used metric by over 17% of all businesses and by over 70% of the largest global enterprises.15 As a metric, it serves to gauge the likelihood of customers recommending the company’s product or service. This is done by sorting respondents into Promoters (highly rated), Neutrals (middle), and Detractors (low rated). Once sorted, to calculate the NPS, the percentage of Detractors are subtracted from the percentage of Promoters.
Other common measures include:16 17
• Loyalty measurement (retention, churn);
• Attribute satisfaction measurements;
• Intention to re-purchase measurements;
• Reputation, brand, and advocacy measurements;
• Product or service quality;
• Customer-perceived value;18 • External industry benchmarks.19
According to BC Ferries, many of these measures are used including:
• Attribute satisfaction measures (as measured by the Customer Satisfaction Tracking Survey);
• Reputation and brand;
• Service quality through secret shoppers; and
• External industry benchmarks for performance.
Best Practices Across Industry
Shared challenges faced by industry in measuring customer experiences include the potential for surveys to overwhelm respondents20 and ensuring that metrics influence long-term business decisions as much
14 Gartner, How to Manage Customer Experience Metrics 15 Gartner, How to Manage Customer Experience Metrics 16 Qualtrics, Customer Satisfaction Surveys 17 Gartner, How to Manage Customer Experience Metrics 18 Voice Crafter, Customer Relationship Surveys – 12 Best Practices 19 Survey Monkey, Customer Satisfaction KPI’s You Need to Use 20 Gartner, How to Manage Customer Experience Metrics
Collecting customer satisfaction data through surveys, focus groups, or other mechanisms allows organizations to:
• Measure – Determine the level of customer satisfaction with a specific product or service offered by the organization.
• Quantify Impact – Quantify the impact that customer satisfaction has on their intent to re-purchase a product or service.
• Predict – Predict the impact that product or service improvements may have on overall customer experience, loyalty over time, and referrals to other customers.
• Prioritize – Prioritize financial, human resource, and capital investments based on overall customer experience data.
• Benchmark – Benchmark against the performance of the organization based on previous years, and compare performance to other leading organizations or competitors.
• Inform – Inform marketing and communications efforts, tailoring messaging based on emerging issues or areas of priority.
BC Ferries also measures other key performance indicators that have a relationship to the overall customer experience such as:
• On time performance;
• Passenger safety index;
• Employee safety index;
• Call wait times;
• Capacity utilization; and
• Fleet reliability.
Review of BC Ferries’ Annual Customer Satisfaction Tracking Survey
14
as results. To overcome the complexity of customer experiences and effectively measure satisfaction, consideration can be given to:21
• Consolidating metrics into a customer experience dashboard;
• Creating a customer experience index with weighted measures based on relative importance;
• Identifying the causality between operational and customer experience metrics;
• Coordinating with information technology service providers;22
• Reporting often and making results accessible;23
• Providing for regular, third-party customer experience metrics across the organization;24
• Building a hierarchical dashboard of customer experience metrics covering quality, satisfaction,
loyalty and advocacy;
• Focusing on outcomes (measuring the results delivered, not the steps taken);
• Establishing initial baseline performance;
• Favouring predictive measures over historical measures;
• Assigning an owner to be responsible for the tracking and reporting of measures coupled with
accountabilities for results.
Measuring the Customer Journey
It is becoming more common for organizations to approach customer satisfaction from the perspective of their “journey”. The customer journey is made up of multiple touchpoints, or interactions, with the organization, such as an online experience, receipt of products or services, messages, or specific physical settings.25 In a world of increasingly complex, multi-touch customer service, mapping out customer journeys is not without difficulty. What this does allow for though, is visualizing the customer experience from initial awareness through to the after-sales service.26 It also provides the organization with another means to analyze what drives their customers’ decisions and behaviours. Visually mapping out the customer journey is just the starting point; the next step is to analyze the customers’ actions, motivations, gaps and barriers as defined below.
Actions:
• Identify the actions of what the customer is doing at each stage.27
• Analyze how the customer is being supported along the way of these same stages.28
Key Drivers and Motivations:
• Understand the emotions and motivations of what keeps the customers continuing to the next
stage.
• Determine which customer experience elements drive the associated measure(s) and desired
business results.29
• Identify which drivers need improvement.30
• Perform key driver analysis and prioritize the elements of experience by customer segment.31
21 Gartner, How to Manage Customer Experience Metrics 22 ASCI, The Science of Customer Satisfaction 23 ASCI, The Science of Customer Satisfaction 24 Gartner, How to Manage Customer Experience Metrics 25 Harvard Business Review, Touchpoints Bring the Customer Journey to Life 26 Harvard Business Review, Using Customer Journey Maps to Improve Customer Experience 27 Harvard Business Review, Using Customer Journey Maps to Improve Customer Experience 28 Harvard Business Review, Touchpoints Bring the Customer Journey to Life 29 Voice Crafter, Customer Relationship Surveys – 12 Best Practices 30 Voice Crafter, Customer Relationship Surveys – 12 Best Practices 31 Voice Crafter, Customer Relationship Surveys – 12 Best Practices
Review of BC Ferries’ Annual Customer Satisfaction Tracking Survey
15
Barriers, Gaps and Opportunities:
• Question if there are any uncertainties, processes, costs, jargon or other factors preventing
customers to move on to the next stage.32
• Provide opportunities and leave room for what the customer wants to discuss.33
After evaluating the factors above, it is important to help staff understand and use survey results to better
customer satisfaction, as well as to ensure regular review and refinement cycles.34 As stated in the
Harvard Business Review Article, “Touchpoints Bring the Customer Journey to Life”: “Taking the time and
effort to look at your touchpoints not just as isolated mini-experiences, but as a collective whole, will help
you shape them for a better customer experience.”35
BC Ferries indicated they have been using journey mapping for several years in project based work to
create a better understanding of the customer experience and to identify gaps between current state and
desired outcomes.
32 Harvard Business Review, Using Customer Journey Maps to Improve Customer Experience 33 Voice Crafter, Customer Relationship Surveys – 12 Best Practices 34 Voice Crafter, Customer Relationship Surveys – 12 Best Practices 35 Harvard Business Review, Touchpoints Bring the Customer Journey to Life
Review of BC Ferries’ Annual Customer Satisfaction Tracking Survey
16
5. SUMMARY OF STAKEHOLDER FEEDBACK
MNP undertook a series of consultations to gauge the views of ferry users on topics related to the
Customer Satisfaction Tracking (CST) Survey, as well as to gather opinions from the Ferry Advisory
Committees (FACs), Terminal Advisory Committees, and commercial clients on the same. These findings
represent the comments received throughout the consultations as well as information provided by BC
Ferries.
Representation of Ferry Users
Demographics and Customer Types36
• Demographic Information – It is difficult to confirm representation of the population as minimal demographic information is provided in the annual CST reports.
• Customer Perspectives – Some stakeholders perceive the survey as being geared more toward tourists and infrequent users than commuters and commercial users who are reliant upon the service. From data provided by BC Ferries as it relates to the CST interviews completed in 2016, 32% were with tourists, and another 13% were with infrequent travellers. Another 46% of the CST interviews in 2016 was made up of very frequent travellers and those considered to be commuters and/or on business purposes.
Representation of Routes
• Major Routes – Many stakeholders that were consulted perceived that there was a bias in the survey toward major routes, with missing representation of smaller routes.
• Minor Routes – Several stakeholders and representatives from minor routes were concerned that there was little opportunity to contribute feedback in the survey process.
• Northern Routes – Representatives from Northern routes noted concern that they are not being surveyed, and suggested that such ferry-dependent areas of the province are feeling like their concerns are being ignored. BC Ferries stated they re-introduced a pilot project in 2015 to reinstate the CST survey on routes 10 and 11 (i.e., Port Hardy-Mid Coast-Prince Rupert, and, Haida Gwaii to Prince Rupert).
• Stress Areas – The surveys were viewed among those consulted as not sufficiently addressing issues of route bottlenecks, fares, or regular commuting. The CST survey does include, however, the attributes of “ability to get onto desired sailing” and “ability to connect with other sailings”.
• Presentation of Results – Stakeholders indicated that the survey reports are presented in a way that implies results are representative of all routes, despite varying characteristics.
Representation Gaps
• Users of Alternate Transportation – The current approach to the CST Survey does not capture the views of people who may choose alternative transportation and the associated reasons (e.g., airport, seaplanes, private vessels, decision to not travel, etc.).
• Missed Riders – The CST Survey as delivered does not catch people who missed the ferry or were turned away because lines were too long.
36 Full demographic information is available in the CST data tables, but these are not published as they hold commercial value.
Review of BC Ferries’ Annual Customer Satisfaction Tracking Survey
17
• Commercial Users – Those commercial ferry users engaged for the purposes of this review noted they have never seen nor were aware of the survey. As reported by BC Ferries, 1% of all passengers completing the survey in 2016 were “hauling freight or operating a commercial vehicle”.
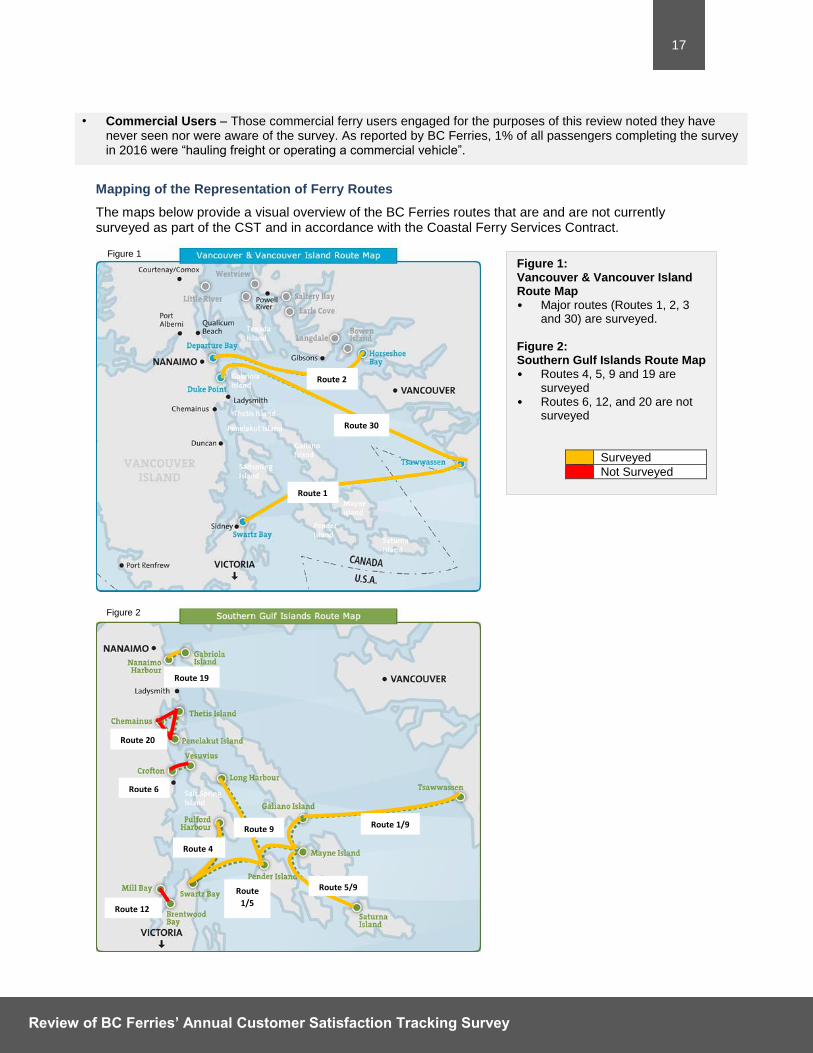
Mapping of the Representation of Ferry Routes
The maps below provide a visual overview of the BC Ferries routes that are and are not currently surveyed as part of the CST and in accordance with the Coastal Ferry Services Contract.
Route
1/5
Route 4
Route 19
Route 5/9
Route 6
Route 20
Route 12
Route 9 Route 1/9
Figure 1: Vancouver & Vancouver Island Route Map • Major routes (Routes 1, 2, 3
and 30) are surveyed. Figure 2: Southern Gulf Islands Route Map • Routes 4, 5, 9 and 19 are
surveyed • Routes 6, 12, and 20 are not
surveyed
Surveyed
Not Surveyed
Route 1
Route 2
Route 30
Figure 1
Figure 2

Review of BC Ferries’ Annual Customer Satisfaction Tracking Survey
18
Figure 3: Northern Gulf Islands Route Map • Routes 21 and 23 were surveyed but
not currently • Routes 22, 24 and 25 are not
surveyed Figure 4: North Coast Route Map • Routes were not typically surveyed
but are now surveyed with the re-introduction pilot (2015)
Figure 5: Sunshine Coast Route Map • Route 3 and 7 are surveyed • Routes 8, 17 and 18 are not
Surveyed
Not Surveyed
Route 22
Route 21
Route 23
Route 24
Route 25
Route 26
Route 28
Route 11
Route 10
Route 17
Route 18 Route 3
Route 8
Figure 3
Figure 4 Figure 5

Review of BC Ferries’ Annual Customer Satisfaction Tracking Survey
19
Is a reasonably representative group of Designated Ferry Routes being engaged through the survey, and are any significant ferry user groups37 being excluded from the survey?
In terms of the total population of ferry users and their experiences, the CST Survey is reasonably
representative by virtue of surveying routes carrying approximately 75% to 80% of the overall number of
ferry passengers each year. The surveys are typically conducted on 8 to 10 out of 24 routes. BC Ferries
commented on a pilot project in 2015 to re-introduce the CST Survey on Routes 10 and 11 (Port Hardy –
Mid Coast – Prince Rupert; Haida Gwaii to Prince Rupert) but stated that they rely on survey results from
routes such as Route 3, which has the largest commuter segment in the system, to be representative of
non-surveyed routes. While the data can be considered reasonably representative in terms of total
population, the consolidated reporting of the CST Survey results is more reflective of the experiences of
those on major and southern routes. As each route has its own distinctions in terms of ridership,
schedules and available services, the data as presented in the annual CST reports may not fully
represent the views along with experiences of northern and other specific commuter-based passengers.
Methodology and Questionnaire
Questionnaire
• Updating of Questions – Over the 13 years of the customer survey, BC Ferries has evolved as an organization, yet the questions have tended to remain unchanged since inception for the stated purpose of maintaining historical trends.38
• Number of Questions – Many of the consulted stakeholders perceive there to be too many (90) questions and indicated that they are less likely to participate or complete the CST Survey due to fatigue. The FACs would prefer a shorter survey including a suggested 15 questions with route specific topics. BC Ferries has noted that the 2016 response rates ranged from 38% to 53% across seven surveyed routes (i.e., Routes 1, 2, 3, 4, 5/9, 19, and 30).
• Opportunities for Open-Ended Responses – By relying mainly on Likert rating (1 to 5) scales for most of the CST Survey, there is a missed opportunity to clarify why the customer’s perception is what it is.39
Survey Methodology
• Reach – There are concerns among those consulted that the intercept survey may not reach (or represent) everyone.
• Objectivity – While the objectivity in selecting stakeholders was questioned by those consulted, the CST Survey is founded on protocols of random sampling.
• One Survey Method – There is one survey method being used (intercept methodology) in support of the CST Survey.40
• Value for Money – There are relatively high-costs associated with the intercept methodology.
37 Ferry users are considered to include, but not be limited to, residents, commuters, tourists, commercial operators, dependent businesses, and emergency service providers.
38 BC Ferries reviews the questionnaire annually as new services are added, deleted or changed.
39 The questionnaire does include some opportunities to suggest additional services and improvements, with the recognition that open-ended questions can drive project costs as results require manual coding. 40 Ad-hoc research projects are conducted to enable deeper understandings of specific service areas.
Review of BC Ferries’ Annual Customer Satisfaction Tracking Survey
20
Gaps
• Route Relevant Questions – It was noted by BC Ferries that the CST Survey is custom designed for each route, and that a respondent has the option of stating “N/A” if a service is mentioned that was not used or seen during a trip.
• Accessibility Questions – There is little in the way of accessibility-focused questions.41
• Multiple Route Dependency – Some commuters are dependent on multiple routes, yet the current CST Survey does not take this into account.
• Separate Systems – The CST Survey is currently being kept separate, for the most part, from other relevant systems and practices including complaint reporting.
Does the survey cover the full range of activities, as set out in Section 6.02 of the contract, and are there any gaps that should be addressed?
The CST Survey addresses the range of activities as set out in Section 6.02 of the Coastal Ferry Services
Contract in a manner that is trip-specific. Almost all of the responses to the CST Survey pertain to the
respondent’s current voyage.
The CST Survey is conducted three times per year, providing information to BC Ferries at the end of each
research wave. The aggregate results though, are only published annually in the publicly released report.
It is in this sense that the annual CST reporting is of less value from the perspective of informing
decisions on emerging trends or issues during the year.
Is the methodology appropriate in terms of the intended purpose of the survey and for ensuring the engagement of ferry user groups?
The intended purpose of the CST Survey is not clearly indicated in the contract. If it can be assumed that
the intention is to ensure engagement of all ferry user groups and to gauge BC Ferries’ performance
regarding customer satisfaction, the CST Survey can be considered somewhat appropriate. The current
data collection effort exclusively uses the intercept methodology, with screeners on board who are trained
to randomly approach every fifth passenger with a request to complete the survey. The advantage to this
methodology is that the results can be considered to be taken from a random sample. Because this
methodology can be costly to carry out, routes with the highest population of travellers are selected.
Additionally, when the intercept methodology was employed on northern commuter routes in the past, it
was not well received by passengers who were repeatedly approached by screeners over a brief period.
41 There is one question on the survey pertaining to accessibility in the “Other onboard facilities / Services” Section. “Ease of access, overall, for people with disabilities”.
Review of BC Ferries’ Annual Customer Satisfaction Tracking Survey
21
Use of Results
Action and Accountability
• Decision Making – In isolation of other sources of relevant information, the CST Survey is constrained as a means of informing decisions or changes to BC Ferries services. There is also a prevailing perception from the annual reporting that the contractual agreement is the main driver for BC Ferries to undertake the CST surveying.
• Accountability – There is a perceived need for accountability from BC Ferries to ensure the results of the CST Survey are being used, which includes addressing complaints to better the related services. Furthermore, there is an expressed desire to see that the CST Survey responses are adding value, notably in the form of actioning the feedback (e.g., behavioral change).
Gaps
• Unrepresented Positions – The CST Survey in its current form and administration does not reflect the overall range of compliments as well as complaints that BC Ferries may receive on a regular basis from other sources.
Reporting
• Lag Time – There is a lag time between collection and public reporting of results from the CST Survey.
• Reporting on Change – Many respondents stated that there is a lack of reporting on what issues BC Ferries is responding to, and the resulting changes.
• FAC Reporting and Uses – Some FACs use the data proactively (e.g., the Gabriola FAC analyzes the survey results and reports out on its website). Any significant findings from the reports were described as signals to the FAC to steer a conversation with BC Ferries.
• Presenting on the Implications – Questions and concerns were raised among those consulted on how BC Ferries is tracking the impacts of their decisions.
Can the results of the survey be considered representative in terms of adequately reflecting the views of ferry users, all for the purpose of measuring customer satisfaction with the service?
The CST Survey can be considered representative of the views of ferry users, but not all. To adequately reflect the views of all ferry users, greater sampling from routes not surveyed currently and/or information from other sources such as community engagements as well as customer service research would need to be included. BC Ferries does report annually to the BC Ferries Commissioner with service quality information taken from the most recent CST Survey results as well as other information on complaints resolution. It is in this regard that the survey results should be taken as one source of measurement for customer satisfaction, but not necessarily the most representative or comprehensive unto itself.
Review of BC Ferries’ Annual Customer Satisfaction Tracking Survey
22
6. GENERAL CONCLUSION AND CONSIDERATIONS FOR IMPROVEMENT
In the years since its 2003 inception, the survey that is at the core of the CST has collected consistent
and valid data through an intercept methodology. This has provided BC Ferries and the BC Ferries
Commissioner with 13 years of high-level benchmark data on the customer experience across the “full
range of activities in respect of which a customer is engaged with BC Ferries.”
Based on our findings, the original intent of the CST Survey was to provide for the collection of customer
satisfaction information that would inform BC Ferries’ operations and the business decisions made by the
company. The requirement that the survey be undertaken by an independent consulting firm was
intended to provide accountability and ensure representative survey results, resulting in better data for BC
Ferries’ use.
While the current CST Survey is somewhat representative in its findings and has been useful in the past,
the time is appropriate for BC Ferries to address aspects of customer satisfaction in an integrated,
outcome-driven and comprehensive manner that is conducive to results-oriented management along with
governance. The CST Survey approach should be revised or augmented with other measurement tools
(information sources) to reasonably cover all routes and all customer segments. In doing so, BC Ferries
should also provide for more comprehensive and consolidated reporting. Communicating customer
satisfaction measures, along with resulting actions taken by BC Ferries, needs to be more prominent and
more frequent. Improvements to the current reporting frequency, along with expanded communication
efforts, will help strengthen oversight and better highlight actions taken by BC Ferries to respond to
customer satisfaction results on an ongoing basis.
Considerations for Improvement
Consideration #1. Provide for a Consolidated View on the State of, and Responses to, Customer Satisfaction42
The existing CST Survey and associated methodology have captured consistent baseline along with
trend information for more than a decade. Over the same period, practices have continued to evolve
around collecting data related to satisfaction levels. For example, customer data can be collected in an
ongoing and dynamic manner at each service touchpoint, as evidenced through familiar phrases such as
“how did we do today?” and, “tell us about your experience”. Electronic and in-person opportunities to
provide feedback about customer satisfaction have become more commonplace and data collected is
typically used as one facet in multi-dimensional customer service measurement.
The CST Survey results do not represent the range of opinions, both positive and negative, across all
customer types and service touchpoints that BC Ferries receives in other ways. Nor do the CST Survey
results necessarily reflect the needs and views of customers travelling on all minor and northern routes.
Minor and northern route passengers can consist of daily commuters, carriers of essential commercial
goods for community livelihood, and people travelling for medical appointments. Their frequency of travel
and reliance upon BC Ferry services can be quite different than those travelling on southern and major
routes. This is in opposition to the concept of sampling some routes to extrapolate opinions and
42 The BC Ferries’ Business Plan for the year ending March 31, 2018 indicates actions toward many of the considerations for
improvement outlined in this report. The BC Ferries business plan can be found at http://www.bcferries.com/files/PDFs/2018_Business_Plan.pdf
Review of BC Ferries’ Annual Customer Satisfaction Tracking Survey
23
experiences representative for all. In addition, of the commercial vehicle passengers engaged in this
review, none could recall ever being approached to complete a survey. This means it is possible that
important feedback from customer groups such as commercial or dependent businesses is not being
consistently captured through the current CST Survey.43
Feedback from the regional FACs indicated that customer satisfaction should be measured on all routes
during peak, shoulder and slow periods over the year, and should extend beyond service offerings (e.g.,
washrooms, catering, etc.) to also include feedback on matters of operational policy.
While expanding the CST Survey research to meet these expectations would require additional funding,
customer feedback is being obtained by BC Ferries through other sources. For example, throughout the
year, there is the BC Ferries’ customer comment tracking system known as ResponseTek (which allows
for online and call-in comments). BC Ferries also conducts regular meetings with FACs to provide an
opportunity to directly engage with the challenges and concerns of the communities they represent.
Added to this are regular meetings between staff from BC Ferries’ Commercial Services Division and the
BC Trucking Association, to understand and incorporate the needs of the commercial segment.
With respect to reporting, BC Ferries provides the CST Survey results in its Annual Report to the Ferries
Commissioner. BC Ferries details areas where an indexed score for specific services falls below a 3.00
rating out of 5.00. Furthermore, in its Annual Reports, BC Ferries describes how underperforming
services are being addressed. BC Ferries maintains though, that it is through the key performance
indicators as well as the CST results from each research wave and other sources of data as noted above
that decisions are being informed including on changes to customer services along with operations. As
publicly reported, the CST Survey results are stand alone and with few exceptions are not shown in
conjunction with other relevant information be it from social media monitoring, reports from service line
managers and staff, feedback from the FACs, or data from BC Ferries Vacations. By providing for more
consolidated reporting using these various sources of information, and possibly revising the frequency to
match each CST research wave (which currently coincide with peak, shoulder and slow periods), a
complete view of customer satisfaction and actions taken in response can be produced.
Consideration #2. Focus on Outcomes and Accountability
The Coastal Ferry Service Contract states that an annual representative survey must be carried out.
However, the contract language is focused on the means and not on the outcomes or actions that are
expected. The contract also does not specify any accountability to the public for relatively low or
declining satisfaction levels other than what is represented in Section 6.03 calling for “a comparison
between benchmark measures and stated objectives” in the annual report. Assuming the intent behind
Section 6 of the contract was not only to administer a customer satisfaction survey, but also to ensure
that BC Ferries is aware of, and publicly responding to, the expressed experiences across its broad
customer base, the BCFC may wish to consider engaging BC Ferries in a process to focus more on
outcomes, with greater insight and public accountability on customer satisfaction.
43 It is also possible that company drivers surveyed did not report that fact and as such, the business representatives interviewed
were not aware. BC Ferries relies upon their Customer Care Team to communicate and respond to concerns or feedback from commercial clients. Commercial operators engaged during this review were highly complimentary of the responsiveness and service provided by the Commercial Care Team.

Review of BC Ferries’ Annual Customer Satisfaction Tracking Survey
24
Consideration #3. Strengthen the Oversight
Those stakeholders consulted felt, for the most part, that BC Ferries needs to strengthen oversight toward
customer satisfaction. While the current annual reporting on the CST Survey provides both baseline and
trend data, it does not capture the more specific context of changes or granular trends in satisfaction
levels beyond what is afforded from the limited number of open-ended questions. Taken by itself, the CST
Survey limits the ability of BC Ferries to demonstrate how it will address potential service gaps and
complaints to improve their customer services and improve customer satisfaction. BC Ferries has stated
that it uses the CST Survey reports for trend analysis and, in some cases, a confirmation point for
information that is drawn from other sources such as:
• Community engagements;
• Online surveys;
• Phone surveys;
• Focus groups;
• Brand research;
• Other intercept surveys;
• Customer service research; and
• Specific community engagement to inform projects such as terminal upgrades or vessel new-
builds or acquisitions (including First Nations groups).
The results of these additional points of research are not, for the most part, included in the BC Ferries’
Annual Report to the Commissioner. BC Ferries states that it currently provides the overall satisfaction
score as a corporate key performance indicator and the BC Ferries’ Board of Directors receive quarterly
along with annual updates on the overall satisfaction ratings.
Accountability would be strengthened with more holistic reporting. A consolidated report that brings
together multiple sources of relevant information may help strengthen oversight and provide greater
assurance that there is a focus being put toward customer satisfaction, assuming the related data is
representative of the range of experiences and that relatively low ratings as well as noted issues are
being resolved.
Review of BC Ferries’ Annual Customer Satisfaction Tracking Survey
25
7. APPENDICES
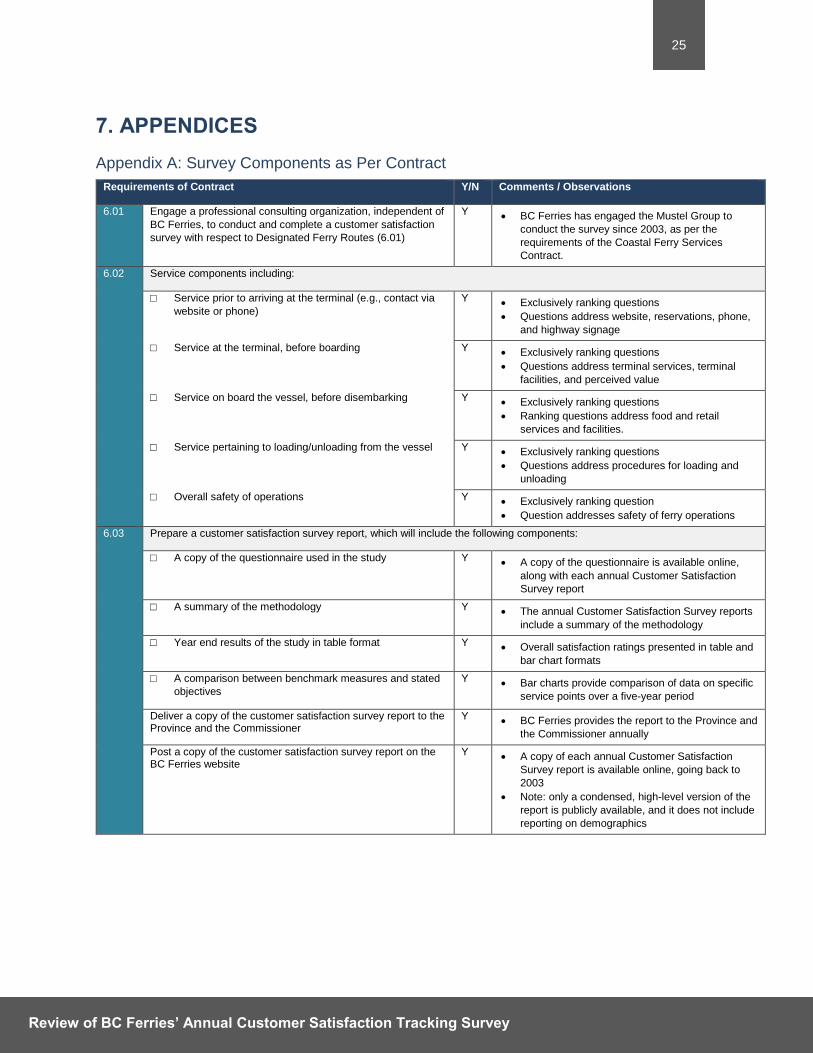
Appendix A: Survey Components as Per Contract
Requirements of Contract Y/N Comments / Observations
6.01 Engage a professional consulting organization, independent of
BC Ferries, to conduct and complete a customer satisfaction
survey with respect to Designated Ferry Routes (6.01)
Y • BC Ferries has engaged the Mustel Group to
conduct the survey since 2003, as per the
requirements of the Coastal Ferry Services
Contract.
6.02 Service components including:
□ Service prior to arriving at the terminal (e.g., contact via
website or phone)
Y • Exclusively ranking questions
• Questions address website, reservations, phone,
and highway signage
□ Service at the terminal, before boarding Y • Exclusively ranking questions
• Questions address terminal services, terminal
facilities, and perceived value
□ Service on board the vessel, before disembarking Y • Exclusively ranking questions
• Ranking questions address food and retail
services and facilities.
□ Service pertaining to loading/unloading from the vessel Y • Exclusively ranking questions
• Questions address procedures for loading and
unloading
□ Overall safety of operations Y • Exclusively ranking question
• Question addresses safety of ferry operations
6.03 Prepare a customer satisfaction survey report, which will include the following components:
□ A copy of the questionnaire used in the study Y • A copy of the questionnaire is available online,
along with each annual Customer Satisfaction
Survey report
□ A summary of the methodology Y • The annual Customer Satisfaction Survey reports
include a summary of the methodology
□ Year end results of the study in table format Y • Overall satisfaction ratings presented in table and
bar chart formats
□ A comparison between benchmark measures and stated
objectives
Y • Bar charts provide comparison of data on specific
service points over a five-year period
Deliver a copy of the customer satisfaction survey report to the Province and the Commissioner
Y • BC Ferries provides the report to the Province and
the Commissioner annually
Post a copy of the customer satisfaction survey report on the BC Ferries website
Y • A copy of each annual Customer Satisfaction
Survey report is available online, going back to
2003
• Note: only a condensed, high-level version of the
report is publicly available, and it does not include
reporting on demographics

Review of BC Ferries’ Annual Customer Satisfaction Tracking Survey
26
Appendix B: Data Collection
INTERVIEW GUIDE – FERRY ADVISORY COMMITTEES AND OTHER STAKEHOLDERS
INTRODUCTION
MNP LLP (MNP), a national consulting and accounting firm, has been hired by the BC Ferries Commissioner to carry out a third-party review of BC Ferry Services Inc.’s (BC Ferries) annual Customer Satisfaction Tracking (CST) program. The objectives of this review are to evaluate how the CST Program is being delivered and determine whether opportunities for improvement exist.
As part of the review, we are conducting a range of interviews and discussions with stakeholders such as representatives from BC Ferries, the BC Ministry of Transportation, the Ferry Advisory Committees and other stakeholders, to seek their views on:
• The appropriateness of the objectives, protocols and processes associated with the CST Program;
• Whether the CST Program represents the views and experiences of ferry user groups and across Designated Ferry Routes; and
• Whether any improvement opportunities exist.
This interview will take approximately 45 to 60 minutes to complete.
Before we proceed, I should note that all information we collect from you will be treated as confidential and will be reported only in summary form with the responses of other individuals we interview.
CONTACT INFORMATION
The section is for classification purposes and will be completed prior to the interviews. It will then be validated with the interviewee(s) at the beginning of the interview.
Name:
Position:
Organization:
Stakeholder Group:
Ferry Advisory Committee:
Bowen Island Municipality FAC
Brentwood Bay-Mill Bay FAC
Campbell River-Quadra Island-Cortes Island FAC
Chemainus-Thetis Island-Penelakut Island FAC
Denman Hornby FAC
Gabriola FAC
Gambier-Langdale-Keats FAC
North & Central Coast FAC
Northern Sunshine Coast FAC
Salt Spring Island FAC
Southern Gulf Islands FAC
Southern Sunshine Coast FAC
Tri-Island FAC
Terminal Liaison Committee:
Horseshoe Bay
Swartz Bay
Departure Bay
Other stakeholder group:
specify: __________________
Review of BC Ferries’ Annual Customer Satisfaction Tracking Survey
27
Phone Number:
Date:
SETTING THE CONTEXT
1. To start, how familiar are you [the group] with the CST Program of BC Ferries?
GAUGING THE EXPERIENCES AND FUTURE OPPORTUNITIES
2. BC Ferries conducts an annual survey as part of the CST Program. The intention is to understand opinions and experiences across a range of activities which a BC Ferries customer is engaged with.
From what you know, or may have heard from others, can you comment on:
a) Whether the CST Program, through its annual survey, is picking up on the views and experiences of customers across the various Designated Ferry Routes?
b) If there are any routes or regions that are not being covered to the extent they should be?
c) If there are any significant ferry users not being engaged to the extent they should be?
Note: Ferry users are considered to include, but not be limited to, residents, commuters, tourists, commercial operators, dependent businesses, and emergency service providers.
d) From what you know, or heard from others, is the CST Program covering with its survey the full range of experiences, as it relates to:
(a) service prior to arriving at the terminal (e.g., contact via website or phone) (b) service at the terminal, before boarding (c) service on board the vessel, before disembarking (d) service pertaining to loading/unloading from the vessel (e) overall safety of operations, and (f) value for money for fare paid.
Note: Since 2003, questions have been added to the survey on such topics as outside appearance along with overall look and interior décor of terminals, vending machines, play areas for children, pet areas, usefulness of television information screens, and the overall outside appearance of vessels.
e) Is there anything about the use of the survey that we should consider as part of this review?
Note: The survey is administered every year over June, August and November. Passengers are stopped onboard ferries and asked “screener” questions such as how often they travel on BC Ferries, the purpose of trips, etc.
Following this, the “screened” passengers are given a longer, follow-up survey to complete after they disembark or leave the terminal, with this being done online (as of June, 2015) or by returning the printed version using a postage pre-paid envelope.
The request is that these surveys be completed within 48 hours.

Review of BC Ferries’ Annual Customer Satisfaction Tracking Survey
28
3. Given what we have discussed up to now, do you think BC Ferries can rely on the results from the CST Program in terms of informing its plans (e.g., strategic planning, marketing planning) along with the service(s) provided to ferry travellers?
(On a scale of 1 to 5, where 1 is do not rely on the results, 3 is somewhat, and 5 is definitely, can rely on the results.)
1 BC Ferries should not rely on the CST results
2 3
BC Ferries can somewhat rely on the CST results
4 5
Definitely, BC Ferries can rely on the CST results
Please elaborate:
4. Looking to the future, is there anything you would change in terms of how the CST Program goes about seeking the views and experiences of ferry user groups and across Designated Ferry Routes?
Yes
No
Don’t know / can’t comment
Please elaborate:
5. Similarly, is there anything you would change as it relates to the annual survey?
Yes
No
Don’t know / can’t comment
Please elaborate:
6. Do you have any other recommendations for improvement as they relate to the CST Program of BC Ferries?
CLOSING
7. Are there any documents that you have, that may be helpful for the purposes of this review?
8. Is there anything else that you would like to add or speak to as it relates to this review?

Review of BC Ferries’ Annual Customer Satisfaction Tracking Survey
29
INTERVIEW GUIDE – MUSTEL GROUP
INTRODUCTION
MNP LLP (MNP), a national consulting and accounting firm, has been hired by the BC Ferries Commissioner to carry out a third-party review of BC Ferry Services Inc.’s (BC Ferries) annual Customer Satisfaction Tracking (CST) program. The objective of this review is to evaluate how the CST Program is being delivered in terms of compliance with the contract provision.
As part of the review, we are conducting a range of interviews and discussions with stakeholders such as representatives from BC Ferries, the BC Ministry of Transportation, the Ferry Advisory Committees and other stakeholders. As the administrator of the survey, your insight would be unique.
This interview will take approximately 45 to 60 minutes to complete.
GENERAL QUESTIONS
The questions in this section are the main objectives of the review.
1. Does the annual survey use a reasonably representative group of Designated Ferry Routes?
2. Does the survey measure the full range of activities, as set out in Section 6.02 of the contract?
3. Is the methodology appropriate for the intended purpose?
4. Are there any gaps in the survey which should be addressed?
5. Can the results of the survey be considered reliable as a measure of customer satisfaction with the service offered by BC Ferries?
6. Are any significant ferry user groups excluded from the survey? Ferry users are considered to include, but not be limited to residents, commuters, tourists, commercial operators, dependent businesses, and emergency service providers.
TECHNICAL QUESTIONS
The questions in this section related to the technical aspects of the survey and its administration.
1. How were the questions asked in the survey determined?
2. The routes included on the survey in 2016 were 1, 2, 3, 30 4, 19, and 5/9. In previous years, routes 23 and 21 were also included. How were the routes on which to carry out the survey determined?
o BC Ferries mentioned that survey fatigue was one of the reasons why surveys were discontinued on the smaller routes (21 and 23), and that the northern routes were excluded due to the cost of conducting the surveys. Are you aware of any other reasons why some routes were not included?
3. The survey was conducted in June, August, and November. How were these times of year selected? Is there any reason why the survey was not conducted during other months of the year?
o Was there any variation in survey responses by time of year?
4. Since June 2015, survey respondents have had the option to complete the survey online. Has there been any difference between the responses received by mail and those submitted online? For example, is the distribution of responses similar by age and/or gender between the two methods of submission?
5. The survey responses were weighted to match the actual passenger distribution. Is there any population level information available other than the passenger counts that could be used for weighting?
Review of BC Ferries’ Annual Customer Satisfaction Tracking Survey
30
6. The survey currently surveys respondents from southern routes only. In your opinion, are the results from these groups generalizable to the overall population of BC Ferries passengers?
7. Were partially complete responses included in the total number of responses? If so, what criteria was used to classify a partially complete response as complete?
8. On routes 5/9, there was a sharp increase in the number of screeners between 2003 and 2006 from 1,168 in 2003 to 3,754 in 2006. This was followed by a gradual decline in screeners to 1,481 in 2016. Is there any reason for the increase and then decrease in the number of screeners issued on routes 5/9?
9. When conducting surveys and interviews there are always risks of interviewers introducing personal biases, or of interview subjects introducing response biases. In your opinion, were any of these risks relevant here, and if so were any steps taken to minimize these risks?
10. The survey has a question on whether interview subjects can be contacted by the interviewee’s supervisor for verification purposes. Do you know approximately what share of interviews were verified by supervisors?
11. Do you know if there were any differences in responses by interviewer?
DISCUSSION POINTS
This section includes points for discussion about the survey.
1. What were some of the challenges faced by Mustel when administering the survey?
2. How involved is BC Ferries in the survey process? For example, do they determine the questions in the survey, and the routes to be surveyed?
o We understand that it was BC Ferries decision to cancel surveys on routes 21 and 23. How involved was the Mustel group in this decision? Was it a collaborative process between Mustel and BC Ferries?
3. Going forward, is there anything that you would like changed about the survey or how the survey is administered?
4. If BC Ferries wanted to include additional routes, and/or conduct surveys in other months do you have an idea of how much this would cost?
5. Have you considered alternative means of administering the survey? For example, installing terminals on the ferries where users can complete the surveys while they’re on a sailing.
6. Are you aware of any similar projects undertaken in other countries and/or industries?
7. What are the best practices when conducting surveys of this nature? Do you feel that you have adequately addressed them?
Thank you for the time and your insight, it is truly appreciated.