Embed Size (px)
Citation preview
1
BoAML 18th Annual Banking & Insurance CEO Conference“Making finance work in a higher capital world”
September 25th, 2013
Manuel González Cid, CFO
BBVA, ready for the new world

2
Disclaimer
This document is only provided for information purposes and does not constitute, nor must it be interpreted as, an offer to sell or exchange or acquire,
or an invitation for offers to buy securities issued by any of the aforementioned companies. Any decision to buy or invest in securities in relation to a
specific issue must be made solely and exclusively on the basis of the information set out in the pertinent prospectus filed by the company in relation to
such specific issue. Nobody who becomes aware of the information contained in this report must regard it as definitive, because it is subject to changes
and modifications.
This document contains or may contain forward looking statements (in the usual meaning and within the meaning of the US Private Securities Litigation
Act of 1995) regarding intentions, expectations or projections of BBVA or of its management on the date thereof, that refer to miscellaneous aspects,
including projections about the future earnings of the business. The statements contained herein are based on our current projections, although the said
earnings may be substantially modified in the future by certain risks, uncertainty and other factors relevant that may cause the results or final decisions to
differ from such intentions, projections or estimates. These factors include, without limitation, (1) the market situation, macroeconomic factors,
regulatory, political or government guidelines, (2) domestic and international stock market movements, exchange rates and interest rates, (3) competitive
pressures, (4) technological changes, (5) alterations in the financial situation, creditworthiness or solvency of our customers, debtors or counterparts.
These factors could condition and result in actual events differing from the information and intentions stated, projected or forecast in this document and
other past or future documents. BBVA does not undertake to publicly revise the contents of this or any other document, either if the events are not
exactly as described herein, or if such events lead to changes in the stated strategies and estimates.
This document may contain summarised information or information that has not been audited, and its recipients are invited to consult the
documentation and public information filed by BBVA with stock market supervisory bodies, in particular, the prospectuses and periodical information filed
with the Spanish Securities Exchange Commission (CNMV) and the Annual Report on form 20-F and information on form 6-K that are disclosed to the
US Securities and Exchange Commission.
Distribution of this document in other jurisdictions may be prohibited, and recipients into whose possession this document comes shall be solely
responsible for informing themselves about, and observing any such restrictions. By accepting this document you agree to be bound by the foregoing
Restrictions.

3
Contents
3 BBVA, ready for the new banking standard
2BBVA in a new banking industry and a higher capital world
1 A changing macro environment
4 Conclusions

4
Growth improves across areas
EM: still high growth rates, despite recent global tightening; heterogeneous impact
Europe: gradual recovery with a stronger institutional framework
Spain significant progress in 2013, 0.9% expected growth in 2014
USA: QE “tapering” on the back of an improving economy, especially in Texas
Real GDP growth (%)
Source: BBVA Research. (1) South America includes only BBVA’s footprint in the region (Argentina, Chile, Colombia, Paraguay, Peru, Uruguay and Venezuela).
In this context, BBVA is very well positionedwith an attractive footprint in Developed and Emerging Markets
1.8%
2.3%
-0.4%
1.0%
-1.4%
0.9%
3.2%3.6%
1.4%
3.1%
20
13
20
14
20
13
20
14
20
13
20
14
20
13
20
14
20
13
20
14
USA Eurozone Spain S. America(1)
Mexico

5
The Spanish economy has bottomed out and GDP will start growing in 3Q13Main drivers:
Lower drag on GDP growth from:Exports and private sector
investment
Spain: exports and investment in equipment and machinery (2008=100)
Continued export growth should boost private
sector investment
Lower fiscal consolidation needs
Fiscal effort in 2014e -0.6% of GDP (vs -4.6% in 2012)
Unemployment rate stabilization thanks to labor market reform
Strong competitiveness gains
Residential construction will not drain growth in 2014
60
70
80
90
100
110
120
130
140
Dec
-99
Sep-0
0
Jun-0
1
Mar
-02
Dec
-02
Sep-0
3
Jun-0
4
Mar
-05
Dec
-05
Sep-0
6
Jun-0
7
Mar
-08
Dec
-08
Sep-0
9
Jun-1
0
Mar
-11
Dec
-11
Sep-1
2
Jun-1
3
Mar
-14
Dec
-14
Good and Services Exports
Investment in Equipment and Machinery
Source: BBVA Research
6
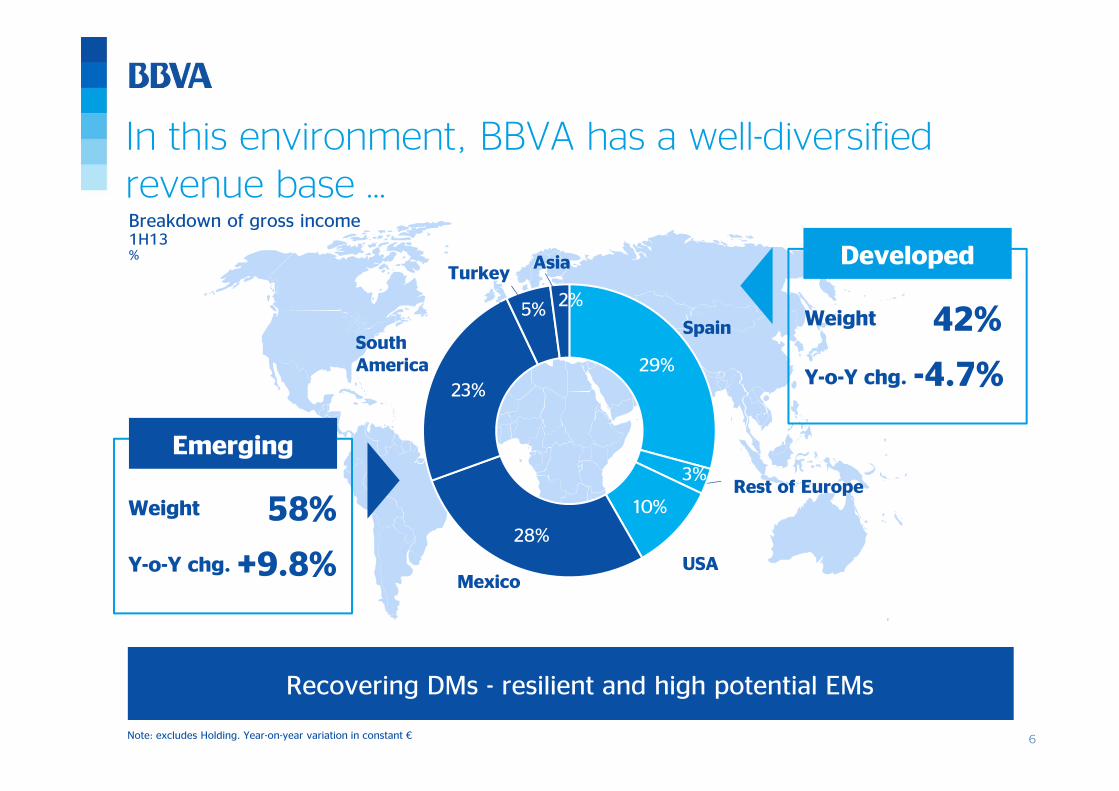
In this environment, BBVA has a well-diversified revenue base …
Note: excludes Holding. Year-on-year variation in constant €
29%
3%
10%
28%
23%
5% 2%
Spain
Rest of Europe
USA
Mexico
South America
TurkeyAsia
USA
Developed
42%
Y-o-Y chg.
Weight
-4.7%
Emerging
58%
Y-o-Y chg.
Weight
+9.8%
Breakdown of gross income 1H13%
Recovering DMs - resilient and high potential EMs

7
• Successfully managing the recent turmoil• High potential market for BBVA
Mexico
… with significant medium term upside in our major franchises …
South America
Turkey
Spain
• Resilient market with high potential, growth to recover in 2H13• Profitability vs. market share during historically low rate period
• Growth to stabilize at a high and sustainable level • Balanced diversification within the region
• Deposit cost and cost of risk normalization to drive P&L• Higher share of new business in a context of continued
deleverage in the system
USA• Growth in activity to continue• NII to improve as rates increase
… coupled with an active and successful FX hedging policy

8
USA: Activity remains solid and profitability will increase with interest rates
Cost ControlSolid Loan Growth
Superior Credit Quality High Interest Rate Sensitivity
Despite the strong technological effort, expenses remain
contained
-1% (YTD June 2013)
• Negatively impacting profitability in the short term
• NII will increase by +7% if the yield curve rises 100bps
New loan production
Over $1Bna month
5.04.5
3.9
2.11.7
1
1.5
2
2.5
3
3.5
4
4.5
5
5.5
6
2009 2010 2011 2012 Jun-13
NPL Ratio (1)
BBVA USA
3.8%
8.9%
Peers Median
BBVA Compass
Loan Growth (1)
June 2013(Y-o-Y %)
(1) BBVA Compass in Local Figures. (2) Peers: PNC, FHN, ASBC,STI, ZION, SNV, RF, KEY, FITB, CMA, USB, CFR, BBT, HBAN, MTB. (3) Excluding Guaranty LSA
(3)
(2)

9
1.2%
7.9%
-27.6%
20.2%
8.0%
Residentialmortgages
Consumer+C.Cards
Developers Corporates+SMEs (2)
Totalperforming
loans
Mexico: Prioritizing profitability vs. market share, in a historically low interest rate environment
Loan growth per segment (1)
(Y-o-Y, June 2013)
2.1
5.7
1.6
4.5
ROA(%) NIM (%)
Bancomer Peers' average
ROA and NIM (3)
Bancomer vs. Peers’ average(December 2012)
BBVA MEXICO
A track record of anticipation, pulling back of increasingly risky segments like credit cards in 2006/07 and developers since 2010
Active management of asset mix Leader in profitability
(1) Consolidated figures. (2) Excluding Public Sector. (3) Data according to local accounting; Peers included: Banamex, Banorte, HSBC and Santander.

10
South America: Normalizing growth at a high and sustainable level
Solid credit quality indicators
Self-financed growth
Strong profitability (5)
Leadership positions (1)
1.9
1.1
2.6
1.8
2009 2012
BBVA
System
NPL ratio (4)
(%)
2010-2012CAGR (3)
June 2013y-o-y
Performing Loans +25% +17%
Deposits +23% +27%
VEN CHIPER COL ARG S.A.(2)
13.0 7.423.2 9.6 7.6 10.2Mkt. Share%
3rd 2nd 4th 4thRkg.#
2.2% ROA
5.7% NIM
(1) Market share and ranking by loans. Data as of June, 2013. (2) Regional market share including: Argentina, Chile, Colombia, Panama, Paraguay, Peru, Uruguay and Venezuela. (3) South America (only banks), based on average balances, constant €. (4) Data according to local accounting. (5) Consolidated data, as of June, 2013. Annualized Net Income (for ROA) and annualized Net Interest Income (for NIM) over Average Total Assets.
5th
BBVA SOUTH AMERICA
Well-diversified footprint with different management priorities across countries
11
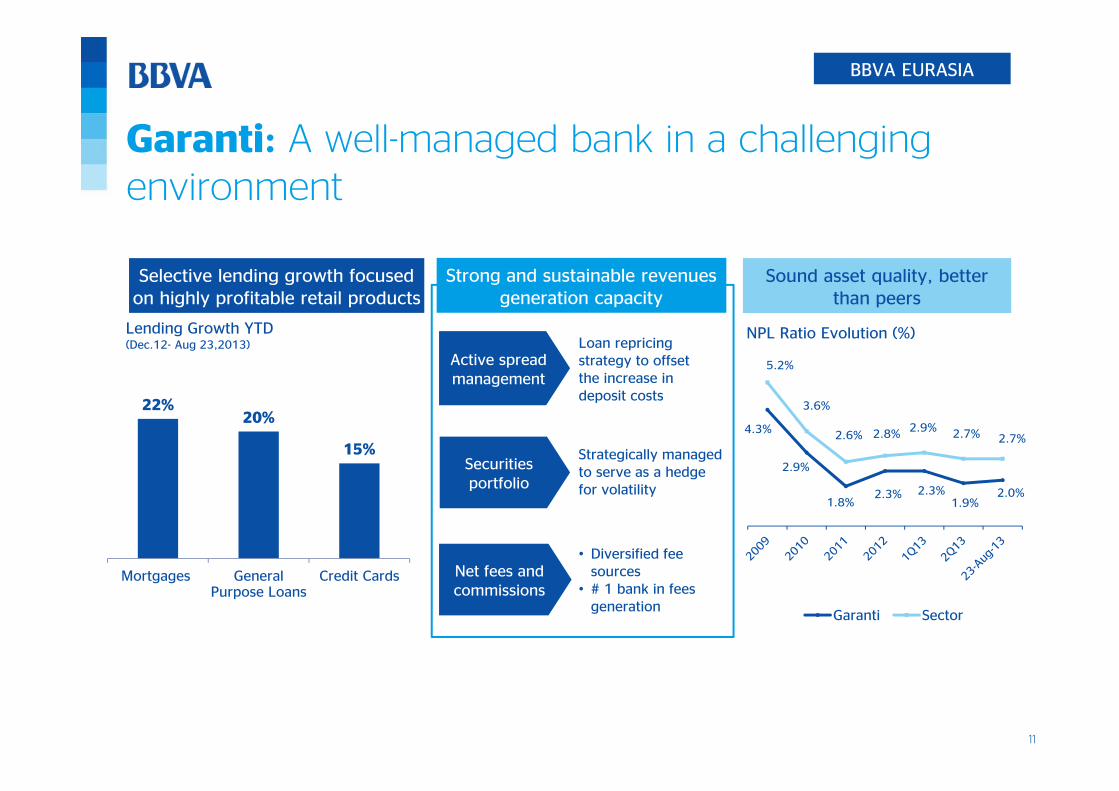
Loan repricingstrategy to offset the increase in deposit costs
Garanti: A well-managed bank in a challenging environment
BBVA EURASIA
Selective lending growth focused on highly profitable retail products
Strong and sustainable revenues generation capacity
Sound asset quality, better than peers
Active spread management
Securities portfolio
Strategically managed to serve as a hedge for volatility
Net fees and commissions
• Diversified fee sources
• # 1 bank in fees generation
22%20%
15%
Mortgages GeneralPurpose Loans
Credit Cards
Lending Growth YTD (Dec.12- Aug 23,2013)
4.3%
2.9%
1.8%2.3% 2.3%
1.9%2.0%
5.2%
3.6%
2.6% 2.8% 2.9% 2.7% 2.7%
Garanti Sector
NPL Ratio Evolution (%)

12
Active and successful FX hedging policy
Limited impact of FX volatility on core capital (10 bps YTD)
60% of expectedFX Net Income
hedged
Reduce FX impact on
Group’s Net Income
40% of FX Equityhedged
Minimize Core capital
Volatility
100105
115
140
152156
151
164
100
110
107 106 108104
97 982006 2007 2008 2009 2010 2011 2012 1H13
BBVA Peer's average
Tangible Book Value per shareBBVA Group vs. European Peer Group average(Base 100 = 2006)
Peers considered: BARCL, BNPP, CASA , CMZ, CS, DB, ISP, HSBC, LBG, RBS, SAN, SG, UCI and UBS.
FX HEDGING POLICY
13
1,646 1,4061,940
769 652
242 842208
253205
3.2%
2.6%
3.6%
1.5%1.3%
0
0.5
1
1.5
2
2.5
3
3.5
0
500
1000
1500
2000
2500
2Q12 3Q12 4Q12 1Q13 2Q13
RE assets impairtmentsLoan-loss provisions (Banking activity+developers)Cost of risk (RE assets impairtments not included)
857
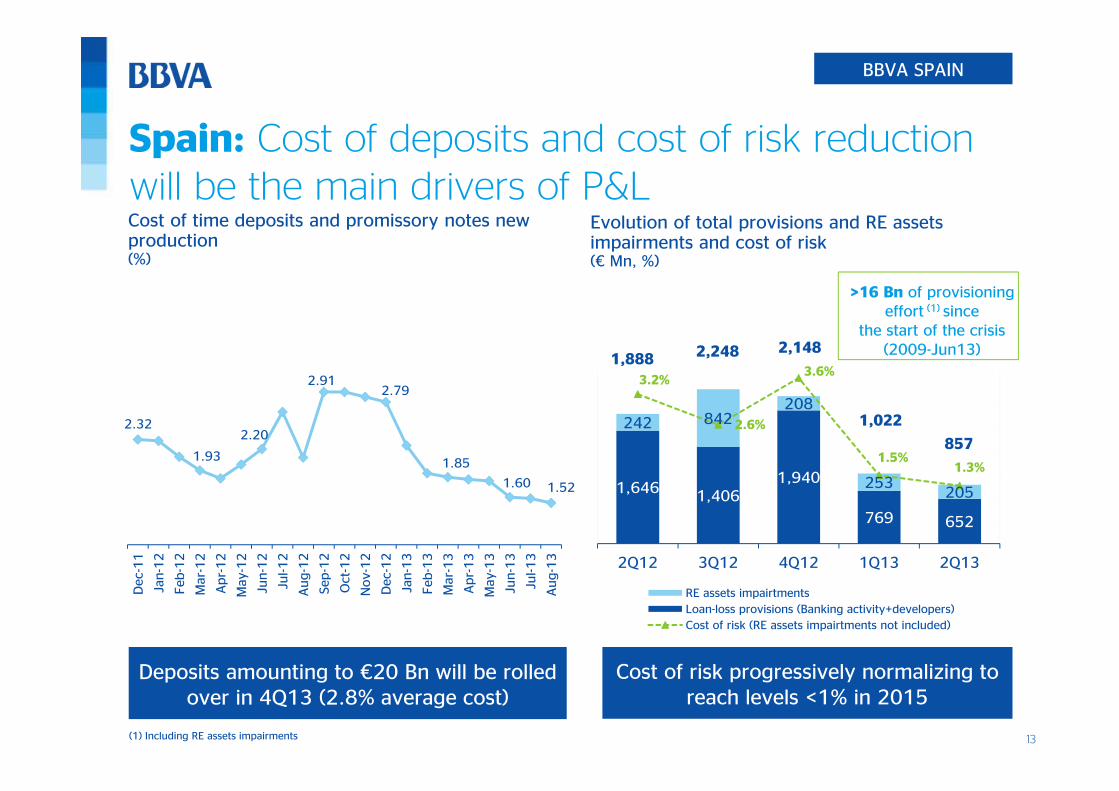
Spain: Cost of deposits and cost of risk reduction will be the main drivers of P&L
BBVA SPAIN
Evolution of total provisions and RE assets impairments and cost of risk(€ Mn, %)
Cost of time deposits and promissory notes new production(%)
1,888 2,248 2,148
1,022
>16 Bn of provisioning effort (1) since
the start of the crisis (2009-Jun13)
Deposits amounting to €20 Bn will be rolled over in 4Q13 (2.8% average cost)
2.32
1.93
2.20
2.912.79
1.85
1.60 1.52
Dec
-11
Jan-1
2
Feb
-12
Mar
-12
Apr-
12
May
-12
Jun-1
2
Jul-1
2
Aug-1
2
Sep-1
2
Oct
-12
Nov-
12
Dec
-12
Jan-1
3
Feb
-13
Mar
-13
Apr-
13
May
-13
Jun-1
3
Jul-1
3
Aug-1
3
(1) Including RE assets impairments
Cost of risk progressively normalizing to reach levels <1% in 2015

14
Contents
3 BBVA, ready for the new banking standard
2 BBVA in a new banking industry and a higher capital world
1 A changing macro environment
4 Conclusions
15
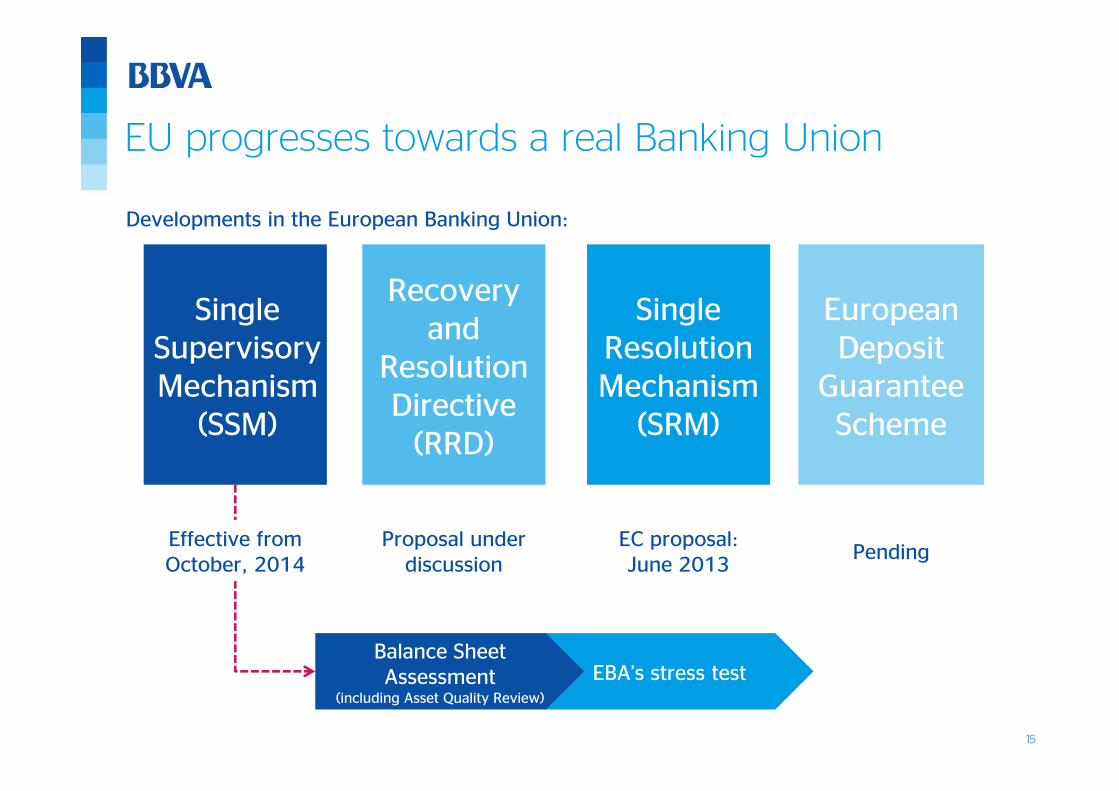
EBA’s stress test
European Deposit
Guarantee Scheme
Single Supervisory Mechanism
(SSM)
Recovery and
Resolution Directive
(RRD)
Single Resolution Mechanism
(SRM)
EU progresses towards a real Banking Union
Effective from October, 2014
Proposal under discussion
PendingEC proposal: June 2013
Balance Sheet Assessment
(including Asset Quality Review)
Developments in the European Banking Union:

16
8470
5223
6
89
59
33
3737
9%
13.4%
3.4% 3.3% 3.1%
0
2
4
6
8
10
12
14
16
0
50
100
150
200
UK Spain Germany France Italy
Public (1) Private % Capital injections over GDP
Spanish financial sector: in a strong position to face the upcoming European Asset Quality Review and stress test
Very significant effort in terms of provisions
Financial System Recapitalization (Jul07-Jul13) (€Bn)
€173 Bn
€129 Bn
€84 Bn
€60 Bn€43 Bn
0.0
0.5
1.0
1.5
2.0
2.5
3.0
3.5
4.0
4.5
5.0
5.5
2008 2009 2010 2011 2012
Spain Germany France
Italy UK
Cost of Risk (pp)
(2)
Recapitalization in Spain:among the highest in Europe
(3)
Provisioning effort in Spain Jun08 - Dec12:> €200 Bn, including RE assets impairments
Source: BBVA. GDP data as of Dec-2012.
Source: BoS and BBVA
(1) Public financial assistance committed in various forms of capital. (2) Public capital support includes: €61 Bn of capital injections, €6.5 Bn of Asset Protection Schemes expected losses and €2.2 Bn of capital injection into SAREB. (3) Loan loss provisions over ‘Other Residential Sector’ loans

17
Regulatory developments should provide additional tools to assess a bank's solvency
Capital Adequacy
from
Risk-based capital ratios
Combination of risk-based and
leverage
to
Credit Worthiness
Profitability + Sovereign support
Profitability + Loss absorption
capacity
The solvency of a sovereign should contribute less to a bank's rating than its fundamentals

18
In the new regulatory environment, certain business models will be questioned
Retail business models will be reinforced
• Short-term ratio: LCR• Long-term ratio: NSFR
BIS 3 leverage ratio• BIS 3• RWAs density
Liquidity
Capital Leverage
Business Model
CAPITAL ADEQUACY
1919
90
95
100
105
110
115
120
125
130
4Q10 1Q11 2Q11 3Q11 4Q11 1Q12 2Q12 3Q12 4Q12 1Q13 2Q13
BBVA European Peer Group Aggregate
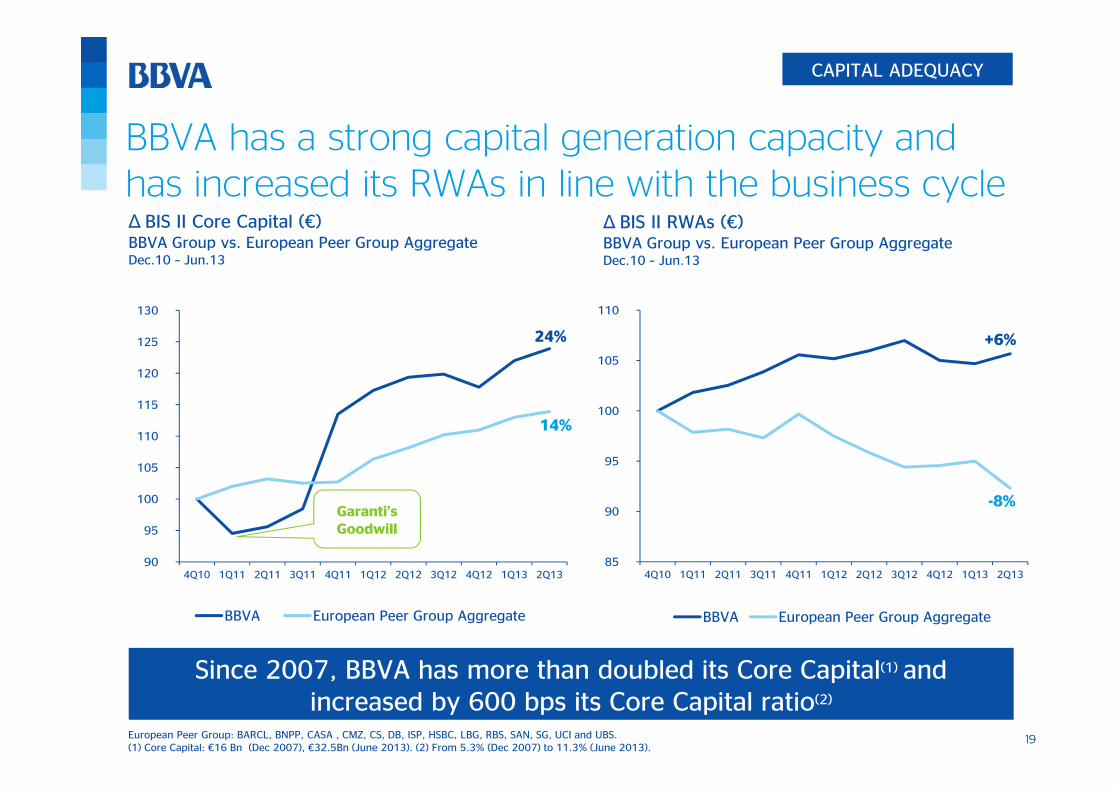
Δ BIS II Core Capital (€)BBVA Group vs. European Peer Group Aggregate Dec.10 – Jun.13
24%
14%
BBVA has a strong capital generation capacity and has increased its RWAs in line with the business cycle
Δ BIS II RWAs (€)BBVA Group vs. European Peer Group Aggregate Dec.10 – Jun.13
85
90
95
100
105
110
4Q10 1Q11 2Q11 3Q11 4Q11 1Q12 2Q12 3Q12 4Q12 1Q13 2Q13
BBVA European Peer Group Aggregate
+6%
-8%
Since 2007, BBVA has more than doubled its Core Capital(1) and increased by 600 bps its Core Capital ratio(2)
European Peer Group: BARCL, BNPP, CASA , CMZ, CS, DB, ISP, HSBC, LBG, RBS, SAN, SG, UCI and UBS.(1) Core Capital: €16 Bn (Dec 2007), €32.5Bn (June 2013). (2) From 5.3% (Dec 2007) to 11.3% (June 2013).
Garanti’sGoodwill
CAPITAL ADEQUACY
2020
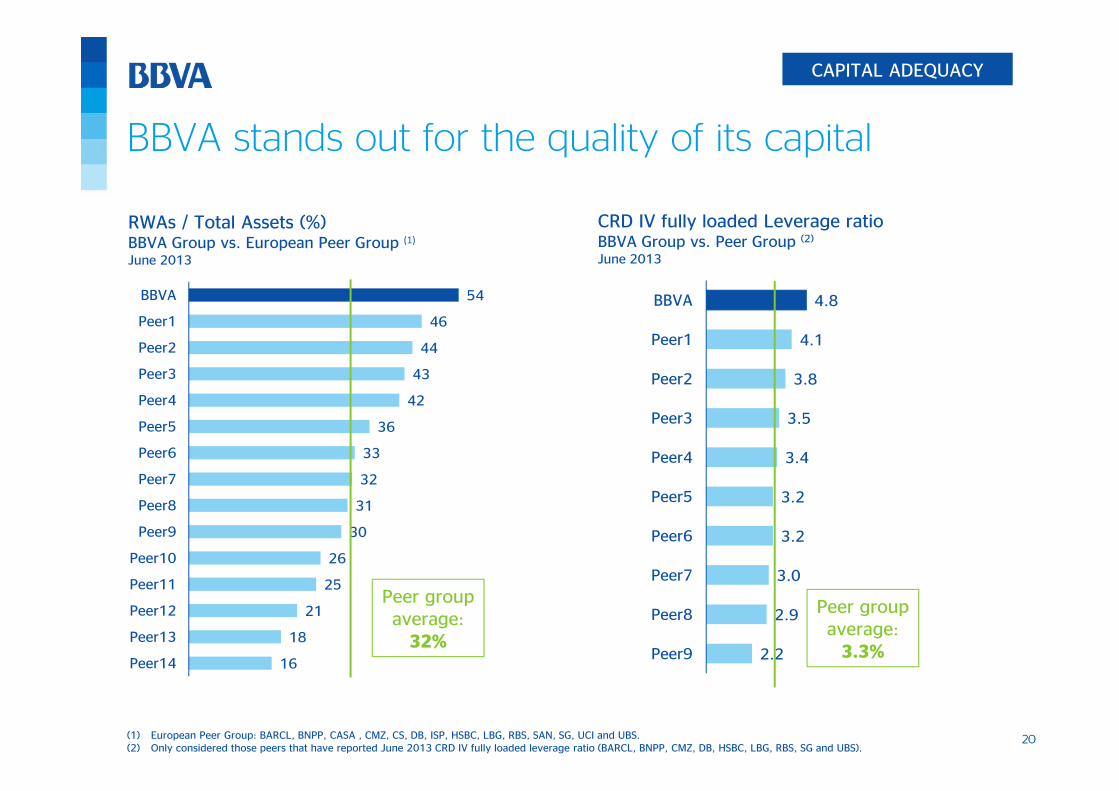
BBVA stands out for the quality of its capital
RWAs / Total Assets (%)BBVA Group vs. European Peer Group (1)June 2013
16
18
21
25
26
30
31
32
33
36
42
43
44
46
54
Peer14
Peer13
Peer12
Peer11
Peer10
Peer9
Peer8
Peer7
Peer6
Peer5
Peer4
Peer3
Peer2
Peer1
BBVA
(1) European Peer Group: BARCL, BNPP, CASA , CMZ, CS, DB, ISP, HSBC, LBG, RBS, SAN, SG, UCI and UBS.(2) Only considered those peers that have reported June 2013 CRD IV fully loaded leverage ratio (BARCL, BNPP, CMZ, DB, HSBC, LBG, RBS, SG and UBS).
2.2
2.9
3.0
3.2
3.2
3.4
3.5
3.8
4.1
4.8
Peer9
Peer8
Peer7
Peer6
Peer5
Peer4
Peer3
Peer2
Peer1
BBVA
CRD IV fully loaded Leverage ratioBBVA Group vs. Peer Group (2)
June 2013
Peer group average:
32%
Peer group average:
3.3%
CAPITAL ADEQUACY
21
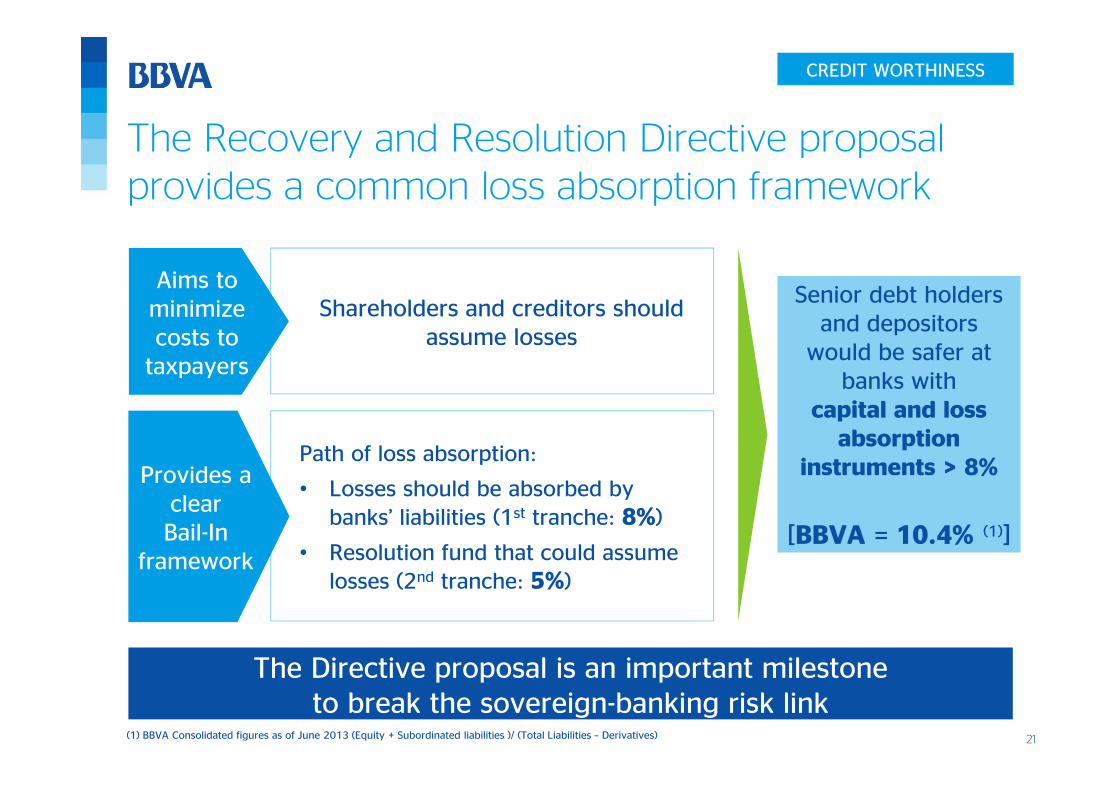
Path of loss absorption:
• Losses should be absorbed by banks’ liabilities (1st tranche: 8%)
• Resolution fund that could assume losses (2nd tranche: 5%)
Shareholders and creditors should assume losses
Aims to minimize costs to
taxpayers
The Recovery and Resolution Directive proposal provides a common loss absorption framework
CREDIT WORTHINESS
The Directive proposal is an important milestone to break the sovereign-banking risk link
Provides a clear Bail-In
framework
Senior debt holders and depositors
would be safer at banks with
capital and loss absorption
instruments > 8%
[BBVA = 10.4% (1)]
(1) BBVA Consolidated figures as of June 2013 (Equity + Subordinated liabilities )/ (Total Liabilities – Derivatives)

22
BBVA has one of the highest percentages of capital and loss absorption instruments over total liabilities
10.4%
9.3%9.0%
8.8%8.3%
7.4%7.1%
6.5% 6.4%
5.6%5.2%
4.8%
BBVA Peer1 Peer2 Peer3 Peer4 Peer5 Peer6 Peer7 Peer8 Peer9 Peer10 Peer11
(1) (Equity + Subordinated liabilities )/ (Total Liabilities – Derivatives). European Peers: BARCL, BNPP, CASA, CMZ, DB, ISP, HSBC, LBG, SAN, SG and UCI.
Capital and loss absorption instruments / Total Liabilities (1)
Consolidated figures as of June, 2013(%)
8%
CREDIT WORTHINESS

2323Credit Rating according to S&P; European Peer Group: BARCL, BNPP, CASA, CMZ, CS, DB, ISP, HSBC, LBG, RBS, SAN, SG, UCI, and UBS.
The RRD should break the sovereign - banking link and change current rating dynamics
BBVA’s rating does not reflect its capital adequacy and credit worthiness
AA
AA-
A+
A
A-
BBB+
BBB
BBB-
-2 +2 / +3 +2 +2 +1 0Sovereign
Uplift
BBVA SP2 UK1 UK2 UK3 UK4 SW1 SW2 GER1 GER2 FR1 FR2 FR3 IT1 IT2
Stand Alone Rating Sovereign Uplift Sovereign Penalization
CREDIT WORTHINESS
24
Contents
3 BBVA, ready for the new banking standard
2BBVA in a new banking industry and a higher capital world
1 A changing macro environment
4 Conclusions

25
Most banks still run their
IT systems on “patched”
technology from the 60’s
and 70’s platforms
Adapting to the digital age is a multi-year effort that requires major investments and process re-engineering
In retail banking, the rules of the game have changed
21st century Banking
Omnichannel
Smart Data Contents
MobilityReal-time

26
USA
Mexico
South America
Spain 80 %100 % 90 %
80 %80 % 75 %
80 %80 % 50 %
80 %70 % 40 %
Transformation Plan IT investment progress:
Satisfying client needs providing the best customer experience, while improving commercial productivity and efficiency
GOAL
BBVA’s 2007 Transformation Plan: technology as a key sustainable competitive advantage
Foundations Value added
75 %
40 %
40 %
35 %
IT InfrastructureCore banking
platformBig Data Omnichannel

27
This effort is mandatory, as our clients are becoming increasingly digital
4,4235,044
5,948
2010 2011 2012
76%
78%
81%
2010 2011 20122010 2011 2012
Active Internet customersBBVA Group (in thousands)
Transactions through alternative channelsBBVA Group (%)
16,995
18,794
20,177
Source: BBVAGaranti Bank not included
ATMsBBVA Group (number)
Smartphone app adoption is growing fast
+34% +19%
2828
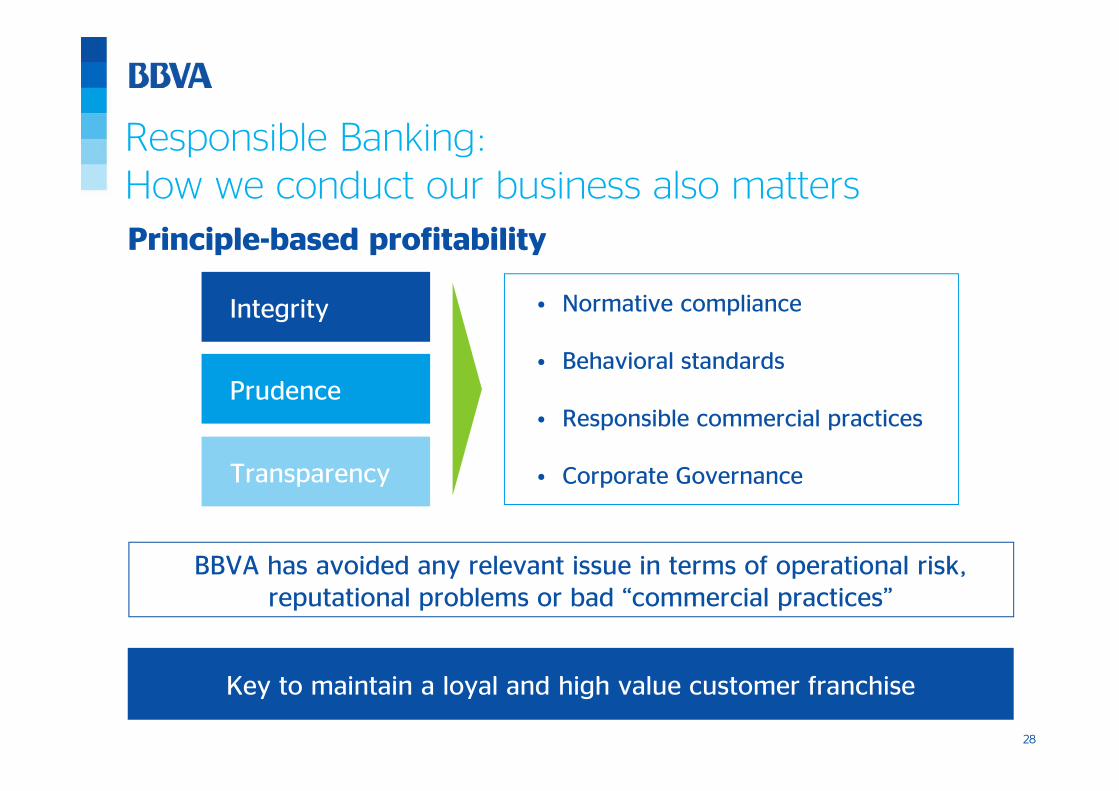
Prudence
Transparency
Integrity • Normative compliance
• Behavioral standards
• Responsible commercial practices
• Corporate Governance
BBVA has avoided any relevant issue in terms of operational risk, reputational problems or bad “commercial practices”
Responsible Banking: How we conduct our business also matters
Key to maintain a loyal and high value customer franchise
Principle-based profitability
29
Contents
3 BBVA, ready for the new banking standard
2BBVA in a new banking industry and a higher capital world
1 A changing macro environment
4 Conclusions
30
Conclusions
1 Well positioned for the new macroeconomic cycle
2
Active FX hedging policy to protect our shareholders wealth 3
Positive dynamics in our major franchises despite uncertainties
4 Strong capital position: capital generation capacity & low leverage
5 RRD: breaking sovereign–banking link
6 Ready for the digital era, a competitive advantage
7 Responsible Banking: How we conduct our business also matters

31
BoAML 18th Annual Banking & Insurance CEO Conference“Making finance work in a higher capital world”
September 25th, 2013
Manuel González Cid, CFO
BBVA, ready for the new world