Embed Size (px)
Citation preview
BB Working Paper Series: WP No. 2004
Foreign Exchange Market Structure and Exchange Rate Volatility in Bangladesh
Md.Yousuf
Md. Sakawat Hossain
Mahmud Salahuddin Naser
Md. Ezazul Islam
Bangladesh Bank
August 2020

Page 1 of 18
Foreign Exchange Market Structure and
Exchange Rate Volatility in Bangladesh Md. Yousuf, Md. Sakhawat Hossain, Mahmud Salahuddin Naser, Md. Ezazul Islam
1
Abstract
Foreign exchange rate volatility is an important factor involved in the decision making of investors and
policymakers. This study attempts to measures the volatility behavior in terms of exchange rate returns and
volume of daily transactions in foreign exchange market of Bangladesh ranging from July 2014 to June 2018,
applying GARCH family models (i.e. PARCH, EGARCH, and IGARCH). The results show that the presence of
volatility clustering in foreign exchange rate returns as the volatility of risk is responsive to past shocks and the
past volatility influences the current volatility of exchange rate returns. Moreover, the return is positively related
to its volatility. The existence of leverage effect is also evidenced in the Bangladesh foreign exchange market
because positive past shocks increase volatility more than the negative past shocks of the same magnitude. Thus,
the appreciation and the depreciation of Bangladesh Taka against USD do not necessarily cause symmetric
variation in the exchange rate returns.
Keywords: Exchange rate, Volatility, ARCH, GARCH
JEL Classification: C52, C58, E44, F31
Introduction
Analyzing foreign exchange rate volatility i.e. fluctuation of the exchange rate with respect to
time is essential for corporate decision-makers because such unpredictable movement
presents exchange rate risk and uncertainty in the operational environment and increases
profit uncertainty. The policymakers, on the other hand, keep an eye on the foreign exchange
rate volatility for making economic decisions as it has effects on capital flows and
international trade that are crucial for the balance of payments of a country. In addition, FX
rate volatility adversely affects the long-term decisions by stirring the volume of global
marketing and decisions to allocate resources for investment, sales and procurement policies
of governments as investor’s confidence to invest in a particular country is inversely related 1 The authors are from The Chief Economist's Unit of Bangladesh Bank. The authors are grateful to Dr. Md.
Habibur Rahman, Executive Director, Bangladesh Bank for suggesting new explorations that led to a better
understanding of the findings of the study. The authors are alone responsible for the views or opinions expressed
in this paper and not in any way the institution where they are working. The authors welcome comments and
suggestions for improvement of the content and those may be forwarded to [email protected]
Page 2 of 18
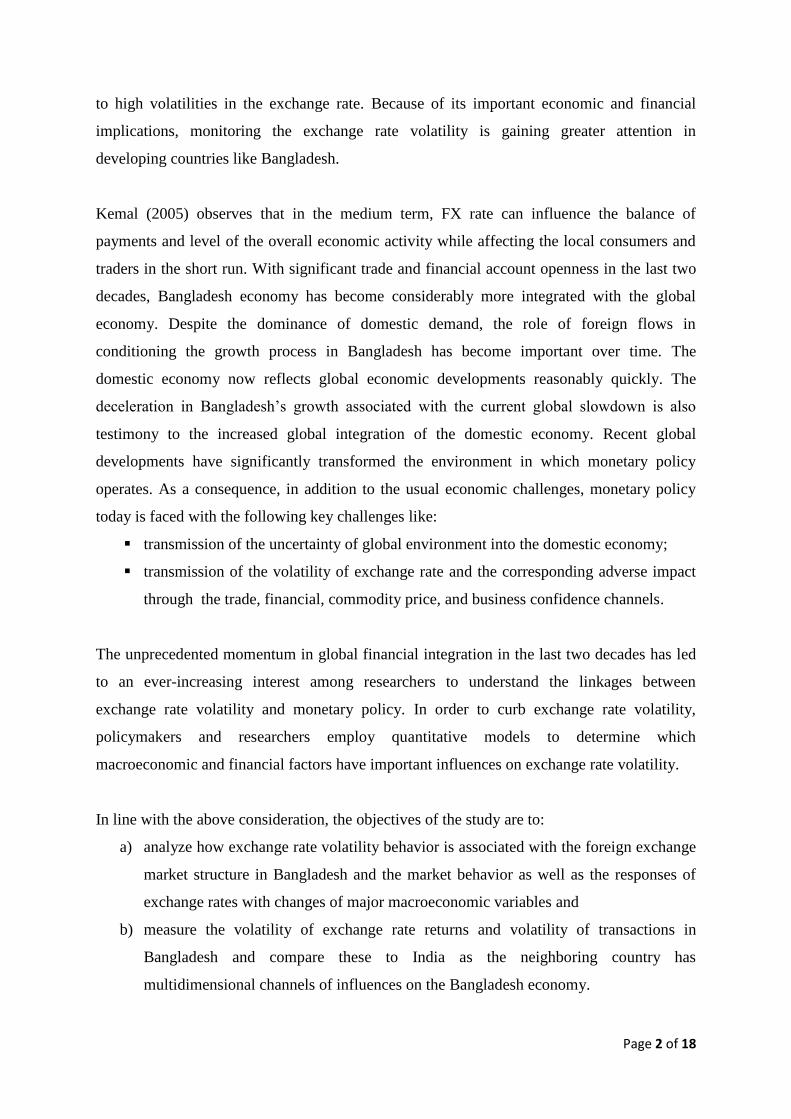
to high volatilities in the exchange rate. Because of its important economic and financial
implications, monitoring the exchange rate volatility is gaining greater attention in
developing countries like Bangladesh.
Kemal (2005) observes that in the medium term, FX rate can influence the balance of
payments and level of the overall economic activity while affecting the local consumers and
traders in the short run. With significant trade and financial account openness in the last two
decades, Bangladesh economy has become considerably more integrated with the global
economy. Despite the dominance of domestic demand, the role of foreign flows in
conditioning the growth process in Bangladesh has become important over time. The
domestic economy now reflects global economic developments reasonably quickly. The
deceleration in Bangladesh’s growth associated with the current global slowdown is also
testimony to the increased global integration of the domestic economy. Recent global
developments have significantly transformed the environment in which monetary policy
operates. As a consequence, in addition to the usual economic challenges, monetary policy
today is faced with the following key challenges like:
transmission of the uncertainty of global environment into the domestic economy;
transmission of the volatility of exchange rate and the corresponding adverse impact
through the trade, financial, commodity price, and business confidence channels.
The unprecedented momentum in global financial integration in the last two decades has led
to an ever-increasing interest among researchers to understand the linkages between
exchange rate volatility and monetary policy. In order to curb exchange rate volatility,
policymakers and researchers employ quantitative models to determine which
macroeconomic and financial factors have important influences on exchange rate volatility.
In line with the above consideration, the objectives of the study are to:
a) analyze how exchange rate volatility behavior is associated with the foreign exchange
market structure in Bangladesh and the market behavior as well as the responses of
exchange rates with changes of major macroeconomic variables and
b) measure the volatility of exchange rate returns and volatility of transactions in
Bangladesh and compare these to India as the neighboring country has
multidimensional channels of influences on the Bangladesh economy.

Page 3 of 18
In the era of the financial globalization process, monetary policy authorities have given a
high weight to reduce the negative consequences of exchange rate fluctuations on inflation
dynamics. To the best of our knowledge, ample studies have been done on the developed
markets FX volatility but a few studies have been conducted on Bangladesh. So, this study
will also further contribute to a literature on Bangladesh FX market volatility. Moreover, this
study differs from the studies conducted earlier on Bangladesh as this study uses updated data
along with contemporary econometric tools and techniques to overcome some
methodological limitations of the earlier studies on exchange rate volatility. Different
GARCH family models have been used in the study to capture the main characteristics of the
time series, such as volatility clustering and leverage effect. Moreover, most of the studies on
Bangladesh only focus on exchange rate volatility rather than the overall market activities
such as transaction volume. The issue of transaction volume is important because unexpected
events may affect the transaction volume which has an impact on exchange rate volatility
especially reflected on market demand and supply. Accordingly, this study considers the
transaction of the FX market and volatilities together instead of considering them separately.
Rest of the study is organized as follows. Following the introduction in section 1, Section 2
reviews some relevant literature on the exchange rate volatility. Section 3 discusses the
features of the foreign exchange market structure and operations in Bangladesh. Section 4
specifies data and methodology used in the study and section 5 highlights the results of the
models. Finally, section 6 offers the conclusions.
2. Review of the Literature
In the modern integrated world, the exchange rate plays a vital role not only in foreign trade
but also in domestic price stability. Chongcheul Cheong, et al (2006) examine the dynamic
interrelations between exchange rate uncertainty, international trade, and trading
competitiveness in prices, using UK data. The empirical results derived from vector
autoregressive (VAR) models show that a shock to exchange rate volatility negatively affects
trade volumes, and such negative effects are greater than the effects on trade price levels.
Bhanumurthy (2006) finds that a majority of the dealers feel short-term changes in the Indian
rupee/US dollar market are basically influenced by the micro variables such as information
flow, market movement, speculation, central bank intervention, etc. Khullar and Sethi (2011)
Page 4 of 18
measure the volatility of FX market in India found that the exchange rate of EURO is much
more volatile than the YEN and US Dollar in the Indian foreign exchange market when
comparing their daily volatilities. For all the 3 currencies under this study, they found
generally an increasing trend in volatility when volatility is compared along the different time
span taken into consideration such as from daily to weekly to monthly.
Among the articles on Bangladesh, Ahmed (2009) analyzes the relationship between
exchange rate volatility and international trade growth in Bangladesh. The result shows that
the exchange rate volatility has a negative and major effect on trade both in short run and
long run with Western European and North American countries. Alam and Rahman (2012)
Using GARCH type models,they measured the volatility of exchange rate using daily data for
the period of July 2006-April 2012 find that the past volatility of exchange rate significantly
influences current volatility. However, in this study limitations like excess skewness and
kurtosis issues were detected but not properly addressed. Moreover, the lag specification of
the mean equation was not properly addressed in their paper. Estimation with these may show
misleading findings.
Younus (2014) finds that Bangladesh’s export to India is sensitive to India’s Rupee
depreciation and Bangladesh’s imports are very sensitive to the relative price level changes.
Rahman &Ghosh (2013) detect that the forecasted exchange rates have not been exactly
convergent to the market exchange rates and the volatility has been mounting. Hossain &
Ahmed, (2009) conclude that expansionary monetary policy has a high exchange rate pass-
through with high market pressure. Moreover, lowering the REER volatility has positive
impact on overall exports.
Kamal Uddin et al (2013) investigate the fluctuation in the exchange rate of Bangladesh
observes that stock of money and increase in debt service burden results in a real depreciation
of currency while increasing foreign exchange reserve results in a real appreciation of the
currency. Moreover, political instability has a significant negative effect on the value of the
domestic currency. Another study by Abdullah et al (2017) examine exchange rate volatility
using daily exchange rates for 7 years (January 1, 2008 - April 30, 2015) found that, in
contrast with the normal distribution, the application of Student’s t-distribution for errors
helped the models satisfy the diagnostic tests and show improved forecasting accuracy. This
study has also limitations since only the AR process is used in the mean equation but ARMA
process may be more appropriate.
Page 5 of 18
Our approach differs from the current literature that we measure the volatility of exchange
rate using GARCH type models including GARCH in Mean equation with the objectives of
measuring Foreign exchange rate volatility and also examining the foreign exchange market
structure in Bangladesh. We not only measure the volatility of the exchange rate but also the
volatility of transactions volume. Moreover, in this study, we compare the foreign exchange
market of Bangladesh with that of India, a major trade partner.
3. Features of the FX Market: Structure and Operations
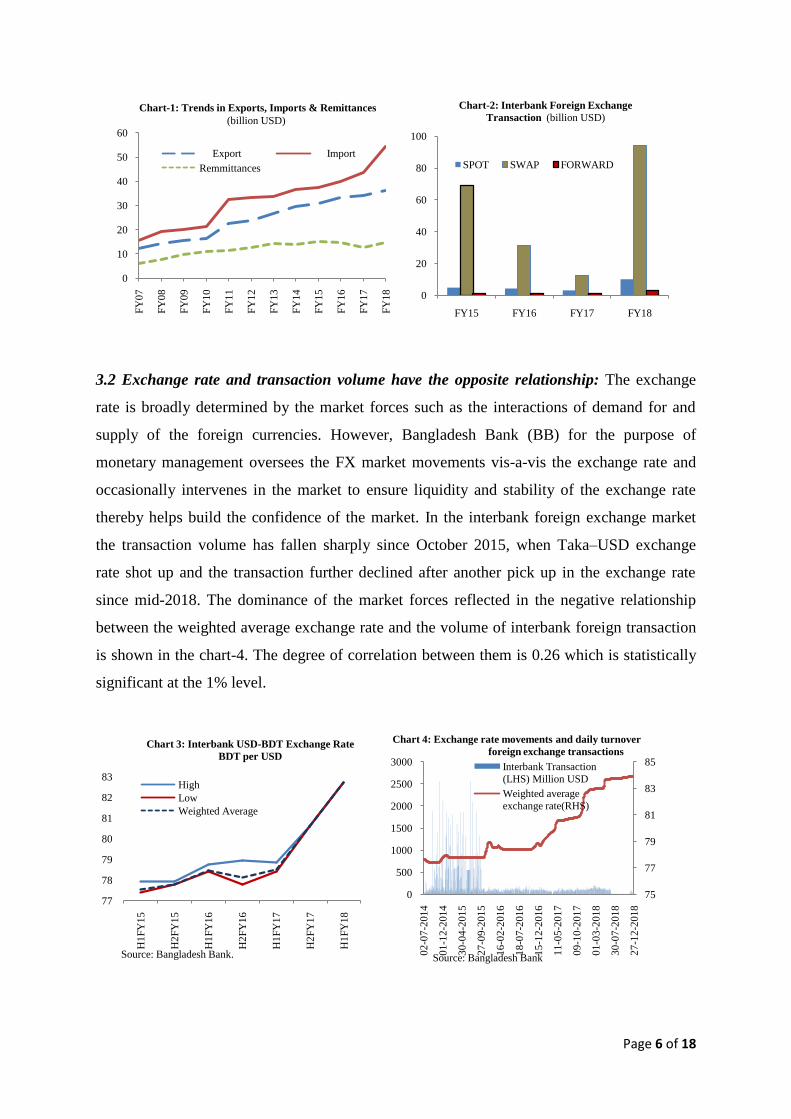
3.1 Volume of Transactions is increasing over time: All types of current transactions
(excluding interbank) such as export earnings, import payment, remittance earnings are
transected by the authorized dealer banks deal with customers increased over time (chart-1).
At present 57 scheduled banks with 1010 branches and 225 money changers are doing their
FX businesses in Bangladesh. Mainly two types of transactions take place in Bangladesh FX
market namely interbank and other than interbank. Authorized dealer banks are engaged in
interbank transactions while both banks and money changers are engaged in transactions with
the customers. In addition to the formal markets such as banks and money changers, there are
some informal transactions which are called curb market transactions. In spite of major
transactions occurred in USD, the interbank market is divided into 'US Dollar' and 'Non-
Dollar' segment (includes all currencies other than USD, but calculated in equivalent USD
units).
Among the typical foreign exchange instruments such as Spot, Forward and SWAP; the
SWAP remained the dominant trading instrument during our sample period in Bangladesh
foreign exchange market (chart-2). During FY18 the percentage share of SWAP, Spot and
Forward transactions were 88%, 9% and 3% respectively while during FY17 the percentage
share of SWAP, Spot and Forward transactions were 75%, 19% and 6% respectively. Decline
in transaction of Spot and Forward as reflected in the percentage share of their transactions in
FY18 compared to FY17 may be attributable to the higher weighted average exchange rate in
FY18 than that of in FY17 (chart-3). So, a relationship between the exchange rate and the
transaction type is also observed in Bangladesh FX market.
Page 6 of 18
3.2 Exchange rate and transaction volume have the opposite relationship: The exchange
rate is broadly determined by the market forces such as the interactions of demand for and
supply of the foreign currencies. However, Bangladesh Bank (BB) for the purpose of
monetary management oversees the FX market movements vis-a-vis the exchange rate and
occasionally intervenes in the market to ensure liquidity and stability of the exchange rate
thereby helps build the confidence of the market. In the interbank foreign exchange market
the transaction volume has fallen sharply since October 2015, when Taka–USD exchange
rate shot up and the transaction further declined after another pick up in the exchange rate
since mid-2018. The dominance of the market forces reflected in the negative relationship
between the weighted average exchange rate and the volume of interbank foreign transaction
is shown in the chart-4. The degree of correlation between them is 0.26 which is statistically
significant at the 1% level.
0
10
20
30
40
50
60F
Y0
7
FY
08
FY
09
FY
10
FY
11
FY
12
FY
13
FY
14
FY
15
FY
16
FY
17
FY
18
Export Import
Remmittances
Chart-1: Trends in Exports, Imports & Remittances
(billion USD)
0
20
40
60
80
100
FY15 FY16 FY17 FY18
SPOT SWAP FORWARD
Chart-2: Interbank Foreign Exchange
Transaction (billion USD)
75
77
79
81
83
85
0
500
1000
1500
2000
2500
3000
02
-07
-201
4
01
-12
-201
4
30
-04
-201
5
27
-09
-201
5
16
-02
-201
6
18
-07
-201
6
15
-12
-201
6
11
-05
-201
7
09
-10
-201
7
01
-03
-201
8
30
-07
-201
8
27
-12
-201
8
Interbank Transaction
(LHS) Million USD
Weighted average
exchange rate(RHS)
Source: Bangladesh Bank
Chart 4: Exchange rate movements and daily turnover
foreign exchange transactions
77
78
79
80
81
82
83
H1
FY
15
H2
FY
15
H1
FY
16
H2
FY
16
H1
FY
17
H2
FY
17
H1
FY
18
Chart 3: Interbank USD-BDT Exchange Rate
BDT per USD
High
Low
Weighted Average
Source: Bangladesh Bank.
Page 7 of 18
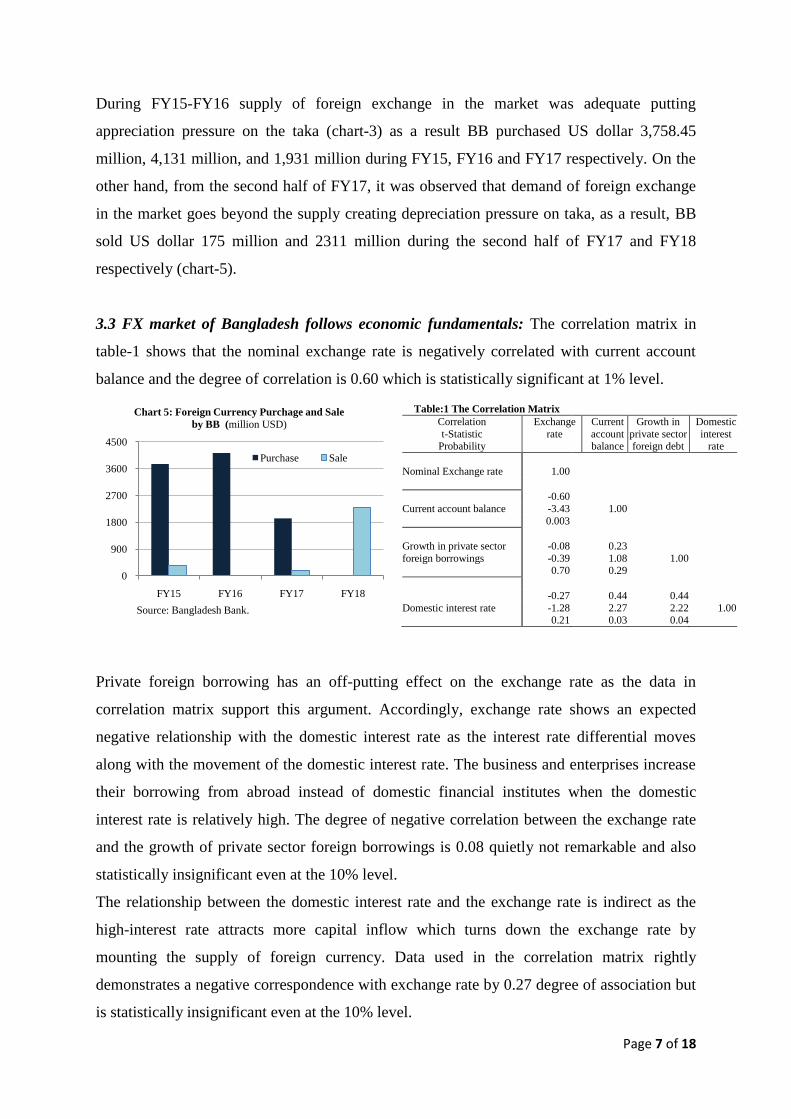
During FY15-FY16 supply of foreign exchange in the market was adequate putting
appreciation pressure on the taka (chart-3) as a result BB purchased US dollar 3,758.45
million, 4,131 million, and 1,931 million during FY15, FY16 and FY17 respectively. On the
other hand, from the second half of FY17, it was observed that demand of foreign exchange
in the market goes beyond the supply creating depreciation pressure on taka, as a result, BB
sold US dollar 175 million and 2311 million during the second half of FY17 and FY18
respectively (chart-5).
3.3 FX market of Bangladesh follows economic fundamentals: The correlation matrix in
table-1 shows that the nominal exchange rate is negatively correlated with current account
balance and the degree of correlation is 0.60 which is statistically significant at 1% level.
Table:1 The Correlation Matrix
Correlation
t-Statistic Probability
Exchange
rate
Current
account balance
Growth in
private sector foreign debt
Domestic
interest rate
Nominal Exchange rate
1.00
Current account balance
-0.60
-3.43 1.00
0.003
Growth in private sector
foreign borrowings
-0.08 0.23
-0.39 1.08 1.00 0.70 0.29
Domestic interest rate
-0.27 0.44 0.44
-1.28 2.27 2.22 1.00 0.21 0.03 0.04
Private foreign borrowing has an off-putting effect on the exchange rate as the data in
correlation matrix support this argument. Accordingly, exchange rate shows an expected
negative relationship with the domestic interest rate as the interest rate differential moves
along with the movement of the domestic interest rate. The business and enterprises increase
their borrowing from abroad instead of domestic financial institutes when the domestic
interest rate is relatively high. The degree of negative correlation between the exchange rate
and the growth of private sector foreign borrowings is 0.08 quietly not remarkable and also
statistically insignificant even at the 10% level.
The relationship between the domestic interest rate and the exchange rate is indirect as the
high-interest rate attracts more capital inflow which turns down the exchange rate by
mounting the supply of foreign currency. Data used in the correlation matrix rightly
demonstrates a negative correspondence with exchange rate by 0.27 degree of association but
is statistically insignificant even at the 10% level.
0
900
1800
2700
3600
4500
FY15 FY16 FY17 FY18
Chart 5: Foreign Currency Purchage and Sale
by BB (million USD)
Purchase Sale
Source: Bangladesh Bank.

Page 8 of 18
4. Data and Methodology
To explore the volatility in the Bangladesh foreign exchange market, the daily foreign
exchange rate of BDT per USD and daily transaction volume for the period of 2nd
July 2014
to 27th
June 2018 with 979 observations has been collected for the study from Bangladesh
Bank. A the same time, to examine the influence of different economic variables on the
volume of interbank foreign exchange transaction, yearly data on export, import, remittance,
private sector foreign debt, current account balance, the domestic interest rate has been
collected from BB website. To compare the volatility of Bangladesh foreign exchange market
with neighboring India, data on Indian rupee-USD exchange and daily transaction volume
has been collected from Reserve Bank of India (RBI) on a daily basis. Because of the
nonstationary property of exchange rate series, the study converted the exchange rate series
into the rate of return on the exchange rate by the following logarithmic transformation due to
Alam and Rahman (2012) and Abdullah et al (2017) and uses the transformed series in our
analysis. The adopted the logarithmic transformation to make the daily returns series
stationary by using the following formula:
𝑅𝑡 = 𝑙𝑜𝑔 𝐸𝑅𝑡
𝐸𝑅𝑡−1 ∗ 100
Here, 𝑅𝑡 is the return on the exchange rate at period 𝑡; 𝐸𝑅𝑡 and 𝐸𝑅𝑡−1 are the exchange of the
BDT per USD at period 𝑡 and (𝑡 − 1). This formula for return has already been used by other
authors for example, Kamal et al (2011) and Ece Oral (2012).
4.1 Model Specification:
4.1.1 GARCH models: GARCH models are assumed to be appropriate for understanding the
dynamic behavior of exchange rate variables and derive variance series for volatility.
Volatility is the common feature of the most financial series. To model volatility, Engle
(1982) first introduced the autoregressive conditional heteroskedastic (ARCH) model. To
predict volatility the model requires estimating a large number of parameters. To solve the
problem Bollerslev(1986) proposed the generalized autoregressive conditional
heteroskedastic (GARCH) model which reduces the number of required lags.
Page 9 of 18
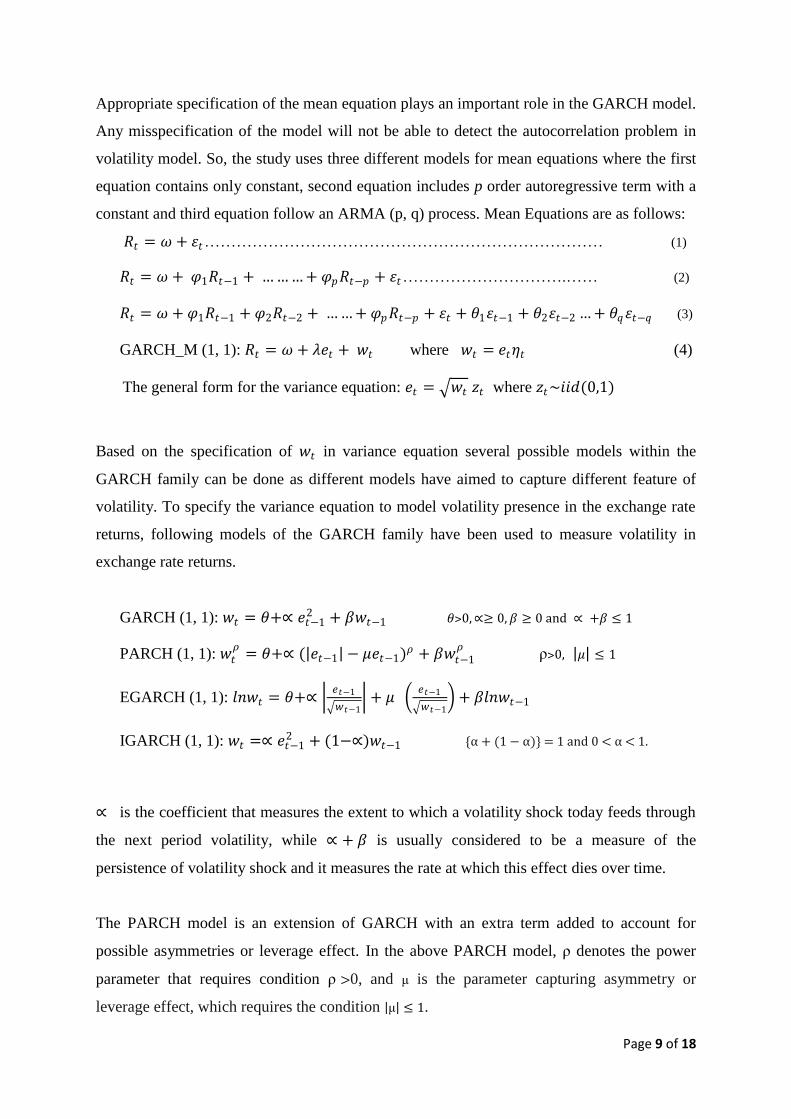
Appropriate specification of the mean equation plays an important role in the GARCH model.
Any misspecification of the model will not be able to detect the autocorrelation problem in
volatility model. So, the study uses three different models for mean equations where the first
equation contains only constant, second equation includes p order autoregressive term with a
constant and third equation follow an ARMA (p, q) process. Mean Equations are as follows:
𝑅𝑡 = 𝜔 + 𝜀𝑡………………………………………………………………… (1)
𝑅𝑡 = 𝜔 + 𝜑1𝑅𝑡−1 + … … … + 𝜑𝑝𝑅𝑡−𝑝 + 𝜀𝑡………………………….…… (2)
𝑅𝑡 = 𝜔 + 𝜑1𝑅𝑡−1 + 𝜑2𝑅𝑡−2 + … … + 𝜑𝑝𝑅𝑡−𝑝 + 𝜀𝑡 + 𝜃1𝜀𝑡−1 + 𝜃2𝜀𝑡−2 … + 𝜃𝑞𝜀𝑡−𝑞 (3)
GARCH_M (1, 1): 𝑅𝑡 = 𝜔 + 𝜆𝑒𝑡 + 𝑤𝑡 where 𝑤𝑡 = 𝑒𝑡𝜂𝑡 (4)
The general form for the variance equation: 𝑒𝑡 = 𝑤𝑡 𝑧𝑡 where 𝑧𝑡~𝑖𝑖𝑑(0,1)
Based on the specification of 𝑤𝑡 in variance equation several possible models within the
GARCH family can be done as different models have aimed to capture different feature of
volatility. To specify the variance equation to model volatility presence in the exchange rate
returns, following models of the GARCH family have been used to measure volatility in
exchange rate returns.
GARCH (1, 1): 𝑤𝑡 = 𝜃+∝ 𝑒𝑡−12 + 𝛽𝑤𝑡−1 𝜃˃0, ∝≥ 0, 𝛽 ≥ 0 and ∝ +𝛽 ≤ 1
PARCH (1, 1): 𝑤𝑡𝜌
= 𝜃+∝ ( 𝑒𝑡−1 − 𝜇𝑒𝑡−1)𝜌 + 𝛽𝑤𝑡−1𝜌
ρ˃0, 𝜇 ≤ 1
EGARCH (1, 1): 𝑙𝑛𝑤𝑡 = 𝜃+∝ 𝑒𝑡−1
𝑤𝑡−1 + 𝜇
𝑒𝑡−1
𝑤𝑡−1 + 𝛽𝑙𝑛𝑤𝑡−1
IGARCH (1, 1): 𝑤𝑡 =∝ 𝑒𝑡−12 + (1−∝)𝑤𝑡−1 {α + (1 − α)} = 1 and 0 < α < 1.
∝ is the coefficient that measures the extent to which a volatility shock today feeds through
the next period volatility, while ∝ + 𝛽 is usually considered to be a measure of the
persistence of volatility shock and it measures the rate at which this effect dies over time.
The PARCH model is an extension of GARCH with an extra term added to account for
possible asymmetries or leverage effect. In the above PARCH model, ρ denotes the power
parameter that requires condition ρ >0, and μ is the parameter capturing asymmetry or
leverage effect, which requires the condition μ ≤ 1.

Page 10 of 18
A typical feature of financial data is that negative shocks generate more volatility compared
to positive shocks. It has been shown that the symmetric GARCH models may not capture
some important features of the data since they assume symmetric response of volatility to
positive and negative shocks. The EGARCH is an asymmetric model that specifies the
logarithm of the conditional volatility and avoids the need for any parameters constraints. In
the EGARCH specification, μ is the asymmetry parameter measuring leverage effect, ∝ is the
size parameter measuring the magnitude of shocks, and 𝛽 is the persistency parameter.
5. Results and Discussion
5.1 Measuring Exchange Rate and Transaction Volatility:
5.1.1 Estimation Output Taka-USD Exchange rate: Prior to measuring the volatility of
exchange rate return the study estimates the summary statistics and test the stationary of
the exchange rate returns. The average rate of return is 0.00335 with a standard deviation
of 0.015 which indicates the exchange rate return is highly volatile (table-2). This
conclusion is also evident from chart-6.
Table-2: Summary Statistics Taka-USD Exchange rate
Average Std. Deviation Kurtosis Skewness JB test P-value
0.003351 0.014966 108.6001 7.637428 464401.4 0.003
Chart-6
-.10
-.05
.00
.05
.10
.15
.20
.25
14 15 16 17 18
Exchange rate returns
Source: Bangladesh Bank.
Chart-7
77
78
79
80
81
82
83
84
14 15 16 17 18
Exchange rate
Source: Bangladesh Bank.
Table-3: Unit root test
Level First difference
ADF test PP test ADF test PP test
Series name Intercept Intercept
&trend
Intercept Intercept
&trend
Intercept Intercept
&trend
Intercept Intercept
&trend
Exchange rate 1.349 -1.110 1.871 -0.901 -
7.994*
-8.268* -27.174* -27.095*
Exchange rate
return
-7.933* -26.858*
* Indicates significant at 1% level
Page 11 of 18
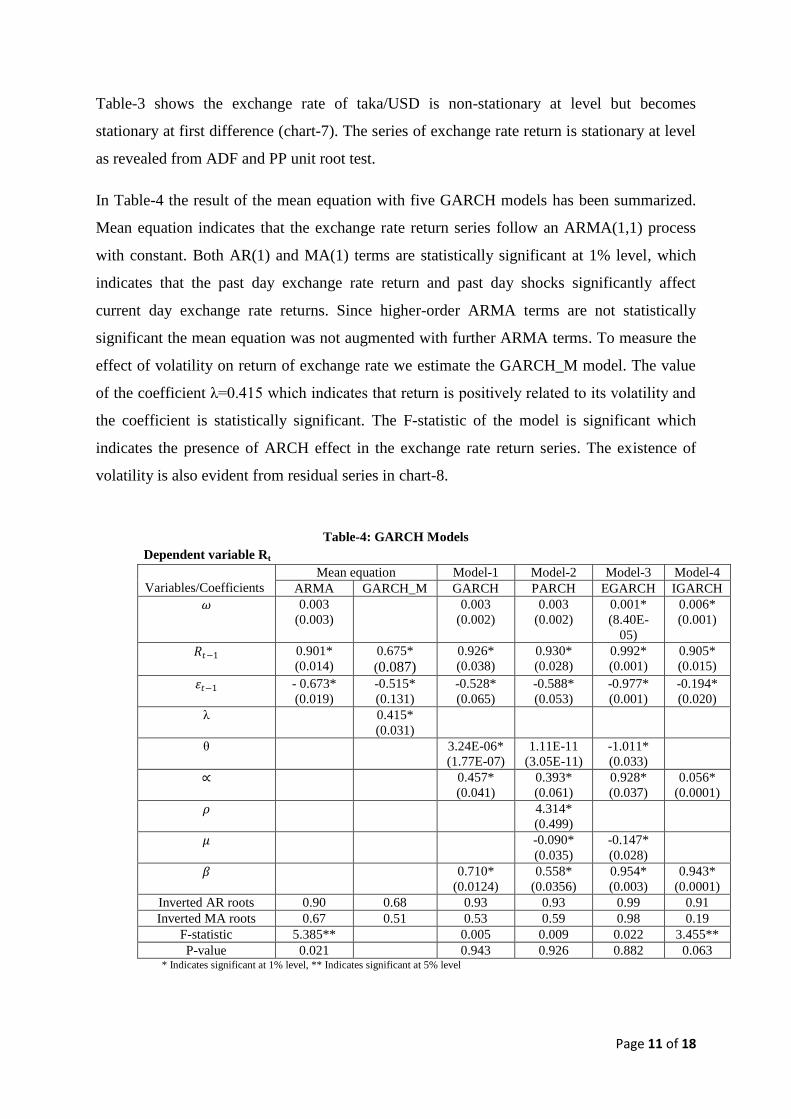
Table-3 shows the exchange rate of taka/USD is non-stationary at level but becomes
stationary at first difference (chart-7). The series of exchange rate return is stationary at level
as revealed from ADF and PP unit root test.
In Table-4 the result of the mean equation with five GARCH models has been summarized.
Mean equation indicates that the exchange rate return series follow an ARMA(1,1) process
with constant. Both AR(1) and MA(1) terms are statistically significant at 1% level, which
indicates that the past day exchange rate return and past day shocks significantly affect
current day exchange rate returns. Since higher-order ARMA terms are not statistically
significant the mean equation was not augmented with further ARMA terms. To measure the
effect of volatility on return of exchange rate we estimate the GARCH_M model. The value
of the coefficient λ=0.415 which indicates that return is positively related to its volatility and
the coefficient is statistically significant. The F-statistic of the model is significant which
indicates the presence of ARCH effect in the exchange rate return series. The existence of
volatility is also evident from residual series in chart-8.
Table-4: GARCH Models
Dependent variable Rt
Variables/Coefficients
Mean equation Model-1 Model-2 Model-3 Model-4
ARMA GARCH_M GARCH PARCH EGARCH IGARCH
𝜔
0.003
(0.003)
0.003
(0.002)
0.003
(0.002)
0.001*
(8.40E-
05)
0.006*
(0.001)
𝑅𝑡−1 0.901*
(0.014)
0.675*
(0.087) 0.926*
(0.038)
0.930*
(0.028)
0.992*
(0.001)
0.905*
(0.015)
𝜀𝑡−1 - 0.673*
(0.019)
-0.515*
(0.131)
-0.528*
(0.065)
-0.588*
(0.053)
-0.977*
(0.001)
-0.194*
(0.020)
λ 0.415*
(0.031)
θ 3.24E-06*
(1.77E-07)
1.11E-11
(3.05E-11)
-1.011*
(0.033)
∝ 0.457*
(0.041)
0.393*
(0.061)
0.928*
(0.037)
0.056*
(0.0001)
𝜌 4.314*
(0.499)
𝜇 -0.090*
(0.035)
-0.147*
(0.028)
𝛽 0.710*
(0.0124)
0.558*
(0.0356)
0.954*
(0.003)
0.943*
(0.0001)
Inverted AR roots 0.90 0.68 0.93 0.93 0.99 0.91
Inverted MA roots 0.67 0.51 0.53 0.59 0.98 0.19
F-statistic 5.385** 0.005 0.009 0.022 3.455**
P-value 0.021 0.943 0.926 0.882 0.063 * Indicates significant at 1% level, ** Indicates significant at 5% level
Page 12 of 18
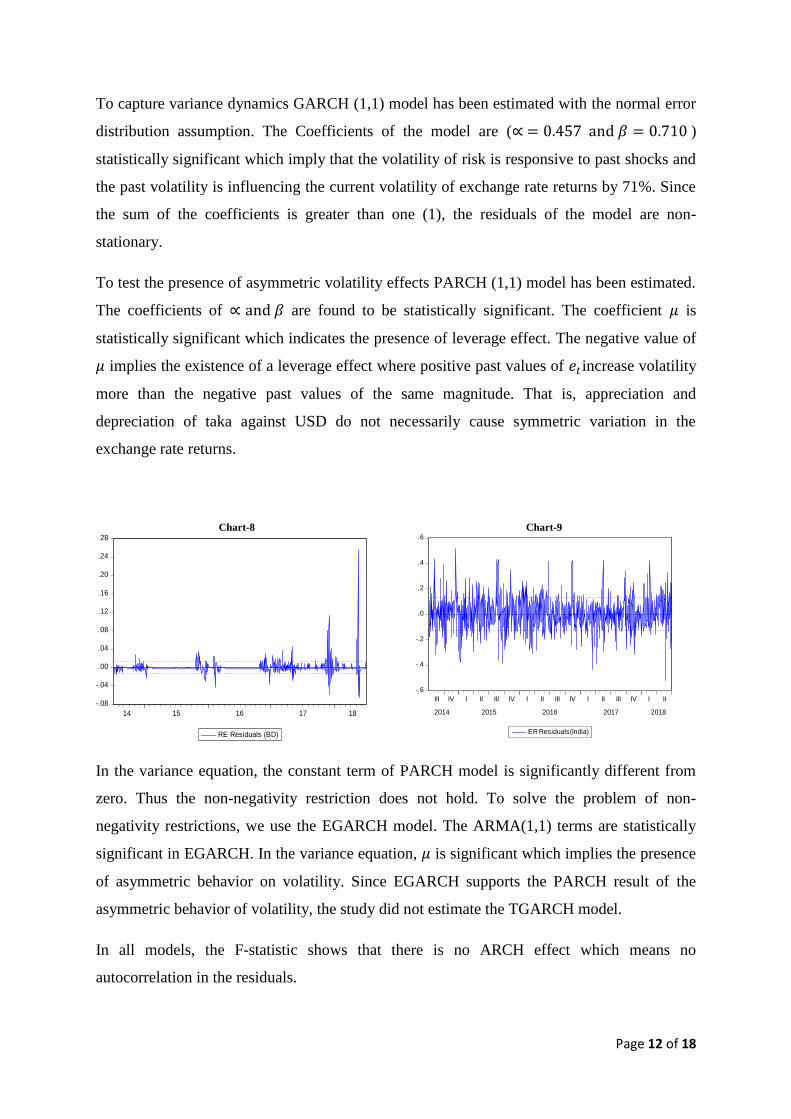
To capture variance dynamics GARCH (1,1) model has been estimated with the normal error
distribution assumption. The Coefficients of the model are (∝ = 0.457 and 𝛽 = 0.710 )
statistically significant which imply that the volatility of risk is responsive to past shocks and
the past volatility is influencing the current volatility of exchange rate returns by 71%. Since
the sum of the coefficients is greater than one (1), the residuals of the model are non-
stationary.
To test the presence of asymmetric volatility effects PARCH (1,1) model has been estimated.
The coefficients of ∝ and 𝛽 are found to be statistically significant. The coefficient 𝜇 is
statistically significant which indicates the presence of leverage effect. The negative value of
𝜇 implies the existence of a leverage effect where positive past values of 𝑒𝑡 increase volatility
more than the negative past values of the same magnitude. That is, appreciation and
depreciation of taka against USD do not necessarily cause symmetric variation in the
exchange rate returns.
Chart-8
-.08
-.04
.00
.04
.08
.12
.16
.20
.24
.28
14 15 16 17 18
RE Residuals (BD)
Chart-9
-.6
-.4
-.2
.0
.2
.4
.6
III IV I II III IV I II III IV I II III IV I II
2014 2015 2016 2017 2018
ER Residuals(India)
In the variance equation, the constant term of PARCH model is significantly different from
zero. Thus the non-negativity restriction does not hold. To solve the problem of non-
negativity restrictions, we use the EGARCH model. The ARMA(1,1) terms are statistically
significant in EGARCH. In the variance equation, 𝜇 is significant which implies the presence
of asymmetric behavior on volatility. Since EGARCH supports the PARCH result of the
asymmetric behavior of volatility, the study did not estimate the TGARCH model.
In all models, the F-statistic shows that there is no ARCH effect which means no
autocorrelation in the residuals.
Page 13 of 18
The sum of GARCH parameters is greater than one in model-2 implies that the variance may
not be well behaved. To model volatility by imposing restrictions that the sum of GARCH
parameters is one leads to IGARCH specification. The result of the model shows that the
restriction is valid and the model overcomes all of the diagnostic tests.
The inverted roots of the AR and MA terms are less than one in all models which imply the
stability of the models.
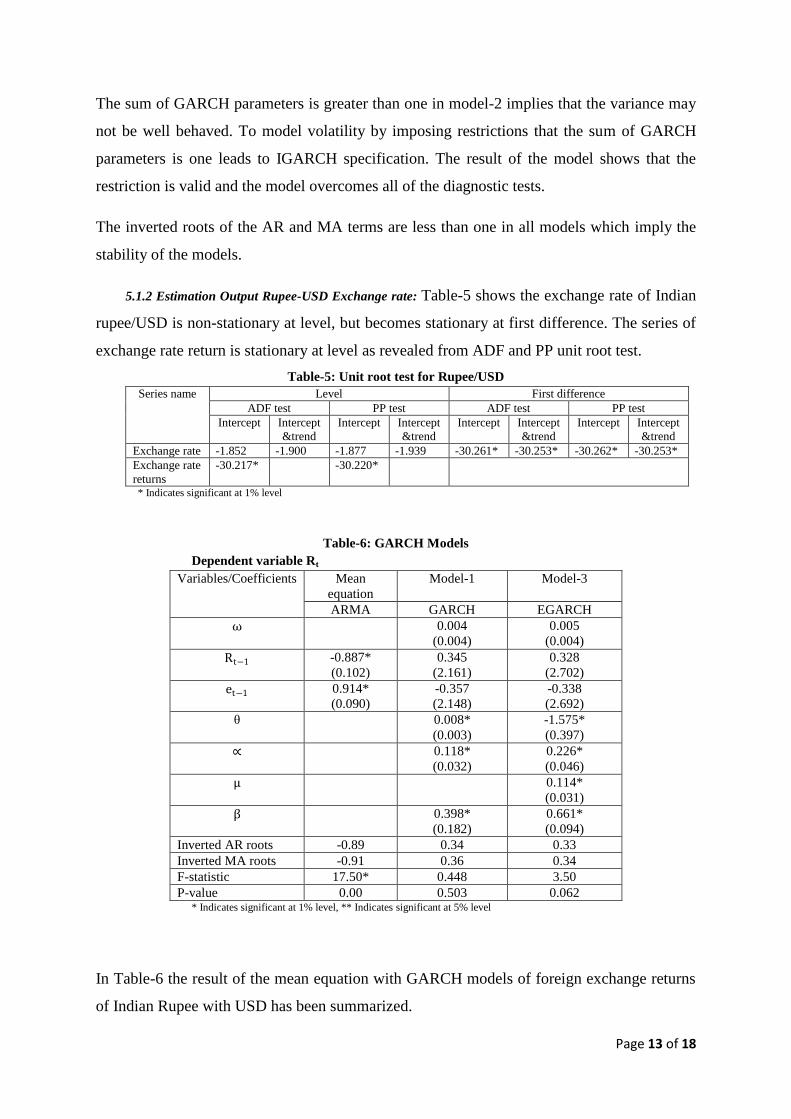
5.1.2 Estimation Output Rupee-USD Exchange rate: Table-5 shows the exchange rate of Indian
rupee/USD is non-stationary at level, but becomes stationary at first difference. The series of
exchange rate return is stationary at level as revealed from ADF and PP unit root test.
Table-5: Unit root test for Rupee/USD
Series name Level First difference
ADF test PP test ADF test PP test
Intercept Intercept
&trend
Intercept Intercept
&trend
Intercept Intercept
&trend
Intercept Intercept
&trend
Exchange rate -1.852 -1.900 -1.877 -1.939 -30.261* -30.253* -30.262* -30.253*
Exchange rate
returns
-30.217* -30.220*
* Indicates significant at 1% level
Table-6: GARCH Models Dependent variable Rt
Variables/Coefficients Mean
equation
Model-1 Model-3
ARMA GARCH EGARCH
ω
0.004
(0.004)
0.005
(0.004)
Rt−1 -0.887*
(0.102)
0.345
(2.161)
0.328
(2.702)
et−1 0.914*
(0.090)
-0.357
(2.148)
-0.338
(2.692)
θ 0.008*
(0.003)
-1.575*
(0.397)
∝ 0.118*
(0.032)
0.226*
(0.046)
μ 0.114*
(0.031)
β 0.398*
(0.182)
0.661*
(0.094)
Inverted AR roots -0.89 0.34 0.33
Inverted MA roots -0.91 0.36 0.34
F-statistic 17.50* 0.448 3.50
P-value 0.00 0.503 0.062 * Indicates significant at 1% level, ** Indicates significant at 5% level
In Table-6 the result of the mean equation with GARCH models of foreign exchange returns
of Indian Rupee with USD has been summarized.
Page 14 of 18
Mean Equation indicates that the exchange rate return series follow an ARMA(1,1) process
with no constant. Both AR(1) and MA(1) terms are statistically significant at 1% level, which
indicates that the past day exchange rate return and past day shocks significantly affect
current day exchange rate returns. Since higher-order ARMA terms are not statistically
significant the mean equation was not augmented with further ARMA terms. The F-statistic
of the model is significant which indicates the presence of ARCH effect in the exchange rate
return series. The existence of volatility is also evident from residual series in chart-9.
To capture variance dynamics GARCH (1,1) model has been estimated. The Coefficients of
the model for India are (∝ = 0.118 and 𝛽 = 0.398 ) statistically significant which imply that
the volatility of risk is responsive to past shocks and the past volatility is influencing the
current volatility of exchange rate returns by almost 40%. Since the sum of the coefficients is
less than one (1), the residuals of the model are stationary.
To overcome the problem of non-negativity restrictions, we use the EGARCH model. In the
variance equation, 𝜇 is significant which implies the presence of asymmetric behavior on
volatility. That is, appreciation and depreciation of the Indian Rupee against USD do not
necessarily cause symmetric variation in the exchange rate return.
In both models, the F-statistic shows that there is no ARCH effect which means no
autocorrelation in the residuals. Since the sum of GARCH parameters is less than one, the
study does not estimate the IGARCH model. The inverted roots of the AR and MA terms are
less than one in all models which imply the stability of the models.
5.2 Transaction Volatility for Bangladesh and India
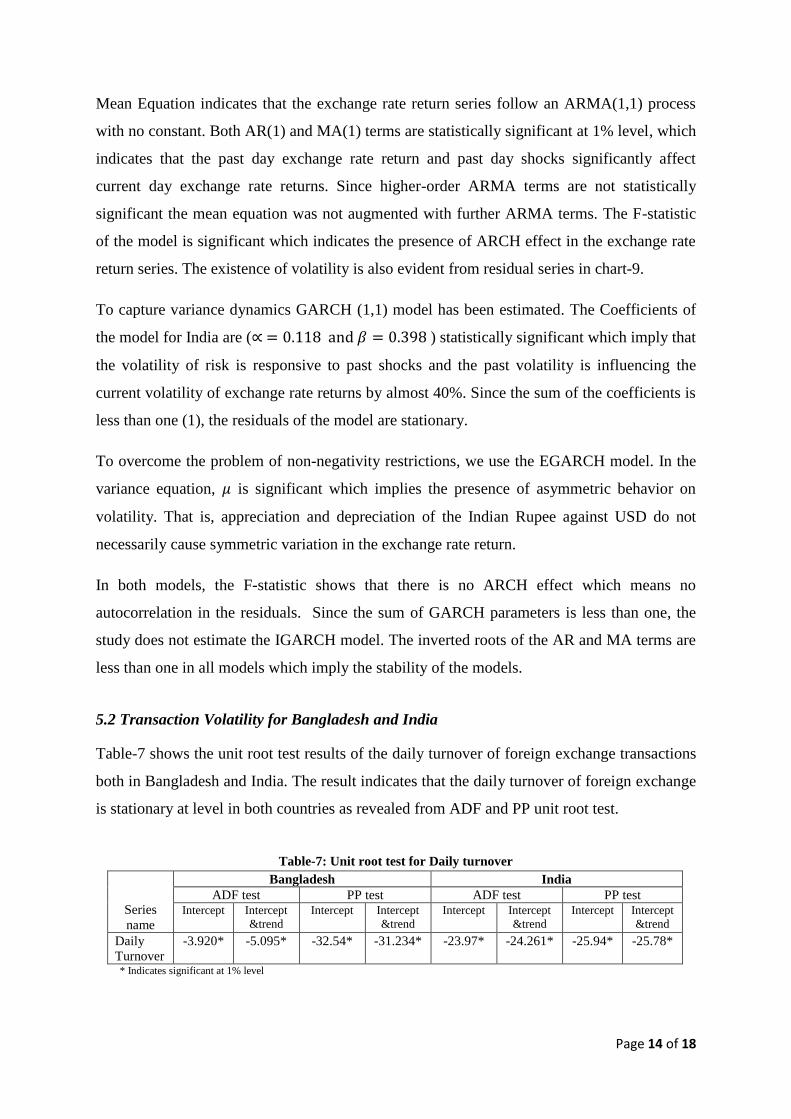
Table-7 shows the unit root test results of the daily turnover of foreign exchange transactions
both in Bangladesh and India. The result indicates that the daily turnover of foreign exchange
is stationary at level in both countries as revealed from ADF and PP unit root test.
Table-7: Unit root test for Daily turnover
Series
name
Bangladesh India
ADF test PP test ADF test PP test Intercept Intercept
&trend
Intercept Intercept
&trend
Intercept Intercept
&trend
Intercept Intercept
&trend
Daily
Turnover
-3.920* -5.095* -32.54* -31.234* -23.97* -24.261* -25.94* -25.78*
* Indicates significant at 1% level
Page 15 of 18
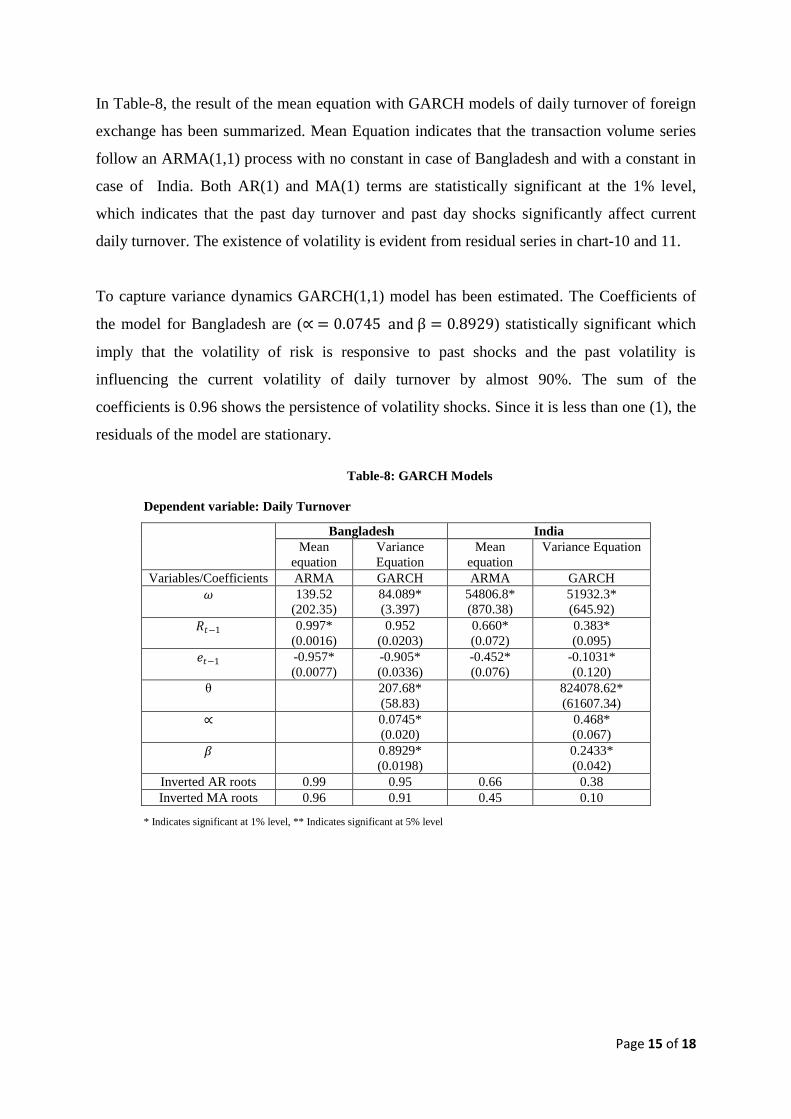
In Table-8, the result of the mean equation with GARCH models of daily turnover of foreign
exchange has been summarized. Mean Equation indicates that the transaction volume series
follow an ARMA(1,1) process with no constant in case of Bangladesh and with a constant in
case of India. Both AR(1) and MA(1) terms are statistically significant at the 1% level,
which indicates that the past day turnover and past day shocks significantly affect current
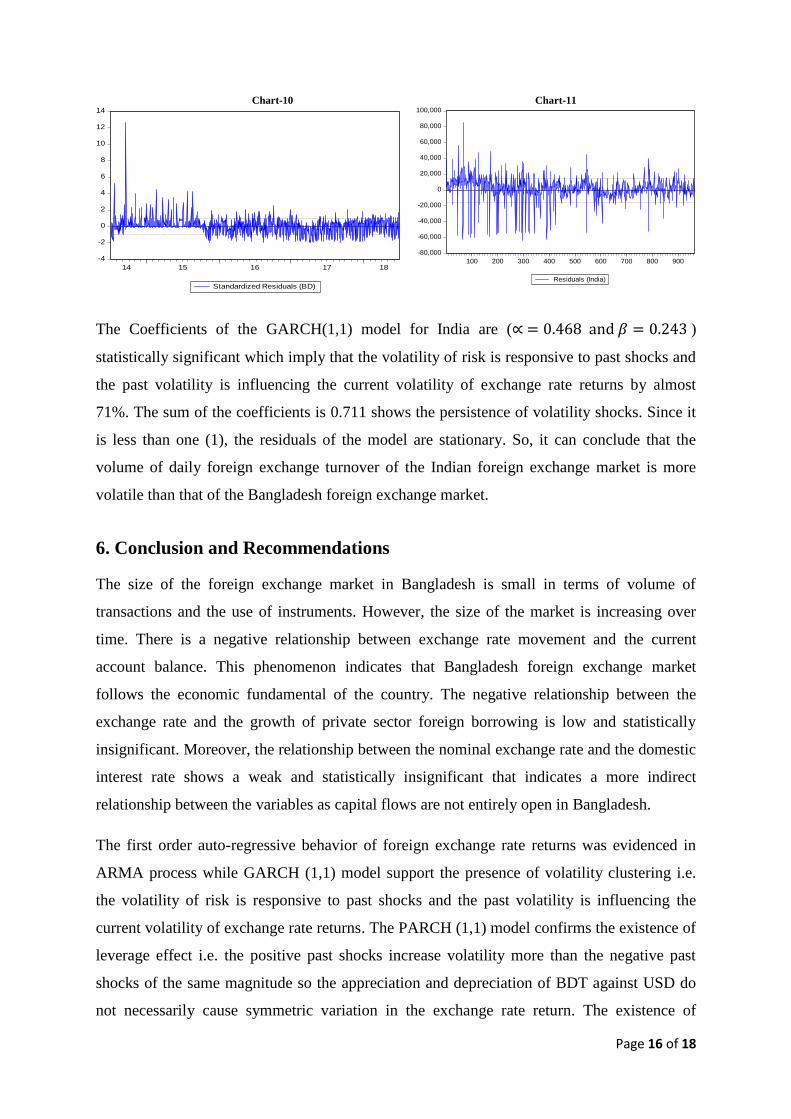
daily turnover. The existence of volatility is evident from residual series in chart-10 and 11.
To capture variance dynamics GARCH(1,1) model has been estimated. The Coefficients of
the model for Bangladesh are (∝ = 0.0745 and β = 0.8929) statistically significant which
imply that the volatility of risk is responsive to past shocks and the past volatility is
influencing the current volatility of daily turnover by almost 90%. The sum of the
coefficients is 0.96 shows the persistence of volatility shocks. Since it is less than one (1), the
residuals of the model are stationary.
Table-8: GARCH Models
Dependent variable: Daily Turnover
* Indicates significant at 1% level, ** Indicates significant at 5% level
Bangladesh India
Mean
equation
Variance
Equation
Mean
equation
Variance Equation
Variables/Coefficients ARMA GARCH ARMA GARCH
𝜔
139.52
(202.35)
84.089*
(3.397)
54806.8*
(870.38)
51932.3*
(645.92)
𝑅𝑡−1 0.997*
(0.0016)
0.952
(0.0203)
0.660*
(0.072)
0.383*
(0.095)
𝑒𝑡−1 -0.957*
(0.0077)
-0.905*
(0.0336)
-0.452*
(0.076)
-0.1031*
(0.120)
θ 207.68*
(58.83)
824078.62*
(61607.34)
∝ 0.0745*
(0.020)
0.468*
(0.067)
𝛽 0.8929*
(0.0198)
0.2433*
(0.042)
Inverted AR roots 0.99 0.95 0.66 0.38
Inverted MA roots 0.96 0.91 0.45 0.10
Page 16 of 18
Chart-10
-4
-2
0
2
4
6
8
10
12
14
14 15 16 17 18
Standardized Residuals (BD)
Chart-11
-80,000
-60,000
-40,000
-20,000
0
20,000
40,000
60,000
80,000
100,000
100 200 300 400 500 600 700 800 900
Residuals (India)
The Coefficients of the GARCH(1,1) model for India are (∝ = 0.468 and 𝛽 = 0.243 )
statistically significant which imply that the volatility of risk is responsive to past shocks and
the past volatility is influencing the current volatility of exchange rate returns by almost
71%. The sum of the coefficients is 0.711 shows the persistence of volatility shocks. Since it
is less than one (1), the residuals of the model are stationary. So, it can conclude that the
volume of daily foreign exchange turnover of the Indian foreign exchange market is more
volatile than that of the Bangladesh foreign exchange market.
6. Conclusion and Recommendations
The size of the foreign exchange market in Bangladesh is small in terms of volume of
transactions and the use of instruments. However, the size of the market is increasing over
time. There is a negative relationship between exchange rate movement and the current
account balance. This phenomenon indicates that Bangladesh foreign exchange market
follows the economic fundamental of the country. The negative relationship between the
exchange rate and the growth of private sector foreign borrowing is low and statistically
insignificant. Moreover, the relationship between the nominal exchange rate and the domestic
interest rate shows a weak and statistically insignificant that indicates a more indirect
relationship between the variables as capital flows are not entirely open in Bangladesh.
The first order auto-regressive behavior of foreign exchange rate returns was evidenced in
ARMA process while GARCH (1,1) model support the presence of volatility clustering i.e.
the volatility of risk is responsive to past shocks and the past volatility is influencing the
current volatility of exchange rate returns. The PARCH (1,1) model confirms the existence of
leverage effect i.e. the positive past shocks increase volatility more than the negative past
shocks of the same magnitude so the appreciation and depreciation of BDT against USD do
not necessarily cause symmetric variation in the exchange rate return. The existence of
Page 17 of 18
volatility clustering and the leverage effect in the foreign exchange market of Bangladesh
indicates the weak form of efficiency of the market. To make the foreign exchange market
more dynamic, vibrant and competitive market size should be expanded with proper
management in place.
This study reveals that high importance should be given to both monetary and non-monetary
factors in the open-economy framework to detect the possible impacts on trade and capital
flows. The empirical findings of this study would guide the monetary authority in formulating
and conducting monetary policy and help achieve the ultimate goal of monetary policy.
References:
Abdullah, S.M., Siddiqua, S., Siddiquee, M.S.H., and Hossain, N. (2017), ‘Modeling and
Forecasting Exchange Rate Volatility in Bangladesh Using GARCH Models: a
Comparison Based on Normal and Student’s t-error Distribution,’ Financial
Innovation, vol. 3, Iss.18, pp.1-19.
Ahmed, S. (2009), ‘Exchange Rate Volatility and International Trade Growth: Evidence from
Bangladesh’, MPRA Paper no19466, ASA University Bangladesh.
Alam, M.Z., and Rahman, M.A. (2012), ‘Modeling Volatility of the BDT/USD Exchange
Rate with GARCH Model’, International Journal of Economics and Finance,Vol.4,
No.11, pp.193-204.
Bhanumurthy, N. R. (2006), ‘Macroeconomic Fundamentals and Exchange Rate Dynamics in
India: Some Survey Results’, Economic and Political Weekly, Vol. 41, No. 11, pp.
1101-1107.
Cheong C., Mehari T., and Williams L. (2006) ‘Dynamic Links Between Unexpected
Exchange Rate Variation, Prices, And International Trade’. Open Economies Review,
Vol.17 pp.221-233.
Firoj, M., and Khanom, S. (2018), ‘Efficient Market Hypothesis: Foreign Exchange Market
of Bangladesh’, International Journal of Economics and Financial Issues, Vol.8,
No.6, pp.99-103.
Hossain,M., and Ahmed,M. (2009) ‘An Assessment of Exchange Rate Policy under Floating
Regime in Bangladesh’. The Bangladesh Development Studies, Vol. XXXII, No. 4.
Page 18 of 18
Kamal, Y., Haq, H.U., Ghani, U., and Khan, M.M. (2012) ‘Modeling the Exchange Rate
Volatility, Using Generalized Autoregressive Conditionally Heteroscedastic
(GARCH) Type Models: Evidence from Pakistan’, African Journal of Business
Management, Vol.6 (8), pp.2830-2838.
Kazi, M.K.U., Quaosar,G.M.A.A., & Nandi, D.C.(2013), ‘Factors Affecting the Fluctuation
in Exchange Rate of Bangladesh: A Co-Integration Approach’, The International
Journal of Social Sciences. Vol.18, No.1.
Kemal, M.A. (2006), ‘Exchange Rate Instability and Trade: The Case of Pakistan’, Pakistan
Institute of Development Economics Working Papers, 2006:7.
Khosa, J., Botha, I. ,& Pretorius, M. (2015), ‘The Impact of Exchange Rate Volatility on
Emerging Market Exports’, Acta Commercii Vol.15, No-01,pp1-11.
Khullar,N.,& Sethi,U.J.(2011), ‘Measuring the Volatility of Foreign Exchange Market in
India’, Research Journal of Finance and Accounting, Vol.2, No.(9/10), pp.14-26.
Rahman,M.,Ghosh,S.K.(2013),‘Influence of Demand–Supply Forces on Exchange Rate
Movement’, Bank Parikrama, Vol. XXXVIII, Nos. 3 & 4, pp. 107 – 128.
Younus, S.(2014), ‘Causes of Indian Rupee Depreciation and its Impact on Bangladesh
Economy’, Working Papers-1406.