Embed Size (px)
Citation preview
RESEARCH Open Access
Bayesian network model to distinguishbetween intentional attacks and accidentaltechnical failures: a case study offloodgatesSabarathinam Chockalingam1,2* , Wolter Pieters1,3, André Teixeira4 and Pieter van Gelder1
Abstract
Water management infrastructures such as floodgates are critical and increasingly operated by Industrial ControlSystems (ICS). These systems are becoming more connected to the internet, either directly or through thecorporate networks. This makes them vulnerable to cyber-attacks. Abnormal behaviour in floodgates operated byICS could be caused by both (intentional) attacks and (accidental) technical failures. When operators noticeabnormal behaviour, they should be able to distinguish between those two causes to take appropriate measures,because for example replacing a sensor in case of intentional incorrect sensor measurements would be ineffectiveand would not block corresponding the attack vector. In the previous work, we developed the attack-failuredistinguisher framework for constructing Bayesian Network (BN) models to enable operators to distinguish betweenthose two causes, including the knowledge elicitation method to construct the directed acyclic graph andconditional probability tables of BN models. As a full case study of the attack-failure distinguisher framework, thispaper presents a BN model constructed to distinguish between attacks and technical failures for the problem ofincorrect sensor measurements in floodgates, addressing the problem of floodgate operators. We utilised expertswho associate themselves with the safety and/or security community to construct the BN model and validate thequalitative part of constructed BN model. The constructed BN model is usable in water management infrastructuresto distinguish between intentional attacks and accidental technical failures in case of incorrect sensormeasurements. This could help to decide on appropriate response strategies and avoid further complications incase of incorrect sensor measurements.
Keywords: Bayesian network, DeMorgan model, Intentional attack, Probability elicitation, Safety, Security, Technicalfailure, Water management
IntroductionWater management is one of the critical infrastructuresin countries like the Netherlands (Castellon and Frinking2015). The proper functioning of water management in-frastructures is vital for economic growth and societal
wellbeing. The unexpected closure of floodgates couldlead to severe economic damage, for instance, by delay-ing cargo ships. Over the years, water management in-frastructures have become dependent on IndustrialControl Systems (ICSs) to ensure efficient operations ofsuch infrastructures (Nogueira and Walraven 2018).ICSs were originally designed for isolated environ-
ments (Effendi and Davis 2015). Such systems weremainly susceptible to technical failures. The blackout inthe Canadian province of Ontario and the North-eastern
© The Author(s). 2021 Open Access This article is licensed under a Creative Commons Attribution 4.0 International License,which permits use, sharing, adaptation, distribution and reproduction in any medium or format, as long as you giveappropriate credit to the original author(s) and the source, provide a link to the Creative Commons licence, and indicate ifchanges were made. The images or other third party material in this article are included in the article's Creative Commonslicence, unless indicated otherwise in a credit line to the material. If material is not included in the article's Creative Commonslicence and your intended use is not permitted by statutory regulation or exceeds the permitted use, you will need to obtainpermission directly from the copyright holder. To view a copy of this licence, visit http://creativecommons.org/licenses/by/4.0/.
* Correspondence: [email protected] of Technology, Policy and Management, Delft University ofTechnology, Delft, The Netherlands2Department of Risk, Safety and Security, Institute for Energy Technology,Halden, NorwayFull list of author information is available at the end of the article
CybersecurityChockalingam et al. Cybersecurity (2021) 4:29 https://doi.org/10.1186/s42400-021-00086-6
and Mid-western United States is a typical example of atechnical failure in which the absence of alarm due to asoftware bug in the alarm system left operators unawareof the need to redistribute power (Zhivich and Cunning-ham 2009). However, modern ICSs no longer operate inisolation, but use other networks to facilitate and im-prove business processes (Knowles et al. 2015). This in-creased connectivity makes ICSs more vulnerable tocyber-attacks apart from technical failures. A cyber-attack on a German steel mill is a typical example inwhich adversaries made use of corporate network toenter the ICS network (RISI 2014). As an initial step, theadversaries used both the targeted email and social en-gineering techniques to acquire credentials for the cor-porate network. Once they acquired credentials for thecorporate network, they worked their way into theplant’s control system network and caused damage tothe blast furnace.It is essential to distinguish between attacks and tech-
nical failures that would lead to abnormal behaviour inthe components of ICSs and take suitable measures. Inmost cases, the initiation of response strategy presum-ably aimed at technical failures would be ineffective inthe event of a targeted attack and may lead to furthercomplications. For instance, replacing a water level sen-sor that is sending incorrect measurement data with anew water level sensor would be a suitable responsestrategy to technical failure of a water level sensor. How-ever, this may not be an appropriate response strategy toan attack on the water level sensor as it would not blockthe corresponding attack vector. Furthermore, the initi-ation of inappropriate response strategies would delaythe recovery of the system from adversaries and mightlead to harmful consequences. Noticeably, there is a lackof decision support to distinguish between attacks andtechnical failures.Bayesian Networks (BNs) have the capacity to tackle
this challenge especially based on their real-world appli-cations in medical diagnosis and fault diagnosis (Nakatsu2009). BNs belong to the family of probabilistic graphicalmodels, consisting of a qualitative and a quantitative part(Darwiche 2008). The qualitative part is a DirectedAcyclic Graph (DAG) of nodes and edges. Each noderepresents a random variable, while the edges betweenthe nodes represent the conditional dependencies amongthe random variables. The quantitative part takes theform of a priori marginal and conditional probabilitiesso as to quantify the dependencies between connectednodes.In order to address the above-mentioned research gap,
we developed the attack-failure distinguisher frameworkin our previous work to help construct BN models fordistinguishing attacks and technical failures (Chockalin-gam et al. 2019; Chockalingam et al. 2020). Furthermore,
we extended and combined fishbone diagrams withinour framework for knowledge elicitation to constructthe qualitative part of such BN models. Finally, we inte-grated DeMorgan models and probability scales with nu-merical and verbal anchors within our framework forknowledge elicitation to construct the quantitative partof such BN models. The present study aims to constructa BN model based on the developed framework to dis-tinguish between attacks and technical failures for anobservable problem in floodgates, providing a full casestudy of the framework as well as addressing the prob-lem of floodgate operators. This paper addresses the re-search question: “How could we develop BayesianNetwork (BN) models for distinguishing attacks and tech-nical failures in floodgates?”. The research objectives are:
RO1. To develop a BN model for distinguishing attacksand technical failures in floodgates involving domainexperts using the attack-failure distinguisherframework.RO2. To demonstrate the suitability of a BN modeldeveloped with the attack-failure distinguisher frame-work in floodgates.
RO1 focuses primarily on the use of the expert elicit-ation process proposed in the attack-failure distinguisherframework to develop a BN model for distinguishing at-tacks and technical failures in floodgates. Even thoughthe available system information during the elicitationprocess is limited, this would not have an impact onproviding a full case study of the framework. RO2 fo-cuses mainly on demonstrating when and how a BNmodel developed with the framework would be useful inpractice, and not on assessing the validity of the specificBN model, due to the lack of real water management in-frastructure and testbed for evaluation.At the start of this research, we investigated the avail-
ability of data corresponding to cyber-attacks and tech-nical failures from real-world systems in the watermanagement sector. This data would help to constructDAGs and populate Conditional Probability Tables(CPTs). However, there is a lack of data regarding cyber-attacks from real-world systems as experts in safety and/or security of ICS in the water management sector inthe Netherlands claim that there are no/limited cyber-attacks on their infrastructures. These experts are associ-ated with the organisation responsible for the construc-tion and maintenance of flood protection andprevention in the Netherlands and their suppliers. More-over, data corresponding to limited cyber-attacks thathappened is not shareable due to the sensitivity of data.On the other hand, technical failures occur in their in-
frastructures which are documented as technical failurereports. However, they are also not shareable due to the
Chockalingam et al. Cybersecurity (2021) 4:29 Page 2 of 19
sensitivity of data. Therefore, we relied on expertknowledge which is one of the predominant datasources utilised to construct DAGs and populateCPTs especially in domains where there is a limitedavailability of data like cyber security (Chockalingamet al. 2017). Furthermore, expert knowledge is sub-stantive information on a specific domain based onthe system knowledge that is not commonly knownby others (Martin et al. 2012). Finally, it is also preva-lent to use expert knowledge as the data sourcewhich is one of the well-established and successful al-ternate data source to data from real-world systemsin modelling cyber security (Holm et al. 2013; Husáket al. 2018). Specifically, we utilised experts who asso-ciate themselves with safety and/or security commu-nity as it is appropriate for our application whichdeals with distinguishing attacks and technical fail-ures. In our context, we associate the security com-munity as dealing with attacks. On the other hand,we associate the safety community as dealing withtechnical failures.The main contributions of this paper are as follows:
(i) we provide a full case study of the attack-failure dis-tinguisher framework on how to construct a BNmodel for an observable problem in floodgates usingexpert knowledge.
(ii) we develop decision support that help operators todistinguish between attacks and technical failuresfor the problem of incorrect sensor measurementsin floodgates in the Netherlands.
(iii)we demonstrate the suitability of the constructedBN model in the water management sector byshowing when and how this could be used inpractice.
The remainder of this paper is structured as follows.In Section 2, we illustrate the different layers and thecomponents of an ICS. In Section 3, we describe ourexisting framework that would help to construct BNmodels for distinguishing attacks and technical failuresin addition to the systematic methods for knowledgeelicitation to construct the BN models. Section 4 dem-onstrates the constructed BN model followed by discus-sions in Section 5. Section 6 highlights the related work.
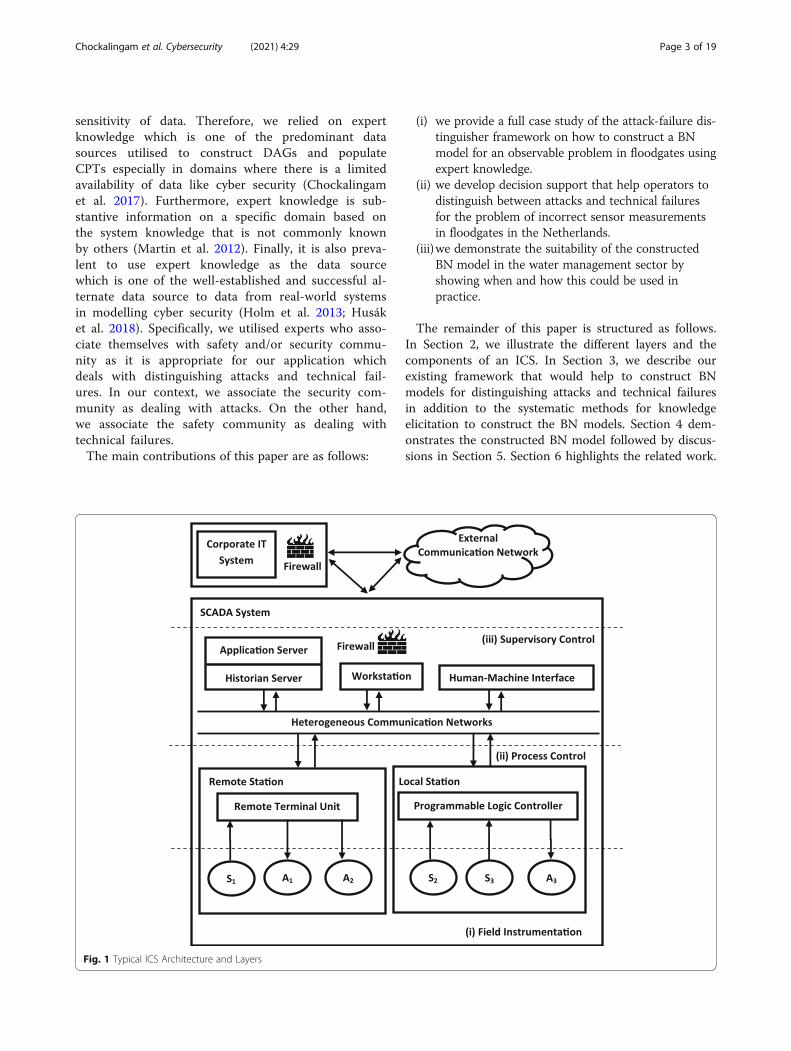
Fig. 1 Typical ICS Architecture and Layers
Chockalingam et al. Cybersecurity (2021) 4:29 Page 3 of 19
Section 7 presents the conclusions and future workdirections.
ICS architectureIn this section, we illustrate the three different layersand major components in each layer of an ICS.Domain knowledge on ICSs is the starting point for
the application of our proposed approach. A typicalICS consists of three layers: (i) Field instrumentation,(ii) Process control, and (iii) Supervisory control,bound together by network infrastructure, as shownin Fig. 1.The field instrumentation layer consists of sensors (Si)
and actuators (Ai), while the process control layer con-sists of Programmable Logic Controllers (PLCs)/RemoteTerminal Units (RTUs). Typically, PLCs have wiredcommunication capabilities whereas RTUs have wired orwireless communication capabilities. The PLC/RTU re-ceives measurement data from sensors, and controls thephysical systems through actuators (Skopik and Smith2015). The supervisory control layer consists of historiandatabases, software application servers, the Human-Machine Interface (HMI), and the workstation. The his-torian databases and software application servers enablethe efficient operation of the ICS. The low-level compo-nents are configured and monitored with the help of theworkstation and the HMI, respectively (Skopik andSmith 2015).
Framework for distinguishing attacks andtechnical failuresThis section describes the attack-failure distinguisherframework proposed in our previous work to constructBN models for distinguishing attacks and technical fail-ures (Chockalingam et al. 2019).The framework consists of three layers as shown in
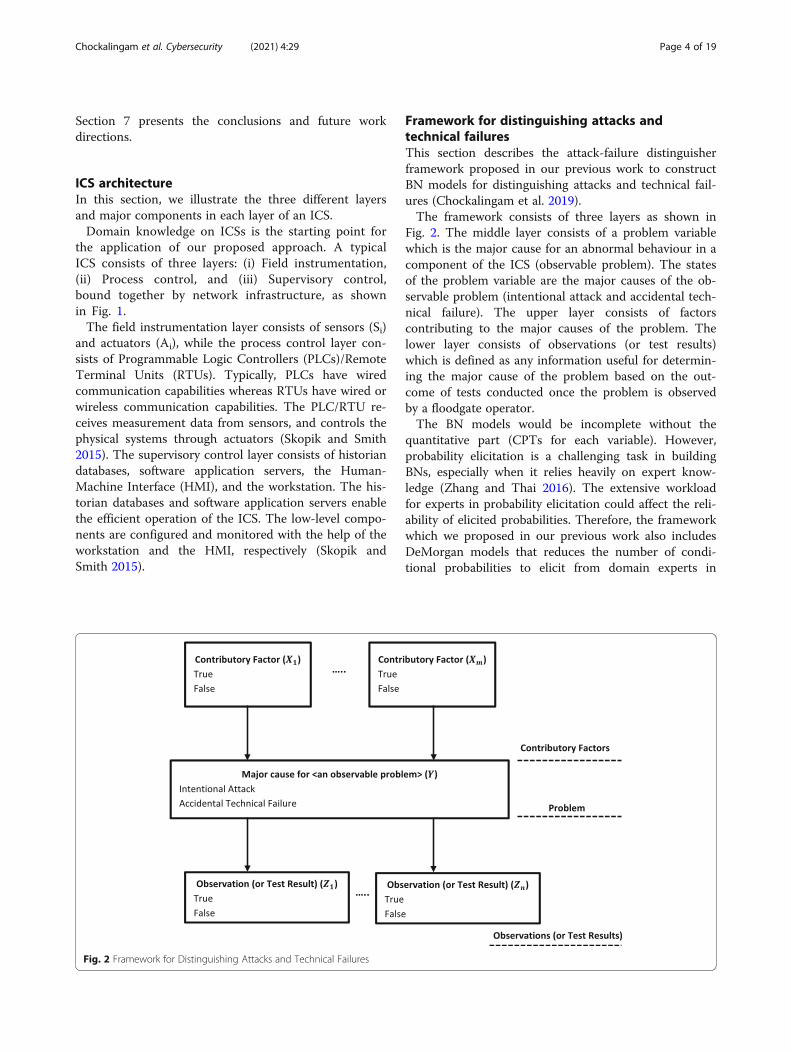
Fig. 2. The middle layer consists of a problem variablewhich is the major cause for an abnormal behaviour in acomponent of the ICS (observable problem). The statesof the problem variable are the major causes of the ob-servable problem (intentional attack and accidental tech-nical failure). The upper layer consists of factorscontributing to the major causes of the problem. Thelower layer consists of observations (or test results)which is defined as any information useful for determin-ing the major cause of the problem based on the out-come of tests conducted once the problem is observedby a floodgate operator.The BN models would be incomplete without the
quantitative part (CPTs for each variable). However,probability elicitation is a challenging task in buildingBNs, especially when it relies heavily on expert know-ledge (Zhang and Thai 2016). The extensive workloadfor experts in probability elicitation could affect the reli-ability of elicited probabilities. Therefore, the frameworkwhich we proposed in our previous work also includesDeMorgan models that reduces the number of condi-tional probabilities to elicit from domain experts in
Fig. 2 Framework for Distinguishing Attacks and Technical Failures
Chockalingam et al. Cybersecurity (2021) 4:29 Page 4 of 19
constructing the quantitative part of BN models, espe-cially this technique reduces the number of parametersthat need to be elicited from exponential to linear in thenumber of parents to define a full CPT for the childvariable (Chockalingam et al. 2019; Chockalingam et al.2020). We adopted DeMorgan models because it is themost suitable technique for our purpose (Chockalingamet al. 2020). Furthermore, we integrated probabilityscales with numerical and verbal anchors with DeMor-gan models to facilitate individual probability entry byproviding visual aids to help experts answer in terms ofprobabilities (Chockalingam et al. 2020).The DeMorgan model is applicable when there are
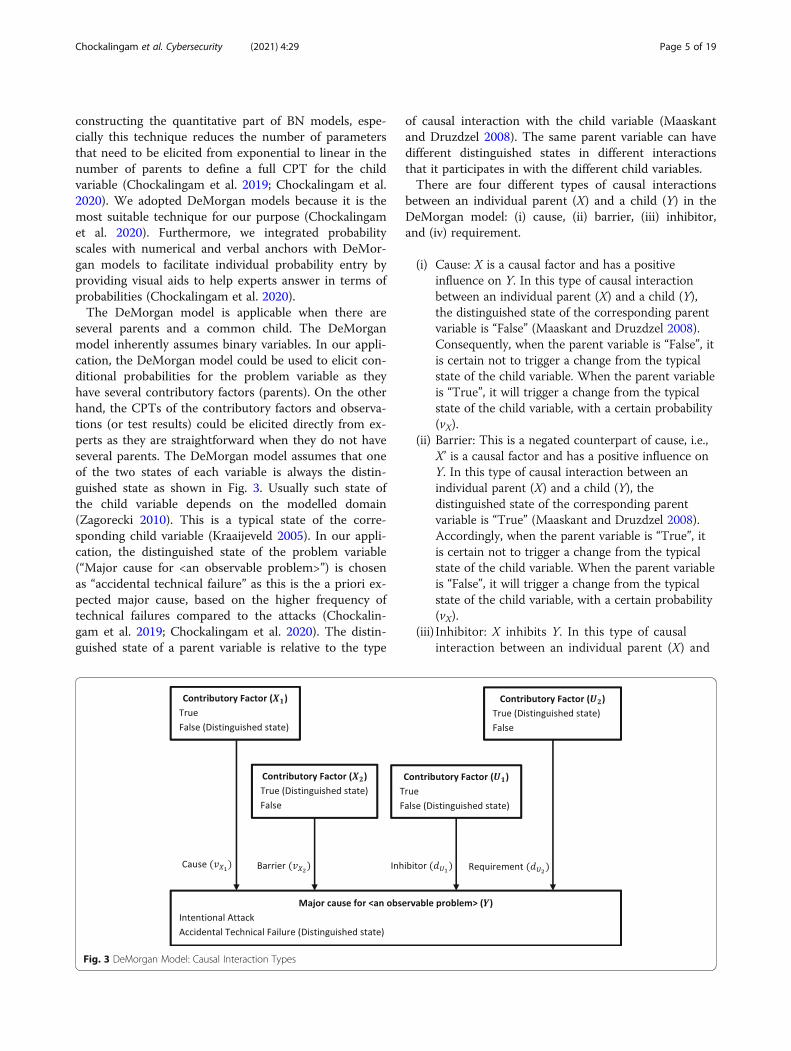
several parents and a common child. The DeMorganmodel inherently assumes binary variables. In our appli-cation, the DeMorgan model could be used to elicit con-ditional probabilities for the problem variable as theyhave several contributory factors (parents). On the otherhand, the CPTs of the contributory factors and observa-tions (or test results) could be elicited directly from ex-perts as they are straightforward when they do not haveseveral parents. The DeMorgan model assumes that oneof the two states of each variable is always the distin-guished state as shown in Fig. 3. Usually such state ofthe child variable depends on the modelled domain(Zagorecki 2010). This is a typical state of the corre-sponding child variable (Kraaijeveld 2005). In our appli-cation, the distinguished state of the problem variable(“Major cause for <an observable problem>”) is chosenas “accidental technical failure” as this is the a priori ex-pected major cause, based on the higher frequency oftechnical failures compared to the attacks (Chockalin-gam et al. 2019; Chockalingam et al. 2020). The distin-guished state of a parent variable is relative to the type
of causal interaction with the child variable (Maaskantand Druzdzel 2008). The same parent variable can havedifferent distinguished states in different interactionsthat it participates in with the different child variables.There are four different types of causal interactions
between an individual parent (X) and a child (Y) in theDeMorgan model: (i) cause, (ii) barrier, (iii) inhibitor,and (iv) requirement.
(i) Cause: X is a causal factor and has a positiveinfluence on Y. In this type of causal interactionbetween an individual parent (X) and a child (Y),the distinguished state of the corresponding parentvariable is “False” (Maaskant and Druzdzel 2008).Consequently, when the parent variable is “False”, itis certain not to trigger a change from the typicalstate of the child variable. When the parent variableis “True”, it will trigger a change from the typicalstate of the child variable, with a certain probability(vX).
(ii) Barrier: This is a negated counterpart of cause, i.e.,X’ is a causal factor and has a positive influence onY. In this type of causal interaction between anindividual parent (X) and a child (Y), thedistinguished state of the corresponding parentvariable is “True” (Maaskant and Druzdzel 2008).Accordingly, when the parent variable is “True”, itis certain not to trigger a change from the typicalstate of the child variable. When the parent variableis “False”, it will trigger a change from the typicalstate of the child variable, with a certain probability(vX).
(iii) Inhibitor: X inhibits Y. In this type of causalinteraction between an individual parent (X) and
Fig. 3 DeMorgan Model: Causal Interaction Types
Chockalingam et al. Cybersecurity (2021) 4:29 Page 5 of 19
a child (Y), the distinguished state of thecorresponding parent variable is “False”(Maaskant and Druzdzel 2008). As a result, whenthe parent variable is “False”, it is certain not toprevent a change from the typical state of thechild variable. When the parent variable is“True”, it will prevent a change from the typicalstate of the child variable, with a certainprobability (dX).
(iv)Requirement: The relationship between an inhibitorand requirement is similar to the relationshipbetween a cause and barrier. X’ inhibits Y. In thistype of causal interaction between an individualparent (X) and a child (Y), the distinguished state ofthe corresponding parent variable is “True”(Maaskant and Druzdzel 2008). Hence, when theparent is “True”, it is certain not to prevent achange from the typical state of the child variable.When the parent variable is “False”, it will prevent achange from the typical state of the child variable,with a certain probability (dX).
The DeMorgan model is an extension and a combin-ation of the noisy-OR and noisy-AND model which sup-ports modelling the above-mentioned types of causalinteractions (Maaskant and Druzdzel 2008). The propertyof accountability in the noisy-OR model is applicable tothe DeMorgan model with a slight modification as it alsoexploits causal independence: In case all the modelled par-ents of the child are in their distinguished state, the prop-erty of accountability requires that the child be presumedtheir distinguished state. However, in many cases, this isnot a realistic assumption as it is difficult to capture allthe possible parents of the child (Fallet-Fidry et al. 2012).Specifically, this is not realistic in our application as it isdifficult to capture all the possible contributory factors ofan observable problem due to “intentional attack”. In theDeMorgan model, the leak parameter (vXL ) deals with thepossible parents of the child that are not previously knownand explicitly modelled.In general, the size of the CPT of a binary variable
with n binary parents is 2n + 1. However, only n + 1
parameters are sufficient to completely define CPT usingthe DeMorgan model as it exploits causal independ-ence. In the example shown in Fig. 3, only five pa-rameters are sufficient to completely define the CPTof child variable (Y) using the DeMorgan modelinstead of 64 entries. We could find the values forrequired parameters from the experts to completelydefine CPT using the DeMorgan model based on ap-propriate question for each type of causal interactionshown in Table 1.Once we determine the required parameters based on
appropriate elicitation questions, we can completely de-fine the CPT of the child variable using (1):
P yð jX;UÞ ¼ 1− 1−vXLð ÞY
Xi∈þX
1−vXið Þ !
Y
Ui∈þU
1−dUið Þ
ð1ÞIn the Eq. (1), Y represents the effect variable which
has values y for the effect being in the non-distinguishedstate (“Intentional attack”) and y’ for the effect being inthe distinguished state (“Accidental technical failure”). Xdenotes the set of parents which interact with the effectvariable as promoting influences, U denotes the set ofparents which interact with the effect variable as inhibit-ing influences, +X denotes the subset of X that containsall parents that are in their non-distinguished states, +Udenotes the subset of U that contains all parents that arein their non-distinguished states. vXL denotes the leak par-ameter which expresses the probability of y (“Intentionalattack”) given all parents are in their distinguished states,vXi denotes the probability of y (“Intentional attack”) giventhat the parent Xi is not in its distinguished state and allother parents are in their distinguished states, dUi denotesthe probability of y’ (“Accidental technical failure”) giventhat the parent Ui is not in its distinguished state and allother parents are in their distinguished states.
Applying BNs for distinguishing attacks andtechnical failuresThis section describes how we constructed the BNmodel for distinguishing attacks and technical failures in
Table 1 Causal Interactions and their Corresponding Elicitation Questions in the DeMorgan Model
Type of Causal Interaction Elicitation Question
Leak “What is the probability that the child is in their non-distinguished state given that the par-ents are in their distinguished states?”
Cause, BarrierNote: There is a difference between the non-distinguishedstate of a cause and barrier.
“What is the probability that the child is in their non-distinguished state given that all theparents are in their distinguished states, except Xi and no other unmodelled causal factorsare present?”.
Inhibitor, RequirementNote: There is a difference between the non-distinguishedstate of an inhibitor and requirement.
“What is the probability that the child is in their distinguished state given that the parentsare in their distinguished states, except Ui and no other unmodelled causal factors arepresent?”.
Chockalingam et al. Cybersecurity (2021) 4:29 Page 6 of 19
floodgates. We considered the observable problem forthis application as “Sensor sends incorrect water levelmeasurements” because it could lead to serious conse-quences in the case of floodgate. In case the floodgatecloses when it should not, based on the incorrect waterlevel measurements sent by the sensor, it would lead tosevere economic damage, for instance, by delaying cargoships. On the other hand, in case the floodgate openswhen it should not, due to incorrect water level mea-surements sent by the sensor, it would lead to flooding.
Construction of qualitative BN model for distinguishingattacks and technical failures in floodgatesWe have utilised a multimethodology approach for datacollection. Multimethodology refers to using more thanone method of data collection in a research study(Brewer and Hunter 1989), providing more comprehen-sive data. In our study, we utilised a focus group work-shop and a questionnaire to gather data for constructingthe qualitative BN model. Firstly, we conducted a focusgroup workshop with five participants who have experi-ence working with safety and/or security of water man-agement infrastructures operated by ICS. The majorobjective of this focus group is to discuss and identifycontributory factors and observations (or test results) forthe problem which we considered. Each participant wasprovided with a set of questions as shown in Additionalfile 1: Appendix A. Most of these questions are open-ended that ask for factors that would contribute to themajor cause of the considered problem (attack/technicalfailure) and tests that would provide additional informa-tion to distinguish between the major cause of the con-sidered problem (attack/technical failure) after theproblem is observed by the floodgate operator. For in-stance, we considered the problem “the sensor sends in-correct water level measurements” and asked theparticipants: “Which contributory factors would increasethe likelihood of the problem due to (accidental) sensorfailure?”. The moderator explained each question to theparticipants and facilitated the discussion among theparticipants to identify a set of contributory factors andobservations (or test results) for the observable problemwhich we considered.After the focus group workshop, we employed a ques-
tionnaire to gather data for constructing the qualitativeBN model. We employed snowball sampling to recruitother participants for this study through initial partici-pants. This sampling technique is useful as it helps tofind experts in ICS safety and/or security quickly. Theparticipants were provided with the same set of ques-tions which we provided to focus group participants asshown in Additional file 1: Appendix A to elicit con-tributory factors and observations (or test results) forthe considered problem. We received 10 responses in
total for the questionnaire. However, we excluded oneresponse as the participant did not have any experienceworking with ICS. Importantly, seven out of nine re-spondents have five or more years working experiencewith ICS which helps to ensure reliability of data. Inaddition, we had a good mix of participants from safetyand/or security community which is important for ourapplication. Specifically, two out of nine respondents as-sociate themselves with both safety and security, two outof nine respondents associate themselves with safety andfive out of nine respondents associate themselves withsecurity.We combined the data gathered from the focus group
and questionnaire for coding. We utilised thematic cod-ing by grouping contributory factors which are similarunder a category. For instance, there were nine re-sponses such as “easy access to sensor”, “attacker hasphysical access to the sensor”, “free access to sensor”which we categorised into “easy physical access to sen-sor”. On the other hand, we grouped and removed con-tributory factors which are not contributory factorsbased on our definition. For instance, “Man-in-the-Mid-dle attack using the wired connection” is not a specificcontributory factor but rather a type of attack that an at-tacker might employ. Once we categorised the contribu-tory factors, there were 14 categories (parent nodes) intotal. However, this would result in the CPT size of theproblem variable as 16,384, which makes it unmanage-able. Therefore, we utilised parent node divorcing, whichallows parent nodes to be grouped hierarchically toavoid excessive inbound links to the child node. By uti-lising parent node divorcing, we reduced the number ofparent nodes to eight which in turn reduced the CPTsize of the problem variable to 256. For instance, wegrouped hierarchically three different parent nodes (lo-cation of sensor susceptible to severe weather, locationof sensor susceptible to biological fouling, location ofsensor susceptible to physical contact of marine vessel)into a single parent node (location of sensor susceptibleto external factor) as shown in Fig. 4, because they areof the same theme and no original interactions are lostin the process. Figure 4 shows two different types ofcausal interactions between an individual contributoryfactor and the problem: (i) cause and (ii) inhibitor. Thecontributory factors including easy physical accessibility,no sensor data integrity verification, easy network acces-sibility, presence of software in sensor and no sensorfirmware update have a positive influence on the prob-lem (major cause for sensor sends incorrect water levelmeasurements). On the other hand, the contributory fac-tors including maintenance issue, no use of Electro-Magnetic Interference (EMI) shielding technique, loca-tion of sensor susceptible to external factor have an inhi-biting influence on the problem. Once the qualitative
Chockalingam et al. Cybersecurity (2021) 4:29 Page 7 of 19
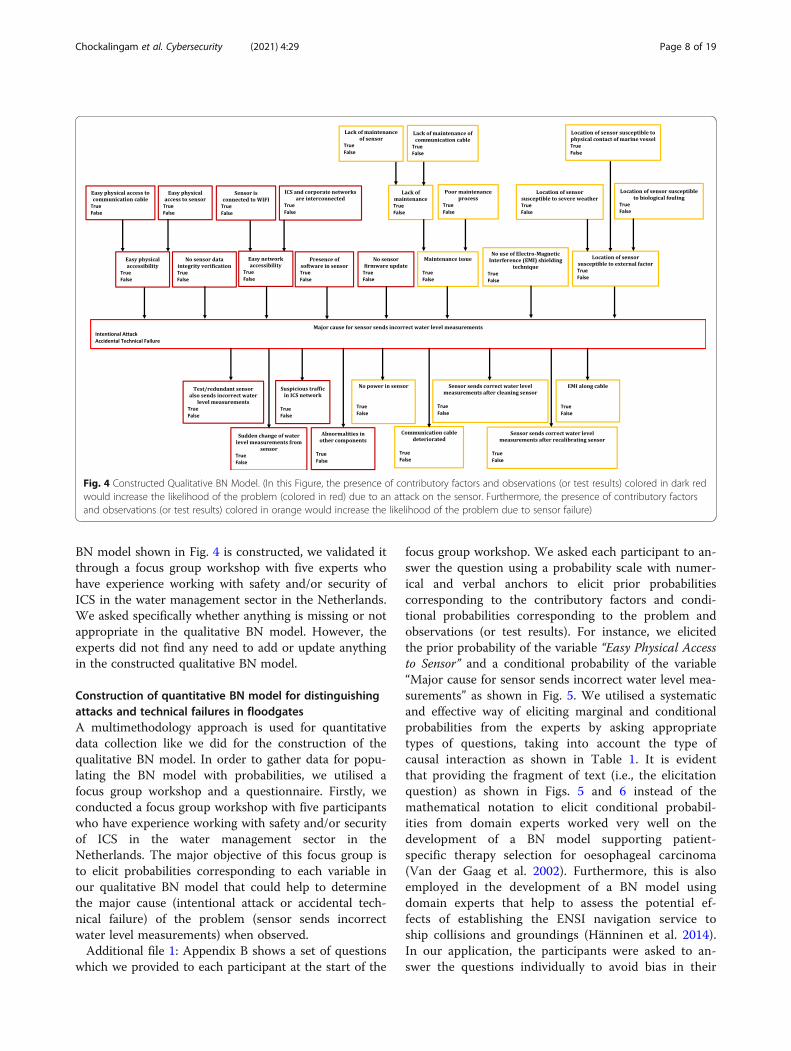
BN model shown in Fig. 4 is constructed, we validated itthrough a focus group workshop with five experts whohave experience working with safety and/or security ofICS in the water management sector in the Netherlands.We asked specifically whether anything is missing or notappropriate in the qualitative BN model. However, theexperts did not find any need to add or update anythingin the constructed qualitative BN model.
Construction of quantitative BN model for distinguishingattacks and technical failures in floodgatesA multimethodology approach is used for quantitativedata collection like we did for the construction of thequalitative BN model. In order to gather data for popu-lating the BN model with probabilities, we utilised afocus group workshop and a questionnaire. Firstly, weconducted a focus group workshop with five participantswho have experience working with safety and/or securityof ICS in the water management sector in theNetherlands. The major objective of this focus group isto elicit probabilities corresponding to each variable inour qualitative BN model that could help to determinethe major cause (intentional attack or accidental tech-nical failure) of the problem (sensor sends incorrectwater level measurements) when observed.Additional file 1: Appendix B shows a set of questions
which we provided to each participant at the start of the
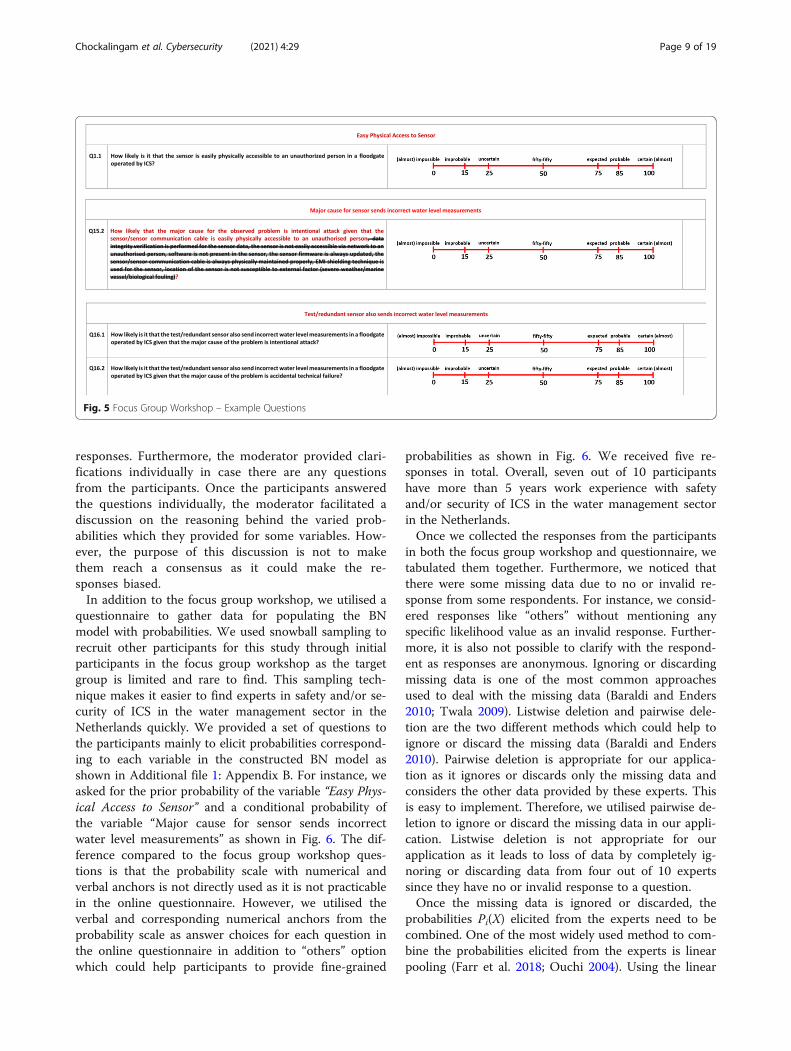
focus group workshop. We asked each participant to an-swer the question using a probability scale with numer-ical and verbal anchors to elicit prior probabilitiescorresponding to the contributory factors and condi-tional probabilities corresponding to the problem andobservations (or test results). For instance, we elicitedthe prior probability of the variable “Easy Physical Accessto Sensor” and a conditional probability of the variable“Major cause for sensor sends incorrect water level mea-surements” as shown in Fig. 5. We utilised a systematicand effective way of eliciting marginal and conditionalprobabilities from the experts by asking appropriatetypes of questions, taking into account the type ofcausal interaction as shown in Table 1. It is evidentthat providing the fragment of text (i.e., the elicitationquestion) as shown in Figs. 5 and 6 instead of themathematical notation to elicit conditional probabil-ities from domain experts worked very well on thedevelopment of a BN model supporting patient-specific therapy selection for oesophageal carcinoma(Van der Gaag et al. 2002). Furthermore, this is alsoemployed in the development of a BN model usingdomain experts that help to assess the potential ef-fects of establishing the ENSI navigation service toship collisions and groundings (Hänninen et al. 2014).In our application, the participants were asked to an-swer the questions individually to avoid bias in their
Fig. 4 Constructed Qualitative BN Model. (In this Figure, the presence of contributory factors and observations (or test results) colored in dark redwould increase the likelihood of the problem (colored in red) due to an attack on the sensor. Furthermore, the presence of contributory factorsand observations (or test results) colored in orange would increase the likelihood of the problem due to sensor failure)
Chockalingam et al. Cybersecurity (2021) 4:29 Page 8 of 19
responses. Furthermore, the moderator provided clari-fications individually in case there are any questionsfrom the participants. Once the participants answeredthe questions individually, the moderator facilitated adiscussion on the reasoning behind the varied prob-abilities which they provided for some variables. How-ever, the purpose of this discussion is not to makethem reach a consensus as it could make the re-sponses biased.In addition to the focus group workshop, we utilised a
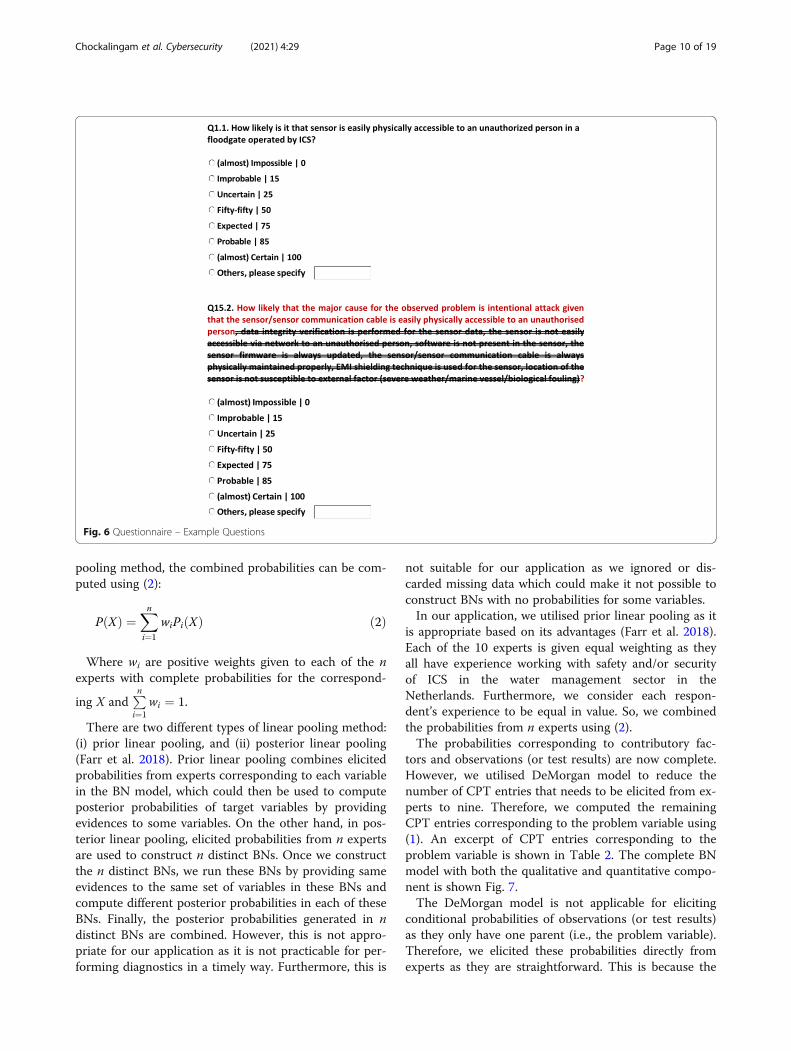
questionnaire to gather data for populating the BNmodel with probabilities. We used snowball sampling torecruit other participants for this study through initialparticipants in the focus group workshop as the targetgroup is limited and rare to find. This sampling tech-nique makes it easier to find experts in safety and/or se-curity of ICS in the water management sector in theNetherlands quickly. We provided a set of questions tothe participants mainly to elicit probabilities correspond-ing to each variable in the constructed BN model asshown in Additional file 1: Appendix B. For instance, weasked for the prior probability of the variable “Easy Phys-ical Access to Sensor” and a conditional probability ofthe variable “Major cause for sensor sends incorrectwater level measurements” as shown in Fig. 6. The dif-ference compared to the focus group workshop ques-tions is that the probability scale with numerical andverbal anchors is not directly used as it is not practicablein the online questionnaire. However, we utilised theverbal and corresponding numerical anchors from theprobability scale as answer choices for each question inthe online questionnaire in addition to “others” optionwhich could help participants to provide fine-grained
probabilities as shown in Fig. 6. We received five re-sponses in total. Overall, seven out of 10 participantshave more than 5 years work experience with safetyand/or security of ICS in the water management sectorin the Netherlands.Once we collected the responses from the participants
in both the focus group workshop and questionnaire, wetabulated them together. Furthermore, we noticed thatthere were some missing data due to no or invalid re-sponse from some respondents. For instance, we consid-ered responses like “others” without mentioning anyspecific likelihood value as an invalid response. Further-more, it is also not possible to clarify with the respond-ent as responses are anonymous. Ignoring or discardingmissing data is one of the most common approachesused to deal with the missing data (Baraldi and Enders2010; Twala 2009). Listwise deletion and pairwise dele-tion are the two different methods which could help toignore or discard the missing data (Baraldi and Enders2010). Pairwise deletion is appropriate for our applica-tion as it ignores or discards only the missing data andconsiders the other data provided by these experts. Thisis easy to implement. Therefore, we utilised pairwise de-letion to ignore or discard the missing data in our appli-cation. Listwise deletion is not appropriate for ourapplication as it leads to loss of data by completely ig-noring or discarding data from four out of 10 expertssince they have no or invalid response to a question.Once the missing data is ignored or discarded, the
probabilities Pi(X) elicited from the experts need to becombined. One of the most widely used method to com-bine the probabilities elicited from the experts is linearpooling (Farr et al. 2018; Ouchi 2004). Using the linear
Fig. 5 Focus Group Workshop – Example Questions
Chockalingam et al. Cybersecurity (2021) 4:29 Page 9 of 19
pooling method, the combined probabilities can be com-puted using (2):
P Xð Þ ¼Xn
i¼1
wiPi Xð Þ ð2Þ
Where wi are positive weights given to each of the nexperts with complete probabilities for the correspond-
ing X andPn
i¼1wi ¼ 1.
There are two different types of linear pooling method:(i) prior linear pooling, and (ii) posterior linear pooling(Farr et al. 2018). Prior linear pooling combines elicitedprobabilities from experts corresponding to each variablein the BN model, which could then be used to computeposterior probabilities of target variables by providingevidences to some variables. On the other hand, in pos-terior linear pooling, elicited probabilities from n expertsare used to construct n distinct BNs. Once we constructthe n distinct BNs, we run these BNs by providing sameevidences to the same set of variables in these BNs andcompute different posterior probabilities in each of theseBNs. Finally, the posterior probabilities generated in ndistinct BNs are combined. However, this is not appro-priate for our application as it is not practicable for per-forming diagnostics in a timely way. Furthermore, this is
not suitable for our application as we ignored or dis-carded missing data which could make it not possible toconstruct BNs with no probabilities for some variables.In our application, we utilised prior linear pooling as it
is appropriate based on its advantages (Farr et al. 2018).Each of the 10 experts is given equal weighting as theyall have experience working with safety and/or securityof ICS in the water management sector in theNetherlands. Furthermore, we consider each respon-dent’s experience to be equal in value. So, we combinedthe probabilities from n experts using (2).The probabilities corresponding to contributory fac-
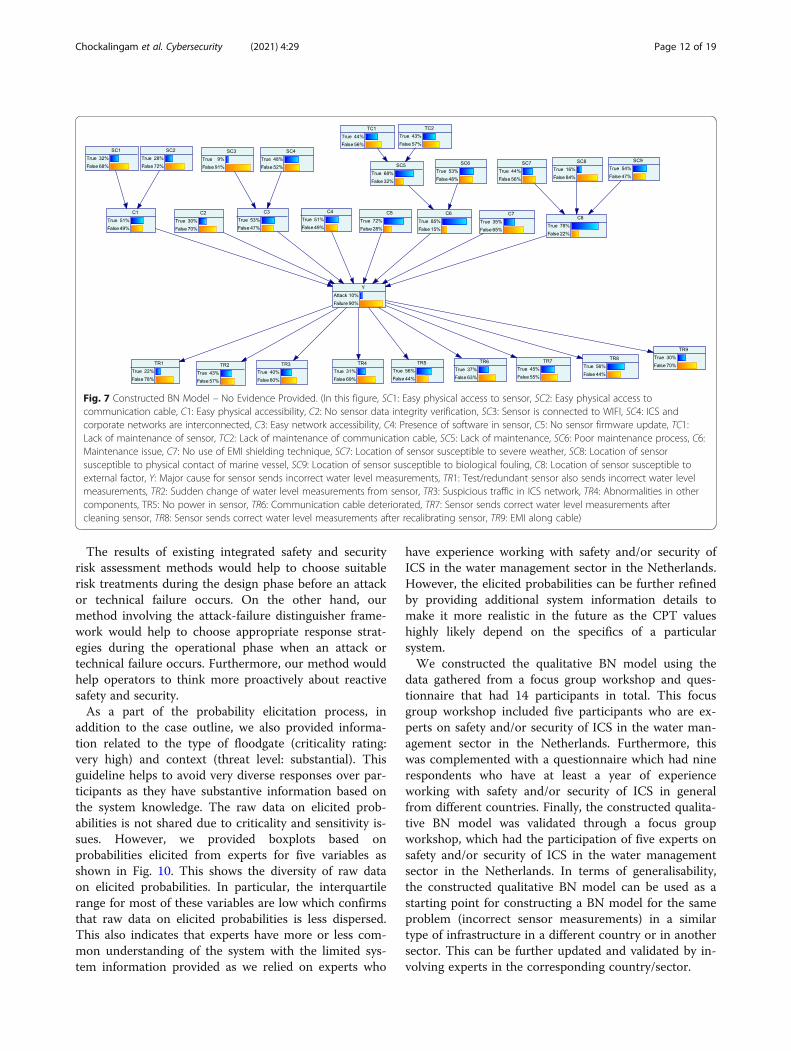
tors and observations (or test results) are now complete.However, we utilised DeMorgan model to reduce thenumber of CPT entries that needs to be elicited from ex-perts to nine. Therefore, we computed the remainingCPT entries corresponding to the problem variable using(1). An excerpt of CPT entries corresponding to theproblem variable is shown in Table 2. The complete BNmodel with both the qualitative and quantitative compo-nent is shown Fig. 7.The DeMorgan model is not applicable for eliciting
conditional probabilities of observations (or test results)as they only have one parent (i.e., the problem variable).Therefore, we elicited these probabilities directly fromexperts as they are straightforward. This is because the
Fig. 6 Questionnaire – Example Questions
Chockalingam et al. Cybersecurity (2021) 4:29 Page 10 of 19
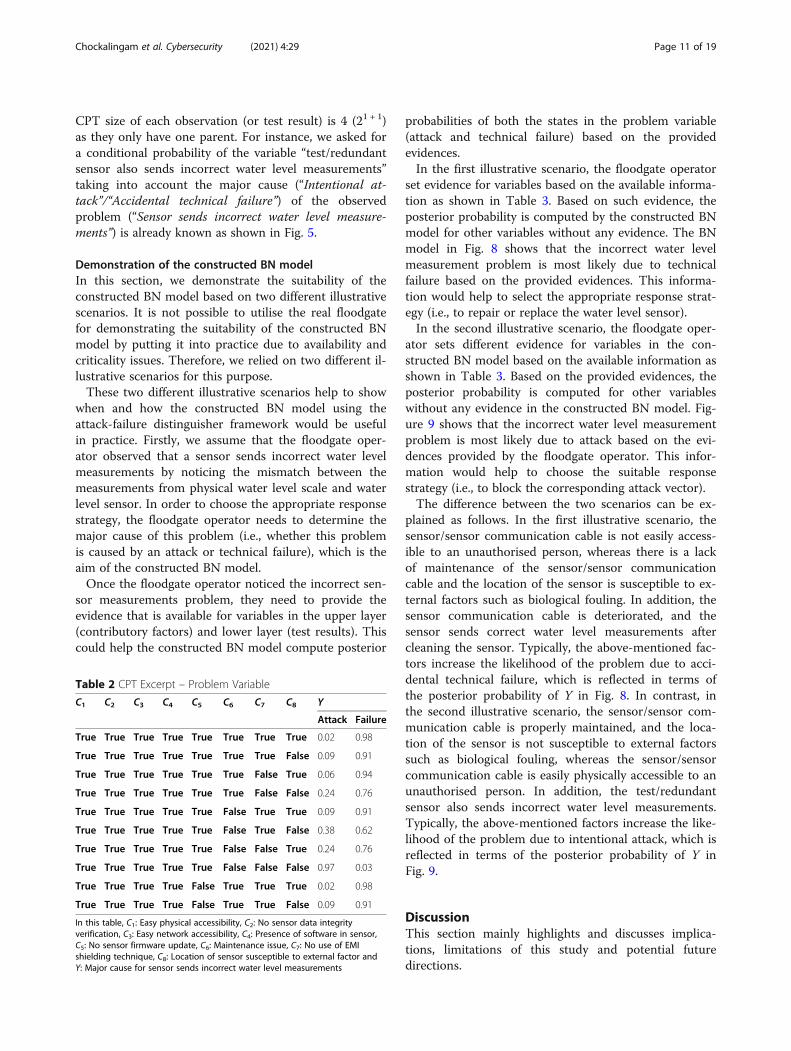
CPT size of each observation (or test result) is 4 (21 + 1)as they only have one parent. For instance, we asked fora conditional probability of the variable “test/redundantsensor also sends incorrect water level measurements”taking into account the major cause (“Intentional at-tack”/“Accidental technical failure”) of the observedproblem (“Sensor sends incorrect water level measure-ments”) is already known as shown in Fig. 5.
Demonstration of the constructed BN modelIn this section, we demonstrate the suitability of theconstructed BN model based on two different illustrativescenarios. It is not possible to utilise the real floodgatefor demonstrating the suitability of the constructed BNmodel by putting it into practice due to availability andcriticality issues. Therefore, we relied on two different il-lustrative scenarios for this purpose.These two different illustrative scenarios help to show
when and how the constructed BN model using theattack-failure distinguisher framework would be usefulin practice. Firstly, we assume that the floodgate oper-ator observed that a sensor sends incorrect water levelmeasurements by noticing the mismatch between themeasurements from physical water level scale and waterlevel sensor. In order to choose the appropriate responsestrategy, the floodgate operator needs to determine themajor cause of this problem (i.e., whether this problemis caused by an attack or technical failure), which is theaim of the constructed BN model.Once the floodgate operator noticed the incorrect sen-
sor measurements problem, they need to provide theevidence that is available for variables in the upper layer(contributory factors) and lower layer (test results). Thiscould help the constructed BN model compute posterior
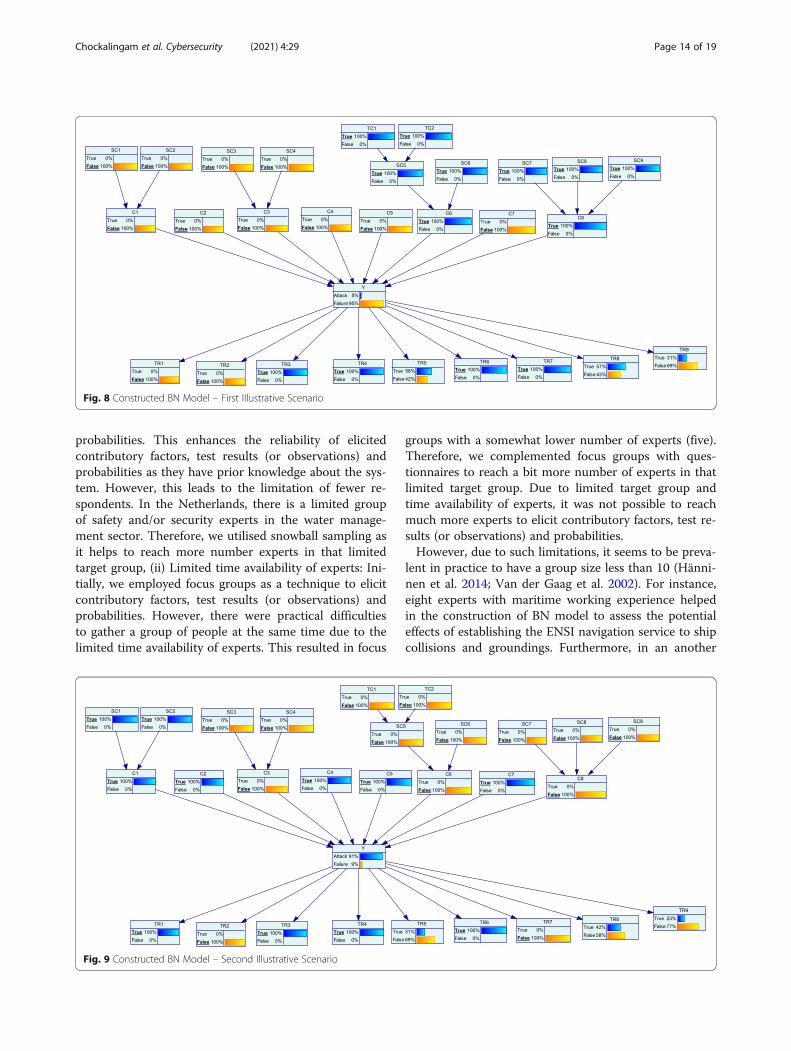
probabilities of both the states in the problem variable(attack and technical failure) based on the providedevidences.In the first illustrative scenario, the floodgate operator
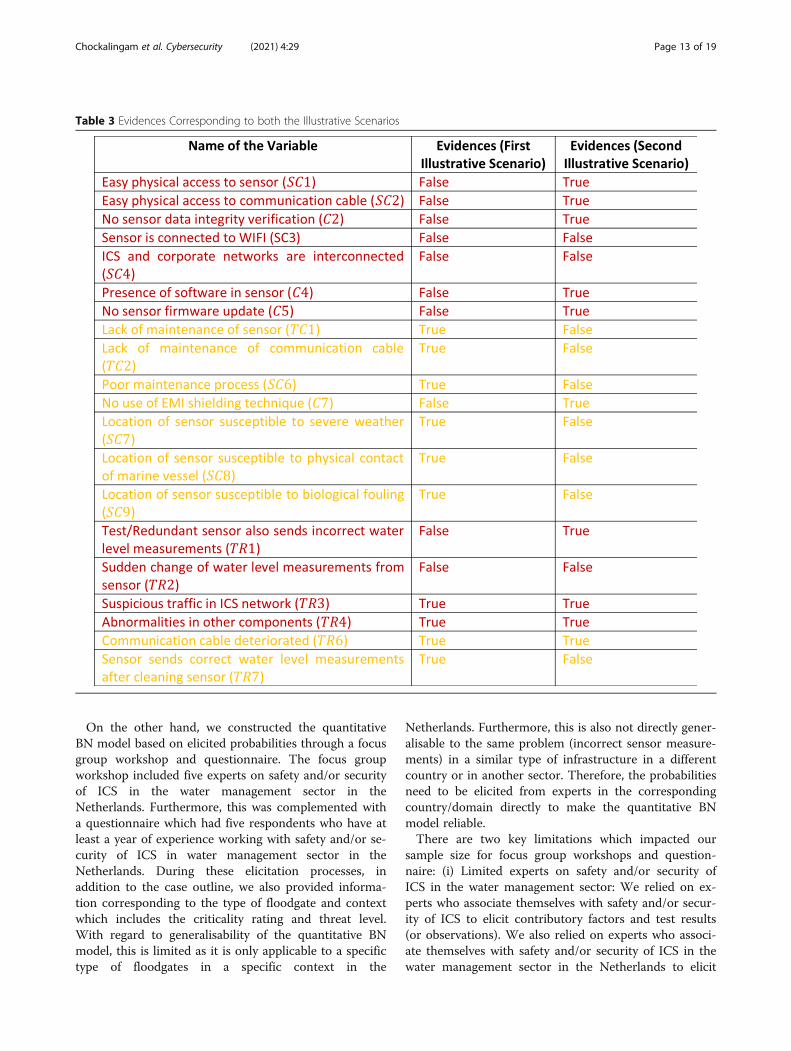
set evidence for variables based on the available informa-tion as shown in Table 3. Based on such evidence, theposterior probability is computed by the constructed BNmodel for other variables without any evidence. The BNmodel in Fig. 8 shows that the incorrect water levelmeasurement problem is most likely due to technicalfailure based on the provided evidences. This informa-tion would help to select the appropriate response strat-egy (i.e., to repair or replace the water level sensor).In the second illustrative scenario, the floodgate oper-
ator sets different evidence for variables in the con-structed BN model based on the available information asshown in Table 3. Based on the provided evidences, theposterior probability is computed for other variableswithout any evidence in the constructed BN model. Fig-ure 9 shows that the incorrect water level measurementproblem is most likely due to attack based on the evi-dences provided by the floodgate operator. This infor-mation would help to choose the suitable responsestrategy (i.e., to block the corresponding attack vector).The difference between the two scenarios can be ex-
plained as follows. In the first illustrative scenario, thesensor/sensor communication cable is not easily access-ible to an unauthorised person, whereas there is a lackof maintenance of the sensor/sensor communicationcable and the location of the sensor is susceptible to ex-ternal factors such as biological fouling. In addition, thesensor communication cable is deteriorated, and thesensor sends correct water level measurements aftercleaning the sensor. Typically, the above-mentioned fac-tors increase the likelihood of the problem due to acci-dental technical failure, which is reflected in terms ofthe posterior probability of Y in Fig. 8. In contrast, inthe second illustrative scenario, the sensor/sensor com-munication cable is properly maintained, and the loca-tion of the sensor is not susceptible to external factorssuch as biological fouling, whereas the sensor/sensorcommunication cable is easily physically accessible to anunauthorised person. In addition, the test/redundantsensor also sends incorrect water level measurements.Typically, the above-mentioned factors increase the like-lihood of the problem due to intentional attack, which isreflected in terms of the posterior probability of Y inFig. 9.
DiscussionThis section mainly highlights and discusses implica-tions, limitations of this study and potential futuredirections.
Table 2 CPT Excerpt – Problem Variable
C1 C2 C3 C4 C5 C6 C7 C8 Y
Attack Failure
True True True True True True True True 0.02 0.98
True True True True True True True False 0.09 0.91
True True True True True True False True 0.06 0.94
True True True True True True False False 0.24 0.76
True True True True True False True True 0.09 0.91
True True True True True False True False 0.38 0.62
True True True True True False False True 0.24 0.76
True True True True True False False False 0.97 0.03
True True True True False True True True 0.02 0.98
True True True True False True True False 0.09 0.91
In this table, C1: Easy physical accessibility, C2: No sensor data integrityverification, C3: Easy network accessibility, C4: Presence of software in sensor,C5: No sensor firmware update, C6: Maintenance issue, C7: No use of EMIshielding technique, C8: Location of sensor susceptible to external factor andY: Major cause for sensor sends incorrect water level measurements
Chockalingam et al. Cybersecurity (2021) 4:29 Page 11 of 19
The results of existing integrated safety and securityrisk assessment methods would help to choose suitablerisk treatments during the design phase before an attackor technical failure occurs. On the other hand, ourmethod involving the attack-failure distinguisher frame-work would help to choose appropriate response strat-egies during the operational phase when an attack ortechnical failure occurs. Furthermore, our method wouldhelp operators to think more proactively about reactivesafety and security.As a part of the probability elicitation process, in
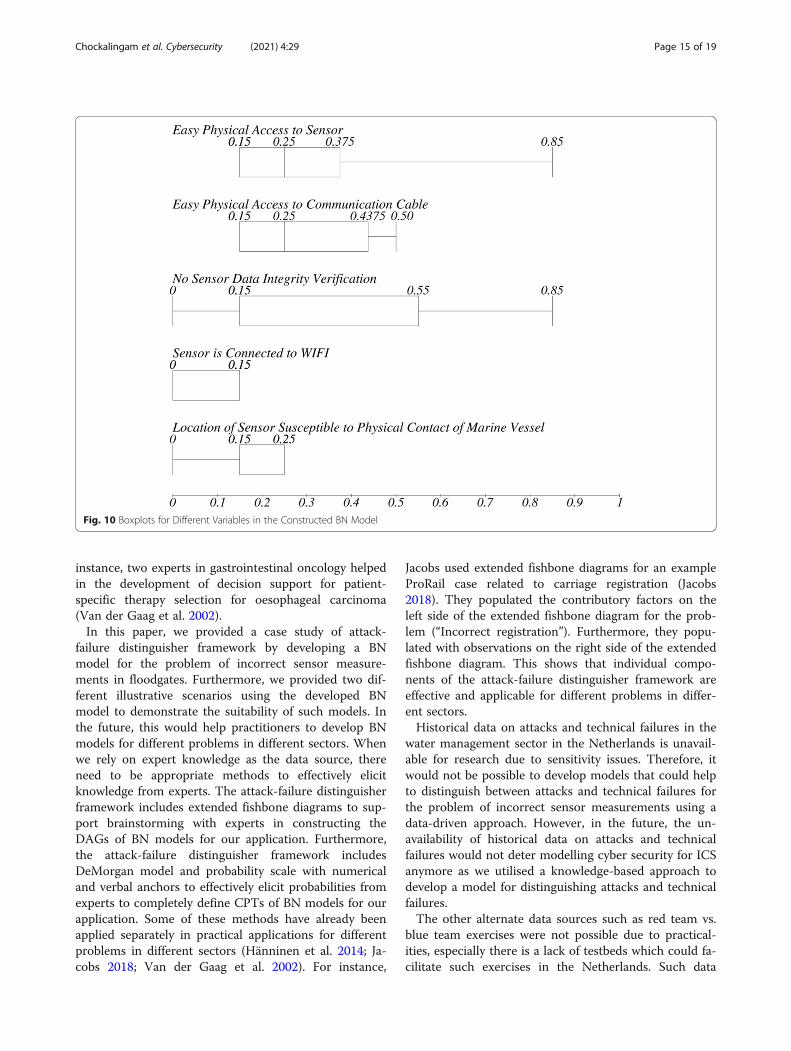
addition to the case outline, we also provided informa-tion related to the type of floodgate (criticality rating:very high) and context (threat level: substantial). Thisguideline helps to avoid very diverse responses over par-ticipants as they have substantive information based onthe system knowledge. The raw data on elicited prob-abilities is not shared due to criticality and sensitivity is-sues. However, we provided boxplots based onprobabilities elicited from experts for five variables asshown in Fig. 10. This shows the diversity of raw dataon elicited probabilities. In particular, the interquartilerange for most of these variables are low which confirmsthat raw data on elicited probabilities is less dispersed.This also indicates that experts have more or less com-mon understanding of the system with the limited sys-tem information provided as we relied on experts who
have experience working with safety and/or security ofICS in the water management sector in the Netherlands.However, the elicited probabilities can be further refinedby providing additional system information details tomake it more realistic in the future as the CPT valueshighly likely depend on the specifics of a particularsystem.We constructed the qualitative BN model using the
data gathered from a focus group workshop and ques-tionnaire that had 14 participants in total. This focusgroup workshop included five participants who are ex-perts on safety and/or security of ICS in the water man-agement sector in the Netherlands. Furthermore, thiswas complemented with a questionnaire which had ninerespondents who have at least a year of experienceworking with safety and/or security of ICS in generalfrom different countries. Finally, the constructed qualita-tive BN model was validated through a focus groupworkshop, which had the participation of five experts onsafety and/or security of ICS in the water managementsector in the Netherlands. In terms of generalisability,the constructed qualitative BN model can be used as astarting point for constructing a BN model for the sameproblem (incorrect sensor measurements) in a similartype of infrastructure in a different country or in anothersector. This can be further updated and validated by in-volving experts in the corresponding country/sector.
Fig. 7 Constructed BN Model – No Evidence Provided. (In this figure, SC1: Easy physical access to sensor, SC2: Easy physical access tocommunication cable, C1: Easy physical accessibility, C2: No sensor data integrity verification, SC3: Sensor is connected to WIFI, SC4: ICS andcorporate networks are interconnected, C3: Easy network accessibility, C4: Presence of software in sensor, C5: No sensor firmware update, TC1:Lack of maintenance of sensor, TC2: Lack of maintenance of communication cable, SC5: Lack of maintenance, SC6: Poor maintenance process, C6:Maintenance issue, C7: No use of EMI shielding technique, SC7: Location of sensor susceptible to severe weather, SC8: Location of sensorsusceptible to physical contact of marine vessel, SC9: Location of sensor susceptible to biological fouling, C8: Location of sensor susceptible toexternal factor, Y: Major cause for sensor sends incorrect water level measurements, TR1: Test/redundant sensor also sends incorrect water levelmeasurements, TR2: Sudden change of water level measurements from sensor, TR3: Suspicious traffic in ICS network, TR4: Abnormalities in othercomponents, TR5: No power in sensor, TR6: Communication cable deteriorated, TR7: Sensor sends correct water level measurements aftercleaning sensor, TR8: Sensor sends correct water level measurements after recalibrating sensor, TR9: EMI along cable)
Chockalingam et al. Cybersecurity (2021) 4:29 Page 12 of 19
On the other hand, we constructed the quantitativeBN model based on elicited probabilities through a focusgroup workshop and questionnaire. The focus groupworkshop included five experts on safety and/or securityof ICS in the water management sector in theNetherlands. Furthermore, this was complemented witha questionnaire which had five respondents who have atleast a year of experience working with safety and/or se-curity of ICS in water management sector in theNetherlands. During these elicitation processes, inaddition to the case outline, we also provided informa-tion corresponding to the type of floodgate and contextwhich includes the criticality rating and threat level.With regard to generalisability of the quantitative BNmodel, this is limited as it is only applicable to a specifictype of floodgates in a specific context in the
Netherlands. Furthermore, this is also not directly gener-alisable to the same problem (incorrect sensor measure-ments) in a similar type of infrastructure in a differentcountry or in another sector. Therefore, the probabilitiesneed to be elicited from experts in the correspondingcountry/domain directly to make the quantitative BNmodel reliable.There are two key limitations which impacted our
sample size for focus group workshops and question-naire: (i) Limited experts on safety and/or security ofICS in the water management sector: We relied on ex-perts who associate themselves with safety and/or secur-ity of ICS to elicit contributory factors and test results(or observations). We also relied on experts who associ-ate themselves with safety and/or security of ICS in thewater management sector in the Netherlands to elicit
Table 3 Evidences Corresponding to both the Illustrative Scenarios
Chockalingam et al. Cybersecurity (2021) 4:29 Page 13 of 19
probabilities. This enhances the reliability of elicitedcontributory factors, test results (or observations) andprobabilities as they have prior knowledge about the sys-tem. However, this leads to the limitation of fewer re-spondents. In the Netherlands, there is a limited groupof safety and/or security experts in the water manage-ment sector. Therefore, we utilised snowball sampling asit helps to reach more number experts in that limitedtarget group, (ii) Limited time availability of experts: Ini-tially, we employed focus groups as a technique to elicitcontributory factors, test results (or observations) andprobabilities. However, there were practical difficultiesto gather a group of people at the same time due to thelimited time availability of experts. This resulted in focus
groups with a somewhat lower number of experts (five).Therefore, we complemented focus groups with ques-tionnaires to reach a bit more number of experts in thatlimited target group. Due to limited target group andtime availability of experts, it was not possible to reachmuch more experts to elicit contributory factors, test re-sults (or observations) and probabilities.However, due to such limitations, it seems to be preva-
lent in practice to have a group size less than 10 (Hänni-nen et al. 2014; Van der Gaag et al. 2002). For instance,eight experts with maritime working experience helpedin the construction of BN model to assess the potentialeffects of establishing the ENSI navigation service to shipcollisions and groundings. Furthermore, in an another
Fig. 9 Constructed BN Model – Second Illustrative Scenario
Fig. 8 Constructed BN Model – First Illustrative Scenario
Chockalingam et al. Cybersecurity (2021) 4:29 Page 14 of 19
instance, two experts in gastrointestinal oncology helpedin the development of decision support for patient-specific therapy selection for oesophageal carcinoma(Van der Gaag et al. 2002).In this paper, we provided a case study of attack-
failure distinguisher framework by developing a BNmodel for the problem of incorrect sensor measure-ments in floodgates. Furthermore, we provided two dif-ferent illustrative scenarios using the developed BNmodel to demonstrate the suitability of such models. Inthe future, this would help practitioners to develop BNmodels for different problems in different sectors. Whenwe rely on expert knowledge as the data source, thereneed to be appropriate methods to effectively elicitknowledge from experts. The attack-failure distinguisherframework includes extended fishbone diagrams to sup-port brainstorming with experts in constructing theDAGs of BN models for our application. Furthermore,the attack-failure distinguisher framework includesDeMorgan model and probability scale with numericaland verbal anchors to effectively elicit probabilities fromexperts to completely define CPTs of BN models for ourapplication. Some of these methods have already beenapplied separately in practical applications for differentproblems in different sectors (Hänninen et al. 2014; Ja-cobs 2018; Van der Gaag et al. 2002). For instance,
Jacobs used extended fishbone diagrams for an exampleProRail case related to carriage registration (Jacobs2018). They populated the contributory factors on theleft side of the extended fishbone diagram for the prob-lem (“Incorrect registration”). Furthermore, they popu-lated with observations on the right side of the extendedfishbone diagram. This shows that individual compo-nents of the attack-failure distinguisher framework areeffective and applicable for different problems in differ-ent sectors.Historical data on attacks and technical failures in the
water management sector in the Netherlands is unavail-able for research due to sensitivity issues. Therefore, itwould not be possible to develop models that could helpto distinguish between attacks and technical failures forthe problem of incorrect sensor measurements using adata-driven approach. However, in the future, the un-availability of historical data on attacks and technicalfailures would not deter modelling cyber security for ICSanymore as we utilised a knowledge-based approach todevelop a model for distinguishing attacks and technicalfailures.The other alternate data sources such as red team vs.
blue team exercises were not possible due to practical-ities, especially there is a lack of testbeds which could fa-cilitate such exercises in the Netherlands. Such data
Fig. 10 Boxplots for Different Variables in the Constructed BN Model
Chockalingam et al. Cybersecurity (2021) 4:29 Page 15 of 19
sources could further improve the reliability of data usedto construct DAG and populate CPTs. Notably, the Crit-ical Infrastructure Security Showdown (CISS) is con-ducted by Singapore University of Technology andDesign on their Secure Water Treatment (SWaT)testbed (Antonioli et al. 2017). Such type of events couldprovide information about contributory factors and ob-servations (or test results) corresponding to attacks. Forinstance, we could interview members of the red teamregarding which factors in the infrastructure contributedto the success of their attack. Furthermore, we couldinterview members of the blue team regarding tests (orobservations) which helped them to diagnose an attack.The use of existing testbeds like SWaT testbed is not ap-propriate for this study as it did not reflect the systemwhich we considered i.e., a specific type of floodgates inthe Netherlands. Therefore, there is a need for a testbedin the Netherlands which reflect the system which weconsidered for using red team vs. blue team exercises asan alternate data source and/or a system for evaluationin the future.The real water management infrastructure like a flood-
gate is not available for the evaluation of the developedBN model due to availability and criticality issues.Therefore, we could not perform naturalistic evaluation,which involves evaluating the developed artefact withreal users and real systems in the real setting. Therefore,we relied on the artificial evaluation, which involvesevaluating the developed BN model in a contrived andnon-realistic way. However, we made it more realisticwith real-users, and realistic problems to correspond theresults to real use. Furthermore, the developed BNmodel is validated using expert evaluation and illustra-tive scenarios. However, the quantitative BN modelneeds to be further evaluated using a testbed in the fu-ture. Currently, this was not possible due to the lack oftestbed in the Netherlands which reflect the systemwhich we considered. However, this evaluation wouldalso help to answer the key question on how much con-fidence should an operator have based on such BN-based analysis.
Related workThis section highlights application of BNs in differentdomains. Furthermore, we summarise important pat-terns corresponding to the application of BNs in cybersecurity, which we used as a basis to develop BN modelsfor our application. In addition, we point out studies thatrelate to the problem of distinguishing attacks and tech-nical failures.BNs are used for developing medical decision support
systems (Curiac et al. 2009; Kahn et al. 2001; Kahn Jret al. 1997; Luciani et al. 2003; Milho and Fred 2001;Onisko et al. 1999). Furthermore, BNs are also used in
fault diagnosis (Cai et al. 2014; Huang et al. 2008; Zhaoet al. 2013), cyber security (Alile 2018; Apukhtin 2011;Axelrad et al. 2013; Elmrabit et al. 2020; Greitzer et al.2010; Greitzer et al. 2012; Herland et al. 2016; Holmet al. 2015; Ibrahimović and Bajgorić 2016; Korneckiet al. 2013; Kwan et al. 2009; Kwan et al. 2008; Mo et al.2009; Pappaterra 2021; Pecchia et al. 2011; Shin et al.2015; Wang and Guo 2010; Zhou et al. 2018).In our previous work, we conducted a systematic lit-
erature review of BN models in cyber security (Chocka-lingam et al. 2017). In that study, we identified 17standard BN models in cyber security based on the re-view methodology we adopted. The identified BNmodels were analysed using eight different criteria: (i)citation details, (ii) data sources used to construct Di-rected Acyclic Graphs (DAGs) and populate ConditionalProbability Tables (CPTs), (iii) the number of nodesused in the model, (iv) type of threat actor, (v) applica-tion and application sector, (vi) scope of variables, (vii)the approach(es) used to validate models and (viii)model purpose and type of purpose.Some of the important patterns in the use of standard
BN models in cyber security which we identified in-cludes: (i) data sources used to construct DAGs andpopulate CPTs in the identified BN models were expertknowledge and empirical data predominantly from cybersecurity reports, (ii) the identified BN models were pre-dominantly used to tackle problems associated with theInformation Technology (IT) environment compared tothe ICS environment and (iii) the identified BN modelscompletely or partially benefited risk management, fo-rensic investigation, governance, threat hunting and vul-nerability management in cyber security.The identified BN models were considered as a start-
ing point to develop the attack-failure distinguisherframework for constructing BN models that would helpto distinguish between attacks and technical failures(Chockalingam et al. 2019). Furthermore, some of theidentified patterns in the use of BN models in cyber se-curity were used as a basis to construct BN models forour application. For instance, expert knowledge is a suc-cessful and well-established alternate data source totackle problems associated with ICS environment asthere is a no availability of data from real-world systemswhich we considered. Finally, some of the identified pat-terns in the use of BN models in cyber security wereused as a motivation for this study to fill an identified re-search gap in addition to considering inputs from suchBN models. For instance, we developed a BN model totackle a problem associated with the ICS environmenttaking into account BN models used to tackle problemsin IT environment.(Ahmed et al. 2020) highlighted that distinguishing at-
tacks and technical failures is necessary based on
Chockalingam et al. Cybersecurity (2021) 4:29 Page 16 of 19
interviews with researchers at state-of-the-art testbedslike SWaT, ICS security experts and engineers at indus-trial production plants for steel and water. Furthermore,they described three important challenges of distinguish-ing attacks and technical failures. One of the challengesis that related works mainly focus on the consequencesof an attack or technical failure instead of looking intothe properties of an attack or technical failure. Further-more, they suggested different potential directions thatcould help to tackle the problem of distinguishing at-tacks and technical failures, one of which is to use datafrom both the network layer and the process layer.There are a lot of works that focus on either detecting
an attack or a technical failure separately. For instance,(Park et al. 2015) proposed an approach to detect sensorattacks in the presence of transient faults like a GPSreporting incorrect measurements inside a tunnel. Fur-thermore, (Samara et al. 2008) proposed a method fordetection of sensor abrupt faults. However, these lackthe capability to distinguish between attacks and tech-nical failures.Finally, (Anwar et al. 2015) proposed a data-driven
approach to distinguish cyber-attacks from physicalfaults in a smart grid. Furthermore, they comparedtheir approach with the conventional supervised clas-sification approaches. However, their approach is notapplicable when there is a lack of data which is typic-ally the case in cyber security of different domainslike water management.
Conclusions and future workHarmful consequences of a problem could be minimisedby choosing the appropriate response strategy in a timelymanner. However, this is not possible without determin-ing the major cause of a problem. In our previous work,we developed the attack-failure distinguisher frameworkwhich could help to construct BN models that deter-mine whether the problem is caused by an attack ortechnical failure. This framework also includes theknowledge elicitation methods such as the DeMorganmodel, and probability scales with numerical and verbalanchors to effectively elicit expert knowledge to con-struct such BN models. This work mainly focused onproviding a full case study of the framework on how toconstruct the BN model for a problem and demonstratewhen and how this could be used in practice.In this work, we developed a BN model for the prob-
lem of incorrect sensor measurements in floodgates inthe Netherlands using the attack-failure distinguisherframework. This corresponds to the second main contri-bution of this paper. Due to the lack of data, we reliedon expert knowledge to construct the qualitative andquantitative part of the BN model for our problem. Weelicited contributory factors and test results (or
observations) through a focus group workshop and aquestionnaire among respondents who have experienceworking with ICS. The data from both the focus groupworkshop and questionnaire were used to construct thequalitative BN model, which was also validated with fiveexperts.Once the qualitative BN model was constructed, we
used the DeMorgan model to reduce the number ofCPT entries that needs to be elicited for the problemvariable to nine instead of 256. Firstly, we elicited prob-abilities corresponding to contributory factors, problemand test results (or observations) from experts who haveexperience working with safety and/or security of watermanagement infrastructures operated by ICS in theNetherlands through a focus group workshop and ques-tionnaire. During this elicitation, we employed probabil-ity scales with numerical and verbal anchors to facilitateindividual probability entry by providing it as a visualaid. We computed the rest of the probabilities for theproblem variable using the DeMorgan model. Theprocess of using attack-failure distinguisher frameworkto construct the BN model for our application relates tothe first main contribution of this paper. Finally, wedemonstrated the suitability of the constructed BNmodel using two different illustrative scenarios. This as-sociates with the third main contribution of this paper.The first illustrative scenario shows that the most likelycause for the considered problem is technical failure,whereas the second illustrative scenario shows that themost likely cause for the considered problem is attackbased on the evidences provided.It was not possible to use real systems for evaluat-
ing the attack-failure distinguisher framework due toavailability and criticality issues. However, we utilisedreal-users and realistic problems to evaluate theattack-failure distinguisher framework by developing aprototype and using the developed prototype for twodifferent illustrative scenarios to relate the results toreal use. Therefore, the developed BN model is usablein real settings in the future. However, this BN modelcan be further updated with appropriate contributoryfactors, test results and probabilities based on theperformance measures in the confusion matrix, whichincludes four different combinations of diagnosed andactual classes. This is only possible when a datasetcorresponding to the problem in the real setting isavailable for research.In the future, it would be beneficial to put the con-
structed BN model into practice in a real floodgate incase it is available to showcase the value of the con-structed BN model. Furthermore, we developed a root-cause analysis framework with the appropriate type ofvariables and relationships between them in our previouswork, which would help to construct BN models to
Chockalingam et al. Cybersecurity (2021) 4:29 Page 17 of 19
determine the attack-vector (in case of an attack) andfailure mode (in case of a technical failure) (Chockalin-gam and Katta 2019). However, the root-cause analysisframework needs to be applied and evaluated for a prob-lem like incorrect sensor measurements in the future asit could complement the attack-failure distinguisherframework to determine the attack-vector (in case of anattack) and failure mode (in case of a technical failure).This could also help to choose the most effective re-sponse strategy between alternatives like repairing or re-placing the sensor.
Supplementary InformationThe online version contains supplementary material available at https://doi.org/10.1186/s42400-021-00086-6.
Additional file 1 : Appendix A. Knowledge Elicitation Method toDevelop Qualitative BN Model. Appendix B. Knowledge ElicitationMethod to Develop Quantitative BN Model.
AcknowledgementsThe authors would like to thank the focus group participants andquestionnaire respondents. We also thank the anonymous reviewers for theirtime and efforts in reviewing our manuscript and providing constructivecomments.
Authors’ contributionsSabarathinam Chockalingam: Conceptualization, Methodology, Investigation,Validation, Writing – Original Draft. Wolter Pieters: Writing – Review &Editing, Supervision. André Teixeira: Writing – Review & Editing, Supervision.Pieter van Gelder: Writing – Review & Editing, Supervision. All authors readand approved the final manuscript.
FundingThis research received funding from the Netherlands Organization forScientific Research (NWO) in the framwork of the Cyber Security researchprogram under the project “Secure Our Safety: Building Cyber Security forFlood Management (SOS4Flood)”.
Availability of data and materialsThe probabilities elicited from experts during this research will not beshared, due to the data criticality and sensitivity issues. The elicitedprobabilities are critical and sensitive because they are elicited from expertswho have experience working with safety and/or security of ICS in the watermanagement sector in the Netherlands, which reflects reality for a specifictype of floodgates under a particular threat level. However, correspondingexcerpts are provided in the paper to make application of BNs fordistinguishing attacks and technical failures comprehensible, which alsoensures that the value of this research is not negatively impacted by notsharing the elicited probabilities.
Declaration
Competing interestsThe authors declare that they have no competing interests.
Author details1Faculty of Technology, Policy and Management, Delft University ofTechnology, Delft, The Netherlands. 2Department of Risk, Safety and Security,Institute for Energy Technology, Halden, Norway. 3Behavioural ScienceInstitute, Radboud University, Nijmegen, The Netherlands. 4Department ofElectrical Engineering, Uppsala University, Uppsala, Sweden.
Received: 12 August 2020 Accepted: 4 April 2021
ReferencesAhmed, C. M., Prakash, J., & Zhou, J. (2020). Revisiting anomaly detection in ICS:
aimed at segregation of attacks and faults. arXiv preprint arXiv:2005.00325Alile OS (2018) Predicting multi-stage attack with normal IP addresses on a
computer network using Bayesian belief network. University of Benin, BeninAntonioli D, Ghaeini HR, Adepu S, Ochoa M, Tippenhauer NO (2017) Gamifying
ICS security training and research: design, implementation, and results of S3.In: Proceedings of the Workshop on Cyber-Physical Systems Security andPrivacy
Anwar A, Mahmood AN, Shah Z (2015) A data-driven approach to distinguishcyber-attacks from physical faults in a smart grid. In: Proceedings of the 24thACM International on Conference on Information and KnowledgeManagement
Apukhtin V (2011) Bayesian network modeling for analysis of data breach in abank. University of Stavanger, Norway
Axelrad ET, Sticha PJ, Brdiczka O, Shen J (2013) A Bayesian network model forpredicting insider threats. In: 2013 IEEE security and privacy workshops
Baraldi AN, Enders CK (2010) An introduction to modern missing data analyses. JSch Psychol 48(1):5–37. https://doi.org/10.1016/j.jsp.2009.10.001
Brewer J, Hunter A (1989) Multimethod research: a synthesis of styles. Sagelibrary of social research (vol. 175). Sage Publications, Inc
Cai B, Liu Y, Fan Q, Zhang Y, Liu Z, Yu S, Ji R (2014) Multi-source informationfusion based fault diagnosis of ground-source heat pump using Bayesiannetwork. Appl Energy 114:1–9. https://doi.org/10.1016/j.apenergy.2013.09.043
Castellon N, Frinking E (2015) Securing critical infrastructures in the Netherlands:towards a National Testbed. The Hague Centre for Strategic Studies.Retrieved from https://www.thehaguesecuritydelta.com/media/com_hsd/report/53/document/Securing-Critical-Infrastructures-in-the-Netherlands.pdf
Chockalingam S, Katta V (2019) Developing a bayesian network framework forroot cause analysis of observable problems in cyber-physical systems. In:2019 IEEE Conference on Information and Communication Technology(CICT)
Chockalingam S, Pieters W, Teixeira A, Khakzad N, van Gelder P (2019) CombiningBayesian networks and fishbone diagrams to distinguish between intentionalattacks and accidental technical failures. Graphical Models Secur (GramSec).https://doi.org/10.1007/978-3-030-15465-3_3
Chockalingam S, Pieters W, Teixeira A, van Gelder P (2017) Bayesian networkmodels in cyber security: a systematic review. In: Nordic Conference onSecure IT Systems (NordSec). https://doi.org/10.1007/978-3-319-70290-2_7
Chockalingam S (2020) Distinguishing attacks and failures in industrial controlsystems: knowledge-based design of Bayesian networks for WaterManagement Infrastructures – Chapter 5 (Doctoral Thesis, Delft University ofTechnology, Delft, The Netherlands). Retrieved from https://doi.org/10.4233/uuid:17da1df4-3295-45d3-9119-9f92a547e7c6
Curiac D-I, Vasile G, Banias O, Volosencu C, Albu A (2009) Bayesian networkmodel for diagnosis of psychiatric diseases. In: Proceedings of the ITI 200931st International Conference on Information Technology Interfaces
Darwiche A (2008) Bayesian networks. Foundations Artif Intell 3:467–509. https://doi.org/10.1016/S1574-6526(07)03011-8
Effendi A, Davis R (2015) ICS and IT: managing cyber security across theenterprise. In: SPE Middle East Intelligent Oil and Gas Conference andExhibition
Elmrabit N, Yang S-H, Yang L, Zhou H (2020) Insider threat risk prediction basedon Bayesian network. Comput Secur 96:101908. https://doi.org/10.1016/j.cose.2020.101908
Fallet-Fidry G, Weber P, Simon C, Iung B, Duval C (2012) Evidential network-basedextension of leaky Noisy-OR structure for supporting risks analyses. In: Faultdetection, supervision and safety of technical processes
Farr C, Ruggeri F, Mengersen K (2018) Prior and posterior linear pooling forcombining expert opinions: uses and impact on Bayesian networks— the caseof the wayfinding model. Entropy 20(3):209. https://doi.org/10.3390/e20030209
Greitzer FL, Kangas LJ, Noonan CF, Dalton AC (2010) Identifying at-riskemployees: a behavioral model for predicting potential insider threats. PacificNorthwest National Lab (PNNL), Richland. Retrieved from https://www.pnnl.gov/main/publications/external/technical_reports/PNNL-19665.pdf
Greitzer FL, Kangas LJ, Noonan CF, Dalton AC, Hohimer RE (2012) Identifying at-risk employees: modeling psychosocial precursors of potential insider threats.In: 2012 45th Hawaii International Conference on System Sciences
Chockalingam et al. Cybersecurity (2021) 4:29 Page 18 of 19
Hänninen M, Mazaheri A, Kujala P, Montewka J, Laaksonen P, Salmiovirta M, KlangM (2014) Expert elicitation of a navigation service implementation effects onship groundings and collisions in the Gulf of Finland. Proc Inst Mech Eng,Part O: J Risk Reliability 228(1):19–28
Herland K, Hämmäinen H, Kekolahti P (2016) Information security risk assessmentof smartphones using Bayesian networks. J Cyber Secur Mobility 4(3):65–86.https://doi.org/10.13052/jcsm2245-1439.424
Holm H, Korman M, Ekstedt M (2015) A Bayesian network model for likelihoodestimations of acquirement of critical software vulnerabilities and exploits. InfSoftw Technol 58:304–318. https://doi.org/10.1016/j.infsof.2014.07.001
Holm H, Sommestad T, Ekstedt M, NordströM L (2013) CySeMoL: a tool for cybersecurity analysis of enterprises. In: 22nd International Conference andExhibition on Electricity Distribution (CIRED 2013)
Huang Y, McMurran R, Dhadyalla G, Jones RP (2008) Probability based vehiclefault diagnosis: Bayesian network method. J Intell Manuf 19(3):301–311.https://doi.org/10.1007/s10845-008-0083-7
Husák M, Komárková J, Bou-Harb E, Čeleda P (2018) Survey of attack projection,prediction, and forecasting in cyber security. IEEE Commun Surveys Tutorials21(1):640–660
Ibrahimović S, Bajgorić N (2016) Modeling information system availability byusing Bayesian belief network approach. Interdiscip Description ComplexSyst: INDECS 14(2):125–138. https://doi.org/10.7906/indecs.14.2.2
Jacobs F (2018) Safety through machine learning applications: a safety caseanalysis (Master thesis, Delft University of Technology, Delft). Retrieved fromhttp://resolver.tudelft.nl/uuid:ce5c73ef-8ad0-426f-926e-7d7ef3e197c3
Kahn CE, Laur JJ, Carrera G (2001) A Bayesian network for diagnosis of primarybone tumors. J Digit Imaging 14(1):56–57. https://doi.org/10.1007/BF03190296
Kahn CE Jr, Roberts LM, Shaffer KA, Haddawy P (1997) Construction of a Bayesiannetwork for mammographic diagnosis of breast cancer. Comput Biol Med27(1):19–29. https://doi.org/10.1016/S0010-4825(96)00039-X
Knowles W, Prince D, Hutchison D, Disso JFP, Jones K (2015) A survey of cybersecurity management in industrial control systems. Int J Crit Infrastruct Prot9:52–80. https://doi.org/10.1016/j.ijcip.2015.02.002
Kornecki AJ, Subramanian N, Zalewski J (2013) Studying interrelationships ofsafety and security for software assurance in cyber-physical systems:approach based on Bayesian belief networks. In: 2013 Federated Conferenceon Computer Science and Information Systems
Kraaijeveld P (2005) Genierate: an interactive generator of diagnostic Bayesiannetwork models. In: 16th International Workshop on Principle Diagnosis
Kwan M, Chow K-P, Lai P, Law F, Tse H (2009) Analysis of the digital evidencepresented in the yahoo! Case. In: IFIP International Conference on DigitalForensics
Kwan M, Chow K-P, Law F, Lai P (2008) Reasoning about evidence using Bayesiannetworks. In: IFIP International Conference on Digital Forensics
Luciani D, Marchesi M, Bertolini G (2003) The role of Bayesian networks in thediagnosis of pulmonary embolism. J Thromb Haemost 1(4):698–707. https://doi.org/10.1046/j.1538-7836.2003.00139.x
Maaskant PP, Druzdzel MJ (2008) An Independence of Causal Interactions Modelfor Opposing Influences. In: 4th European workshop on probabilisticgraphical models
Martin TG, Burgman MA, Fidler F, Kuhnert PM, Low-Choy S, McBride M,Mengersen K (2012) Eliciting expert knowledge in conservation science.Conserv Biol 26(1):29–38. https://doi.org/10.1111/j.1523-1739.2011.01806.x
Milho I, Fred A (2001) A user-friendly development tool for medical diagnosisbased on Bayesian networks. In: Sharp B, Filipe J, Cordeiro J (eds) EnterpriseInformation Systems II. Springer, Dordrecht, pp 113–118. https://doi.org/10.1007/978-94-017-1427-3_16
Mo SYK, Beling PA, Crowther KG (2009) Quantitative assessment of cyber securityrisk using Bayesian network-based Model. In: 2009 Systems and InformationEngineering Design Symposium
Nakatsu RT (2009) Diagrammatic Reasoning in AI. Wiley, Hoboken. https://doi.org/10.1002/9780470400777
Nogueira HIS, Walraven M (2018) Overview storm surge barriers. Rijskwaterstaat,Deltares. Retrieved from http://www.masterpiece.dk/UploadetFiles/10852/25/Deltares_2018_Overview_storm_surge_barriers_komprimeret.pdf
Onisko A, Druzdzel MJ, Wasyluk H (1999) A Bayesian network model for diagnosisof liver disorders. In: Proceedings of the Eleventh Conference onBiocybernetics and Biomedical Engineering
Ouchi F (2004) A literature review on the use of expert opinion in probabilisticrisk analysis. World Bank Policy Research Working Paper 3201
Pappaterra MJ, Flammini F (2021) Bayesian networks for online cybersecuritythreat detection. In: Machine intelligence and big data analytics forcybersecurity applications (pp. 129-159). Springer, Cham. https://doi.org/10.1007/978-3-030-57024-8_6
Park J, Ivanov R, Weimer J, Pajic M, Lee I (2015) Sensor attack detection in thepresence of transient faults. In: Proceedings of the ACM/IEEE SixthInternational Conference on Cyber-Physical Systems
Pecchia A, Sharma A, Kalbarczyk Z, Cotroneo D, Iyer RK (2011) Identifyingcompromised users in shared computing infrastructures: a data-drivenBayesian network approach. In: 2011 IEEE 30th International Symposium onReliable Distributed Systems
RISI. (2014). German steel mill cyber attack. Retrieved from http://www.risidata.com/database/detail/german-steelmill-cyber-attack.
Samara PA, Fouskitakis GN, Sakellariou JS, Fassois SD (2008) A statistical methodfor the detection of sensor abrupt faults in aircraft control systems. IEEE TransControl Syst Technol 16(4):789–798. https://doi.org/10.1109/TCST.2007.903109
Shin J, Son H, Heo G (2015) Development of a cyber security risk model usingBayesian networks. Reliability Eng Syst Saf 134:208–217. https://doi.org/10.1016/j.ress.2014.10.006
Skopik F, Smith PD (eds) (2015) Smart grid security: innovative solutions for amodernized grid. Syngress, Boston. https://doi.org/10.1016/C2014-0-01356-1
Twala B (2009) An empirical comparison of techniques for handling incompletedata using decision trees. Appl Artif Intell 23(5):373–405. https://doi.org/10.1080/08839510902872223
Van der Gaag LC, Renooij S, Witteman CL, Aleman BM, Taal BG (2002)Probabilities for a probabilistic network: a case study in Oesophageal cancer.Artif Intell Med 25(2):123–148. https://doi.org/10.1016/S0933-3657(02)00012-X
Wang JA, Guo M (2010) Vulnerability categorization using Bayesian networks. In:Proceedings of the Sixth Annual Workshop on Cyber Security andInformation Intelligence Research
Zagorecki A (2010) Local probability distributions in Bayesian networks:knowledge elicitation and inference (Doctoral Dissertation, University ofPittsburgh, Pittsburgh). Retrieved from http://d-scholarship.pitt.edu/6542/1/Zagorecki_April_21_2010.pdf
Zhang G, Thai VV (2016) Expert elicitation and Bayesian network modeling forshipping accidents: a literature review. Saf Sci 87:53–62. https://doi.org/10.1016/j.ssci.2016.03.019
Zhao Y, Xiao F, Wang S (2013) An intelligent chiller fault detection and diagnosismethodology using Bayesian belief network. Energy Build 57:278–288.https://doi.org/10.1016/j.enbuild.2012.11.007
Zhivich M, Cunningham RK (2009) The real cost of software errors. IEEE SecurPrivacy 7(2):87–90. https://doi.org/10.1109/MSP.2009.56
Zhou Y, Zhu C, Tang L, Zhang W, Wang P (2018) Cyber security inference basedon a two-level Bayesian network framework. In: 2018 IEEE InternationalConference on Systems, Man, and Cybernetics (SMC)
Publisher’s NoteSpringer Nature remains neutral with regard to jurisdictional claims inpublished maps and institutional affiliations.
Chockalingam et al. Cybersecurity (2021) 4:29 Page 19 of 19