Embed Size (px)
Citation preview
BAYESIAN STATISTICS 9,
J. M. Bernardo, M. J. Bayarri, J. O. Berger, A. P. Dawid,
D. Heckerman, A. F. M. Smith and M. West (Eds.)c© Oxford University Press, 2010
Bayesian Methods in Pharmacovigilance
David MadiganColumbia University, U.S.A.
Patrick RyanGlaxoSmithKline Research and Development, U.S.A.
Shawn SimpsonColumbia University, U.S.A.
Ivan ZorychColumbia University, U.S.A.
Summary
Regulators such as the U.S. Food and Drug Administration have elaborate,multi-year processes for approving new drugs as safe and effective. Nonethe-less, in recent years, several approved drugs have been withdrawn from themarket because of serious and sometimes fatal side effects. We describe sta-tistical methods for post-approval data analysis that attempt to detect drugsafety problems as quickly as possible. Bayesian approaches are especiallyuseful because of the high dimensionality of the data, and, in the future, forincorporating disparate sources of information.
Keywords and Phrases: Drug safety; Shrinkage; High-dimensionalmodeling; Poisson regression.
1. INTRODUCTION
Increasing scientific, regulatory and public scrutiny focuses on the obligation ofthe medical community, pharmaceutical industry and health authorities to ensurethat marketed drugs have acceptable benefit-risk profiles. This is an intricate and
David Madigan is Professor of Statistics, Shawn Simpson is a PhD student, and Ivan Zorychis a Research Scientist, all at Columbia University. Patrick Ryan is a Research Scientist atGlaxoSmithKline.
2 D. Madigan et al.
ongoing process that begins with carefully designed randomized clinical trials priorto approval but continues after regulatory market authorization when the drug isin widespread clinical use. In the post-approval environment, surveillance schemesbased on spontaneous reporting systems (SRS) represent a cornerstone for the earlydetection of drug hazards that are novel by virtue of their clinical nature, severityand/or frequency. SRS databases collect reports of adverse events made directlyto the regulator or to the product manufacturer by clinicians or patients withoutregard to any assessment of causality. Such spontaneous report databases present anumber of well-documented limitations such as under-reporting, over-reporting, andduplicate reporting. Furthermore, SRS databases have limited temporal informationwith regard to duration of exposure and the time order of exposure and condition.
Despite the limitations inherent in SRS-based pharmacovigilance, analytic meth-ods for signal detection in spontaneous report databases have attracted considerableattention in the last decade, and several different methods have become well estab-lished, both in commercial software products and in the literature. All of the morewidely used methods compute measures of “disproportionality” for specific drug-condition pairs. That is, the methods quantify the extent to which a given conditionis disproportionally reported with a given drug. We provide a brief description ofa Bayesian shrinkage approach due to DuMouchel that has been widely adopted inthis context. More recent work has focused on Bayesian regression approaches thatattempt to deal with certain types of confounding.
Newer data sources have emerged that overcome some of the SRS limitations butpresent methodological and logistical challenges of their own. Longitudinal obser-vational databases (LODs) provide time-stamped patient-level medical information,such as periods of drug exposure and dates of diagnoses. Typical examples includemedical claims databases and electronic health record systems. The scale of someof these databases presents interesting computational challenges – the larger claimsdatabases contain upwards of 50 million lives with up to 10 years of data per life.A nascent literature on signal detection in LODs now exists including adaptationsof some of the Bayesian methods developed in the SRS context. We also considerone particular approach that draws on a method known in epidemiology as the self-controlled case series. We present a Bayesian analysis of this method and describesome generalizations.
Because our focus in this paper is on drug safety in the post-approval context,we do not consider randomized clinical trials (RCTs). While most RCTs occurprior to drug approval, it is not uncommon for pharmaceutical manufacturers toconduct post-approval trials, especially for potential new indications. Ross et al.(2009) describe one particular meta-analytic approach to drug safety analysis in theRCT context. The use of pre-approval RCTs to inform post-approval drug safetyanalyses is also beyond the scope of this paper, but the use of Bayesian methods forthis purpose seems apt.
2. DRUG SAFETY TERMINOLOGY
In what follows, we will use the term “signal.” What do we mean by a signal?The drug safety literature often uses the term signal to refer to early hints thatpoint at the possibility of novel “unintended drug effects.” Stolley (1981) defines anunintended drug effect as a noxious and unintended response to a drug in humansthat occurs at usually recommended doses. The precise definition of signal however,remains somewhat elusive. Meyboom et al. (1997) provide an eloquent discussionand settle on:
Bayesian Pharmacovigilance 3
“A set of data constituting a hypothesis that is relevant to the ratio-nal and safe use of a medicine. Such data are usually clinical, pharma-cological, pathological, or epidemiological in nature. A signal consistsof a hypothesis together with data and arguments.”
Crucially, most authors consider a signal to be more than just a statistical as-sociation. Some authors use the term “signal of disproportionate reporting” (SDR)when discussing purely statistical signals without clinical, pharmacological and/or(pharmaco)epidemiological context (Hauben et al., 2005, Hauben and Reich, 2005).In reality, most SDRs that emerge from spontaneous report databases in particularrepresent noise because the reports are associated with treatment indications (i.e.,confounding by indication), co-prescribing patterns, co-morbid illnesses, protopathicbias, channeling bias, or other reporting artifacts, or, the reported adverse eventsare already labeled or are medically trivial. In this sense, SDRs generate hypotheses.Confirmation of such hypotheses goes beyond the purview of spontaneous reportsand draws on the pharmacoepidemiologist’s extensive armamentarium. Longitudi-nal observational databases can provide a richer context in which to study drugsafety. There, signals that arise from marginal drug-condition associations mightreasonably be referred to as SDRs, but more elaborate approaches that adjust forpotential confounders, while falling short of definitively establishing causation, couldyield “signals.”
Because we focus on observational data, the potential for confounding is everpresent and indeed is the central problem in pharmacovigilance. Following Green-land and Morgenstern (2001) we view confounding as a causal concept. This is ger-mane because ultimately we want to know which drugs cause which adverse effects.Consider a population of people exposed to a particular drug D (the D population)and suppose a fraction a of these people experience an adverse effect A. Ideally wewould compare a with the fraction b of these people that would have experienced Ahad they not been exposed to D. The ratio a/b (or possibly some other function ofa and b) then measures the causal effect of D on A. In reality, b is unobserved andinstead we compare a to the fraction c of the unexposed or comparator population(the D′ population) that experienced the adverse effect. Thus we would like to havea/b but instead we work with a/c. Confounding occurs if c differs from b. In thedrug safety context this can happen in myriad scenarios including:
• Individuals in the D′ population took a drug other than D at a different ratethat the individuals in population D. This other drug increases or decreasesthe probability of A and thus increases or decreases c (relative to b).
• The condition(s) that led people in the D′ population to take the other drugmay themselves increase or decrease the probability of A (i.e., c) relative to b.
• The relative absence in the D′ population of the condition(s) that led peopleto take the target drug may causally increase or decrease the probability of A(i.e., c) relative to b.
While one can never rule out the possibility of confounding, the primary goal ofthe methods we describe is to be diminish its impact.
4 D. Madigan et al.
3. SPONTANEOUS REPORT DATABASES
Pharmaceutical companies, health authorities and drug monitoring centers use SRSdatabases for global drug safety screening. These databases comprise case reportsof suspected adverse drug reactions and/or adverse events (i.e. any medical eventcoincident with drug therapy). The precise details of each SRS differ in terms ofsize and scope, statutory reporting mandates, surveillance selectivity or intensity,and organizational structure. Prominent SRSs include the Adverse Event Report-ing System (AERs) of the United States Food and Drug Administration (FDA), theYellow Card Scheme of the Medicines and Healthcare Products Regulatory Agency(MHRA), and the international pharmacovigilance program of the World HealthOrganization (the WHO Uppsala Monitoring Center). Regulators created thesesystems to provide early warnings of possible safety problems that would be diffi-cult to detect during clinical drug development because of the power limitations,constricted range of demographics, exclusion of patients with extensive co-morbidillnesses and co-medications, and limited duration of follow-up, characteristic ofclinical trials.
Although legally required in some countries, there is de facto voluntary reportingfor all but pharmaceutical manufacturers. This introduces differential reporting ofadverse events. An extensive literature describes the factors that influence reportingbehavior – see, for example, Belton (1997) or De Bruin et al. (2002).
At the outset, drug safety professionals review individual reports and can insti-gate extensive follow-up, especially for serious events. The algorithms we discuss inthis paper in no way obviate the need for this first level of case review.
Individual records in SRS databases typically include limited demographic in-formation (age and sex), date of report, one or more drugs and one or more adverseevent codes. The adverse event codes typically come from a standardized vocabu-lary such as MedDRA. One of the drugs may be labeled as ”suspect” but we ignorethis in what follows. Since there over 10,000 entries in MedDRA and over 10,000licensed drugs (at least in the U.S.), one can think of each record as a vector withover 20,000 dimensions, albeit a sparse vector. Since SRS databases only containreports of adverse effects, they fail to provide a denominator, i.e., the number ofindividuals consuming a particular drug.
3.1. Disproportionality Methods
Disproportionality analysis methods for drug safety surveillance comprise the mostwidely used class of analytic methods for signal detection in SRSs. These methodsinclude the DuMouchel’s Bayesian multi-item gamma-Poisson shrinker (MGPS), theBayesian confidence propagation neural network (BCPNN), proportional reportingratios (PRR), and reporting odds ratios (ROR). The methods search SRS databasesfor potential signals, focusing on low-dimensional projections of the data, specifically2-dimensional contingency tables. Table 1 shows a typical table.
Table 1: A fictitious 2-dimensional projection of an SRS database.
AEj=Yes AEj=No TotalDrugi=Yes w00 = 20 w01 = 100 120Drugi=No w10 = 100 w11 = 980 1080
The basic task of a disproportionality method then is to rank order these tables
Bayesian Pharmacovigilance 5
in order of “interestingness.” Different disproportionality methods focus on differentstatistical measures of association as their measure of interestingness. MGPS focuseson the “reporting ratio” (RR). The observed RR for the drug i - adverse event jcombination is the observed number of occurrences of the combination (20 in theexample above) divided by the expected number of occurrences under a model ofindependence (12 in the example above). Thus the observed RR for this example is20/12 or 1 2/3; this combination occurred about 67% more often than expected.
Natural (though not necessarily unbiased) estimates of various quantities emergefrom tables like Table 1. Table 2 lists the measures of association in common use.
Table 2: Common measures of association for 2X2 tables in SRS analysis.
Measure of Association Probabilistic Interpretation
Reporting Ratio (RR)Pr(AE|DrugPr(AE)
Proportional Reporting Ratio (PRR)Pr(AE|Drug)Pr(AE|notDrug
Reporting Odds Ratio (ROR)Pr(AE|Drug)/Pr(notAE|Drug)
Pr(AE|notDrug)/Pr(notAE|notDrug)Information Component (IC) log2
Pr(AE|Drug)Pr(AE)
In the SRS context, however, the count in the w00 cell is often small, leading tosubstantial variability (and hence uncertainty about the true value of the measureof association) despite the often large numbers of reports overall. PRR and RORdo not address the variability issue whereas MGPS and BCPNN adopt a Bayesianapproach to address the issue.
MGPS and its predecessor GPS (DuMouchel, 1999; DuMouchel and Pregibon,2001) are the most widely used methods and they provide a singular example oflarge-scale Bayesian shrinkage in routine use by regulators and pharmaceutical man-ufacturers worldwide. GPS proceeds as follows. Let w00(i, j) denote the w00 en-try for the two-by-two table for the ith drug and the jth adverse event. Assumethat each w00(i, j) is a draw from a Poisson distribution with mean m(i, j). Letm(i, j) = λ(i, j) ∗ E(i, j), where E(i, j) = w0+(i, j) ∗ w+1(i, j)/w++(i, j), i.e., theexpected value of w00(i, j) under independence, and is assumed to be known. Thegoal is to estimate the λ’s. GPS assumes that the λ’s arise a particular 5-parameterprior distribution, namely a mixture of two gamma distributions. GPS adopts anempirical Bayes approach and chooses the five hyperparameters to maximize themarginal likelihood. Commonly reported summary statistics include the geometricmean of the posterior distribution for each λ or the fifth percentile of the posterior(“EBGM” and “EB05” respectively). For further details see DuMouchel (1999).
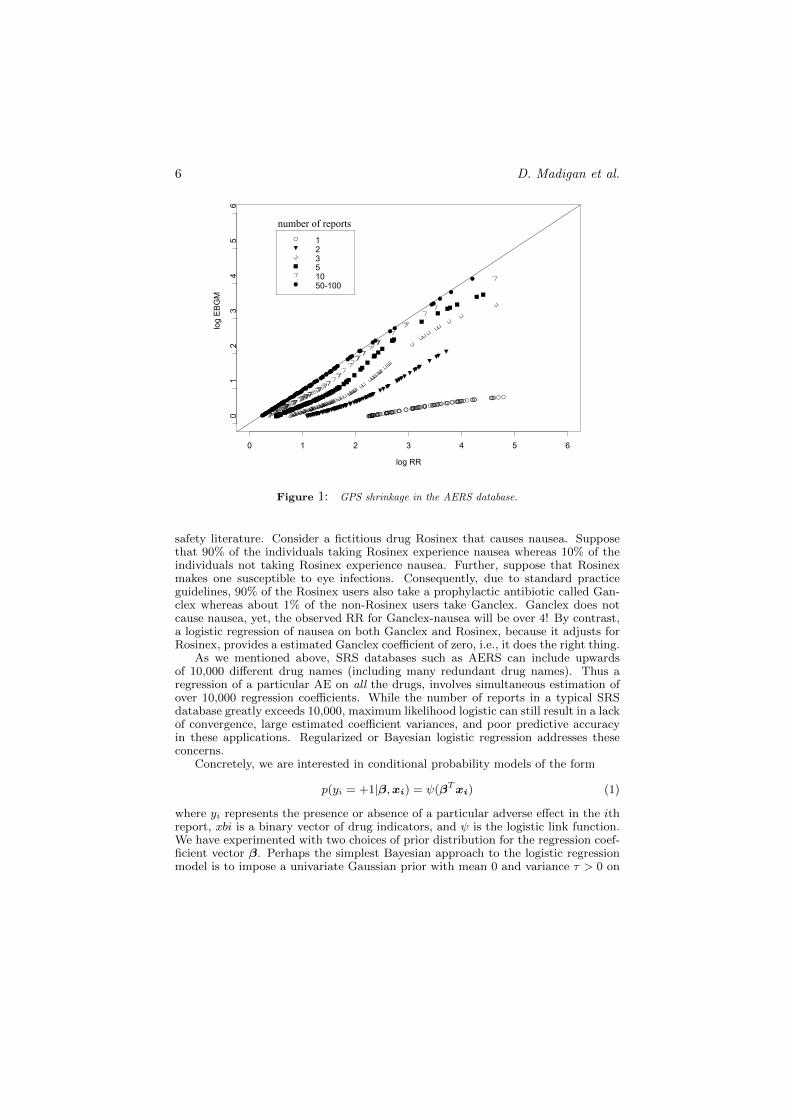
Figure 1 illustrates the effect of the shrinkage for a sample of 2X2 tables in AERS.Each point represents a particular drug-adverse effect combination and shows theEBGM estimate versus the observed RR, both on the log scale. Tables where w00 =1, i.e., drug-adverse effect combinations with a single report in AERS (denoted bythe open circles), shrink substantially whereas tables with w00 of say 50 and above(denoted by the solid circles) hardly shrink at all.
3.2. Bayesian Logistic Regression
Disproportionality analyses typically stratify by age, sex, and year of report butotherwise provide no protection against confounding. One particular kind of con-founding risk has come to be known as the “innocent bystander” effect in the drug
6 D. Madigan et al.
log RR
log EBGM
0 1 2 3 4 5 6
01
23
45
612351050-100
number of reports
Figure 1: GPS shrinkage in the AERS database.
safety literature. Consider a fictitious drug Rosinex that causes nausea. Supposethat 90% of the individuals taking Rosinex experience nausea whereas 10% of theindividuals not taking Rosinex experience nausea. Further, suppose that Rosinexmakes one susceptible to eye infections. Consequently, due to standard practiceguidelines, 90% of the Rosinex users also take a prophylactic antibiotic called Gan-clex whereas about 1% of the non-Rosinex users take Ganclex. Ganclex does notcause nausea, yet, the observed RR for Ganclex-nausea will be over 4! By contrast,a logistic regression of nausea on both Ganclex and Rosinex, because it adjusts forRosinex, provides a estimated Ganclex coefficient of zero, i.e., it does the right thing.
As we mentioned above, SRS databases such as AERS can include upwardsof 10,000 different drug names (including many redundant drug names). Thus aregression of a particular AE on all the drugs, involves simultaneous estimation ofover 10,000 regression coefficients. While the number of reports in a typical SRSdatabase greatly exceeds 10,000, maximum likelihood logistic can still result in a lackof convergence, large estimated coefficient variances, and poor predictive accuracyin these applications. Regularized or Bayesian logistic regression addresses theseconcerns.
Concretely, we are interested in conditional probability models of the form
p(yi = +1|β,xi) = ψ(βTxi) (1)
where yi represents the presence or absence of a particular adverse effect in the ithreport, xbi is a binary vector of drug indicators, and ψ is the logistic link function.We have experimented with two choices of prior distribution for the regression coef-ficient vector β. Perhaps the simplest Bayesian approach to the logistic regressionmodel is to impose a univariate Gaussian prior with mean 0 and variance τ > 0 on
Bayesian Pharmacovigilance 7
each parameter βj . Finding the maximum a posteriori (MAP) estimate of β withthis prior is equivalent to ridge regression for the logistic model (Santner and Duffy1989; Le Cessie and Van Houwelingen 1992). Alternatively, a sparseness inducinghierarchical prior distribution for β gives each βj a Gaussian prior with mean 0 andvariance τj and then an exponential prior on the τj ’s:
p(τj |γ) =γj2
exp(−γj2τj). (2)
with γ > 0. Integrating out τj then gives a (nonhierarchical) double exponentialor Laplace prior distribution. MAP estimation in this context corresponds to thewell-known lasso (Tibshirani, 1995).
Computing the full posterior distribution for β is computationally demandingand even efficiently calculating the posterior mode requires some care. We use acyclic coordinate ascent algorithm described in Genkin et al. (2007) and imple-mented in the open source BXR software1. Yuan et al. (2010) provide a review ofrelated methods and software.
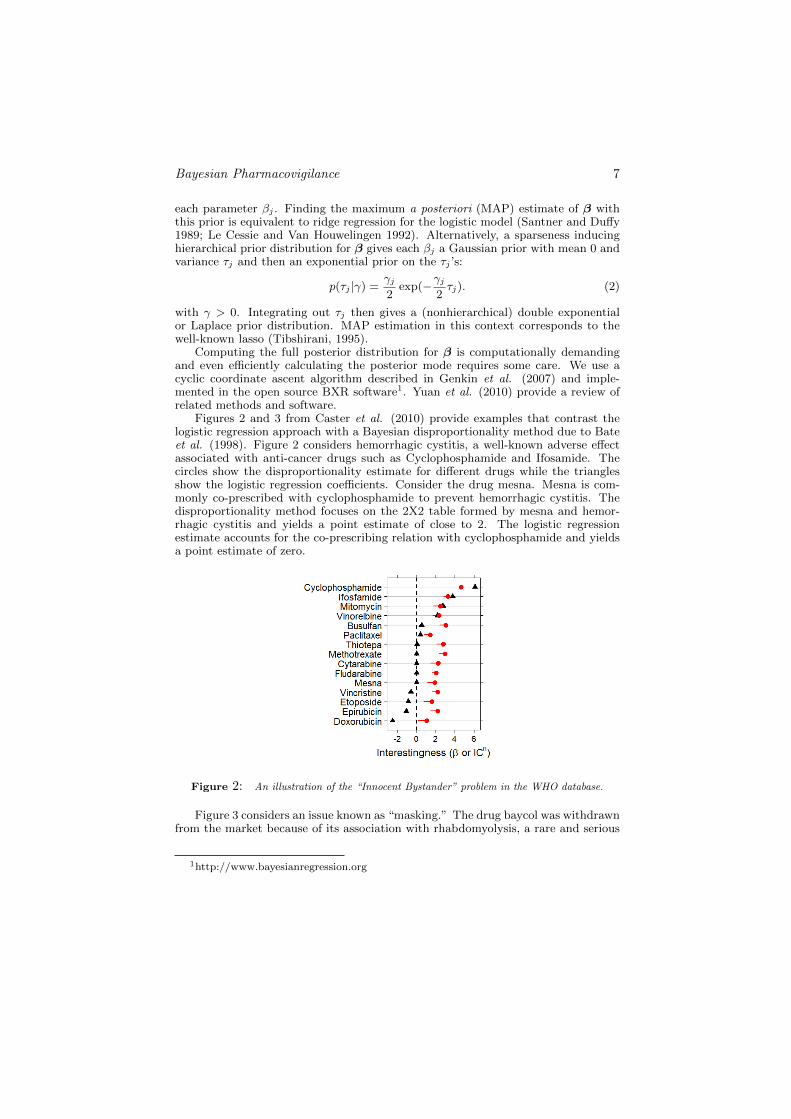
Figures 2 and 3 from Caster et al. (2010) provide examples that contrast thelogistic regression approach with a Bayesian disproportionality method due to Bateet al. (1998). Figure 2 considers hemorrhagic cystitis, a well-known adverse effectassociated with anti-cancer drugs such as Cyclophosphamide and Ifosamide. Thecircles show the disproportionality estimate for different drugs while the trianglesshow the logistic regression coefficients. Consider the drug mesna. Mesna is com-monly co-prescribed with cyclophosphamide to prevent hemorrhagic cystitis. Thedisproportionality method focuses on the 2X2 table formed by mesna and hemor-rhagic cystitis and yields a point estimate of close to 2. The logistic regressionestimate accounts for the co-prescribing relation with cyclophosphamide and yieldsa point estimate of zero.
Figure 2: An illustration of the “Innocent Bystander” problem in the WHO database.
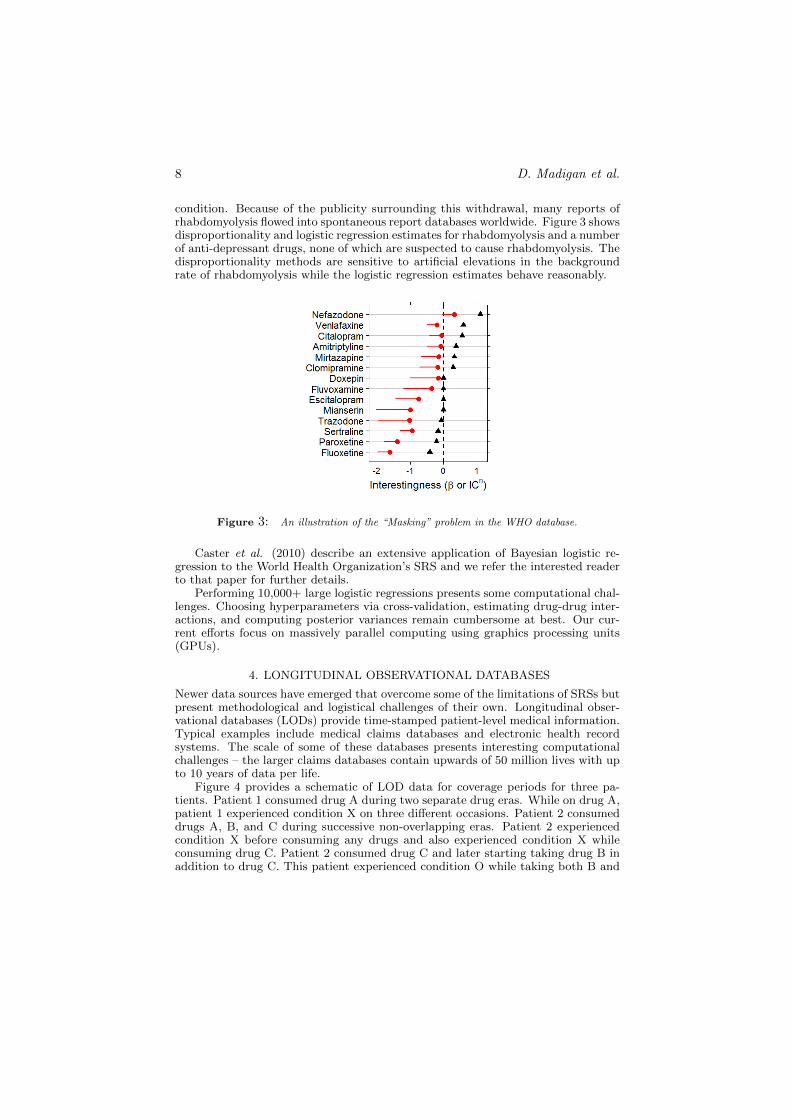
Figure 3 considers an issue known as “masking.” The drug baycol was withdrawnfrom the market because of its association with rhabdomyolysis, a rare and serious
1http://www.bayesianregression.org
8 D. Madigan et al.
condition. Because of the publicity surrounding this withdrawal, many reports ofrhabdomyolysis flowed into spontaneous report databases worldwide. Figure 3 showsdisproportionality and logistic regression estimates for rhabdomyolysis and a numberof anti-depressant drugs, none of which are suspected to cause rhabdomyolysis. Thedisproportionality methods are sensitive to artificial elevations in the backgroundrate of rhabdomyolysis while the logistic regression estimates behave reasonably.
Figure 3: An illustration of the “Masking” problem in the WHO database.
Caster et al. (2010) describe an extensive application of Bayesian logistic re-gression to the World Health Organization’s SRS and we refer the interested readerto that paper for further details.
Performing 10,000+ large logistic regressions presents some computational chal-lenges. Choosing hyperparameters via cross-validation, estimating drug-drug inter-actions, and computing posterior variances remain cumbersome at best. Our cur-rent efforts focus on massively parallel computing using graphics processing units(GPUs).
4. LONGITUDINAL OBSERVATIONAL DATABASES
Newer data sources have emerged that overcome some of the limitations of SRSs butpresent methodological and logistical challenges of their own. Longitudinal obser-vational databases (LODs) provide time-stamped patient-level medical information.Typical examples include medical claims databases and electronic health recordsystems. The scale of some of these databases presents interesting computationalchallenges – the larger claims databases contain upwards of 50 million lives with upto 10 years of data per life.
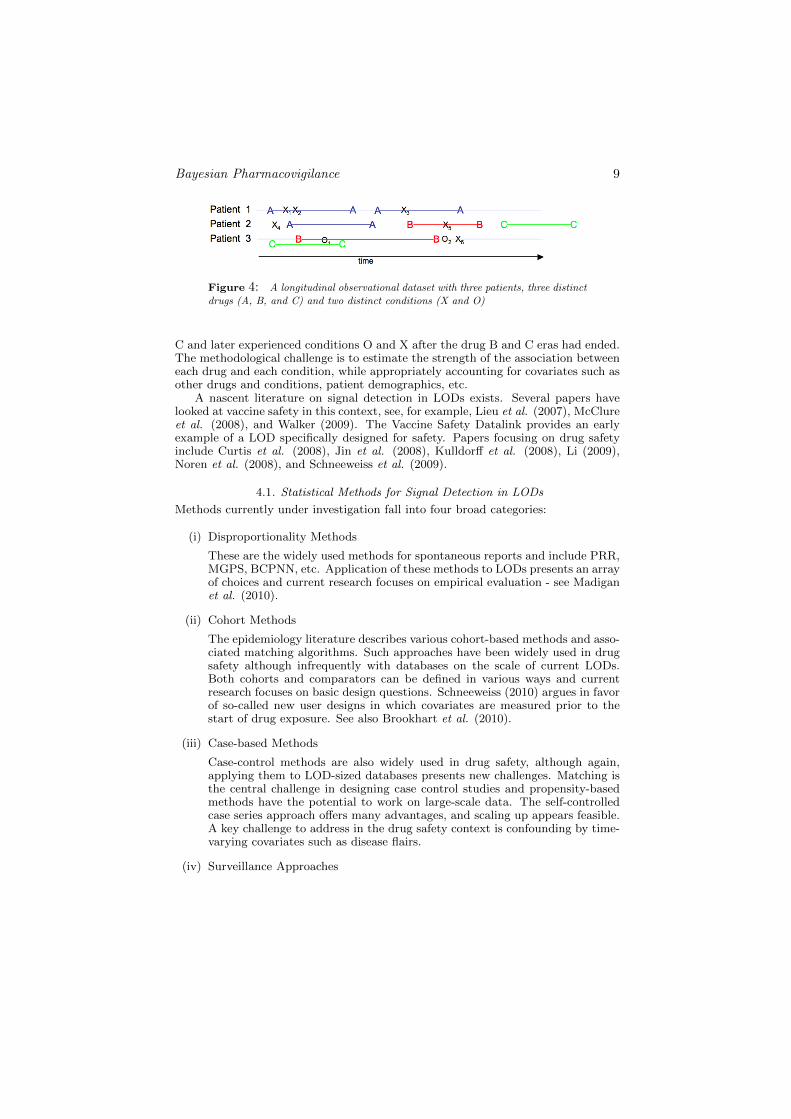
Figure 4 provides a schematic of LOD data for coverage periods for three pa-tients. Patient 1 consumed drug A during two separate drug eras. While on drug A,patient 1 experienced condition X on three different occasions. Patient 2 consumeddrugs A, B, and C during successive non-overlapping eras. Patient 2 experiencedcondition X before consuming any drugs and also experienced condition X whileconsuming drug C. Patient 2 consumed drug C and later starting taking drug B inaddition to drug C. This patient experienced condition O while taking both B and
Bayesian Pharmacovigilance 9
Figure 4: A longitudinal observational dataset with three patients, three distinctdrugs (A, B, and C) and two distinct conditions (X and O)
C and later experienced conditions O and X after the drug B and C eras had ended.The methodological challenge is to estimate the strength of the association betweeneach drug and each condition, while appropriately accounting for covariates such asother drugs and conditions, patient demographics, etc.
A nascent literature on signal detection in LODs exists. Several papers havelooked at vaccine safety in this context, see, for example, Lieu et al. (2007), McClureet al. (2008), and Walker (2009). The Vaccine Safety Datalink provides an earlyexample of a LOD specifically designed for safety. Papers focusing on drug safetyinclude Curtis et al. (2008), Jin et al. (2008), Kulldorff et al. (2008), Li (2009),Noren et al. (2008), and Schneeweiss et al. (2009).
4.1. Statistical Methods for Signal Detection in LODs
Methods currently under investigation fall into four broad categories:
(i) Disproportionality Methods
These are the widely used methods for spontaneous reports and include PRR,MGPS, BCPNN, etc. Application of these methods to LODs presents an arrayof choices and current research focuses on empirical evaluation - see Madiganet al. (2010).
(ii) Cohort Methods
The epidemiology literature describes various cohort-based methods and asso-ciated matching algorithms. Such approaches have been widely used in drugsafety although infrequently with databases on the scale of current LODs.Both cohorts and comparators can be defined in various ways and currentresearch focuses on basic design questions. Schneeweiss (2010) argues in favorof so-called new user designs in which covariates are measured prior to thestart of drug exposure. See also Brookhart et al. (2010).
(iii) Case-based Methods
Case-control methods are also widely used in drug safety, although again,applying them to LOD-sized databases presents new challenges. Matching isthe central challenge in designing case control studies and propensity-basedmethods have the potential to work on large-scale data. The self-controlledcase series approach offers many advantages, and scaling up appears feasible.A key challenge to address in the drug safety context is confounding by time-varying covariates such as disease flairs.
(iv) Surveillance Approaches
10 D. Madigan et al.
All of the above methods estimate an effect size relating a drug (or group ofdrugs) to a medical outcome. As such these can be used in a surveillancecontext - the effect size is recomputed as new data arrive and a surveillancealgorithm triggers an alarm when certain temporal patterns emerge. Standardsurveillance techniques include SPRT, CUSUM, and hidden Markov models.
The next section describes one particular case-based method in detail.
5. THE SELF-CONTROLLED CASE SERIES METHOD
Farrington (1995) proposed the self-controlled case series (SCCS) method in orderto estimate the relative incidence of adverse events to assess vaccine safety. Themajor features of SCCS are that (1) it automatically controls for fixed individualbaseline covariates, and (2) only cases (individuals with at least one event) need tobe included in the analysis. With SCCS, each individual serves as their own control.
SCCS is one of several self-controlled methods that the epidemiology literaturedescribes, many of which are variants on the case-crossover method (Maclure, 1991).However unlike the case-crossover method, which requires the choice of a compara-tor time period to serve as a control, SCCS makes use of all available temporalinformation without the need for selection.
Epidemiological applications of SCCS tend to focus on situations with smallsample sizes and few exposure variables of interest. In contrast, the problem of drugsafety surveillance in LODs must contend with millions of individuals and millions ofpotential drug exposures. The size of the problem presents a major computationalchallenge – ensuring the availability of an efficient optimization procedure is essentialfor a feasible implementation.
5.1. One drug, one adverse event
We will first focus on the case where there is one drug (e.g. Vioxx) and one adverseevent (e.g. myocardial infarction, MI) of interest.
To set up the notation, i will index individuals from 1 to N . Events and expo-sures in our databases are recorded with dates, so temporal information is availabledown to the level of days (indexed by d). Let τi be the number of days that personi is observed, with (i,d) being their dth day of observation. The number of eventson day (i,d) is denoted by yid, and drug exposure is indicated by xid, where xid = 1if i is exposed to the drug on (i,d), and 0 otherwise.
SCCS assumes that AEs arise according to a non-homogeneous Poisson process,where the underlying event rate is modulated by drug exposure. We will start withthe simple assumption that person i has their own individual baseline event rateeφi , which is constant over time. Under the SCCS model, drug exposure yields amultiplicative effect of eβ on the baseline incidence rate. In other words, the eventintensity for person i on day d can be written as a function of drug exposure xid.
λid = eφi+βxid
The number of events observed on (i,d) given the current exposure status isdistributed as a Poisson random variable with rate λid, which has the followingdensity:
P (yid | xid) =e−λidλ
yidid
yid!
Bayesian Pharmacovigilance 11
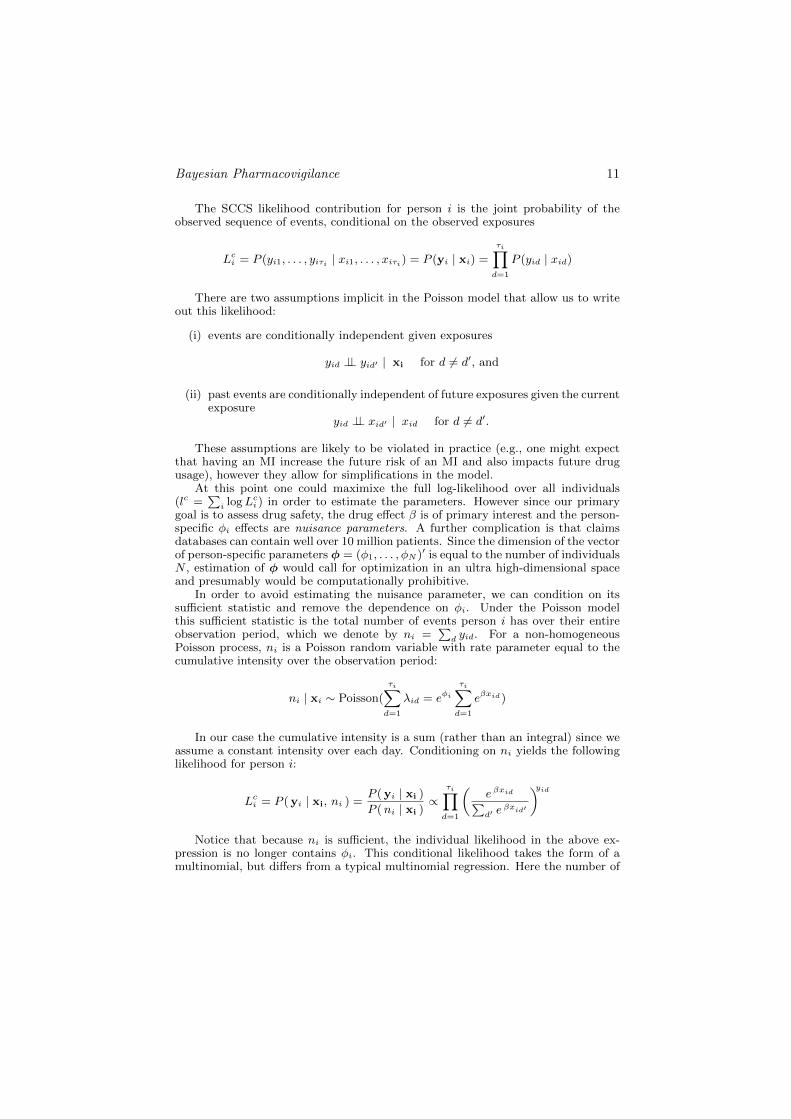
The SCCS likelihood contribution for person i is the joint probability of theobserved sequence of events, conditional on the observed exposures
Lci = P (yi1, . . . , yiτi | xi1, . . . , xiτi) = P (yi | xi) =
τi∏d=1
P (yid | xid)
There are two assumptions implicit in the Poisson model that allow us to writeout this likelihood:
(i) events are conditionally independent given exposures
yid ⊥⊥ yid′ | xi for d 6= d′, and
(ii) past events are conditionally independent of future exposures given the currentexposure
yid ⊥⊥ xid′ | xid for d 6= d′.
These assumptions are likely to be violated in practice (e.g., one might expectthat having an MI increase the future risk of an MI and also impacts future drugusage), however they allow for simplifications in the model.
At this point one could maximixe the full log-likelihood over all individuals(lc =
∑i logLci ) in order to estimate the parameters. However since our primary
goal is to assess drug safety, the drug effect β is of primary interest and the person-specific φi effects are nuisance parameters. A further complication is that claimsdatabases can contain well over 10 million patients. Since the dimension of the vectorof person-specific parameters φ = (φ1, . . . , φN )′ is equal to the number of individualsN , estimation of φ would call for optimization in an ultra high-dimensional spaceand presumably would be computationally prohibitive.
In order to avoid estimating the nuisance parameter, we can condition on itssufficient statistic and remove the dependence on φi. Under the Poisson modelthis sufficient statistic is the total number of events person i has over their entireobservation period, which we denote by ni =
∑d yid. For a non-homogeneous
Poisson process, ni is a Poisson random variable with rate parameter equal to thecumulative intensity over the observation period:
ni | xi ∼ Poisson(
τi∑d=1
λid = eφi
τi∑d=1
eβxid)
In our case the cumulative intensity is a sum (rather than an integral) since weassume a constant intensity over each day. Conditioning on ni yields the followinglikelihood for person i:
Lci = P (yi | xi, ni ) =P (yi | xi )
P (ni | xi )∝
τi∏d=1
(e βxid∑d′ e
βxid′
)yidNotice that because ni is sufficient, the individual likelihood in the above ex-
pression is no longer contains φi. This conditional likelihood takes the form of amultinomial, but differs from a typical multinomial regression. Here the number of
12 D. Madigan et al.
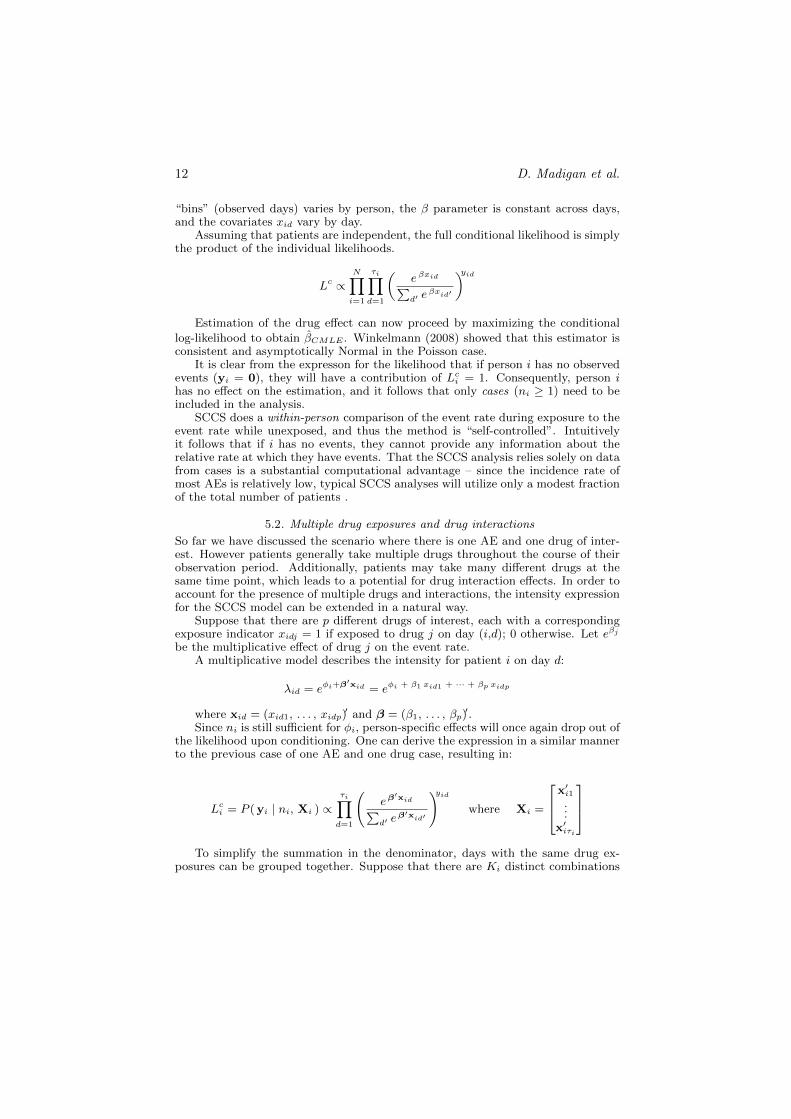
“bins” (observed days) varies by person, the β parameter is constant across days,and the covariates xid vary by day.
Assuming that patients are independent, the full conditional likelihood is simplythe product of the individual likelihoods.
Lc ∝N∏i=1
τi∏d=1
(e βxid∑d′ e
βxid′
)yidEstimation of the drug effect can now proceed by maximizing the conditional
log-likelihood to obtain βCMLE . Winkelmann (2008) showed that this estimator isconsistent and asymptotically Normal in the Poisson case.
It is clear from the expresson for the likelihood that if person i has no observedevents (yi = 0), they will have a contribution of Lci = 1. Consequently, person ihas no effect on the estimation, and it follows that only cases (ni ≥ 1) need to beincluded in the analysis.
SCCS does a within-person comparison of the event rate during exposure to theevent rate while unexposed, and thus the method is “self-controlled”. Intuitivelyit follows that if i has no events, they cannot provide any information about therelative rate at which they have events. That the SCCS analysis relies solely on datafrom cases is a substantial computational advantage – since the incidence rate ofmost AEs is relatively low, typical SCCS analyses will utilize only a modest fractionof the total number of patients .
5.2. Multiple drug exposures and drug interactions
So far we have discussed the scenario where there is one AE and one drug of inter-est. However patients generally take multiple drugs throughout the course of theirobservation period. Additionally, patients may take many different drugs at thesame time point, which leads to a potential for drug interaction effects. In order toaccount for the presence of multiple drugs and interactions, the intensity expressionfor the SCCS model can be extended in a natural way.
Suppose that there are p different drugs of interest, each with a correspondingexposure indicator xidj = 1 if exposed to drug j on day (i,d); 0 otherwise. Let eβj
be the multiplicative effect of drug j on the event rate.A multiplicative model describes the intensity for patient i on day d:
λid = eφi+β′xid = eφi + β1 xid1 + ··· + βp xidp
where xid = (xid1, . . . , xidp)′ and β = (β1, . . . , βp)
′.Since ni is still sufficient for φi, person-specific effects will once again drop out of
the likelihood upon conditioning. One can derive the expression in a similar mannerto the previous case of one AE and one drug case, resulting in:
Lci = P (yi | ni, Xi ) ∝τi∏d=1
(eβ
′xid∑d′ e
β′xid′
)yidwhere Xi =
x′i1...
x′iτi
To simplify the summation in the denominator, days with the same drug ex-
posures can be grouped together. Suppose that there are Ki distinct combinations
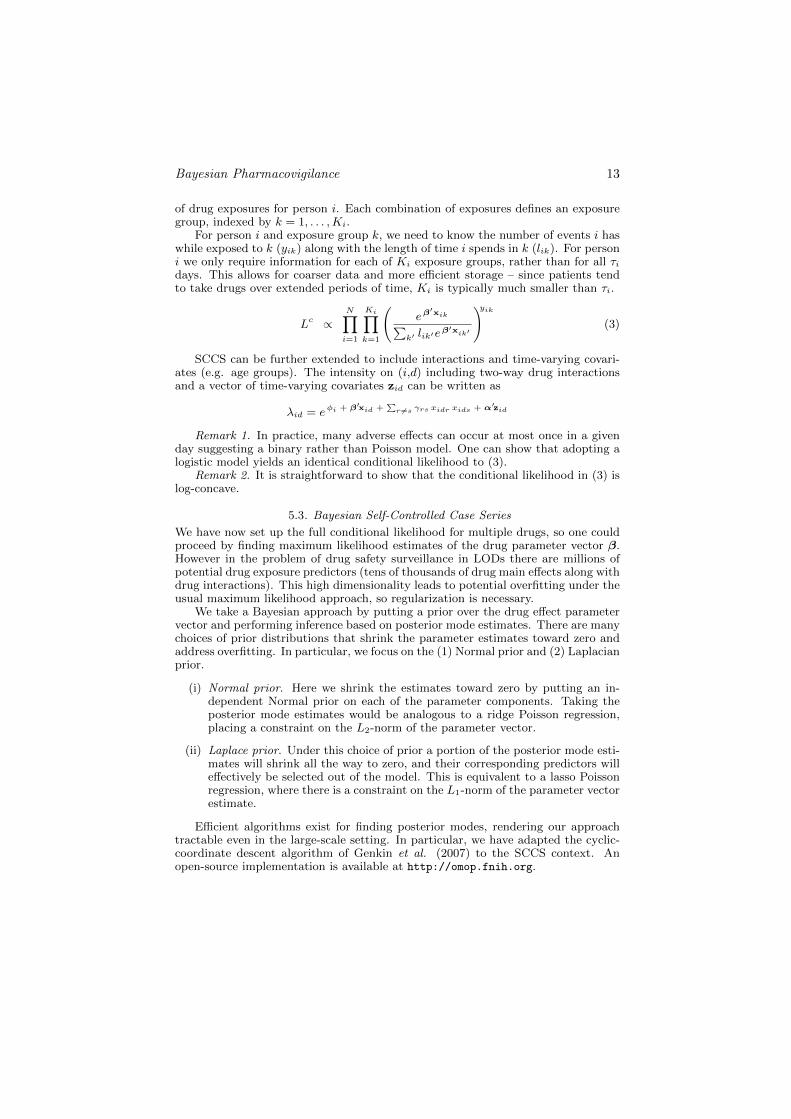
Bayesian Pharmacovigilance 13
of drug exposures for person i. Each combination of exposures defines an exposuregroup, indexed by k = 1, . . . ,Ki.
For person i and exposure group k, we need to know the number of events i haswhile exposed to k (yik) along with the length of time i spends in k (lik). For personi we only require information for each of Ki exposure groups, rather than for all τidays. This allows for coarser data and more efficient storage – since patients tendto take drugs over extended periods of time, Ki is typically much smaller than τi.
Lc ∝N∏i=1
Ki∏k=1
(eβ
′xik∑k′ lik′e
β′xik′
)yik(3)
SCCS can be further extended to include interactions and time-varying covari-ates (e.g. age groups). The intensity on (i,d) including two-way drug interactionsand a vector of time-varying covariates zid can be written as
λid = eφi + β′xid +∑
r 6=s γrs xidr xids + α′zid
Remark 1. In practice, many adverse effects can occur at most once in a givenday suggesting a binary rather than Poisson model. One can show that adopting alogistic model yields an identical conditional likelihood to (3).
Remark 2. It is straightforward to show that the conditional likelihood in (3) islog-concave.
5.3. Bayesian Self-Controlled Case Series
We have now set up the full conditional likelihood for multiple drugs, so one couldproceed by finding maximum likelihood estimates of the drug parameter vector β.However in the problem of drug safety surveillance in LODs there are millions ofpotential drug exposure predictors (tens of thousands of drug main effects along withdrug interactions). This high dimensionality leads to potential overfitting under theusual maximum likelihood approach, so regularization is necessary.
We take a Bayesian approach by putting a prior over the drug effect parametervector and performing inference based on posterior mode estimates. There are manychoices of prior distributions that shrink the parameter estimates toward zero andaddress overfitting. In particular, we focus on the (1) Normal prior and (2) Laplacianprior.
(i) Normal prior. Here we shrink the estimates toward zero by putting an in-dependent Normal prior on each of the parameter components. Taking theposterior mode estimates would be analogous to a ridge Poisson regression,placing a constraint on the L2-norm of the parameter vector.
(ii) Laplace prior. Under this choice of prior a portion of the posterior mode esti-mates will shrink all the way to zero, and their corresponding predictors willeffectively be selected out of the model. This is equivalent to a lasso Poissonregression, where there is a constraint on the L1-norm of the parameter vectorestimate.
Efficient algorithms exist for finding posterior modes, rendering our approachtractable even in the large-scale setting. In particular, we have adapted the cyclic-coordinate descent algorithm of Genkin et al. (2007) to the SCCS context. Anopen-source implementation is available at http://omop.fnih.org.
14 D. Madigan et al.
6. EXTENSIONS TO THE BAYESIAN SCCS MODEL
We are currently exploring several extensions to the basic model.
(i) Hierarchical model: Drugs. Drugs form drug classes. For example, Vioxx is aCox-2 inhibitor. Cox-2 inhibitors in turn are non-steroidal anti-inflammatories.A natural extension assumes regression coefficients for drugs from within asingle class arise exchangeably from a common prior distribution. This hier-archy could extend to multiple levels.
(ii) Hierarchical model: AEs. AEs also form AE classes. For example, an MI isa cardiovascular thrombotic (CVT) event, a class that includes, for example,ischemic stroke and unstable angina. In turn, CVT events belong to a broaderclass of cardiovascular events. This extension assumes that the regressioncoefficients for a particular drug but for different AEs within a class arise froma common prior distribution. Again this hierarchy could extend to multiplelevels.
(iii) Relaxing the Independence Assumptions: Events. Farrington and Hocine(2010) explore one particular approach to allowing for event dependence al-though other approaches are possible.
(iv) Relaxing the Independence Assumptions: Exposures. As discussed above, theSCCS model assumes that events are conditionally independent of subsequentexposures. Farrington et al. (2009) present a relaxation of this assumptionbased on an estimating equations approach. Roy et al. (2006) present analternative approach.
7. DISCUSSION
We have described statistical methods for post-approval drug safety signal detec-tion, some Bayesian and some not. In the spontaneous report context, Bayesianmethods offer significant advantages and represent the de facto standard approachworldwide. Considerable attention now focuses on large-scale longitudinal observa-tional databases and basic research on methods for signal detection in that contextis underway. When dealing with large numbers of drug-adverse effect combinations,the great success of the Bayesian approach on the SRS context should extend to theLOD context.
Real-life LODs are noisy and have the potential to introduce all sorts of artifactsand biases into analyses. For example, conditions and the drugs prescribed to treatthe conditions are often recorded simultaneously at a single visit to the doctor, eventhough the condition actually predated the visit. This can introduce “confoundingby indication” - the drug used to treat a condition can appear to be caused by thecondition. Many such challenges exist and it remains to be seen whether or not falsepositives will render signal detection in LODs impractical.
The use of LODs to study specific drug-adverse effect combinations has becomeroutine. The medical literature provides many examples and many different epidemi-ological and statistical approaches, often tailored to the specific drug and specificadverse effect. For example some adverse effects occur immediately following drugingestion while other may take months or even years to exhibit themselves - clearlythis has methodological implications. Our focus, however, is on signal detection,and this implicitly requires simultaneous consideration of many drug-adverse effects
Bayesian Pharmacovigilance 15
combinations. A major outstanding challenge is develop approaches that flexiblyadapt to different contexts.
The Observational Methods Outcomes Partnership (OMOP, http://omop.fnih.org)is an international public-private partnership between the pharmaceutical industryand the FDA. OMOP is implementing and evaluating methods for signal detectionin LODs. Open source software for many of the methods mentioned above areavailable on the OMOP website.
A key practical barrier in pharmacovigilance research is the dearth of groundtruth judgments - drug-condition pairs known to be causal or non-causal. OMOPis developing simulators to generate high-fidelity longitudinal medical records. Theproject is in its early stages (and a simulator written in R is available on the OMOPwebsite) but has the potential to transform pharmacovigilance research.
REFERENCES
Bate, A., Lindquist, M., Edwards, I.R., Olsson, S., Orre, R., Lansner, A., and De Freitas,R.M. (1998), A Bayesian neural network method for adverse drug reaction signalgeneration, European Journal of Clinical Pharmacology, 54, 315–321.
Belton, K. J. (1997). Attitude survey of adverse drug-reaction reporting by health careprofessionals across the European Union. European Journal of Clinical Pharmacology,52, 423–427.
Brookhart, M.A., Sturmer, T., Glynn, R.J., Rassen, J., and Schneeweiss, S. (2010).Confounding control in healthcare database research: challenges and potentialapproaches. Medical Care, 48, S114–S120.
Brown, J. S., M. Kulldorff, et al. (2009). Early adverse drug event signal detection withinpopulation-based health networks using sequential methods: key methodologicconsiderations. Pharmacoepidemiology and Drug Safety DOI: 10.1002/pds.1706.
Cameron, A. C and Trivedi, P. K (1988). Regression Analysis of Count Data. Cambridge:University Press.
Caster, O., Noren, G. N., Madigan, D., and Bate, A. (2010). Large-ScaleRegression-Based Pattern Discovery: The Example of Screening the WHO GlobalDrug Safety Database. Statistical Anaysis and Data Mining, 3, 197–208.
Curtis, J. R., Cheng, H., Delzell, E., Fram, D., Kilgore, M., Saag, K., Yun, H., andDuMouchel, W. (2008). Adaptation of Bayesian data mining algorithms tolongitudinal claims data. Medical Care, 46, 969-975.
De Bruin, M. L., Van Puijenbroek, E. P., Egberts, A. C., Hoes, A. W., and Leufkens,H. G. (2002) Non-sedating antihistamine drugs and cardiac arrhythmias – biased riskestimates from spontaneous reporting systems? British Journal of ClinicalPharmacology, 53, 370–374
DuMouchel, W (1999). Bayesian data mining in large frequency tables, with anapplication to the FDA spontaneous reporting system. Amer. Statist. 53, 170–190.
DuMouchel, W. and Pregibon, D. (2001). Empirical Bayes screening for multi-itemassociations. In: In: Proceedings of the Seventh International Conference onKnowledge Discovery and Data Mining SIGKDD 2001, 67–76.
Farrington, P. (1995). Relative incidence estimation from case series for vaccine safetyevaluation. Biometrics 51, 228–235.
Farrington, C. P., Whitaker, H. J. and Hocine, M. N. (2009). Case series analysis forcensored, perturbed or curtailed post-event exposures. Biostatistics, 10, 3–16.
Farrington, P. and Hocine, M.N. (2010). Within-individual dependence in self-controlledcase series models for recurrent events. Appl. Statist. 59, 457–475.
Genkin, A., Lewis, D. D., and Madigan, D. (2007) Large-scale Bayesian logistic regressionfor text categorization,Technometrics 49, 291–304.
16 D. Madigan et al.
Greenland, S. and Morgenstern, H. (2001). Confounding in health research. AnnualReview of Public Health, 22 189–212.
Hauben, M., Madigan, D., Gerrits, C., and Meyboom, R. (2005). The role of data miningin pharmacovigilance. Expert Opinion in Drug Safety, 4(5), 929–948.
Hauben, M. and Reich, J. (2005). Communication of findings in pharmacovigilance: use ofterm“signal” and the need for precision in its use. European Journal of ClinicalPharmacology, 61, 479–480.
Jin, H., Chen, J., He, H., Williams, G.J., Kelman, C., and OKeefe, C.M. (2008). Miningunexpected temporal associations: Applications in detecting adverse drug reactions.IEEE Transactions on Information Technology in Biomedicine, 12, 488–500.
Kulldorff, M., Davis, R.L., Kolczak, M., Lewis, E., Lieu, T., and Platt, R. (2008). Amaximized sequential probability ratio test for drug and vaccine safety surveillance.Preprint.
le Cessie, S. and van Houwelingen, J. C. (1997). Ridge Estimators in Logistic Regression,Appl. Statist. 41, 191–201.
Li, L. (2009). A conditional sequential sampling procedure for drug safety surveillance.Statistics in Medicine. DOI:10.1002/sim.3689
Lieu, T.A., Kulldorff, M., Davis, R.L., Lewis, E.M., Weintraub, E., Yih, K., Yin, R.,Brown, J.S., and Platt, R. (2007). Real-time vaccine safety surveillance for the earlydetection of adverse events. Medical Care, 45, S89–95.
Maclure, M. (1991). The Case-Crossover Design: A Method for Studying Transient Effectson the Risk of Acute Events. American Journal of Epidemiology, 133, 144–153.
Madigan, D., Bate, A., Zorych, I. and Ryan, P. (2010). Disproportionality Methods forPharmacovigilance in Longitudinal Observational Databases. Submitted.
McClure, D. L., Glanz, J. M., Xu, S., Hambidge, S. J., Mullooly, J. P., and Baggs, J.(2008). Comparison of epidemiologic methods for active surveillance of vaccine safety.Vaccine, doi:10:1016/j.vaccine.2008.03.074.
Meyboom, R.H., Egberts, A.C., Edwards, I.R., et al. (1997). Principles of signal detectionin pharmacovigilance. Drug Safety, 16, 35–365.
Noren, G. N., Bate, A., Hopstadius, J., Star, K., and Edwards, I. R. (2008). Temporalpattern discovery for trends and transient effects: its application to patient records. In:Proceedings of the Fourteenth International Conference on Knowledge Discovery andData Mining SIGKDD 2008, 963–971.
Ross, J.S., Madigan, D., Hill, K.P., Egilman, D.S., Wang, Y., Krumholz, H.M. (2009).Pooled analysis of Rofecoxib placebo-controlled clinical trial data: Lessons forpost-market pharmaceutical safety surveillance. Archives of Internal Medicine, 169,1976-1985.
Roy, J., Alderson, D., Hogan, J.W., and Tashima, K. T. (2006). Conditional inferencemethods for incomplete Poisson data with endogenous time-varying covariates,J. Amer. Statist. Assoc. 101, 424–434.
Santner, T. and Duffy, D. (1989), The Statistical Analysis of Discrete Data, New York:Springer-Verlag.
Schneeweiss, S., Rassen, J. A., Glynn, R. J., Avorn, J., Mogun, H., and Brookhart, M. A.(2009). High-dimensional propensity scoring adjustment in studies of treatment effectsusing health care claims data. Epidemiology, 20, 512-522.
Schneeweiss, S. (2010). A basic study design for expedited safety signal evaluation basedon electronic healthcare data. Pharmacoepidemiology and Drug Safety, 19, 858–868.
Stolley, P.D. (1981). Prevention of adverse effects related to drug therapy. In: Clark, D.W.and MacMahon, P. (Eds)., Preventative and Community Medicine (2nd ed.) Boston:Little Brown, 141–8.
Tibshirani, R. (1996). Regression Shrinkage and Selection via the Lasso, J. Roy. Statist.Soc. B 58, 267–288.
Bayesian Pharmacovigilance 17
Walker, A. M. (2009). Signal detection for vaccine side effects that have not been specifiedin advance. Preprint.
Winkelmann, R. (2008). Econometric Analysis of Count Data. Springer.
Wooldridge, J. M.(1999). Distribution-free estimation of some nonlinear panel datamodels, J. Econometrics 90, 77-97.
Yuan, G., Chang, K., Hsieh, C., and Lin, C. (2010). A comparison of optimizationmethods and software for large-scale L-1 regularized linear classification. Journal ofMachine Learning Research, 11, 3183–3234.