Embed Size (px)
Citation preview
ORIGINAL INVESTIGATION
Bayesian latent trait modeling of migraine symptom data
Carla Chia Ming Chen Æ Jonathan M. Keith ÆDale R. Nyholt Æ Nicholas G. Martin ÆKerrie L. Mengersen
Received: 19 January 2009 / Accepted: 12 April 2009 / Published online: 24 April 2009
� Springer-Verlag 2009
Abstract Definition of disease phenotype is a necessary
preliminary to research into genetic causes of a complex
disease. Clinical diagnosis of migraine is currently based
on diagnostic criteria developed by the International
Headache Society. Previously, we examined the natural
clustering of these diagnostic symptoms using latent class
analysis (LCA) and found that a four-class model was
preferred. However, the classes can be ordered such that all
symptoms progressively intensify, suggesting that a single
continuous variable representing disease severity may
provide a better model. Here, we compare two models:
item response theory and LCA, each constructed within a
Bayesian context. A deviance information criterion is used
to assess model fit. We phenotyped our population sample
using these models, estimated heritability and conducted
genome-wide linkage analysis using Merlin-qtl. LCA with
four classes was again preferred. After transformation,
phenotypic trait values derived from both models are
highly correlated (correlation = 0.99) and consequently
results from subsequent genetic analyses were similar.
Heritability was estimated at 0.37, while multipoint linkage
analysis produced genome-wide significant linkage to
chromosome 7q31-q33 and suggestive linkage to chromo-
somes 1 and 2. We argue that such continuous measures are
a powerful tool for identifying genes contributing to
migraine susceptibility.
Introduction
Research into the genetics of complex diseases often
involves the identification of genes associated with groups
of patients who exhibit different combinations of disease
symptoms or phenotypes. This analysis depends crucially
on the careful classification of patients. Commonly, the
clustering of patients depends on the criteria established by
medical societies, such as the International Headache
Society (Headache Classification Committee of the Inter-
national Headache Society 1988; Olesen and Steiner 2004;
Silberstein et al. 2005) for migraine. Without doubt, these
criteria are valuable for the diagnosis of diseases, but their
effectiveness for genetic research is debatable (Hallmayer
et al. 2003; Wessman et al. 2007) as discussed below.
Migraine is a hereditary disorder with estimated heri-
tability between 34 and 57% (Ziegler et al. 1998; Mulder
et al. 2003; Svensson et al. 2003, 2004; Nyholt et al. 2004,
2005). The two most common forms of migraine are
C. C. M. Chen (&) � J. M. Keith � K. L. Mengersen
School of Mathematical Sciences,
Queensland University of Technology, Brisbane,
QLD 4001, Australia
e-mail: [email protected]
J. M. Keith
e-mail: [email protected]
K. L. Mengersen
e-mail: [email protected]
D. R. Nyholt
Neurogenetics Laboratory, Queensland Institute of Medical
Research, PO Royal Brisbane Hospital, Brisbane,
QLD 4029, Australia
e-mail: [email protected]
D. R. Nyholt � N. G. Martin
Genetic Epidemiology Laboratory,
Queensland Institute of Medical Research,
PO Royal Brisbane Hospital,
Brisbane, QLD 4029, Australia
N. G. Martin
e-mail: [email protected]
123
Hum Genet (2009) 126:277–288
DOI 10.1007/s00439-009-0671-4
migraine without aura (MO) and migraine with aura (MA),
where aura typically concerns a visual disturbance. The
genetic research of migraine is mainly focused on these
two subgroups. To date, except for CACNA1A, ATP1A2
and SCN1A—genes that contribute to a rare mendelian
form of MA, familial hemiplegic migraine (FHM), no gene
has been convincingly implicated in migraine (Table 1).
This may be due to clinical and genetic heterogeneity of
the disease. The phenotype defined by IHS criteria may
oversimplify the complex variability among sufferers of
this complex disease (Anttila et al. 2006; Wessman et al.
2007). Furthermore, there is overlap in the symptoms of
MO and MA. Clinically, the symptoms of MA are a super-
set of the symptoms of MO. The work of Nyholt et al.
2004 and Ligthart et al. (2006) provides further support for
the argument that MA and MO are not separate entities.
Therefore, the development of an endophenotype or an
alternative phenotype may give better insight into the
genetics of common migraine.
There are currently two main types of method for
investigating the phenotypic structure of symptom survey
results, one based on the use of statistical methodologies to
convert the symptoms to a unidimensional value and the
other based on trait component analysis (TCA), which
treats each individual symptom as a response variable for
the purpose of linkage analyses. Nyholt et al. (2004) pio-
neered the use of latent class analysis (LCA) of the pheno-
type for migraine. The authors applied LCA to migraine
symptomatic data in an Australian twin population sample
and found that the best fit to the data was obtained using a
model with three symptomatic latent classes; these corre-
spond to a mild form of recurrent non-migrainous head-
aches, a moderately severe form of migraine and a severe
form. Moreover, the estimated heritability using LCA was
found to be slightly higher than the heritability estimated
using IHS criteria. Nyholt et al. (2005) then applied this
method for genome-wide linkage analysis and identified
linkage to chromosome 5q21. They also replicated previ-
ously reported susceptibility loci on chromosomes 6p12.2-
p21.1 and 1q21-q23.
Since migraine is a suite of symptoms and the sub-
phenotype analysis in Nyholt et al. (2005) found that
individual symptoms are associated with specific linkage
peaks in their data, there have been several attempts to
identify gene loci linked to individual symptoms (Anttila
et al. 2006, 2008). This method is referred to as trait
component analysis. Anttila et al. (2006) applied TCA to
dissect the genetic susceptibility of migraine in a Finnish
cohort. They found strong evidence that various migraine
symptoms are linked to chromosome 4q24, including
photophobia, phonophobia, intensity, unilaterality, nausea,
vomiting and attack length. They also found that pulsation
is linked to chromosome 17p3 and reported some sugges-
tive linkage of the phonophobia trait to chromosome 10q22
and the ‘‘aggravation by physical exercise’’ trait to chro-
mosomes 12q21, 15q14 and Xp21.
Besides LCA, other clustering methods have been applied
to genetic research of diseases with complex aetiology.
These include grade of membership (GoM), used to analyze
schizophrenia (Hallmayer et al. 2003), mania (Cassidy et al.
2001) and Alzheimer’s (Fillenbaum 1998; Corder and
Woodbury 1993); model-based clustering, used to analyze
anorexia nervosa (Devlin et al. 2002); and fuzzy clustering,
used to analyze anxiety disorder (Kaabi et al. 2006). All
these algorithms aim to identify homogenous classes/com-
ponents in the data, based on specified traits of interest, and
estimate the parameters associated with each class.
For some diseases composed of many individual
symptoms, the data may be better modeled using a con-
tinuous representation. Indeed, in earlier analyses of multi-
symptom migraine data using LCA and GoM (Chen et al.
2009; Nyholt et al. 2004, 2005; Ligthart et al. 2006, 2008),
the classes could be ordered in such a way that there was a
gradual reduction in all symptoms, suggesting that there is
a single latent continuous trait underlying the observed
pattern of symptoms. It is therefore reasonable to hypo-
thesize that the data may be modeled using a single conti-
nuous variable representing severity of the disease instead
of classes.
Item response theory (IRT), which is also known as
latent trait analysis, is a popular statistical method for
modeling psychological and educational survey responses.
It assumes an underlying continuous latent value which has
direct influence on the responses to items. Indeed, items are
Table 1 The chromosome
regions associated with the
common forms of migraine
Phenotype Cohort Chromosome References
MO Icelandic 4q21 Bjornsson et al. (2003)
MO Italian 14q21.2-q22.3 Soragna et al. (2003)
MA Canadian 11q24 Cader et al. (2003)
MA Finnish 4q24 Wessman et al.(2002)
MA North American Caucasians 19q13 Jones et al.(2001)
TCA and LCA Finnish and Australian 10q22-10q23 Anttila et al.(2008)
278 Hum Genet (2009) 126:277–288
123
designed to capture this latent value. In this paper, the item
variables are equivalent to the symptom variables. IRT has
been found to be useful in behavioral genetics and genetic
epidemiology, where the phenotype is often determined by
the questionnaire or interview data. This method has been
used for exploring the genetic and environmental influence
on the timing of pubertal change (Eaves et al. 2004) and
the analysis of multi-symptom genetic data (Eaves et al.
2005; Wray et al. 2008).
In this paper, we test the hypothesis proposed above by
first introducing IRT for analyzing multi-symptom
migraine data, then comparing this non-clustering method
to LCA. Both the models are introduced in a Bayesian
framework and compared using statistical measures that
take into account goodness of fit and model complexity.
The models are then compared further by assessing the
utility of their resulting trait measures in genetic herita-
bility and linkage analysis.
Methods
Data
Phenotype data
Data were collected by the Queensland Institute of Medical
Research (QIMR) during the course of extensive and semi-
structured telephone interview studies from 1993 to 2000.
The surveys were primarily designed to assess physical,
psychological, and social manifestations of alcoholism and
related disorders. The sample was unselected with regard to
personal or family history of alcoholism or other psychi-
atric or medical disorders. The data were collected over
two periods, 1993–1995 and 1996–2000. The earlier
interview was administered to Australian twins listed with
the volunteer-based Australian Twin Registry who were
born between 1902 and 1964 while the second interview
was focused on twins born between 1964 and 1971. Par-
ticipants of both cohorts were first asked the screening
question:‘‘Do you have recurrent attacks of headaches?’’ If
the participant screened positive, then he/she was asked a
number of questions which were developed by an experi-
enced migraine researcher based on the IHS diagnosis
criteria (Table 2). Although the wording of the questions is
identical for both periods, the older cohort was not asked
questions related to having at least five episodes of head-
aches, the duration of headaches (4–72 h) and the severity
of the pain associated with headache (‘‘moderate to
severe’’).
There are 13,062 individuals from 6,764 families par-
ticipating in this analysis, with 2,716 MZ twin pairs (63.6%
females and 36.4% males), 3,399 DZ twin pairs (34.5%
female twin pairs, 22.4% male twin pairs and 43.1%
opposite sex twin pairs), 12 twins with unknown zygosity
and 817 non-twin siblings. The mean age of participants
was 37.5 years and ages ranged from 23 to 90 years at the
time of survey. Details of the collection of the migraine
data are provided by Nyholt et al. (2004, 2005).
Although it may be argued post-survey that it would
have been more complete for all members of the cohort to
be asked all symptom questions, this was considered to be
an unacceptable impost by the survey designers. Possible
ascertainment bias was considered and discounted since
analysis showed little difference in prediction of LCA and
IRT by including and excluding the ‘‘no’’ cohort. .
Genotype data
The genotypic data are composed of four smaller genome-
wide linkage scans performed for other studies at the
Queensland Institute of Medical Research (QIMR). Geno-
typing for the four studies was conducted at Gemini
Genomics with 426 satellite markers, Sequana Therapeutics
Table 2 The survey questions
based on IHS criteriaNotation Abbreviation Descriptions
a C5 episodes Have at least five episodes of headache in your life time
b 4–72 h Average headache last between 4 and 72 h
c1 Unilateral Headache often occurs at one side of head
c2 Pulsating Headache pain can be described as throbbing, pulsating or
pounding
c3a Moderate/severe Headache pain can be described between moderate and
severe
c3b Prohibitive Headache pain prohibits daily activities
d1 Nausea/vomiting Headache associated with vomiting or feeling nausea
d2a Photophobia Enhance sensitivity to light
d2b Phonophobia Enhance sensitivity to sounds
Aura Aura Have visual problems such as light shower, blurring, blind
spot or double vision
Hum Genet (2009) 126:277–288 279
123
with 519 markers, the Center for Mammalian Genetics at
Marshfield Clinic Research Foundation with 776 markers
and the University of Leiden with 435 markers. The details
of DNA collection, genotyping methods and data cleaning
are discussed elsewhere (Zhu et al. 2004; Cornes et al.
2005).
Graphic Representation of Relationships (GRR) (Abec-
asis et al. 2001) and RELPAIR (Epstein et al. 2000; Duren
et al. 2003) were applied for the examination of the pedi-
gree structure and identification of inconsistencies between
the genotypic data and self-reported pedigree relationships.
The potential misspecification, incorrect zygosity labeling
of twins and sample mix-ups were identified and corrected.
A small number of cases with errors could not be corrected,
so were excluded in further analysis. The SIB-PAIR ver-
sion 0.99.9 program by Duffy (2002) was then imple-
mented for identifying and cleaning the Mendelian
inconsistencies in the genotype data.
Markers from four sources were included separately on
the genetic map for the combined scan, separated by a
small distance of 0.001 cM. Markers with genotypic data
inconsistent between different genome scans were exclu-
ded and unlikely genotypes were identified by MERLIN
(Abecasis et al. 2002) and omitted from further analysis.
Potential map errors were identified by GENEHUNTER
(Kruglyak et al. 1996) and MENDEL (Lange et al. 1988).
Map positions were in Kosambi cM, which is estimated
using locally weighted linear regression from the National
Center for Biotechnology Information (NCBI) Build 34.3
physical map positions, as well as published deCODE and
Marshfield genetic map positions (Kong et al. 2004).
Where the results suggested inconsistencies between
genetic map distance and recombination fraction, the pri-
mer sequences for all markers in the region were BLASTed
against the entire human genome sequence (http://www.
ensembl.org, NCBI build 34.3). The genetic map was then
revised to include the updated physical positions of all
markers in the problematic regions. The revised map and
the original genotype data were cleaned of unlikely geno-
types using MERLIN and map errors were resolved using
GENEHUNTER. More details on the collapsing of markers
is in Cornes et al (2005).
There are a total of 1,770 unique markers and the
combined genome scan included 4,148 individuals from
919 families (143 MZ and 776 DZ twin pairs and some
parent genotype).
Model
Latent class analysis
Suppose that there are n individuals and J observed
(manifest) item response variables ði ¼ 1; . . .; n; j ¼
1; 2. . .; JÞ: Let yij denote the binary response of the ith
individual to symptom question j such that yij = 1 when
the symptom j is present in person i, else yij = 0. Yi is then
the vector of the ith subject’s responses to all symptoms.
Assume that there are K latent classes embedded in
the data. Let kkj be the probability of a positive response on
variable j for a person in latent class kðk ¼ 1; . . .;KÞ: Then
PðYijk; pÞ ¼XKk¼1
pkYJj
ðkkjÞyijð1� kkjÞ1�yij
where pk denotes the probability that a randomly chosen
individual belongs to latent class k. We used the following
non-informative priors:
pk �Dirichletð1; . . .; 1Þkkkj �Betað1; 1Þrepresenting equal probability of membership to any of the
k classes and equal probabilities of a 0 or 1 response for the
jth variable in the kth class. The posterior probability that
subject i belongs to class k is given by:
pik ¼pk
Qj f ðYijkkÞP
k pkQ
j f ðYijkkÞwhere kk is the expected probability of membership of the
kth class and f ðYijkkÞ represents the probability distribution
for Yi given this probability, that is,
f ðYijkkÞ ¼Yj
ðkkjÞyijð1� kkjÞ1�yij :
The parameter vectors p and k are estimated by Markov
Chain Monte Carlo (MCMC) simulations using
WinBUGS1.4 (Spiegelhalter et al. 2006). Then the latent
trait value for the ith subject is given by
Phenotypic traiti ¼Xk¼K
k¼1
Pj¼Jj¼1 kkjJ
� pik: ð1Þ
Item response theory
As before, let yij denote the binary response of person i to
variable j, yij ¼ f0; 1g; i ¼ 1; 2; . . .; n and j ¼ 1; 2; . . .; J:Let hi denote the latent trait value of subject i; hi 2 R and
Pj(hi) be the probability of observing a response score of 1
(symptom present) given the latent trait value PjðhiÞ ¼Pjðyij ¼ 1jhiÞ; which is called the item response function
(IRF). Different types of IRF constitute the subtypes of
IRT. Variations of the IRT model include the Rasch model,
2-parameter logistic model (2-PL), 3-PL model and the
Birnbaum model.
In this paper, we adopt the 2-PL model, which is com-
monly implemented for phenotyping. The IRF for the 2-PL
model is
280 Hum Genet (2009) 126:277–288
123
Pjðhijaj; bjÞ ¼ eajðhi�bjÞ
1þ eajðhi�bjÞ ð2Þ
where variables aj and bj are described in the education/
psychology literature as the item discriminant parameter
and item difficulty parameter. Higher values of aj indicate
that item j has higher correlation with the latent trait value.
The item difficulty parameter represents the point on the
latent trait scale at which the probability of having the
symptom is 0.5.
The likelihood is thus
PðY jhÞ ¼Yni
YJj¼1
ðpjðhiÞÞyijð1� pjðhiÞÞ1�yij :
As in the LCA model, noninformative priors are used
for parameters hi, aj and bj:
hi �Nð0; 1Þ; hi 2 R
aj �Nð0; 10000Þbj �Nð0; 10000Þ:
:
As for Bayesian LCA, estimation was carried out by
Markov Chain Monte Carlo (MCMC) using WinBUGS1.4
(Spiegelhalter et al. 2006).
For both LCA and IRT models, MCMC chains were
generated with 10,000 iterations. The initial 5,000 itera-
tions were considered as burn-in and every fifth case of the
remaining 5,000 (total of 1,000 cases) was extracted to
build the marginal posterior distribution of the parameters.
For the LCA model, a chain was generated for each value
of K; K ¼ 2; . . .; 7:
Model comparison
The deviance information criterion (DIC) is a popular and
useful method for assessing model fit and complexity for
the purpose of comparing Bayesian models. The early DIC
proposed by Spiegelhalter et al. (2002) is only suitable
when the competing likelihood models have a closed form.
It is not ideal for comparing models with missing values or
mixture models (Celeux et al. 2006). Celeux et al (2006)
suggested various alternative forms of DIC for these
models and compared the performance of these criteria.
Here we employ the DIC3 of their work to determine the
optimum number of classes for the Bayesian LCA and
compare Bayesian LCA and IRT models. DIC3 is defined
as
DIC ¼ �4Eh½log f ðyjgÞjy� þ 2 log f ðyÞ ð3Þwhere y is observed data, g is a vector of model parameters
and f ðyÞ is the posterior expectation of model parameters.
Further details on the calculation of DIC for Bayesian LCA
and IRT can be found in Appendix.
Genetic analysis
Heritability of the quantitative phenotype values was esti-
mated with the ACE model, which is well suited for twin
studies.The ACE model assumes that phenotypic variation
is due to additive genetic effect (A), shared environmental
effect (C) and random (non-shared) environmental effect
(E). The heritability is then the proportion of the total
variance which is due to the additive genetic effect. The
analysis was carried out using Mx (Neale et al. 1997). Mx
applies a maximum likelihood method to estimate the
variances and the corresponding heritability. The goodness
of fit criterion used in Mx for assessing the ACE model is
the Bayesian Information Criteria (BIC) (Schwarz 1978).
Non-parametric quantitative trait linkage analysis was
carried out using Merlin-qtl. Merlin-qtl was developed
under the general framework of Kong and Cox (1997) and
Whittemore and Halpern (1994). The pik of LCA and the
latent trait hi of IRT are treated as phenotypic traits for the
genetic analysis.
Results
Bayesian LCA
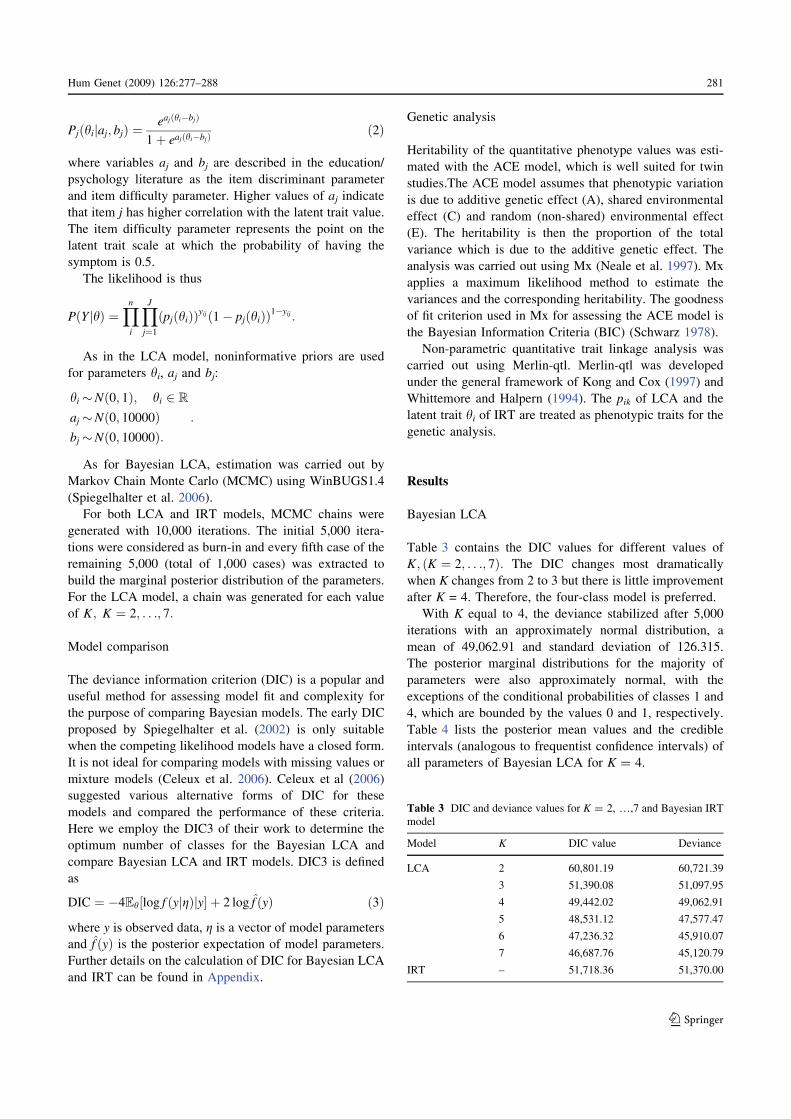
Table 3 contains the DIC values for different values of
K; ðK ¼ 2; . . .; 7Þ: The DIC changes most dramatically
when K changes from 2 to 3 but there is little improvement
after K = 4. Therefore, the four-class model is preferred.
With K equal to 4, the deviance stabilized after 5,000
iterations with an approximately normal distribution, a
mean of 49,062.91 and standard deviation of 126.315.
The posterior marginal distributions for the majority of
parameters were also approximately normal, with the
exceptions of the conditional probabilities of classes 1 and
4, which are bounded by the values 0 and 1, respectively.
Table 4 lists the posterior mean values and the credible
intervals (analogous to frequentist confidence intervals) of
all parameters of Bayesian LCA for K = 4.
Table 3 DIC and deviance values for K = 2, …,7 and Bayesian IRT
model
Model K DIC value Deviance
LCA 2 60,801.19 60,721.39
3 51,390.08 51,097.95
4 49,442.02 49,062.91
5 48,531.12 47,577.47
6 47,236.32 45,910.07
7 46,687.76 45,120.79
IRT – 51,718.36 51,370.00
Hum Genet (2009) 126:277–288 281
123
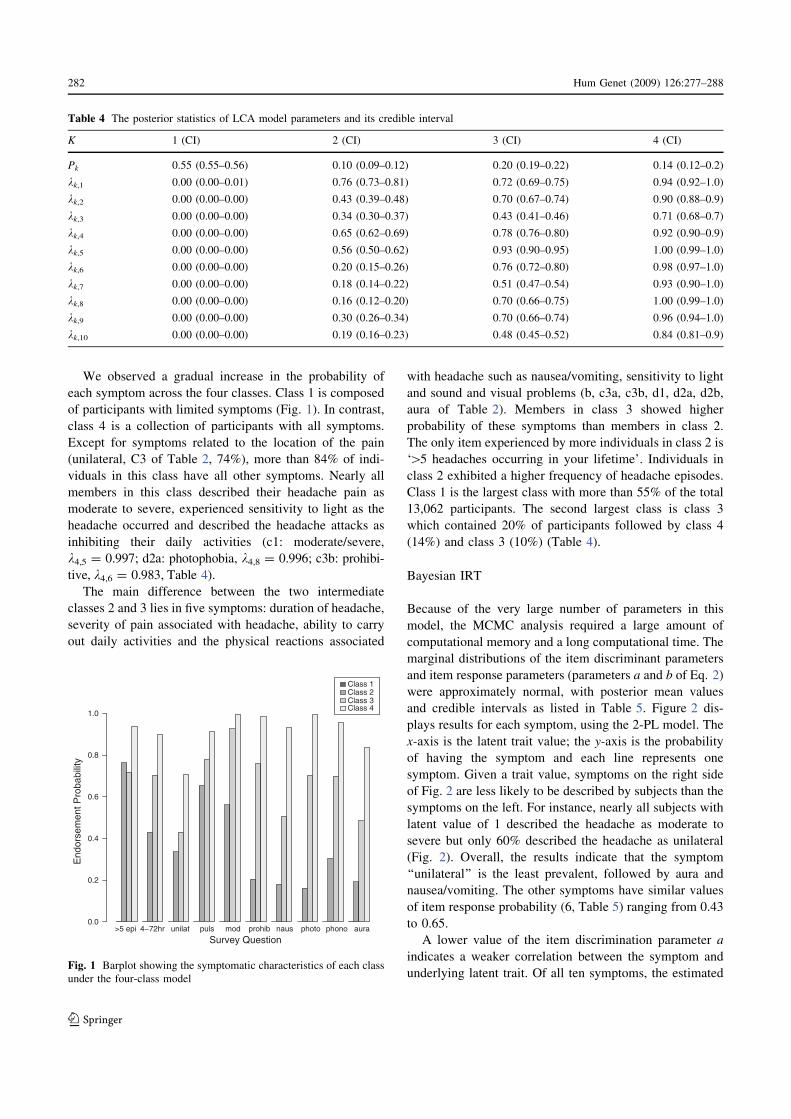
We observed a gradual increase in the probability of
each symptom across the four classes. Class 1 is composed
of participants with limited symptoms (Fig. 1). In contrast,
class 4 is a collection of participants with all symptoms.
Except for symptoms related to the location of the pain
(unilateral, C3 of Table 2, 74%), more than 84% of indi-
viduals in this class have all other symptoms. Nearly all
members in this class described their headache pain as
moderate to severe, experienced sensitivity to light as the
headache occurred and described the headache attacks as
inhibiting their daily activities (c1: moderate/severe,
k4,5 = 0.997; d2a: photophobia, k4,8 = 0.996; c3b: prohibi-
tive, k4,6 = 0.983, Table 4).
The main difference between the two intermediate
classes 2 and 3 lies in five symptoms: duration of headache,
severity of pain associated with headache, ability to carry
out daily activities and the physical reactions associated
with headache such as nausea/vomiting, sensitivity to light
and sound and visual problems (b, c3a, c3b, d1, d2a, d2b,
aura of Table 2). Members in class 3 showed higher
probability of these symptoms than members in class 2.
The only item experienced by more individuals in class 2 is
‘[5 headaches occurring in your lifetime’. Individuals in
class 2 exhibited a higher frequency of headache episodes.
Class 1 is the largest class with more than 55% of the total
13,062 participants. The second largest class is class 3
which contained 20% of participants followed by class 4
(14%) and class 3 (10%) (Table 4).
Bayesian IRT
Because of the very large number of parameters in this
model, the MCMC analysis required a large amount of
computational memory and a long computational time. The
marginal distributions of the item discriminant parameters
and item response parameters (parameters a and b of Eq. 2)
were approximately normal, with posterior mean values
and credible intervals as listed in Table 5. Figure 2 dis-
plays results for each symptom, using the 2-PL model. The
x-axis is the latent trait value; the y-axis is the probability
of having the symptom and each line represents one
symptom. Given a trait value, symptoms on the right side
of Fig. 2 are less likely to be described by subjects than the
symptoms on the left. For instance, nearly all subjects with
latent value of 1 described the headache as moderate to
severe but only 60% described the headache as unilateral
(Fig. 2). Overall, the results indicate that the symptom
‘‘unilateral’’ is the least prevalent, followed by aura and
nausea/vomiting. The other symptoms have similar values
of item response probability (6, Table 5) ranging from 0.43
to 0.65.
A lower value of the item discrimination parameter a
indicates a weaker correlation between the symptom and
underlying latent trait. Of all ten symptoms, the estimated
>5 epi 4−72hr unilat puls mod prohib naus photo phono aura
Class 1 Class 2 Class 3 Class 4
Survey Question
End
orse
men
t Pro
babi
lity
0.0
0.2
0.4
0.6
0.8
1.0
Fig. 1 Barplot showing the symptomatic characteristics of each class
under the four-class model
Table 4 The posterior statistics of LCA model parameters and its credible interval
K 1 (CI) 2 (CI) 3 (CI) 4 (CI)
Pk 0.55 (0.55–0.56) 0.10 (0.09–0.12) 0.20 (0.19–0.22) 0.14 (0.12–0.2)
kk,1 0.00 (0.00–0.01) 0.76 (0.73–0.81) 0.72 (0.69–0.75) 0.94 (0.92–1.0)
kk,2 0.00 (0.00–0.00) 0.43 (0.39–0.48) 0.70 (0.67–0.74) 0.90 (0.88–0.9)
kk,3 0.00 (0.00–0.00) 0.34 (0.30–0.37) 0.43 (0.41–0.46) 0.71 (0.68–0.7)
kk,4 0.00 (0.00–0.00) 0.65 (0.62–0.69) 0.78 (0.76–0.80) 0.92 (0.90–0.9)
kk,5 0.00 (0.00–0.00) 0.56 (0.50–0.62) 0.93 (0.90–0.95) 1.00 (0.99–1.0)
kk,6 0.00 (0.00–0.00) 0.20 (0.15–0.26) 0.76 (0.72–0.80) 0.98 (0.97–1.0)
kk,7 0.00 (0.00–0.00) 0.18 (0.14–0.22) 0.51 (0.47–0.54) 0.93 (0.90–1.0)
kk,8 0.00 (0.00–0.00) 0.16 (0.12–0.20) 0.70 (0.66–0.75) 1.00 (0.99–1.0)
kk,9 0.00 (0.00–0.00) 0.30 (0.26–0.34) 0.70 (0.66–0.74) 0.96 (0.94–1.0)
kk,10 0.00 (0.00–0.00) 0.19 (0.16–0.23) 0.48 (0.45–0.52) 0.84 (0.81–0.9)
282 Hum Genet (2009) 126:277–288
123
latent value correlates most strongly with the severity of
pain during the headache, followed by the symptoms
‘prohibitive of daily activities’, photophobia and phono-
phobia (indicated by the posterior mean discrimination
parameters of 8.368, 6.608, 6.562 and 5.263 respectively;
Table 5). Location of pain (‘unilateral’) and aura correlated
least strongly with the latent value.
Model comparison
The DIC estimated for the Bayesian IRT model of the
migraine symptomatic data is 51718.36 (Table 3). This
value is slightly higher than the equivalent value of
49,442.02 for the best LCA model (K = 4). This suggests
that, by this criterion, Bayesian LCA with K = 4 classes
provides a slightly better model for these data than the
Bayesian IRT model.
The models were also compared using deviance, which
is -29log-likelihood and measures the fit of a model but
not its complexity. Although the difference in the deviance
values between LCA with K = 4 and IRT is less than for
DIC, lower deviance is still observed for LCA with K = 4
(Table 3). This supports the observation that LCA with
K = 4 is a slightly better model for these data.
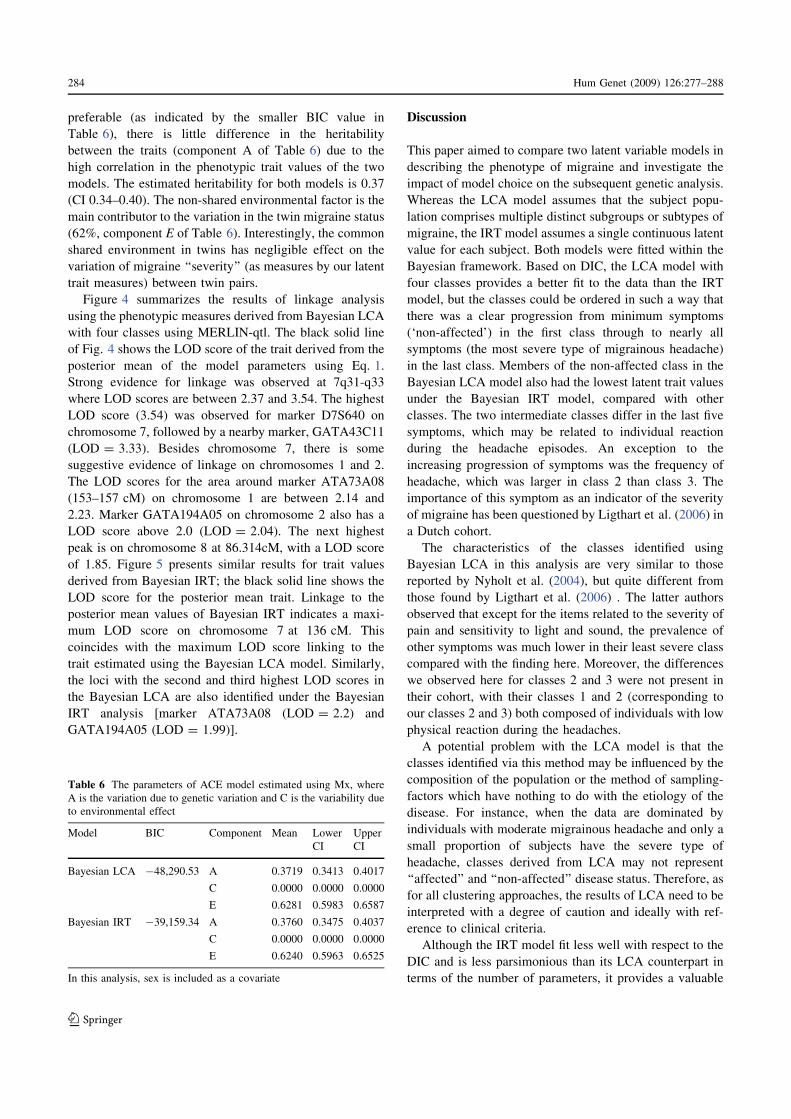
Figure 3 is a scatter plot showing the relationship
between the phenotype trait values estimated using
Bayesian LCA and Bayesian IRT. There is a strong cor-
relation between phenotype values estimated with the two
models (correlation = 0.99).
Genetic analysis
The ACE model was fitted to the latent trait value h of the
Bayesian IRT model and the converted continuous estimate
derived from Bayesian LCA (Eq. 1), to estimate the heri-
tability of common migrainous headache. Although the
trait values derived from the Bayesian LCA model are
−1 0 1 2 3
0.0
0.2
0.4
0.6
0.8
1.0
Latent Trait
Pro
babi
lity
of b
eing
affe
cted
5 epi4−72hrunilatpulsmodprohibnausphotophonoaura
Fig. 2 Plot showing the relationship between the latent trait and each
symptom for IRT model
Table 5 The posterior statistics of item response probability and item
discrimination parameters
Item Mean SD 2.5% 25% Median 75% 97.5%
a-a 4.074 0.12 3.844 3.992 4.073 4.154 4.311
a-b 4.245 0.135 3.983 4.152 4.244 4.336 4.518
a-c1 2.874 0.073 2.73 2.824 2.874 2.922 3.021
a-c2 4.454 0.109 4.24 4.38 4.453 4.525 4.672
a-c3a 8.368 0.361 7.688 8.117 8.36 8.598 9.095
a-c3b 6.562 0.217 6.164 6.415 6.553 6.702 7.003
a-d1 4.646 0.136 4.392 4.551 4.644 4.739 4.919
a-d2a 6.608 0.219 6.194 6.46 6.601 6.755 7.047
a-d2b 5.263 0.148 4.981 5.164 5.258 5.359 5.567
a-Aura 3.732 0.104 3.54 3.659 3.728 3.799 3.943
b-a 0.493 0.015 0.464 0.482 0.492 0.502 0.524
b-b 0.618 0.015 0.59 0.608 0.618 0.627 0.647
b-c1 0.936 0.016 0.907 0.925 0.936 0.947 0.969
b-c2 0.49 0.013 0.466 0.48 0.489 0.499 0.516
b-c3a 0.427 0.014 0.401 0.418 0.427 0.436 0.454
b-c3b 0.61 0.013 0.585 0.601 0.609 0.618 0.635
b-d1 0.781 0.014 0.756 0.771 0.781 0.79 0.807
b-d2a 0.648 0.012 0.625 0.64 0.648 0.656 0.673
b-d2b 0.623 0.013 0.6 0.615 0.623 0.632 0.648
b-Aura 0.845 0.014 0.818 0.835 0.845 0.854 0.872
0.0 0.2 0.4 0.6 0.8
−0.5
0.0
0.5
1.0
1.5
Bayesian LCA phenotype
Bay
esia
n IR
T p
heno
type
Fig. 3 Scatter plot showing the relationship between predicted
continuous phenotypic values by Bayesian LCA and Bayesian IRT
model. The continuous phenotypic trait is bounded between 0 and 1,
where 1 represented a severe type of common migraine and 0
indicated no evidence of common migraine. The straight line is the
predicted linear relationship between these two phenotypes. The
correlation between the phenotypic traits is 0.99
Hum Genet (2009) 126:277–288 283
123
preferable (as indicated by the smaller BIC value in
Table 6), there is little difference in the heritability
between the traits (component A of Table 6) due to the
high correlation in the phenotypic trait values of the two
models. The estimated heritability for both models is 0.37
(CI 0.34–0.40). The non-shared environmental factor is the
main contributor to the variation in the twin migraine status
(62%, component E of Table 6). Interestingly, the common
shared environment in twins has negligible effect on the
variation of migraine ‘‘severity’’ (as measures by our latent
trait measures) between twin pairs.
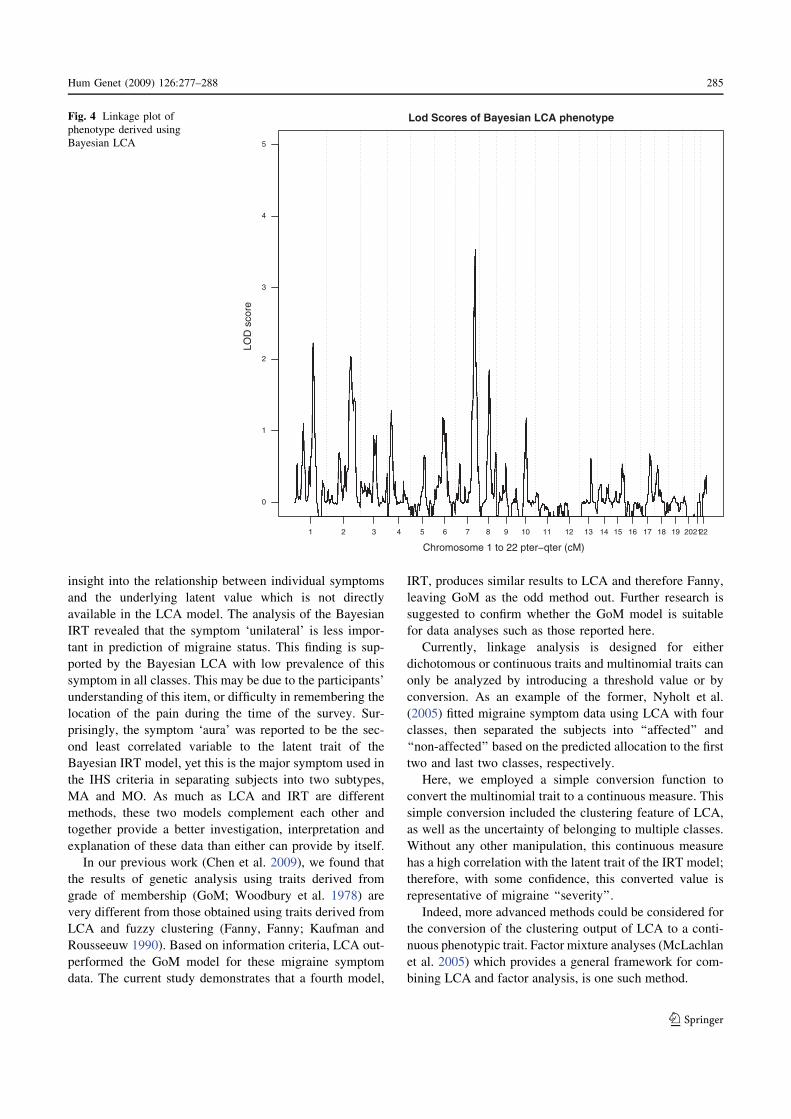
Figure 4 summarizes the results of linkage analysis
using the phenotypic measures derived from Bayesian LCA
with four classes using MERLIN-qtl. The black solid line
of Fig. 4 shows the LOD score of the trait derived from the
posterior mean of the model parameters using Eq. 1.
Strong evidence for linkage was observed at 7q31-q33
where LOD scores are between 2.37 and 3.54. The highest
LOD score (3.54) was observed for marker D7S640 on
chromosome 7, followed by a nearby marker, GATA43C11
(LOD = 3.33). Besides chromosome 7, there is some
suggestive evidence of linkage on chromosomes 1 and 2.
The LOD scores for the area around marker ATA73A08
(153–157 cM) on chromosome 1 are between 2.14 and
2.23. Marker GATA194A05 on chromosome 2 also has a
LOD score above 2.0 (LOD = 2.04). The next highest
peak is on chromosome 8 at 86.314cM, with a LOD score
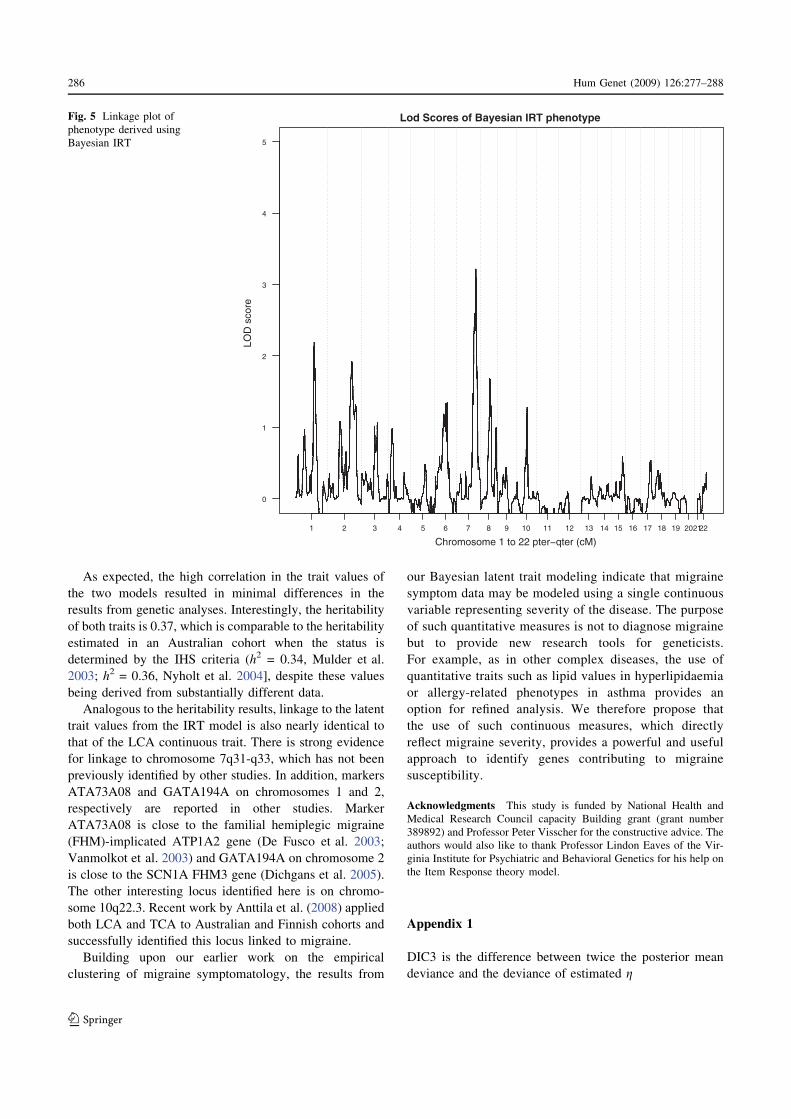
of 1.85. Figure 5 presents similar results for trait values
derived from Bayesian IRT; the black solid line shows the
LOD score for the posterior mean trait. Linkage to the
posterior mean values of Bayesian IRT indicates a maxi-
mum LOD score on chromosome 7 at 136 cM. This
coincides with the maximum LOD score linking to the
trait estimated using the Bayesian LCA model. Similarly,
the loci with the second and third highest LOD scores in
the Bayesian LCA are also identified under the Bayesian
IRT analysis [marker ATA73A08 (LOD = 2.2) and
GATA194A05 (LOD = 1.99)].
Discussion
This paper aimed to compare two latent variable models in
describing the phenotype of migraine and investigate the
impact of model choice on the subsequent genetic analysis.
Whereas the LCA model assumes that the subject popu-
lation comprises multiple distinct subgroups or subtypes of
migraine, the IRT model assumes a single continuous latent
value for each subject. Both models were fitted within the
Bayesian framework. Based on DIC, the LCA model with
four classes provides a better fit to the data than the IRT
model, but the classes could be ordered in such a way that
there was a clear progression from minimum symptoms
(‘non-affected’) in the first class through to nearly all
symptoms (the most severe type of migrainous headache)
in the last class. Members of the non-affected class in the
Bayesian LCA model also had the lowest latent trait values
under the Bayesian IRT model, compared with other
classes. The two intermediate classes differ in the last five
symptoms, which may be related to individual reaction
during the headache episodes. An exception to the
increasing progression of symptoms was the frequency of
headache, which was larger in class 2 than class 3. The
importance of this symptom as an indicator of the severity
of migraine has been questioned by Ligthart et al. (2006) in
a Dutch cohort.
The characteristics of the classes identified using
Bayesian LCA in this analysis are very similar to those
reported by Nyholt et al. (2004), but quite different from
those found by Ligthart et al. (2006) . The latter authors
observed that except for the items related to the severity of
pain and sensitivity to light and sound, the prevalence of
other symptoms was much lower in their least severe class
compared with the finding here. Moreover, the differences
we observed here for classes 2 and 3 were not present in
their cohort, with their classes 1 and 2 (corresponding to
our classes 2 and 3) both composed of individuals with low
physical reaction during the headaches.
A potential problem with the LCA model is that the
classes identified via this method may be influenced by the
composition of the population or the method of sampling-
factors which have nothing to do with the etiology of the
disease. For instance, when the data are dominated by
individuals with moderate migrainous headache and only a
small proportion of subjects have the severe type of
headache, classes derived from LCA may not represent
‘‘affected’’ and ‘‘non-affected’’ disease status. Therefore, as
for all clustering approaches, the results of LCA need to be
interpreted with a degree of caution and ideally with ref-
erence to clinical criteria.
Although the IRT model fit less well with respect to the
DIC and is less parsimonious than its LCA counterpart in
terms of the number of parameters, it provides a valuable
Table 6 The parameters of ACE model estimated using Mx, where
A is the variation due to genetic variation and C is the variability due
to environmental effect
Model BIC Component Mean Lower
CI
Upper
CI
Bayesian LCA -48,290.53 A 0.3719 0.3413 0.4017
C 0.0000 0.0000 0.0000
E 0.6281 0.5983 0.6587
Bayesian IRT -39,159.34 A 0.3760 0.3475 0.4037
C 0.0000 0.0000 0.0000
E 0.6240 0.5963 0.6525
In this analysis, sex is included as a covariate
284 Hum Genet (2009) 126:277–288
123
insight into the relationship between individual symptoms
and the underlying latent value which is not directly
available in the LCA model. The analysis of the Bayesian
IRT revealed that the symptom ‘unilateral’ is less impor-
tant in prediction of migraine status. This finding is sup-
ported by the Bayesian LCA with low prevalence of this
symptom in all classes. This may be due to the participants’
understanding of this item, or difficulty in remembering the
location of the pain during the time of the survey. Sur-
prisingly, the symptom ‘aura’ was reported to be the sec-
ond least correlated variable to the latent trait of the
Bayesian IRT model, yet this is the major symptom used in
the IHS criteria in separating subjects into two subtypes,
MA and MO. As much as LCA and IRT are different
methods, these two models complement each other and
together provide a better investigation, interpretation and
explanation of these data than either can provide by itself.
In our previous work (Chen et al. 2009), we found that
the results of genetic analysis using traits derived from
grade of membership (GoM; Woodbury et al. 1978) are
very different from those obtained using traits derived from
LCA and fuzzy clustering (Fanny, Fanny; Kaufman and
Rousseeuw 1990). Based on information criteria, LCA out-
performed the GoM model for these migraine symptom
data. The current study demonstrates that a fourth model,
IRT, produces similar results to LCA and therefore Fanny,
leaving GoM as the odd method out. Further research is
suggested to confirm whether the GoM model is suitable
for data analyses such as those reported here.
Currently, linkage analysis is designed for either
dichotomous or continuous traits and multinomial traits can
only be analyzed by introducing a threshold value or by
conversion. As an example of the former, Nyholt et al.
(2005) fitted migraine symptom data using LCA with four
classes, then separated the subjects into ‘‘affected’’ and
‘‘non-affected’’ based on the predicted allocation to the first
two and last two classes, respectively.
Here, we employed a simple conversion function to
convert the multinomial trait to a continuous measure. This
simple conversion included the clustering feature of LCA,
as well as the uncertainty of belonging to multiple classes.
Without any other manipulation, this continuous measure
has a high correlation with the latent trait of the IRT model;
therefore, with some confidence, this converted value is
representative of migraine ‘‘severity’’.
Indeed, more advanced methods could be considered for
the conversion of the clustering output of LCA to a conti-
nuous phenotypic trait. Factor mixture analyses (McLachlan
et al. 2005) which provides a general framework for com-
bining LCA and factor analysis, is one such method.
0
1
2
3
4
5
Chromosome 1 to 22 pter−qter (cM)
LOD
sco
re
1 2 3 4 5 6 7 8 9 10 11 12 13 14 15 16 17 18 19 202122
Lod Scores of Bayesian LCA phenotypeFig. 4 Linkage plot of
phenotype derived using
Bayesian LCA
Hum Genet (2009) 126:277–288 285
123
As expected, the high correlation in the trait values of
the two models resulted in minimal differences in the
results from genetic analyses. Interestingly, the heritability
of both traits is 0.37, which is comparable to the heritability
estimated in an Australian cohort when the status is
determined by the IHS criteria (h2 = 0.34, Mulder et al.
2003; h2 = 0.36, Nyholt et al. 2004], despite these values
being derived from substantially different data.
Analogous to the heritability results, linkage to the latent
trait values from the IRT model is also nearly identical to
that of the LCA continuous trait. There is strong evidence
for linkage to chromosome 7q31-q33, which has not been
previously identified by other studies. In addition, markers
ATA73A08 and GATA194A on chromosomes 1 and 2,
respectively are reported in other studies. Marker
ATA73A08 is close to the familial hemiplegic migraine
(FHM)-implicated ATP1A2 gene (De Fusco et al. 2003;
Vanmolkot et al. 2003) and GATA194A on chromosome 2
is close to the SCN1A FHM3 gene (Dichgans et al. 2005).
The other interesting locus identified here is on chromo-
some 10q22.3. Recent work by Anttila et al. (2008) applied
both LCA and TCA to Australian and Finnish cohorts and
successfully identified this locus linked to migraine.
Building upon our earlier work on the empirical
clustering of migraine symptomatology, the results from
our Bayesian latent trait modeling indicate that migraine
symptom data may be modeled using a single continuous
variable representing severity of the disease. The purpose
of such quantitative measures is not to diagnose migraine
but to provide new research tools for geneticists.
For example, as in other complex diseases, the use of
quantitative traits such as lipid values in hyperlipidaemia
or allergy-related phenotypes in asthma provides an
option for refined analysis. We therefore propose that
the use of such continuous measures, which directly
reflect migraine severity, provides a powerful and useful
approach to identify genes contributing to migraine
susceptibility.
Acknowledgments This study is funded by National Health and
Medical Research Council capacity Building grant (grant number
389892) and Professor Peter Visscher for the constructive advice. The
authors would also like to thank Professor Lindon Eaves of the Vir-
ginia Institute for Psychiatric and Behavioral Genetics for his help on
the Item Response theory model.
Appendix 1
DIC3 is the difference between twice the posterior mean
deviance and the deviance of estimated g
0
1
2
3
4
5
Chromosome 1 to 22 pter−qter (cM)
LOD
sco
re
1 2 3 4 5 6 7 8 9 10 11 12 13 14 15 16 17 18 19 202122
Lod Scores of Bayesian IRT phenotypeFig. 5 Linkage plot of
phenotype derived using
Bayesian IRT
286 Hum Genet (2009) 126:277–288
123
DIC ¼ 2DðgÞ � Dð~gÞ ð4ÞIn the DIC3 proposed by Celeux et al. (2006), when the
likelihood has a closed form, the first term can be
approximated using M simulated values, gð1Þ; . . .; gðMÞ;where gðmÞ ¼ ðpm; kmÞ from an MCMC chain.
DðgÞ ¼ Eg½�2 log f ðyjgÞjy�
� � 2
M
XMm¼1
log f ðyjgðmÞÞ ð5Þ
The second term of Eq. 3 we used here is the posterior
expectation, E½f ðyjgÞjy� which is also approximated using
the parameters of an MCMC chain.
Dð~gÞ ¼ �2 log f ðyÞ ¼ �2 logEh½f ðyjgÞjy�
� �2 log1
M
XMm¼1
f ðyjgðmÞÞ ð6Þ
From Eqs. 5 and 6, Eq. 3 is the expanded form of Eq. 4. In
the Bayesian LCA model, f ðyjgðmÞÞ is
f ðyjkðmÞ; pðmÞÞ ¼XKk¼1
pðmÞk
Yni
YJj
kðmÞkj
� �yij1� kðmÞkj
� �1�yij
and the posterior mean deviance is
Dðp;kÞ¼� 2
M
XMm¼1
logXKk¼1
pðmÞk
Yni
YJj
kðmÞkj
� �yij1�kðmÞkj
� �1�yij
and DðgÞ is
Dðp; kÞ ¼ �2 log
(1
M
XMm¼1
XKk¼1
pðmÞk
Yni
YJj
kðmÞkj
� �yij
� 1� kðmÞkj
� �1�yij
):
For the Bayesian IRT model, the likelihood is
f ðyjh; a; bÞ ¼Yni
YJj¼1
eajðhi�bjÞ
1þ eajðhi�bjÞ
� �yij1� eajðhi�bjÞ
1þ eajðhi�bjÞ
� �1�yij
therefore DðgÞ is
Dðh; a; bÞ ¼ � 2
M
XMm¼1
logYni
YJj¼1
eaðmÞj ðhðmÞi �b
ðmÞj Þ
1þ eaðmÞj ðhðmÞi �b
ðmÞj Þ
" #yij
� 1� eaðmÞj ðhðmÞi �b
ðmÞj Þ
1þ eaðmÞj ðhðmÞi �b
ðmÞj Þ
" #1�yij
and DðgÞ is
Dðh; a; bÞ ¼ �2 log
(1
M
XMm¼1
Yni
YJj¼1
eaðmÞj ðhðmÞi �b
ðmÞj Þ
1þ eaðmÞj ðhðmÞi �b
ðmÞj Þ
" #yij
� 1� eaðmÞj ðhðmÞi �b
ðmÞj Þ
1þ eaðmÞj ðhðmÞi �b
ðmÞj Þ
" #1�yij):
References
Abecasis GR, Cherny SS, Cookson WOC, Cardon LR (2001) Grr:
graphical representation of relationship errors
Abecasis GR, Cherny SS, Cookson WO, Cardon LR (2002) Merlin-
rapid analysis of dense genetic maps using sparse gene flow
trees. Nat Genet 30:97–101
Anttila V, Kallela M, Oswell G, Kaunisto MA, Nyholt DR,
Hamalainen E, Havanka H, Ilmavirta M, Terwilliger J, Sobel
E (2006) Trait components provide tools to dissect the genetic
susceptibility of migraine. Am J Hum Genet 79(1):85–99
Anttila V, Nyholt DR, Kallela M, Artto V, Vepsalainen S, Jakkula E,
Wennerstrom A, Tikka-Kleemola P, Kaunisto MA, Hamalainen
E (2008) Consistently replicating locus linked to migraine on
10q22-q23. Am J Hum Genet 82(5):1051–1063
Bjornsson A, Gudmundsson G, Gudfinnsson E, Hrafnsdottir M,
Benedikz J, Skuladottir S, Kristjansson K, Frigge ML, Kong A,
Stefansson K, Gulcher JR (2003) Localization of a gene for
migraine without aura to chromosome 4q21. Am J Hum Genet
73(5):986–993
Cader ZM, Noble-Topham S, Dyment DA, Cherny SS, Brown JD,
Rice GPA, Ebers GC (2003) Significant linkage to migraine with
aura on chromosome 11q24. Hum Mol Genet 12(19):2511–2517
Cassidy F, Pieper CF, Carroll BJ (2001) Subtypes of mania
determined by grade of membership analysis. Neuropsychophar-
macology 25(3):373–83
Celeux G, Forbes F, Robert C, Titterington M (2006) Deviance
information criteria for missing data models. Bayesian Statistics. p 6
Chen CCM, Mengersen KL, Keith JM, Martin NG, Nyholt DR (2009)
Linkage and heritability analysis of migraine symptom group-
ings: a comparison of three different clustering methods on twin
data (submitted)
Corder EH, Woodbury MA (1993) Genetic heterogeneity in alzhei-
mer’s disease: a grade of membership analysis. Genet Epidemiol
10:495–499
Cornes BK, Medland SE, Ferreira MAR, Morley KI, Duffy DL,
Heijmans BT, Montgomery GW, Martin NG (2005) Sex-limited
genome-wide linkage scan for body mass index in an unselected
sample of 933 australian twin families. Twin Res Hum Genet
8(6):616–632
De Fusco M, Marconi R, Silvestri L, Atorino L, Rampoldi L,
Morgante L, Ballabio A, Aridon P, Casari G (2003) Haploin-
sufficiency of atp1a2 encoding the Na?/K? pump alpha2 subunit
associated with familial hemiplegic migraine type 2. Nat Genet
33(2):192–6
Devlin B, Bacanu SA, Klump KL, Bulik CM, Fichter MM, Halmi
KA, Kaplan AS, Strober M, Treasure J, Woodside DB (2002)
Linkage analysis of anorexia nervosa incorporating behavioral
covariates. Hum Mol Genet 11(6):689–696
Hum Genet (2009) 126:277–288 287
123
Dichgans M, Freilinger T, Eckstein G, Babini E, Lorenz-
Depiereux B, Biskup S, Ferrari MD, Herzog J, van den
Maagdenberg A, Pusch M (2005) Mutation in the neuronal
voltage-gated sodium channel scn1a in familial hemiplegic
migraine. Lancet 366(9483):371–377
Duffy DL (2002) Sib-pair version 099 9. Queensland Institute of
Medical Research, Brisbane, Australia
Duren WL, Epstein MP, Li M, Boehnke M (2003) Relpair: a program
that infers the relationships of pairs of individuals based on
marker data
Eaves L, Silberg J, Foley D, Bulik C, Maes H, Erkanli A, Angold A,
Costello EJ, Worthman C (2004) Genetic and environmental
influences on the relative timing of pubertal change. Twin Res
7(5):471–481
Eaves L, Erkanli A, Silberg J, Angold A, Maes HH, Foley D (2005)
Application of bayesian inference using gibbs sampling to item-
response theory modeling of multi-symptom genetic data. Behav
Genet 35(6):765–780
Epstein MP, Duren WL, Boehnke M (2000) Improved inference of
relationship for pairs of individuals. Am J Hum Genet 67(5):
1219–1231
Fillenbaum GG (1998) Typology of alzheimer’s disease: findings
from cerad data. Aging Mental Health 2(2):105–127
Hallmayer JF, Jablensky A, Michie P, Woodbury M, Salmon B,
Combrinck J, Wichmann H, Rock D, Ercole MD, Howell S,
Dragovic M, Kent A (2003) Linkage analysis of candidate
regions using a composite neurocognitive phenotype correlated
with schizophrenia. Mol Psychiatry 8(5):511
Headache Classification Committee of the International Headache
Society (1988) Classification and diagnostic criteria for headache
disorders, cranial neuralgias and facial pain. Cephalagia 8:1–96
Jones KW, Ehm MG, Pericak-Vance MA, Haines JL, Boyd PR,
Peroutka SJ (2001) Migraine with aura susceptibility locus on
chromosome 19p13 is distinct from the familial hemiplegic
migraine locus. Genomics 78(3):150–154
Kaabi B, Gelernter J, Woods SW, Goddard A, Page GP, Elston RC
(2006) Genome scan for loci predisposing to anxiety disorders
using a novel multivariate approach: strong evidence for a
chromosome 4 risk locus. Am J Hum Genet 78:543
Kaufman L, Rousseeuw PJ (1990) Finding groups in data : an
introduction to cluster analysis. Applied probability and statis-
tics. Wiley series in probability and mathematical statistics.
Wiley, New York
Kong A, Cox NJ (1997) Allele-sharing models: Lod scores and
accurate linkage tests. Am J Hum Genet 61(5):1179–1188
Kong X, Murphy K, Raj T, He C, White PS, Matise TC (2004) A
combined linkage-physical map of the human genome. Am J
Hum Genet 75(6):1143–8
Kruglyak L, Daly MJ, Reeve-Daly MP, Lander ES (1996) Parametric
and nonparametric linkage analysis: a unified multipoint
approach. Am J Hum Genet 58(6):1347–1363
Lange K, Weeks D, Boehnke M (1988) Programs for pedigree
analysis: Mendel, fisher, and dgene. Genet Epidemiol 5(6):471–2
Ligthart L, Boomsma DI, Martin NG, Stubbe JH, Nyholt DR (2006)
Migraine with aura and migraine without aura are not distinct
entities: further evidence from a large dutch population study.
Twin Res Hum Genet 9(1):54–63
Ligthart L, Nyholt DR, Hottenga JJ, Distel MA, Willemsen G,
Boomsma DI (2008) A genome-wide linkage scan provides
evidence for both new and previously reported loci influencing
common migraine. Am J Med Genet B Neuropsychiatr Genet
147B(7):1186–1195
McLachlan GJ, Do KA, Ambroise C (2005) Analyzing microarray
gene expression data. Wiley, New York
Mulder EJ, Van Baal C, Gaist D, Kallela M, Kaprio J, Svensson DA,
Nyholt DR, Martin NG, MacGregor AJ, Cherkas LF (2003)
Genetic and environmental influences on migraine: a twin study
across six countries. Twin Res 6(5):422–31
Neale MC (1997) MX: statistical modeling. Department of Psychi-
atry, Medical College of Virginia
Nyholt DR, Gillespie NG, Heath AC, Merikangas KR, Duffy DL,
Matrin NG (2004) Latent class and genetic analysis does not
support migraine with aura and migraine without aura as
separate entities. Genet Epidemiol 26:231–244
Nyholt DR, Morley KI, Ferreira MAR, Medland SE, Boomsma DI,
Heath AC, Merikangas KR, Montgomery GW, Matrin NG
(2005) Genomewide significant linkage to migrainous headache
on chromosome 5q21. Am J Hum Genet 77:500–512
Olesen J, Steiner TJ (2004) The international classification of
headache disorders, 2nd edn (ICHD-ii). Br Med J 75(6):808
Schwarz G (1978) Estimating the dimension of a model. Ann Stat
6(2):461–464
Silberstein S, Olesen J, Bousser MG, Diener HC, Dodick D, First M,
Goadsby P, Gobel H, Lainez M, Lance J (2005) The international
classification of headache disorders, (ICHD-ii)-revision of criteria
for 8.2 medication-overuse headache. Cephalalgia 25(6):460–465
Soragna D, Vettori A, Carraro G, Marchioni E, Vazza G, Bellini S,
Tupler R, Savoldi F, Mostacciuolo ML (2003) A locus for
migraine without aura maps on chromosome 14q21.2-q22.3. Am
J Hum Genet 72(1):161
Spiegelhalter D, Thomas A, Best N, Lunn D (2006) Winbugs 1.4. 1.
bayesian inference using gibbs sampling
Spiegelhalter DJ, Best NG, Carlin BP, van der Linde A (2002)
Bayesian measures of model complexity and fit. J Roy Stat Soc
B 64(4):583–639
Svensson DA, Larsson B, Waldenlind E, Pedersen NL (2003) Shared
rearing environment in migraine: results from twins reared apart
and twins reared together. Headache 43(3):235–244
Svensson DA, Waldenlind E, Ekbom K, Pedersen NL (2004)
Heritability of migraine as a function of definition. Headache
5(3):171
Vanmolkot KR, Kors EE, Hottenga JJ, Terwindt GM, Haan J,
Hoefnagels WA, Black DF, Sandkuijl LA, Frants RR, Ferrari
MD (2003) Novel mutations in the Na?, K?-ATPase pump gene
atp1a2 associated with familial hemiplegic migraine and benign
familial infantile convulsions. Ann Neurol 54(3):360–6
Wessman M, Kallela M, Kunisto MA, Marttila P, Sobel E, Hartiala J,
Oswell G, Leal SM, Papp JC, Hamalainen E, Broas P, Joslyn G,
Hovatta I, Hiekkalinna T, Kaprio J, Ott J, Cantor RM, Zwart JA,
Ilmavirta M (2002) A susceptibility locus for migraine with aura,
on chromosome 4q24. Am J Hum Genet 70(3):652
Wessman M, Terwindt GM, Kaunisto MA, Palotie A, Ophoff RA
(2007) Migraine: a complex genetic disorder. Lancet Neurol
6(6):521–532
Whittemore AS, Halpern J (1994) A class of tests for linkage using
affected pedigree members. Biometrics 50(1):118–127
Woodbury MA, Clive J, Garson Jr A (1978) Mathematical typology: a
grade of membership technique for obtaining disease definition.
Comput Biomed Res 11(3):277–98
Wray NR, Coventry WL, James MR, Montgomery GW, Eaves LJ,
Martin NG (2008) Use of monozygotic twins to investigate the
relationship between 5httlpr genotype, depression and stressful
life events: an application of item response theory. In: Rutter M
(ed) Novartis Foundation Sympoisum, Genetic effects on
environmental vulnerability to disease, vol. 293, pp 48–68
Zhu G, Evans DM, Duffy DL,Montgomery GW,Medland SE, Gillespie
NA, Ewen KR, Jewell M, Liew YW, Hayward NK (2004) A
genomescan for eye color in502 twin families:most variation is due
to a qtl on chromosome 15q. Twin Res 7(2):197–210
Ziegler DK, Hur YM, Bouchard TJ, Hassanein RS, Barter R (1998)
Migraine in twins raised together and apart. Headache 38(6):
417–422
288 Hum Genet (2009) 126:277–288
123