Embed Size (px)
Citation preview
Gupta et al. BMC Bioinformatics 2010, 11:295http://www.biomedcentral.com/1471-2105/11/295
Open AccessR E S E A R C H A R T I C L E
Research articleBayesian integrated modeling of expression data: a case study on RhoGRashi Gupta*1,2, Dario Greco2, Petri Auvinen2 and Elja Arjas1,3
AbstractBackground: DNA microarrays provide an efficient method for measuring activity of genes in parallel and even covering all the known transcripts of an organism on a single array. This has to be balanced against that analyzing data emerging from microarrays involves several consecutive steps, and each of them is a potential source of errors. Errors tend to accumulate when moving from the lower level towards the higher level analyses because of the sequential nature. Eliminating such errors does not seem feasible without completely changing the technologies, but one should nevertheless try to meet the goal of being able to realistically assess degree of the uncertainties that are involved when drawing the final conclusions from such analyses.
Results: We present a Bayesian hierarchical model for finding differentially expressed genes between two experimental conditions, proposing an integrated statistical approach where correcting signal saturation, systematic array effects, dye effects, and finding differentially expressed genes, are all modeled jointly. The integration allows all these components, and also the associated errors, to be considered simultaneously. The inference is based on full posterior distribution of gene expression indices and on quantities derived from them rather than on point estimates. The model was applied and tested on two different datasets.
Conclusions: The method presents a way of integrating various steps of microarray analysis into a single joint analysis, and thereby enables extracting information on differential expression in a manner, which properly accounts for various sources of potential error in the process.
BackgroundMicroarrays are popular high-throughput biologicalassays that measure the expression level of thousands ofgenes in the biological samples and generate large, com-plex datasets. In spite of the advances in technology, it is amajor challenge to produce reliable gene expression datawith a high signal-to-noise ratio, and analyze these largedatasets in an adequate manner. Analyzing microarraydata is usually performed in a step-wise manner, startingwith, (i) normalization of the intensity measurements, toadjust or account for systematic technical variation, (ii)correcting dye-bias if dye-bias remains after normaliza-tion, (iii) identifying differentially expressed genes on thenormalized data, and completing the analysis with (iv)functional annotation of the differentially expressed
genes. All these steps are regarded as independent, butthey are crucial for any biologically meaningful analysis.
Normalization is an integral part of the analysis, aimingat retaining the systematic effects resulting from the bio-logical process of interest while removing the systematictechnical variations occurring due to experimental vari-ability. Normalization has researched for quite some timeand publications proposing new procedures are available[1-4]. Some datasets display a consistent bias for a givenprobe in either Cy3 or Cy5 direction even after the datahave been normalized using median-centered and lowessnormalization methods. This bias is called dye bias and itis observed on a variety of platforms and labeling sys-tems, including PCR-spotted and short oligonucleotidelabeling methods. Many experimentalists and statisti-cians recommend using a dye-swap design to correct forthis bias. Some publications have shown by consideringexperimental data that, if uncorrected, this bias can leadto the erroneous identification of genes [5-7].
* Correspondence: [email protected] Department of Mathematics and Statistics, University of Helsinki, P.O. Box 68, FIN-00014, Helsinki, FinlandFull list of author information is available at the end of the article
© 2010 Gupta et al; licensee BioMed Central Ltd. This is an Open Access article distributed under the terms of the Creative CommonsAttribution License (http://creativecommons.org/licenses/by/2.0), which permits unrestricted use, distribution, and reproduction inany medium, provided the original work is properly cited.
Gupta et al. BMC Bioinformatics 2010, 11:295http://www.biomedcentral.com/1471-2105/11/295
Page 2 of 11
Identification of differentially expressed genes is usuallythe main goal of microarray experiment. Chen et al. [8]assessed differentially expressed genes by calculating foldchanges between genes under different conditions. Fold-change method, the simplest and the most intuitivemethod for finding genes that are differentially expressed,has many drawbacks. Later, improved methods based ont-test, regularized t-test [9,10] were proposed. Modelbased approaches have also been published to identifydifferentially expressed genes. Most methods listed in theliterature use point estimates of expression and dependupon replicates available for the estimation of variances.
Step-wise analysis of the microarray data has two majordrawbacks: (i) output from one step acts as direct input tothe next, without attempting to account for the uncer-tainties associated with the value that was obtained; as aconsequence, (ii) re-analyzing the data by altering themethod used for a single step will often produce conflict-ing results. For this reason, Bhattacharjee et al. [11] pro-posed a method that aims at integrating the independentsteps, so that uncertainties from each step could beaccounted systematically. Lewin et al. [12] also proposedan integration of the normalization and classification stepby using a Hierarchical Bayesian model. These proposedintegrated approaches performed better than their step-wise approach counterparts. Moreover, the Bayesian for-mulation enables a much richer output than current step-wise analyses.
In here, we also propose an integrated statistical modelunder the Bayesian framework, where normalization anddifferential expression are modeled jointly, and correc-tion of the saturated signal is also incorporated. Satura-tion refers to the optical saturation and not chemicalsaturation. Such (optical) signal saturation occurs in thescanning of hybridized arrays when the digitalized signalfrom a pixel exceeds the scanner's upper threshold ofdetection (216-1 = 65535, for a 16 bit computer storagesystem). Saturation causes a downward bias in geneexpression measurements, which then affects high levelanalysis, such as class prediction, class comparison orclustering that utilizes these signals [13].
Usually, data extracted from a single scan and a singlescanner setting is used for all high level analyses. How-ever, a single setting is unable to capture correctly theexpression of both weakly and highly expressed genes. Asa result, the sensitivity level of the scanner is adjusted toget reliable measurements from all fluorescent spotspresent on the hybridized array. Scanner sensitivity has tobe raised to a certain level to ensure that the signal fromweakly expressed genes exceeds the intrinsic noise levelof the scanner, but this causes saturation for highlyexpressed genes. Several methods [14-19] have been pro-posed for correcting the bias caused by signal saturation.
In here, we extend our previous work (Gupta et al. [19])on handling signal saturation by using several scans atvarying scanner sensitivities. We propose an integratedstatistical approach where correcting signal saturation,systematic array effects, gene-specific dye effects, and dif-ferential expression are modeled simultaneously. We esti-mate our model in a fully Bayesian way with theWinBUGS software [20]. The Bayesian framework allowsfor joint estimation of a large number of parameters, andenables us to obtain here the posterior distribution of anyparameter in the model and of any function of suchparameters. We show how to exploit these posterior dis-tributions to assess differential expression, using multiplecriteria for this purpose. The uncertainties in the parame-ter estimates are thereby incorporated in a natural man-ner into a proposed list of candidate genes.
MethodDataRhoG is a protein belonging to the family of the smallGTPases [21,22]. It is involved in several intracellular sig-naling pathways regulating cell motility and adhesion toextracellular matrix. Together with Cdc42 and Rac1,RhoG is able to elicit formation of both filopodia andlamellipodia. Neurite formation and regulation of axondynamics in neurons are more specific functions in whichRhoG is acting together with other Rho proteins and theirinteractors. Within the cells, Rho proteins can be foundin an active form and inactive form. Mutants of RhoG(RhoG12 and RhoG17) can be used to keep the protein ina constitutively activated (mutation of the 12th aminoacid) or inactivated (mutation of the 17th amino acid)form. In this study we investigate effect of mutantsRhoG12 and RhoG17 on the gene expression of HeLa celllines.
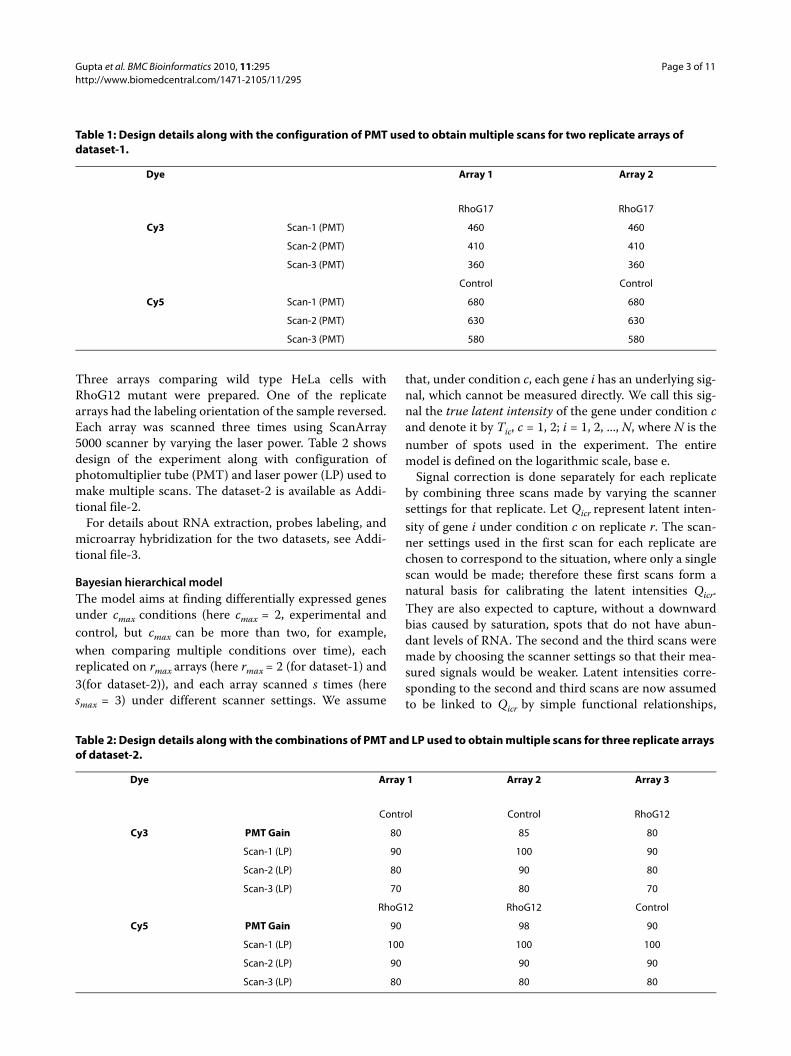
Dataset-1The DNA microarrays used for studying the effect ofRhoG17 in HeLa cells were Agilent human 4 × 44 k andcontained about 44000 60-mer oligonucleotide probes.Three replicate arrays were made initially but only twowere used due to some technical problem in one of thearrays. Each array was scanned three times using AxonGenePix 4200AL scanner by varying the photomultipliertube (PMT). The design of the experiment along with theconfiguration of PMT used to make multiple scans isgiven in Table 1. The dataset-1 is available as Additionalfile-1.
Dataset-2The DNA microarrays used for studying the effect ofRhoG12 in HeLa cells were produced by the Turku Cen-ter for Biotechnology, University of Turku, Finland andcontained 16,000 human cDNAs spotted in duplicate.
Gupta et al. BMC Bioinformatics 2010, 11:295http://www.biomedcentral.com/1471-2105/11/295
Page 3 of 11
Three arrays comparing wild type HeLa cells withRhoG12 mutant were prepared. One of the replicatearrays had the labeling orientation of the sample reversed.Each array was scanned three times using ScanArray5000 scanner by varying the laser power. Table 2 showsdesign of the experiment along with configuration ofphotomultiplier tube (PMT) and laser power (LP) used tomake multiple scans. The dataset-2 is available as Addi-tional file-2.
For details about RNA extraction, probes labeling, andmicroarray hybridization for the two datasets, see Addi-tional file-3.
Bayesian hierarchical modelThe model aims at finding differentially expressed genesunder cmax conditions (here cmax = 2, experimental andcontrol, but cmax can be more than two, for example,when comparing multiple conditions over time), eachreplicated on rmax arrays (here rmax = 2 (for dataset-1) and3(for dataset-2)), and each array scanned s times (heresmax = 3) under different scanner settings. We assume
that, under condition c, each gene i has an underlying sig-nal, which cannot be measured directly. We call this sig-nal the true latent intensity of the gene under condition cand denote it by Tic, c = 1, 2; i = 1, 2, ..., N, where N is thenumber of spots used in the experiment. The entiremodel is defined on the logarithmic scale, base e.
Signal correction is done separately for each replicateby combining three scans made by varying the scannersettings for that replicate. Let Qicr represent latent inten-sity of gene i under condition c on replicate r. The scan-ner settings used in the first scan for each replicate arechosen to correspond to the situation, where only a singlescan would be made; therefore these first scans form anatural basis for calibrating the latent intensities Qicr.They are also expected to capture, without a downwardbias caused by saturation, spots that do not have abun-dant levels of RNA. The second and the third scans weremade by choosing the scanner settings so that their mea-sured signals would be weaker. Latent intensities corre-sponding to the second and third scans are now assumedto be linked to Qicr by simple functional relationships,
Table 2: Design details along with the combinations of PMT and LP used to obtain multiple scans for three replicate arrays of dataset-2.
Dye Array 1 Array 2 Array 3
Control Control RhoG12
Cy3 PMT Gain 80 85 80
Scan-1 (LP) 90 100 90
Scan-2 (LP) 80 90 80
Scan-3 (LP) 70 80 70
RhoG12 RhoG12 Control
Cy5 PMT Gain 90 98 90
Scan-1 (LP) 100 100 100
Scan-2 (LP) 90 90 90
Scan-3 (LP) 80 80 80
Table 1: Design details along with the configuration of PMT used to obtain multiple scans for two replicate arrays of dataset-1.
Dye Array 1 Array 2
RhoG17 RhoG17
Cy3 Scan-1 (PMT) 460 460
Scan-2 (PMT) 410 410
Scan-3 (PMT) 360 360
Control Control
Cy5 Scan-1 (PMT) 680 680
Scan-2 (PMT) 630 630
Scan-3 (PMT) 580 580
Gupta et al. BMC Bioinformatics 2010, 11:295http://www.biomedcentral.com/1471-2105/11/295
Page 4 of 11
respectively by fcr2(Qicr) and fcr3(Qicr) (discussed brieflylater).
Let Yicrs denote the observed intensity for spot i undercondition c and scan s of replicate r. As discussed inGupta et al. [19], the relation between the observed andthe latent intensity is non-linear. If there were no mea-surement errors, we could write the observed intensityYicrs in the form Yicrs = fcrs(Qicr). However, extraction ofintensities of genes from scanned microarrays alwaysinvolves some measurement errors. Here we assume thatthe errors are modulated by the latent signal level in alog-additive fashion. More exactly, we assume that for theobserved intensities, which are below a certain thresholdso that saturation has no effect, the relationship betweenobserved and latent intensities can be expressed as:
where, εicrs is the error associated with spot i under con-dition c and scan s of replicate r. We further assume thatthe estimated latent intensity Qicr of gene i under condi-tion c on replicate r can be modeled with additive gene,array and dye effects:
where, Tic is the true latent intensity of a gene i undercondition c, Air is the array effect, and βi is the gene-spe-cific dye effect. Since for cDNA experiments both thecontrol and the experimental samples are hybridized onthe same array, the array effect (Air) is not dependent onthe condition c. The gene-specific dye-bias correction (βi)is only applied when the values are taken from Cy5 inten-sity data, as enforced by the indicator function I(Cy5)cr.However, the symmetric model in which the correction isapplied to Cy3 channel only would perform identicallywith the difference that the bias terms would be negated.A similar gene-specific dye bias correction was used inKelley et al. [7].
The functions fcr2 and fcr3 in equation (1) are unknownand need to be estimated from the data. We assume thesefunctions to be increasing and continuous. For their esti-mation, we decided to break the whole range of geneexpression data (loge(200), loge(65535)) into small inter-vals yet ensuring enough data points in each of theseintervals. We call these intervals as I1, I2, ... Ik, and assumea simple linear form for fcr2 and fcr3 in each interval. Inother words, we set
where, L(Ik) is the length of the kth interval. The arrayeffects (Air) are estimated over the set of intervals I1, I2, ...Ik, subject to the constraints �r Ajr = 0, j = 1, 2, ...., k toensure identifiability. Estimation of array effects over a setof intervals is similar to the intensity based estimation ofarray effects previously reported in Yang et al. [1] andDudoit et al. [4].
To complete the specification of the model, weassumed Uniform prior distribution over the interval [0,15] on logarithmic scale for Tic. The array effects Ajr wereassigned Normal priors with mean 0 and precision 0.1(inverse of variance). The parameters bjcr and djcr wereassigned Uniform priors over the interval [0, 5]. Genespecific dye effects βi were also assigned Normal priorswith mean 0 and precision 0.1. The errors εicrs areassumed to be independent and identically distributedNormal random variables with mean 0 and intervaldependent variances η2
jcrs, where s = 1, 2, 3; j = 1, 2, ...., k.The interval dependent precision parameters (ηjcr1
2, ηjcr22,
and ηjcr32; j = 1, 2, ..., k) were assigned gamma priors with
parameters (0.001, 0.001).Finally, as per Gupta et al. [19], to account for the effect
of saturation, we treated signal measurements exceedingthe threshold of loge(45000) as 'missing data'. We com-pensated for the resulting loss of information by applyingmodel-based data augmentation and using the measure-ments taken from the second and/or the third scan whichhad been obtained by varying scanner settings.
ImplementationThe model was formulated in BUGS language andparameter estimation was performed using WinBUGS[20].
Y f Qicrs crs icr icrs= +( ) ,e (1)
Q T A Iicr ic ir cr i= + + ( )Cy5 b , (2)
f Q
b Q Q I
b I b Q I
cr icr
cr icr icr
cr cr icr
2
1
1 1 2 1
if
L L
( )=
= ( ) + ( )–
C- 1
(( )…………
= ( ) + ( ) + ……
+
.
.
if
L L
1 1 2 2
Q I
b I b I
b Q
icr
cr cr
kcr ic
C- 2
rr k icr k
cr icr
cr icr icr
I I Q I
f Q
d Q Q
– ..L if
if
1
3
1
+ +( )( )( )
=
−1 C-
CC-
C-
I
d I d Q I Q I
d
cr cr icr icr
cr
1
2= ( ) + ( )( )…………
=
1 1 2 1
1
L L if
L
–
.
II d I
d Q I I Q I
cr
kcr icr k icr
1 2 2
1
L
L if
( ) + ( ) + ……
+ + +( )( )−
.
– .. 1 C- kk
(3)
Gupta et al. BMC Bioinformatics 2010, 11:295http://www.biomedcentral.com/1471-2105/11/295
Page 5 of 11
Rules for selecting genesUsing the Bayesian model as specified above and with theavailable data, we can estimate, for each gene i, i = 1,.....,N, the joint posterior distribution of (Ti1, Ti2), i.e., of thetrue underlying expression levels for the two conditionsinvolved. Based on this, we can further determine theposterior distribution of Di = Ti1 -Ti2, i = 1,....., N, whichrepresent the differential expression between conditions1 and 2 in gene i. There are several ways in which the pos-terior distribution of Di can be exploited with the aim ofidentifying differential expression. Here we propose amethod where we first select suitable threshold valuesDthres
+ and Dthres- for such differences and then consider a
ranking based on the posterior probabilities:
Genes are selected as being potentially up-regulated ifpi
+ > pcut and down-regulated if pi- > pcut, where again the
cut-off point pcut needs to be chosen in advance. Theseposterior probabilities (pi
+ and pi-) are easily estimated by
counting the proportion of MCMC samples in which thechosen criteria are satisfied. The choice of the controllingthreshold values pcut, Dthres
+ and Dthres- depends on the
biological question being studied, and can be problematicto choose. However, in practice, the values are chosenonly after a preliminary analysis of the data.
The above-mentioned criterion is quite similar to thecriterion used in Lewin et al. [12], for selecting interest-ing genes. Other criteria for ranking genes include the useof standardized differences, zi = mean(Di)/sd(Di), anddetermining the highest percentile for which the credibil-ity interval for Di does not cover zero [23]. It is importantto note that identification of differentially expressedgenes is here based directly on determining the gene-wiseposterior probabilities that the latent 'true' difference inexpression in the two conditions exceeds a certain thresh-old. Thus our method does not use the general frame-
work of statistical hypothesis testing, involving, forexample, p-values, or corrections of significance levels toaccount for multiple testing. Unlike Lewin et al. [12], wealso have here not made an attempt to calibrate the cho-sen thresholds on the basis of frequentist criteria such asFalse Discovery/Non-Discovery Rate.
Results and DiscussionApplication to dataset-1The model under "Bayesian hierarchical model" withoutparameter (βi) was applied to dataset-1 to illustrate thecriterion presented under "Rules for selecting genes".Since both replicate arrays from dataset-1 have the samedye-orientation, the dye-bias in the data cannot beassessed.
Computational details and parameter estimationFor dataset-1, foreground median values for each condi-tion without background correction were used for theanalysis. As a result, we had no negative values. This par-ticular dataset had 43,376 genes (on single array) × 2 (rep-licates used) × 3 (scans used) × 2 (dyes/conditions) =520,512 data points to be used for the analysis. The cur-rent model runs in OpenBUGS version 2.01 on Intel Pen-tium processor 2.80 GHz with 1 GB RAM and takesapproximately 4 seconds per iteration using two chains inparallel. Convergence was monitored visually (i.e. by themixing of two chains) and two chains of 10,000 iterationseach were generated to check the convergence of theparameter estimates under consideration. Thereafter asample of size 10,000 was generated to make inference.
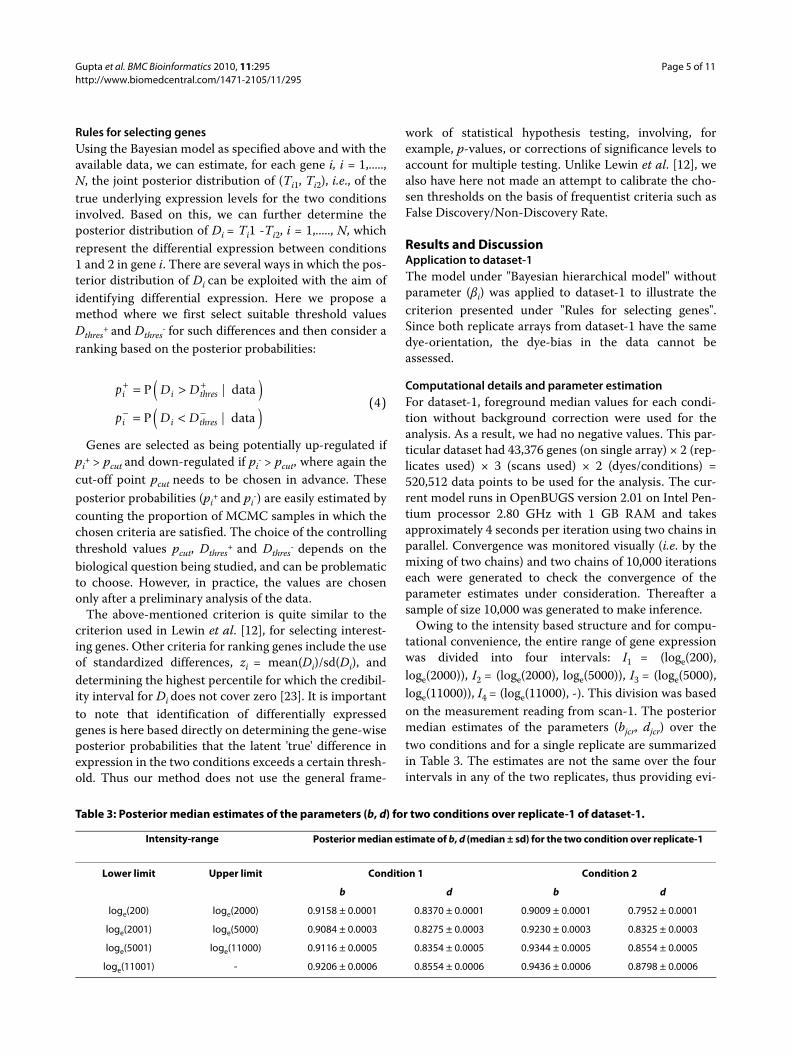
Owing to the intensity based structure and for compu-tational convenience, the entire range of gene expressionwas divided into four intervals: I1 = (loge(200),loge(2000)), I2 = (loge(2000), loge(5000)), I3 = (loge(5000),loge(11000)), I4 = (loge(11000), -). This division was basedon the measurement reading from scan-1. The posteriormedian estimates of the parameters (bjcr, djcr) over thetwo conditions and for a single replicate are summarizedin Table 3. The estimates are not the same over the fourintervals in any of the two replicates, thus providing evi-
p D D
p D D
i i thres
i i thres
+ +
− −
= >( )= <( )
P data
P data
|
|(4)
Table 3: Posterior median estimates of the parameters (b, d) for two conditions over replicate-1 of dataset-1.
Intensity-range Posterior median estimate of b, d (median ± sd) for the two condition over replicate-1
Lower limit Upper limit Condition 1 Condition 2
b d b d
loge(200) loge(2000) 0.9158 ± 0.0001 0.8370 ± 0.0001 0.9009 ± 0.0001 0.7952 ± 0.0001
loge(2001) loge(5000) 0.9084 ± 0.0003 0.8275 ± 0.0003 0.9230 ± 0.0003 0.8325 ± 0.0003
loge(5001) loge(11000) 0.9116 ± 0.0005 0.8354 ± 0.0005 0.9344 ± 0.0005 0.8554 ± 0.0005
loge(11001) - 0.9206 ± 0.0006 0.8554 ± 0.0006 0.9436 ± 0.0006 0.8798 ± 0.0006
Gupta et al. BMC Bioinformatics 2010, 11:295http://www.biomedcentral.com/1471-2105/11/295
Page 6 of 11
dence of the intensity dependent structure of our data.The array effects (Ajr) were also estimated over the sameintervals, subject to the constraints �r Ajr = 0 to ensureidentifiability. The array effects (in terms of posteriormedian and sd) over the two replicates are shown inTable 4.
The breakpoints were selected using visual inspection,but it would also be possible to treat them as modelparameters and then estimate them jointly with bjcr, djcrand Ajr. This was not done here because of the additionalcomputational burden that would have resulted in ana-lyzing the huge dataset.
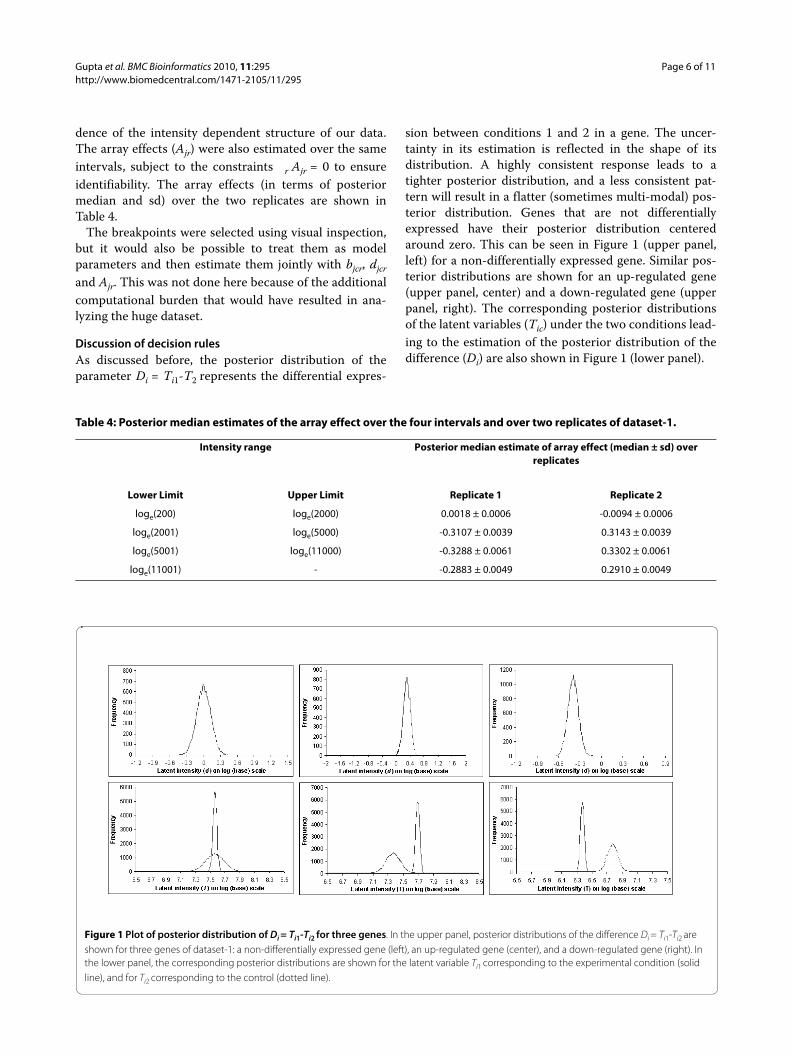
Discussion of decision rulesAs discussed before, the posterior distribution of theparameter Di = Ti1-T2 represents the differential expres-
sion between conditions 1 and 2 in a gene. The uncer-tainty in its estimation is reflected in the shape of itsdistribution. A highly consistent response leads to atighter posterior distribution, and a less consistent pat-tern will result in a flatter (sometimes multi-modal) pos-terior distribution. Genes that are not differentiallyexpressed have their posterior distribution centeredaround zero. This can be seen in Figure 1 (upper panel,left) for a non-differentially expressed gene. Similar pos-terior distributions are shown for an up-regulated gene(upper panel, center) and a down-regulated gene (upperpanel, right). The corresponding posterior distributionsof the latent variables (Tic) under the two conditions lead-ing to the estimation of the posterior distribution of thedifference (Di) are also shown in Figure 1 (lower panel).
Table 4: Posterior median estimates of the array effect over the four intervals and over two replicates of dataset-1.
Intensity range Posterior median estimate of array effect (median ± sd) over replicates
Lower Limit Upper Limit Replicate 1 Replicate 2
loge(200) loge(2000) 0.0018 ± 0.0006 -0.0094 ± 0.0006
loge(2001) loge(5000) -0.3107 ± 0.0039 0.3143 ± 0.0039
loge(5001) loge(11000) -0.3288 ± 0.0061 0.3302 ± 0.0061
loge(11001) - -0.2883 ± 0.0049 0.2910 ± 0.0049
Figure 1 Plot of posterior distribution of Di = Ti1-Ti2 for three genes. In the upper panel, posterior distributions of the difference Di = Ti1-Ti2 are shown for three genes of dataset-1: a non-differentially expressed gene (left), an up-regulated gene (center), and a down-regulated gene (right). In the lower panel, the corresponding posterior distributions are shown for the latent variable Ti1 corresponding to the experimental condition (solid line), and for Ti2 corresponding to the control (dotted line).
Gupta et al. BMC Bioinformatics 2010, 11:295http://www.biomedcentral.com/1471-2105/11/295
Page 7 of 11
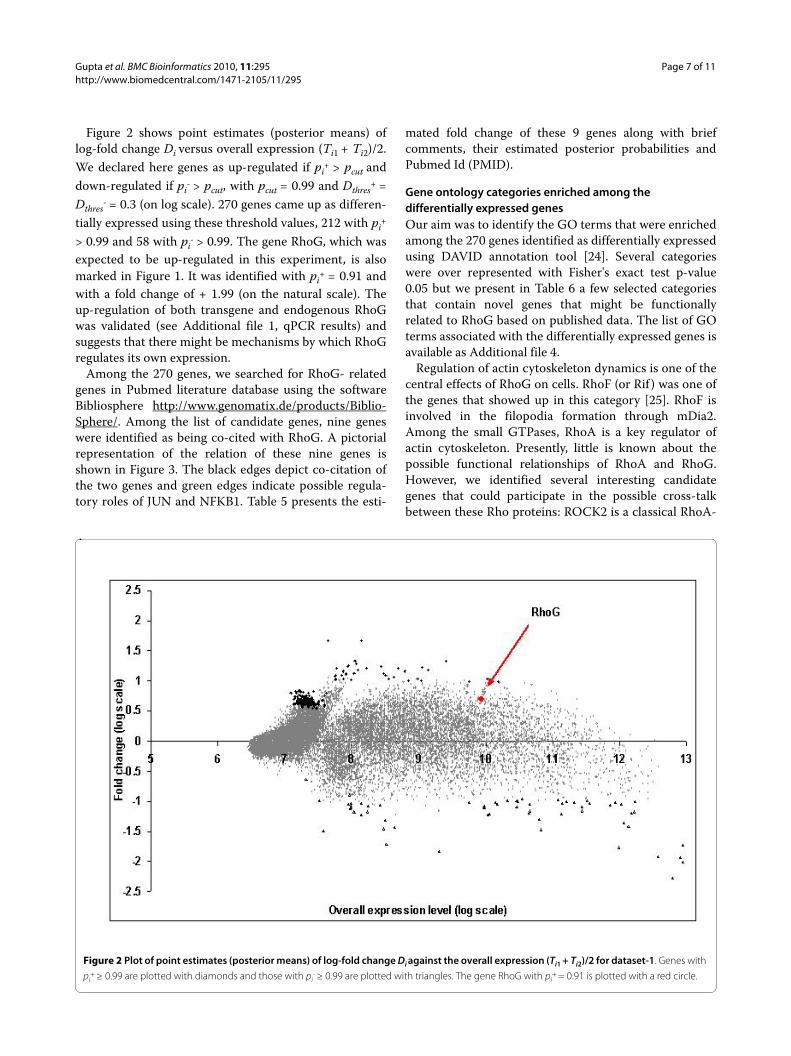
Figure 2 shows point estimates (posterior means) oflog-fold change Di versus overall expression (Ti1 + Ti2)/2.We declared here genes as up-regulated if pi
+ > pcut anddown-regulated if pi
- > pcut, with pcut = 0.99 and Dthres+ =
Dthres- = 0.3 (on log scale). 270 genes came up as differen-
tially expressed using these threshold values, 212 with pi+
> 0.99 and 58 with pi- > 0.99. The gene RhoG, which was
expected to be up-regulated in this experiment, is alsomarked in Figure 1. It was identified with pi
+ = 0.91 andwith a fold change of + 1.99 (on the natural scale). Theup-regulation of both transgene and endogenous RhoGwas validated (see Additional file 1, qPCR results) andsuggests that there might be mechanisms by which RhoGregulates its own expression.
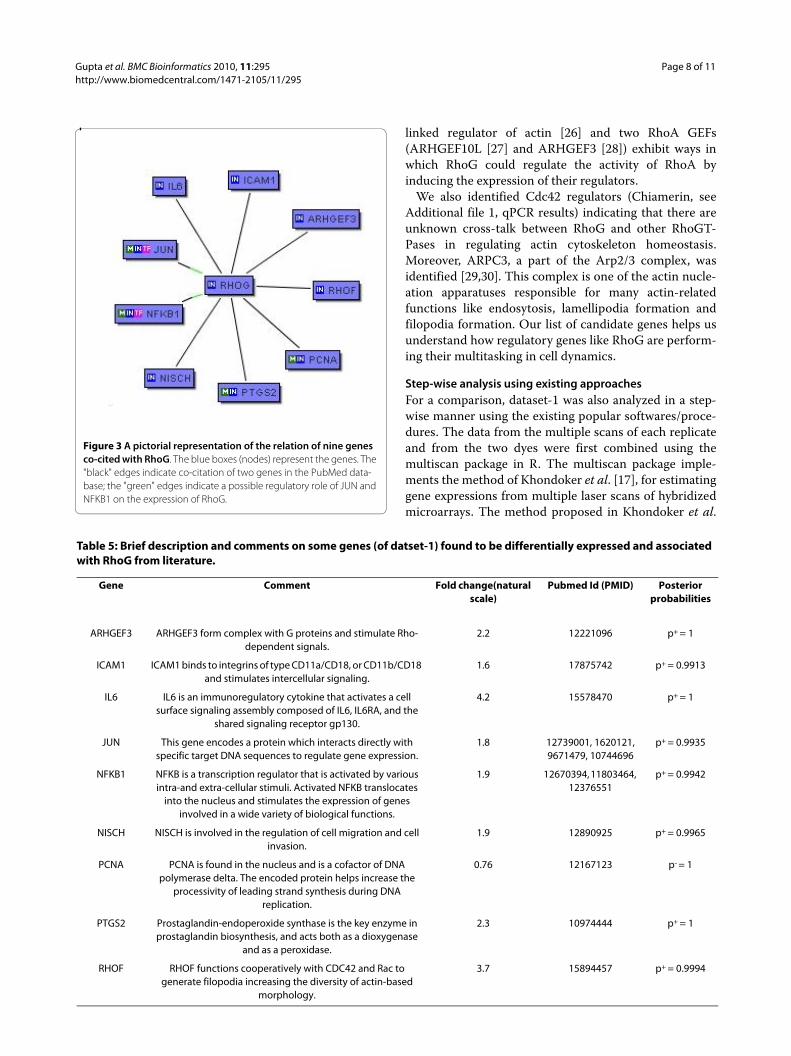
Among the 270 genes, we searched for RhoG- relatedgenes in Pubmed literature database using the softwareBibliosphere http://www.genomatix.de/products/Biblio-Sphere/. Among the list of candidate genes, nine geneswere identified as being co-cited with RhoG. A pictorialrepresentation of the relation of these nine genes isshown in Figure 3. The black edges depict co-citation ofthe two genes and green edges indicate possible regula-tory roles of JUN and NFKB1. Table 5 presents the esti-
mated fold change of these 9 genes along with briefcomments, their estimated posterior probabilities andPubmed Id (PMID).
Gene ontology categories enriched among the differentially expressed genesOur aim was to identify the GO terms that were enrichedamong the 270 genes identified as differentially expressedusing DAVID annotation tool [24]. Several categorieswere over represented with Fisher's exact test p-value0.05 but we present in Table 6 a few selected categoriesthat contain novel genes that might be functionallyrelated to RhoG based on published data. The list of GOterms associated with the differentially expressed genes isavailable as Additional file 4.
Regulation of actin cytoskeleton dynamics is one of thecentral effects of RhoG on cells. RhoF (or Rif ) was one ofthe genes that showed up in this category [25]. RhoF isinvolved in the filopodia formation through mDia2.Among the small GTPases, RhoA is a key regulator ofactin cytoskeleton. Presently, little is known about thepossible functional relationships of RhoA and RhoG.However, we identified several interesting candidategenes that could participate in the possible cross-talkbetween these Rho proteins: ROCK2 is a classical RhoA-
Figure 2 Plot of point estimates (posterior means) of log-fold change Di against the overall expression (Ti1 + Ti2)/2 for dataset-1. Genes with
pi+ ≥ 0.99 are plotted with diamonds and those with pi
- ≥ 0.99 are plotted with triangles. The gene RhoG with pi+ = 0.91 is plotted with a red circle.
Gupta et al. BMC Bioinformatics 2010, 11:295http://www.biomedcentral.com/1471-2105/11/295
Page 8 of 11
linked regulator of actin [26] and two RhoA GEFs(ARHGEF10L [27] and ARHGEF3 [28]) exhibit ways inwhich RhoG could regulate the activity of RhoA byinducing the expression of their regulators.
We also identified Cdc42 regulators (Chiamerin, seeAdditional file 1, qPCR results) indicating that there areunknown cross-talk between RhoG and other RhoGT-Pases in regulating actin cytoskeleton homeostasis.Moreover, ARPC3, a part of the Arp2/3 complex, wasidentified [29,30]. This complex is one of the actin nucle-ation apparatuses responsible for many actin-relatedfunctions like endosytosis, lamellipodia formation andfilopodia formation. Our list of candidate genes helps usunderstand how regulatory genes like RhoG are perform-ing their multitasking in cell dynamics.
Step-wise analysis using existing approachesFor a comparison, dataset-1 was also analyzed in a step-wise manner using the existing popular softwares/proce-dures. The data from the multiple scans of each replicateand from the two dyes were first combined using themultiscan package in R. The multiscan package imple-ments the method of Khondoker et al. [17], for estimatinggene expressions from multiple laser scans of hybridizedmicroarrays. The method proposed in Khondoker et al.
Figure 3 A pictorial representation of the relation of nine genes co-cited with RhoG. The blue boxes (nodes) represent the genes. The "black" edges indicate co-citation of two genes in the PubMed data-base; the "green" edges indicate a possible regulatory role of JUN and NFKB1 on the expression of RhoG.
Table 5: Brief description and comments on some genes (of datset-1) found to be differentially expressed and associated with RhoG from literature.
Gene Comment Fold change(natural scale)
Pubmed Id (PMID) Posterior probabilities
ARHGEF3 ARHGEF3 form complex with G proteins and stimulate Rho-dependent signals.
2.2 12221096 p+ = 1
ICAM1 ICAM1 binds to integrins of type CD11a/CD18, or CD11b/CD18 and stimulates intercellular signaling.
1.6 17875742 p+ = 0.9913
IL6 IL6 is an immunoregulatory cytokine that activates a cell surface signaling assembly composed of IL6, IL6RA, and the
shared signaling receptor gp130.
4.2 15578470 p+ = 1
JUN This gene encodes a protein which interacts directly with specific target DNA sequences to regulate gene expression.
1.8 12739001, 1620121, 9671479, 10744696
p+ = 0.9935
NFKB1 NFKB is a transcription regulator that is activated by various intra-and extra-cellular stimuli. Activated NFKB translocates
into the nucleus and stimulates the expression of genes involved in a wide variety of biological functions.
1.9 12670394, 11803464, 12376551
p+ = 0.9942
NISCH NISCH is involved in the regulation of cell migration and cell invasion.
1.9 12890925 p+ = 0.9965
PCNA PCNA is found in the nucleus and is a cofactor of DNA polymerase delta. The encoded protein helps increase the
processivity of leading strand synthesis during DNA replication.
0.76 12167123 p- = 1
PTGS2 Prostaglandin-endoperoxide synthase is the key enzyme in prostaglandin biosynthesis, and acts both as a dioxygenase
and as a peroxidase.
2.3 10974444 p+ = 1
RHOF RHOF functions cooperatively with CDC42 and Rac to generate filopodia increasing the diversity of actin-based
morphology.
3.7 15894457 p+ = 0.9994
Gupta et al. BMC Bioinformatics 2010, 11:295http://www.biomedcentral.com/1471-2105/11/295
Page 9 of 11
[17] has already been compared with a similar methodfrom Gupta et al. [19] which was utilized in this paper forestimating gene signals from multiple scans. Gupta et al.[19] also showed that the estimated gene signal from mul-tiple scans gave better results when utilized for high levelanalysis than the gene signal data from a single scan.
The combined signals from the multiple scans of thethree replicates and for the two dyes were normalizedusing Quantile normalization method in R [31]. Limmawas used to fit a model and to identify differentiallyexpressed genes. We used DAVID [24] for the functionalannotation of the selected genes. This step-wise analysisidentified three broad functionalities "cell differentiation","cell cycle" and "developmental process" (also listed inTable 6, results from integrated approach) but failed toidentify other specific functionalities associated with theexperiment.
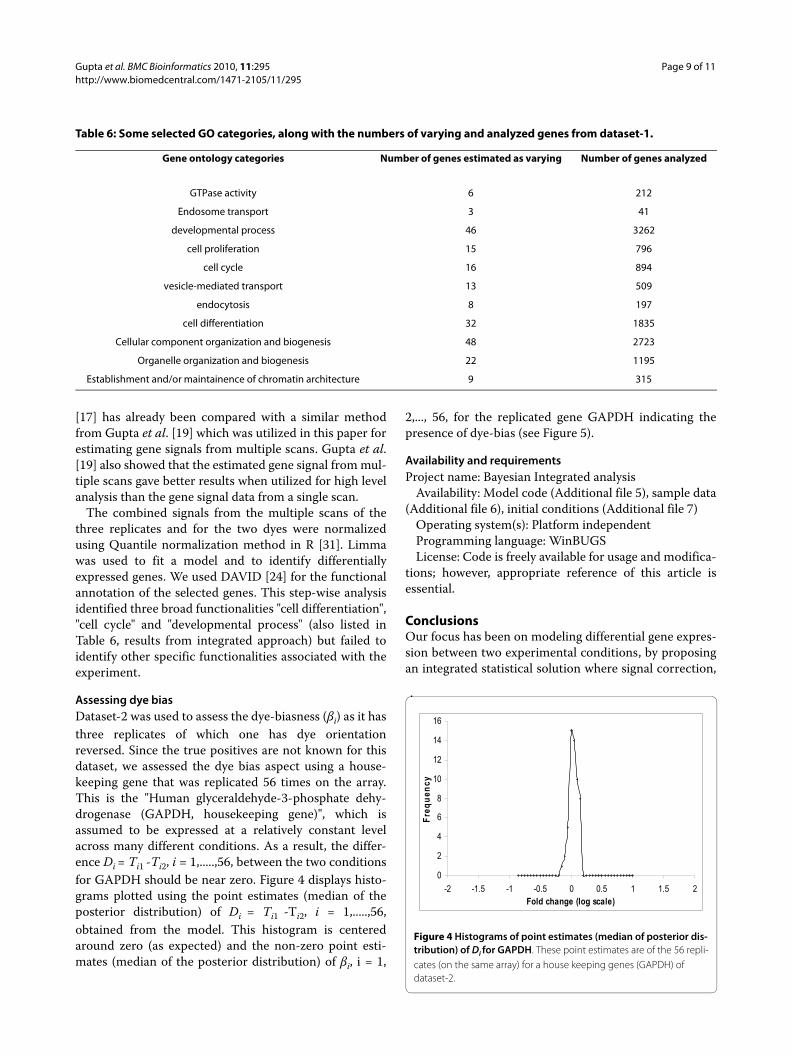
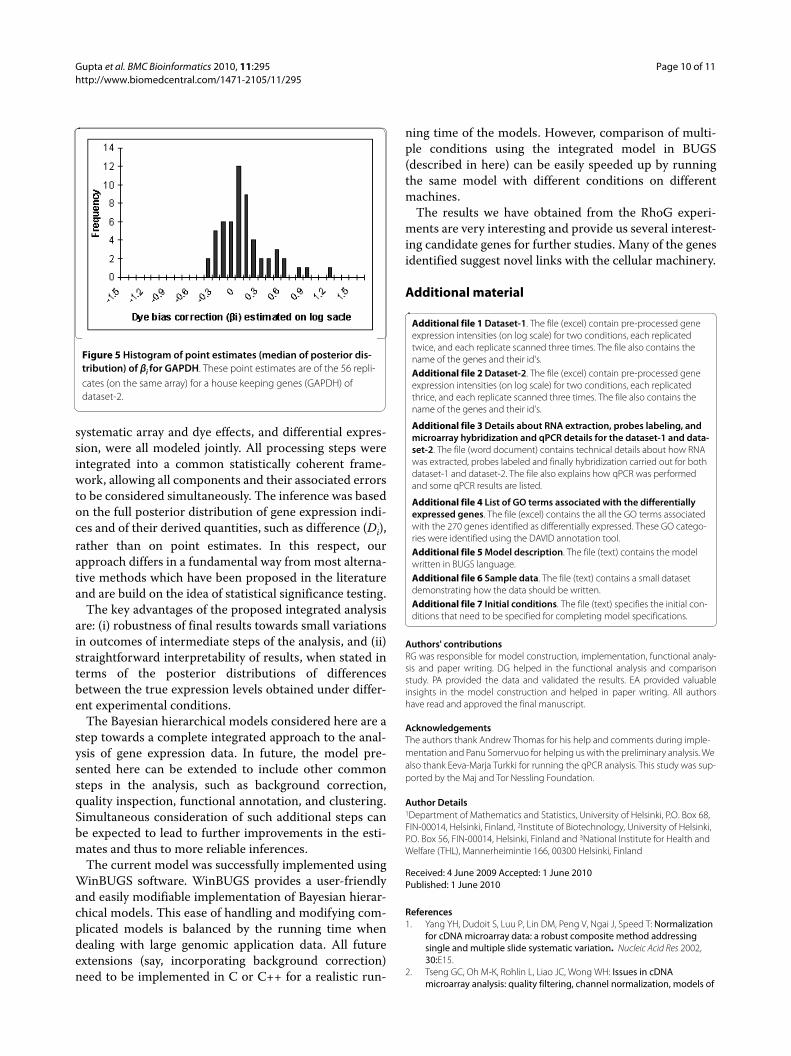
Assessing dye biasDataset-2 was used to assess the dye-biasness (βi) as it hasthree replicates of which one has dye orientationreversed. Since the true positives are not known for thisdataset, we assessed the dye bias aspect using a house-keeping gene that was replicated 56 times on the array.This is the "Human glyceraldehyde-3-phosphate dehy-drogenase (GAPDH, housekeeping gene)", which isassumed to be expressed at a relatively constant levelacross many different conditions. As a result, the differ-ence Di = Ti1 -Ti2, i = 1,.....,56, between the two conditionsfor GAPDH should be near zero. Figure 4 displays histo-grams plotted using the point estimates (median of theposterior distribution) of Di = Ti1 -Ti2, i = 1,.....,56,obtained from the model. This histogram is centeredaround zero (as expected) and the non-zero point esti-mates (median of the posterior distribution) of βi, i = 1,
2,..., 56, for the replicated gene GAPDH indicating thepresence of dye-bias (see Figure 5).
Availability and requirementsProject name: Bayesian Integrated analysis
Availability: Model code (Additional file 5), sample data(Additional file 6), initial conditions (Additional file 7)
Operating system(s): Platform independentProgramming language: WinBUGSLicense: Code is freely available for usage and modifica-
tions; however, appropriate reference of this article isessential.
ConclusionsOur focus has been on modeling differential gene expres-sion between two experimental conditions, by proposingan integrated statistical solution where signal correction,
Table 6: Some selected GO categories, along with the numbers of varying and analyzed genes from dataset-1.
Gene ontology categories Number of genes estimated as varying Number of genes analyzed
GTPase activity 6 212
Endosome transport 3 41
developmental process 46 3262
cell proliferation 15 796
cell cycle 16 894
vesicle-mediated transport 13 509
endocytosis 8 197
cell differentiation 32 1835
Cellular component organization and biogenesis 48 2723
Organelle organization and biogenesis 22 1195
Establishment and/or maintainence of chromatin architecture 9 315
Figure 4 Histograms of point estimates (median of posterior dis-tribution) of Di for GAPDH. These point estimates are of the 56 repli-cates (on the same array) for a house keeping genes (GAPDH) of dataset-2.
0
2
4
6
8
10
12
14
16
-2 -1.5 -1 -0.5 0 0.5 1 1.5 2Fold change (log scale)
Fre
qu
ency
Gupta et al. BMC Bioinformatics 2010, 11:295http://www.biomedcentral.com/1471-2105/11/295
Page 10 of 11
systematic array and dye effects, and differential expres-sion, were all modeled jointly. All processing steps wereintegrated into a common statistically coherent frame-work, allowing all components and their associated errorsto be considered simultaneously. The inference was basedon the full posterior distribution of gene expression indi-ces and of their derived quantities, such as difference (Di),rather than on point estimates. In this respect, ourapproach differs in a fundamental way from most alterna-tive methods which have been proposed in the literatureand are build on the idea of statistical significance testing.
The key advantages of the proposed integrated analysisare: (i) robustness of final results towards small variationsin outcomes of intermediate steps of the analysis, and (ii)straightforward interpretability of results, when stated interms of the posterior distributions of differencesbetween the true expression levels obtained under differ-ent experimental conditions.
The Bayesian hierarchical models considered here are astep towards a complete integrated approach to the anal-ysis of gene expression data. In future, the model pre-sented here can be extended to include other commonsteps in the analysis, such as background correction,quality inspection, functional annotation, and clustering.Simultaneous consideration of such additional steps canbe expected to lead to further improvements in the esti-mates and thus to more reliable inferences.
The current model was successfully implemented usingWinBUGS software. WinBUGS provides a user-friendlyand easily modifiable implementation of Bayesian hierar-chical models. This ease of handling and modifying com-plicated models is balanced by the running time whendealing with large genomic application data. All futureextensions (say, incorporating background correction)need to be implemented in C or C++ for a realistic run-
ning time of the models. However, comparison of multi-ple conditions using the integrated model in BUGS(described in here) can be easily speeded up by runningthe same model with different conditions on differentmachines.
The results we have obtained from the RhoG experi-ments are very interesting and provide us several interest-ing candidate genes for further studies. Many of the genesidentified suggest novel links with the cellular machinery.
Additional material
Authors' contributionsRG was responsible for model construction, implementation, functional analy-sis and paper writing. DG helped in the functional analysis and comparisonstudy. PA provided the data and validated the results. EA provided valuableinsights in the model construction and helped in paper writing. All authorshave read and approved the final manuscript.
AcknowledgementsThe authors thank Andrew Thomas for his help and comments during imple-mentation and Panu Somervuo for helping us with the preliminary analysis. We also thank Eeva-Marja Turkki for running the qPCR analysis. This study was sup-ported by the Maj and Tor Nessling Foundation.
Author Details1Department of Mathematics and Statistics, University of Helsinki, P.O. Box 68, FIN-00014, Helsinki, Finland, 2Institute of Biotechnology, University of Helsinki, P.O. Box 56, FIN-00014, Helsinki, Finland and 3National Institute for Health and Welfare (THL), Mannerheimintie 166, 00300 Helsinki, Finland
References1. Yang YH, Dudoit S, Luu P, Lin DM, Peng V, Ngai J, Speed T: Normalization
for cDNA microarray data: a robust composite method addressing single and multiple slide systematic variation. Nucleic Acid Res 2002, 30:E15.
2. Tseng GC, Oh M-K, Rohlin L, Liao JC, Wong WH: Issues in cDNA microarray analysis: quality filtering, channel normalization, models of
Additional file 1 Dataset-1. The file (excel) contain pre-processed gene expression intensities (on log scale) for two conditions, each replicated twice, and each replicate scanned three times. The file also contains the name of the genes and their id's.Additional file 2 Dataset-2. The file (excel) contain pre-processed gene expression intensities (on log scale) for two conditions, each replicated thrice, and each replicate scanned three times. The file also contains the name of the genes and their id's.
Additional file 3 Details about RNA extraction, probes labeling, and microarray hybridization and qPCR details for the dataset-1 and data-set-2. The file (word document) contains technical details about how RNA was extracted, probes labeled and finally hybridization carried out for both dataset-1 and dataset-2. The file also explains how qPCR was performed and some qPCR results are listed.
Additional file 4 List of GO terms associated with the differentially expressed genes. The file (excel) contains the all the GO terms associated with the 270 genes identified as differentially expressed. These GO catego-ries were identified using the DAVID annotation tool.Additional file 5 Model description. The file (text) contains the model written in BUGS language.Additional file 6 Sample data. The file (text) contains a small dataset demonstrating how the data should be written.Additional file 7 Initial conditions. The file (text) specifies the initial con-ditions that need to be specified for completing model specifications.
Received: 4 June 2009 Accepted: 1 June 2010 Published: 1 June 2010This article is available from: http://www.biomedcentral.com/1471-2105/11/295© 2010 Gupta et al; licensee BioMed Central Ltd. This is an Open Access article distributed under the terms of the Creative Commons Attribution License (http://creativecommons.org/licenses/by/2.0), which permits unrestricted use, distribution, and reproduction in any medium, provided the original work is properly cited.BMC Bioinformatics 2010, 11:295
Figure 5 Histogram of point estimates (median of posterior dis-tribution) of βi for GAPDH. These point estimates are of the 56 repli-cates (on the same array) for a house keeping genes (GAPDH) of dataset-2.
Gupta et al. BMC Bioinformatics 2010, 11:295http://www.biomedcentral.com/1471-2105/11/295
Page 11 of 11
variations and assessment of gene effects. Nucleic Acids Res 2001, 29:2549-2557.
3. Workman C, Jensen LJ, Jarmer H, Berka R, Gautier L, Nielsen HB, Saxild H-H, Nielsen C, Brunak S, Knudsen S: A new non-linear normalization method for reducing variability in DNA microarray experiments. Genome Biol 2002, 3(9):research0048.
4. Dudoit S, Yang YH, Luu P, Speed TP: Normalization for cDNA microarray data. Microarrays:Optical Technolologies and Informatics, Vol. 4266 of Proceedings of SPIE 2001:141-152.
5. Rosenzweig BA, Pine PS, Domon OE, Morris SM, Chen JJ, Sistare FD: Dye bias correction in dual-labeled cDNA microarray gene expression measurements. Environ Health Perspect 2004, 112(4):480-487.
6. Martin-Magniette M-L, Aubert J, Cabannes E, Daudin J-J: Evaluation of the gene-specific dye bias in cDNA microarray experiments. Bioinformatics 2005, 21(9):1995-2000.
7. Kelley R, Feizi H, Ideker T: Correcting for gene-specific dye bias in DNA microarrays using the method of maximum likelihood. Bioinformatics 2007, 24:71-77.
8. Chen Y, Dougherty ER, Bittner ML: Ratio-based decisions and the quantitative analysis of cDNA microarray images. J Biomed Opt 1997, 2:363-374.
9. Baldi P, Long AD: A Bayesian framework for the analysis of microarray expression data: regularized t-test and statistical inferences of gene changes. Bioinformatics 2001, 17:509-519.
10. Tusher VG, Tibshirani R, Chu G: Significance analysis of microarrays applied to the ionizing radiation response. Proc Natl Acad Sci 2001, 98:5116-5121.
11. Bhattacharjee M, Pritchard CC, Nelson PS, Arjas E: Bayesian integrated functional analysis of microarray data. Bioinformatics 2004, 20:2943-2953.
12. Lewin A, Richardson S, Marshall C, Glazier A, Aitman T: Bayesian modeling of differential gene expression. Biometrics 2006, 62:1-9.
13. Hsiao L, Jenser R, Yoshida T, Clark K, Blumenstock J, Gullans S: Correcting for signal saturation errors in the analysis of microarray data. Biotechniques 2002, 32:330-336.
14. Lyng H, Badiee A, Svendsrud DH, Hovig E, Myklebost O, Stokke T: Profound influence of microarray scanner characteristics on gene expression ratios: analysis and procedure for correction. BMC Genomics 2004, 5:10.
15. Piepho HP, Keller B, Hoecker N, Hochholdinger F: Combining signals from spotted cDNA microarrays obtained at different scanning intensities. Bioinformatics 2006, 22:802-807.
16. Skibbe DS, Wang X, Zhao X, Borsuk LA, Nettleton D, Schnable PS: Scanning microarrays at multiple intensities enhances discovery of differentially expressed genes. Bioinformatics 2006, 22:1863-1870.
17. Khondoker MR, Glasbey CA, Worton BJ: Statistical estimation of gene expression using multiple laser scans of microarrays. Bioinformatics 2006, 22:215-219.
18. Gupta R, Auvinen P, Thomas A, Arjas E: Bayesian hierarchical model for correcting signal saturation in microarrays using pixel intensities. Statistical Application in Genetics and Molecular Biology 2006, 5:. Article 20.
19. Gupta R, Arjas E, Kulathinal S, Thomas A, Auvinen P: Bayesian hierarchical model for estimating gene expression intensity using multiple scanned microarrys. EURASIP Journal on Bioinformatics and Systems Biology 2008. Article ID 231950.
20. Spiegelhalter DJ, Thomas A, Best NG: WinBUGS, Version 1.2 User Manual, MRC Biostatistics Unit; 1999.
21. Gauthier-Rouvière C, Vignal E, Mériane M, Roux P, Montcourier P, Fort P: RhoG GTPase controls a pathway that independently activates Rac1 and Cdc42Hs. Mol Biol Cell 1998, 9:1379-1394.
22. Govek E-E, Newey SE, Aelst LV: The role of the Rho GTPases in neuronal development. Genes & Dev 2005, 19:1-49.
23. Hein A-MK, Richardson S, Causton HC, Ambler GK, Green PJ: BGX: A fully Bayesian gene expression index for Affymetrix GeneChip data. Biostatistics 2005, 6(3):349-373.
24. Dennis G Jr, Sherman BT, Hosack DA, Yang J, Gao W, Lane HC, Lempicki RA: DAVID: Database for annotation, visualization, and integrated discovery. Genome Biol 2003, 4(5):P3.
25. Pellegrin S, Mellor H: The Rho family GTPase Rif induces filopodia through mDia2. Curr Biol 2005, 15:129-133.
26. Nakagawa O, Fujisawa K, Ishizaki T, Saito Y, Nakao K, Narumiya S: ROCK-I and ROCK-II, two isoforms of Rho-associated coiled-coil forming protein serine/threonine kinase in mice. FEBS Lett 1996, 392:189-193.
27. Winkler S, Mohl M, Wieland T, Lutz S: GrinchGEF--A novel Rho-specific guanine nucleotide exchange factor. Biochemical and Biophysical Research Communications 2005, 335:1280-1286.
28. Arthur WT, Ellerbroek SM, Der CJ, Burridge K, Wennerberg K: XPLN, a guanine nucleotide exchange factor for RhoA and RhoB, But not RhoC. J Biol Chem 2002, 277:42964-42972.
29. Welch MD, DePace AH, Verma S, Iwamatsu A, Mitchison TJ: The Human Arp2/3 complex is composed of evolutionarily conserved subunits and is localized to cellular regions of dynamic actin filament assembly. J Cell Biol 1997, 138:375-384.
30. Zerial M, McBride H: Rab proteins as membrane organizers. Nat Rev Mol Cell Biol 2001, 2(2):107-17.
31. Bolstad BM, Irizarry RA, Astrand M, Speed TP: A Comparison of Normalization Methods for High Density Oligonucleotide Array Data Based on Bias and Variance. Bioinformatics 2003, 19(2):185-193.
doi: 10.1186/1471-2105-11-295Cite this article as: Gupta et al., Bayesian integrated modeling of expression data: a case study on RhoG BMC Bioinformatics 2010, 11:295