Embed Size (px)
Citation preview

GREEN CHEMISTRY & ENGINEERING
Indian Chemical Council & Green ChemisTree
Foundation, at BATU, Lonere,
Bayer Climate Check
2014.04.22 / Jagdish Solanki / BTS India
An integrated tool to mitigate energy consumption and CO2 emissions
Bayer Climate Check, Jagdish Solanki, 2014.04.22
Agenda Introduction of Bayer and BTS-India
Introduction of the Bayer Climate Program and the Bayer Climate Check
Climate Footprint
Energy Efficiency Check
Workflow of the Climate Check
Data required from Client and results delivered by BTS
Page 2

Bayer AG – Facts, Figures, Objectives
Bayer – Facts and Figures 2013
• 113,200 employees worldwide
• Sales: 40.15 Euro Billion
• EBIT: 4.93 Euro Billion
• Net income: 3.18 Euro Billion
• R&D expenses: 3.19 Euro Billion
• Capital expenditures: 2.15 Euro Billion
Bayer – Objectives
• To become a leader in research and technology
• To achieve continuous growth of expertise in the manufacture of high-quality and
environmentally compatible products
Bayer Climate Check, Jagdish Solanki, 2014.04.22Page 3
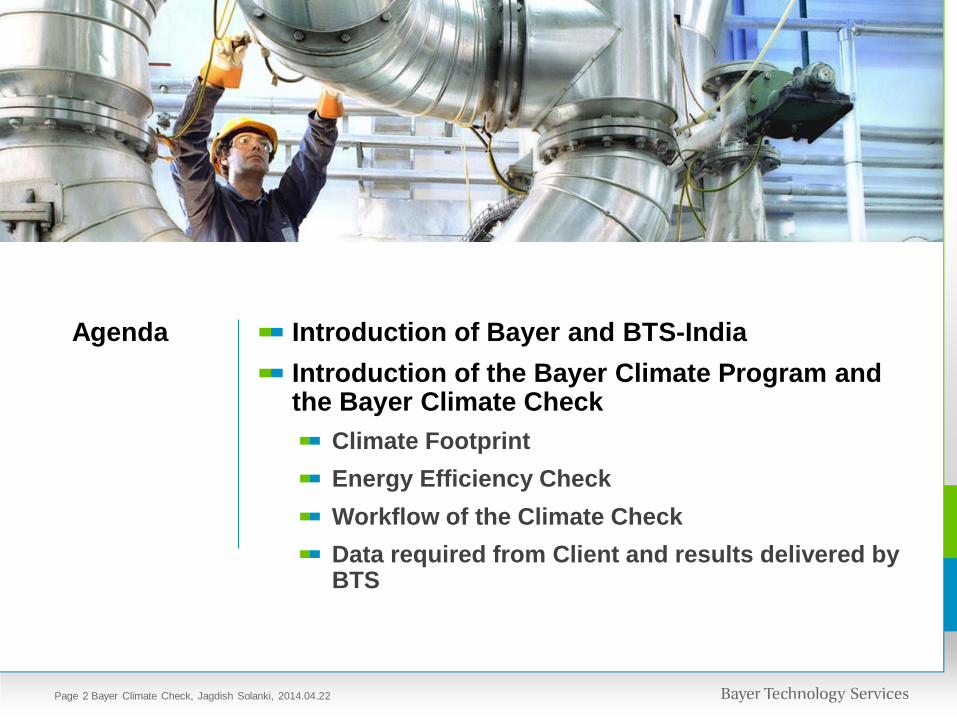
Bayer Technology Services – a Bayer
Group Company
Bayer Climate Check, Jagdish Solanki, 2014.04.22
Corporate Center
Bayer AG
Service AreasBusiness Areas
Group Management Board
Holding Company
Bayer Business
Services
Bayer Technology
Services
Currenta
Bayer
HealthCare
Bayer
CropScience
Bayer
MaterialScience
Offers services on
external market
Turnover worldwide(*) 470 EUR mio
Employees worldwide(*) 2,300(*)2013
Client industries
• Health Care
• Crop Science
• Material Science/Polymers
• Chemicals
Page 4

BTS India is an integral part of BTS
Bayer Climate Check, Jagdish Solanki, 2014.04.22
Location: Mumbai, Thane
Established: 03/2009
Current Staff: 35 + external support
North AmericaBaytown, TX, USA
BeneluxAntwerp, Belgium
IndiaMumbai,
India
AsiaShanghai, China
Latin AmericaMexico City, Mexico
SwitzerlandWitterswil, Switzerland
HQ Leverkusen, GermanySites Berlin, Bergkamen,
Dormagen, Krefeld, Wuppertal
BrazilRio de Janeiro, Brazil
North AmericaBerkeley, CA, USA
AsiaSingapore
AsiaBeijing,
China
RussiaMoscow, Russia
North AmericaPittsburg, USA
Page 5

Bayer Climate Check, Jagdish Solanki, 2014.04.22
BTS India – Our focus
BTS India for Indian market:
1. Micro Reaction Systems
2. BayQik
3. Process optimization
4. Environmental Protection Technologies
5. Project Management (Owner’s Engineering)
BTS India for internal (Bayer) market:
1. Execute projects of Bayer in India
2. Sourcing of equipment from India for Bayer globally
3. Ensure Plant and Process Safety standards of Bayer production facilities in India.
Page 6

The Bayer Climate Program was
announced on November 19th 2007
Bayer Climate Check, Jagdish Solanki, 2014.04.22
• Program: Bayer launched the Group-
wide “Bayer Climate Program” at the
end of 2007, which includes a series of
measures to be implemented in the next
several years
• Goal: Further reduce CO2 emissions in
its production facilities and develop new
solutions for increasing climate
protection and dealing with climate
change
• Investment: EUR 1 billion for climate
protection in 2008 - 2010
Lighthouse Projects:
• “EcoCommercial Building:” A global
concept for zero-emission office and
industrial buildings
• Make plants more resistant to climatic
conditions such as drought and heat
• Contribute to the efficient use of plants
as energy source
• “Bayer Climate Check” identifies
potential for CO2 reduction in production
Page 7
Bayer Climate Check, Jagdish Solanki, 2014.04.22
Bayer Climate Check
Page 8

Bayer Climate Check – Main
Characteristics
Bayer Climate Check, Jagdish Solanki, 2014.04.22
The Bayer Climate Check…
consists of two elements:
Climate Footprint
Energy Efficiency Check
is a systematic screening of all relevant production units
worldwide for all Bayer subgroups to identify measures for
energy & CO2e emission reduction.
supports achievement of targeted climate goals of Bayer
subgroups.
Clim
ate
Fo
otp
rin
t
En
erg
y-E
ffic
ien
cy-
Ch
eck
Bayer Climate Check
Clim
ate
Fo
otp
rin
t
En
erg
y-E
ffic
ien
cy-
Ch
eck
Bayer Climate Check
Page 9

Bayer Climate Check, Jagdish Solanki, 2014.04.22
Climate Footprint
part of
Bayer Climate Check
Page 10

The Climate Footprint is the KPI to
assess the total Climate Impact
Bayer Climate Check, Jagdish Solanki, 2014.04.22
A new indicator to assess climate impact of Bayer production processes
Based on the Life Cycle Analysis method
Takes into account the influence of energy consumption, raw materials,
logistics and direct emissions
Data acquisition by a detailed questionnaire
Resulting in:kg CO2e / kg product
Electricity
Steam
Factory gate
By-product
Footprint
Product B
Footprint
own raw
material
Footprint
raw material
from
suppliers
Transport
Production
Plant A
Production Plant B
Footprint Product A
Factory gate
Page 11
Carbon, CO2, Climate, …, Footprints:
Semantics and definitions.
Bayer Climate Check, Jagdish Solanki, 2014.04.22
Carbon Footprint or CO2 footprint are frequently used phrases with ambiguous meanings.
In simple word, Carbon Footprint can be defined as :
A carbon footprint is a ‘measure of the impact of human activities leave onthe environment, directly and indirectly or is accumulated over the lifestages of a product, in terms of the amount of green house gasesproduced, measured in units of carbon dioxide’.
Definition is usually taken from Life Cycle Analysis (LCA) standards (e.g. ISO14040). Coverage is all gases based on their green house gas potentialmeasured in t CO2e.
LCA covers many more sustainability aspects beyond the carbon footprint.
Application of the phrase carbon footprint is very wide, e.g. products, companies,production units (plants, sites, …), buildings, services, …
Product Carbon Footprints (PCF) are already partly used for product labeling
The Bayer Climate Footprint® is based on the standards for LCA and it is thecertified method within the Bayer Climate Check. Commercial tools anddatabanks are used.
Climate Footprint ® is a registered trade mark for BTS.
Page 12

CO2 emission reporting according to
GHG Protocol distinguishes 3 scopes
Bayer Climate Check, Jagdish Solanki, 2014.04.22
Electrical Power
Heat (e.g. steam)
CO
2 Scope 2:
indirect emissions form
energy supply
Scope 3(optional):
material up and downstream
processing, application, transport,
recycling, …C
O2, N
2O
,
SF
6, C
H4,
Scope 1:
direct emissions
t CO2 e
Page 13

Role of CO2 emission scopes (Carbon
Footprint standards do not distinguish
scopes).
Bayer Climate Check, Jagdish Solanki, 2014.04.22
Scope 1: direct emissions from a plant or product
• Direct GHG emissions occur from sources that are owned or controlled by the company, for example,emissions from combustion in owned or controlled boilers, furnaces, vehicles, etc.; emissions fromchemical production in owned or controlled process equipment.
• Most established and published
• Is clearly regulated for large scale GHG emitters (power plants, steel plants, refineries, …)
Scope 2: indirect emissions from energy consumption
• Emissions due to purchased electricity or utilities
• Recently voluntarily reported by companies and organisations.
• No legal regulations exist today for reporting, not part of the certification or trading system, Bayerreporting according to GRI
Scope 3: other indirect emissions from raw materials, product usage, …
• Scope 3 is an optional reporting category that allows for the treatment of all other indirect emissions.Scope 3 emissions are a consequence of the activities of the company, but occur from sources notowned or controlled by the company. Some examples of scope 3 activities are extraction andproduction of purchased materials; transportation of purchased fuels; and use of sold products andservices.
• Not standardized reported by companies though still used
Page 14

The Climate Footprint® is designed to cover
the relevant CO2 contributions for production
units.
Bayer Climate Check, Jagdish Solanki, 2014.04.22
Raw
Material
Upstream
Processing
Chemical
ProcessingBayer
Climate
Footprint
Cradle to gate Cradle to grave
Distribution Product
Application
Disposal Total
Carbon
Footprint
Downstream:
Manifold product &
lifecycle routes
Assumptions and
vague approximations
ambiguous footprint
Upstream:
Unique allocation of
production
route
unique CO2 allocation
distinct footprint
The Climate Footprint®
covers the impact of our
products up to the gate (no
downstream contributions)
according to LCA rules
Carbon Footprints can have any scope between cradle to gate and cradle to grave.
Page 15

The Climate Footprint® shows the individual
contributions and the reduction potential.
Bayer Climate Check, Jagdish Solanki, 2014.04.22
0
5
10
15
20
25
30
35
40
4541
Iopromid
base
2
Antracol
WP 70
base
3
BPA UER
base
27
Adalat
Gits base
Packaging
Transport
Energy Carrier
Power
Steam
Raw Materials
t CO2e / t
Examples for Climate Footprints Annual reduction potential from
Energy Efficiency measures
0
2000
4000
6000
8000
10000
12000
14000
16000
Power838
Iopromid
1905
FU 1
15271
BPA UER
1950
FSB
Steam
t CO2e / a
Page 16
The Climate Footprint® takes a pragmatic
approach to assess climate impact with
limited effort
Bayer Climate Check, Jagdish Solanki, 2014.04.22
There is no absolutely correct value of a Climate Footprint®. Correctness
is a matter of making appropriate assumptions and applying an accepted
(certified) methodology. Accuracy is a matter of data gathering and
detailing the production chain.
The Climate Footprint® is designed to deliver meaningful results with
limited cost and amount of work.
• Use established databank values where available.
• Application of Proxies for complex raw materials.
• For multi-purpose plants:
• select major products
• Lump products and create typical footprints rather than many individual
• Typically scope to budget for 5 – 8 days is possible (data gathering at
plant/site not included)
Page 17
Carbon Footprint, other approaches &
public expectations
Bayer Climate Check, Jagdish Solanki, 2014.04.22
• Retailers push the Product Carbon Footprint to differentiate fromcompetitors.
• NGOs push the Carbon Footprint as an industry independent tool toavoid green washing
• Politics is looking for cross-industry applicable methods.
• Non-energy intensive industries (e.g. IT, communications) introducecarbon footprints. This creates pressure on the energy intensiveindustry.
• Winners of a „low carbon society“ push the carbon footprint.
• PCF are used where it promises opportunistic advantages. Nosystematic and comparability of current approaches.
• Most companies communicate the value of their products.
• BTS offers the calculation of Carbon Footprints according to LCAstandards as a service.
Page 18
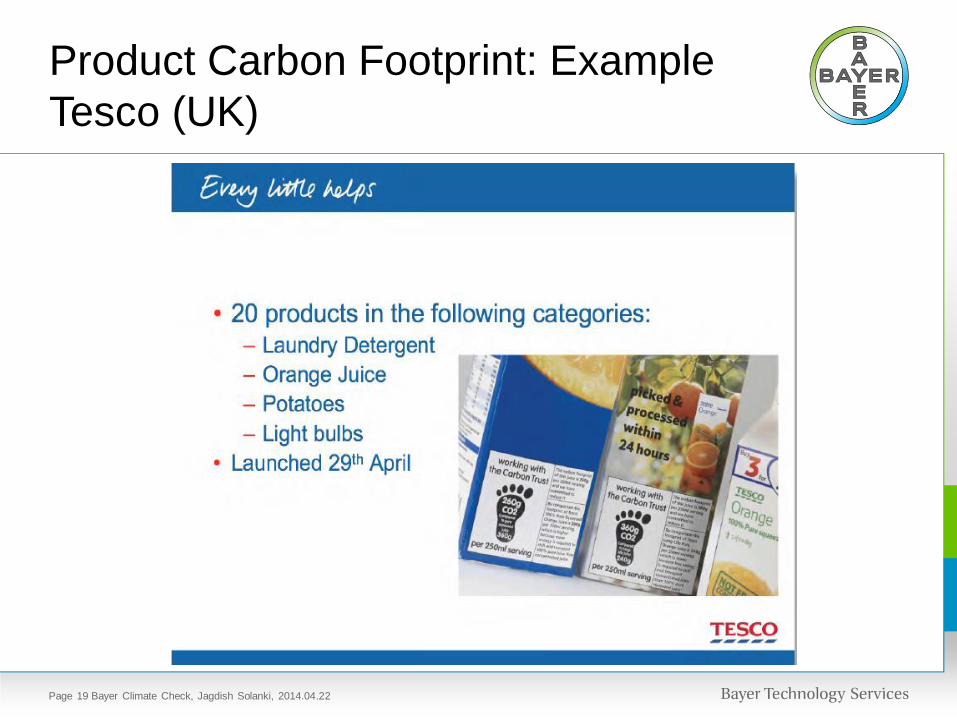
Product Carbon Footprint: Example
Tesco (UK)
Bayer Climate Check, Jagdish Solanki, 2014.04.22Page 19
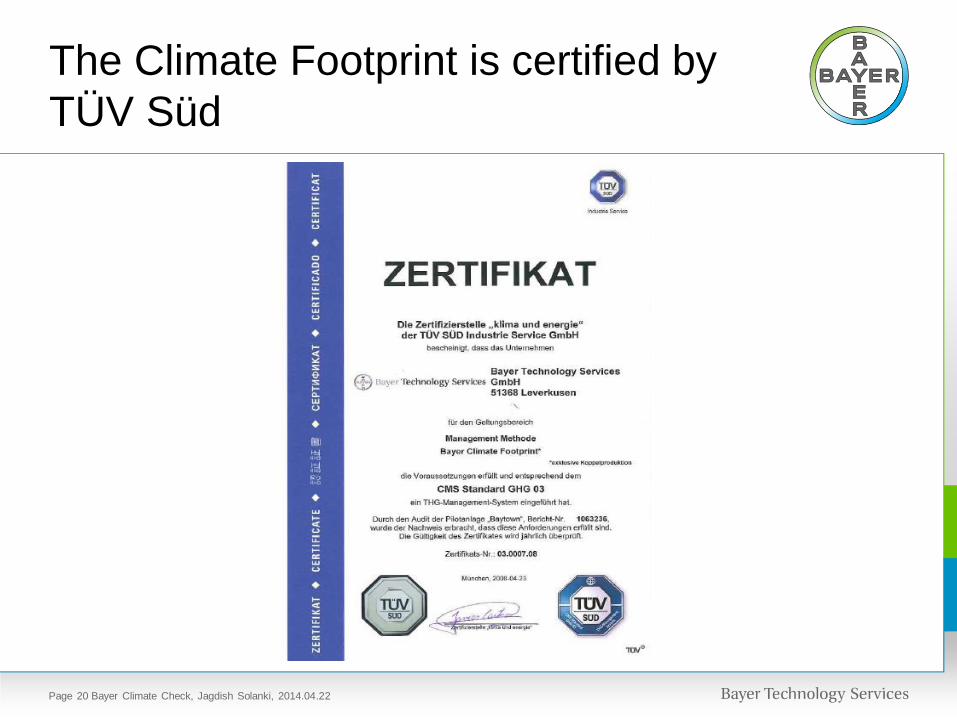
The Climate Footprint is certified by
TÜV Süd
Bayer Climate Check, Jagdish Solanki, 2014.04.22Page 20
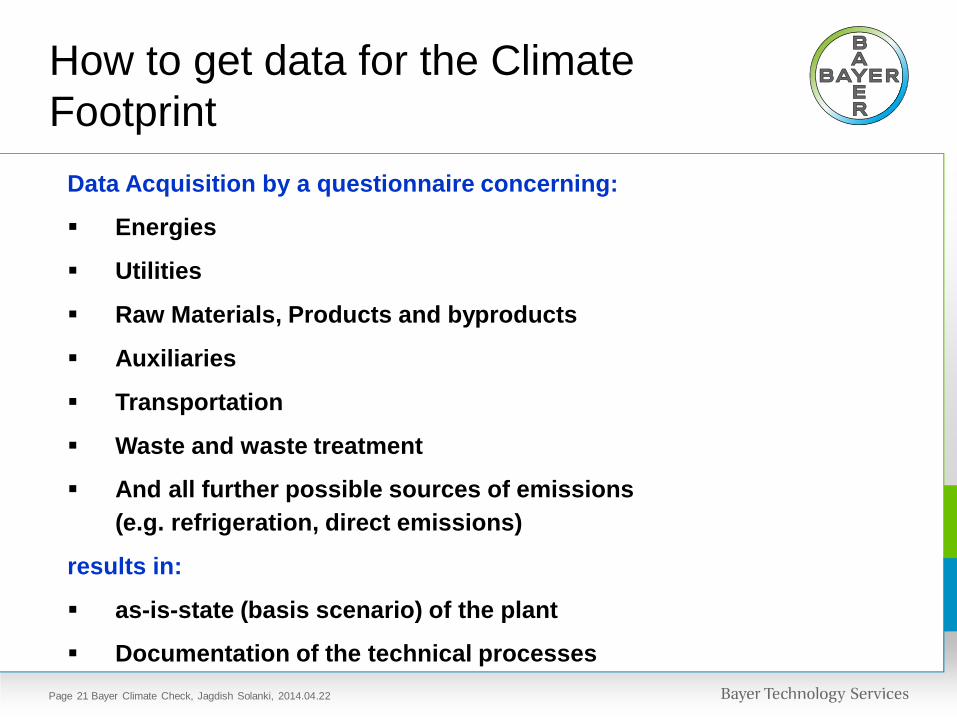
How to get data for the Climate
Footprint
Bayer Climate Check, Jagdish Solanki, 2014.04.22
Data Acquisition by a questionnaire concerning:
Energies
Utilities
Raw Materials, Products and byproducts
Auxiliaries
Transportation
Waste and waste treatment
And all further possible sources of emissions
(e.g. refrigeration, direct emissions)
results in:
as-is-state (basis scenario) of the plant
Documentation of the technical processes
Page 21
Bayer Climate Check, Jagdish Solanki, 2014.04.22
Energy Efficiency Check
part of
Bayer Climate Check
Page 22
The Energy Efficiency Check is a
holistic approach
Bayer Climate Check, Jagdish Solanki, 2014.04.22
The Energy Efficiency Check…
identifies measures for energy & CO2e emission reduction.
applies of a wide range of state-of-the-art methods and tools in a
systematic approach.
brings together the experience of plant engineers & operators
and BTS experts from several competencies.
BTS has successfully executed more than 130 projects.
Customers are e.g.:
BMS, BCS, BHC, Currenta, Lanxess, Saltigo, H.C. Starck,
Ineos, Clariant
Indswift Lab. Ltd and Indorama through DEG
Page 23

Energy Efficiency Check – Workflow
Bayer Climate Check, Jagdish Solanki, 2014.04.22
An Energy Efficiency Check comprises three steps:
Analysis
Idea Generation
Evaluation
Result:
List of feasible improvement suggestions with:
Savings potential
Costs (rough estimate, if possible)
Profitability (rough estimate, if possible)
Analysis
Idea
Generation
Evaluation
Page 24
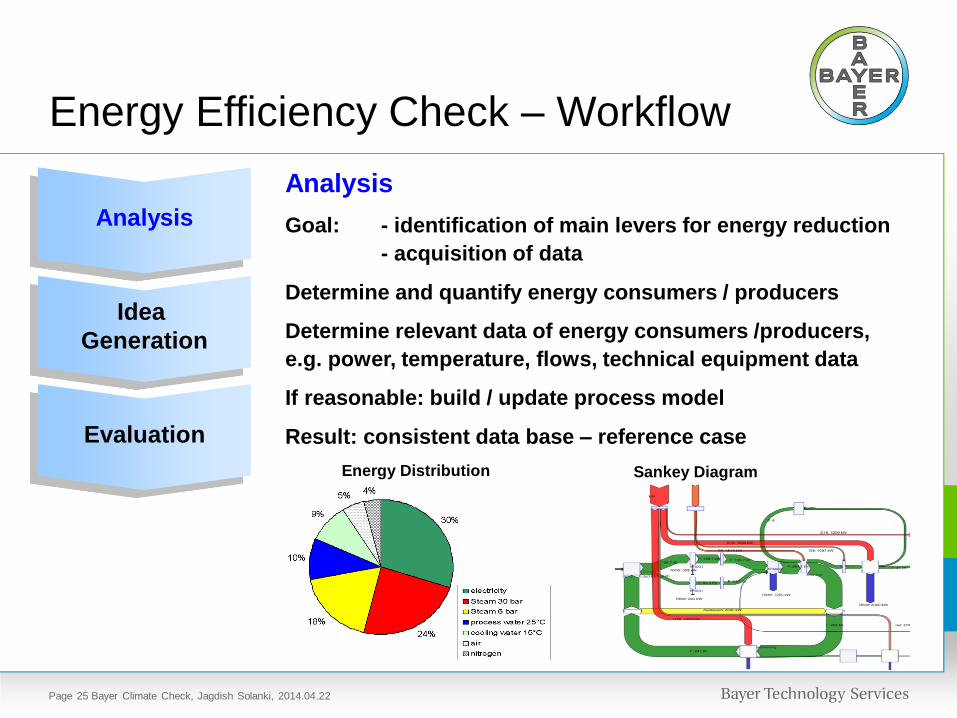
Energy Efficiency Check – Workflow
Bayer Climate Check, Jagdish Solanki, 2014.04.22
Analysis
Idea
Generation
Evaluation
Analysis
Goal: - identification of main levers for energy reduction
- acquisition of data
Determine and quantify energy consumers / producers
Determine relevant data of energy consumers /producers,
e.g. power, temperature, flows, technical equipment data
If reasonable: build / update process model
Result: consistent data base – reference case
Sankey DiagramEnergy Distribution
Page 25
Comprehensive Energy Audit –
Workflow
Bayer Climate Check, Jagdish Solanki, 2014.04.22
Idea Generation
Goal: determination of measures for energy reduction
Application of a wide range of state-of-the-art methods
Improvement measures range from simple operational
adjustments to complex adjustments
Equipment Check
Operational Improvements
Process Control / Automation
Heat Integration / Heat Recovery
Process Improvements
Energy / Utility Systems
Facility Check:
Insulation / Illumination
Different levels of energy optimization
Analysis
Idea
Generation
Evaluation
Page 26

Energy Efficiency Check – Workflow
Bayer Climate Check, Jagdish Solanki, 2014.04.22
Idea Generation
Equipment check
• Evaluation of performance of larger energy consumers
• Checklists: check for best practice / benchmarking
• Examples:
• large pumps: operating point, control strategy, frequency drive
• heat exchanger: control strategy, cleaning program in case of fouling
• unit operation such as dryer, high-viscous-equipment etc.
Motors
PumpsCompressors
Analysis
Idea
Generation
Evaluation
Page 27

Energy Efficiency Check – Workflow
Bayer Climate Check, Jagdish Solanki, 2014.04.22
Idea Generation
Heat Integration / Heat Recovery
• Pinch Analysis (if reasonable):
heat integration possibilities, heat exchanger network
• Total Site Analysis (if reasonable):
heat integration across plants e.g. via utility systems
• Heat recovery and reuse of waste heat:
check application of technical solutions such as absorption
chiller, heat pumps, vapor recompression
Analysis
Idea
Generation
Evaluation
ENTHALPY
TE
MP
ER
AT
UR
E
min cooling demand
min heating
demand Pinch Analysis
pinch
point
heat integration
possible
131.2
69.0
68.4
61.4
26.0
19.0
3.5
0.0
-26.5
-30.0
-66.5
-70.0
-95.0
-100.0
DTMIN: 7.0
(Duty based)
Case: Poly_1
61.5
61.5
19.0
13.0
15.1
13.0
61.5
61.4
64.9
60.0
79.2
70.4
64.9
60.0
41.1
-95.0
41.1
-95.0
59.1
26.0
65.8
61.0
67.7
67.7
60.0
26.0
66.6
32.0
25.6
-90.0
-94.9
-95.0
40.0
30.1
25.6
-90.0
67.7
26.0
122.1
21.0
44.3
26.0
69.0
69.0
69.0
30.0
26.0
-18.0
48.2
26.0
68.0
68.0
68.0
68.0
26.0
-18.0
56.7
26.0
67.0
66.9
5.5
0.0
47.0
47.0
40.4
26.0
43.1
43.1
-94.9
-95.0
235.7
235.7
186.1
186.1
131.2
131.2
23.0
19.0
0.0
0.0
-30.0
-30.0
-70.0
-70.0
-100.0
-100.0
-114.
-114.0
T1REB
Q:616.0
T10REB
Q:254.2
E235
Q:32.5
T2REB
Q:4774.7
T4BREB
Q:1205.2
T4AREB
Q:2311.2
T6REB
Q:346.5
T5REB
Q:678.2
T7REB
Q:453.5
T2CON
Q:4903.0
T1CON
Q:74.7
E98B
Q:1994.9
E98A
Q:3002.8
E22B
Q:156.7
E22A
Q:235.0
E26ABC
Q:2090.1
E27ABCD
Q:1376.7
T10CON
Q:24.7
T6CON
Q:430.3
E205
Q:4.0
T4BCON
Q:2955.7
T5CON
Q:2005.8
E5
Q:40.2
E29
Q:316.2
E28
Q:109.5
E23DE
Q:553.0
E23ABC
Q:829.5
221A
Q:64.2
E12
Q:1.8
E212
Q:1.6
T7CON
Q:508.7
E221B
Q:40.4
E101DE
Q:247.6
E101ABC
Q:371.4
E24DE
Q:371.1
E24ABC
Q:556.7
E21AB
Q:69.5
REACOS
E21C
Q:48.7
REACNS
T4ACON
Q:4253.2
Heat Exchanger Network
Page 28

Energy Efficiency Check – Workflow
Bayer Climate Check, Jagdish Solanki, 2014.04.22
Idea Generation
Operational / Process Improvements
• Improved process operation and process control: optimize operating
parameters and set points,
example:
• distillation: operating conditions, control strategy
• scenario studies with process models: analyze effect of altering operating
parameters
• analysis of operating data
• Improved / alternative process design
example: replacement of trays by packing in distillation
Analysis
Idea
Generation
Evaluation
Analysis of Operating Data
HEATER
iC5
Process Model
Page 29

Energy Efficiency Check – Workflow
Bayer Climate Check, Jagdish Solanki, 2014.04.22
Analysis
Idea
Generation
Evaluation
Idea Generation
Energy / Utilities
• Auditing of energy and utility systems (dependent on scope):
e.g. steam and electricity generation, cooling towers, pressurized air,
refrigeration, HVAC
• assess utility generation by benchmarks and expert evaluation
• assess utility distribution grids (e.g. leakage elimination, steam-
trap maintenance, return / reuse of condensate)
• Energy contracting:
analyze energy contracts and check for suggestions for cost savings
Utility Systems
Page 30

Energy Efficiency Check – Workflow
Bayer Climate Check, Jagdish Solanki, 2014.04.22
Analysis
Idea
Generation
Evaluation
Idea Generation
On-site
• Brainstorming and interviews:
Goal: incorporate improvement ideas from plant management
and operating employees
• Perform moderated sessions of open brainstorming
and interviews with:
• Plant management / plant engineers
• Operating employees
• Experts from customer
• BTS experts
• Facility Check:
plant inspection tours by energy experts,
e.g. inspect insulation, assess illumination
Examples
Page 31

Energy Efficiency Check – Workflow
Bayer Climate Check, Jagdish Solanki, 2014.04.22
Rough evaluation of measures
for energy reduction with regard to:
• Feasibility
• Savings potential
• Costs (rough estimate, if possible)
• Profitability (rough estimate, if possible)
Categories of feasibility :
Result: list of feasible improvement suggestions
with savings potential, costs and profitability
Analysis
Idea
Generation
EvaluationA B C(C1/C2/C3)
Feasible
e.g. proven technology,
no obvious concerns
Needs further
Evaluation
Not Feasible
Examples
Page 32

Energy Efficiency Check – Workflow
Bayer Climate Check, Jagdish Solanki, 2014.04.22
Analysis
Idea
Generation
Evaluation
Portfolio Categories
A = feasible and profitable
B = likely feasible and profitable, needs further evaluation
C1 = technically (currently) not feasible but profitable
C2 = technically feasible but not profitable
C3 = technically (currently) not feasible & not profitable
C1
C3 C2
A
B
Profitability
Technical
Feasibility
3 years ROI
difficult easy
not
profitable
profitable
Page 33

Bayer Climate Check, Jagdish Solanki, 2014.04.22
Thanks for your [email protected]
www.bayertechnology.com
Page 34

Bayer Climate Check, Jagdish Solanki, 2014.04.22
Questions???
Page 35

Backup
Bayer Climate Check, Jagdish Solanki, 2014.04.22
Backup slides
Page 36

Idea Generation- examples
Bayer Climate Check, Jagdish Solanki, 2014.04.22Page 37
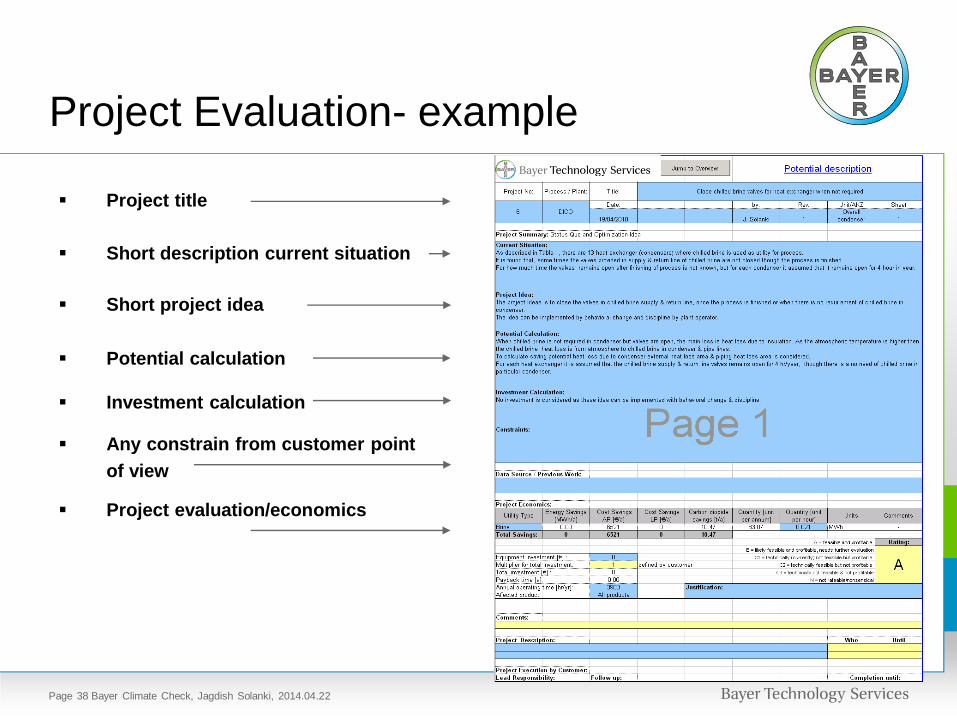
Project Evaluation- example
Bayer Climate Check, Jagdish Solanki, 2014.04.22
Short description current situation
Short project idea
Project title
Potential calculation
Investment calculation
Any constrain from customer point
of view
Project evaluation/economics
Page 38

Project Evaluation- example
Bayer Climate Check, Jagdish Solanki, 2014.04.22Page 39
Thank you!
2011.10.18 / Jagdish Solanki / BTS India