Embed Size (px)
Citation preview
Bay of Plenty Interconnection Capacity Upgrade Investment Proposal
Attachment A Technical Report
November 2009
Attachment A – Technical Report
Executive Summary
Scope
This investigation examines the Bay of Plenty transmission issues between Tarukenga and Kaitimako as identified in the 2008 APR and re-evaluates the needs and timings with the latest Demand Forecast and some further specific customer load shifting plans communicated to Transpower.
The investigation explores the requirements for the next 20 years, to the beginning of 2030.
The specific customer load shifting plans are between:
• Tauranga and the committed Kaitimako supply transformer
• Mt Maunganui and the proposed Papamoa substation.
Findings
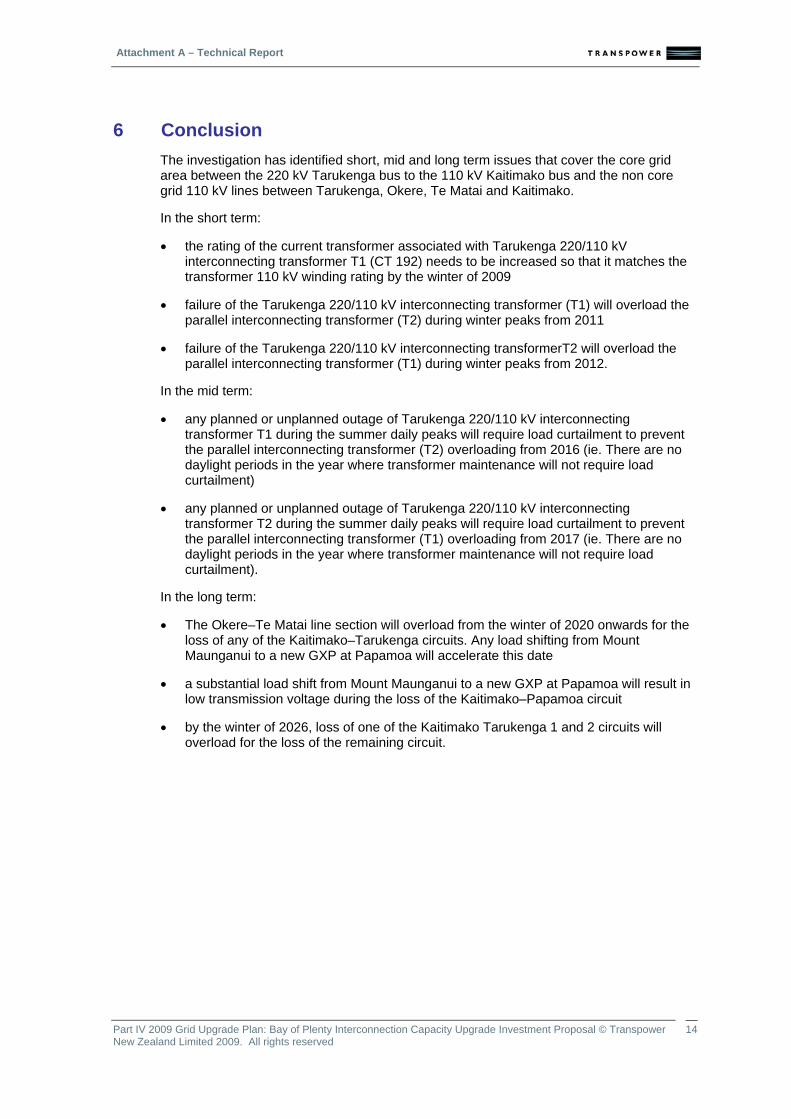
The investigation has identified short, mid and long term issues that cover the core grid area between the 220 kV Tarukenga bus to the 110 kV Kaitimako bus and the non-core grid 110 kV lines between Tarukenga, Okere, Te Matai and Kaitimako.
In the short term:
• the rating of the current transformer associated with Tarukenga 220/110 kV interconnecting transformer T1 (CT 192) needs to be increased so that it matches the transformer 110 kV winding rating by the winter of 2009
• failure of the Tarukenga 220/110 kV interconnecting transformer (T1) will overload the parallel interconnecting transformer (T2) during winter peaks from 2011
• failure of the Tarukenga 220/110 kV interconnecting transformerT2 will overload the parallel interconnecting transformer (T1) during winter peaks from 2012.
In the mid term:
• any planned or unplanned outage of Tarukenga 220/110 kV interconnecting transformer T1 during the summer daily peaks will require load curtailment to prevent the parallel interconnecting transformer (T2) overloading from 2016 (ie. There are no daylight periods in the year where transformer maintenance will not require load curtailment)
• any planned or unplanned outage of Tarukenga 220/110 kV interconnecting transformer T2 during the summer daily peaks will require load curtailment to prevent the parallel interconnecting transformer (T1) overloading from 2017 (ie. There are no daylight periods in the year where transformer maintenance will not require load curtailment).
In the long term:
• The Okere–Te Matai line section will overload from the winter of 2020 onwards for the loss of any of the Kaitimako–Tarukenga circuits. Any load shifting from Mount Maunganui to a new GXP at Papamoa will accelerate this date;
• a substantial load shift from Mount Maunganui to a new GXP at Papamoa will result in low transmission voltage during the loss of the Kaitimako–Papamoa circuit; and
• by the winter of 2026, loss of one of the Kaitimako–Tarukenga 1 and 2 circuits will overload for the loss of the remaining circuit.
Part IV 2009 Grid Upgrade Plan: Bay of Plenty Interconnection Capacity Upgrade Investment Proposal © Transpower New Zealand Limited 2009. All rights reserved

Attachment A – Technical Report
TABLE OF CONTENTS
Executive Summary ..........................................................................................................................II 1 Introduction ................................................................................................................................4 2 Assumptions ..............................................................................................................................7 3 Methodology.............................................................................................................................10 4 Establishing the system needs ..............................................................................................11 5 Analysis of the Tarukenga 220/110 kV interconnection.......................................................13 6 Conclusion................................................................................................................................14 7 References................................................................................................................................15 Appendix A Demand Forecast ..................................................................................................16 Appendix B Digsilent Diagrams................................................................................................17 Appendix C Demand forecast changes ...................................................................................25
Part IV 2009 Grid Upgrade Plan: Bay of Plenty Interconnection Capacity Upgrade Investment Proposal © Transpower New Zealand Limited 2009. All rights reserved
Attachment A – Technical Report
1 Introduction Due to load growth in the Bay of Plenty area of Tauranga, Mt Maunganui and Te Matai the 110 kV transmission system from Kaitimako back to the 220 kV/110 kV Tarukenga interconnection is coming under pressure of exceeding equipment ratings, in the short term of two to three years and over the long term out to 2030 of this study.
The following sections provide an overview to the location of the above substations, the relevant transmission lines and some issues with the load growth and demand forecasts at these substations.
1.1 Geographic Overview
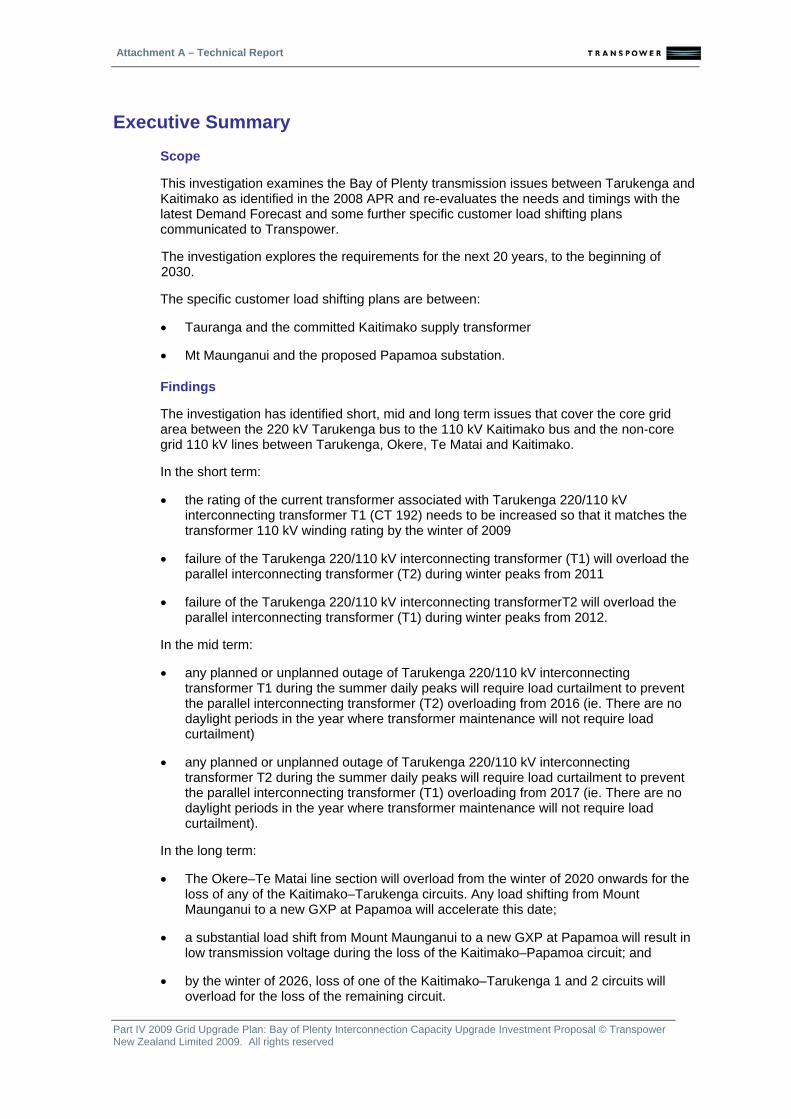
The Bay of Plenty region is shown geographically in Figure 1-1 with the port of Tauranga, the tourist destination of Mount Maunganui and the vineyards of Te Matai occupying the western area of the region near the east coast of the central North Island.
There are three 110 kV circuits supplying the western region, a double circuit, shown in yellow, directly between Tarukenga and Kaitimako and a single line which passes via Okere and Te Matai. The yellow colour signifies that the line was constructed to a 220 kV specification but currently operated at 110 kV.
Figure 1-1: Bay of Plenty Transmission Regional Network Geographically
Part IV 2009 Grid Upgrade Plan: Bay of Plenty Interconnection Capacity Upgrade Investment Proposal © Transpower 4New Zealand Limited 2009. All rights reserved
Attachment A – Technical Report
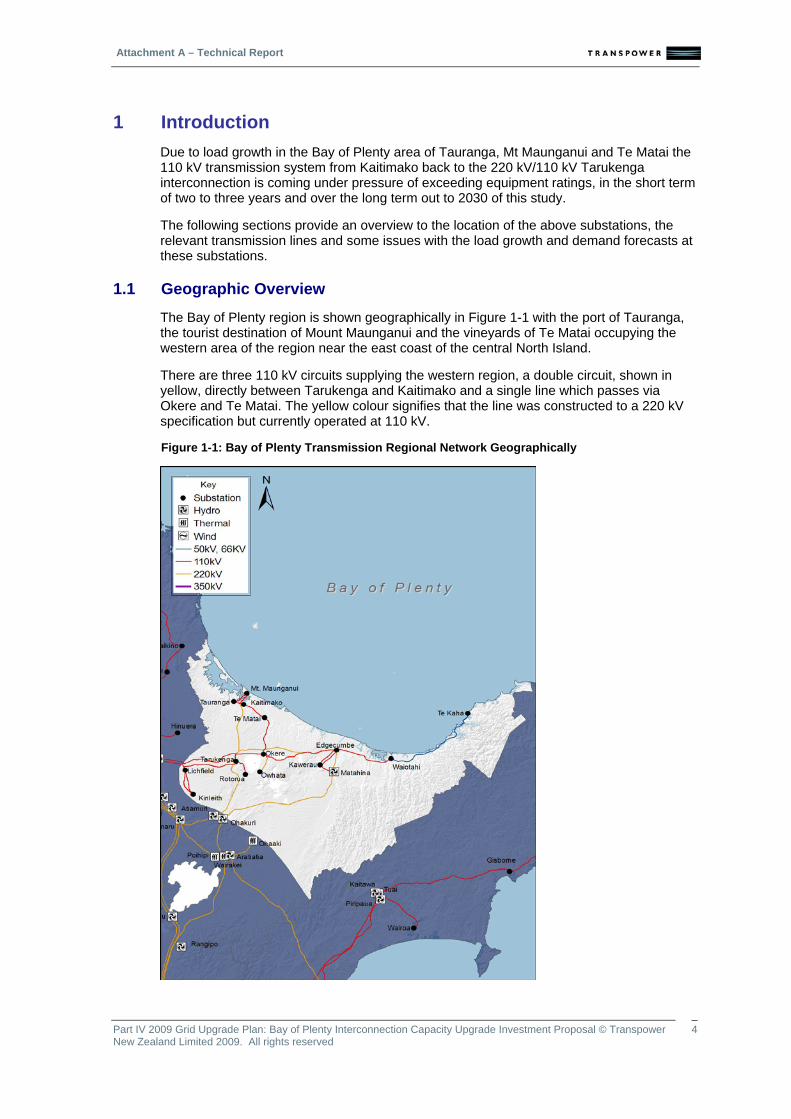
In the close up view of Figure 1-2 more details are revealed:
• The strategic importance of the Kaitimako substation to the western Bay of Plenty loads.
• The access difficulties of the Tauranga circuit and Mount Maunganui circuits as they cross heavily occupied residential land. Additionally the Mount Maunganui circuits have a harbour crossing.
• The location of the Papamoa area south-east of Mount Maunganui along the beach front. The proposed Papamoa substation location has been described as 6 km north of Te Puke.
• The Poike tee connection where the B line splits to supply Tauranga and Mount Maunganui.
Figure 1-2: Locating the proposed Papamoa substation
Part IV 2009 Grid Upgrade Plan: Bay of Plenty Interconnection Capacity Upgrade Investment Proposal © Transpower 5New Zealand Limited 2009. All rights reserved
Attachment A – Technical Report
1.2 Transmission network diagrammatically
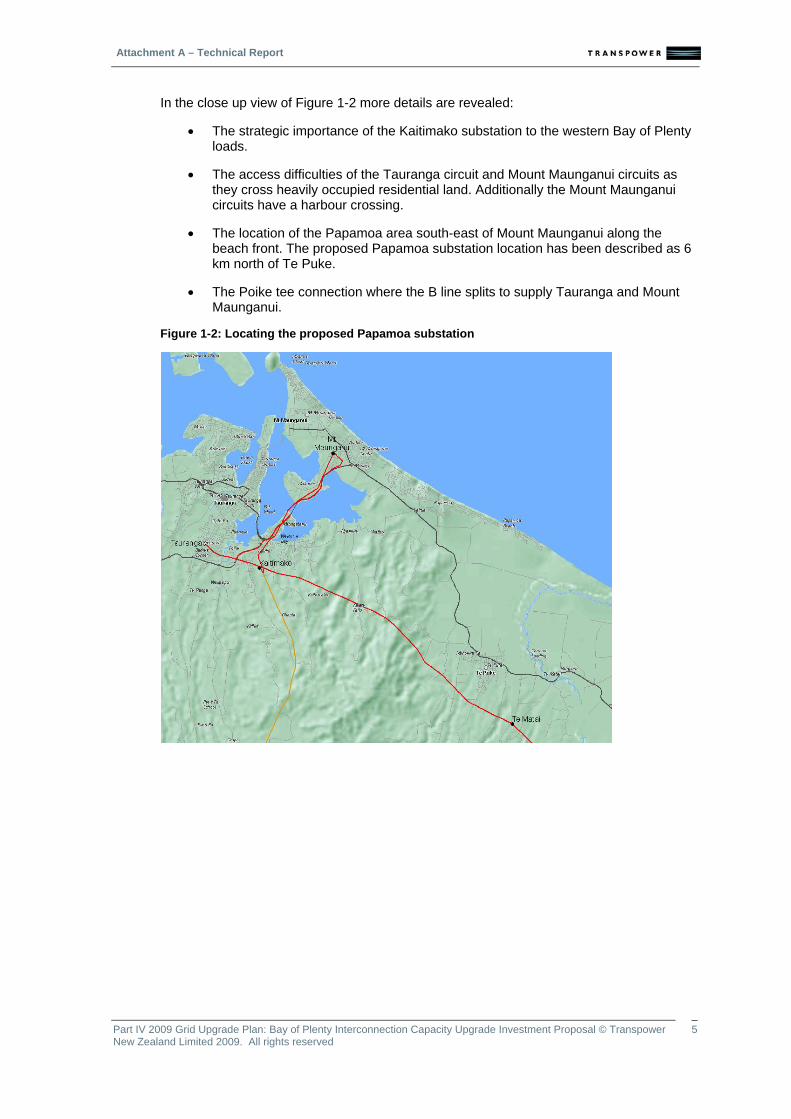
The network diagram of Figure 1-3 reveals that Tarukenga 220/110 kV interconnection supplies the western Bay of Plenty as well as:
• Rotorua substation
• Lichfield and Kinleith mill substations
• an inter-area connection to Arapuni power station.
The actual loading of the Tarukenga interconnecting transformers is determined by the demand at the above supply points as well as the generation in the area.
Figure 1-3: Bay of Plenty regional transmission network (schematically)
1.3 Load Growth Issues
The historical high load growth for Tauranga and Mount Maunganui and the difficulties in expanding these urban substations resulted in:
• the newly created Kaitimako switching substation being upgraded to a one 75 MVA supply substation (Ref 1) to relieve the Tauranga supply, and
• a proposed two 75 MVA supply substation at Papamoa (Ref 2), 6 km north of Te Puke, to relieve the Mount Maunganui supply. The new substation is expected to be looped into the Kaitimako–Te Matai circuit. Papamoa is the subject of a High Level Response (HLR) with Powerco (Ref 1), anticipating the new GXP: • to be commissioned and initially taking 15 MVA from Mount Maunganui by 2011
• transferring 50 MVA by 2025
• reaching its maximum transfer of 80 MW by 2050.
However, while this project is still at the planning stage, there is some serious doubt a new line into Papamoa could be built within this timeframe.
Part IV 2009 Grid Upgrade Plan: Bay of Plenty Interconnection Capacity Upgrade Investment Proposal © Transpower 6New Zealand Limited 2009. All rights reserved
Attachment A – Technical Report
2 Assumptions
2.1 Load
This study is based on the 2009 APR ADMD demand forecast that:
• includes a load shift from Tauranga to Kaitimako
• excludes the possible new 110/33kV GXP at Papamoa, with corresponding load shift from Mount Maunganui.
The demand forecast predicts the combined Tauranga, Kaitimako, Mount Maunganui and Te Matai load grows approximately 3.75 MW/year.
The load shifting (from Tauranga to Kaitimako) is not going to have a significant effect on the loading of the Tarukenga interconnection but will slightly alter the loading on the 110 kV circuits out of Tarukenga.
Winter regional peak and summer national peak forecasts and diversities are used in this investigation.
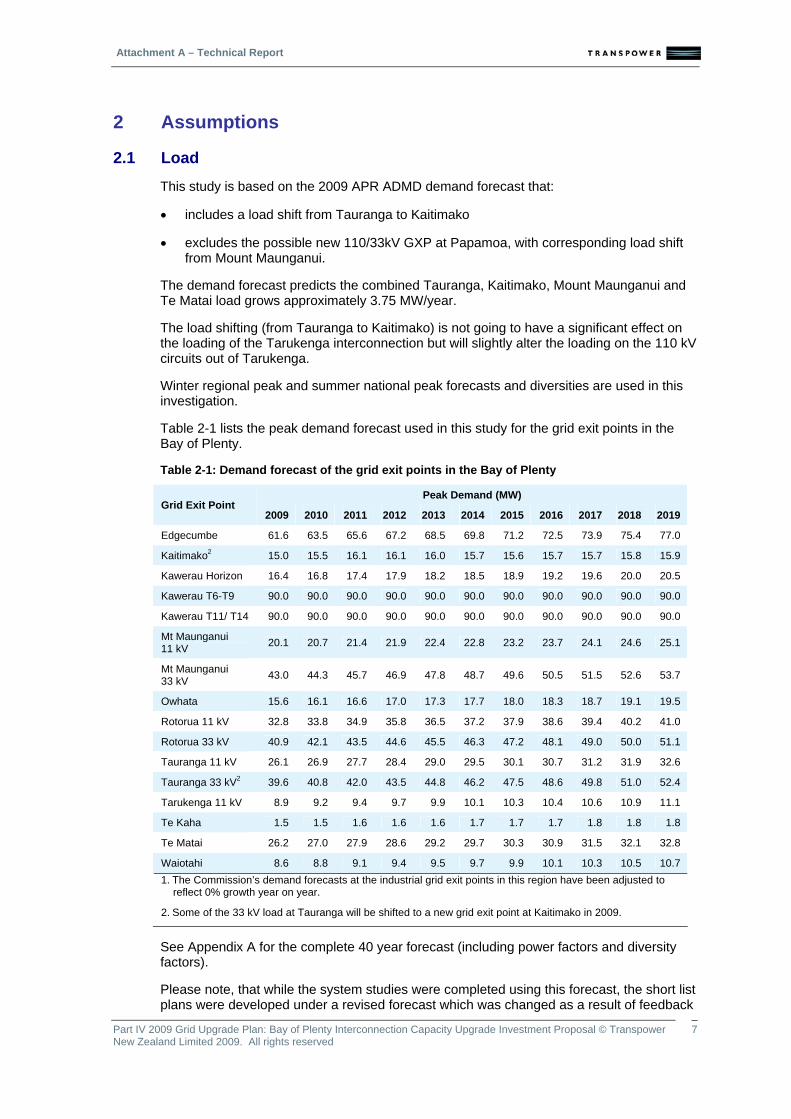
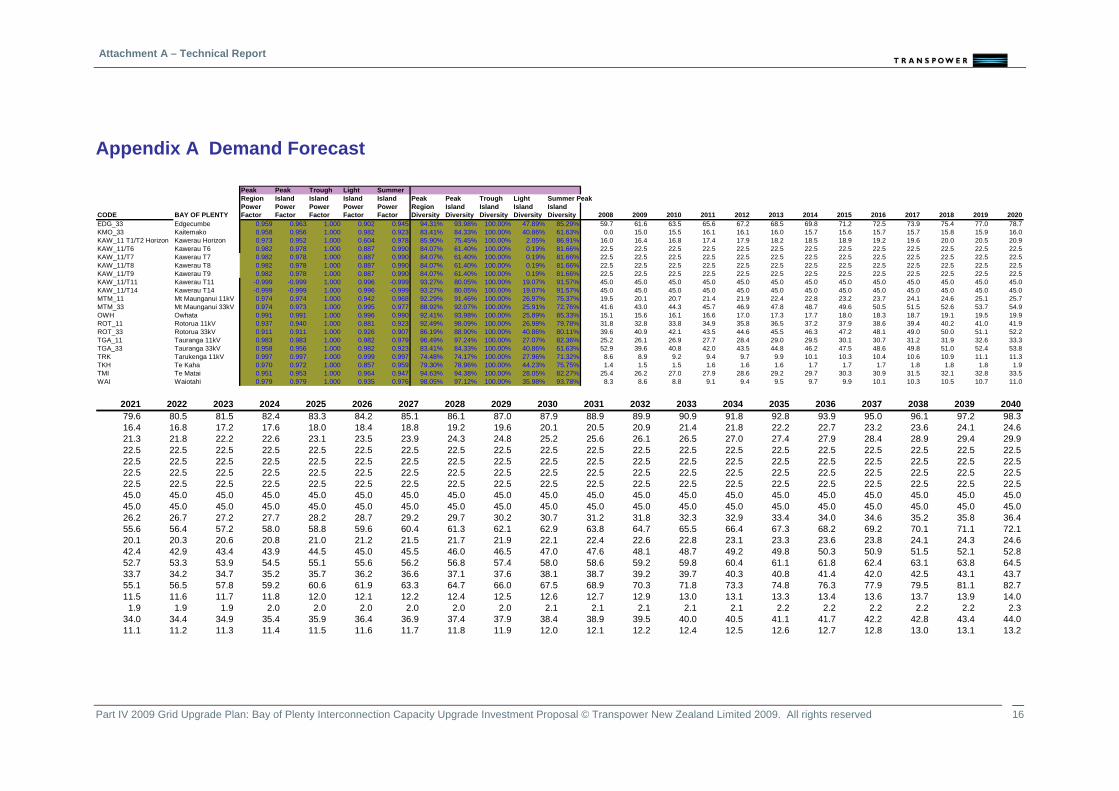
Table 2-1 lists the peak demand forecast used in this study for the grid exit points in the Bay of Plenty.
Table 2-1: Demand forecast of the grid exit points in the Bay of Plenty
Peak Demand (MW) Grid Exit Point
2009 2010 2011 2012 2013 2014 2015 2016 2017 2018 2019
Edgecumbe 61.6 63.5 65.6 67.2 68.5 69.8 71.2 72.5 73.9 75.4 77.0
Kaitimako2 15.0 15.5 16.1 16.1 16.0 15.7 15.6 15.7 15.7 15.8 15.9
Kawerau Horizon 16.4 16.8 17.4 17.9 18.2 18.5 18.9 19.2 19.6 20.0 20.5
Kawerau T6-T9 90.0 90.0 90.0 90.0 90.0 90.0 90.0 90.0 90.0 90.0 90.0
Kawerau T11/ T14 90.0 90.0 90.0 90.0 90.0 90.0 90.0 90.0 90.0 90.0 90.0
Mt Maunganui 11 kV 20.1 20.7 21.4 21.9 22.4 22.8 23.2 23.7 24.1 24.6 25.1
Mt Maunganui 33 kV 43.0 44.3 45.7 46.9 47.8 48.7 49.6 50.5 51.5 52.6 53.7
Owhata 15.6 16.1 16.6 17.0 17.3 17.7 18.0 18.3 18.7 19.1 19.5
Rotorua 11 kV 32.8 33.8 34.9 35.8 36.5 37.2 37.9 38.6 39.4 40.2 41.0
Rotorua 33 kV 40.9 42.1 43.5 44.6 45.5 46.3 47.2 48.1 49.0 50.0 51.1
Tauranga 11 kV 26.1 26.9 27.7 28.4 29.0 29.5 30.1 30.7 31.2 31.9 32.6
Tauranga 33 kV2 39.6 40.8 42.0 43.5 44.8 46.2 47.5 48.6 49.8 51.0 52.4
Tarukenga 11 kV 8.9 9.2 9.4 9.7 9.9 10.1 10.3 10.4 10.6 10.9 11.1
Te Kaha 1.5 1.5 1.6 1.6 1.6 1.7 1.7 1.7 1.8 1.8 1.8
Te Matai 26.2 27.0 27.9 28.6 29.2 29.7 30.3 30.9 31.5 32.1 32.8
Waiotahi 8.6 8.8 9.1 9.4 9.5 9.7 9.9 10.1 10.3 10.5 10.7 1. The Commission’s demand forecasts at the industrial grid exit points in this region have been adjusted to
reflect 0% growth year on year.
2. Some of the 33 kV load at Tauranga will be shifted to a new grid exit point at Kaitimako in 2009.
See Appendix A for the complete 40 year forecast (including power factors and diversity factors).
Please note, that while the system studies were completed using this forecast, the short list plans were developed under a revised forecast which was changed as a result of feedback
Part IV 2009 Grid Upgrade Plan: Bay of Plenty Interconnection Capacity Upgrade Investment Proposal © Transpower 7New Zealand Limited 2009. All rights reserved

Attachment A – Technical Report
received from the long-list consultation in May 2009. Details of these changes can be found in Appendix C.
2.2 Generation
TrustPower’s Kaimai hydro scheme is embedded in the Tauranga 33 kV network and therefore its generation is not specifically included in the model. The demand forecast is based on the historical net demand as seen at the Tauranga 33 kV bus (ie net of the Kaimai generation).
The generation pattern of Kaimai is unlikely to change over the planning horizon.
The Kawerau 110 kV bus was upgraded to include the new injection from the Mighty River 100 MW station. The maximum value of the installed generation is used for the planning studies as the energy source is geothermal.
The other 110 kV connected Bay of Plenty generators are modelled with historical minimum generation as found from the last four years of Avalon metering data. As these are all hydro stations with some small storage ability, the minima are used anticipating low generation during dry years. The historical minima and maxima are:
• Aniwhenua minimum/maximum 5 MW / 20 MW
• Matahina minimum/maximum 20 MW / 78 MW
• Wheo minimum/maximum 7 MW / 25 MW
Similar to the demand forecast, the generation assumptions used to develop the short-list development plans were altered as a result of the consultation feedback, refer Appendix C.
2.3 Voltage Support
Voltage support in the sub region is provided by the:
• existing 25 Mvar capacitors on the Mt Maunganui 110 kV bus
• new 25 Mvar capacitors on the Tauranga 110 kV bus.
In the planning studies, 110 kV capacitors are placed in the model to:
• provide solution convergence
• defer line overloading due excessive reactive power flows
• re-establish transmission voltage limits as the load increases.
2.4 Interconnecting transformer tap changers
The transformers with on-load tap changers1 are set to keep the 110 kV bus voltage at 1.05 pu.
2.5 Power Analysis and Base Case
The analysis for this report is performed using DIgSILENT PowerFactory version 13.2.
The base case used is the latest North Island case available as of 13 May 2008, with the following changes.
1 Tarukenga T1 tap changer is modelled as an "off load" tap changer.
Part IV 2009 Grid Upgrade Plan: Bay of Plenty Interconnection Capacity Upgrade Investment Proposal © Transpower 8New Zealand Limited 2009. All rights reserved
Attachment A – Technical Report
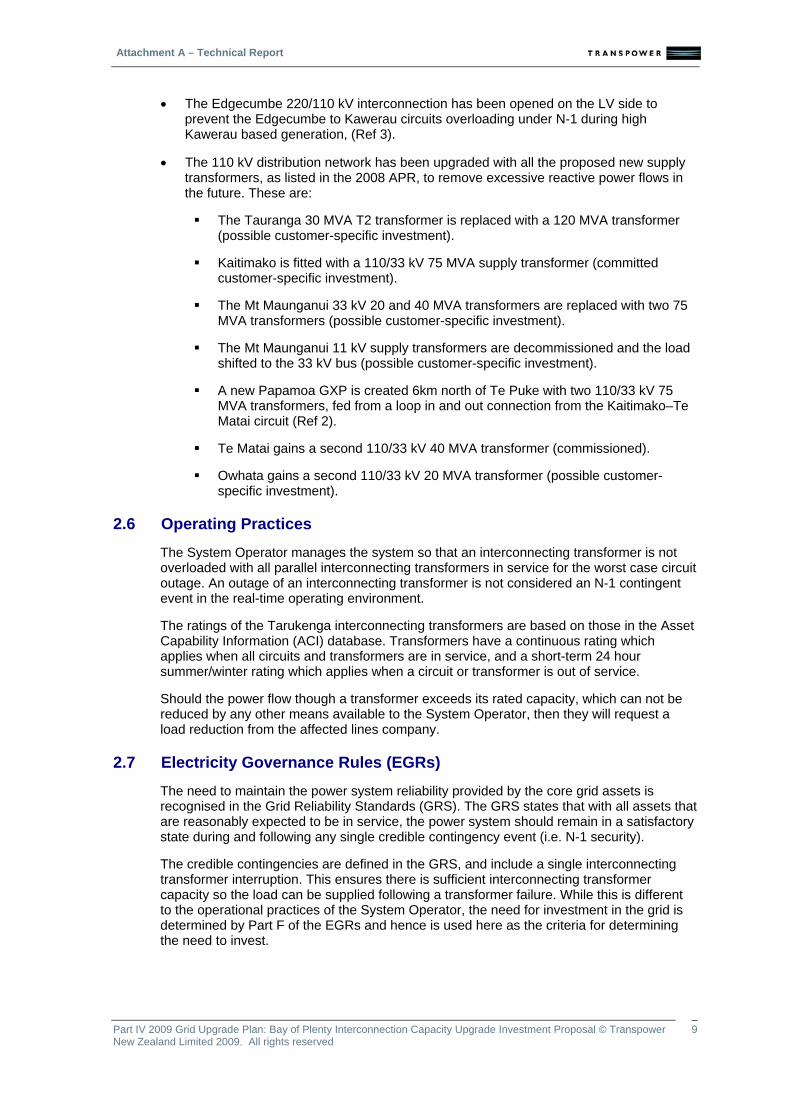
• The Edgecumbe 220/110 kV interconnection has been opened on the LV side to prevent the Edgecumbe to Kawerau circuits overloading under N-1 during high Kawerau based generation, (Ref 3).
• The 110 kV distribution network has been upgraded with all the proposed new supply transformers, as listed in the 2008 APR, to remove excessive reactive power flows in the future. These are:
The Tauranga 30 MVA T2 transformer is replaced with a 120 MVA transformer (possible customer-specific investment).
Kaitimako is fitted with a 110/33 kV 75 MVA supply transformer (committed customer-specific investment).
The Mt Maunganui 33 kV 20 and 40 MVA transformers are replaced with two 75 MVA transformers (possible customer-specific investment).
The Mt Maunganui 11 kV supply transformers are decommissioned and the load shifted to the 33 kV bus (possible customer-specific investment).
A new Papamoa GXP is created 6km north of Te Puke with two 110/33 kV 75 MVA transformers, fed from a loop in and out connection from the Kaitimako–Te Matai circuit (Ref 2).
Te Matai gains a second 110/33 kV 40 MVA transformer (commissioned).
Owhata gains a second 110/33 kV 20 MVA transformer (possible customer-specific investment).
2.6 Operating Practices
The System Operator manages the system so that an interconnecting transformer is not overloaded with all parallel interconnecting transformers in service for the worst case circuit outage. An outage of an interconnecting transformer is not considered an N-1 contingent event in the real-time operating environment.
The ratings of the Tarukenga interconnecting transformers are based on those in the Asset Capability Information (ACI) database. Transformers have a continuous rating which applies when all circuits and transformers are in service, and a short-term 24 hour summer/winter rating which applies when a circuit or transformer is out of service.
Should the power flow though a transformer exceeds its rated capacity, which can not be reduced by any other means available to the System Operator, then they will request a load reduction from the affected lines company.
2.7 Electricity Governance Rules (EGRs)
The need to maintain the power system reliability provided by the core grid assets is recognised in the Grid Reliability Standards (GRS). The GRS states that with all assets that are reasonably expected to be in service, the power system should remain in a satisfactory state during and following any single credible contingency event (i.e. N-1 security).
The credible contingencies are defined in the GRS, and include a single interconnecting transformer interruption. This ensures there is sufficient interconnecting transformer capacity so the load can be supplied following a transformer failure. While this is different to the operational practices of the System Operator, the need for investment in the grid is determined by Part F of the EGRs and hence is used here as the criteria for determining the need to invest.
Part IV 2009 Grid Upgrade Plan: Bay of Plenty Interconnection Capacity Upgrade Investment Proposal © Transpower 9New Zealand Limited 2009. All rights reserved

Attachment A – Technical Report
3 Methodology Modify the base case with all the system configurations listed in 2.7.
Build in the ability to shift load from the Mt Maunganui 33 kV bus to the Papamoa 33 kV bus, and shift as much as required each year to prevent the Kaitimako–Poike-2 section from overloading.
Part IV 2009 Grid Upgrade Plan: Bay of Plenty Interconnection Capacity Upgrade Investment Proposal © Transpower 10New Zealand Limited 2009. All rights reserved
Attachment A – Technical Report
4 Establishing the system needs The following section lists the transmission issues between Tarukenga and Kaitimako that result in asset overloading from the present out to 2030.
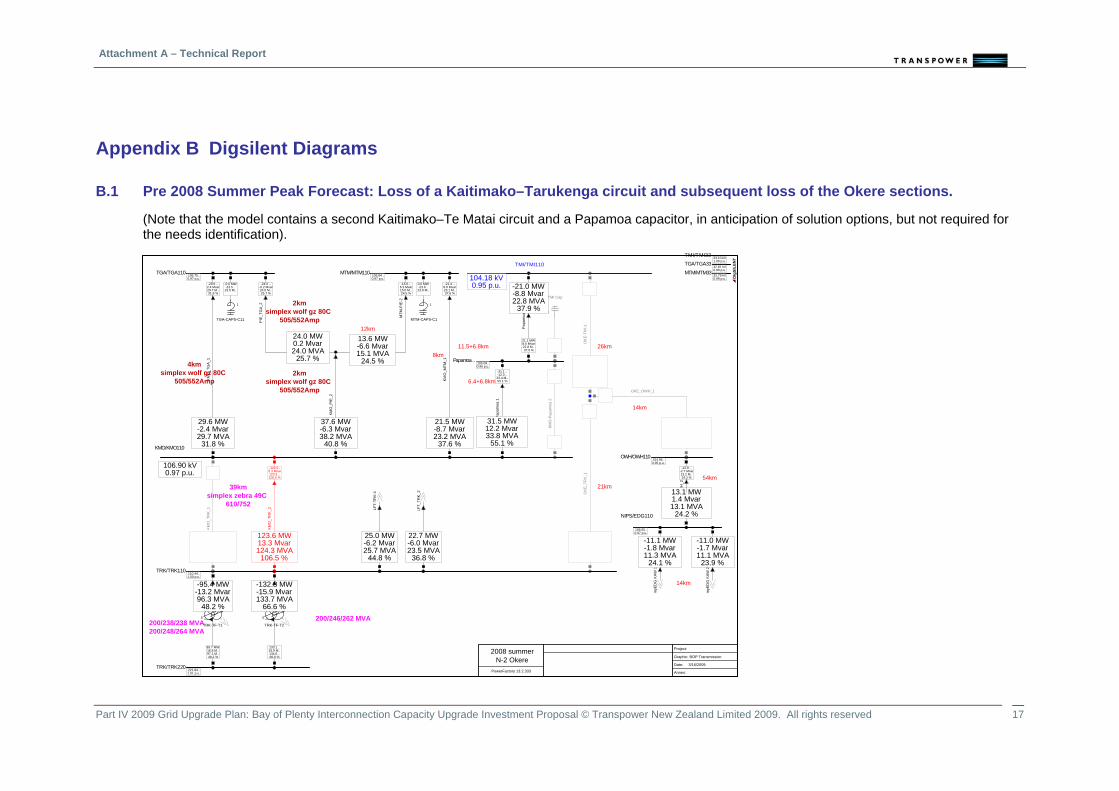
4.1 Pre 2008 Summer Island Peak: Loss of a Kaitimako–Tarukenga circuit and the subsequent loss of the Okere sections (Appendix B1)
The Kaitimako–Tarukenga circuit conductor will overload for the N-2 situation where one of the Kaitimako–Tarukenga circuits and the Okere sections (Kaitimako–Okere–Te Matai) are out of service. This is the situation during planned outages in summer, when a circuit is out of service for maintenance and there is a subsequent loss of another circuit feeding a common bus, in this case the Kaitimako 110 kV bus.
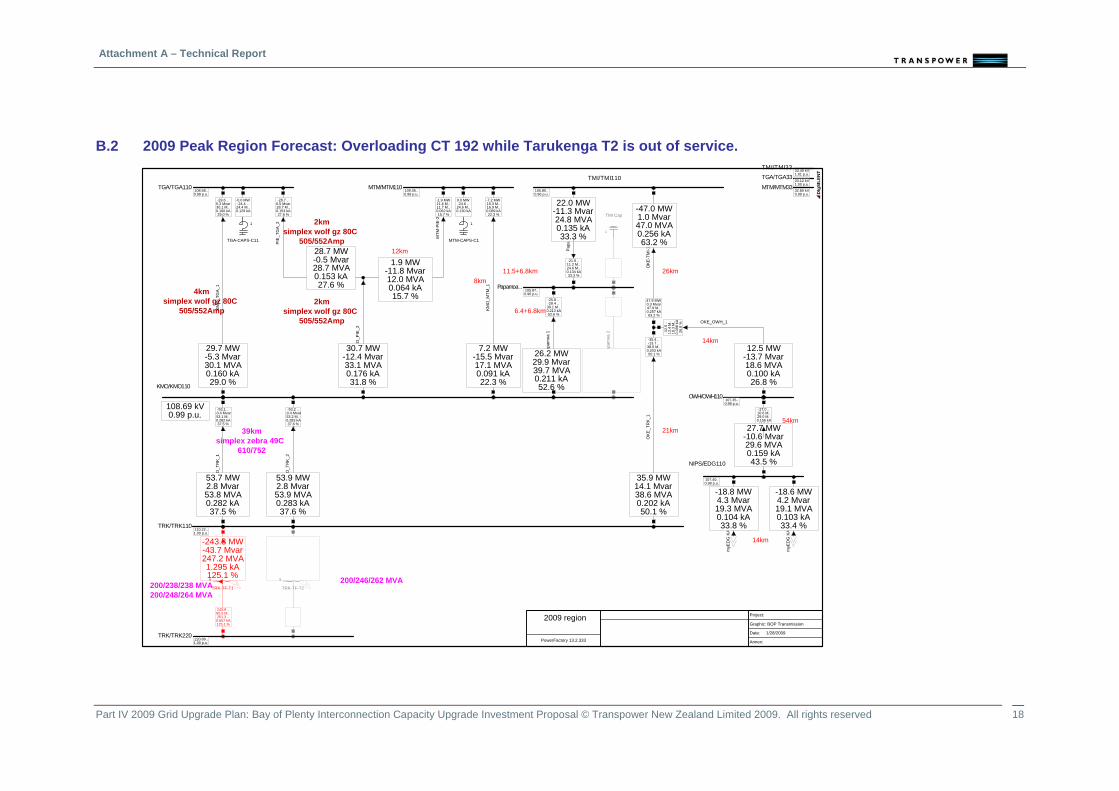
4.2 2009 Peak Region Forecast: Overloading Tarukenga T1 CT 192 while Tarukenga T2 is out of service (Appendix B2)
The 110 kV CT 192 on the Tarukenga T1 interconnecting transformer will exceed its 238.2 MVA winter branch rating, if the Tarukenga 2 interconnecting transformer comes out of service during winter.
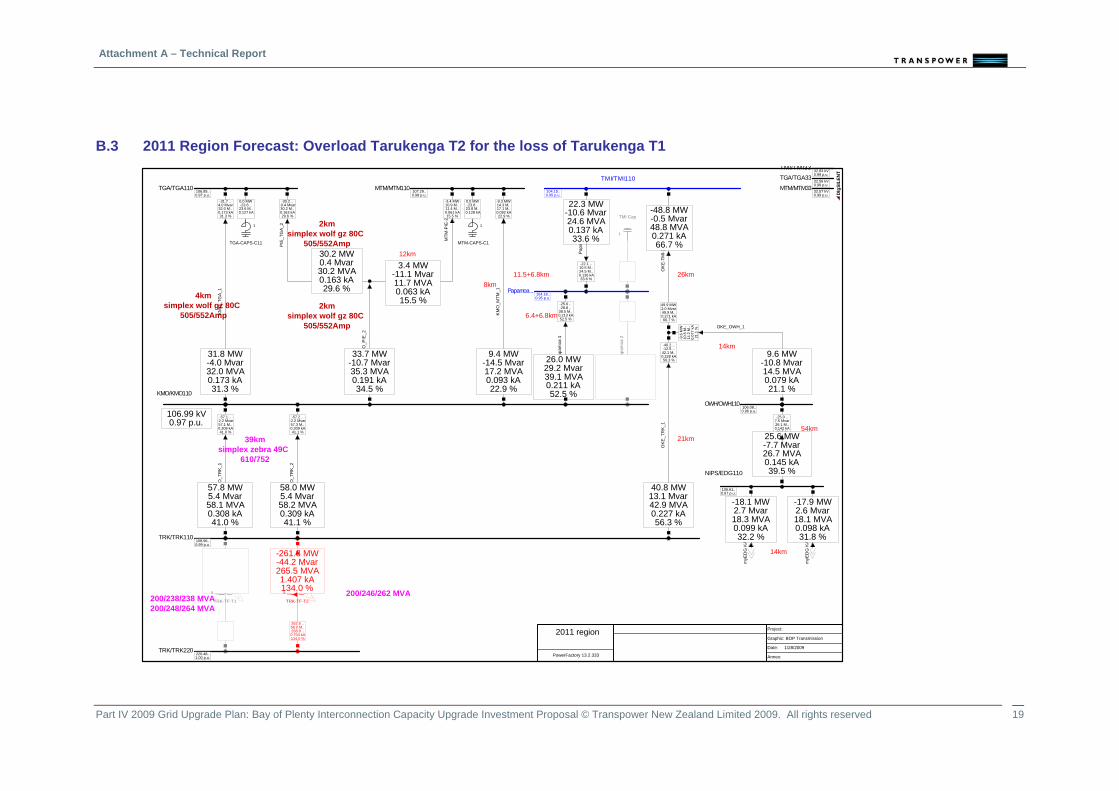
4.3 2011 Peak Region Forecast: Overload of Tarukenga 2 for the loss of Tarukenga T1 (Appendix B3)
The Tarukenga T2 110 kV winding exceeds its 24 hour winter rating of 262 MVA, if Tarukenga T1 comes out of service during winter.
4.4 2012 Peak Region Forecast: Overload of Tarukenga T1 for the loss of Tarukenga T2 (Appendix B4)
The Tarukenga T1 110 kV winding exceeds its 24 hour winter rating of 264 MVA, if Tarukenga T2 comes out of service during winter.
4.5 2016 Summer Peak Forecast: Overload of Tarukenga 2 for the loss of Tarukenga T1
The Tarukenga T2 110 kV winding exceeds its 24 hour summer rating of 246 MVA, if Tarukenga T1 comes out of service during summer.
4.6 2017 Summer Peak Forecast: Overload of Tarukenga 1 for the loss of Tarukenga T2
The Tarukenga T1 110 kV winding exceeds its 24 hour summer rating of 248 MVA, if Tarukenga T2 comes out of service during winter.
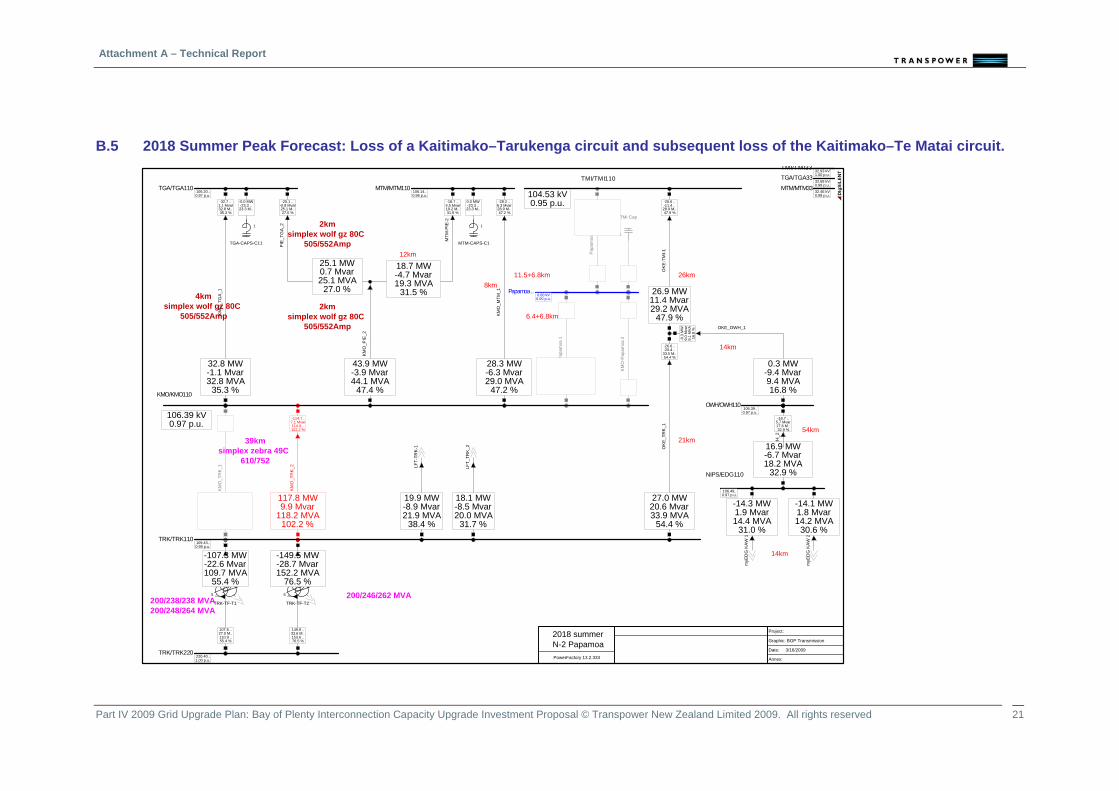
4.7 2018 Summer Island Peak Forecast: Loss of a Kaitimako–Tarukenga circuit and the subsequent loss of the Kaitimako–Te Matai circuit (Appendix B5)
The Kaitimako–Tarukenga circuit conductor will overload for the N-2 situation where one of the Kaitimako–Tarukenga circuits and the Kaitimako–Te Matai circuit are out of service. This is the situation during planned outages in summer, when a circuit is out of service for maintenance and there is a subsequent loss of another circuit feeding a common bus, in this case the Kaitimako 110 kV bus.
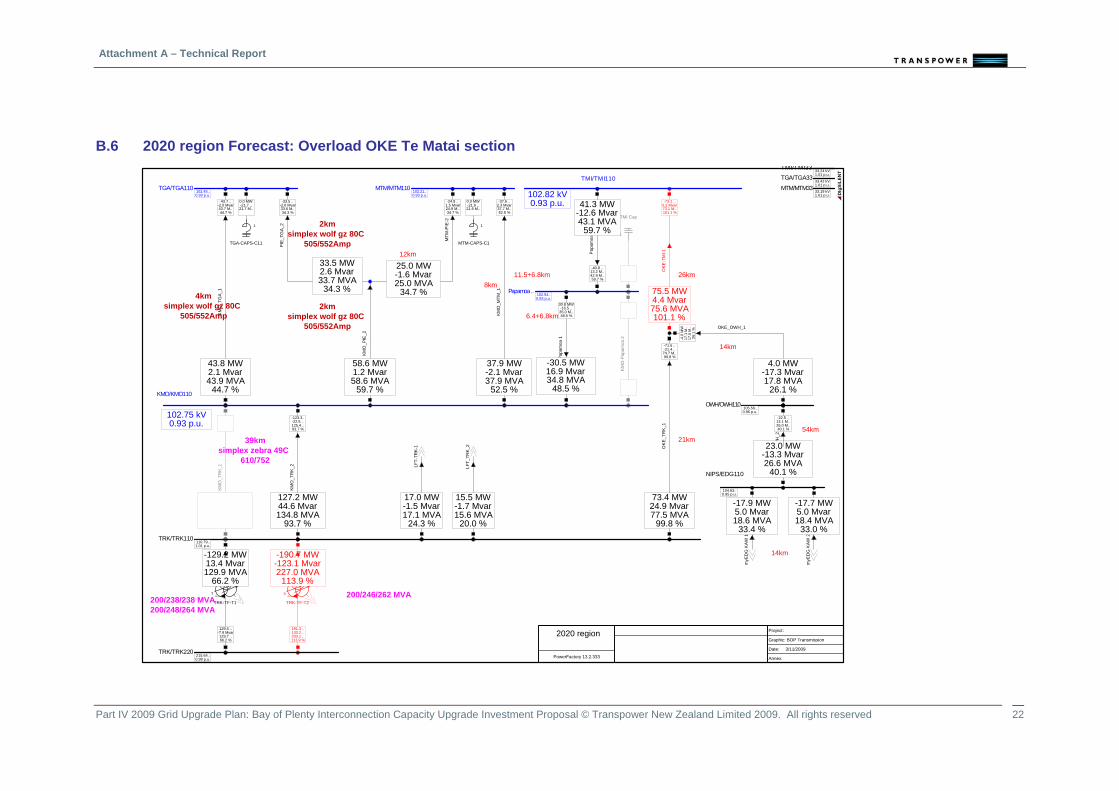
4.8 2020 Peak Region Forecast (Appendix B6) Part IV 2009 Grid Upgrade Plan: Bay of Plenty Interconnection Capacity Upgrade Investment Proposal © Transpower 11New Zealand Limited 2009. All rights reserved
Attachment A – Technical Report
The Okere–Te Matai section reaches 100% loading for the loss of a Kaitimako–Tarukenga 1 or 2 circuit.
The Kaitimako–Poike-2 section reaches 100% loading for the loss of the Kaitimako–Tauranga circuit. This can be deferred by shifting more Mount Maunganui load to Papamoa.
A minimum of 10 MW must be shifted from Mount Maunganui to Papamoa.
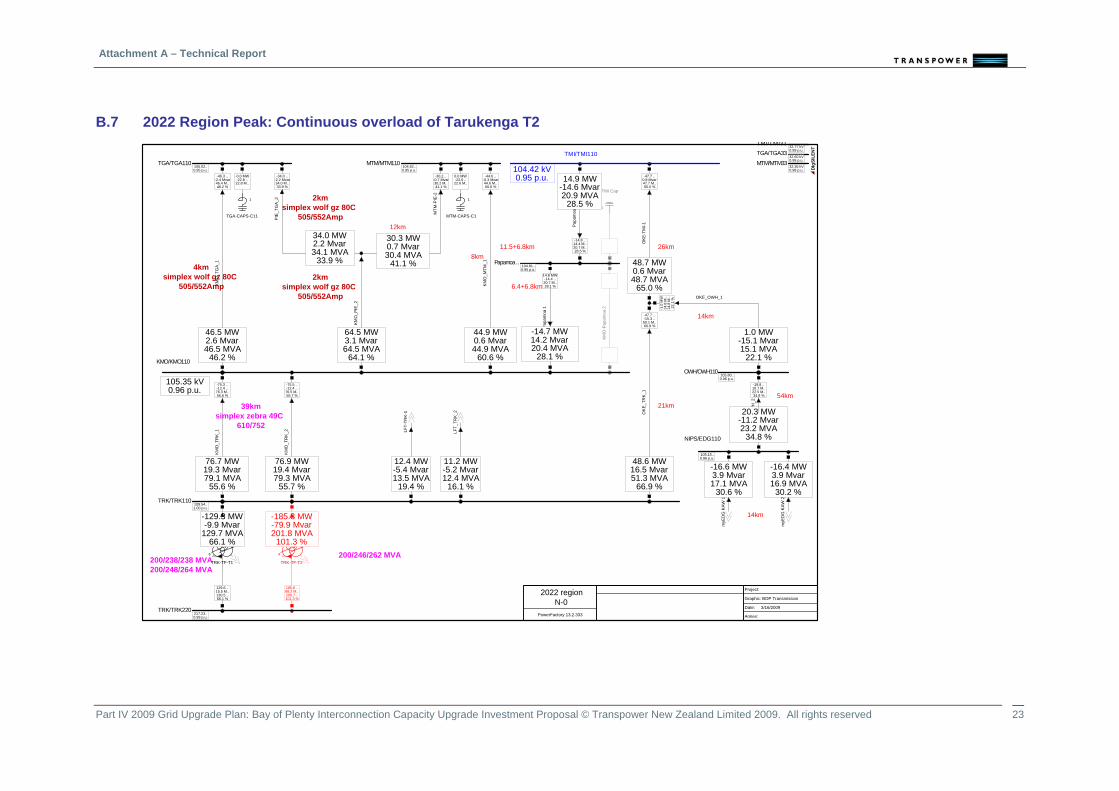
4.9 2022 Peak Region Forecast: Tarukenga T2 continuous rating exceed (Appendix B7)
The Tarukenga T2 110 kV winding exceeds its continuous rating of 200MVA.
The Okere–Tarukenga section reaches 100% loading for the loss of a Kaitimako–Tarukenga 1 or 2 circuit.
A minimum of 15 MW must be shifted from Mount Maunganui to Papamoa.
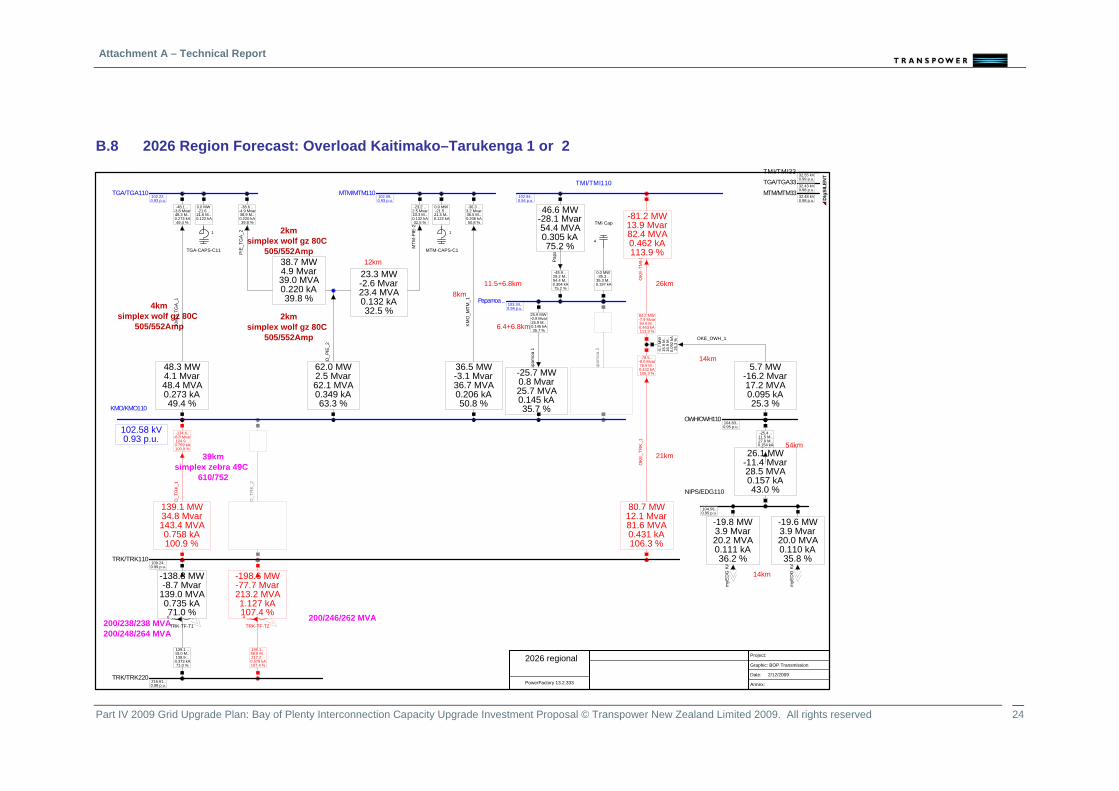
4.10 2026 Peak Region Forecast: Overload of the Kaitimako–Tarukenga 1 and 2 circuits. (Appendix B8)
The Kaitimako–Tarukenga 1 or 2 circuits will reach 100% of their rating for a Kaitimako–Tarukenga 2 or 1 loss.
A minimum of 35 MW must be shifted from Mount Maunganui to Papamoa
4.11 2029 Peak Region Forecast
To complete the 20 year study; a minimum of 48 MW must be shifted from Mount Maunganui to Papamoa to avoid the Kaitimako–Poike-2 section from overloading for the loss of the Kaitimako–Tauranga circuit.
Part IV 2009 Grid Upgrade Plan: Bay of Plenty Interconnection Capacity Upgrade Investment Proposal © Transpower 12New Zealand Limited 2009. All rights reserved
Attachment A – Technical Report
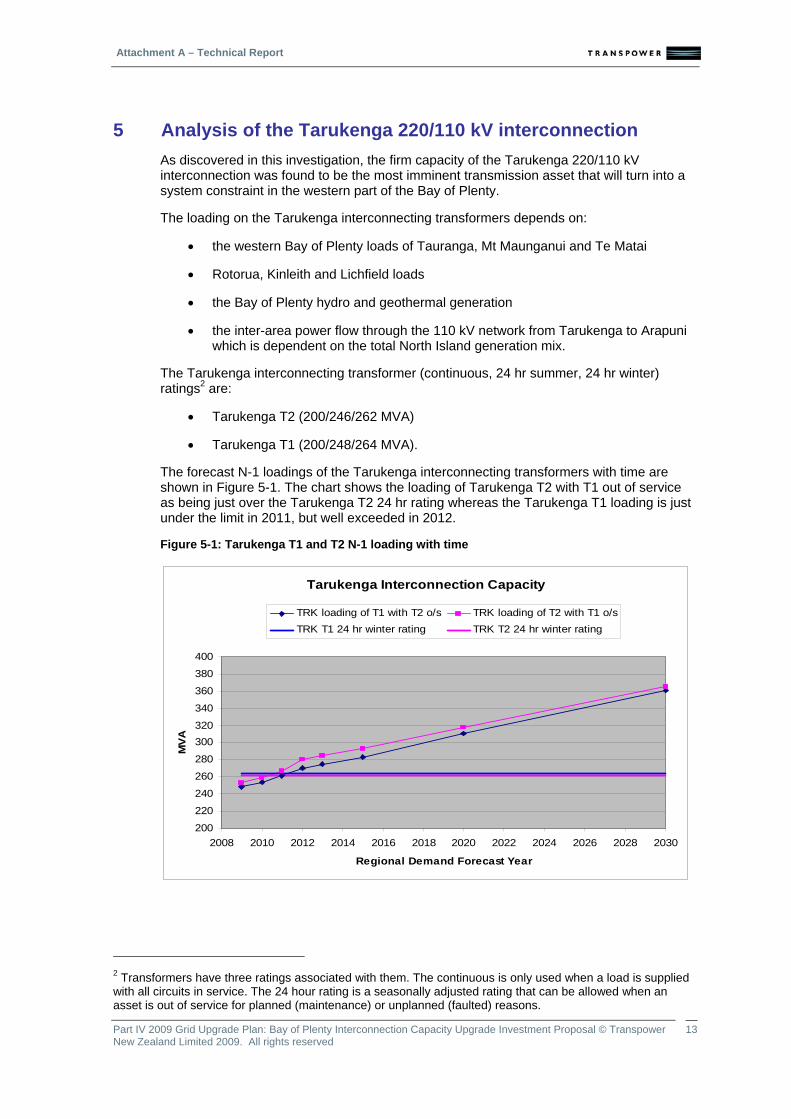
5 Analysis of the Tarukenga 220/110 kV interconnection As discovered in this investigation, the firm capacity of the Tarukenga 220/110 kV interconnection was found to be the most imminent transmission asset that will turn into a system constraint in the western part of the Bay of Plenty.
The loading on the Tarukenga interconnecting transformers depends on:
• the western Bay of Plenty loads of Tauranga, Mt Maunganui and Te Matai
• Rotorua, Kinleith and Lichfield loads
• the Bay of Plenty hydro and geothermal generation
• the inter-area power flow through the 110 kV network from Tarukenga to Arapuni which is dependent on the total North Island generation mix.
The Tarukenga interconnecting transformer (continuous, 24 hr summer, 24 hr winter) ratings2 are:
• Tarukenga T2 (200/246/262 MVA)
• Tarukenga T1 (200/248/264 MVA).
The forecast N-1 loadings of the Tarukenga interconnecting transformers with time are shown in Figure 5-1. The chart shows the loading of Tarukenga T2 with T1 out of service as being just over the Tarukenga T2 24 hr rating whereas the Tarukenga T1 loading is just under the limit in 2011, but well exceeded in 2012.
Figure 5-1: Tarukenga T1 and T2 N-1 loading with time
Tarukenga Interconnection Capacity
200
220
240
260
280
300320
340
360
380
400
2008 2010 2012 2014 2016 2018 2020 2022 2024 2026 2028 2030
Regional Demand Forecast Year
MV
A
TRK loading of T1 with T2 o/s TRK loading of T2 with T1 o/sTRK T1 24 hr winter rating TRK T2 24 hr winter rating
2 Transformers have three ratings associated with them. The continuous is only used when a load is supplied with all circuits in service. The 24 hour rating is a seasonally adjusted rating that can be allowed when an asset is out of service for planned (maintenance) or unplanned (faulted) reasons.
Part IV 2009 Grid Upgrade Plan: Bay of Plenty Interconnection Capacity Upgrade Investment Proposal © Transpower 13New Zealand Limited 2009. All rights reserved
Attachment A – Technical Report
6 Conclusion The investigation has identified short, mid and long term issues that cover the core grid area between the 220 kV Tarukenga bus to the 110 kV Kaitimako bus and the non core grid 110 kV lines between Tarukenga, Okere, Te Matai and Kaitimako.
In the short term:
• the rating of the current transformer associated with Tarukenga 220/110 kV interconnecting transformer T1 (CT 192) needs to be increased so that it matches the transformer 110 kV winding rating by the winter of 2009
• failure of the Tarukenga 220/110 kV interconnecting transformer (T1) will overload the parallel interconnecting transformer (T2) during winter peaks from 2011
• failure of the Tarukenga 220/110 kV interconnecting transformerT2 will overload the parallel interconnecting transformer (T1) during winter peaks from 2012.
In the mid term:
• any planned or unplanned outage of Tarukenga 220/110 kV interconnecting transformer T1 during the summer daily peaks will require load curtailment to prevent the parallel interconnecting transformer (T2) overloading from 2016 (ie. There are no daylight periods in the year where transformer maintenance will not require load curtailment)
• any planned or unplanned outage of Tarukenga 220/110 kV interconnecting transformer T2 during the summer daily peaks will require load curtailment to prevent the parallel interconnecting transformer (T1) overloading from 2017 (ie. There are no daylight periods in the year where transformer maintenance will not require load curtailment).
In the long term:
• The Okere–Te Matai line section will overload from the winter of 2020 onwards for the loss of any of the Kaitimako–Tarukenga circuits. Any load shifting from Mount Maunganui to a new GXP at Papamoa will accelerate this date
• a substantial load shift from Mount Maunganui to a new GXP at Papamoa will result in low transmission voltage during the loss of the Kaitimako–Papamoa circuit
• by the winter of 2026, loss of one of the Kaitimako Tarukenga 1 and 2 circuits will overload for the loss of the remaining circuit.
Part IV 2009 Grid Upgrade Plan: Bay of Plenty Interconnection Capacity Upgrade Investment Proposal © Transpower 14New Zealand Limited 2009. All rights reserved

Attachment A – Technical Report
Part IV 2009 Grid Upgrade Plan: Bay of Plenty Interconnection Capacity Upgrade Investment Proposal © Transpower New Zealand Limited 2009. All rights reserved
15
7 References 1/ Kaitimako New Point of Supply, FMIS CP_Kaitimako_02_00_00, PAD APR 12 Dec 2007 with a commission date of 20 March 2009.
2/ HLR Powerco-New GXP at Papamoa, File 15/Papamoa, 15 January 2009
3/ Customer Advice Notice (CAN) Edgecumbe 11/Sep/2008.
Attachment A – Technical Report
Appendix A Demand Forecast
Peak Peak Trough Light SummerRegion Island Island Island Island Peak Peak Trough Light Summer PeakPower Power Power Power Power Region Island Island Island Island
CODE BAY OF PLENTY Factor Factor Factor Factor Factor Diversity Diversity Diversity Diversity Diversity 2008 2009 2010 2011 2012 2013 2014 2015 2016 2017 2018 2019 2020EDG_33 Edgecumbe 0.959 0.963 1.000 0.902 0.945 94.31% 93.98% 100.00% 47.89% 85.29% 59.7 61.6 63.5 65.6 67.2 68.5 69.8 71.2 72.5 73.9 75.4 77.0 78.7KMO_33 Kaitemako 0.958 0.956 1.000 0.982 0.923 83.41% 84.33% 100.00% 40.86% 61.63% 0.0 15.0 15.5 16.1 16.1 16.0 15.7 15.6 15.7 15.7 15.8 15.9 16.0KAW_11 T1/T2 Horizon Kawerau Horizon 0.973 0.952 1.000 0.604 0.978 85.90% 75.45% 100.00% 2.05% 86.91% 16.0 16.4 16.8 17.4 17.9 18.2 18.5 18.9 19.2 19.6 20.0 20.5 20.9KAW_11/T6 Kawerau T6 0.982 0.978 1.000 0.887 0.990 84.07% 61.40% 100.00% 0.19% 81.66% 22.5 22.5 22.5 22.5 22.5 22.5 22.5 22.5 22.5 22.5 22.5 22.5 22.5KAW_11/T7 Kawerau T7 0.982 0.978 1.000 0.887 0.990 84.07% 61.40% 100.00% 0.19% 81.66% 22.5 22.5 22.5 22.5 22.5 22.5 22.5 22.5 22.5 22.5 22.5 22.5 22.5KAW_11/T8 Kawerau T8 0.982 0.978 1.000 0.887 0.990 84.07% 61.40% 100.00% 0.19% 81.66% 22.5 22.5 22.5 22.5 22.5 22.5 22.5 22.5 22.5 22.5 22.5 22.5 22.5KAW_11/T9 Kawerau T9 0.982 0.978 1.000 0.887 0.990 84.07% 61.40% 100.00% 0.19% 81.66% 22.5 22.5 22.5 22.5 22.5 22.5 22.5 22.5 22.5 22.5 22.5 22.5 22.5KAW_11/T11 Kawerau T11 -0.999 -0.999 1.000 0.996 -0.999 93.27% 80.05% 100.00% 19.07% 91.57% 45.0 45.0 45.0 45.0 45.0 45.0 45.0 45.0 45.0 45.0 45.0 45.0 45.0KAW_11/T14 Kawerau T14 -0.999 -0.999 1.000 0.996 -0.999 93.27% 80.05% 100.00% 19.07% 91.57% 45.0 45.0 45.0 45.0 45.0 45.0 45.0 45.0 45.0 45.0 45.0 45.0 45.0MTM_11 Mt Maunganui 11kV 0.974 0.974 1.000 0.942 0.968 92.29% 91.46% 100.00% 26.97% 75.37% 19.5 20.1 20.7 21.4 21.9 22.4 22.8 23.2 23.7 24.1 24.6 25.1 25.7MTM_33 Mt Maunganui 33kV 0.974 0.973 1.000 0.995 0.977 88.92% 92.07% 100.00% 25.91% 72.76% 41.6 43.0 44.3 45.7 46.9 47.8 48.7 49.6 50.5 51.5 52.6 53.7 54.9OWH Owhata 0.991 0.991 1.000 0.996 0.990 92.41% 93.98% 100.00% 25.89% 85.33% 15.1 15.6 16.1 16.6 17.0 17.3 17.7 18.0 18.3 18.7 19.1 19.5 19.9ROT_11 Rotorua 11kV 0.937 0.940 1.000 0.881 0.923 92.49% 98.09% 100.00% 26.98% 79.78% 31.8 32.8 33.8 34.9 35.8 36.5 37.2 37.9 38.6 39.4 40.2 41.0 41.9ROT_33 Rotorua 33kV 0.911 0.911 1.000 0.926 0.907 86.19% 88.90% 100.00% 40.86% 80.11% 39.6 40.9 42.1 43.5 44.6 45.5 46.3 47.2 48.1 49.0 50.0 51.1 52.2TGA_11 Tauranga 11kV 0.983 0.983 1.000 0.982 0.979 96.49% 97.24% 100.00% 27.07% 82.36% 25.2 26.1 26.9 27.7 28.4 29.0 29.5 30.1 30.7 31.2 31.9 32.6 33.3TGA_33 Tauranga 33kV 0.958 0.956 1.000 0.982 0.923 83.41% 84.33% 100.00% 40.86% 61.63% 52.9 39.6 40.8 42.0 43.5 44.8 46.2 47.5 48.6 49.8 51.0 52.4 53.8TRK Tarukenga 11kV 0.997 0.997 1.000 0.999 0.997 74.48% 74.17% 100.00% 27.96% 71.32% 8.6 8.9 9.2 9.4 9.7 9.9 10.1 10.3 10.4 10.6 10.9 11.1 11.3TKH Te Kaha 0.970 0.972 1.000 0.857 0.959 79.30% 78.96% 100.00% 44.23% 75.75% 1.4 1.5 1.5 1.6 1.6 1.6 1.7 1.7 1.7 1.8 1.8 1.8 1.9TMI Te Matai 0.951 0.953 1.000 0.964 0.947 94.63% 94.38% 100.00% 28.05% 82.27% 25.4 26.2 27.0 27.9 28.6 29.2 29.7 30.3 30.9 31.5 32.1 32.8 33.5WAI Waiotahi 0.979 0.979 1.000 0.935 0.976 98.05% 97.12% 100.00% 35.98% 93.78% 8.3 8.6 8.8 9.1 9.4 9.5 9.7 9.9 10.1 10.3 10.5 10.7 11.0
2021 2022 2023 2024 2025 2026 2027 2028 2029 2030 2031 2032 2033 2034 2035 2036 2037 2038 2039 204079.6 80.5 81.5 82.4 83.3 84.2 85.1 86.1 87.0 87.9 88.9 89.9 90.9 91.8 92.8 93.9 95.0 96.1 97.2 98.316.4 16.8 17.2 17.6 18.0 18.4 18.8 19.2 19.6 20.1 20.5 20.9 21.4 21.8 22.2 22.7 23.2 23.6 24.1 24.621.3 21.8 22.2 22.6 23.1 23.5 23.9 24.3 24.8 25.2 25.6 26.1 26.5 27.0 27.4 27.9 28.4 28.9 29.4 29.922.5 22.5 22.5 22.5 22.5 22.5 22.5 22.5 22.5 22.5 22.5 22.5 22.5 22.5 22.5 22.5 22.5 22.5 22.5 22.522.5 22.5 22.5 22.5 22.5 22.5 22.5 22.5 22.5 22.5 22.5 22.5 22.5 22.5 22.5 22.5 22.5 22.5 22.5 22.522.5 22.5 22.5 22.5 22.5 22.5 22.5 22.5 22.5 22.5 22.5 22.5 22.5 22.5 22.5 22.5 22.5 22.5 22.5 22.522.5 22.5 22.5 22.5 22.5 22.5 22.5 22.5 22.5 22.5 22.5 22.5 22.5 22.5 22.5 22.5 22.5 22.5 22.5 22.545.0 45.0 45.0 45.0 45.0 45.0 45.0 45.0 45.0 45.0 45.0 45.0 45.0 45.0 45.0 45.0 45.0 45.0 45.0 45.045.0 45.0 45.0 45.0 45.0 45.0 45.0 45.0 45.0 45.0 45.0 45.0 45.0 45.0 45.0 45.0 45.0 45.0 45.0 45.026.2 26.7 27.2 27.7 28.2 28.7 29.2 29.7 30.2 30.7 31.2 31.8 32.3 32.9 33.4 34.0 34.6 35.2 35.8 36.455.6 56.4 57.2 58.0 58.8 59.6 60.4 61.3 62.1 62.9 63.8 64.7 65.5 66.4 67.3 68.2 69.2 70.1 71.1 72.120.1 20.3 20.6 20.8 21.0 21.2 21.5 21.7 21.9 22.1 22.4 22.6 22.8 23.1 23.3 23.6 23.8 24.1 24.3 24.642.4 42.9 43.4 43.9 44.5 45.0 45.5 46.0 46.5 47.0 47.6 48.1 48.7 49.2 49.8 50.3 50.9 51.5 52.1 52.852.7 53.3 53.9 54.5 55.1 55.6 56.2 56.8 57.4 58.0 58.6 59.2 59.8 60.4 61.1 61.8 62.4 63.1 63.8 64.533.7 34.2 34.7 35.2 35.7 36.2 36.6 37.1 37.6 38.1 38.7 39.2 39.7 40.3 40.8 41.4 42.0 42.5 43.1 43.755.1 56.5 57.8 59.2 60.6 61.9 63.3 64.7 66.0 67.5 68.9 70.3 71.8 73.3 74.8 76.3 77.9 79.5 81.1 82.711.5 11.6 11.7 11.8 12.0 12.1 12.2 12.4 12.5 12.6 12.7 12.9 13.0 13.1 13.3 13.4 13.6 13.7 13.9 14.0
1.9 1.9 1.9 2.0 2.0 2.0 2.0 2.0 2.0 2.1 2.1 2.1 2.1 2.1 2.2 2.2 2.2 2.2 2.2 2.334.0 34.4 34.9 35.4 35.9 36.4 36.9 37.4 37.9 38.4 38.9 39.5 40.0 40.5 41.1 41.7 42.2 42.8 43.4 44.011.1 11.2 11.3 11.4 11.5 11.6 11.7 11.8 11.9 12.0 12.1 12.2 12.4 12.5 12.6 12.7 12.8 13.0 13.1 13.2
Part IV 2009 Grid Upgrade Plan: Bay of Plenty Interconnection Capacity Upgrade Investment Proposal © Transpower New Zealand Limited 2009. All rights reserved 16
Attachment A – Technical Report
Appendix B Digsilent Diagrams
B.1 Pre 2008 Summer Peak Forecast: Loss of a Kaitimako–Tarukenga circuit and subsequent loss of the Okere sections.
(Note that the model contains a second Kaitimako–Te Matai circuit and a Papamoa capacitor, in anticipation of solution options, but not required for the needs identification).
2008 summer N-2 Okere
PowerFactory 13.2.333
Project:
Graphic: BOP Transmission
Date: 3/16/2009
Annex:
6.4+6.8km
11.5+6.8km
14km
54km21km
14km
26km
12km
8km
200/246/262 MVA200/238/238 MVA200/248/264 MVA
39kmsimplex zebra 49C
610/752
KM
O-P
apam
oa 2
2kmsimplex wolf gz 80C
505/552Amp
2kmsimplex wolf gz 80C
505/552Amp
4kmsimplex wolf gz 80C
505/552Amp
TMI Cap
1
KM
O-P
apam
oa 1
-31.1 ..-12.0 ..33.4 M..55.1 %
31.5 MW12.2 Mvar33.8 MVA
55.1 %
LFT_
TRK
_2
22.7 MW-6.0 Mvar23.5 MVA
36.8 %
LFT-
TRK
-1
25.0 MW-6.2 Mvar25.7 MVA
44.8 %
PIE
_TG
A_2
24.0 MW0.2 Mvar24.0 MVA
25.7 %
-24.0 ..-0.2 Mvar24.0 M..25.7 %
TGA-CAPS-C11
-0.0 MW-23.5 ..23.5 M..
1
MTM-CAPS-C1
0.0 MW-23.6 ..23.6 M..
1
myE
DG
KA
W 2
-11.0 MW-1.7 Mvar11.1 MVA
23.9 %
myE
DG
KA
W 1
-11.1 MW-1.8 Mvar11.3 MVA
24.1 %
ED
G_O
WH
_2
-12.9 ..-2.7 Mvar13.2 M..24.2 %
13.1 MW1.4 Mvar13.1 MVA
24.2 %
TRK-TF-T1
-95.4 MW-13.2 Mvar96.3 MVA
48.2 %
95.7 MW16.8 M..97.1 M..48.2 %
5
TRK-TF-T2
-132.8 MW-15.9 Mvar133.7 MVA
66.6 %
133.1 ..19.9 M..134.6 ..66.6 %
5
OKE_OWH_1
OK
E_T
RK
_1
OK
E-T
MI-1
KM
O_P
IE_2
37.6 MW-6.3 Mvar38.2 MVA
40.8 %
MTM
-PIE
-2
13.6 MW-6.6 Mvar15.1 MVA
24.5 %
-13.6 ..6.3 Mvar15.0 M..24.5 %
Pap
amoa
-TM
I
-21.0 MW-8.8 Mvar22.8 MVA
37.9 %
21.1 MW8.6 Mvar22.8 M..37.9 %
KM
O_T
RK
_2
-120.2..5.3 Mvar120.3 ..106.5 %
123.6 MW13.3 Mvar124.3 MVA
106.5 %
KM
O_T
RK
_1
KM
O_M
TM_1
-21.4 ..8.6 Mvar23.1 M..37.6 %
21.5 MW-8.7 Mvar23.2 MVA
37.6 %
KM
O_T
GA
_1
-29.6 ..2.4 Mvar29.7 M..31.8 %
29.6 MW-2.4 Mvar29.7 MVA
31.8 %
Papamoa ..105.09..0.96 p.u.
NIPS/EDG110
106.55..0.97 p.u.
OWH/OWH110104.96..0.95 p.u.
TMI/TMI33 33.10 kV1.00 p.u.
TMI/TMI110
104.18 kV0.95 p.u.
TRK/TRK220221.84..1.01 p.u.
TRK/TRK110110.44..1.00 p.u.
KMO/KMO110
106.90 kV0.97 p.u.
MTM/MTM3332.79 kV0.99 p.u.
MTM/MTM110106.84..0.97 p.u.
TGA/TGA3332.81 kV0.99 p.u.TGA/TGA110
106.75..0.97 p.u. D
IgSI
LEN
T
Part IV 2009 Grid Upgrade Plan: Bay of Plenty Interconnection Capacity Upgrade Investment Proposal © Transpower New Zealand Limited 2009. All rights reserved 17
Attachment A – Technical Report
B.2 2009 Peak Region Forecast: Overloading CT 192 while Tarukenga T2 is out of service.
2009 region
PowerFactory 13.2.333
Project:
Graphic: BOP Transmission
Date: 1/28/2009
Annex:
2kmsimplex wolf gz 80C
505/552Amp
2kmsimplex wolf gz 80C
505/552Amp
4kmsimplex wolf gz 80C
505/552Amp 6.4+6.8km
11.5+6.8km
14km
54km21km
14km
26km
12km
8km
200/246/262 MVA200/238/238 MVA200/248/264 MVA
39kmsimplex zebra 49C
610/752
KMO
-Pap
amoa
2
TMI Cap
1
KMO
-Pap
amoa
1
-25.8 ..-29.4 ..39.1 M..0.213 kA52.6 %
26.2 MW29.9 Mvar39.7 MVA0.211 kA52.6 %
PIE_
TGA_
2
28.7 MW-0.5 Mvar28.7 MVA0.153 kA27.6 %
-28.7 ..0.5 Mvar28.7 M..0.153 kA27.6 %
TGA-CAPS-C11
-0.0 MW-24.4 ..24.4 M..0.129 kA
1
MTM-CAPS-C1
0.0 MW-24.6 ..24.6 M..0.130 kA
1
myE
DG
KAW
2
-18.6 MW4.2 Mvar19.1 MVA0.103 kA33.4 %
myE
DG
KAW
1
-18.8 MW4.3 Mvar19.3 MVA0.104 kA33.8 %
EDG
_OW
H_2
-27.0 ..10.6 M..29.0 M..0.156 kA43.5 %
27.7 MW-10.6 Mvar29.6 MVA0.159 kA43.5 %
TRK-TF-T1
-243.3 MW-43.7 Mvar247.2 MVA1.295 kA125.1 %
243.9 ..60.5 M..251.3 ..0.657 kA125.1 %
6
TRK-TF-T2
5
OKE_OWH_1
-12.
5 ..
13.4
M..
18.3
M..
0.09
8 kA
26.8
%
12.5 MW-13.7 Mvar18.6 MVA0.100 kA26.8 %
OKE
_TR
K_1
-35.4 ..-13.7 ..38.0 M..0.203 kA50.1 %
35.9 MW14.1 Mvar38.6 MVA0.202 kA50.1 %
OKE
-TM
I-1
-47.0 MW1.0 Mvar47.0 MVA0.256 kA63.2 %
47.9 MW0.3 Mvar47.9 M..0.257 kA63.2 %
KMO
_PIE
_2
30.7 MW-12.4 Mvar33.1 MVA0.176 kA31.8 %
MTM
-PIE
-2
1.9 MW-11.8 Mvar12.0 MVA0.064 kA15.7 %
-1.9 MW11.6 M..11.7 M..0.062 kA15.7 %
Papa
moa
-TM
I
22.0 MW-11.3 Mvar24.8 MVA0.135 kA33.3 %
-21.9 ..11.2 M..24.6 M..0.134 kA33.3 %
KMO
_TR
K_2
-53.2 ..-0.4 Mvar53.2 M..0.283 kA37.6 %
53.9 MW2.8 Mvar53.9 MVA0.283 kA37.6 %
KMO
_TR
K_1
-53.1 ..-0.4 Mvar53.1 M..0.282 kA37.5 %
53.7 MW2.8 Mvar53.8 MVA0.282 kA37.5 %
KMO
_MTM
_1
-7.2 MW15.3 M..16.9 M..0.089 kA22.3 %
7.2 MW-15.5 Mvar17.1 MVA0.091 kA22.3 %
KMO
_TG
A_1
-29.6 ..5.3 Mvar30.1 M..0.160 kA29.0 %
29.7 MW-5.3 Mvar30.1 MVA0.160 kA29.0 %
Papamoa ..105.87..0.96 p.u.
NIPS/EDG110
107.40..0.98 p.u.
OWH/OWH110107.35..0.98 p.u.
TMI/TMI3333.40 kV1.01 p.u.
TMI/TMI110
105.80..0.96 p.u.
TRK/TRK220220.89..1.00 p.u.
TRK/TRK110110.22..1.00 p.u.
KMO/KMO110
108.69 kV0.99 p.u.
MTM/MTM3332.80 kV0.99 p.u.
MTM/MTM110109.05..0.99 p.u.
TGA/TGA3333.12 kV1.00 p.u.TGA/TGA110
108.58..0.99 p.u. D
IgSI
LEN
T
Part IV 2009 Grid Upgrade Plan: Bay of Plenty Interconnection Capacity Upgrade Investment Proposal © Transpower New Zealand Limited 2009. All rights reserved 18
Attachment A – Technical Report
B.3 2011 Region Forecast: Overload Tarukenga T2 for the loss of Tarukenga T1
2011 region
PowerFactory 13.2.333
Project:
Graphic: BOP Transmission
Date: 1/28/2009
Annex:
2kmsimplex wolf gz 80C
505/552Amp
2kmsimplex wolf gz 80C
505/552Amp
4kmsimplex wolf gz 80C
505/552Amp 6.4+6.8km
11.5+6.8km
14km
54km21km
14km
26km
12km
8km
200/246/262 MVA200/238/238 MVA200/248/264 MVA
39kmsimplex zebra 49C
610/752
KM
O-P
apam
oa 2
TMI Cap
1
KM
O-P
apam
oa 1
-25.6 ..-28.8 ..38.5 M..0.213 kA52.5 %
26.0 MW29.2 Mvar39.1 MVA0.211 kA52.5 %
PIE
_TG
A_2
30.2 MW0.4 Mvar30.2 MVA0.163 kA29.6 %
-30.2 ..-0.4 Mvar30.2 M..0.163 kA29.6 %
TGA-CAPS-C11
0.0 MW-23.6 ..23.6 M..0.127 kA
1
MTM-CAPS-C1
0.0 MW-23.8 ..23.8 M..0.128 kA
1
myE
DG
KA
W 2
-17.9 MW2.6 Mvar18.1 MVA0.098 kA31.8 %
myE
DG
KA
W 1
-18.1 MW2.7 Mvar18.3 MVA0.099 kA32.2 %
ED
G_O
WH
_2
-25.0 ..7.5 Mvar26.1 M..0.142 kA39.5 %
25.6 MW-7.7 Mvar26.7 MVA0.145 kA39.5 %
TRK-TF-T1
5
TRK-TF-T2
-261.8 MW-44.2 Mvar265.5 MVA1.407 kA134.0 %
262.6 ..58.0 M..268.9 ..0.704 kA134.0 %
5
OKE_OWH_1
-9.6
MW
10.5
M..
14.2
M..
0.07
7 kA
21.1
%
9.6 MW-10.8 Mvar14.5 MVA0.079 kA21.1 %
OK
E_T
RK
_1
-40.2 ..-12.5 ..42.1 M..0.228 kA56.3 %
40.8 MW13.1 Mvar42.9 MVA0.227 kA56.3 %
OK
E-T
MI-1
-48.8 MW-0.5 Mvar48.8 MVA0.271 kA66.7 %
49.9 MW2.0 Mvar49.9 M..0.271 kA66.7 %
KM
O_P
IE_2
33.7 MW-10.7 Mvar35.3 MVA0.191 kA34.5 %
MTM
-PIE
-2
3.4 MW-11.1 Mvar11.7 MVA0.063 kA15.5 %
-3.4 MW10.9 M..11.4 M..0.061 kA15.5 %
Pap
amoa
-TM
I
22.3 MW-10.6 Mvar24.6 MVA0.137 kA33.6 %
-22.1 ..10.5 M..24.5 M..0.136 kA33.6 %
KM
O_T
RK
_2
-57.2 ..-2.2 Mvar57.3 M..0.309 kA41.1 %
58.0 MW5.4 Mvar58.2 MVA0.309 kA41.1 %
KM
O_T
RK
_1
-57.1 ..-2.2 Mvar57.1 M..0.308 kA41.0 %
57.8 MW5.4 Mvar58.1 MVA0.308 kA41.0 %
KM
O_M
TM_1
-9.3 MW14.3 M..17.1 M..0.092 kA22.9 %
9.4 MW-14.5 Mvar17.2 MVA0.093 kA22.9 %
KM
O_T
GA
_1
-31.7 ..4.0 Mvar32.0 M..0.173 kA31.3 %
31.8 MW-4.0 Mvar32.0 MVA0.173 kA31.3 %
Papamoa ..104.18..0.95 p.u.
NIPS/EDG110
106.61..0.97 p.u.
OWH/OWH110106.08..0.96 p.u.
TMI/TMI3332.83 kV0.99 p.u.
TMI/TMI110
104.15..0.95 p.u.
TRK/TRK220220.48..1.00 p.u.
TRK/TRK110108.96..0.99 p.u.
KMO/KMO110
106.99 kV0.97 p.u.
MTM/MTM3332.57 kV0.99 p.u.
MTM/MTM110107.29..0.98 p.u.
TGA/TGA3332.56 kV0.99 p.u.TGA/TGA110
106.85..0.97 p.u. D
IgSI
LEN
T
Part IV 2009 Grid Upgrade Plan: Bay of Plenty Interconnection Capacity Upgrade Investment Proposal © Transpower New Zealand Limited 2009. All rights reserved 19

Attachment A – Technical Report
B.4 2012 Region Forecast: Overload Tarukenga T1
2012 region
PowerFactory 13.2.333
Project:
Graphic: BOP Transmission
Date: 3/17/2009
Annex:
2kmsimplex wolf gz 80C
505/552Amp
2kmsimplex wolf gz 80C
505/552Amp
4kmsimplex wolf gz 80C
505/552Amp 6.4+6.8km
11.5+6.8km
14km
54km21km
14km
26km
12km
8km
200/246/262 MVA200/238/238 MVA200/248/264 MVA
39kmsimplex zebra 49C
610/752
KM
O-P
apam
oa 2
TMI Cap
1
KM
O-P
apam
oa 1
14.3 MW-15.2 ..20.8 M..27.7 %
-14.1 MW14.9 Mvar20.5 MVA
27.7 %
LFT_
TRK
_2
14.4 MW-2.7 Mvar14.7 MVA
18.9 %
LFT-
TRK
-1
15.9 MW-2.6 Mvar16.1 MVA
23.0 %
PIE
_TG
A_2
26.8 MW-1.2 Mvar26.9 MVA
26.1 %
-26.8 ..1.2 Mvar26.8 M..26.1 %
TGA-CAPS-C11
0.0 MW-23.9 ..23.9 M..
1
MTM-CAPS-C1
0.0 MW-23.7 ..23.7 M..
1
myE
DG
KA
W 2
-18.5 MW5.3 Mvar19.2 MVA
33.9 %
myE
DG
KA
W 1
-18.7 MW5.4 Mvar19.5 MVA
34.3 %
ED
G_O
WH
_2
-25.8 ..13.2 M..29.0 M..43.7 %
26.5 MW-13.2 Mvar29.6 MVA
43.7 %
TRK-TF-T1
-263.4 MW-62.5 Mvar270.7 MVA
138.7 %
264.1 ..82.4 M..276.7 ..138.7 %
7
TRK-TF-T2
5
OKE_OWH_1
-10.
0 ..
16.3
M..
19.2
M..
28.0
%
10.1 MW-16.6 Mvar19.4 MVA
28.0 %
OK
E_T
RK
_1
-32.3 ..-13.0 ..34.9 M..45.8 %
32.7 MW13.2 Mvar35.3 MVA
45.8 %
OK
E-T
MI-1
-41.6 ..4.1 Mvar41.8 M..55.8 %
42.3 MW-3.3 Mvar42.5 MVA
55.8 %
KM
O_P
IE_2
52.1 MW-3.0 Mvar52.2 MVA
50.7 %
MTM
-PIE
-2
25.3 MW-1.9 Mvar25.3 MVA
33.5 %
-25.2 ..1.8 Mvar25.2 M..33.5 %
Pap
amoa
-TM
I
14.4 MW-15.4 Mvar21.1 MVA
28.1 %
-14.3 ..15.2 M..20.8 M..28.1 %
KM
O_T
RK
_2
-62.9 ..-5.6 Mvar63.1 M..45.0 %
63.8 MW9.7 Mvar64.5 MVA
45.0 %
KM
O_T
RK
_1
-62.7 ..-5.6 Mvar63.0 M..44.9 %
63.6 MW9.6 Mvar64.3 MVA
44.9 %K
MO
_MTM
_1
-36.8 ..3.4 Mvar37.0 M..49.0 %
37.0 MW-3.2 Mvar37.1 MVA
49.0 %
KM
TGA
_O
_1
-37.1 ..2.0 Mvar37.1 M..36.1 %
37.1 MW-1.9 Mvar37.2 MVA
36.1 %
Papamoa ..107.09..0.97 p.u.
NIPS/EDG110
106.83..0.97 p.u.
OWH/OWH110107.43..0.98 p.u.
TMI/TMI3333.63 kV1.02 p.u.
TMI/TMI110
106.65 kV0.97 p.u.
TRK/TRK220219.41..1.00 p.u.
TRK/TRK110110.31..1.00 p.u.
KMO/KMO110
107.68 kV0.98 p.u.
MTM/MTM3332.97 kV1.00 p.u.
MTM/MTM110107.21..0.97 p.u.
TGA/TGA3333.13 kV1.00 p.u.TGA/TGA110
107.48..0.98 p.u. D
IgSI
LEN
T
Part IV 2009 Grid Upgrade Plan: Bay of Plenty Interconnection Capacity Upgrade Investment Proposal © Transpower New Zealand Limited 2009. All rights reserved 20
Attachment A – Technical Report
B.5 2018 Summer Peak Forecast: Loss of a Kaitimako–Tarukenga circuit and subsequent loss of the Kaitimako–Te Matai circuit.
2018 summer N-2 Papamoa PowerFactory 13.2.333
Project:
Graphic: BOP Transmission
Date: 3/16/2009
Annex:
6.4+6.8km
11.5+6.8km
14km
54km21km
14km
26km
12km
8km
200/246/262 MVA200/238/238 MVA200/248/264 MVA
39kmsimplex zebra 49C
610/752
KM
O-P
apam
oa 2
2kmsimplex wolf gz 80C
505/552Amp
2kmsimplex wolf gz 80C
505/552Amp
4kmsimplex wolf gz 80C
505/552Amp
TMI Cap
1
KM
O-P
apam
oa 1
LFT_
TRK
_2
18.1 MW-8.5 Mvar20.0 MVA
31.7 %
LFT-
TRK
-1
19.9 MW-8.9 Mvar21.9 MVA
38.4 %
PIE
_TG
A_2
25.1 MW0.7 Mvar25.1 MVA
27.0 %
-25.1 ..-0.8 Mvar25.1 M..27.0 %
TGA-CAPS-C11
-0.0 MW-23.3 ..23.3 M..
1
MTM-CAPS-C1
0.0 MW-23.3 ..23.3 M..
1
myE
DG
KA
W 2
-14.1 MW1.8 Mvar14.2 MVA
30.6 %
myE
DG
KA
W 1
-14.3 MW1.9 Mvar14.4 MVA
31.0 %
ED
G_O
WH
_2
-16.7 ..5.7 Mvar17.6 M..32.9 %
16.9 MW-6.7 Mvar18.2 MVA
32.9 %
TRK-TF-T1
-107.3 MW-22.6 Mvar109.7 MVA
55.4 %
107.6 ..27.0 M..110.9 ..55.4 %
5
TRK-TF-T2
-149.5 MW-28.7 Mvar152.2 MVA
76.5 %
149.9 ..33.6 M..153.6 ..76.5 %
5
OKE_OWH_1
-0.3
MW
9.0
Mva
r9.
1 M
VA
16.8
%
0.3 MW-9.4 Mvar9.4 MVA16.8 %
OK
E_T
RK
_1
-26.6 ..-20.4 ..33.5 M..54.4 %
27.0 MW20.6 Mvar33.9 MVA
54.4 %
OK
E-T
MI-1
-26.6 ..-11.4 ..28.9 M..47.9 %
26.9 MW11.4 Mvar29.2 MVA
47.9 %
KM
O_P
IE_2
43.9 MW-3.9 Mvar44.1 MVA
47.4 %
MTM
-PIE
-2
18.7 MW-4.7 Mvar19.3 MVA
31.5 %
-18.7 ..4.5 Mvar19.2 M..31.5 %
Pap
amoa
-TM
I
KM
O_T
RK
_2
-114.7..7.1 Mvar114.9 ..102.2 %
117.8 MW9.9 Mvar
118.2 MVA102.2 %
KM
O_T
RK
_1
KM
O_M
TM_1
-28.2 ..6.3 Mvar28.9 M..47.2 %
28.3 MW-6.3 Mvar29.0 MVA
47.2 %
KM
TGA
_O
_1
-32.7 ..1.1 Mvar32.8 M..35.3 %
32.8 MW-1.1 Mvar32.8 MVA
35.3 %
Papamoa ..0.00 kV0.00 p.u.
NIPS/EDG110
106.49..0.97 p.u.
OWH/OWH110106.39..0.97 p.u.
TMI/TMI3332.93 kV1.00 p.u.
TMI/TMI110
104.53 kV0.95 p.u.
TRK/TRK220220.40..1.00 p.u.
TRK/TRK110109.43..0.99 p.u.
KMO/KMO110
106.39 kV0.97 p.u.
MTM/MTM3332.46 kV0.98 p.u.
MTM/MTM110106.14..0.96 p.u.
TGA/TGA3332.65 kV0.99 p.u.TGA/TGA110
106.20..0.97 p.u. D
IgSI
LEN
T
Part IV 2009 Grid Upgrade Plan: Bay of Plenty Interconnection Capacity Upgrade Investment Proposal © Transpower New Zealand Limited 2009. All rights reserved 21
Attachment A – Technical Report
B.6 2020 region Forecast: Overload OKE Te Matai section
2020 region
PowerFactory 13.2.333
Project:
Graphic: BOP Transmission
Date: 3/11/2009
Annex:
6.4+6.8km
11.5+6.8km
14km
54km21km
14km
26km
12km
8km
200/246/262 MVA200/238/238 MVA200/248/264 MVA
39kmsimplex zebra 49C
610/752
KM
O-P
apam
oa 2
2kmsimplex wolf gz 80C
505/552Amp
2kmsimplex wolf gz 80C
505/552Amp
4kmsimplex wolf gz 80C
505/552Amp
TMI Cap
1
KM
O-P
apam
oa 1
30.8 MW-16.5 ..35.0 M..48.5 %
-30.5 MW16.9 Mvar34.8 MVA
48.5 %
LFT_
TRK
_2
15.5 MW-1.7 Mvar15.6 MVA
20.0 %
LFT-
TRK
-1
17.0 MW-1.5 Mvar17.1 MVA
24.3 %
PIE
_TG
A_2
33.5 MW2.6 Mvar33.7 MVA
34.3 %
-33.5 ..-2.6 Mvar33.6 M..34.3 %
TGA-CAPS-C11
0.0 MW-21.7 ..21.7 M..
1
MTM-CAPS-C1
0.0 MW-21.6 ..21.6 M..
1
myE
DG
KA
W 2
-17.7 MW5.0 Mvar18.4 MVA
33.0 %
myE
DG
KA
W 1
-17.9 MW5.0 Mvar18.6 MVA
33.4 %
ED
G_O
WH
_2
-22.5 ..13.1 M..26.0 M..40.1 %
23.0 MW-13.3 Mvar26.6 MVA
40.1 %
TRK-TF-T1
-129.2 MW13.4 Mvar129.9 MVA
66.2 %
129.5 ..-7.9 Mvar129.7 ..66.2 %
7
TRK-TF-T2
-190.7 MW-123.1 Mvar227.0 MVA
113.9 %
191.3 ..133.2 ..233.1 ..113.9 %
3
OKE_OWH_1
-4.0
MW
17.1
M..
17.5
M..
26.1
%
4.0 MW-17.3 Mvar17.8 MVA
26.1 %
OK
E_T
RK
_1
-71.5 ..-21.4 ..74.7 M..99.8 %
73.4 MW24.9 Mvar77.5 MVA
99.8 %
OK
E-T
MI-1
-73.1 ..0.2 Mvar73.1 M..101.1 %
75.5 MW4.4 Mvar75.6 MVA101.1 %
KM
O_P
IE_2
58.6 MW1.2 Mvar58.6 MVA
59.7 %
MTM
-PIE
-2
25.0 MW-1.6 Mvar25.0 MVA
34.7 %
-24.9 ..1.5 Mvar24.9 M..34.7 %
Pap
amoa
-TM
I
41.3 MW-12.6 Mvar43.1 MVA
59.7 %
-40.8 ..13.2 M..42.9 M..59.7 %
KM
O_T
RK
_2
-123.3..-22.5 ..125.4 ..93.7 %
127.2 MW44.6 Mvar134.8 MVA
93.7 %
KM
O_T
RK
_1
KM
O_M
TM_1
-37.6 ..2.3 Mvar37.7 M..52.5 %
37.9 MW-2.1 Mvar37.9 MVA
52.5 %
KM
O_T
GA
_1
-43.7 ..-2.0 Mvar43.7 M..44.7 %
43.8 MW2.1 Mvar43.9 MVA
44.7 %
Papamoa ..102.54..0.93 p.u.
NIPS/EDG110
104.63..0.95 p.u.
OWH/OWH110105.56..0.96 p.u.
TMI/TMI3333.24 kV1.01 p.u.
TMI/TMI110
102.82 kV0.93 p.u.
TRK/TRK220215.64..0.98 p.u.
TRK/TRK110110.79..1.01 p.u.
KMO/KMO110
102.75 kV0.93 p.u.
MTM/MTM3333.19 kV1.01 p.u.
MTM/MTM110102.21..0.93 p.u.
TGA/TGA3333.42 kV1.01 p.u.TGA/TGA110
102.45..0.93 p.u. D
IgSI
LEN
T
Part IV 2009 Grid Upgrade Plan: Bay of Plenty Interconnection Capacity Upgrade Investment Proposal © Transpower New Zealand Limited 2009. All rights reserved 22
Attachment A – Technical Report
B.7 2022 Region Peak: Continuous overload of Tarukenga T2
2022 region N-0
PowerFactory 13.2.333
Project:
Graphic: BOP Transmission
Date: 3/16/2009
Annex:
2kmsimplex wolf gz 80C
505/552Amp
2kmsimplex wolf gz 80C
505/552Amp
4kmsimplex wolf gz 80C
505/552Amp 6.4+6.8km
11.5+6.8km
14km
54km21km
14km
26km
12km
8km
200/246/262 MVA200/238/238 MVA200/248/264 MVA
39kmsimplex zebra 49C
610/752
KMO
-Pap
amoa
2
TMI Cap
1
KMO
-Pap
amoa
1
14.8 MW-14.4 ..20.7 M..28.1 %
-14.7 MW14.2 Mvar20.4 MVA
28.1 %
LFT_
TRK_
2
11.2 MW-5.2 Mvar12.4 MVA
16.1 %
LFT-
TRK-
1
12.4 MW-5.4 Mvar13.5 MVA
19.4 %
PIE_
TGA_
2
34.0 MW2.2 Mvar34.1 MVA
33.9 %
-34.0 ..-2.2 Mvar34.0 M..33.9 %
TGA-CAPS-C11
-0.0 MW-22.8 ..22.8 M..
1
MTM-CAPS-C1
0.0 MW-22.6 ..22.6 M..
1
myE
DG
KAW
2
-16.4 MW3.9 Mvar16.9 MVA
30.2 %
myE
DG
KAW
1
-16.6 MW3.9 Mvar17.1 MVA
30.6 %
EDG
_OW
H_2
-19.8 ..10.7 M..22.5 M..34.8 %
20.3 MW-11.2 Mvar23.2 MVA
34.8 %
TRK-TF-T1
-129.3 MW-9.9 Mvar
129.7 MVA66.1 %
129.6 ..15.5 M..130.5 ..66.1 %
6
TRK-TF-T2
-185.3 MW-79.9 Mvar201.8 MVA
101.3 %
185.8 ..88.2 M..205.7 ..101.3 %
4
OKE_OWH_1
-1.0
MW
14.8
M..
14.8
M..
22.1
%
1.0 MW-15.1 Mvar15.1 MVA
22.1 %
OKE
_TR
K_1
-47.7 ..-15.3 ..50.1 M..66.9 %
48.6 MW16.5 Mvar51.3 MVA
66.9 %
OKE
-TM
I-1
-47.7 ..0.8 Mvar47.7 M..65.0 %
48.7 MW0.6 Mvar48.7 MVA
65.0 %
KMO
_PIE
_2
64.5 MW3.1 Mvar64.5 MVA
64.1 %
MTM
-PIE
-2
30.3 MW0.7 Mvar30.4 MVA
41.1 %
-30.2 ..-0.7 Mvar30.2 M..41.1 %
Papa
moa
-TM
I
14.9 MW-14.6 Mvar20.9 MVA
28.5 %
-14.8 ..14.4 M..20.7 M..28.5 %
KMO
_TR
K_2
-75.5 ..-12.4 ..76.5 M..55.7 %
76.9 MW19.4 Mvar79.3 MVA
55.7 %
KMO
_TR
K_1
-75.3 ..-12.4 ..76.3 M..55.6 %
76.7 MW19.3 Mvar79.1 MVA
55.6 %KM
O_M
TM_1
-44.6 ..-0.3 Mvar44.6 M..60.6 %
44.9 MW0.6 Mvar44.9 MVA
60.6 %
KMO
_TG
A_1
-46.3 ..-2.4 Mvar46.4 M..46.2 %
46.5 MW2.6 Mvar46.5 MVA
46.2 %
Papamoa ..104.81..0.95 p.u.
NIPS/EDG110
105.15..0.96 p.u.
OWH/OWH110105.80..0.96 p.u.
TMI/TMI3332.77 kV0.99 p.u.
TMI/TMI110
104.42 kV0.95 p.u.
TRK/TRK220217.23..0.99 p.u.
TRK/TRK110109.54..1.00 p.u.
KMO/KMO110
105.35 kV0.96 p.u.
MTM/MTM3332.36 kV0.98 p.u.
MTM/MTM110104.62..0.95 p.u.
TGA/TGA3332.60 kV0.99 p.u.TGA/TGA110
105.02..0.95 p.u. D
IgSI
LEN
T
Part IV 2009 Grid Upgrade Plan: Bay of Plenty Interconnection Capacity Upgrade Investment Proposal © Transpower New Zealand Limited 2009. All rights reserved 23
Attachment A – Technical Report
Grid Upgrade Plan: Bay of Plenty Interconnection Capacity Upgrade Investment Proposal © Transpower New Zealand Limited 2009. All rights reserved 24
B.8 2026 Region Forecast: Overload Kaitimako–Tarukenga 1 or 2
2026 regional
PowerFactory 13.2.333
Project:
Graphic: BOP Transmission
Date: 2/12/2009
Annex:
6.4+6.8km
11.5+6.8km
14km
54km21km
14km
26km
12km
8km
200/246/262 MVA200/238/238 MVA200/248/264 MVA
39kmsimplex zebra 49C
610/752
KMO
-Pap
amoa
2
2kmsimplex wolf gz 80C
505/552Amp
2kmsimplex wolf gz 80C
505/552Amp
4kmsimplex wolf gz 80C
505/552Amp
TMI Cap
0.0 MW-35.3 ..35.3 M..0.197 kA
4
KMO
-Pap
amoa
1
25.9 MW-0.9 Mvar25.9 M..0.145 kA35.7 %
-25.7 MW0.8 Mvar25.7 MVA0.145 kA35.7 %
PIE_
TGA_
2
38.7 MW4.9 Mvar39.0 MVA0.220 kA39.8 %
-38.6 ..-4.9 Mvar38.9 M..0.220 kA39.8 %
TGA-CAPS-C11
0.0 MW-21.6 ..21.6 M..0.122 kA
1
MTM-CAPS-C1
0.0 MW-21.5 ..21.5 M..0.122 kA
1
myE
DG
KAW
2
-19.6 MW3.9 Mvar20.0 MVA0.110 kA35.8 %
myE
DG
KAW
1
-19.8 MW3.9 Mvar20.2 MVA0.111 kA36.2 %
EDG
_OW
H_2
-25.4 ..11.5 M..27.9 M..0.154 kA43.0 %26.1 MW
-11.4 Mvar28.5 MVA0.157 kA43.0 %
TRK-TF-T1
-138.8 MW-8.7 Mvar
139.0 MVA0.735 kA71.0 %
139.1 ..15.0 M..139.9 ..0.373 kA71.0 %
6
TRK-TF-T2
-198.6 MW-77.7 Mvar213.2 MVA1.127 kA107.4 %
199.1 ..86.8 M..217.2 ..0.579 kA107.4 %
4
OKE_OWH_1
-5.7
MW
15.9
M..
16.9
M..
0.09
2 kA
25.3
%
5.7 MW-16.2 Mvar17.2 MVA0.095 kA25.3 %
OKE
_TR
K_1
-78.5 ..-8.0 Mvar78.9 M..0.432 kA106.3 %
80.7 MW12.1 Mvar81.6 MVA0.431 kA106.3 %
OKE
-TM
I-1
-81.2 MW13.9 Mvar82.4 MVA0.462 kA113.9 %
84.2 MW-7.9 Mvar84.6 M..0.463 kA113.9 %
KMO
_PIE
_2
62.0 MW2.5 Mvar62.1 MVA0.349 kA63.3 %
MTM
-PIE
-2
23.3 MW-2.6 Mvar23.4 MVA0.132 kA32.5 %
-23.2 ..2.5 Mvar23.3 M..0.132 kA32.5 %
Papa
moa
-TM
I
46.6 MW-28.1 Mvar54.4 MVA0.305 kA75.2 %
-45.9 ..29.2 M..54.4 M..0.304 kA75.2 %
KMO
_TR
K_2
KMO
_TR
K_1
-134.6..-8.8 Mvar134.9 ..0.759 kA100.9 %
139.1 MW34.8 Mvar143.4 MVA0.758 kA100.9 %
KM
O_M
TM_1
-36.3 ..3.2 Mvar36.5 M..0.206 kA50.8 %
36.5 MW-3.1 Mvar36.7 MVA0.206 kA50.8 %
KMO
_TG
Part IV 2009
A_1
-48.1 ..-3.8 Mvar48.3 M..0.273 kA49.4 %
48.3 MW4.1 Mvar48.4 MVA0.273 kA49.4 %
Papamoa ..103.34..0.94 p.u.
NIPS/EDG110
104.56..0.95 p.u.
OWH/OWH110104.83..0.95 p.u.
TMI/TMI3332.55 kV0.99 p.u.
TMI/TMI110
102.94..0.94 p.u.
TRK/TRK220216.61..0.98 p.u.
TRK/TRK110109.24..0.99 p.u.
KMO/KMO110
102.58 kV0.93 p.u.
MTM/MTM3332.48 kV0.98 p.u.
MTM/MTM110102.09..0.93 p.u.
TGA/TGA3332.43 kV0.98 p.u.TGA/TGA110
102.22..0.93 p.u. D
IgSI
LEN
T
Attachment A – Technical Report
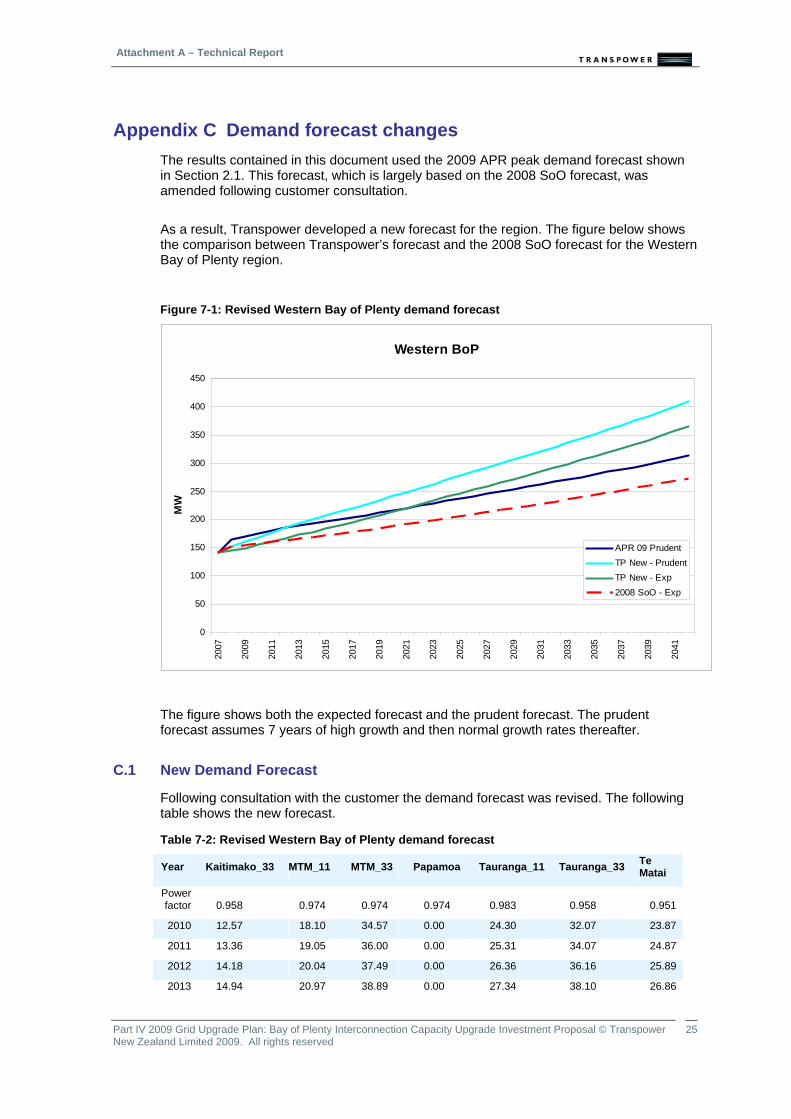
Appendix C Demand forecast changes The results contained in this document used the 2009 APR peak demand forecast shown in Section 2.1. This forecast, which is largely based on the 2008 SoO forecast, was amended following customer consultation.
As a result, Transpower developed a new forecast for the region. The figure below shows the comparison between Transpower’s forecast and the 2008 SoO forecast for the Western Bay of Plenty region.
Figure 7-1: Revised Western Bay of Plenty demand forecast
Western BoP
0
50
100
150
200
250
300
350
400
450
2007
2009
2011
2013
2015
2017
2019
2021
2023
2025
2027
2029
2031
2033
2035
2037
2039
2041
MW
APR 09 PrudentTP New - PrudentTP New - Exp2008 SoO - Exp
The figure shows both the expected forecast and the prudent forecast. The prudent forecast assumes 7 years of high growth and then normal growth rates thereafter.
C.1 New Demand Forecast
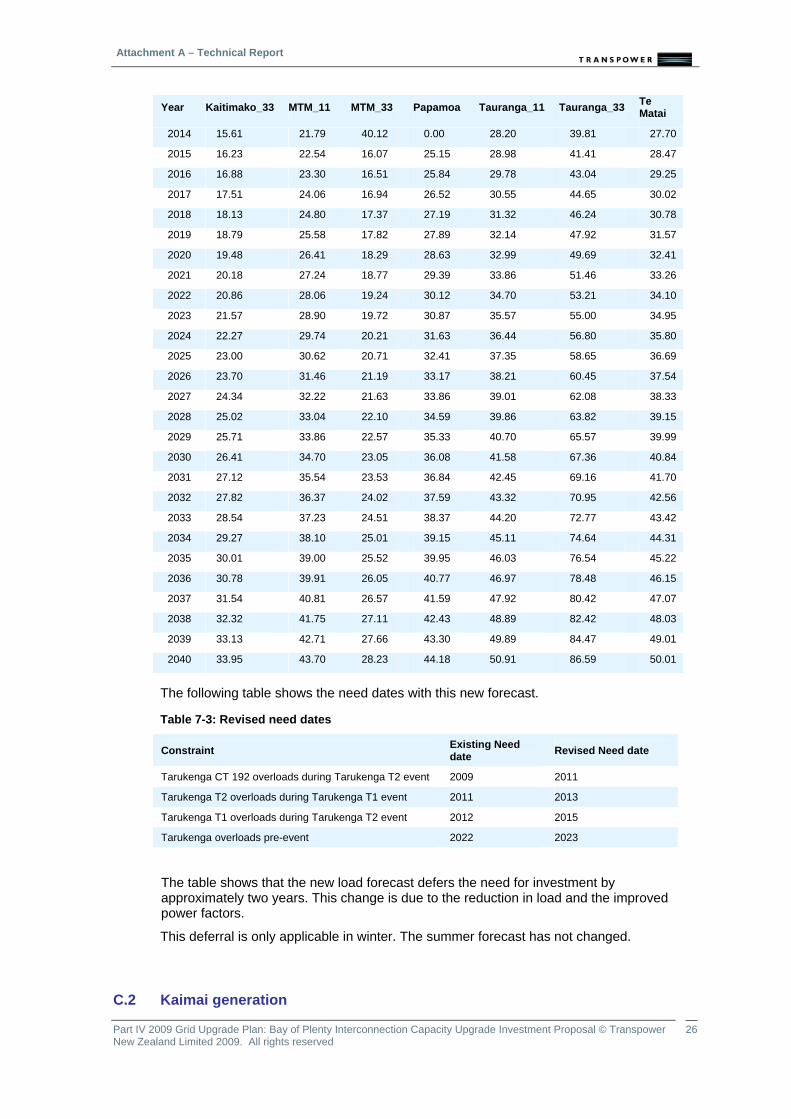
Following consultation with the customer the demand forecast was revised. The following table shows the new forecast.
Table 7-2: Revised Western Bay of Plenty demand forecast
Year Kaitimako_33 MTM_11 MTM_33 Papamoa Tauranga_11 Tauranga_33 Te Matai
Power factor 0.958 0.974 0.974 0.974 0.983 0.958 0.951
2010 12.57 18.10 34.57 0.00 24.30 32.07 23.87
2011 13.36 19.05 36.00 0.00 25.31 34.07 24.87
2012 14.18 20.04 37.49 0.00 26.36 36.16 25.89
2013 14.94 20.97 38.89 0.00 27.34 38.10 26.86
Part IV 2009 Grid Upgrade Plan: Bay of Plenty Interconnection Capacity Upgrade Investment Proposal © Transpower 25New Zealand Limited 2009. All rights reserved
Attachment A – Technical Report
Part IV 2009 Grid Upgrade Plan: Bay of Plenty Interconnection Capacity Upgrade Investment Proposal © Transpower 26
Year Kaitimako_33 MTM_11 MTM_33 Papamoa Tauranga_11 Tauranga_33 Te Matai
2014 15.61 21.79 40.12 0.00 28.20 39.81 27.70
2015 16.23 22.54 16.07 25.15 28.98 41.41 28.47
2016 16.88 23.30 16.51 25.84 29.78 43.04 29.25
2017 17.51 24.06 16.94 26.52 30.55 44.65 30.02
2018 18.13 24.80 17.37 27.19 31.32 46.24 30.78
2019 18.79 25.58 17.82 27.89 32.14 47.92 31.57
2020 19.48 26.41 18.29 28.63 32.99 49.69 32.41
2021 20.18 27.24 18.77 29.39 33.86 51.46 33.26
2022 20.86 28.06 19.24 30.12 34.70 53.21 34.10
2023 21.57 28.90 19.72 30.87 35.57 55.00 34.95
2024 22.27 29.74 20.21 31.63 36.44 56.80 35.80
2025 23.00 30.62 20.71 32.41 37.35 58.65 36.69
2026 23.70 31.46 21.19 33.17 38.21 60.45 37.54
2027 24.34 32.22 21.63 33.86 39.01 62.08 38.33
2028 25.02 33.04 22.10 34.59 39.86 63.82 39.15
2029 25.71 33.86 22.57 35.33 40.70 65.57 39.99
2030 26.41 34.70 23.05 36.08 41.58 67.36 40.84
2031 27.12 35.54 23.53 36.84 42.45 69.16 41.70
2032 27.82 36.37 24.02 37.59 43.32 70.95 42.56
2033 28.54 37.23 24.51 38.37 44.20 72.77 43.42
2034 29.27 38.10 25.01 39.15 45.11 74.64 44.31
2035 30.01 39.00 25.52 39.95 46.03 76.54 45.22
2036 30.78 39.91 26.05 40.77 46.97 78.48 46.15
2037 31.54 40.81 26.57 41.59 47.92 80.42 47.07
2038 32.32 41.75 27.11 42.43 48.89 82.42 48.03
2039 33.13 42.71 27.66 43.30 49.89 84.47 49.01
2040 33.95 43.70 28.23 44.18 50.91 86.59 50.01
The following table shows the need dates with this new forecast.
Table 7-3: Revised need dates
Constraint Existing Need date Revised Need date
Tarukenga CT 192 overloads during Tarukenga T2 event 2009 2011
Tarukenga T2 overloads during Tarukenga T1 event 2011 2013
Tarukenga T1 overloads during Tarukenga T2 event 2012 2015
Tarukenga overloads pre-event 2022 2023
The table shows that the new load forecast defers the need for investment by approximately two years. This change is due to the reduction in load and the improved power factors.
This deferral is only applicable in winter. The summer forecast has not changed.
C.2 Kaimai generation
New Zealand Limited 2009. All rights reserved
Attachment A – Technical Report
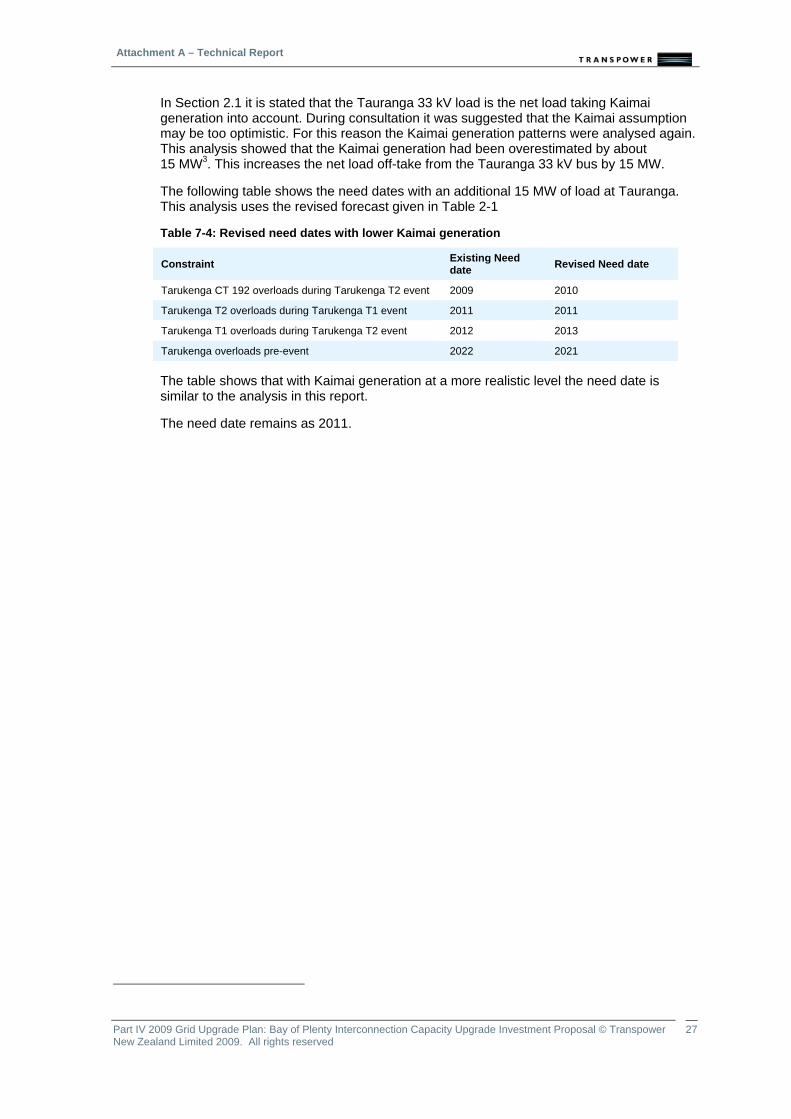
In Section 2.1 it is stated that the Tauranga 33 kV load is the net load taking Kaimai generation into account. During consultation it was suggested that the Kaimai assumption may be too optimistic. For this reason the Kaimai generation patterns were analysed again. This analysis showed that the Kaimai generation had been overestimated by about 15 MW3. This increases the net load off-take from the Tauranga 33 kV bus by 15 MW.
The following table shows the need dates with an additional 15 MW of load at Tauranga. This analysis uses the revised forecast given in Table 2-1
Table 7-4: Revised need dates with lower Kaimai generation
Constraint Existing Need date Revised Need date
Tarukenga CT 192 overloads during Tarukenga T2 event 2009 2010
Tarukenga T2 overloads during Tarukenga T1 event 2011 2011
Tarukenga T1 overloads during Tarukenga T2 event 2012 2013
Tarukenga overloads pre-event 2022 2021
The table shows that with Kaimai generation at a more realistic level the need date is similar to the analysis in this report.
The need date remains as 2011.
Part IV 2009 Grid Upgrade Plan: Bay of Plenty Interconnection Capacity Upgrade Investment Proposal © Transpower 27New Zealand Limited 2009. All rights reserved