Embed Size (px)
Citation preview
Fare Coordination/Integration Study + Business CaseSan Francisco Municipal Transportation Agency – Board of DirectorsOctober 5, 2021
Ph
oto
: Sea
mle
ss B
ay A
rea
Agenda
Key Findings & Recommendations
Fare Coordination & Integration Study Overview + Recap
Recommended Near-Term Actions
Appendix – Business Case: Available for download here.
2
1
2
4 Summary of Key Business Case Metrics
3
Fare Coordination & Integration Study Recap1
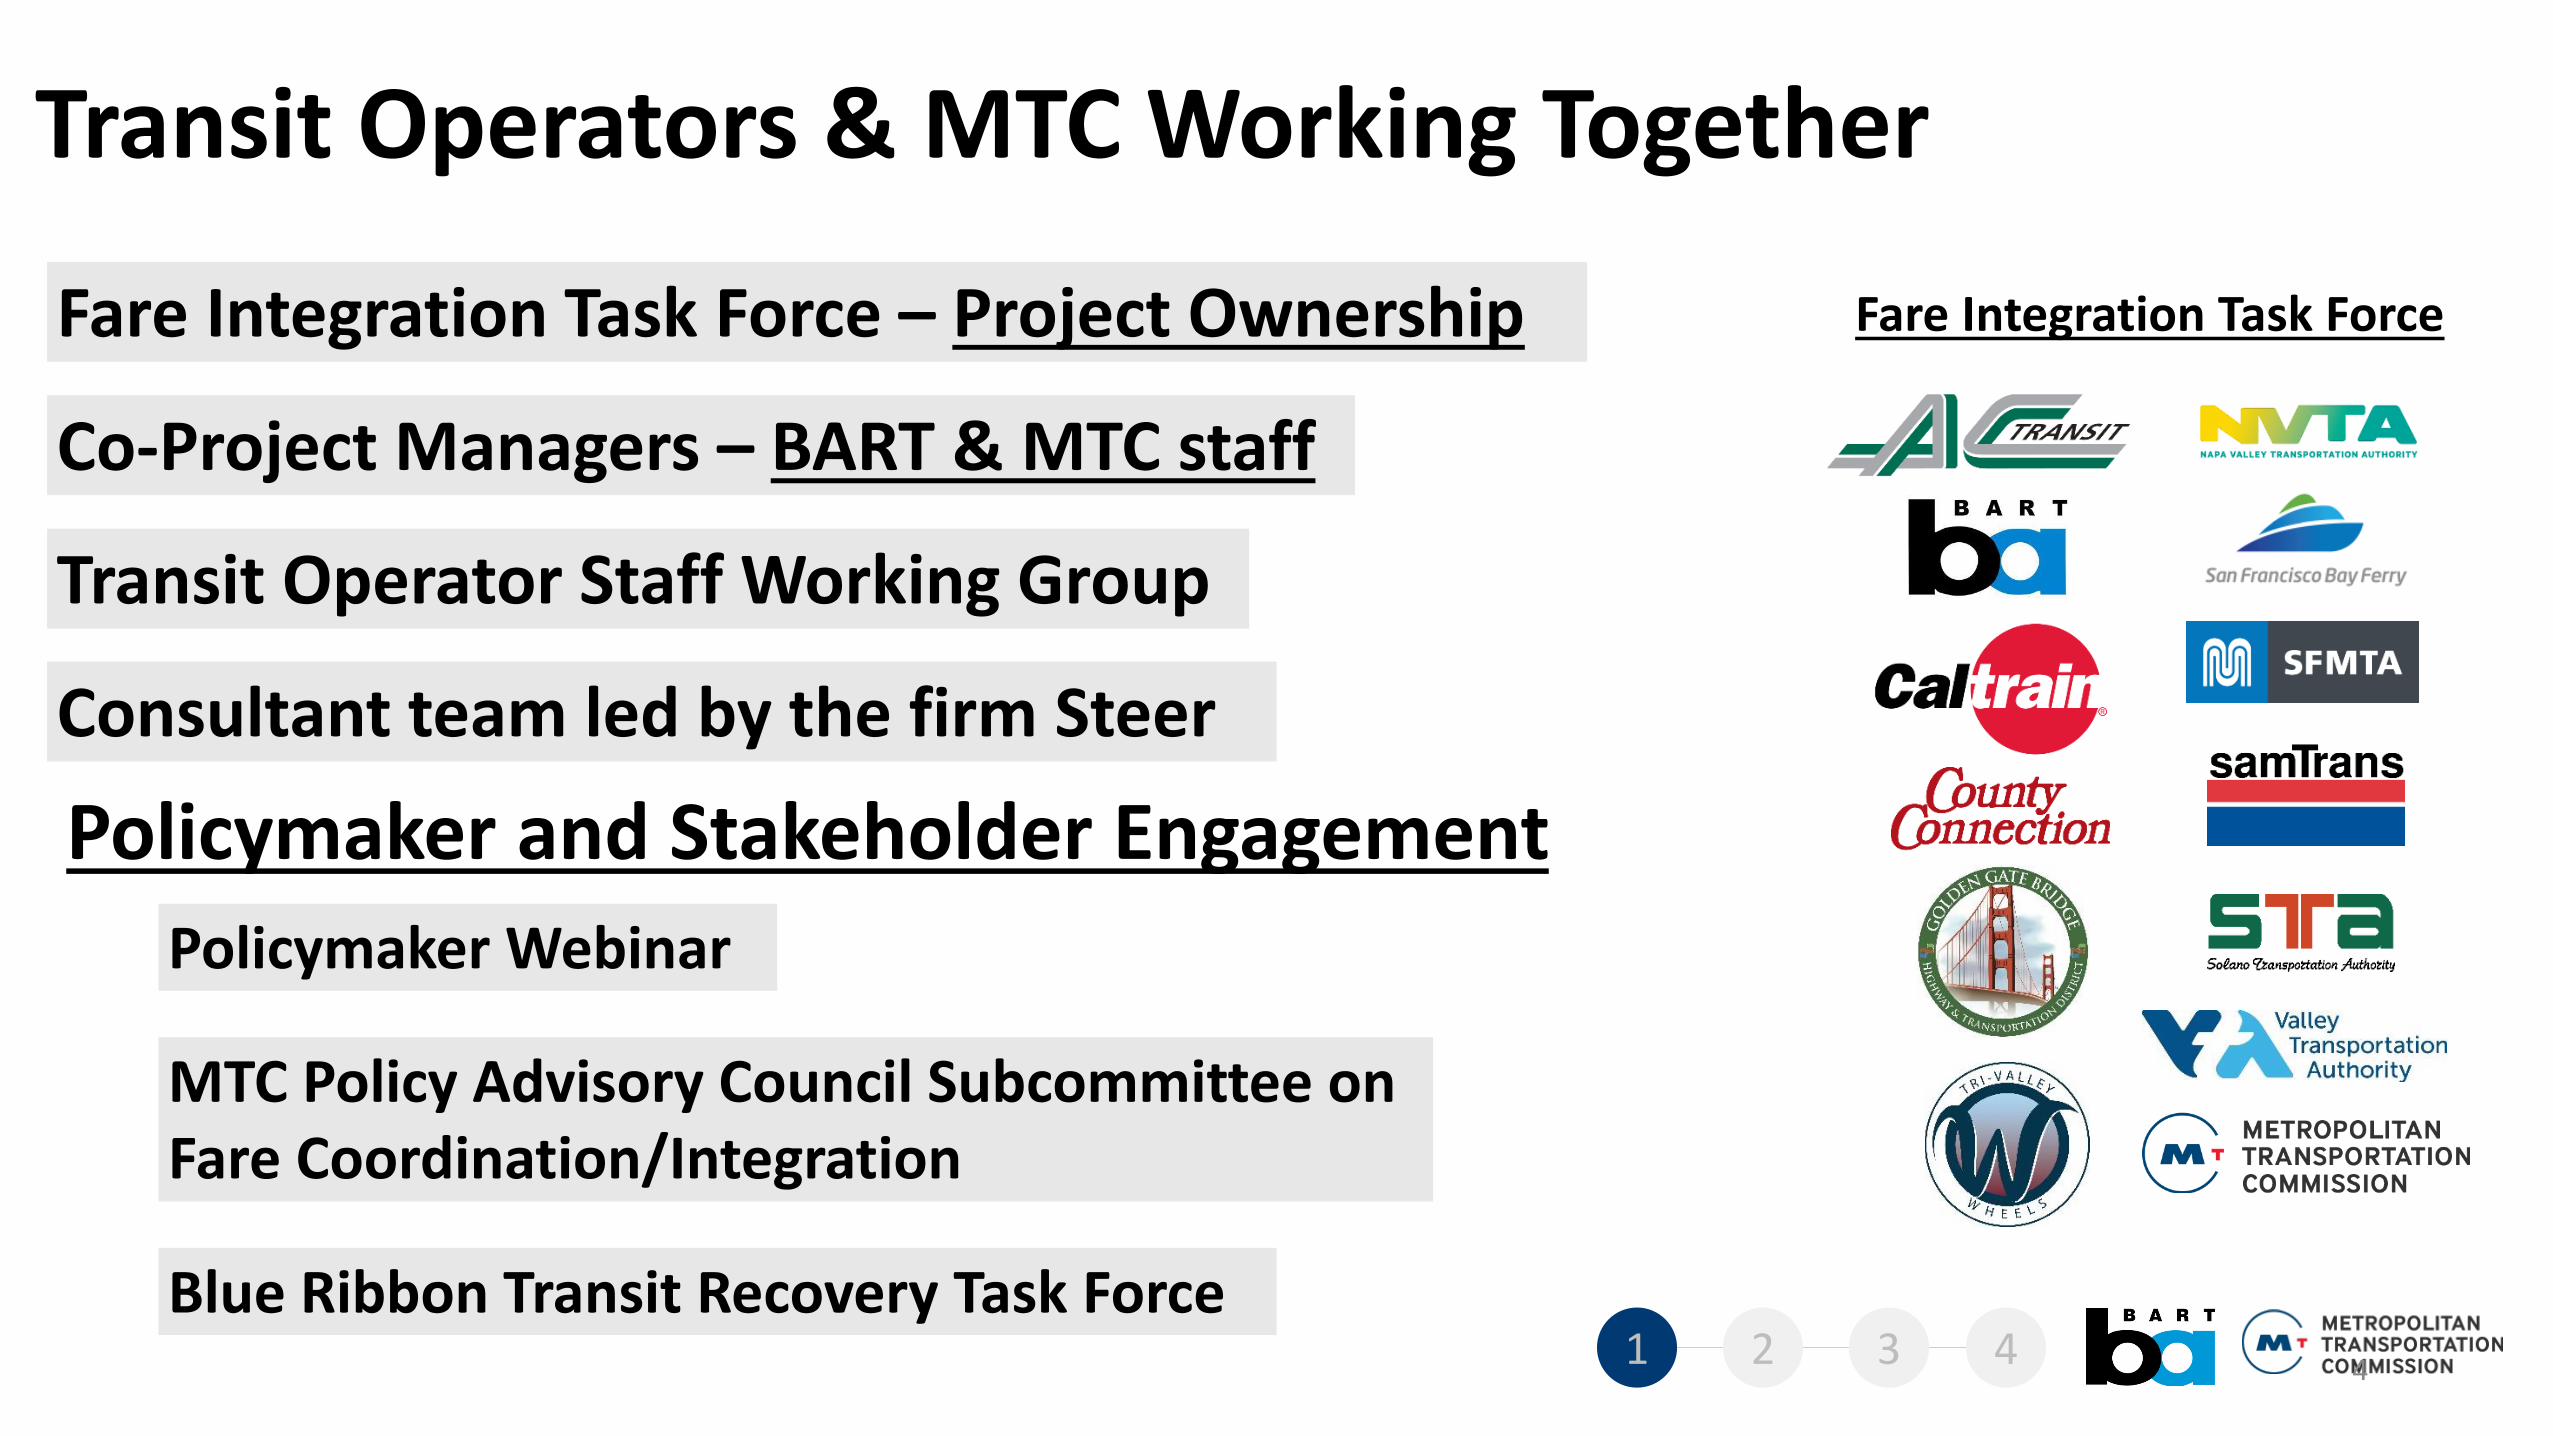
Transit Operators & MTC Working Together
Consultant team led by the firm Steer
Fare Integration Task Force – Project Ownership
Transit Operator Staff Working Group
Co-Project Managers – BART & MTC staff
Fare Integration Task Force
4
Policymaker Webinar
MTC Policy Advisory Council Subcommittee on Fare Coordination/Integration
Policymaker and Stakeholder Engagement
Blue Ribbon Transit Recovery Task Force1 2 3 4
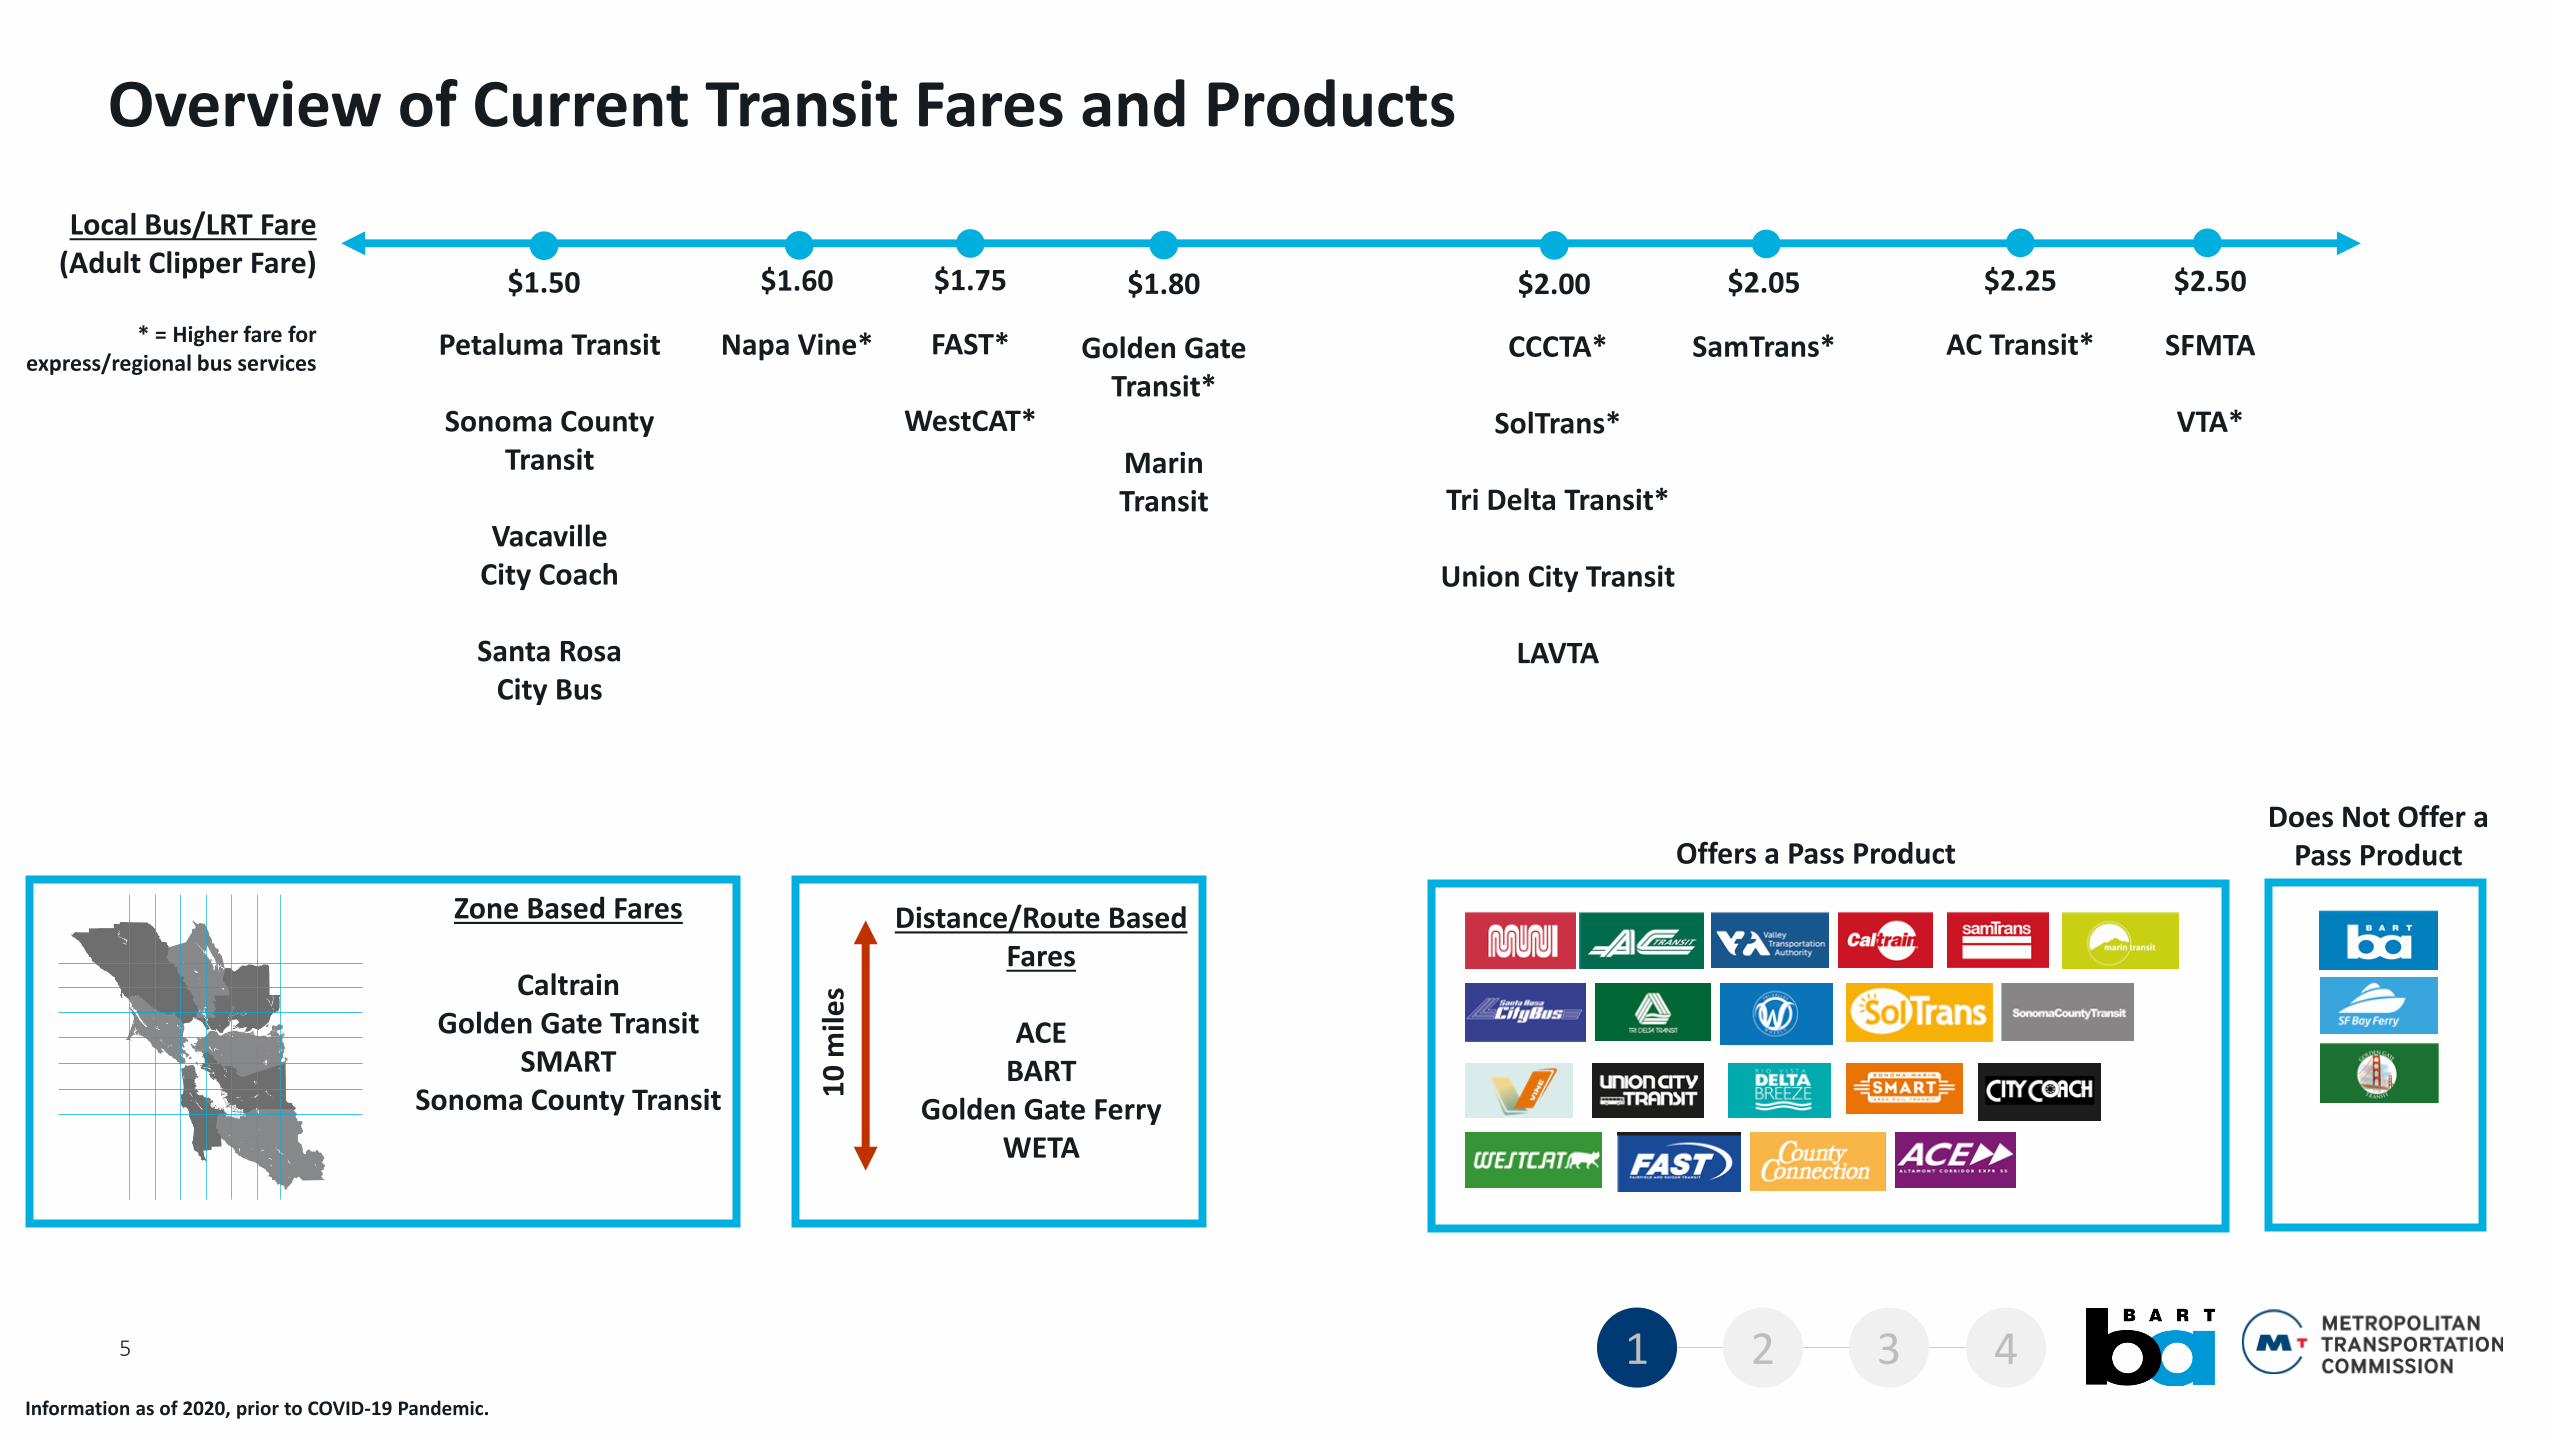
Overview of Current Transit Fares and Products
5
Local Bus/LRT Fare(Adult Clipper Fare)
* = Higher fare for express/regional bus services
$2.25$2.05
AC Transit*SamTrans*
$1.80
Golden Gate Transit*
Marin Transit
$2.50
SFMTA
VTA*
$2.00
CCCTA*
SolTrans*
Tri Delta Transit*
Union City Transit
LAVTA
$1.75
FAST*
WestCAT*
$1.50
Petaluma Transit
Sonoma County Transit
Vacaville City Coach
Santa Rosa City Bus
$1.60
Napa Vine*
Offers a Pass ProductDoes Not Offer a
Pass Product
Zone Based Fares
CaltrainGolden Gate Transit
SMARTSonoma County Transit 1
0 m
iles
Distance/Route Based Fares
ACEBART
Golden Gate FerryWETA
Information as of 2020, prior to COVID-19 Pandemic.
1 2 3 4
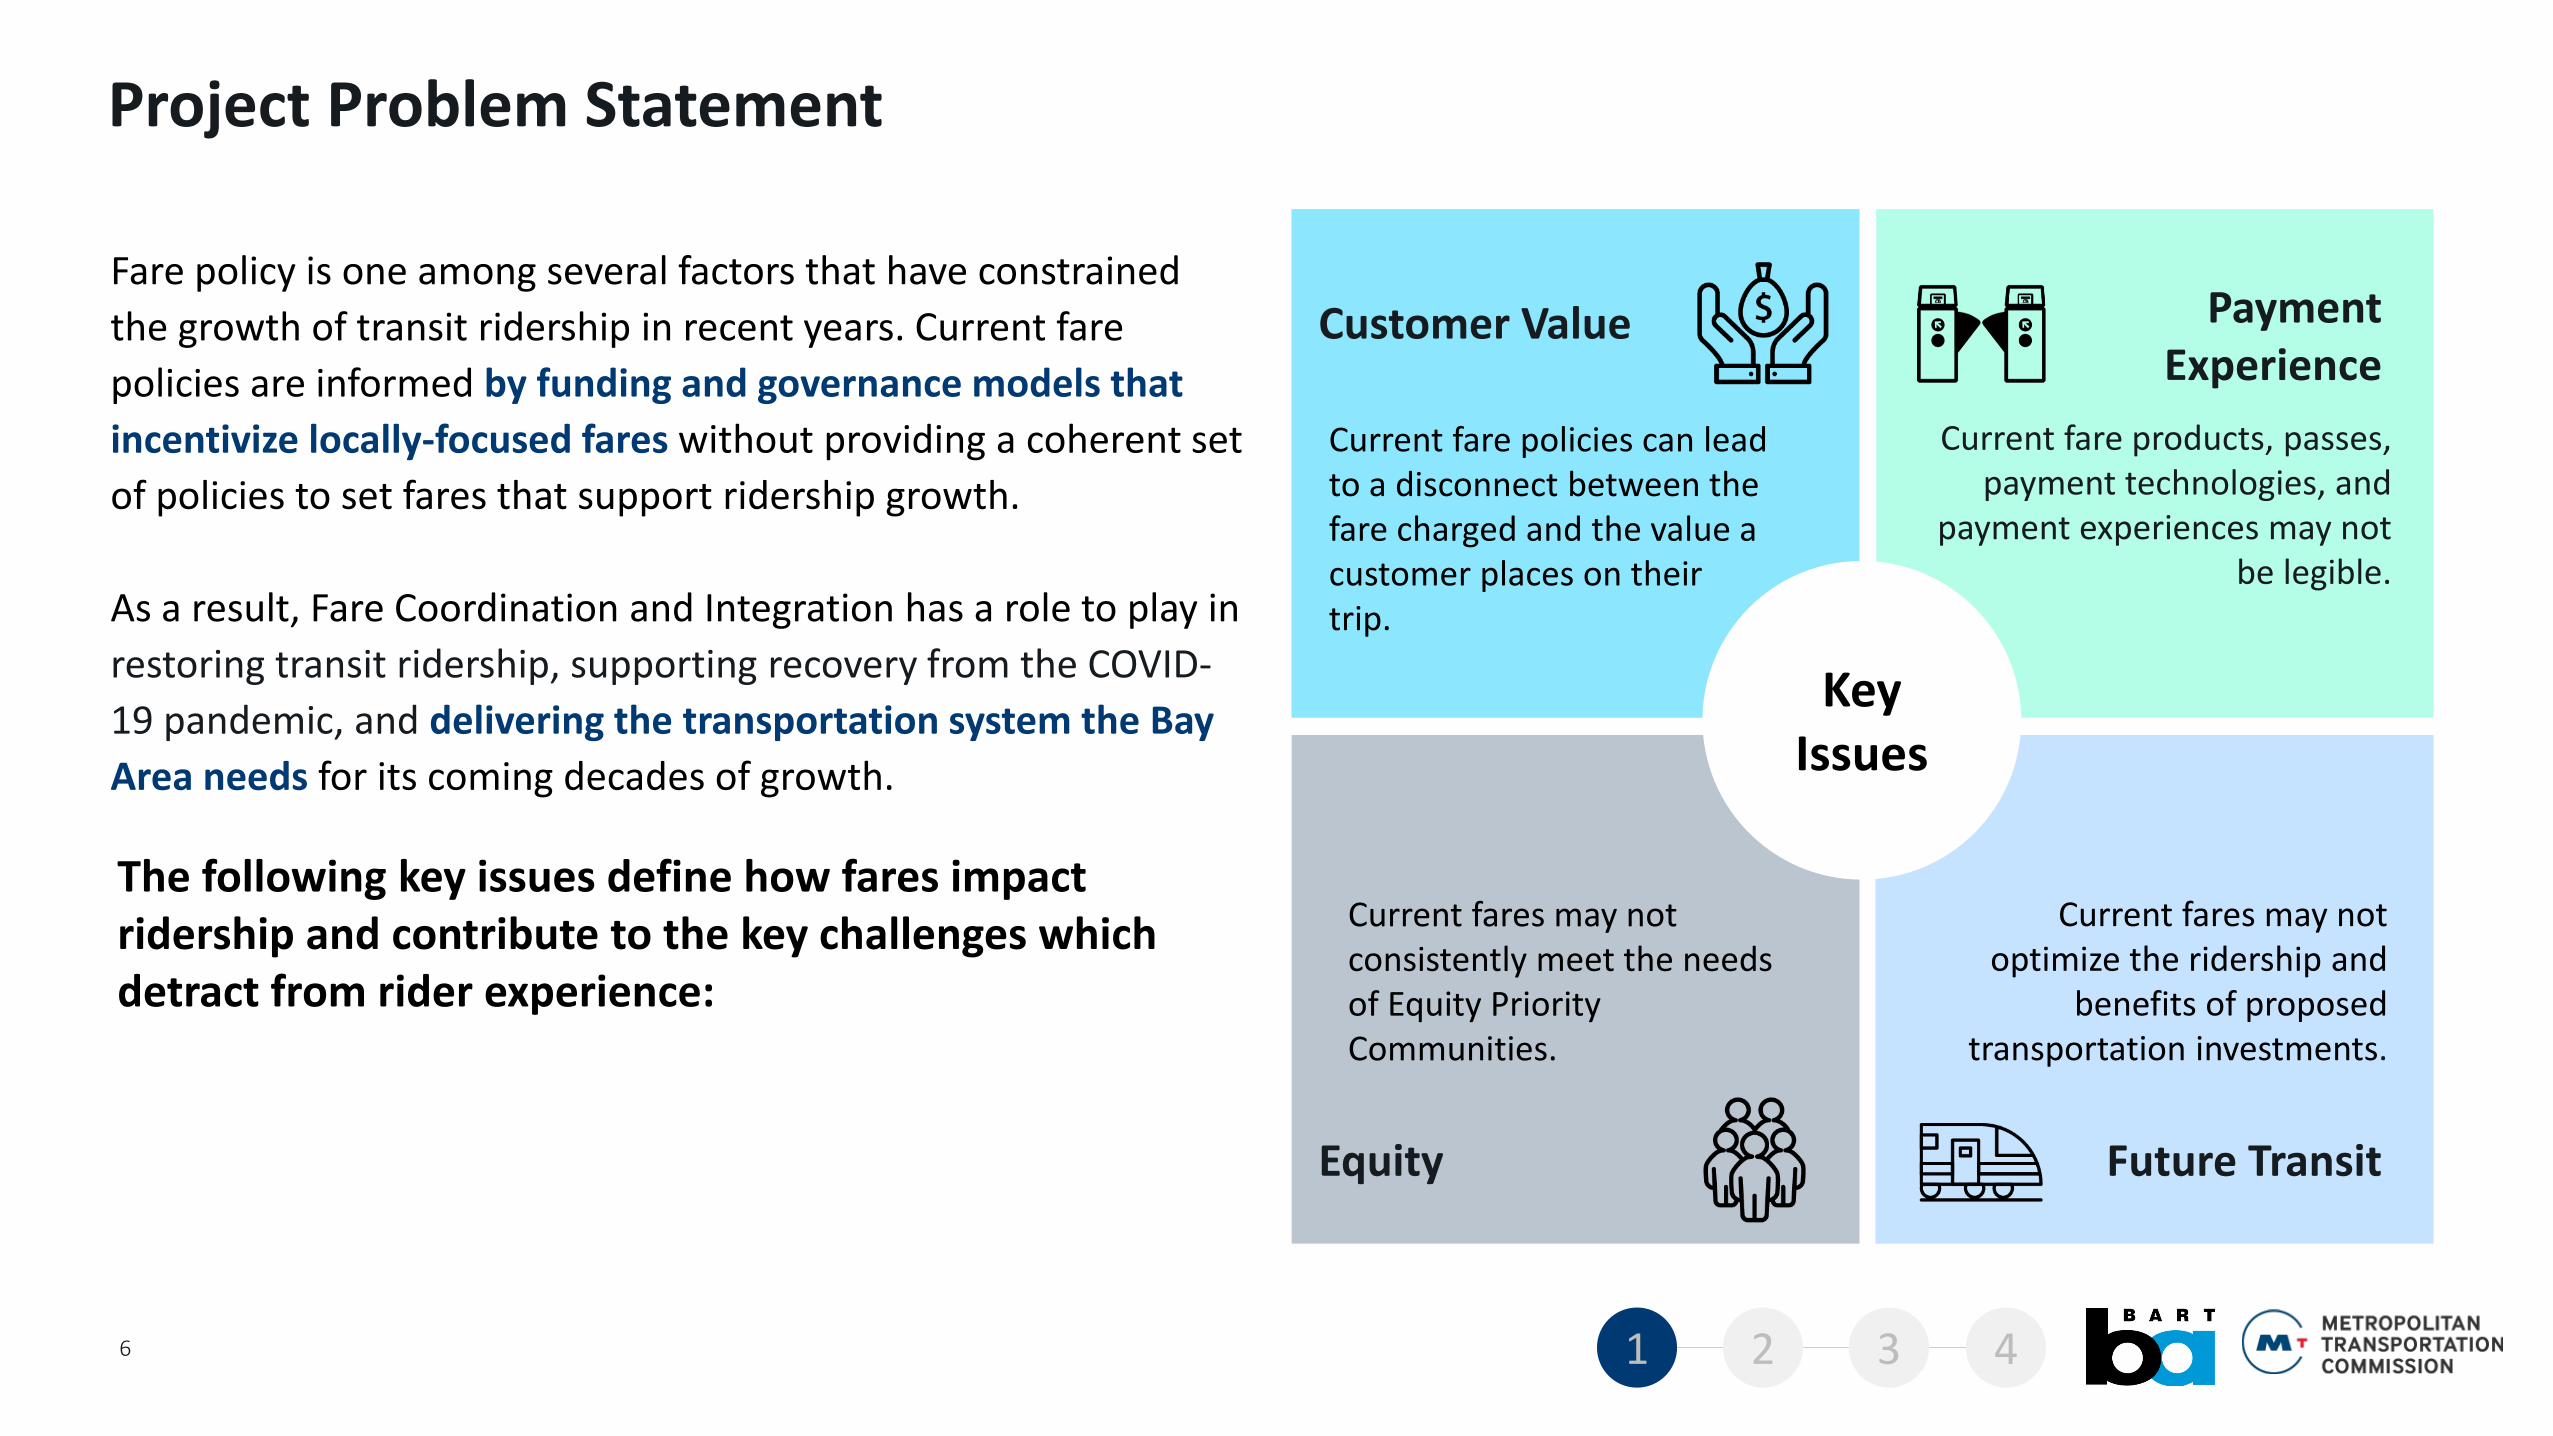
Key Issues
Customer Value
Equity Future Transit
PaymentExperience
Project Problem Statement
Current fare policies can lead to a disconnect between the fare charged and the value a customer places on their trip.
Current fare products, passes, payment technologies, and
payment experiences may not be legible.
Fare policy is one among several factors that have constrained
the growth of transit ridership in recent years. Current fare
policies are informed by funding and governance models that
incentivize locally-focused fares without providing a coherent set
of policies to set fares that support ridership growth.
As a result, Fare Coordination and Integration has a role to play in
restoring transit ridership, supporting recovery from the COVID-
19 pandemic, and delivering the transportation system the Bay
Area needs for its coming decades of growth.
The following key issues define how fares impact ridership and contribute to the key challenges which detract from rider experience:
Current fares may not consistently meet the needs of Equity Priority Communities.
Current fares may not optimize the ridership and
benefits of proposed transportation investments.
6 1 2 3 4
4.3.2.1.
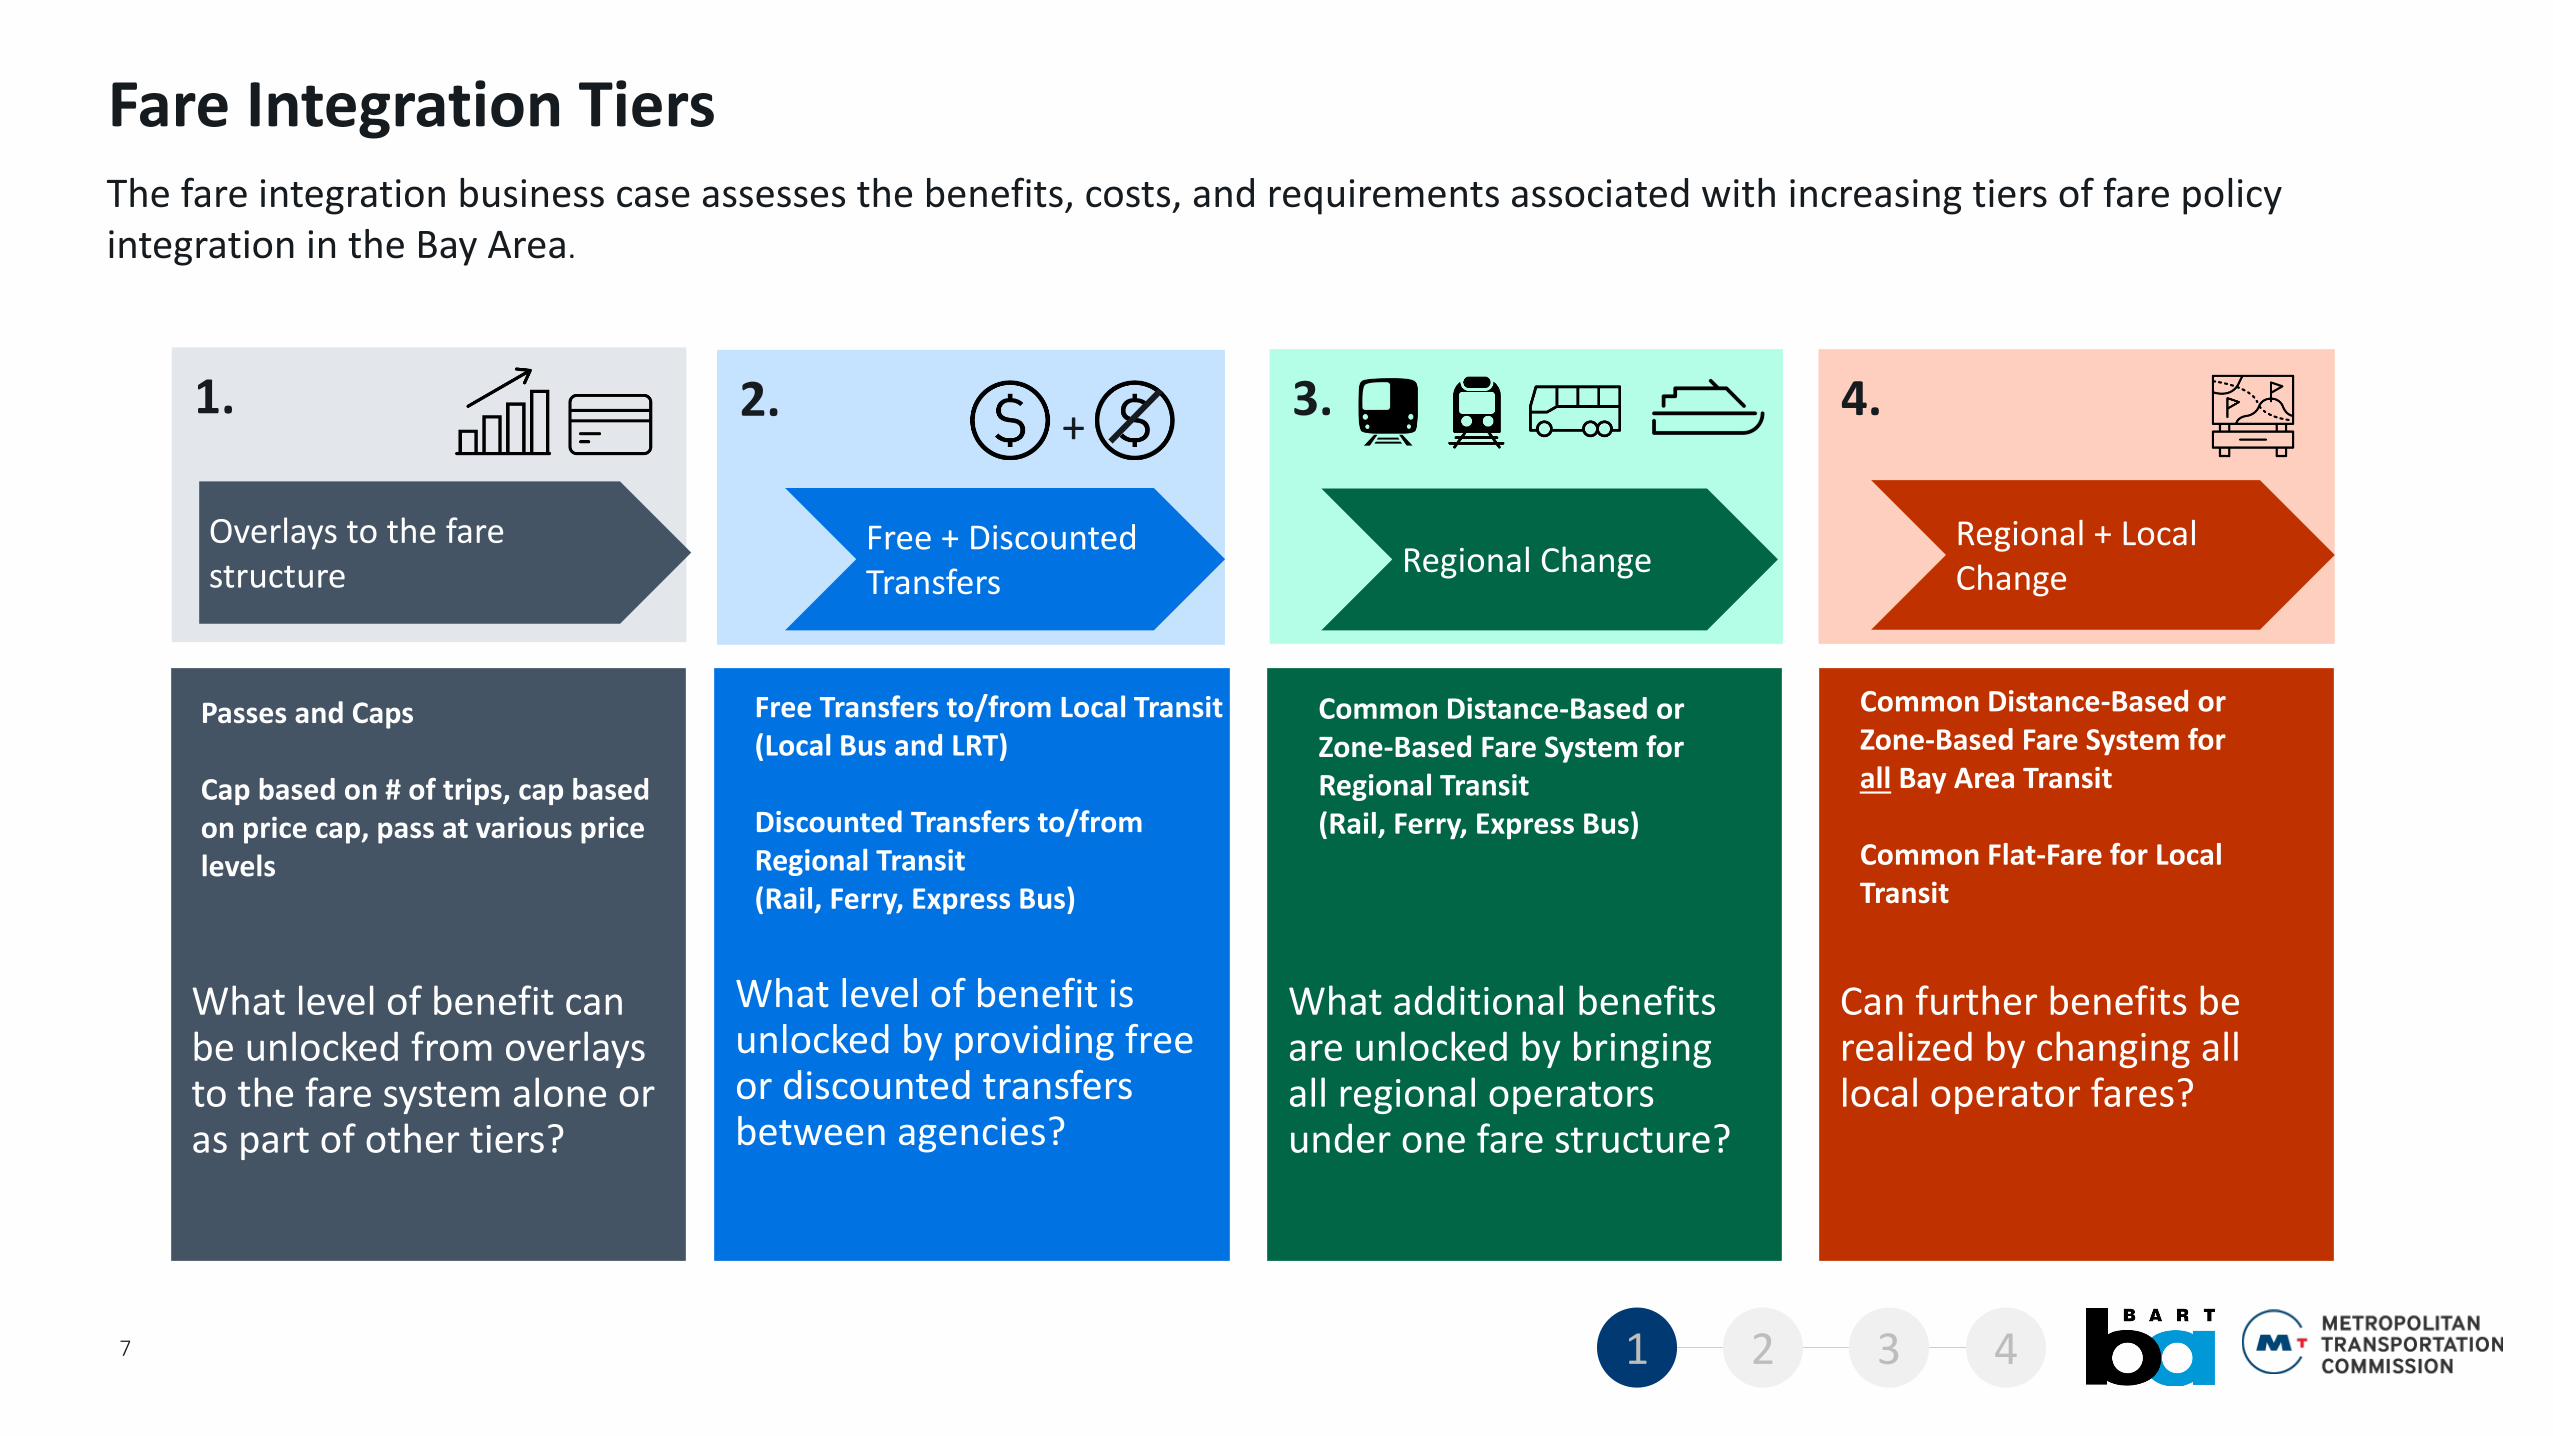
Fare Integration Tiers
Overlays to the fare structure
Free + Discounted Transfers
Regional ChangeRegional + Local Change
What level of benefit can be unlocked from overlays to the fare system alone or as part of other tiers?
What level of benefit is unlocked by providing free or discounted transfers between agencies?
What additional benefits are unlocked by bringing all regional operators under one fare structure?
Can further benefits be realized by changing all local operator fares?
Passes and Caps
Cap based on # of trips, cap based on price cap, pass at various price levels
Free Transfers to/from Local Transit (Local Bus and LRT)
Discounted Transfers to/from Regional Transit (Rail, Ferry, Express Bus)
Common Distance-Based or Zone-Based Fare System for Regional Transit(Rail, Ferry, Express Bus)
Common Distance-Based or Zone-Based Fare System for all Bay Area Transit
Common Flat-Fare for Local Transit
The fare integration business case assesses the benefits, costs, and requirements associated with increasing tiers of fare policy integration in the Bay Area.
7
+
1 2 3 4
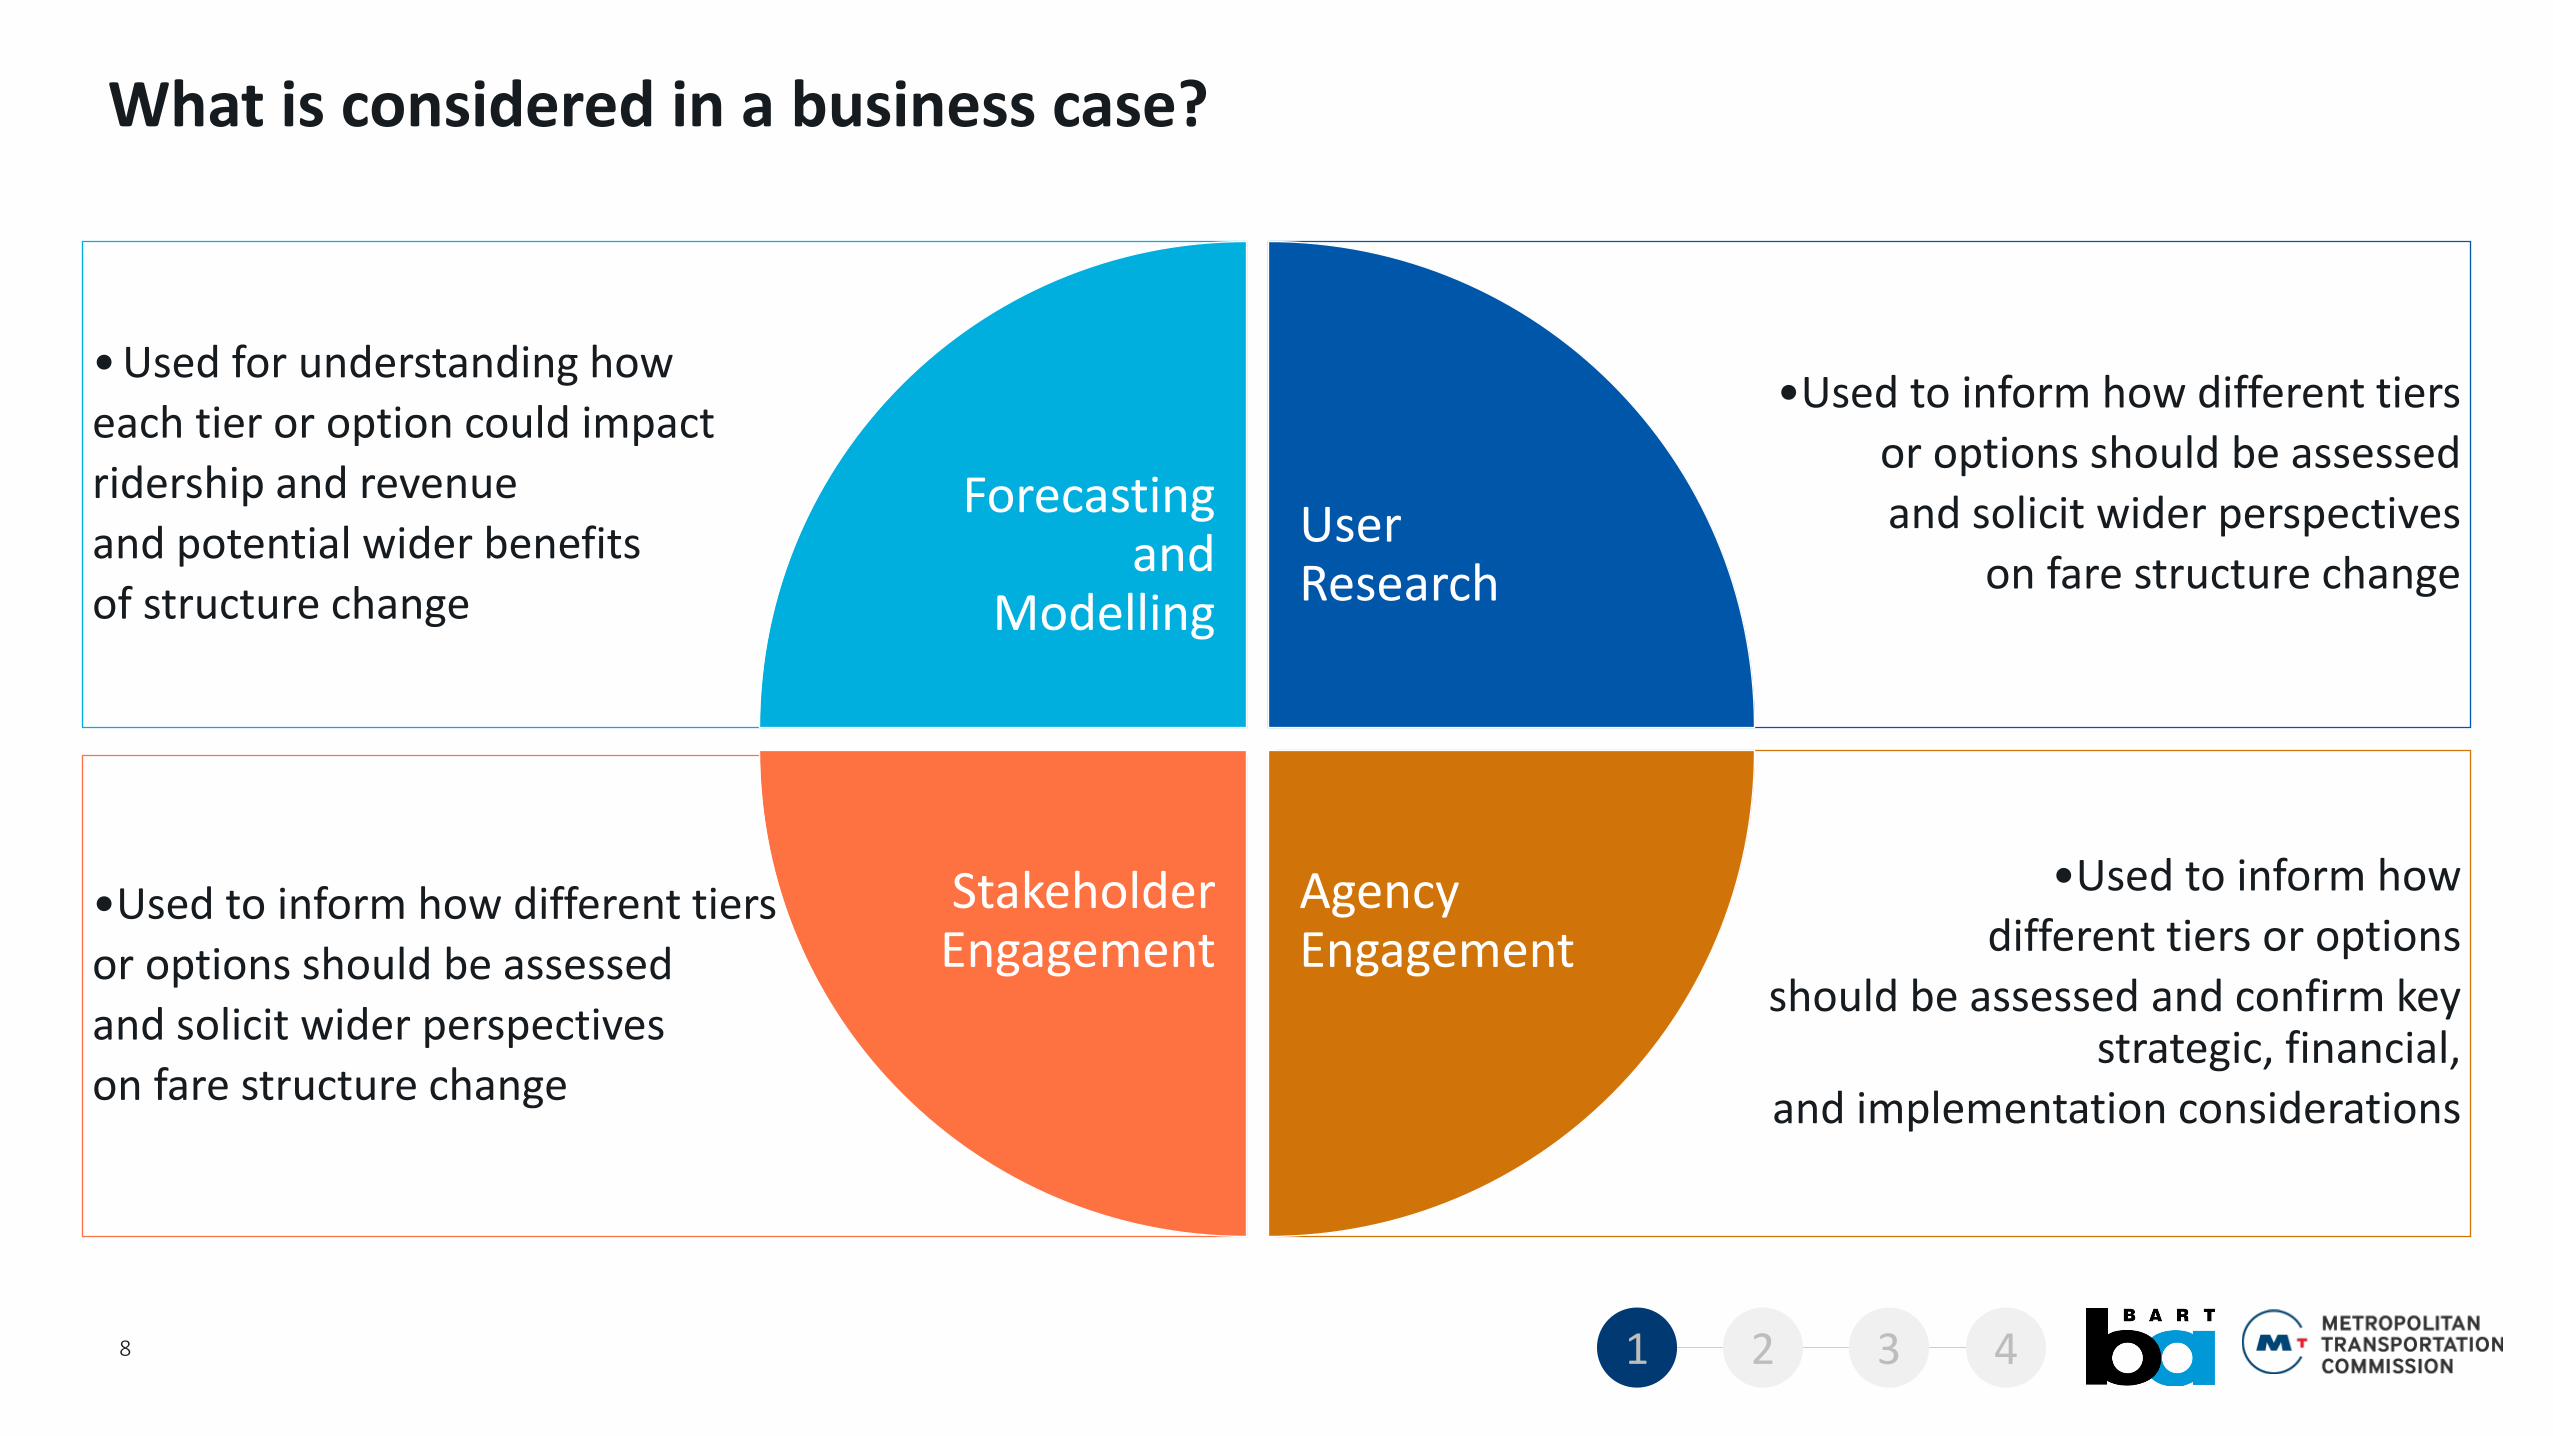
•Used to inform how
different tiers or options
should be assessed and confirm key strategic, financial,
and implementation considerations
•Used to inform how different tiers
or options should be assessed
and solicit wider perspectives
on fare structure change
•Used to inform how different tiers
or options should be assessed
and solicit wider perspectives
on fare structure change
• Used for understanding how
each tier or option could impact
ridership and revenue
and potential wider benefits
of structure change
What is considered in a business case?
Forecasting and
Modelling
User Research
Agency Engagement
Stakeholder Engagement
8 1 2 3 4
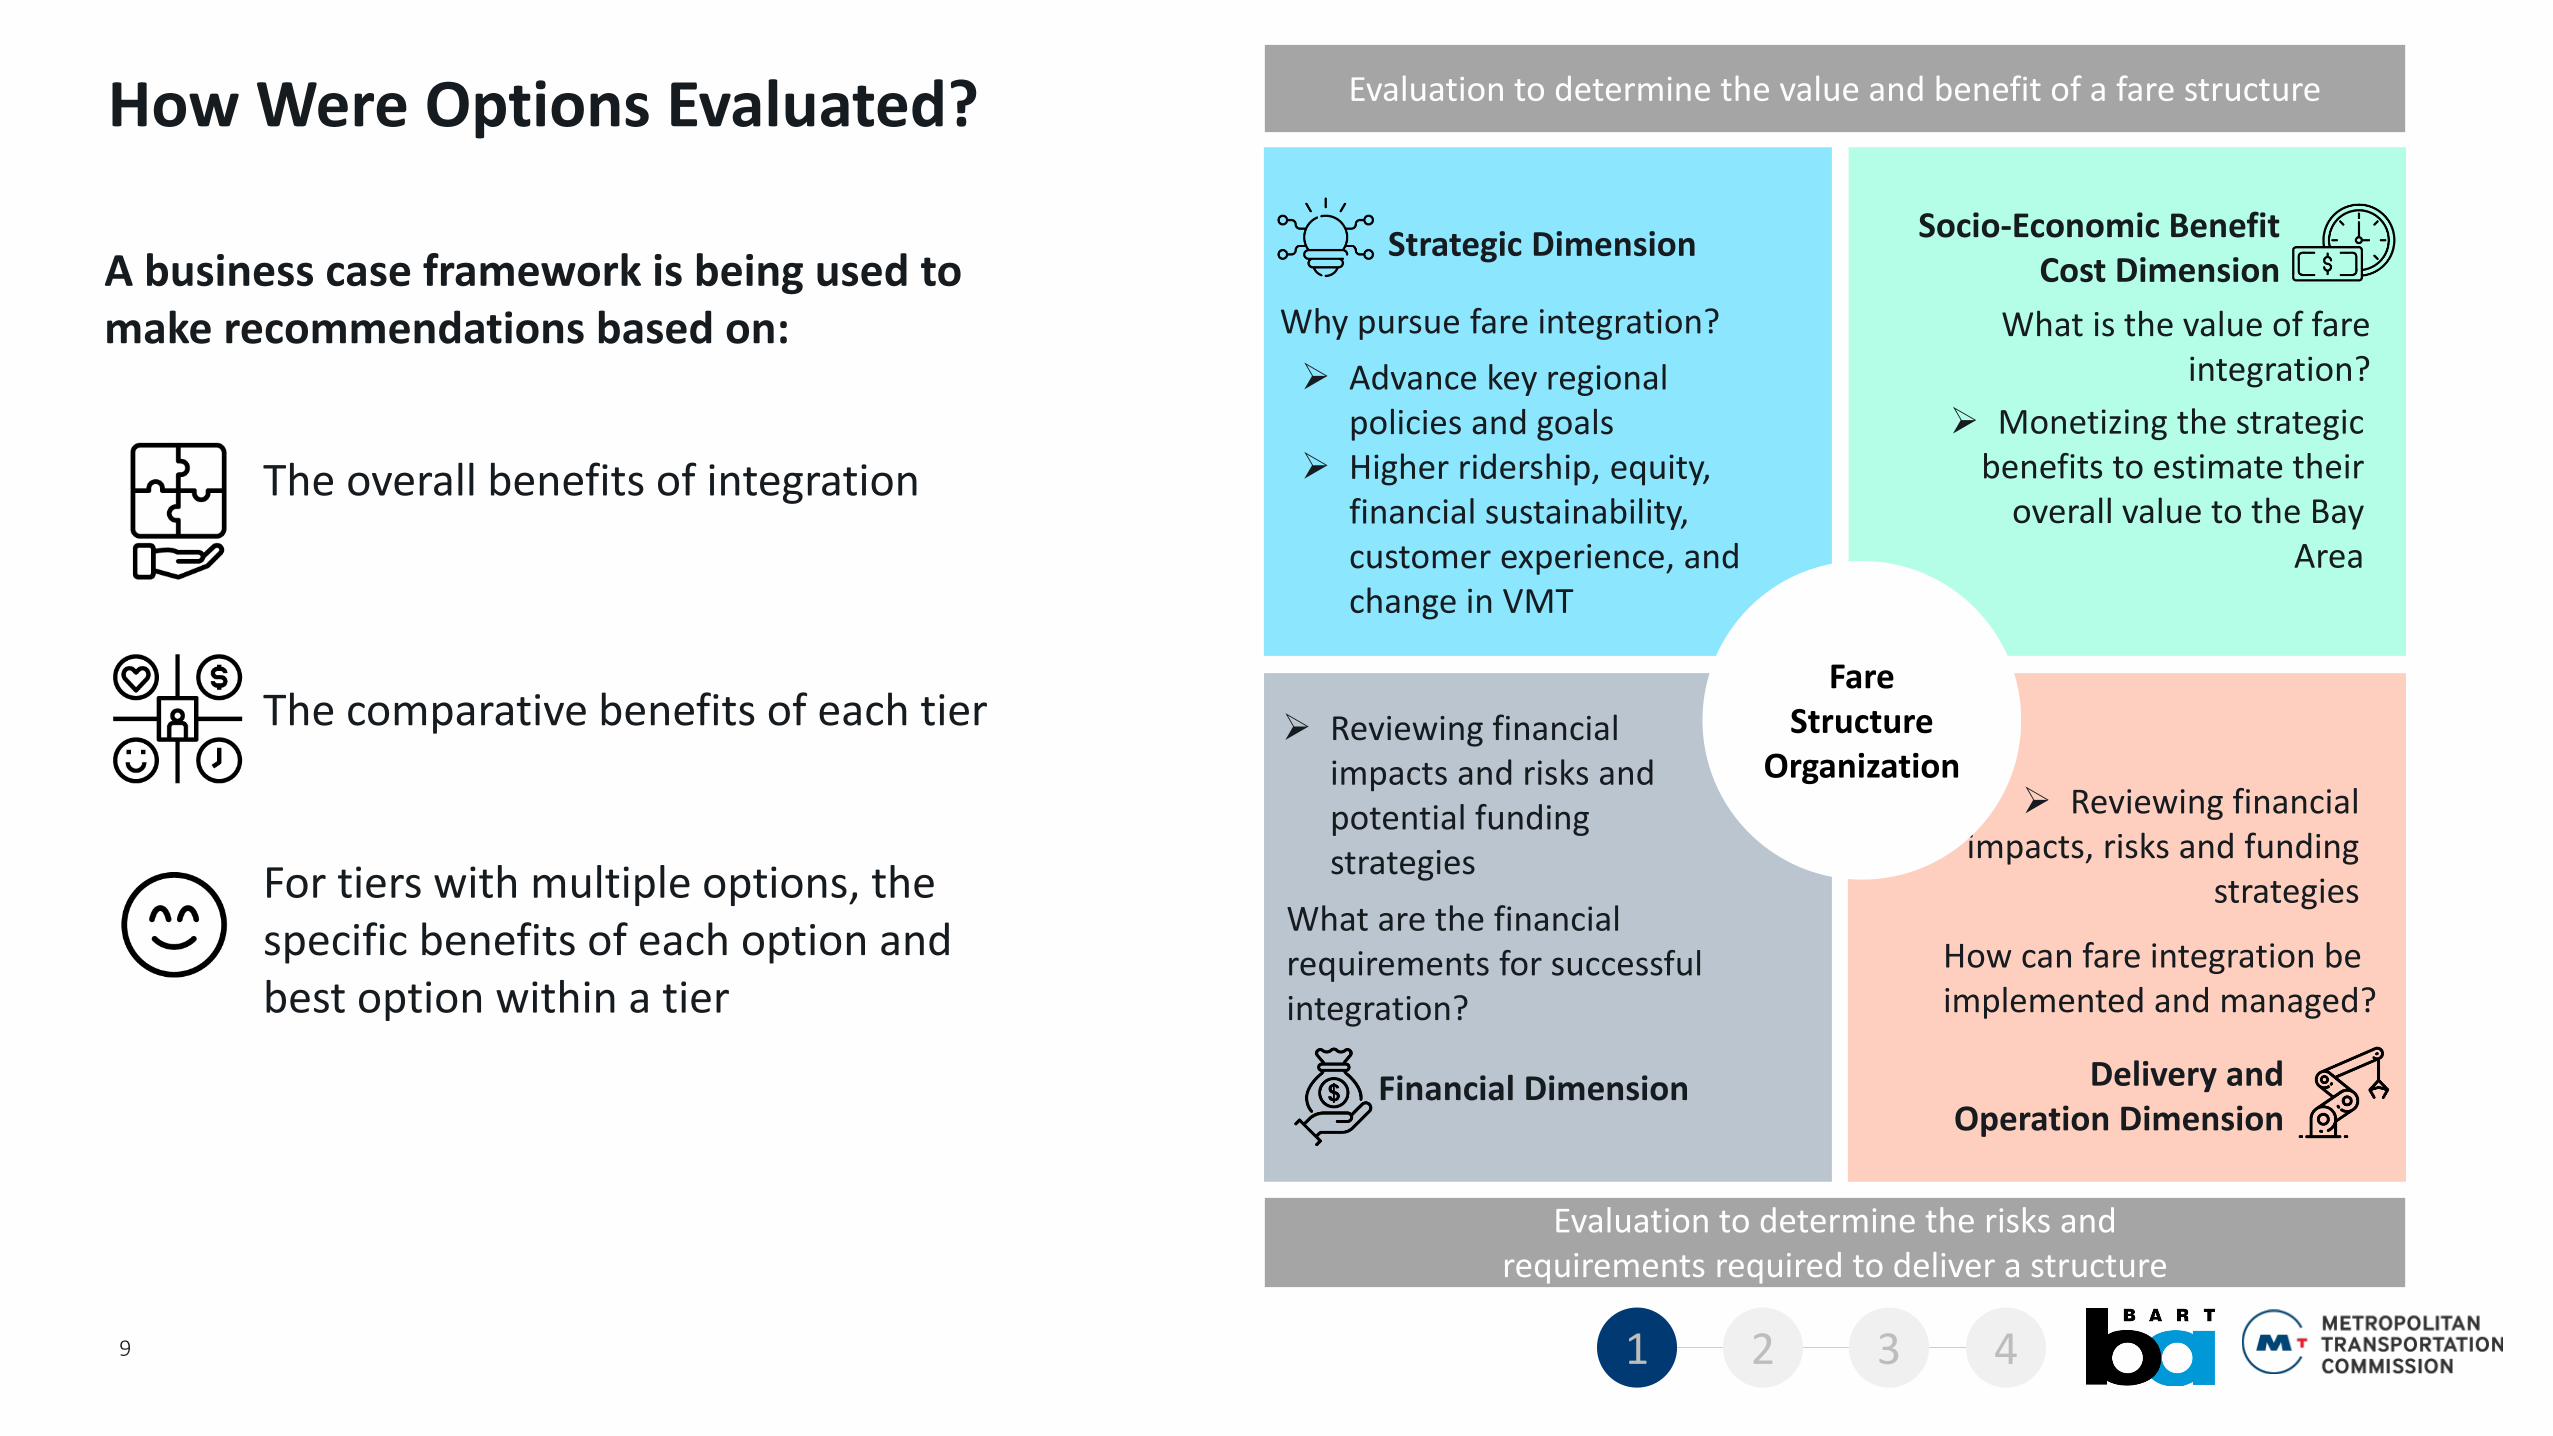
How Were Options Evaluated?
Strategic Dimension Socio-Economic Benefit
Cost Dimension
Financial Dimension Delivery and Operation Dimension
Why pursue fare integration? What is the value of fare integration?
What are the financial requirements for successful integration?
How can fare integration be implemented and managed?
➢ Advance key regional policies and goals
➢ Higher ridership, equity, financial sustainability, customer experience, and change in VMT
➢ Monetizing the strategic benefits to estimate their
overall value to the Bay Area
➢ Reviewing financial impacts, risks and funding
strategies
➢ Reviewing financial impacts and risks and potential funding strategies
Evaluation to determine the value and benefit of a fare structure
Evaluation to determine the risks and requirements required to deliver a structure
The overall benefits of integration
The comparative benefits of each tier
For tiers with multiple options, the specific benefits of each option and best option within a tier
A business case framework is being used to make recommendations based on:
9
Fare Structure
Organization
1 2 3 4
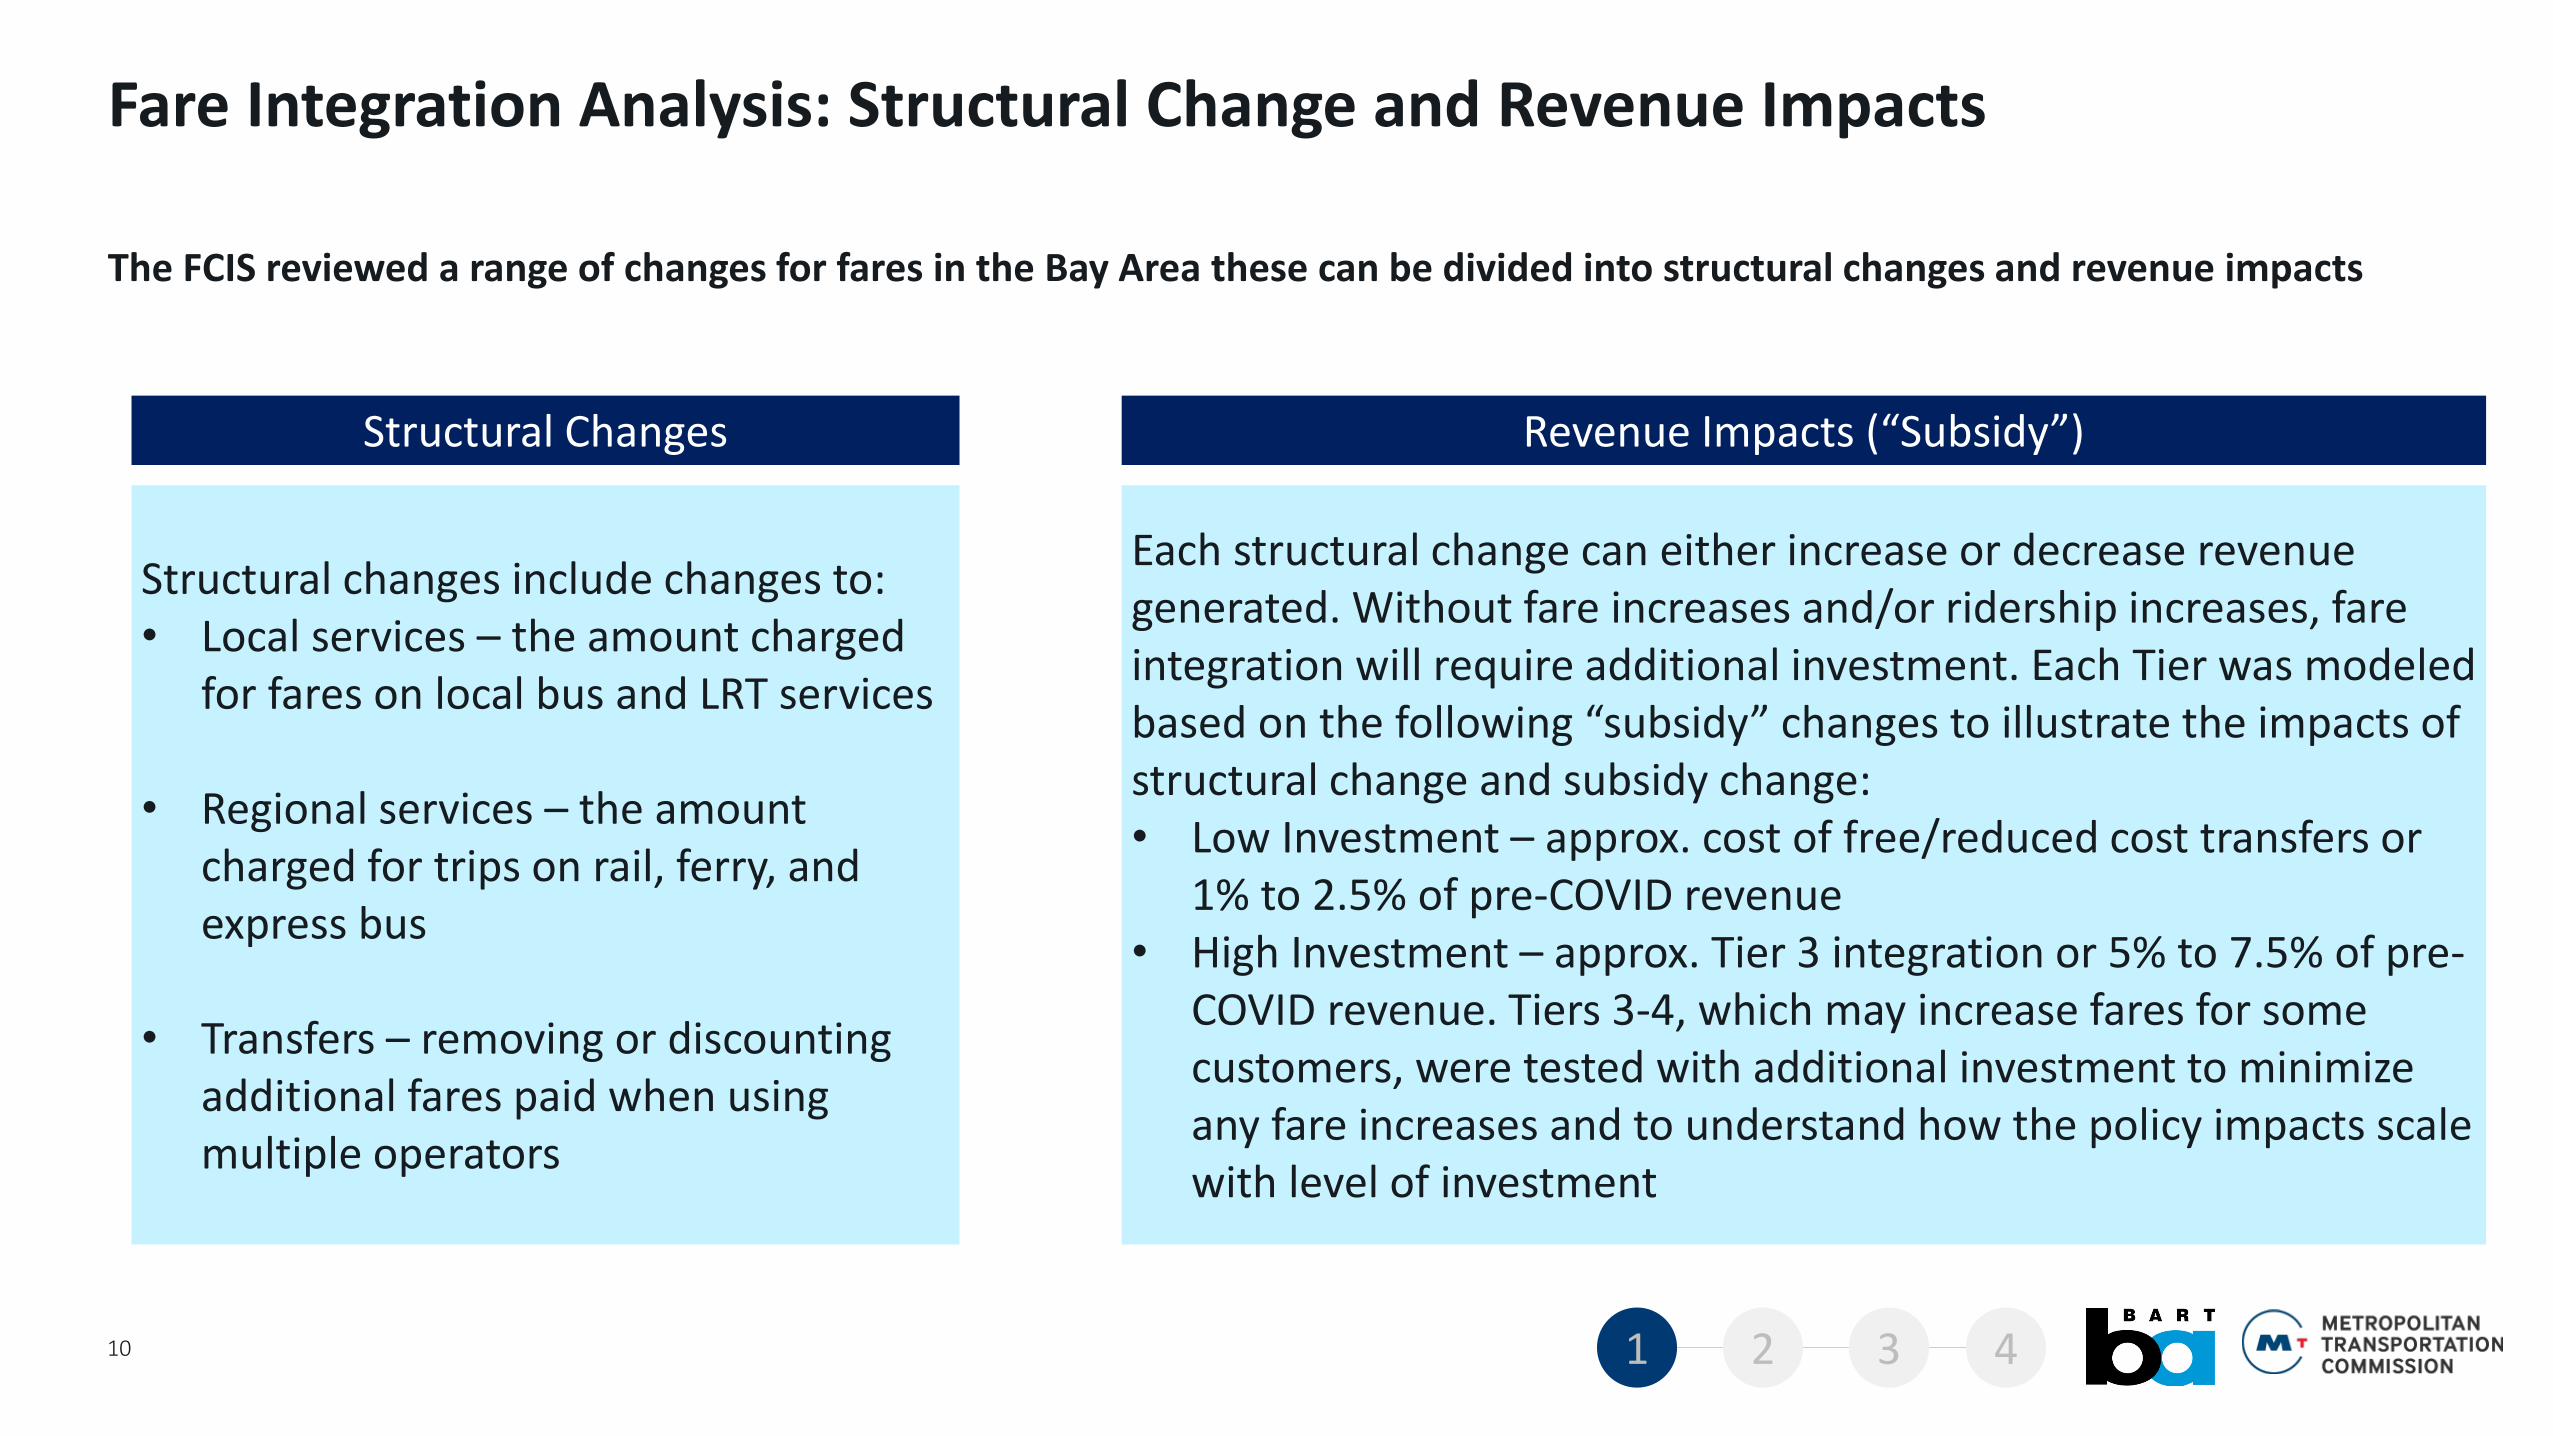
Fare Integration Analysis: Structural Change and Revenue Impacts
10
The FCIS reviewed a range of changes for fares in the Bay Area these can be divided into structural changes and revenue impacts
Structural Changes
Structural changes include changes to:• Local services – the amount charged
for fares on local bus and LRT services
• Regional services – the amount charged for trips on rail, ferry, and express bus
• Transfers – removing or discounting additional fares paid when using multiple operators
Revenue Impacts (“Subsidy”)
Each structural change can either increase or decrease revenue generated. Without fare increases and/or ridership increases, fare integration will require additional investment. Each Tier was modeled based on the following “subsidy” changes to illustrate the impacts of structural change and subsidy change: • Low Investment – approx. cost of free/reduced cost transfers or
1% to 2.5% of pre-COVID revenue• High Investment – approx. Tier 3 integration or 5% to 7.5% of pre-
COVID revenue. Tiers 3-4, which may increase fares for some customers, were tested with additional investment to minimize any fare increases and to understand how the policy impacts scale with level of investment
1 2 3 4
Key Findings & Recommendations2
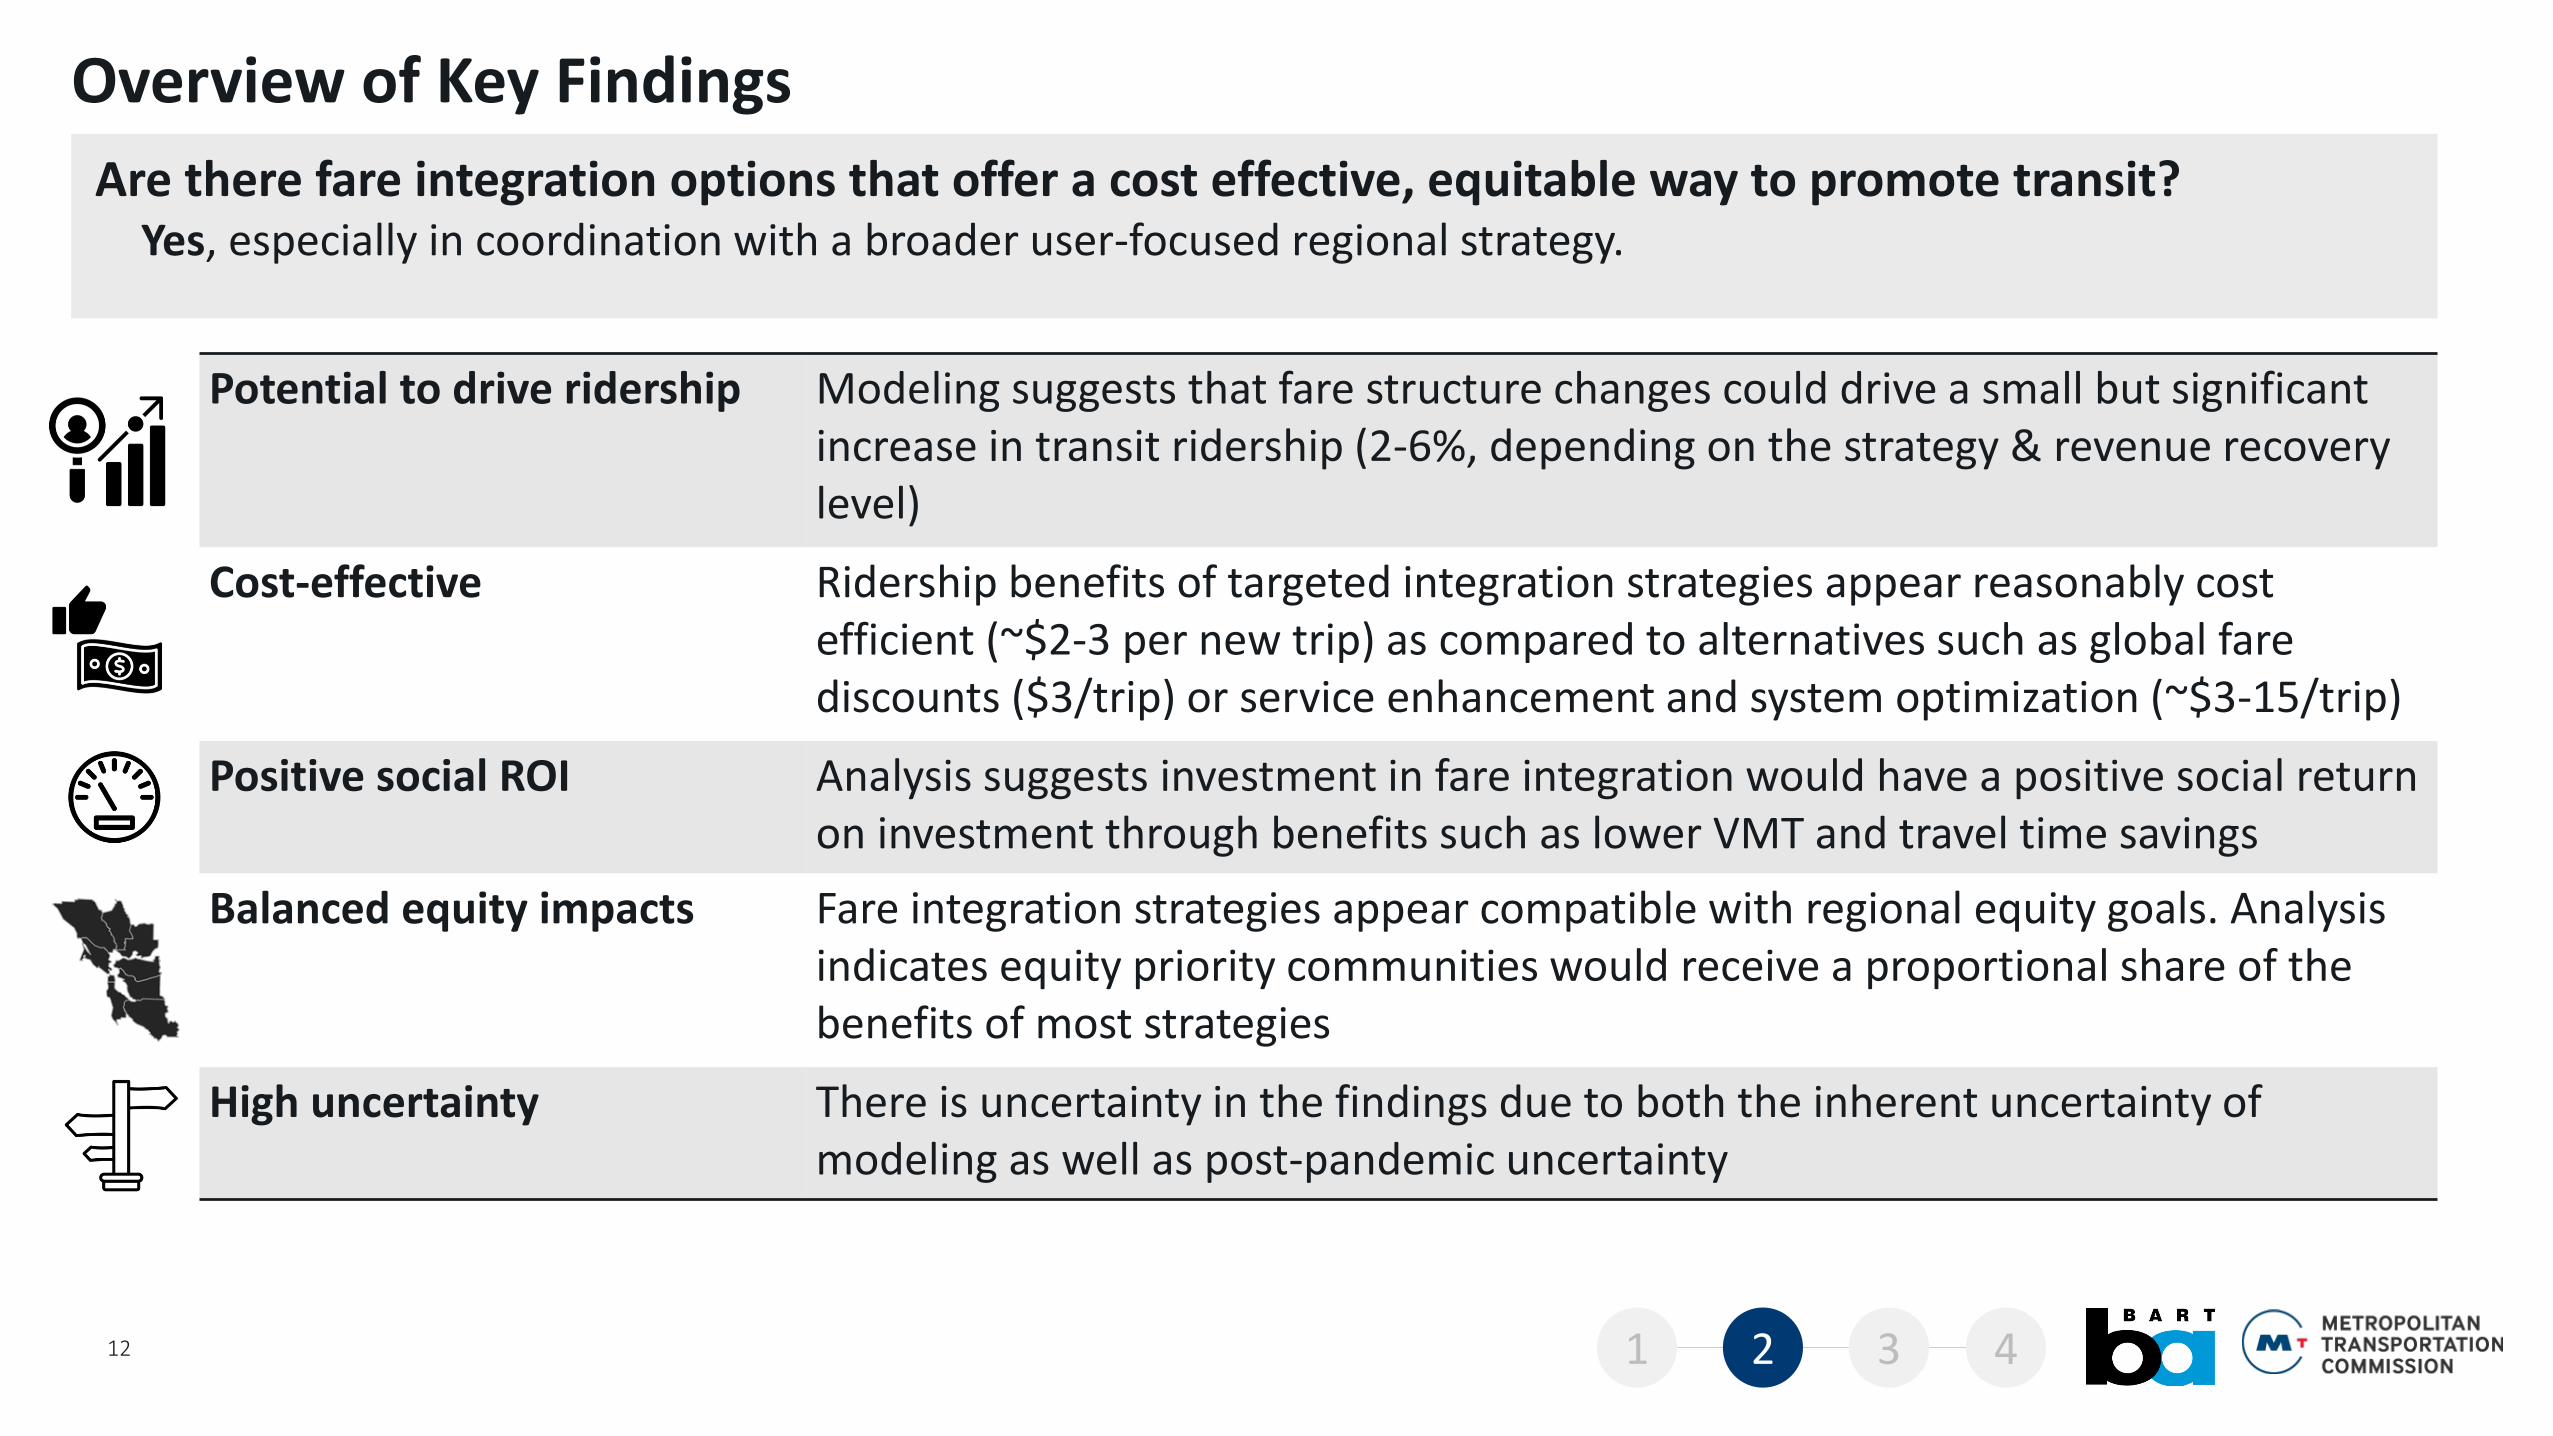
Are there fare integration options that offer a cost effective, equitable way to promote transit?
12
Yes, especially in coordination with a broader user-focused regional strategy.
Overview of Key Findings
Potential to drive ridership Modeling suggests that fare structure changes could drive a small but significant increase in transit ridership (2-6%, depending on the strategy & revenue recovery level)
Cost-effective Ridership benefits of targeted integration strategies appear reasonably cost efficient (~$2-3 per new trip) as compared to alternatives such as global fare discounts ($3/trip) or service enhancement and system optimization (~$3-15/trip)
Positive social ROI Analysis suggests investment in fare integration would have a positive social return on investment through benefits such as lower VMT and travel time savings
Balanced equity impacts Fare integration strategies appear compatible with regional equity goals. Analysis indicates equity priority communities would receive a proportional share of the benefits of most strategies
High uncertainty There is uncertainty in the findings due to both the inherent uncertainty of modeling as well as post-pandemic uncertainty
1 2 3 4
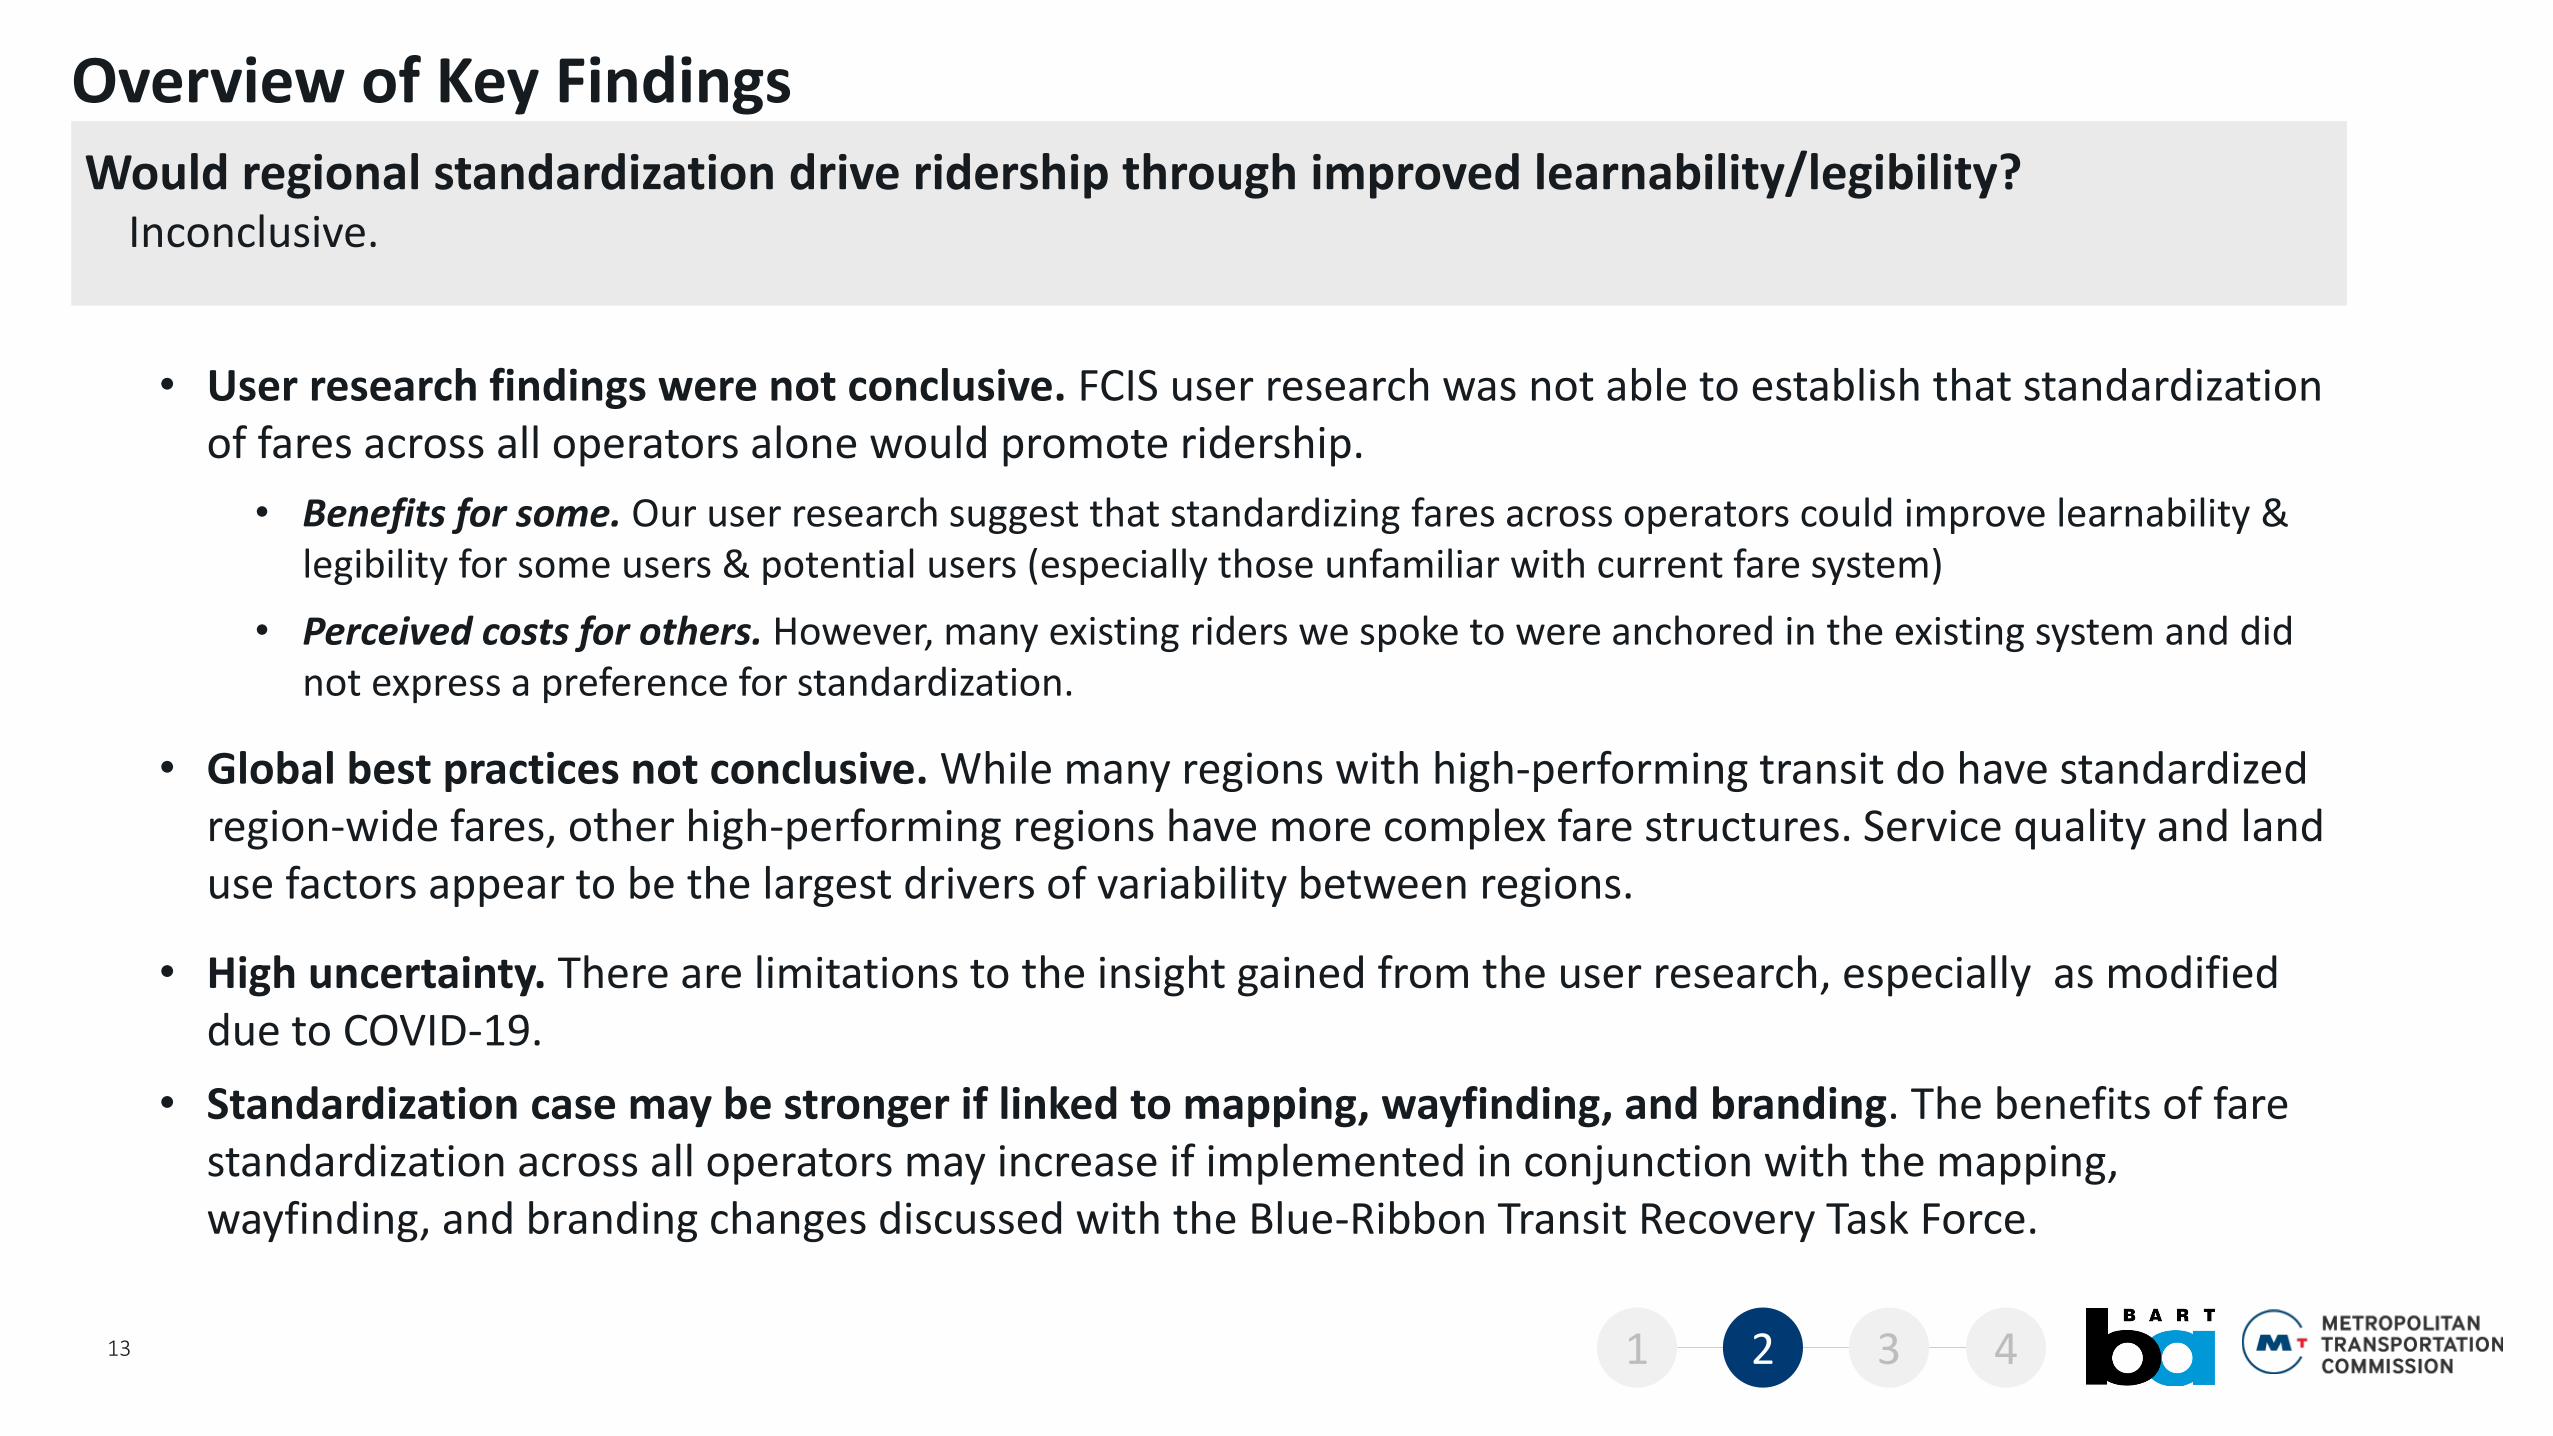
Would regional standardization drive ridership through improved learnability/legibility?
13
• User research findings were not conclusive. FCIS user research was not able to establish that standardization of fares across all operators alone would promote ridership.
• Benefits for some. Our user research suggest that standardizing fares across operators could improve learnability & legibility for some users & potential users (especially those unfamiliar with current fare system)
• Perceived costs for others. However, many existing riders we spoke to were anchored in the existing system and did not express a preference for standardization.
• Global best practices not conclusive. While many regions with high-performing transit do have standardized region-wide fares, other high-performing regions have more complex fare structures. Service quality and land use factors appear to be the largest drivers of variability between regions.
• High uncertainty. There are limitations to the insight gained from the user research, especially as modified due to COVID-19.
• Standardization case may be stronger if linked to mapping, wayfinding, and branding. The benefits of fare standardization across all operators may increase if implemented in conjunction with the mapping, wayfinding, and branding changes discussed with the Blue-Ribbon Transit Recovery Task Force.
Inconclusive.
Overview of Key Findings
1 2 3 4
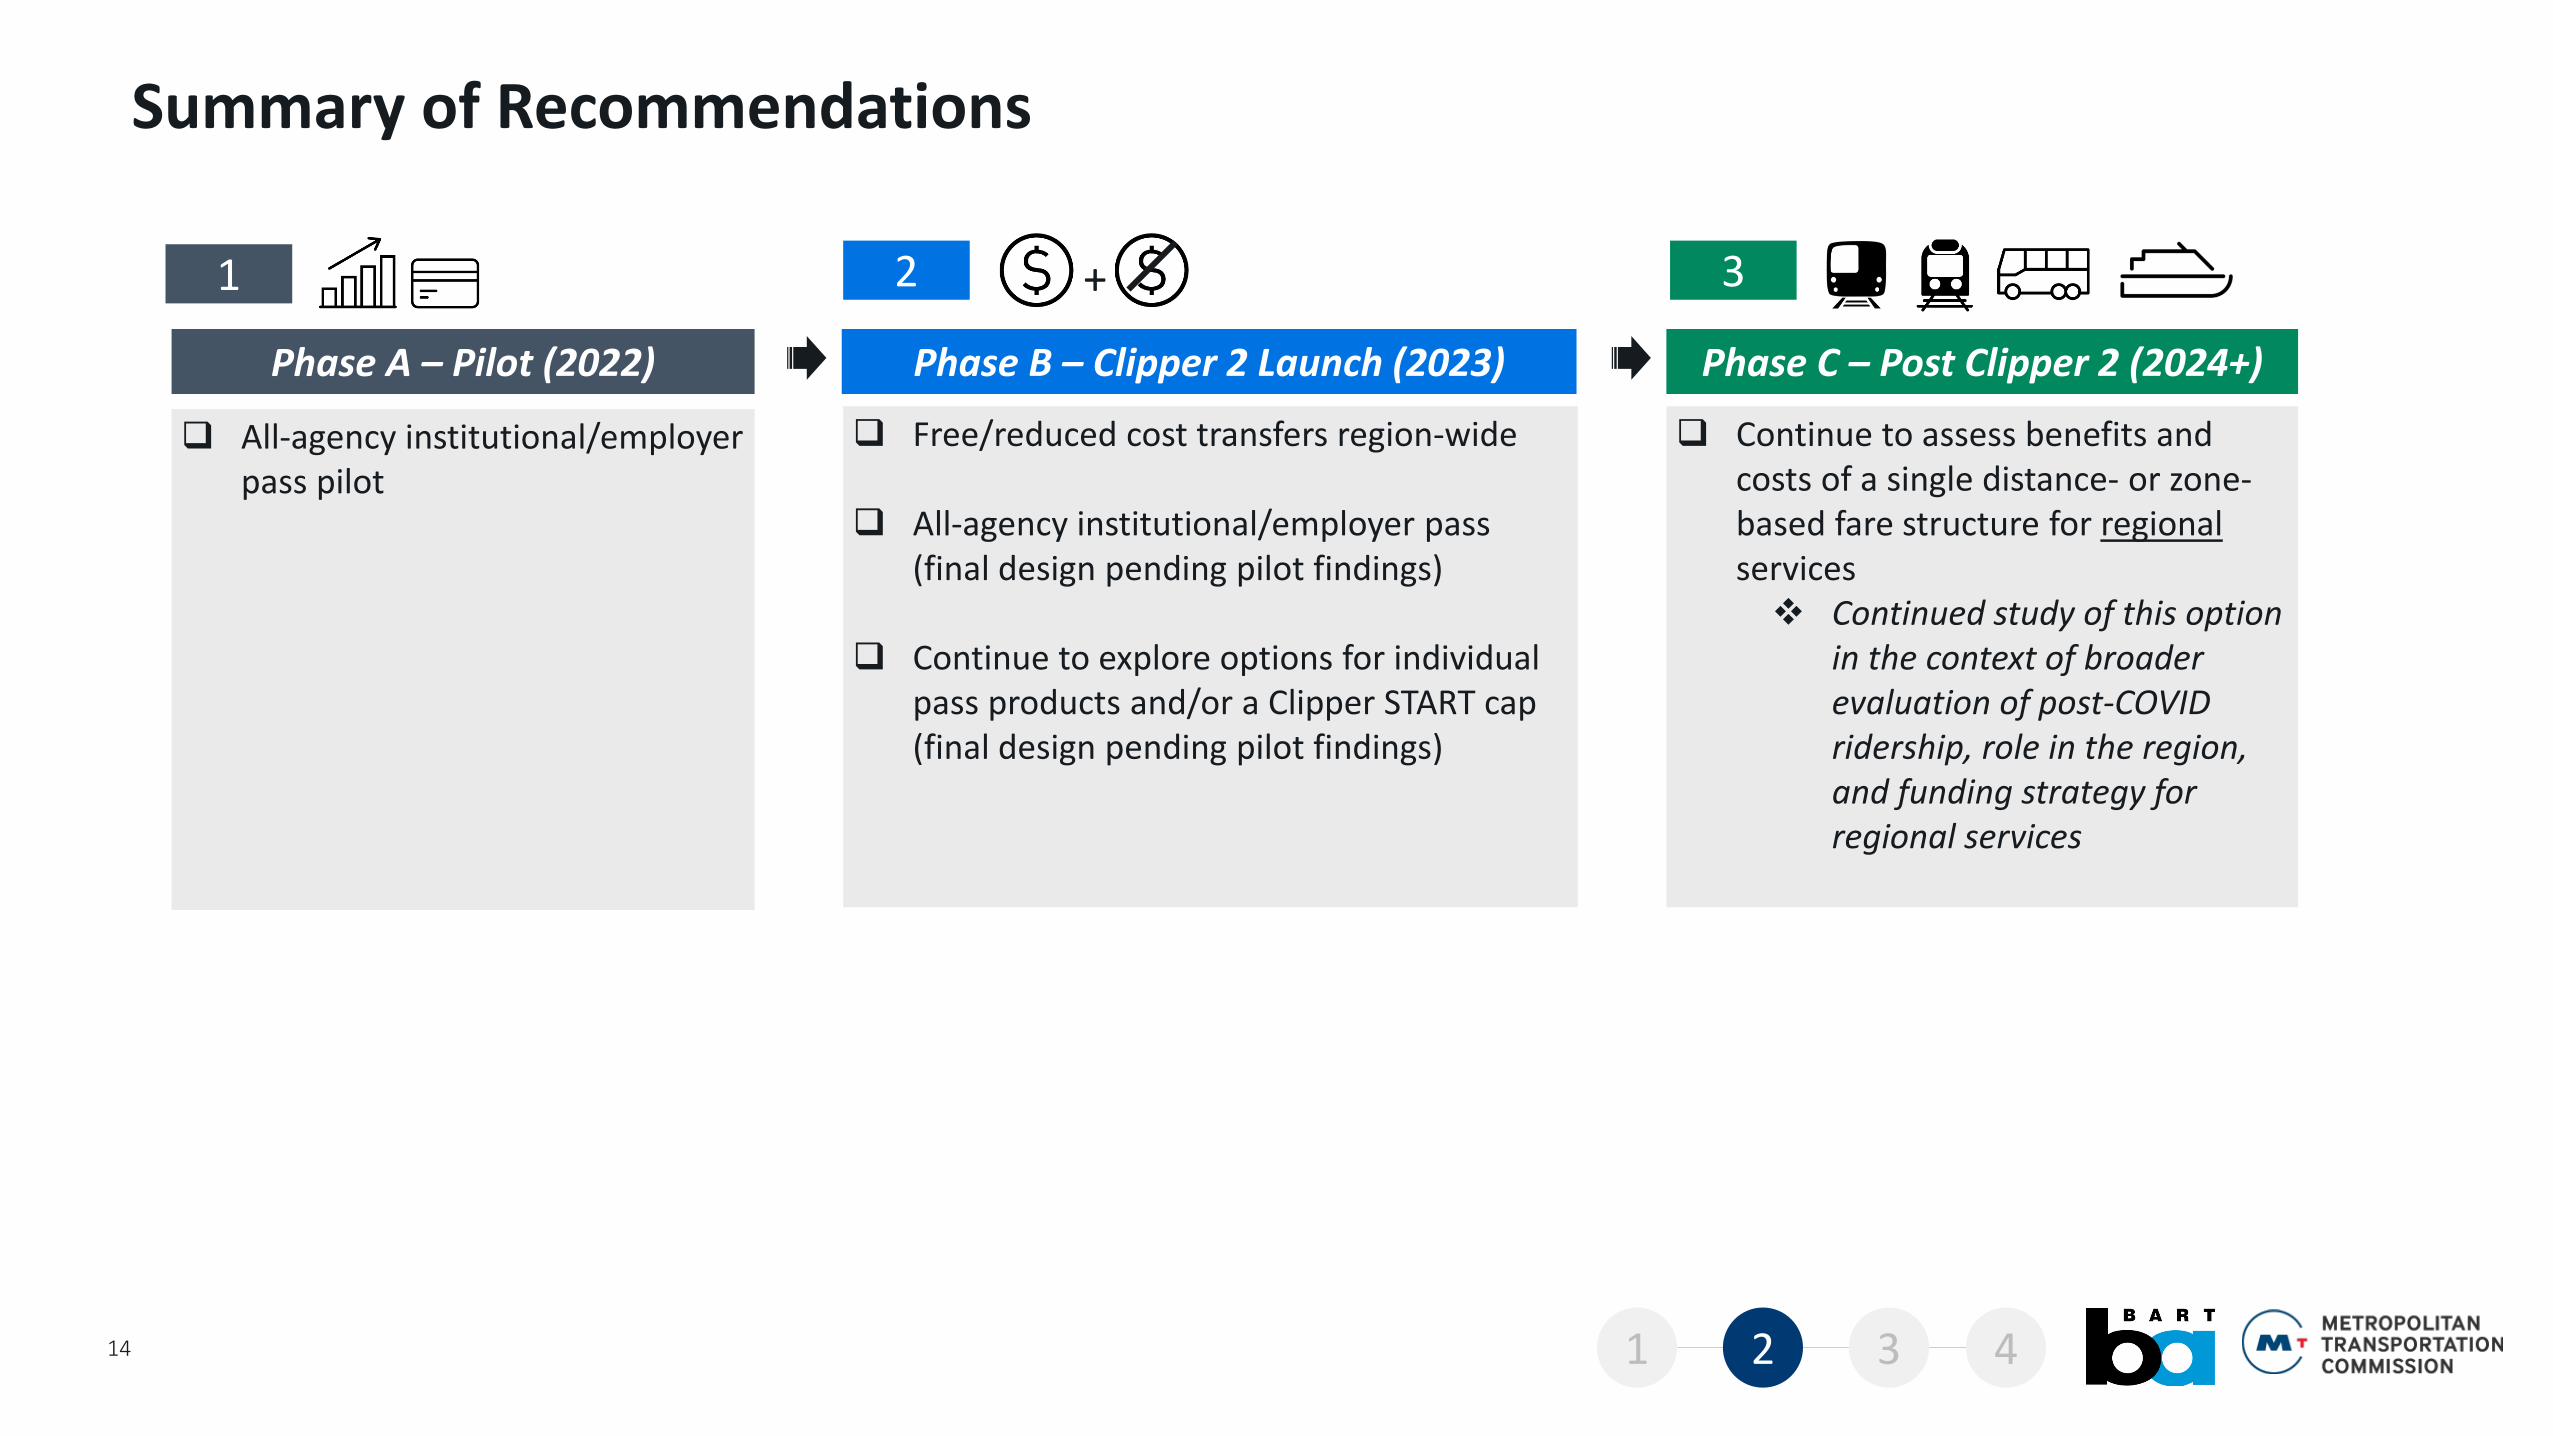
Summary of Recommendations
Phase A – Pilot (2022) Phase B – Clipper 2 Launch (2023) Phase C – Post Clipper 2 (2024+)
❑ Continue to assess benefits and costs of a single distance- or zone-based fare structure for regionalservices❖ Continued study of this option
in the context of broader evaluation of post-COVID ridership, role in the region, and funding strategy for regional services
❑ Free/reduced cost transfers region-wide
❑ All-agency institutional/employer pass (final design pending pilot findings)
❑ Continue to explore options for individual pass products and/or a Clipper START cap (final design pending pilot findings)
❑ All-agency institutional/employer pass pilot
14
+1 2 3
1 2 3 4
Summary of Recommendations
15
No-cost transfers region-wide
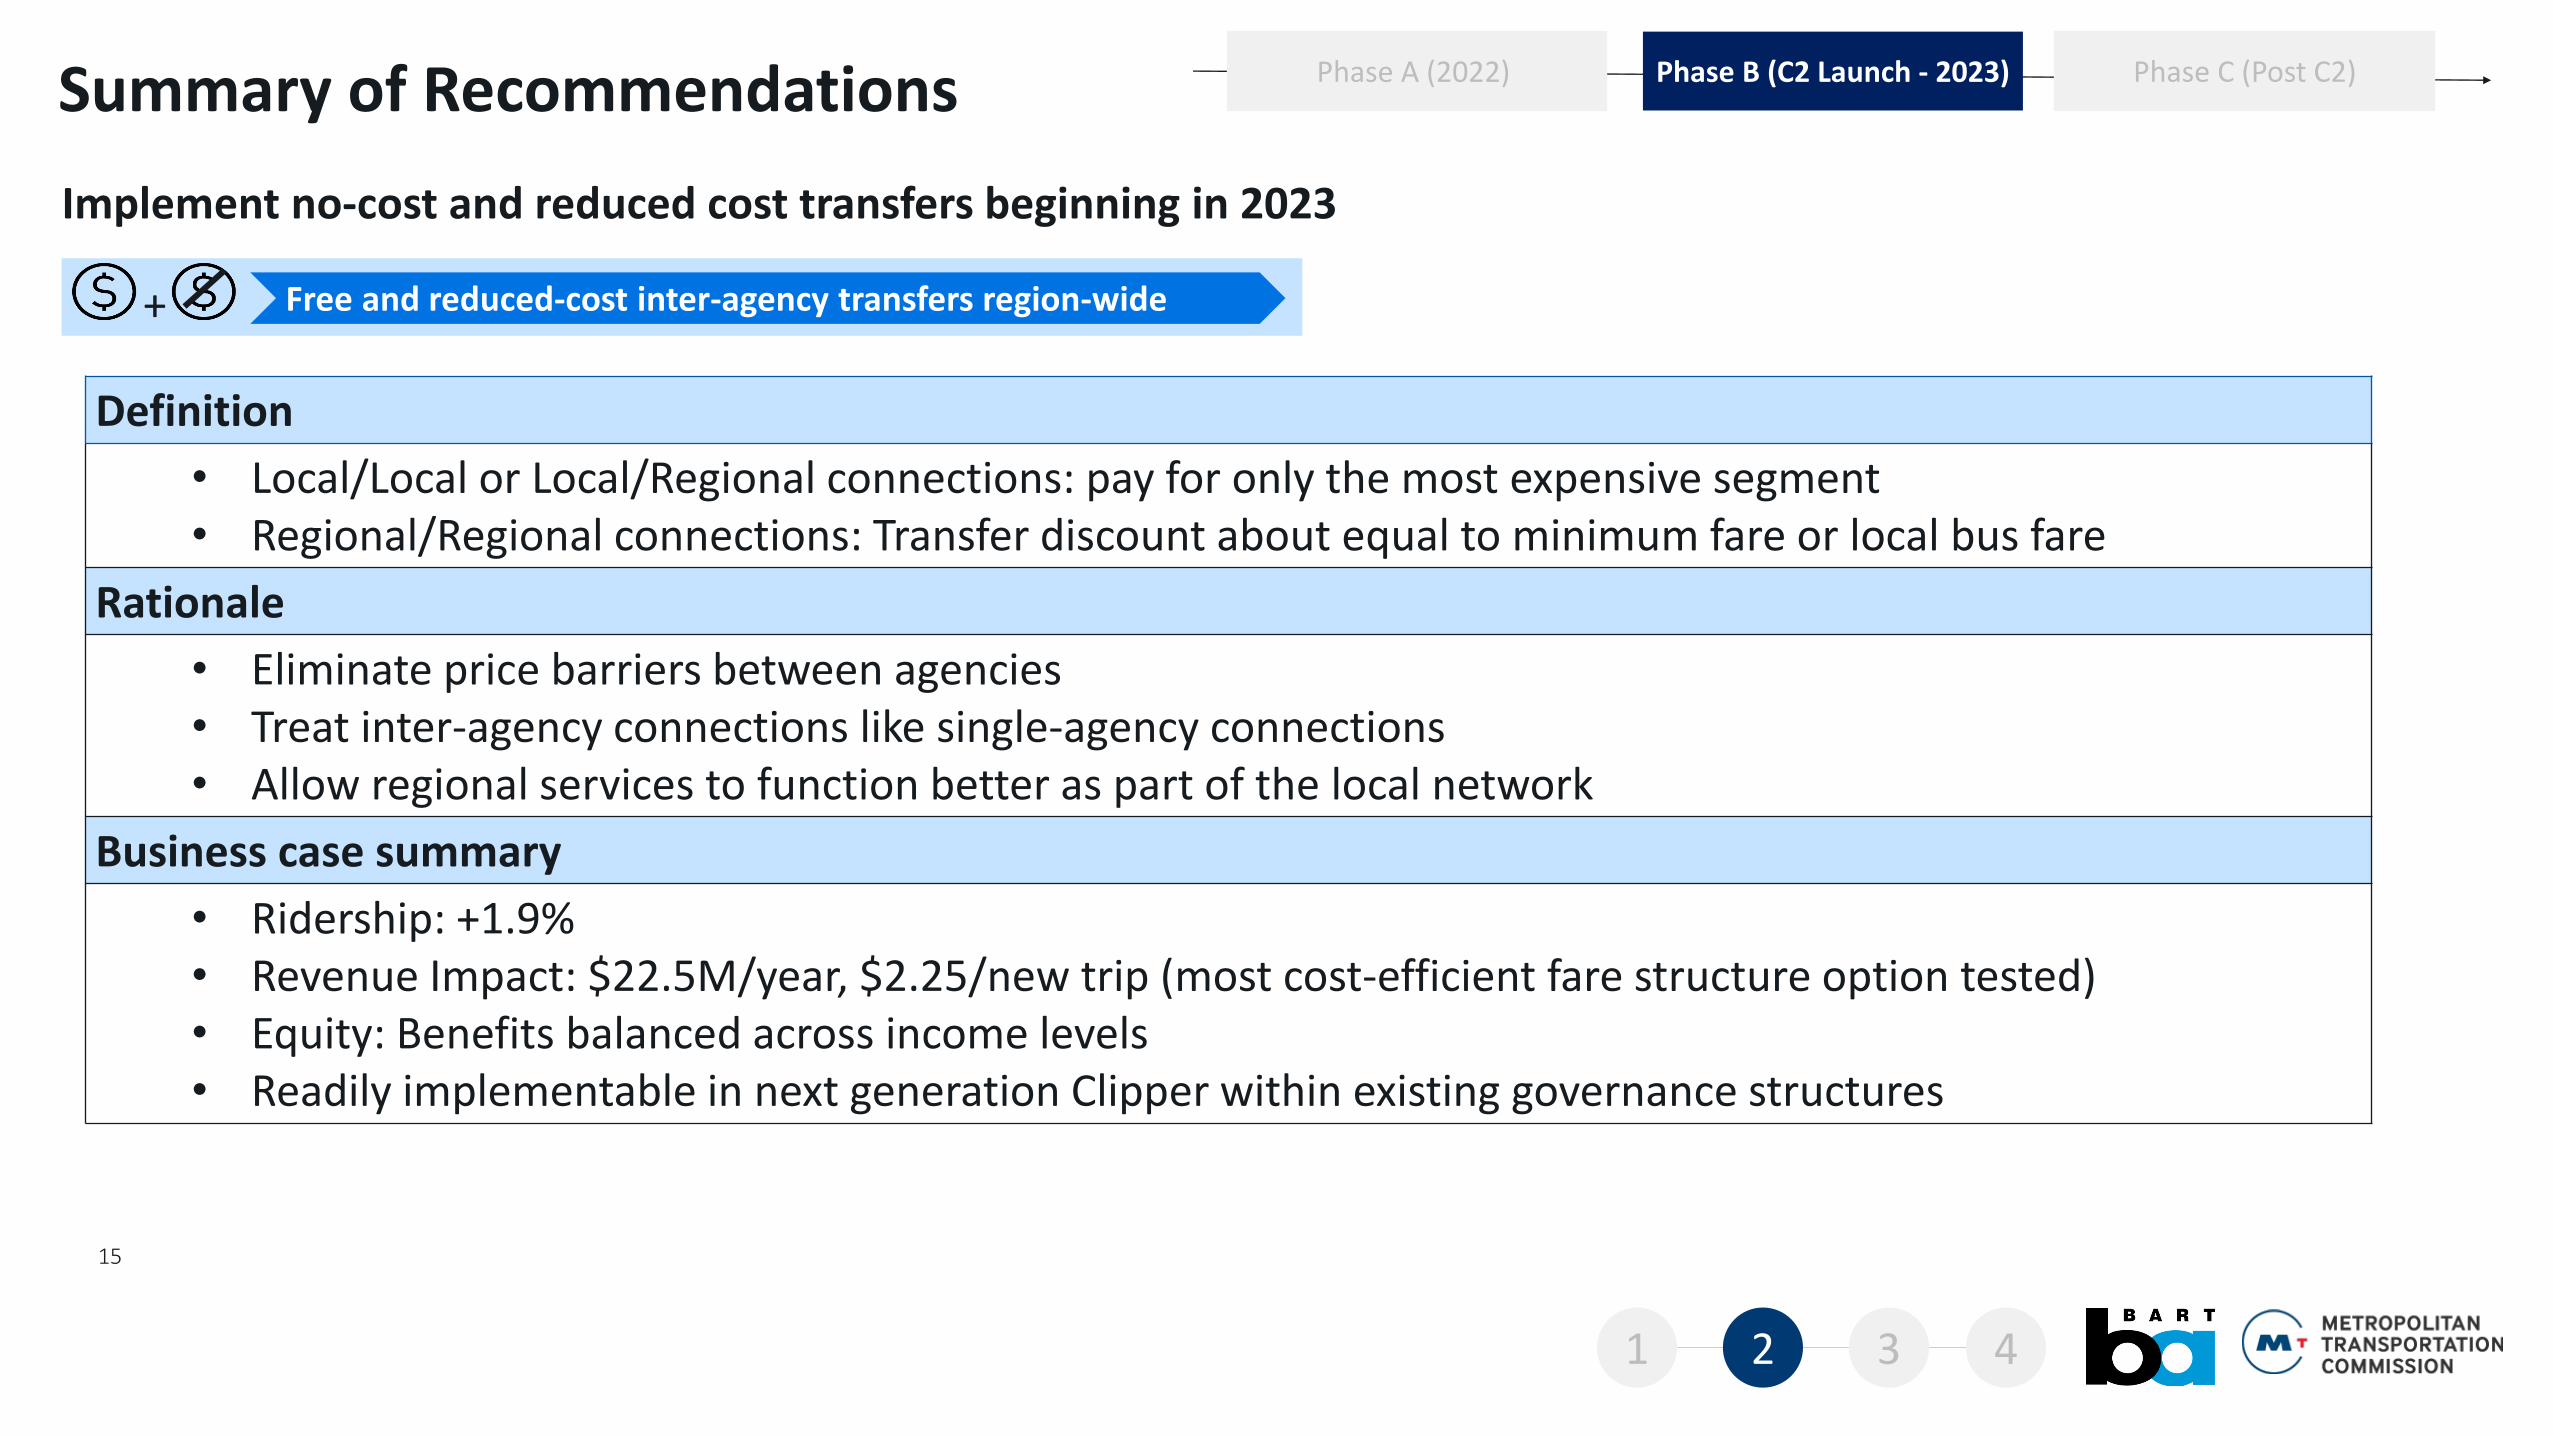
Implement no-cost and reduced cost transfers beginning in 2023
Free and reduced-cost inter-agency transfers region-wide+
Definition
• Local/Local or Local/Regional connections: pay for only the most expensive segment• Regional/Regional connections: Transfer discount about equal to minimum fare or local bus fare
Rationale
• Eliminate price barriers between agencies • Treat inter-agency connections like single-agency connections• Allow regional services to function better as part of the local network
Business case summary
• Ridership: +1.9%• Revenue Impact: $22.5M/year, $2.25/new trip (most cost-efficient fare structure option tested)• Equity: Benefits balanced across income levels• Readily implementable in next generation Clipper within existing governance structures
Phase B (C2 Launch - 2023)Phase A (2022) Phase C (Post C2)
1 2 3 4
Summary of Recommendations
16
No-cost transfers region-wide
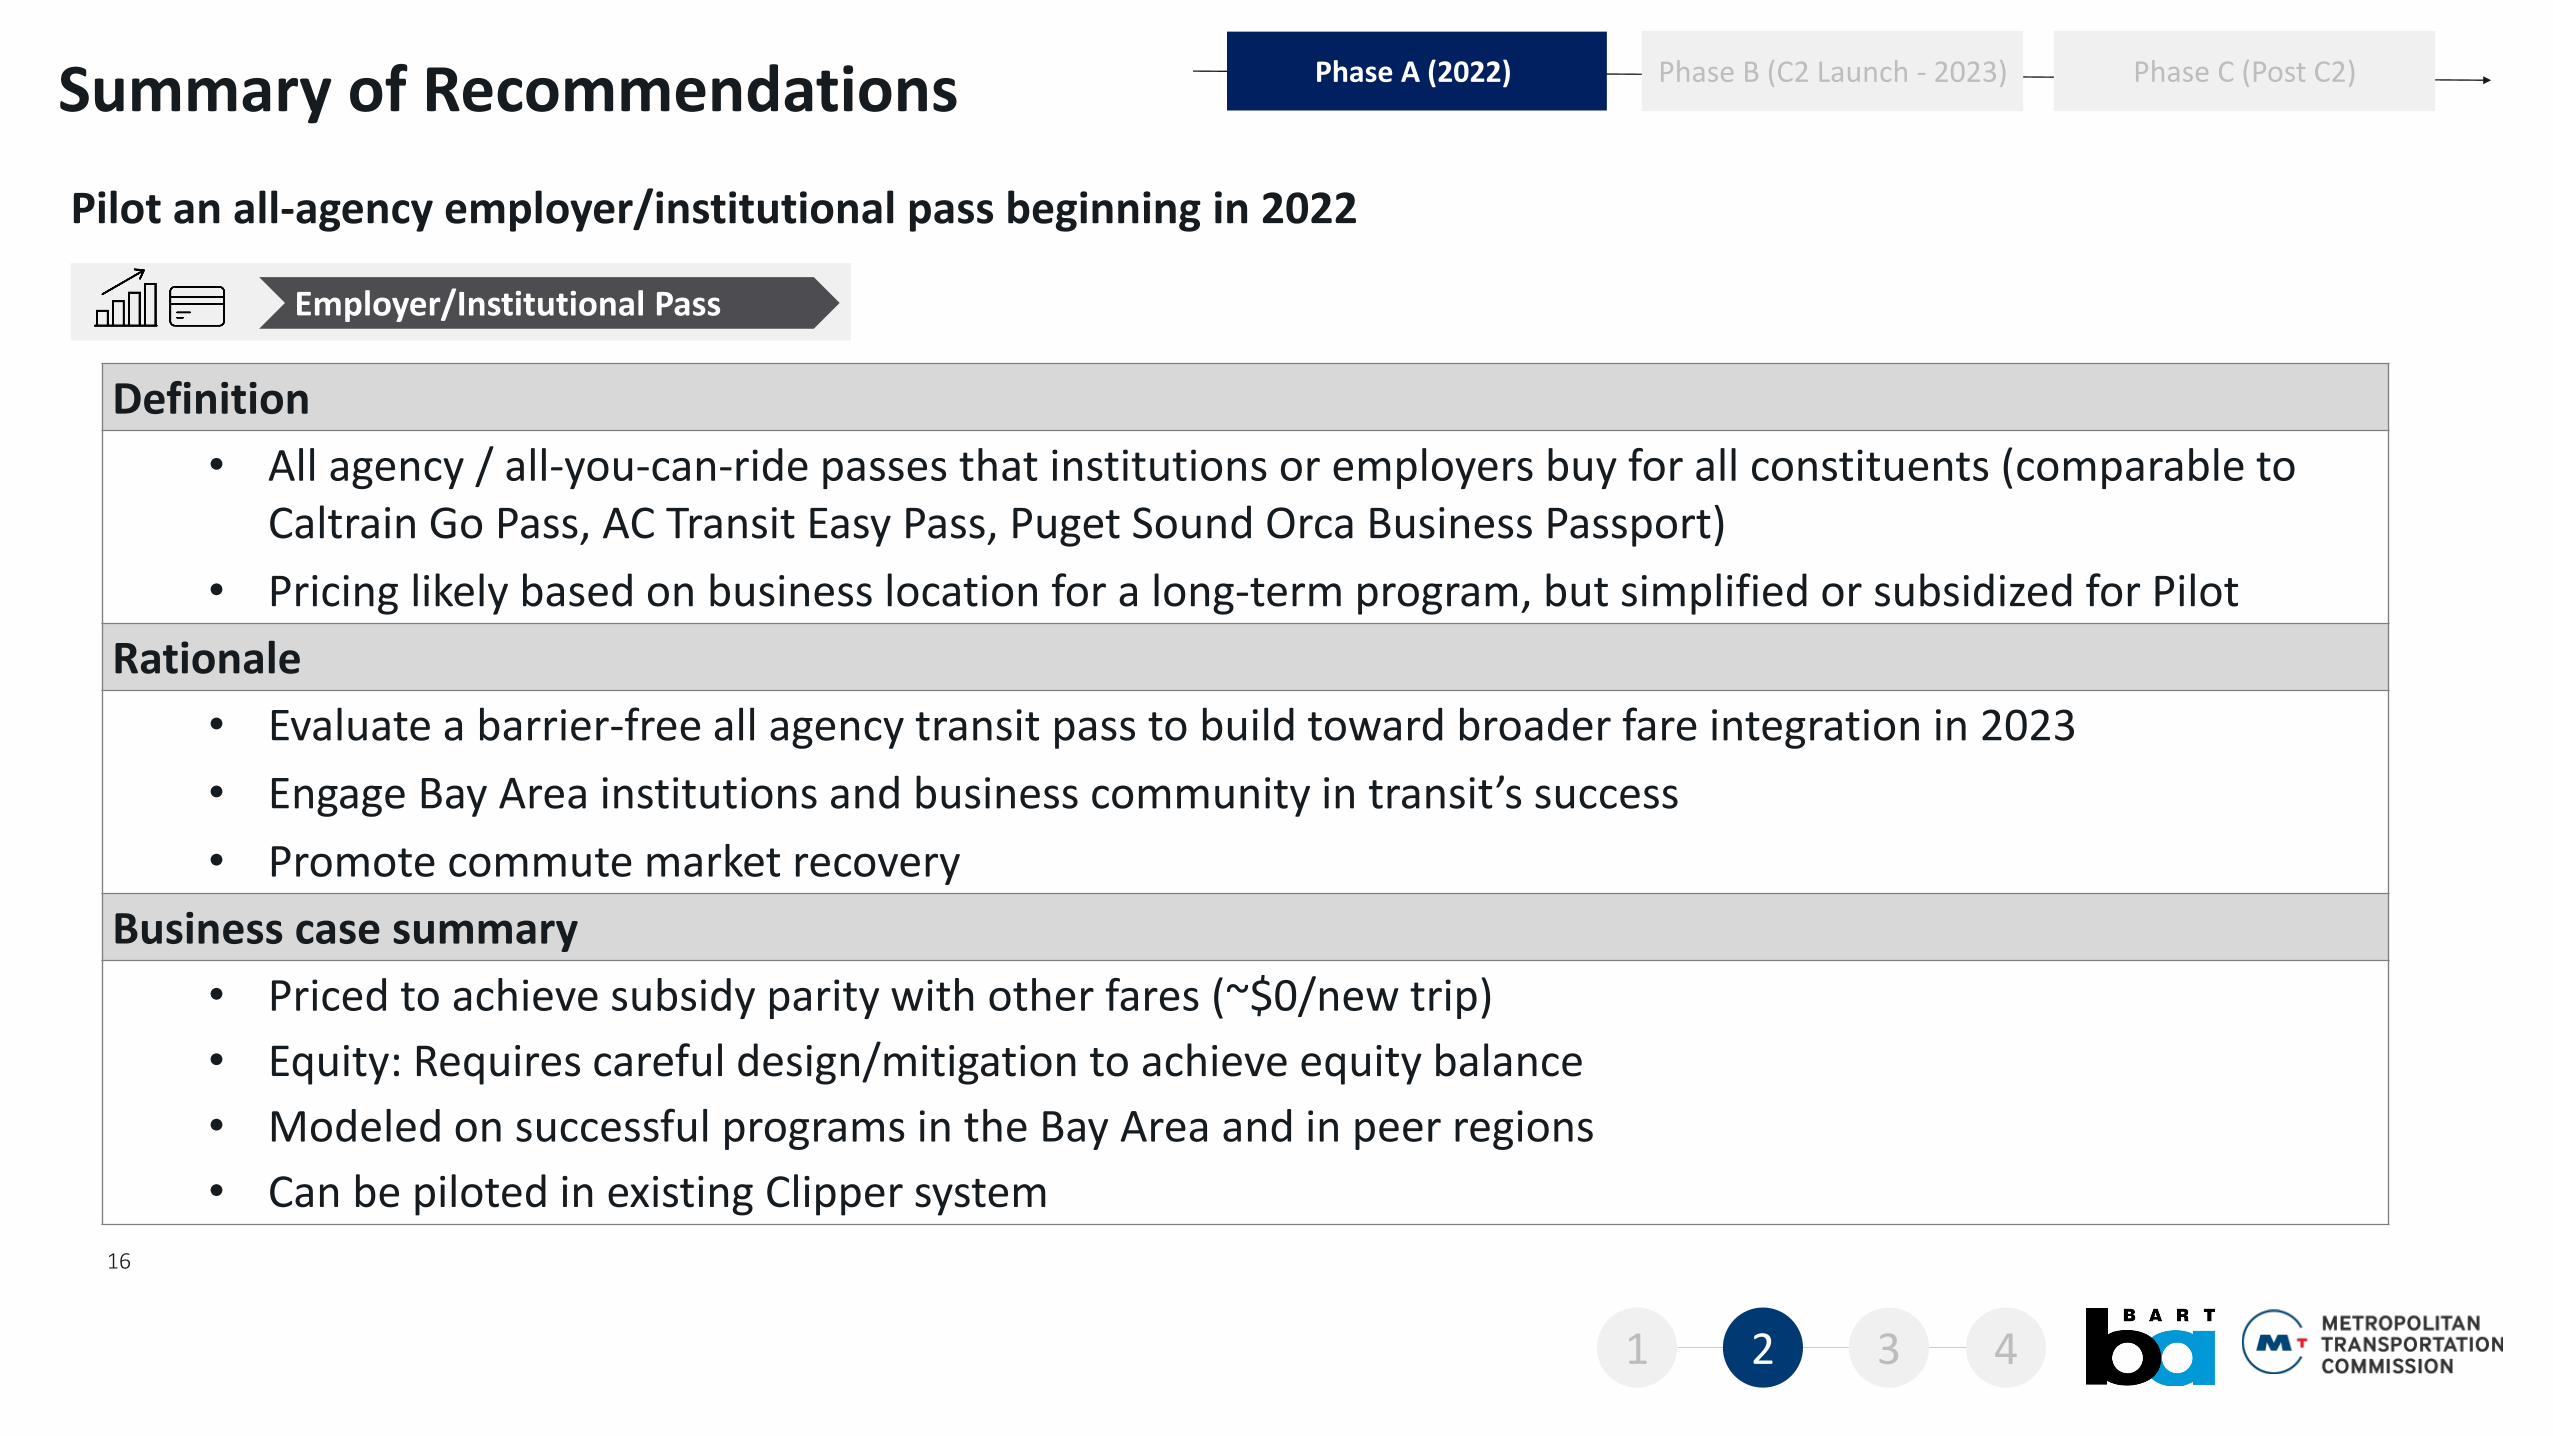
Pilot an all-agency employer/institutional pass beginning in 2022
Employer/Institutional Pass
Definition
• All agency / all-you-can-ride passes that institutions or employers buy for all constituents (comparable to Caltrain Go Pass, AC Transit Easy Pass, Puget Sound Orca Business Passport)
• Pricing likely based on business location for a long-term program, but simplified or subsidized for Pilot
Rationale
• Evaluate a barrier-free all agency transit pass to build toward broader fare integration in 2023
• Engage Bay Area institutions and business community in transit’s success
• Promote commute market recovery
Business case summary
• Priced to achieve subsidy parity with other fares (~$0/new trip)
• Equity: Requires careful design/mitigation to achieve equity balance
• Modeled on successful programs in the Bay Area and in peer regions
• Can be piloted in existing Clipper system
Phase B (C2 Launch - 2023)Phase A (2022) Phase C (Post C2)
1 2 3 4
Summary of Recommendations
17
No-cost transfers region-wide
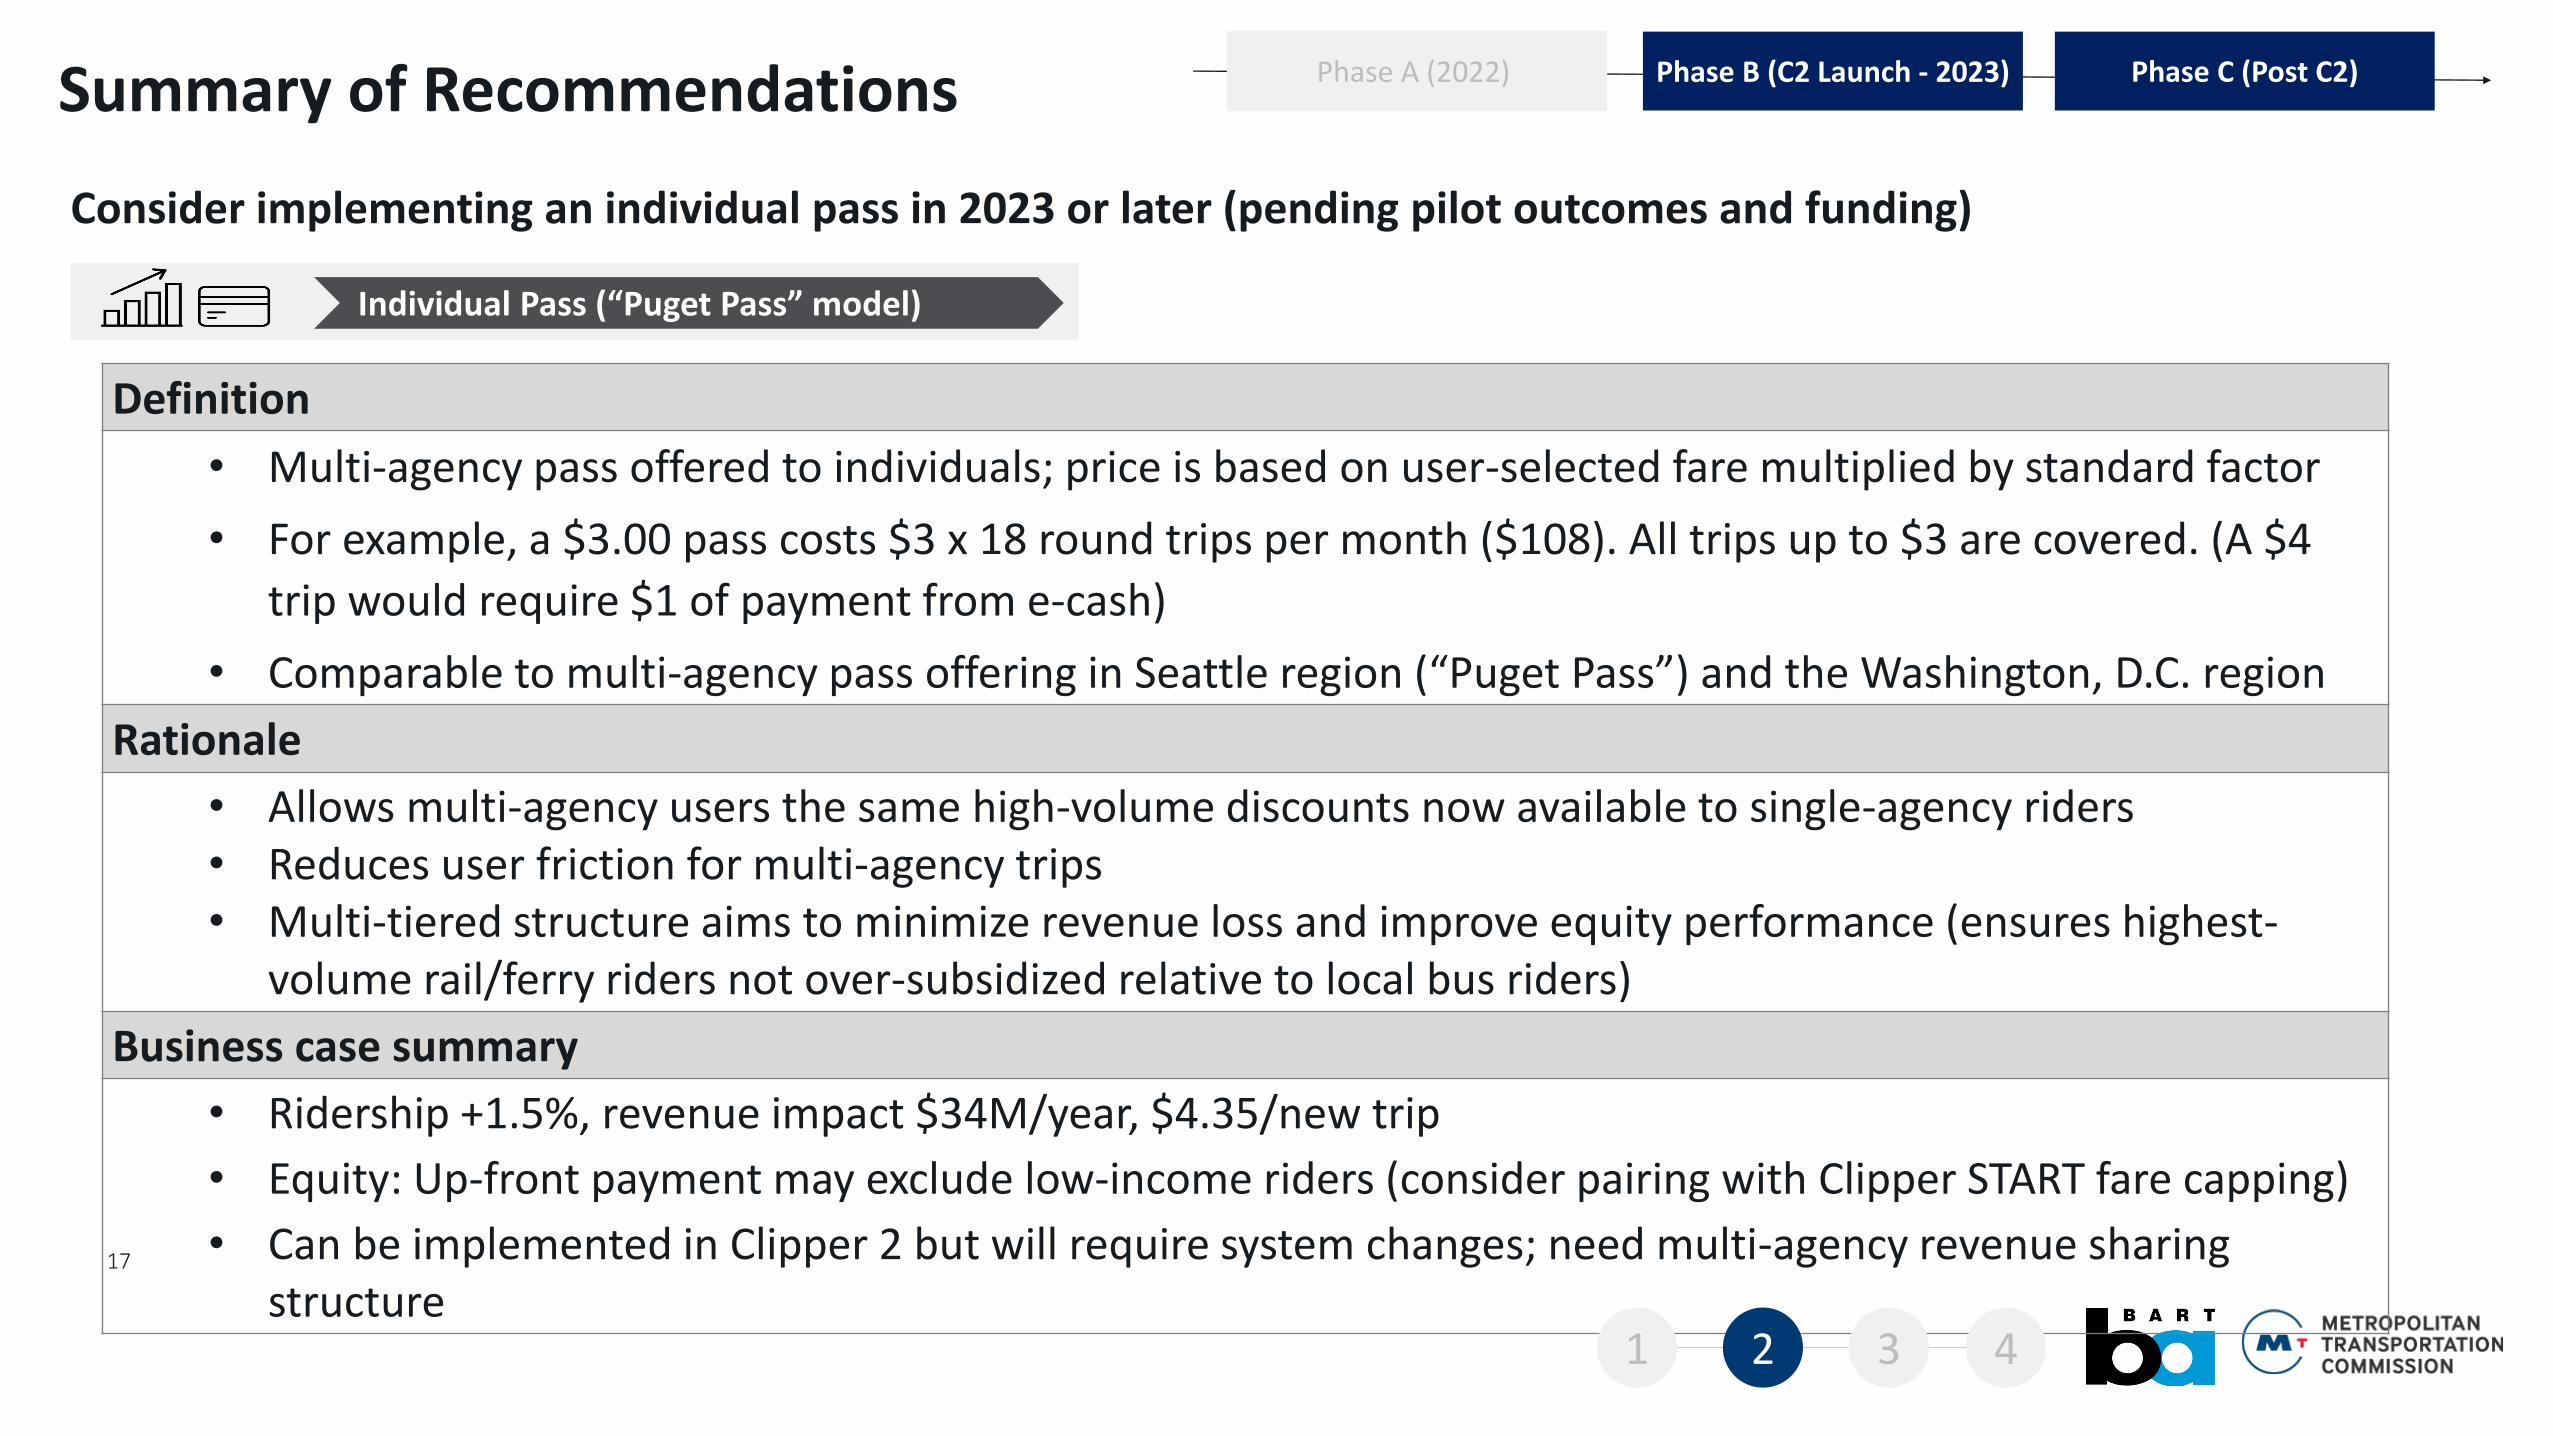
Consider implementing an individual pass in 2023 or later (pending pilot outcomes and funding)
Individual Pass (“Puget Pass” model)
Definition
• Multi-agency pass offered to individuals; price is based on user-selected fare multiplied by standard factor
• For example, a $3.00 pass costs $3 x 18 round trips per month ($108). All trips up to $3 are covered. (A $4
trip would require $1 of payment from e-cash)
• Comparable to multi-agency pass offering in Seattle region (“Puget Pass”) and the Washington, D.C. region
Rationale
• Allows multi-agency users the same high-volume discounts now available to single-agency riders• Reduces user friction for multi-agency trips• Multi-tiered structure aims to minimize revenue loss and improve equity performance (ensures highest-
volume rail/ferry riders not over-subsidized relative to local bus riders)
Business case summary
• Ridership +1.5%, revenue impact $34M/year, $4.35/new trip
• Equity: Up-front payment may exclude low-income riders (consider pairing with Clipper START fare capping)
• Can be implemented in Clipper 2 but will require system changes; need multi-agency revenue sharing structure
Phase B (C2 Launch - 2023)Phase A (2022) Phase C (Post C2)
1 2 3 4
Summary of Recommendations
18
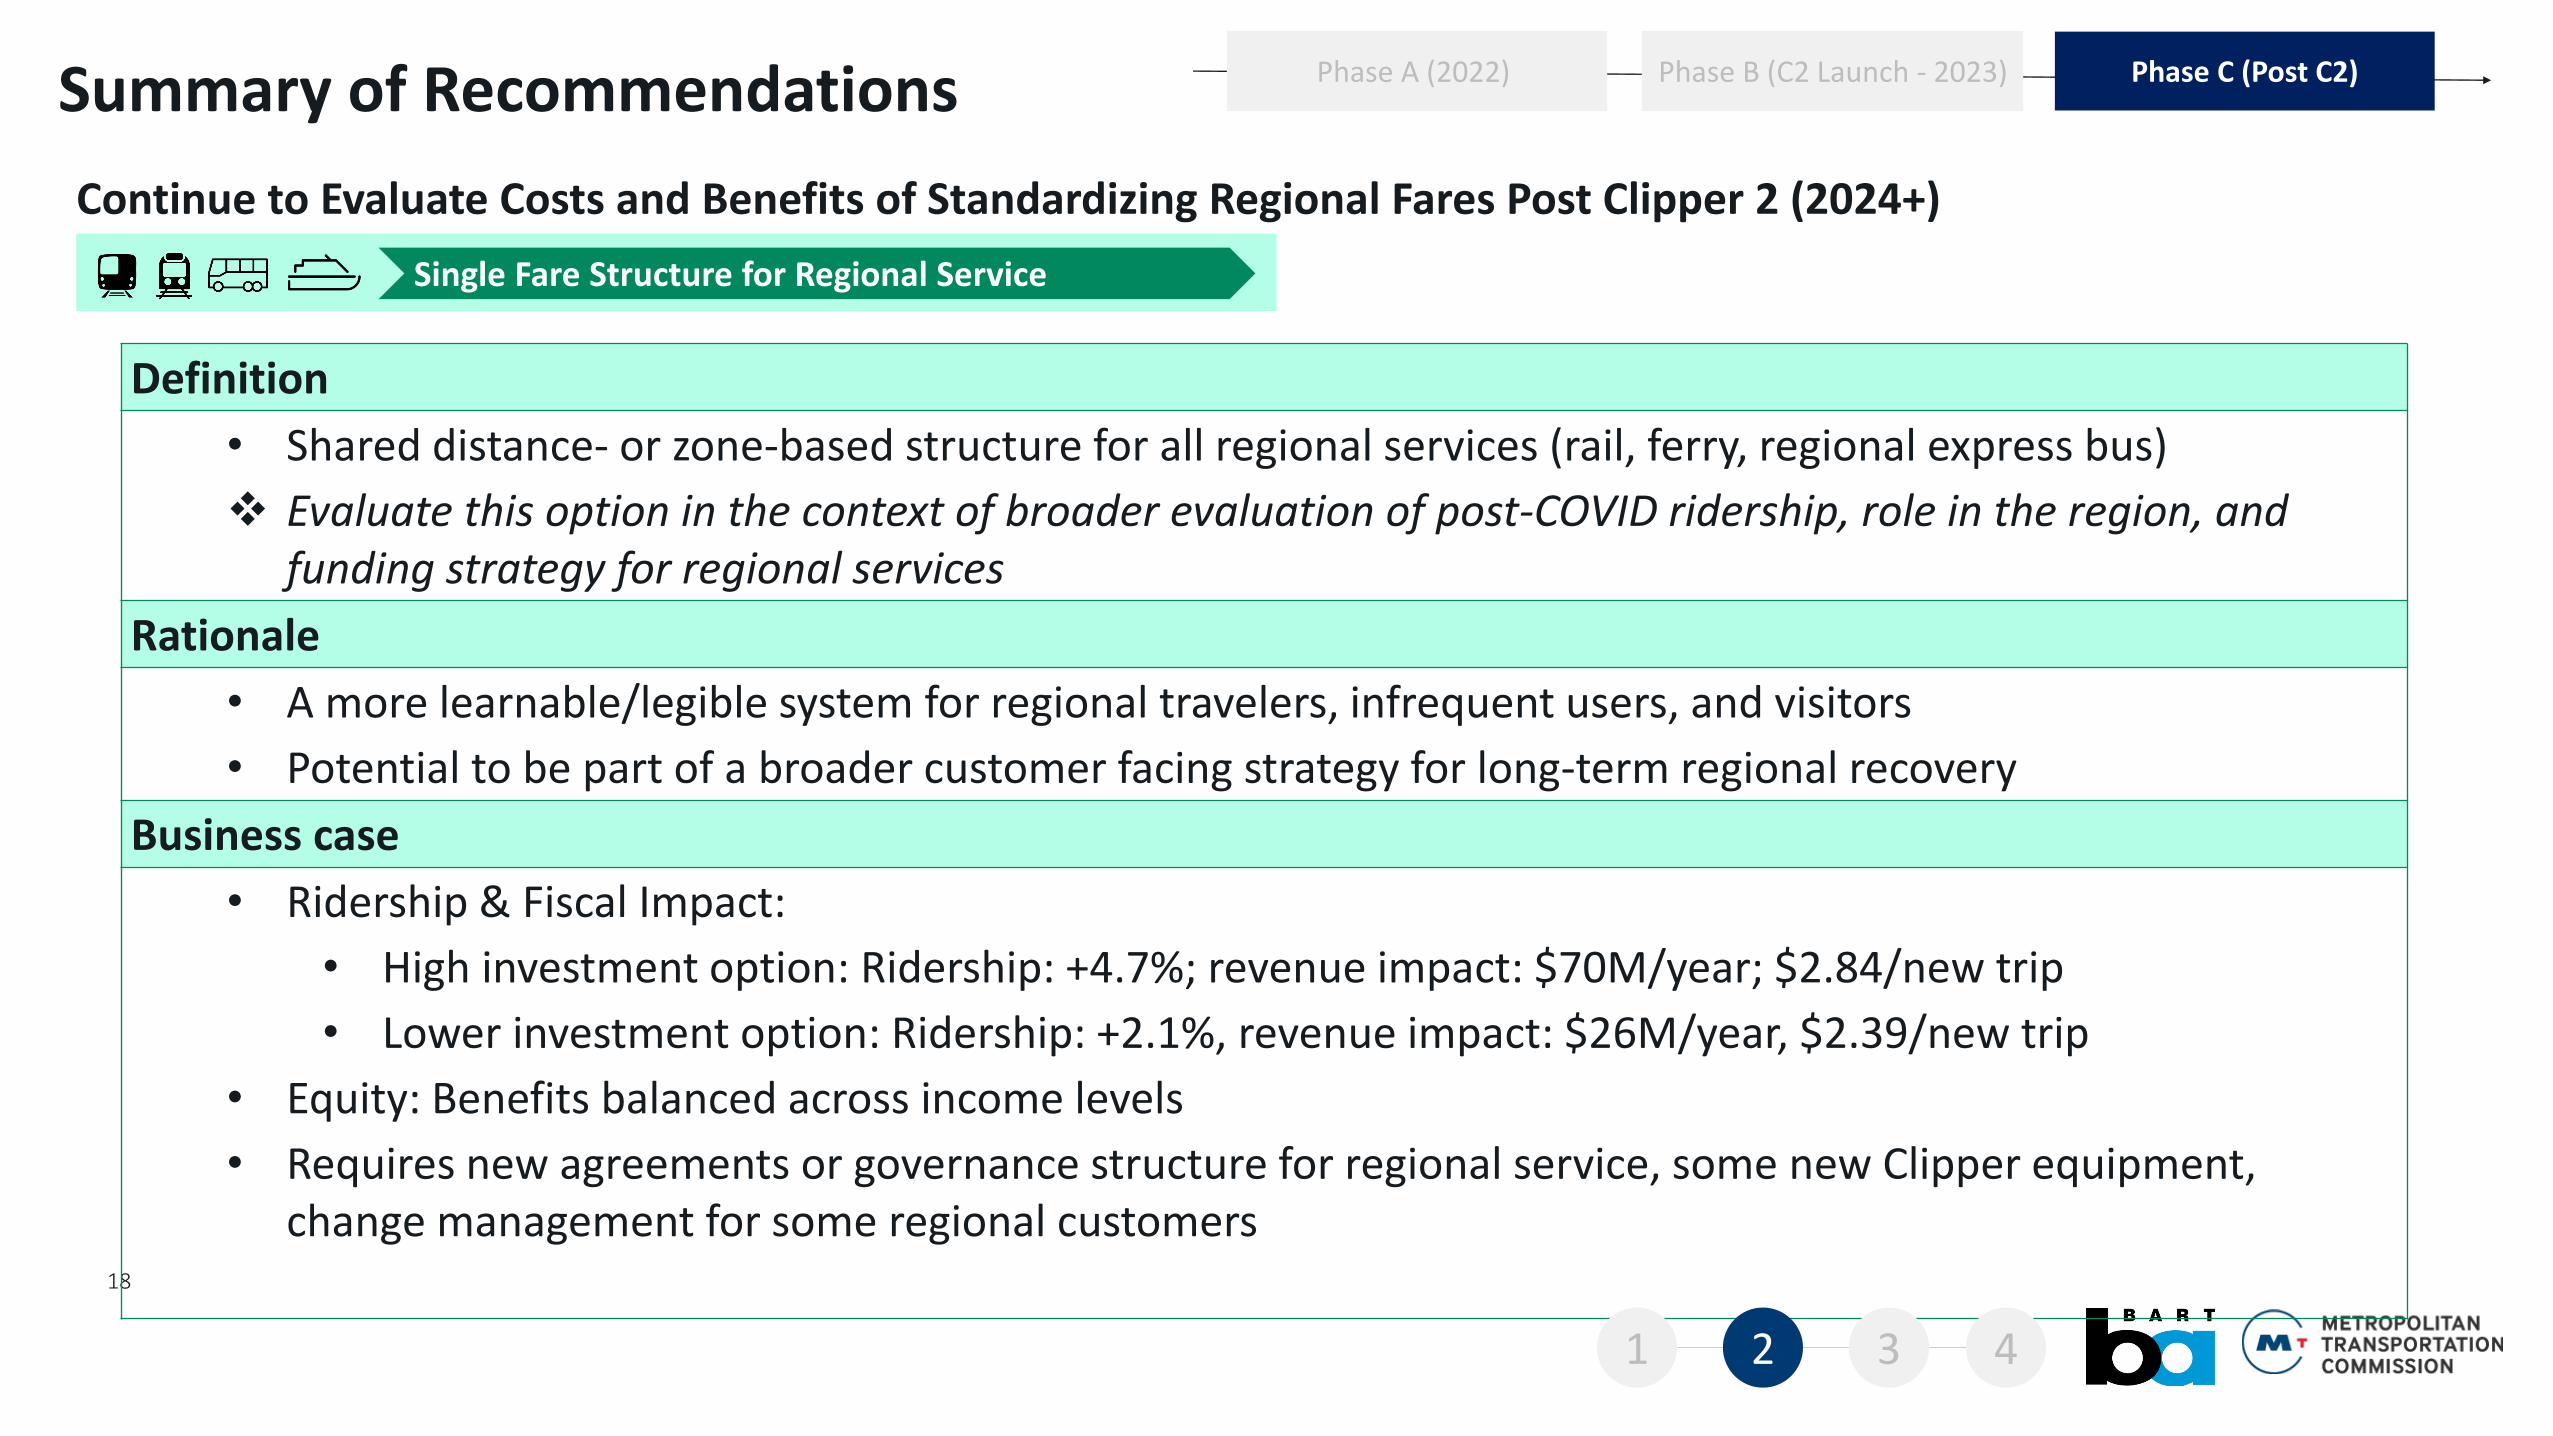
Continue to Evaluate Costs and Benefits of Standardizing Regional Fares Post Clipper 2 (2024+)
Definition
• Shared distance- or zone-based structure for all regional services (rail, ferry, regional express bus)
❖ Evaluate this option in the context of broader evaluation of post-COVID ridership, role in the region, and funding strategy for regional services
Rationale
• A more learnable/legible system for regional travelers, infrequent users, and visitors
• Potential to be part of a broader customer facing strategy for long-term regional recovery
Business case
• Ridership & Fiscal Impact:
• High investment option: Ridership: +4.7%; revenue impact: $70M/year; $2.84/new trip
• Lower investment option: Ridership: +2.1%, revenue impact: $26M/year, $2.39/new trip
• Equity: Benefits balanced across income levels
• Requires new agreements or governance structure for regional service, some new Clipper equipment, change management for some regional customers
Phase B (C2 Launch - 2023)Phase A (2022) Phase C (Post C2)
1 2 3 4
Single Fare Structure for Regional Service
Summary of Recommendations
19
No-cost transfers region-wide
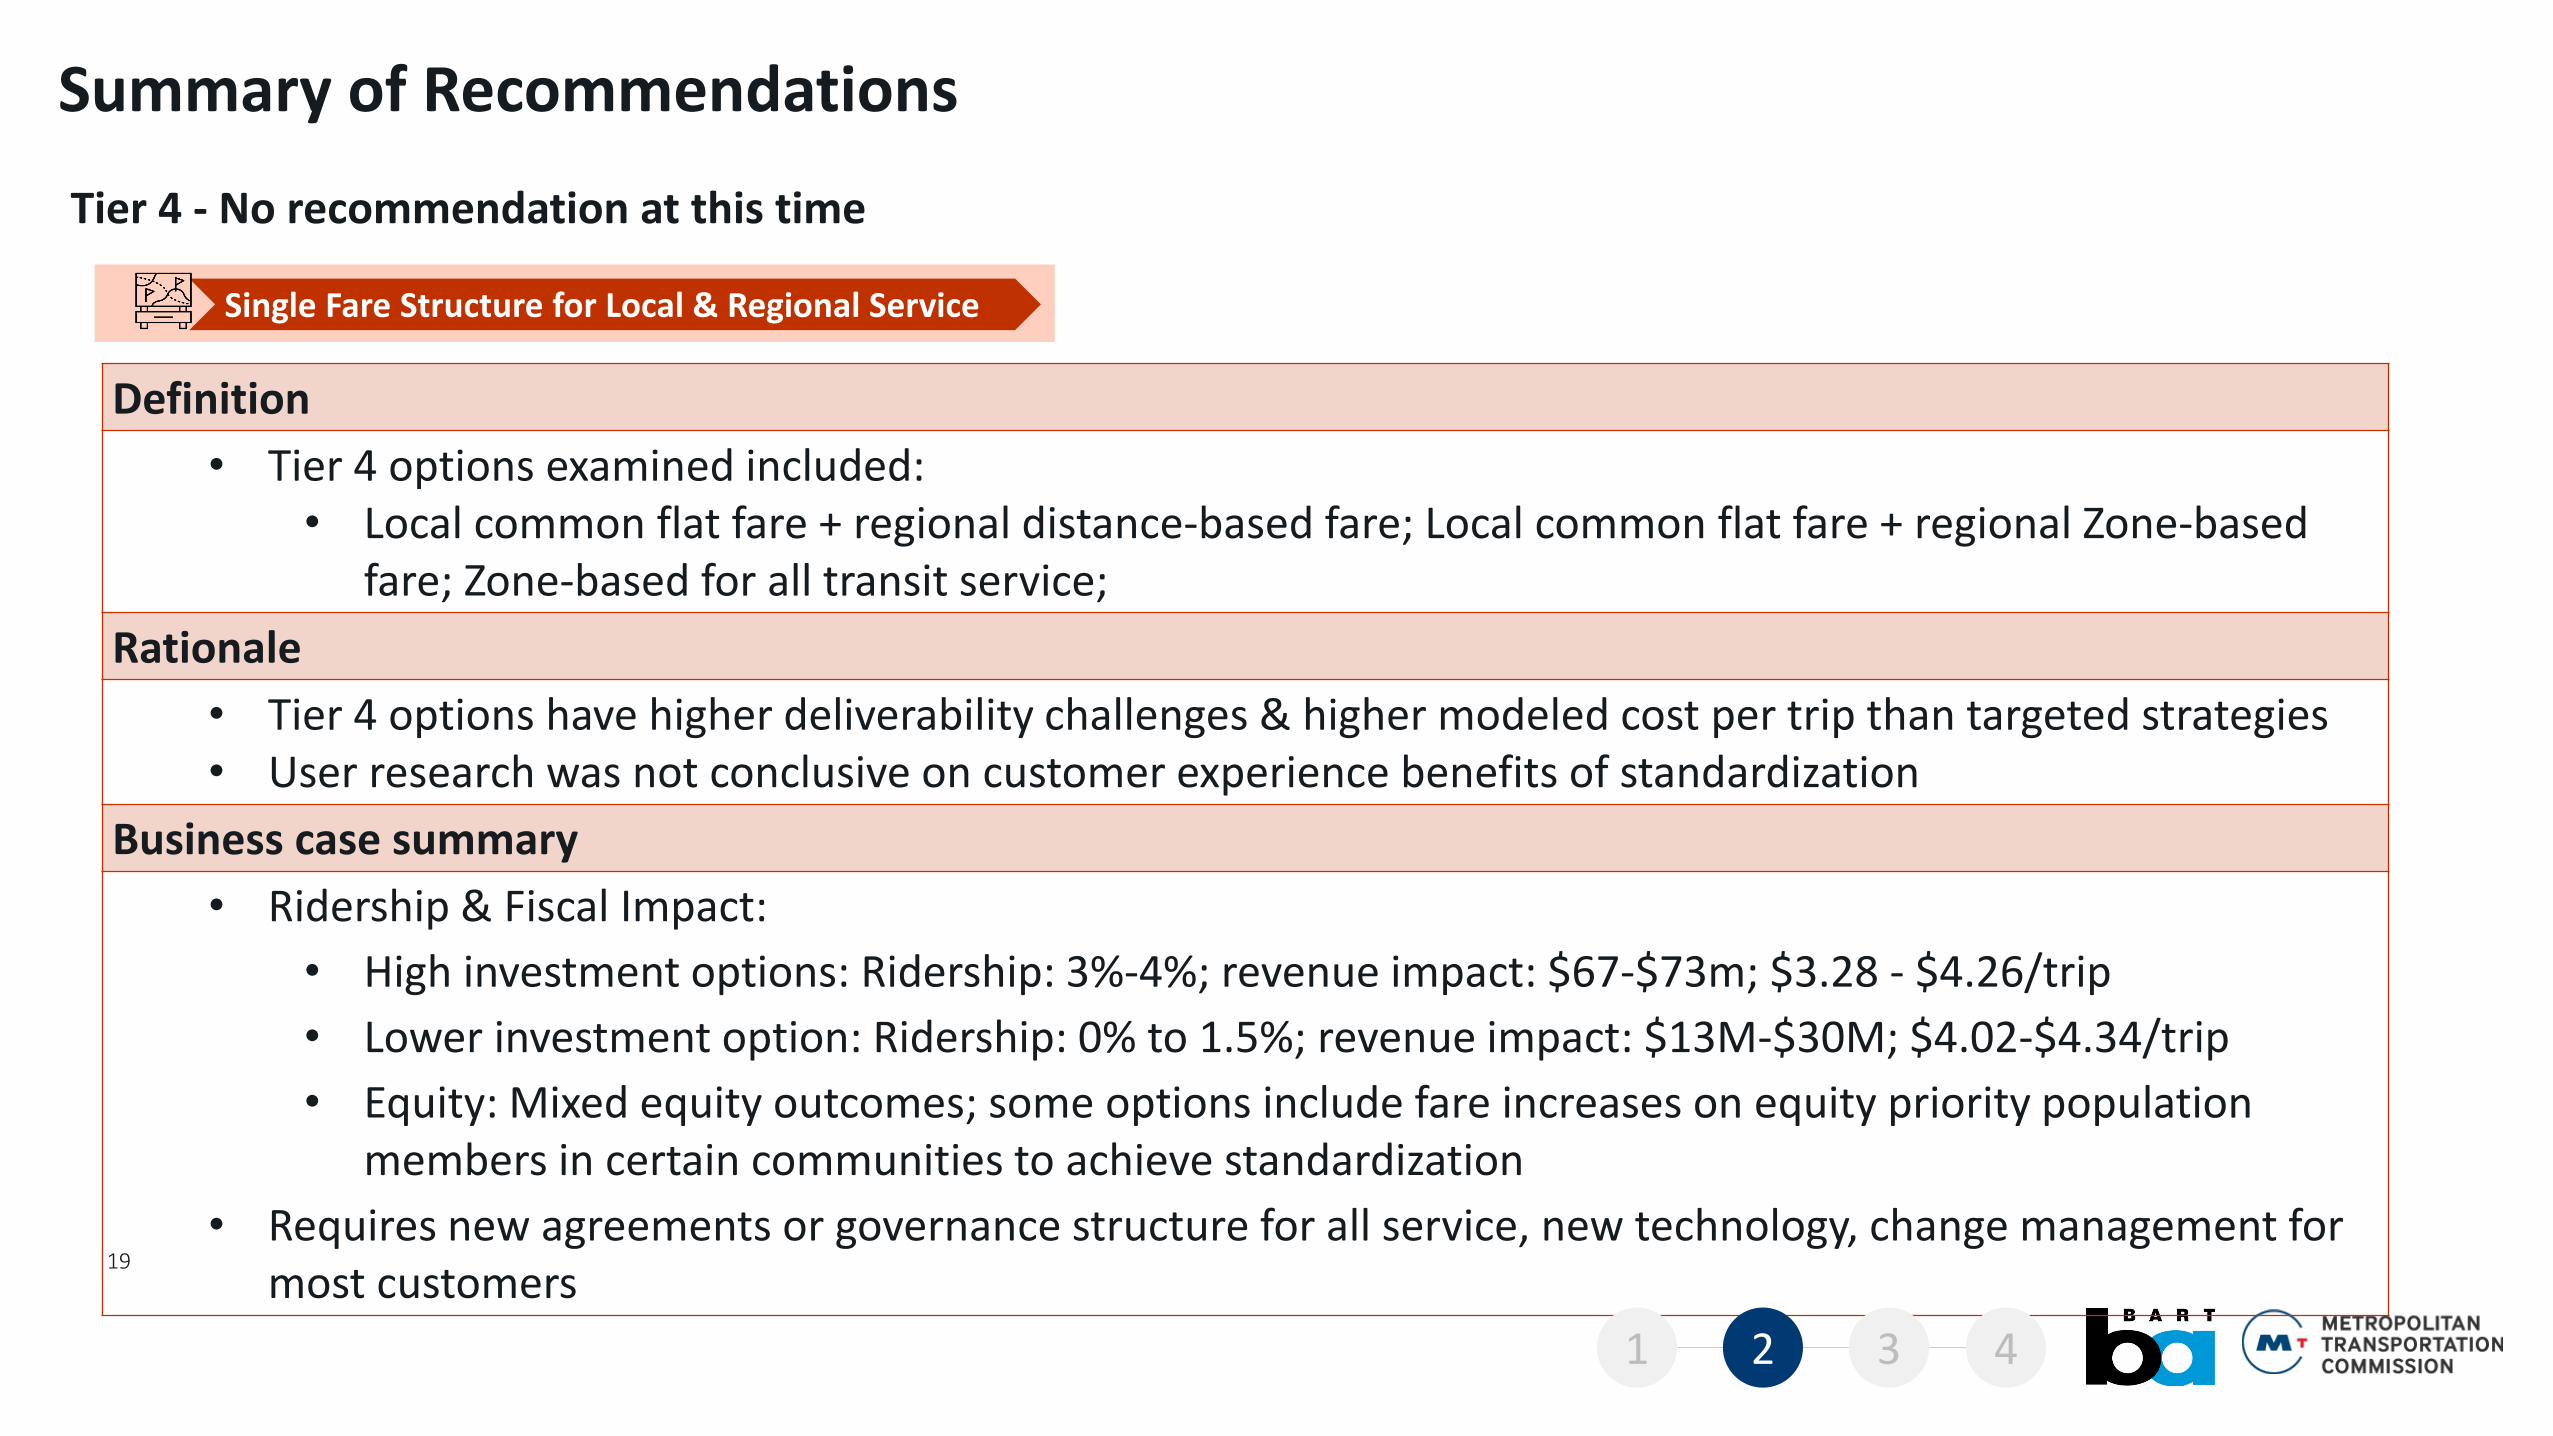
Tier 4 - No recommendation at this time
Single Fare Structure for Local & Regional Service
Definition
• Tier 4 options examined included: • Local common flat fare + regional distance-based fare; Local common flat fare + regional Zone-based
fare; Zone-based for all transit service;
Rationale
• Tier 4 options have higher deliverability challenges & higher modeled cost per trip than targeted strategies• User research was not conclusive on customer experience benefits of standardization
Business case summary
• Ridership & Fiscal Impact:
• High investment options: Ridership: 3%-4%; revenue impact: $67-$73m; $3.28 - $4.26/trip
• Lower investment option: Ridership: 0% to 1.5%; revenue impact: $13M-$30M; $4.02-$4.34/trip
• Equity: Mixed equity outcomes; some options include fare increases on equity priority population members in certain communities to achieve standardization
• Requires new agreements or governance structure for all service, new technology, change management for most customers
1 2 3 4
Summary of Key Business Case Metrics3
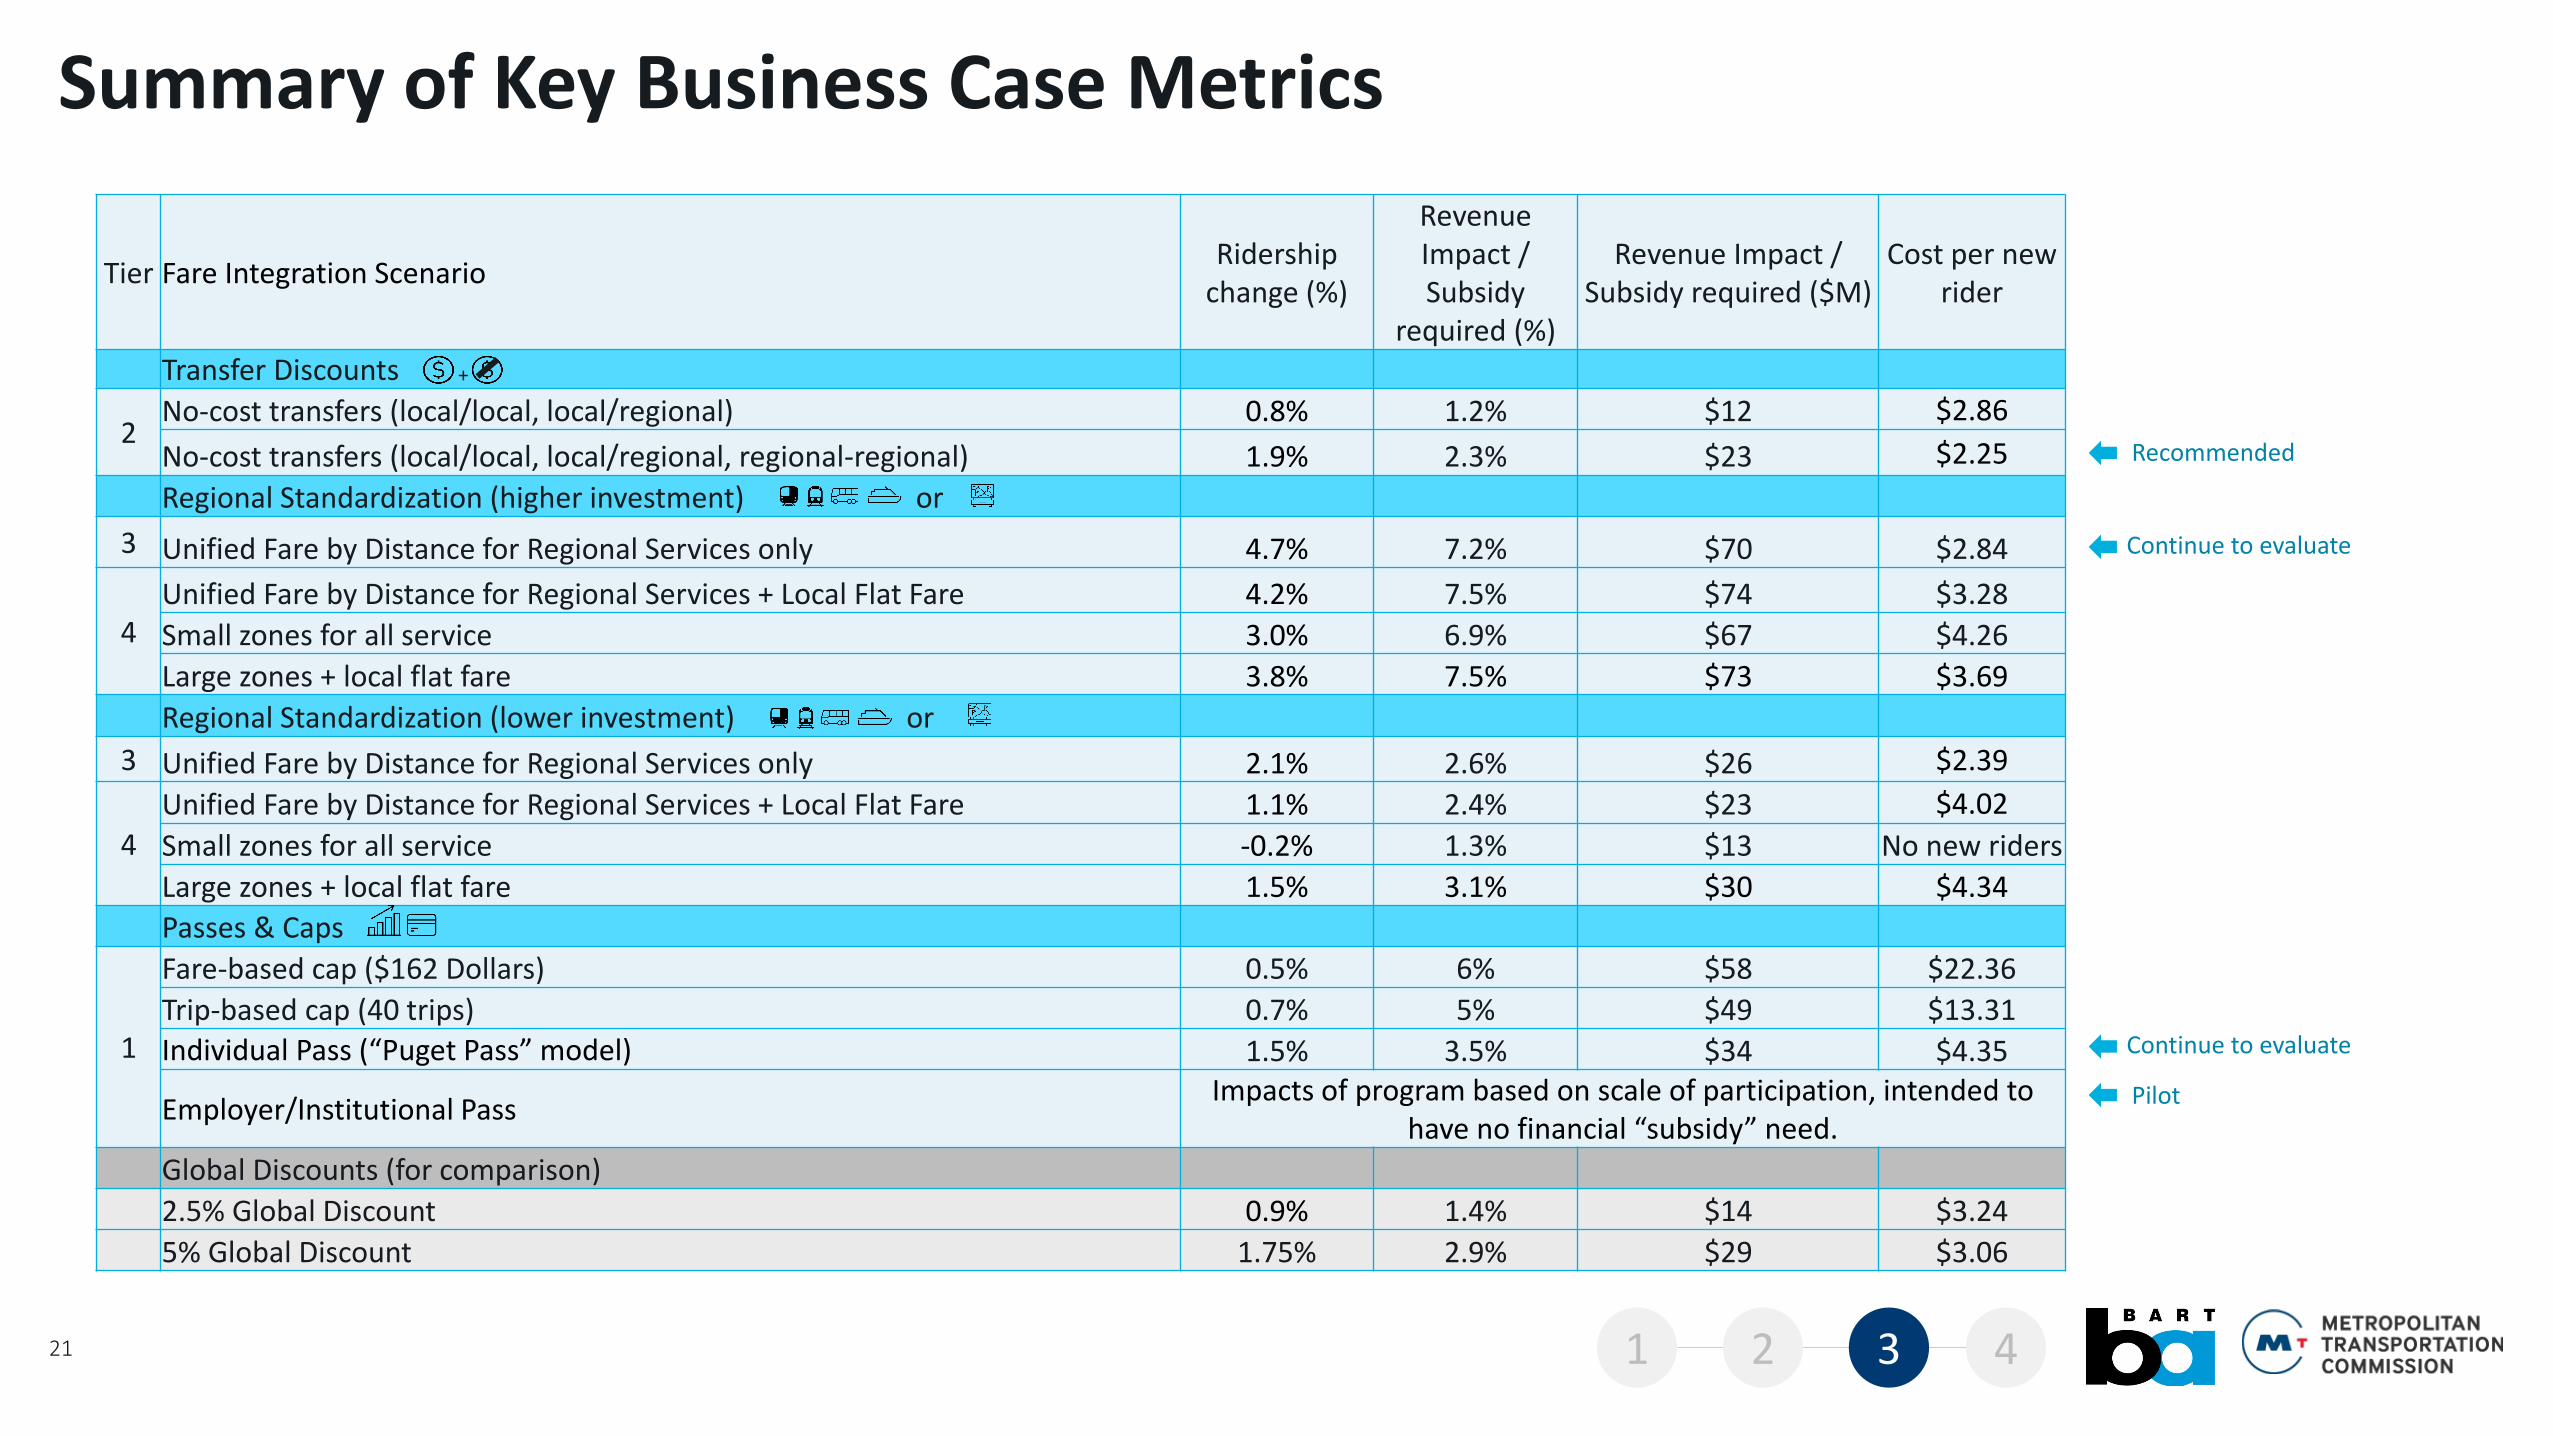
Fare Integration Cost Efficiency vs Other Investment Options
21
Tier Fare Integration ScenarioRidership
change (%)
Revenue Impact / Subsidy
required (%)
Revenue Impact / Subsidy required ($M)
Cost per new rider
Transfer Discounts
2No-cost transfers (local/local, local/regional) 0.8% 1.2% $12 $2.86
No-cost transfers (local/local, local/regional, regional-regional) 1.9% 2.3% $23 $2.25
Regional Standardization (higher investment) or
3 Unified Fare by Distance for Regional Services only 4.7% 7.2% $70 $2.84
4Unified Fare by Distance for Regional Services + Local Flat Fare 4.2% 7.5% $74 $3.28
Small zones for all service 3.0% 6.9% $67 $4.26
Large zones + local flat fare 3.8% 7.5% $73 $3.69
Regional Standardization (lower investment) or
3 Unified Fare by Distance for Regional Services only 2.1% 2.6% $26 $2.39
4
Unified Fare by Distance for Regional Services + Local Flat Fare 1.1% 2.4% $23 $4.02
Small zones for all service -0.2% 1.3% $13 No new riders
Large zones + local flat fare 1.5% 3.1% $30 $4.34
Passes & Caps
1
Fare-based cap ($162 Dollars) 0.5% 6% $58 $22.36
Trip-based cap (40 trips) 0.7% 5% $49 $13.31
Individual Pass (“Puget Pass” model) 1.5% 3.5% $34 $4.35
Employer/Institutional PassImpacts of program based on scale of participation, intended to
have no financial “subsidy” need.
Global Discounts (for comparison)
2.5% Global Discount 0.9% 1.4% $14 $3.24
5% Global Discount 1.75% 2.9% $29 $3.06
Summary of Key Business Case Metrics
1 2 3 4
+
Recommended
Continue to evaluate
Continue to evaluate
Pilot
Fare Integration Cost Efficiency vs Other Investment Options
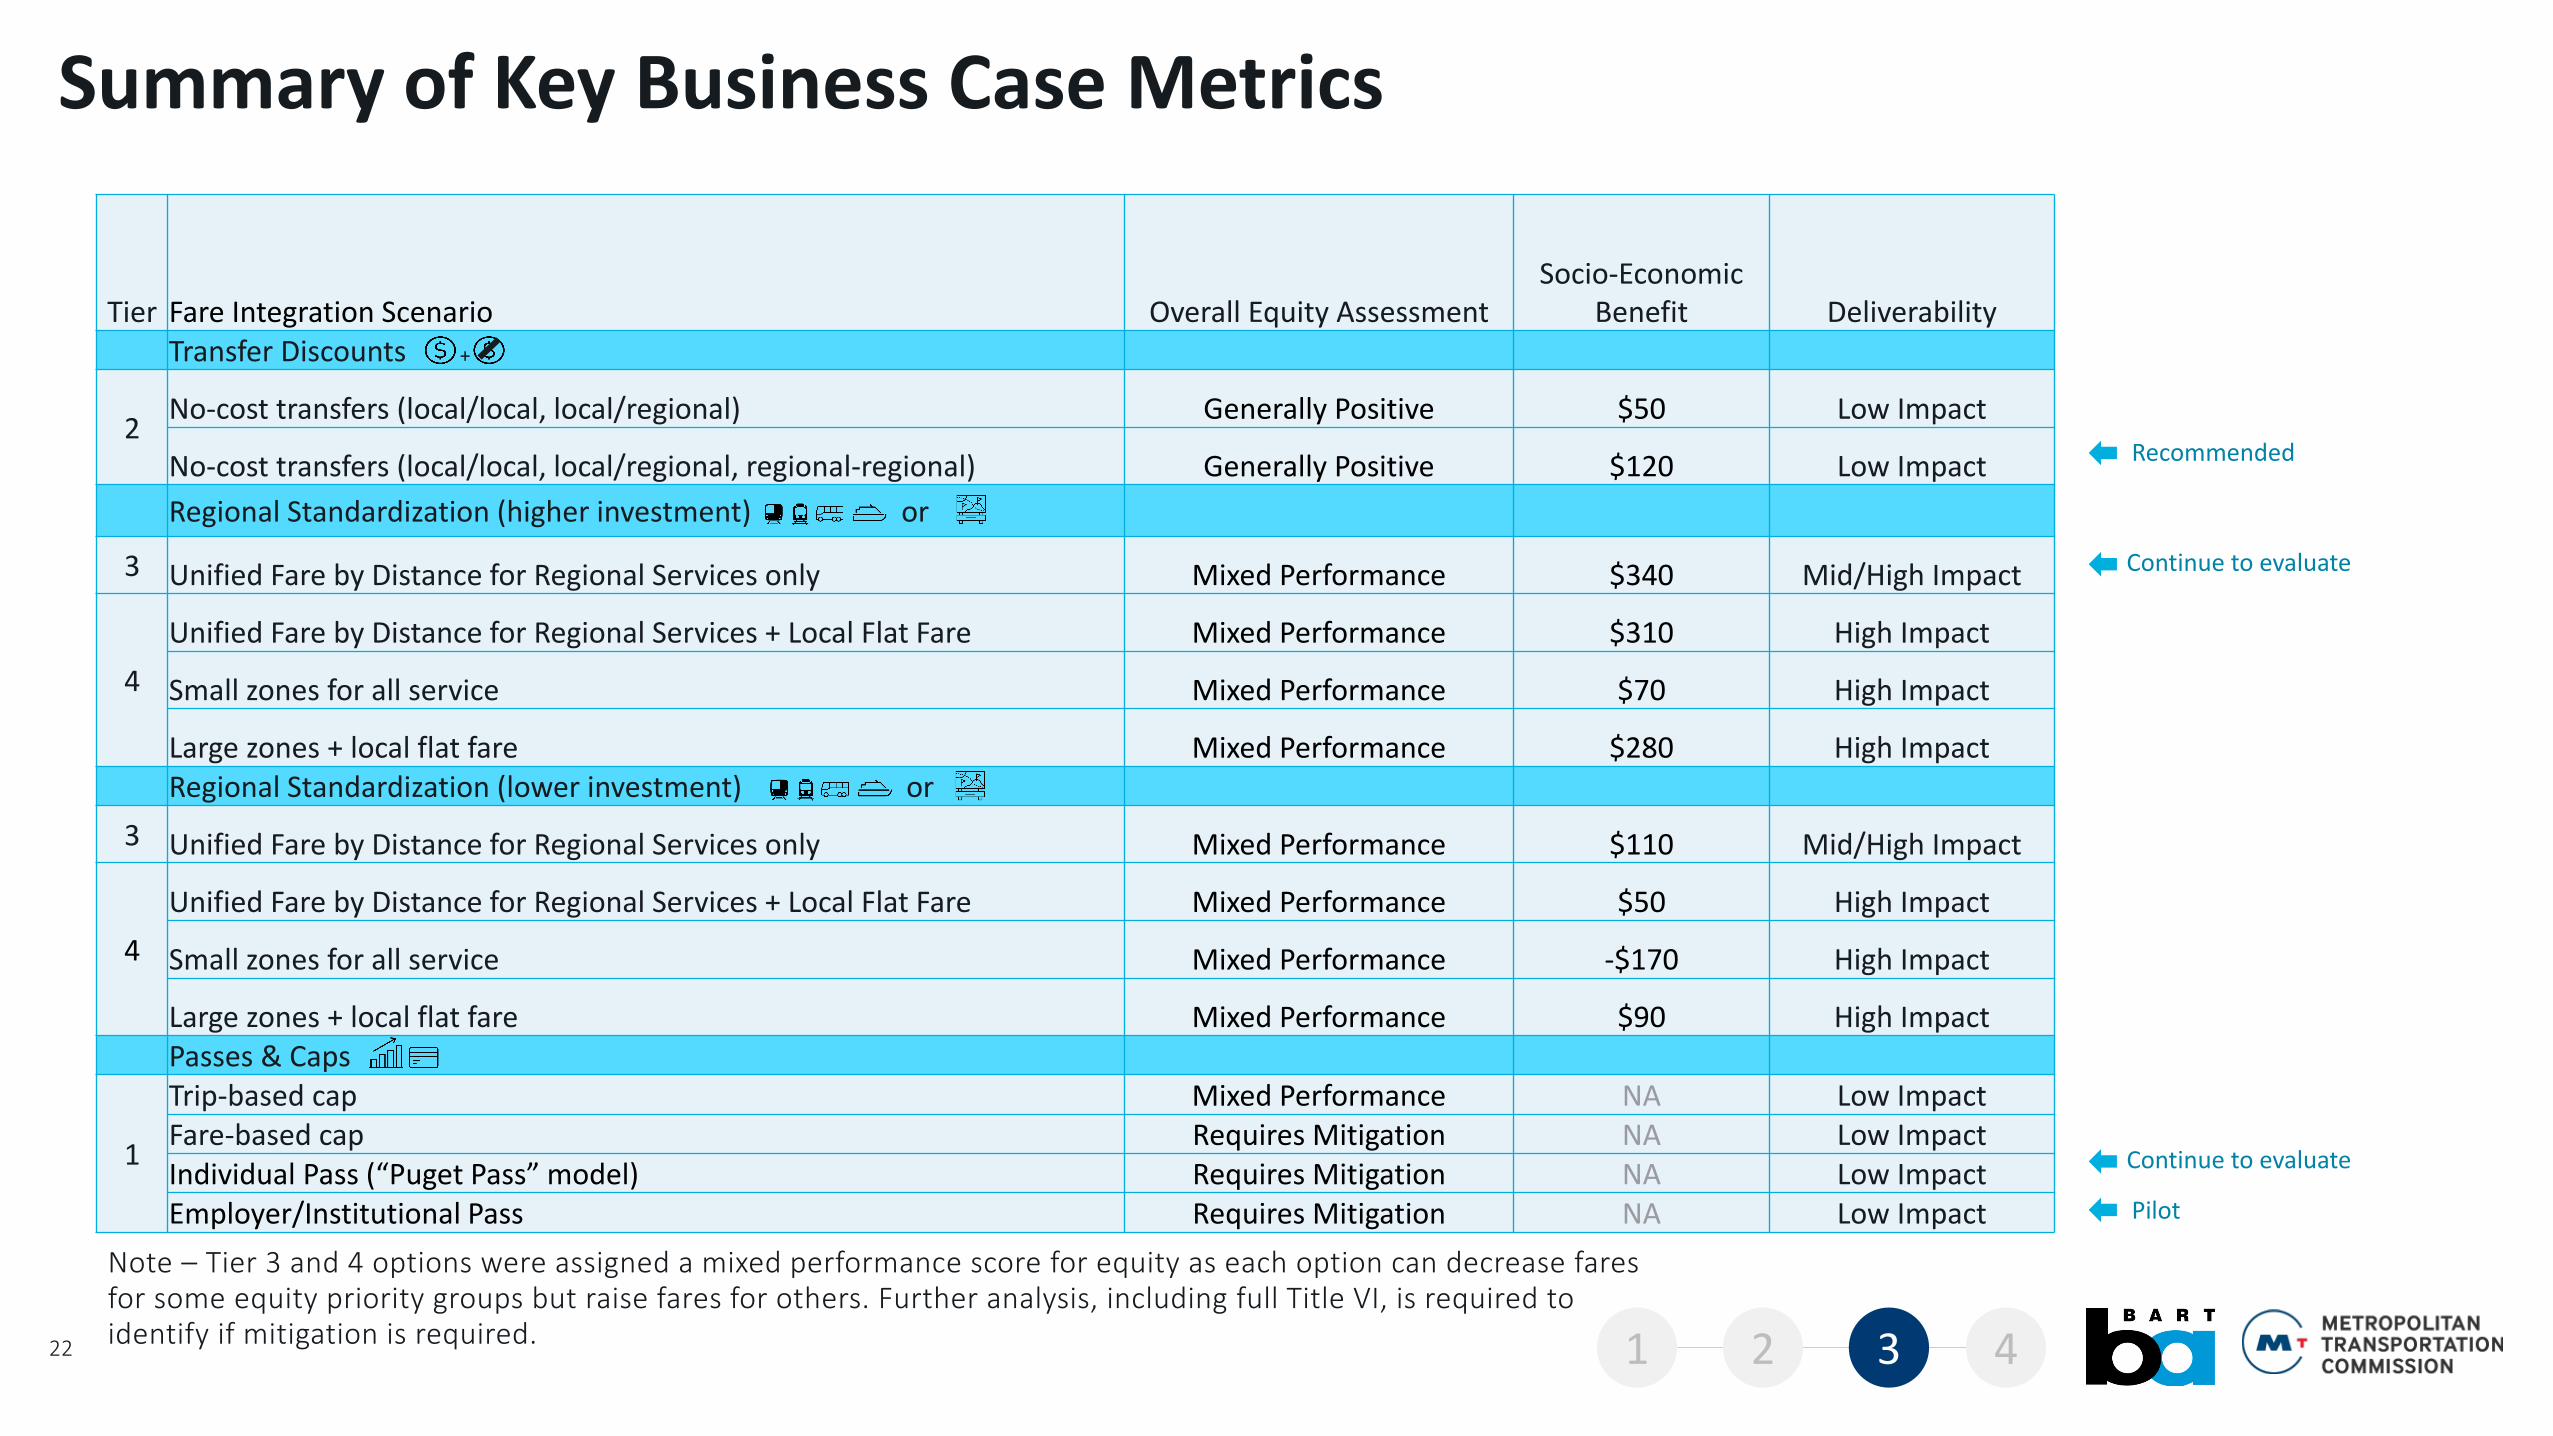
Note – Tier 3 and 4 options were assigned a mixed performance score for equity as each option can decrease fares for some equity priority groups but raise fares for others. Further analysis, including full Title VI, is required to identify if mitigation is required.
22
Tier Fare Integration Scenario Overall Equity AssessmentSocio-Economic
Benefit DeliverabilityTransfer Discounts
2No-cost transfers (local/local, local/regional) Generally Positive $50 Low Impact
No-cost transfers (local/local, local/regional, regional-regional) Generally Positive $120 Low Impact
Regional Standardization (higher investment) or
3 Unified Fare by Distance for Regional Services only Mixed Performance $340 Mid/High Impact
4
Unified Fare by Distance for Regional Services + Local Flat Fare Mixed Performance $310 High Impact
Small zones for all service Mixed Performance $70 High Impact
Large zones + local flat fare Mixed Performance $280 High ImpactRegional Standardization (lower investment) or
3 Unified Fare by Distance for Regional Services only Mixed Performance $110 Mid/High Impact
4
Unified Fare by Distance for Regional Services + Local Flat Fare Mixed Performance $50 High Impact
Small zones for all service Mixed Performance -$170 High Impact
Large zones + local flat fare Mixed Performance $90 High ImpactPasses & Caps
1
Trip-based cap Mixed Performance NA Low ImpactFare-based cap Requires Mitigation NA Low ImpactIndividual Pass (“Puget Pass” model) Requires Mitigation NA Low ImpactEmployer/Institutional Pass Requires Mitigation NA Low Impact
Recommended
Continue to evaluate
Summary of Key Business Case Metrics
Pilot
1 2 3 4
+
Continue to evaluate
Recommended Near Term Actions4
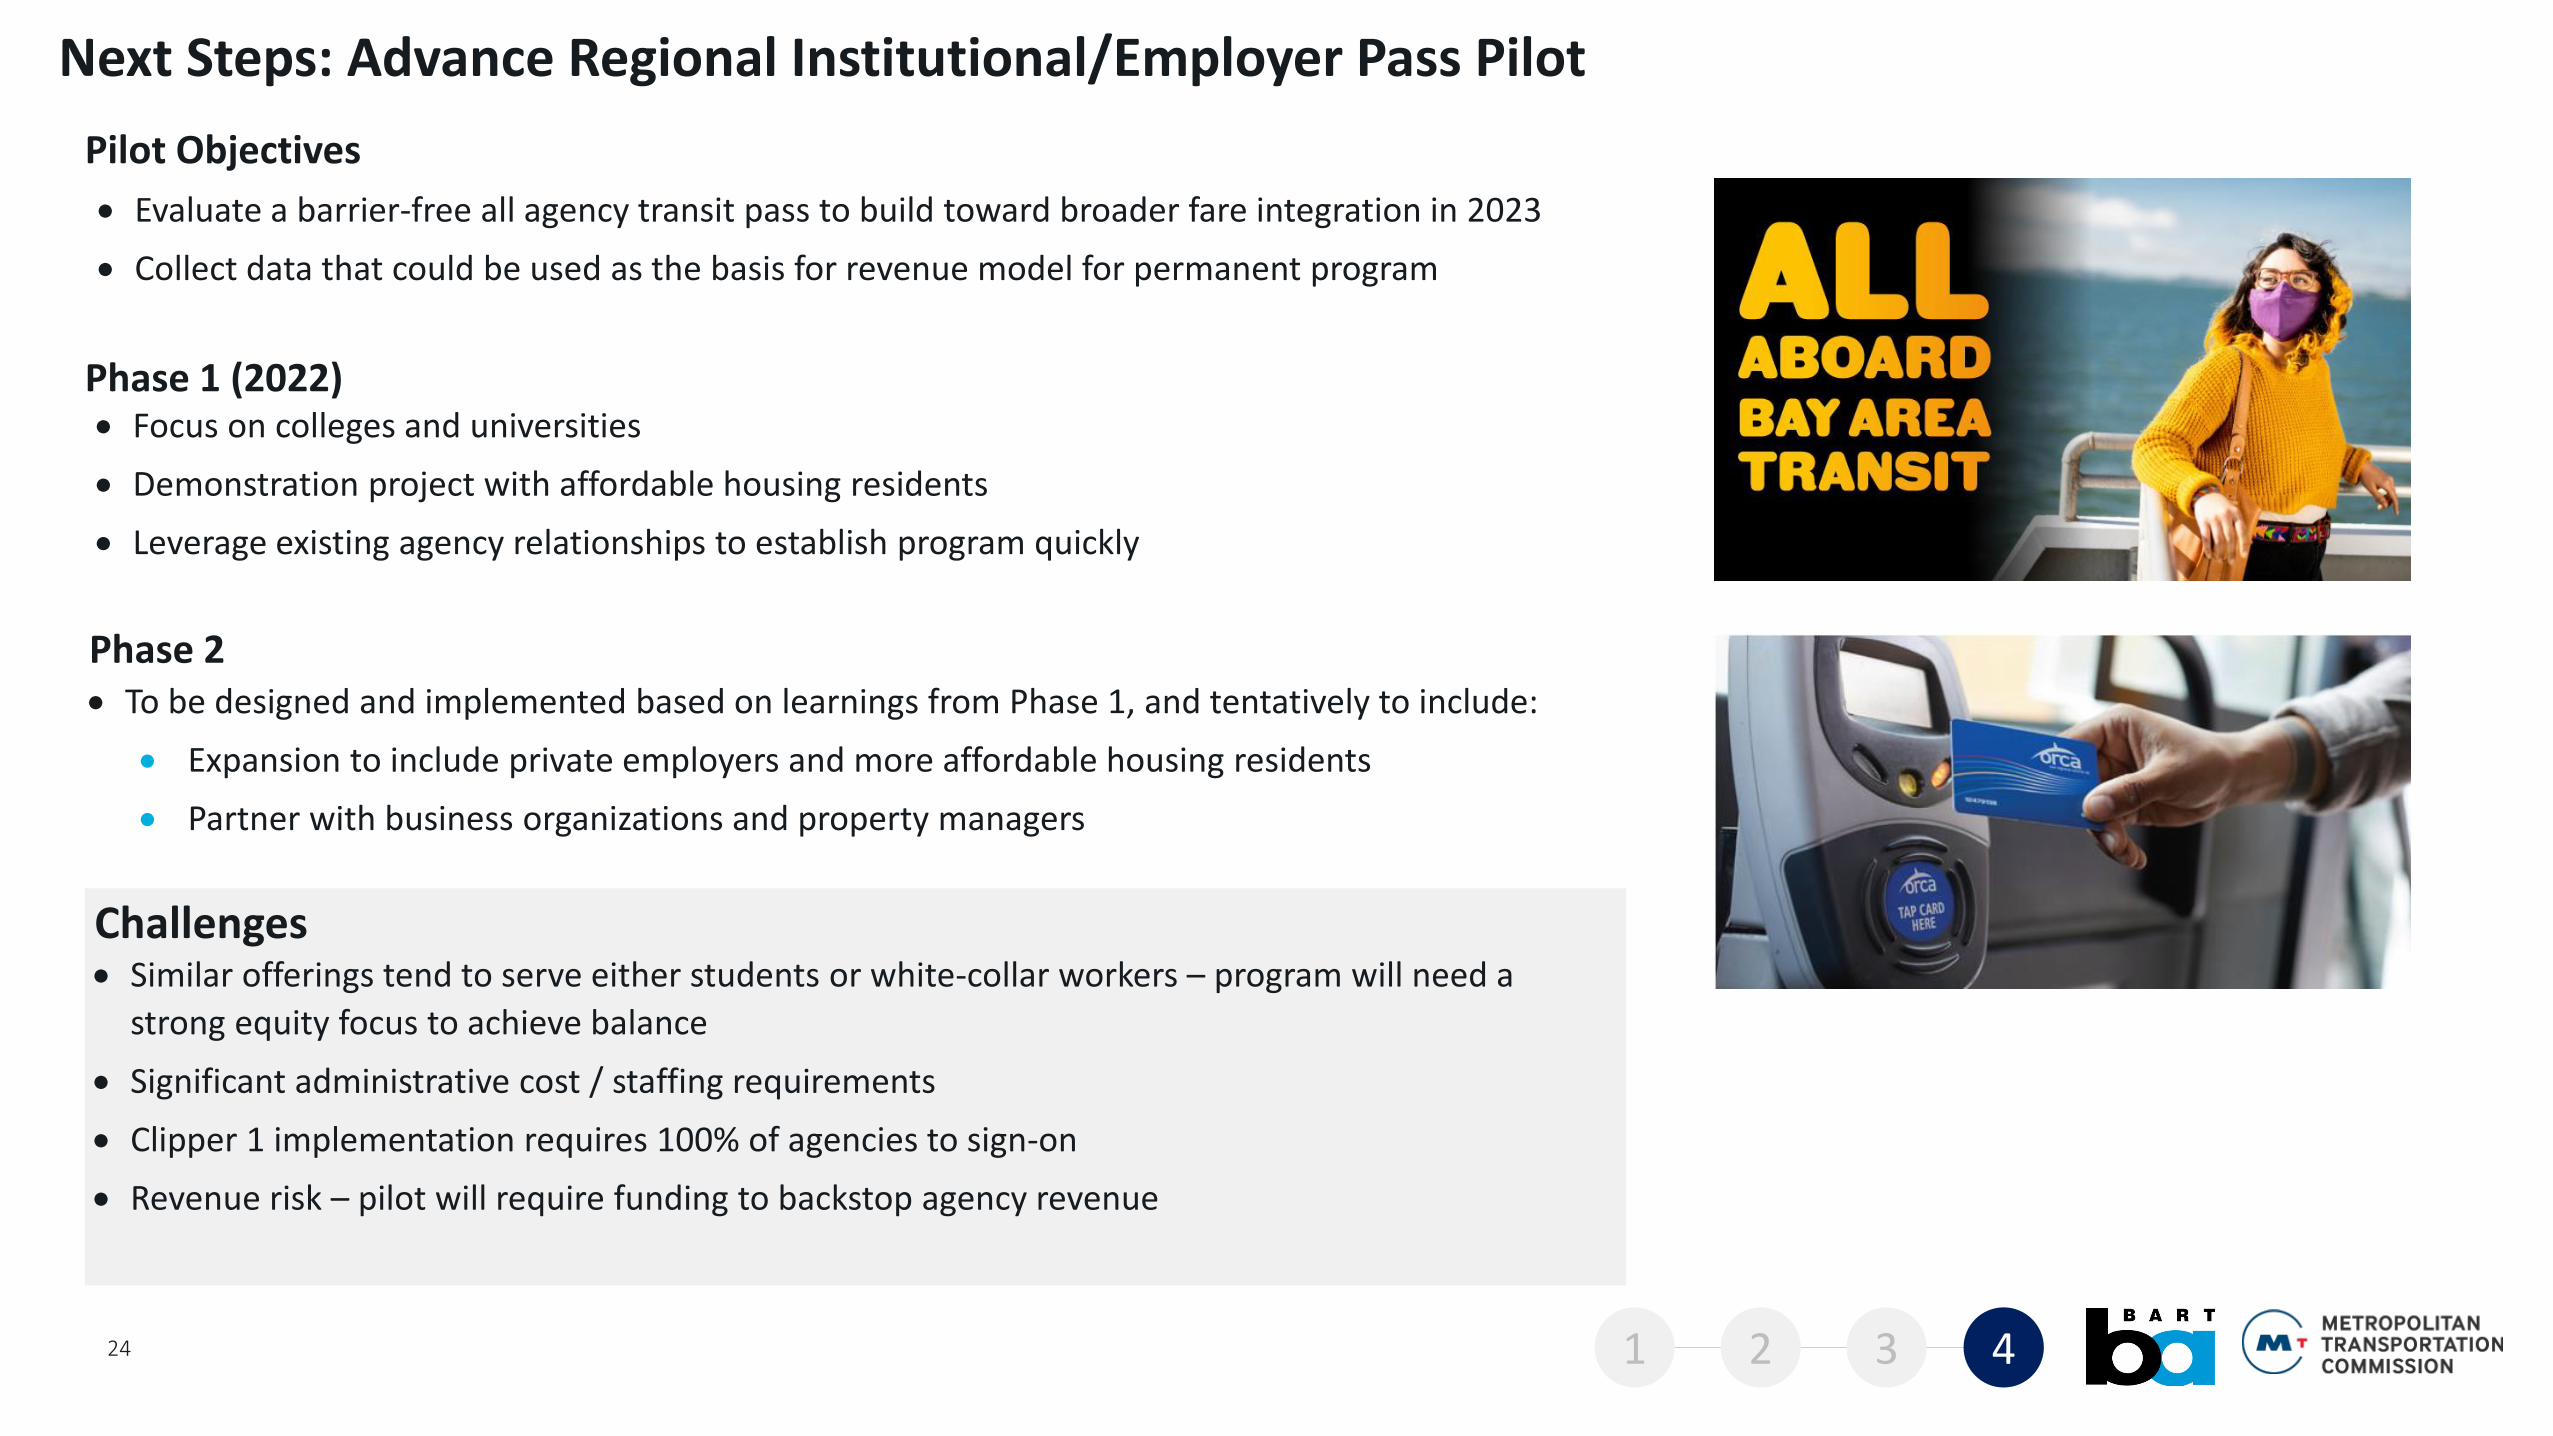
Phase 1 (2022)
24
• Focus on colleges and universities
• Demonstration project with affordable housing residents
• Leverage existing agency relationships to establish program quickly
Next Steps: Advance Regional Institutional/Employer Pass Pilot
Phase 2 • To be designed and implemented based on learnings from Phase 1, and tentatively to include:
• Expansion to include private employers and more affordable housing residents
• Partner with business organizations and property managers
Challenges• Similar offerings tend to serve either students or white-collar workers – program will need a
strong equity focus to achieve balance
• Significant administrative cost / staffing requirements
• Clipper 1 implementation requires 100% of agencies to sign-on
• Revenue risk – pilot will require funding to backstop agency revenue
• Evaluate a barrier-free all agency transit pass to build toward broader fare integration in 2023
• Collect data that could be used as the basis for revenue model for permanent program
Pilot Objectives
1 2 3 4
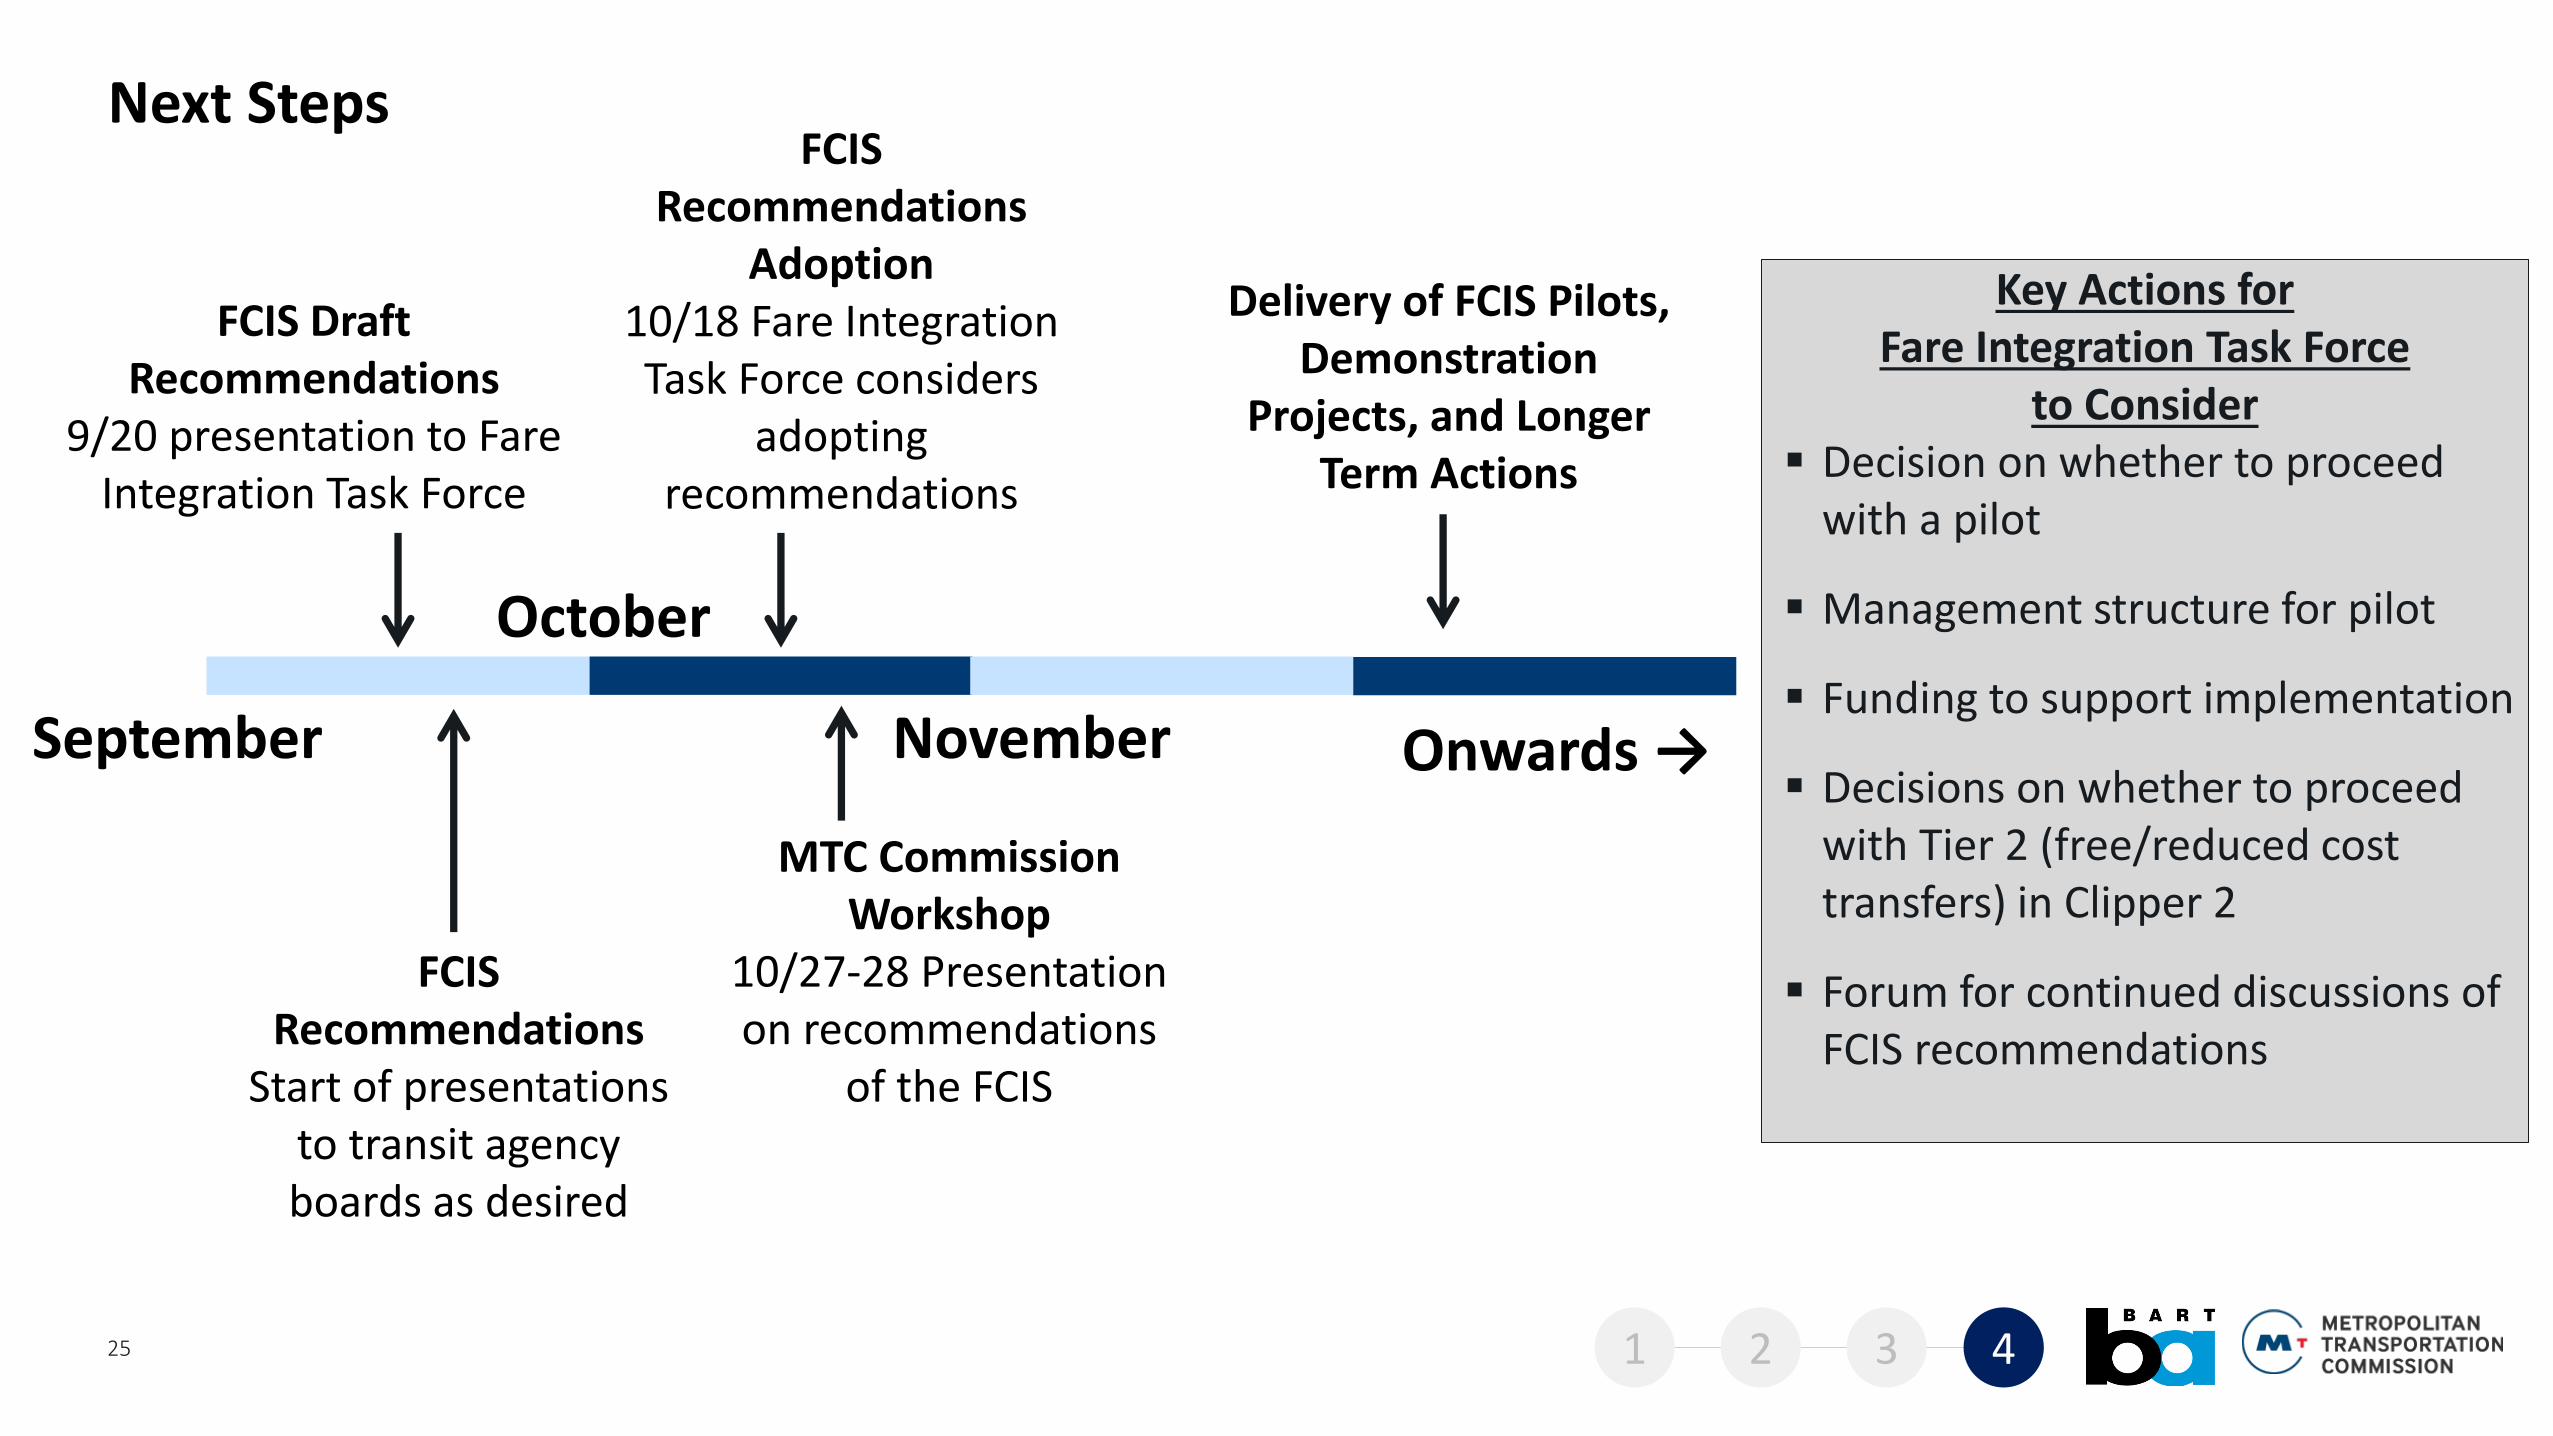
Next Steps
September Onwards →
FCIS Draft Recommendations
9/20 presentation to Fare Integration Task Force
FCIS Recommendations
Start of presentations to transit agency boards as desired
October
FCIS Recommendations
Adoption10/18 Fare Integration Task Force considers
adopting recommendations
Delivery of FCIS Pilots, Demonstration
Projects, and Longer Term Actions
November
25
MTC Commission Workshop
10/27-28 Presentation on recommendations
of the FCIS
1 2 3 4
Key Actions for Fare Integration Task Force
to Consider▪ Decision on whether to proceed
with a pilot
▪ Management structure for pilot
▪ Funding to support implementation
▪ Decisions on whether to proceed with Tier 2 (free/reduced cost transfers) in Clipper 2
▪ Forum for continued discussions of FCIS recommendations