Embed Size (px)
Citation preview

Baxter International Inc.
2012 Annual Report

R&D Investment(dollars in millions)
Cash Dividends Declared(per common share)
Financial Highlights
Revenues(dollars in billions)
$12.
320
08
$12.
620
09
$12.
820
10
$13.
920
11
$14.
220
12
Earnings per Diluted Share
(adjusted)1
2008
$3.3
8
2009
$3.8
0
2010
$3.9
8
2011
$4.3
1
2012
$4.5
3
Cash Flow from Operations(dollars in billions)
2008
$2.5
2009
$2.9
2010
$3.0
2011
$2.8
2012
$3.1
5-Year Total Shareholder Return
(including dividends)
2008
$868
2009
$917
2010
$915
2011
$946
2012
$1,1
56
2008
$0.9
13
2009
$1.0
70
2010
$1.1
80
2011
$1.2
65
2012
$1.5
70
Do
w J
on
es13
.8%
S&
P 5
008.
6%
S&
P H
C26
.4%
Bax
ter
28.0
%
About our Cover: Brian Navarro of Los Angeles, California, uses ADVATE [Antihemophilic Factor (Recombinant),
Plasma/Albumin-Free Method] to help prevent and control bleeding due to hemophilia A.
1 Represents earnings per diluted share (as calculated in accordance with generally accepted accounting principles (GAAP)), after adjusting earnings to exclude special items. Please see the company’s website at www.baxter.com for a reconciliation to earnings per diluted share.
2012 Sales by Region(dollars in millions)
United States
Latin Americaand Canada
Asia-Pacific
Europe, Middle East and Africa
$6,056
$4,196
$2,229
$1,709
Medical Products3
2012 Sales by Business(dollars in millions)
BioScience2
2 Includes Recombinants, Antibody Therapy, Plasma Proteins, Regenerative Medicine and Other BioScience
3 Includes Renal, Global Injectables, IV Therapies, Infusion Systems, Anesthesia and Other Medical Products
$6,237 $7,953
Dear Shareholders,
The success of Baxter International Inc. in 2012 reflects
our ongoing momentum in pursuit of our mission to
save and sustain lives. We remain focused on building
a truly great company, capable of advancing outcomes
through innovation, effective execution and new ways
of doing business. The decisions and investments we
are making now will help ensure our ability to address
the needs of our wide-ranging stakeholder base today,
tomorrow and for decades to come.
1
Bax
ter
Inte
rnat
iona
l Inc
. 20
12 A
nnua
l Rep
ort

2
Rising to Tomorrow’s Challenges
The impact of today’s challenging macro- economic climate continues to be felt across the healthcare landscape, and we expect this dynamic to continue. From global cost containment pressures and access constraints to shifting patient demographics, we are in the midst of a significant transformation in how the healthcare industry operates and its many constituencies interact.
But just as we are realistic about today’s challenges, we also recognize many ongoing and emerging opportunities to enhance care and advance the business — and Baxter is uniquely positioned to respond successfully. Baxter’s focus on medically necessary products and therapies ensures continuing demand for the company’s diverse portfolio despite a challenging macroeconomic climate. And, in line with building a great company, we are charting a course that will deliver results today while helping strengthen Baxter for the future.
2012 Financial Performance
Baxter’s 2012 worldwide sales were $14.2 billion, an increase of 2 percent over 2011 sales on a reported basis. The company’s net income of $2.3 billion, or $4.18 per diluted share, compares to net income of $2.2 billion, or $3.88 per diluted share, in 2011.
In 2012 Baxter’s investment in research and development (R&D) rose to almost $1.2 billion, reflecting an increase of more than 20 percent from 2011.
Excluding the impact of foreign currency, sales grew 5 percent in 2012. On an adjusted basis, excluding special items in both years, earnings per diluted share rose 5 percent, to $4.53.* Cash flow from operations rose 10 percent and totaled more than $3.1 billion, a record level.
Baxter’s Four Strategic Growth Vectors
Baxter’s solid financial performance in 2012 demonstrates the soundness of the company’s underlying strategic priorities — the same priorities that are the platform for the company’s future growth.
We serve the interests of a multitude of stakeholders in our mission to save and sustain lives. Patients and healthcare providers depend on us for products of exceptional quality and innovation addressing crucial unmet needs. Governments, insurers and other business partners rely on our ongoing collaboration. Our employees seek opportunities to pursue meaningful work and rewarding careers. The communities where we do business are counting on us for economic impact and environmental stewardship. And our shareholders seek and deserve an attractive return on their investment.
The only way we can provide long-term value for our stakeholders is by driving sustainable growth across multiple dimensions of our business. Baxter’s four strategic growth vectors provide a clear roadmap for making it happen. They reflect key pathways to drive innovation and advance the business for the long term.
Vector 1: Core Portfolio
The most fundamental way to grow the business is by taking full advantage of the global growth potential of our core portfolio. Baxter’s wide-ranging product base, focused on nondiscretionary needs — including many under-diagnosed and under-treated conditions, such as end-stage renal disease, hemophilia and immune deficiencies — provides many opportunities for ongoing expansion.
Emerging markets continue to represent Baxter’s greatest opportunity for international growth. Approximately 20 percent of Baxter’s revenue now comes from emerging markets, and this is expected to increase to 30 percent within the next five years. Baxter is advancing its presence in emerging markets through key product approvals and launches, while simultaneously supporting the growth of the core portfolio in developed markets worldwide. Among Baxter’s 2012 highlights, the company:
• Received approval in China for ADVATE Octocog alfa (Recombinant Human Coagulation Factor VIII) for the control and prophylaxis of bleeding episodes in individuals with hemophilia A, with an expected launch in 2013.
• Launched a new prophylaxis indication for ADVATE [Antihemophilic Factor (Recombinant), Plasma/Albumin-Free Method] in the United States, supporting the prevention of bleeds, in addition to treatment after bleeds occur.
• Introduced a new 4000 IU dosage strength of ADVATE in the United States, broadening the most comprehensive range of doses available for enhanced patient convenience.
• Launched NUMETA (emulsion for infusion) and OLIMEL (Amino Acids, Dextrose and Lipids, with/without Electrolytes) triple-chamber nutrition systems in multiple markets across Europe, Latin America and Asia-Pacific.
• Received U.S. Food and Drug Administration (FDA) approval for FLOSEAL Hemostatic Matrix to include needle-free preparation, enhancing safety and convenience for healthcare providers employing the product in a variety of surgical scenarios.
• Broadened our global leadership position in anesthesia with the launch of DESFORANE (Desflurano) in Brazil (sold as SUPRANE (Desflurane, USP) in the United States).
*Adjusted earnings per diluted share, excluding special items, is a non-GAAP measure. The company believes that this non-GAAP measure, when used in conjunction with results presented in accordance with GAAP, may provide a more complete understanding of the company’s operations and may facilitate a fuller analysis of the company’s results of operations, particularly in evaluating performance from one period to another. Please see the company’s website at www.baxter.com for reconciliations of the non-GAAP measures to their respective GAAP measures.
Baxter’s focus on
medically necessary
products and therapies
ensures continuing
demand for the
company’s diverse
portfolio.

3
Bax
ter
Inte
rnat
iona
l Inc
. 20
12 A
nnua
l Rep
ort
And Baxter continues to invest in manufacturing capacity to support future growth of its existing portfolio. In August the company began construction of a new, state-of-the-art plasma fractionation facility in Covington, Georgia, to help address anticipated rising demand for Baxter’s plasma-derived therapies, including GAMMAGARD LIQUID [Immune Globulin Infusion (Human)] 10% (marketed as KIOVIG Human Normal Immunoglobulin (IVIg) outside the United States and Canada) and albumin products. The facility is expected to create more than 1,500 new U.S. jobs in Georgia, plus many more new roles through the extension of Baxter’s plasma collection capabilities.
In addition, work progresses on Baxter’s expansion in Singapore, which will significantly increase manufacturing capacity for ADVATE; and construction has begun to expand capacity in Halle/Westfalen, Germany, supporting the growth of Baxter’s BioPharma Solutions business.
Vector 2: Research and Development
Innovation is the lifeblood of growth in today’s marketplace, and Baxter’s increasing investment in R&D reflects this fact. This investment has more than doubled since 2005. The result is the most robust product pipeline in the company’s history. At the close of 2012, Baxter had 18 products in Phase III development—more than tripling the number of Phase III pipeline programs since 2007—plus many others in earlier stages. These include high-potential new products and line extensions across our BioScience and Medical Products businesses, addressing key areas of unmet patient need. Among our many 2012 R&D milestones, Baxter:
• Received FDA approval for an expanded indication of GAMMAGARD LIQUID to include treatment for multifocal motor neuropathy.
• Initiated the second of two Phase III trials evaluating the use of GAMMAGARD LIQUID for the treatment of mild to moderate Alzheimer’s disease.
• Advanced clinical trials on the VIVIA home hemodialysis (HD) system, supporting the administration of High-Dose HD in the home setting.
• Submitted a biologics license application to the FDA for BAX 326, a recombinant factor IX protein being investigated for the treatment and prophylaxis of bleeding episodes for patients over 12 years of age with hemophilia B.
• Completed Phase I clinical trials of BAX 855, a longer-acting recombinant factor VIII protein for the treatment of hemophilia A based on the full-length ADVATE [Antihemophilic Factor (Recombinant), Plasma/Albumin-Free Method] molecule.
• Continued the United States and European regulatory approval processes for HyQ, a facilitated subcutaneous immunoglobulin therapy for patients with immune deficiencies.
• Initiated a Phase III clinical trial evaluating the efficacy and safety of adult autologous (an individual’s own) CD34+ stem cells to increase exercise capacity in patients with chronic myocardial ischemia.
• Initiated a Phase I clinical trial of a fully human, recombinant anti-MIF (anti-macrophage migra-tion inhibitory factor) monoclonal antibody to treat patients having malignant solid tumors.
Vector 3: Business Development
Baxter has accelerated its pace of acquisitions and collaborations in recent years; and we have also become more adept at identifying, closing and integrating these arrangements.
In December Baxter announced an agreement to acquire Gambro AB, a longstanding innovator in dialysis treatment. This acquisition, which is expected to close at the end of the second quarter of 2013, will transform our presence in renal care. Gambro’s emphasis on in-center hemodialysis and acute care therapies forms an exceptional complement to Baxter’s own focus on home-based dialysis technologies. This transaction positions us to offer a comprehensive array of dialysis options at a time when the global need continues to rise.
While the Gambro announcement stands out in scale, it is only one of the business development opportunities Baxter has pursued in areas of critical patient need. In 2012 we additionally:
• Acquired Synovis Life Technologies, Inc., a leading provider of biological and mechanical products used for soft tissue repair and microsurgery procedures.
• Completed the purchase of Sigma International General Medical Apparatus, LLC (SIGMA); Baxter purchased its initial stake in 2009 when we became the exclusive global distributor of SIGMA’s smart infusion pump technology.
• Entered an exclusive agreement with Chatham Therapeutics, LLC, to develop and commer- cialize potential treatments for hemophilia B based on Chatham’s Biological Nano Particles™ gene therapy technology.
• Announced a European licensing agreement with Onconova Therapeutics, Inc., for the novel targeted anti-cancer compound rigosertib.
• Made a range of equity investments through our Baxter Ventures initiative in companies developing high-potential technologies in such areas as autoimmune diseases, end-stage renal disease, allergic asthma and a form of acute depression that frequently leads patients to seek emergency room treatment.
Our four strategic
growth vectors reflect
key pathways to
drive innovation and
advance the business
for the long term.

4
Vector 4: Public-Private Partnerships
Baxter is also committed to innovating new models for doing business that respond to today’s market challenges.
Governments have never been under greater pressure to control costs, even as they pursue parallel measures to increase healthcare access and improve patient outcomes. Baxter is focused on creative solutions that seek to address these concerns through public-private collaborations focused on widening the availability of leading technologies, controlling costs and fueling local economic opportunity. Baxter’s leadership in a broad range of high-priority, nondis-cretionary therapies makes us a compelling partner positioned to make a significant impact. In 2012 Baxter:
• Announced an exclusive 20-year partnership with Hemobrás (Empresa Brasileira de Hemo- derivados e Biotechnologia) that will greatly increase access to recombinant factor VIII therapy for Brazil’s hemophilia A patients.
• Began construction of a new peritoneal dialysis manufacturing facility in Thailand, supporting that country’s “PD First” program to reinforce peritoneal dialysis as Thailand’s first-line dialysis treatment.
• Announced a partnership with China’s National Institute of Hospital Administration under the Ministry of Health to help improve access to peritoneal dialysis in China’s rural communities.
• Completed an agreement with Stichting Sanquin Bloedvoorziening (Sanquin Blood Supply Foundation) of the Netherlands that will provide additional plasma fractionation capacity in support of global demand for Baxter’s plasma-derived therapies.
Corporate Social Responsibility
Baxter’s continued growth is central to advancing our social and environmental priorities. Our aspiration of being a truly great company embraces our commitment to responsible corporate citizenship and passion for making a difference in people’s lives. Baxter and The Baxter International Foundation support worthy causes around the world through product donations, financial support and thriving employee volunteerism. We are focused on improving access to healthcare, responding to natural disasters, and improving math and science education, among other concerns. We are also pursuing efforts at sites worldwide to reduce our carbon footprint and use natural resources more efficiently.
As a result of these efforts, Baxter is frequently recognized for its sustainability leadership. In 2012 Baxter was ranked as the Medical Products Industry Leader on the Dow Jones Sustainability
Index, our 14th consecutive year on the index and 11th as industry leader. We also ranked first in the healthcare category in Newsweek magazine’s U.S. Green Rankings for the fourth consecutive year.
Creating Shareholder Value
By successfully positioning the business for the long term while addressing the needs of our diverse stakeholder base, we are able to deliver increasing value for our investors. Baxter returned approximately $2.3 billion to shareholders in 2012 through dividends totaling approximately $800 mil- lion and share repurchases of approximately $1.5 billion (or approximately 25 million shares).
Baxter announced in July 2012 a new annualized dividend rate of $1.80 per share, representing an increase of more than 34 percent over the previous annual rate. With the support of Baxter’s consistently strong balance sheet and cash flow, the company’s annual dividend has nearly doubled since 2008. Over the last five years, Baxter’s disciplined capital allocation strategy resulted in approximately $11 billion returned to shareholders cumulatively through dividends and share repurchases.
A Strong Future in Service of Patients
With the exceptional contributions and commitment of more than 50,000 employees worldwide, Baxter is prepared to fulfill its mission in 2013 and many years to come.
Our core emphasis on lifesaving therapies provides a foundation for growth in both mature and emerging markets. Our investment in innovation is advancing an outstanding R&D pipeline in key areas of unmet need. We are pursuing collaborations — through business development and government partnerships —that are helping us reach more patients and serve them in new ways. And all these efforts are bolstered by Baxter’s absolute focus on quality and efficiency throughout the company.
These are the building blocks that ensure Baxter’s ability to make a difference for patients — and in so doing, achieve sustained success on behalf of our many stakeholders. This, more than anything else, is what resides at the heart of our enduring aspiration to be a truly great company in the service of saving and sustaining lives.
Robert L. Parkinson, Jr. Chairman and Chief Executive Officer February 28, 2013
Our strong financial
position allows us to
significantly increase
our R&D investment
while continuing
to reward our
shareholders.

5
Bax
ter
Inte
rnat
iona
l Inc
. 20
12 A
nnua
l Rep
ort
Access, Innovation, Collaboration
Left: Namita Taneja of New Delhi,
India, uses Baxter peritoneal
dialysis products to treat her
end-stage renal disease.
Below: Pier Cristoforo Giulianotti,
M.D., is the Lloyd Nyhus Professor
of Surgery and Chief of General,
Minimally Invasive and Robotic
Surgery at the University of Illinois
at Chicago College of Medicine.
He frequently employs TISSEEL
[Fibrin Sealant] to help control
patient bleeding in a range of
surgical procedures.
Baxter’s employees are united in a mission to save and sustain lives.
Millions of people worldwide count on this commitment every day. We
are passionate about meeting their needs – and also making our impact
felt even more broadly. Every day we are focused on increasing access
to Baxter products, innovating new technologies and pursuing creative
collaborations that bring our mission to life for more patients globally.

6
Left: Born prematurely at 29 weeks
and weighing less than one kilogram
(2.2 pounds), Matyas Jakub Balej
of Ústí nad Labem, Czech Republic,
was prescribed NUMETA (emulsion
for infusion) to address his nutritional
needs until he could tolerate non-
intravenous nutrition.
Below Left: Daniel Fleischanderl
of Baxter’s Orth, Austria, facility
researches new treatment options for
patients with bleeding disorders.
Below Right: Mario Duller of
Schnaitsee, Bavaria, Germany,
was diagnosed with primary
immunodeficiency as a one-year-old.
He currently infuses SUBCUVIA
160g/l Solution for Injection
subcutaneously to treat his condition.

7
Bax
ter
Inte
rnat
iona
l Inc
. 20
12 A
nnua
l Rep
ortAdvancing our Core Portfolio Globally
Addressing Demand for Plasma-Based Treatments
Baxter is a leading innovator of plasma-derived therapies used for treating a range of serious health conditions. The company’s global portfolio includes GAMMAGARD LIQUID [Immune Globulin Infusion (Human)] 10% and SUBCUVIA 160g/l Solution for Injection, immunoglobulin therapies used for treating patients with immune disorders. Baxter also produces albumin, used to treat burns and maintain adequate fluid volume in critical care patients, and alpha1-proteinase inhibitors to treat alpha-1 antitrypsin deficiency. (GAMMAGARD LIQUID is marketed as KIOVIG Human Normal Immunoglobulin (IVIg) outside the United States and Canada.)
To meet expected future demand for plasma-based therapies, Baxter initiated construction in August of a new, state-of-the-art plasma fractionation facility in Covington, Georgia. This capital investment will initially add up to 3 million liters of annual fractionation capacity to Baxter’s existing production levels when the plant is fully operational, while offering the flexibility to support further expansion as needs warrant. The new facility is expected to create more than 1,500 new jobs in Georgia, as well as additional new jobs through the expansion of Baxter’s plasma collection capabilities. Commercial operation is expected to begin in 2018.
Bringing ADVATE to More Hemophilia Patients Worldwide
In 2012 Baxter announced the approval in China of ADVATE Octocog alfa (Recombinant Human Coagulation Factor VIII) for the control and prophylaxis of bleeding episodes in individuals with hemophilia A. The product is expected to launch in 2013. ADVATE has now been approved in more than 55 countries and is the most widely chosen recombinant factor VIII product globally.
Also in 2012 the U.S. Food and Drug Administration (FDA) approved a new 4000 IU dosage strength of ADVATE [Antihemophilic Factor (Recombinant), Plasma/Albumin-Free Method]. The new strength provides the convenience of a single-vial dosing opportunity for many adult patients, including those on a dosing schedule of every three days for prophylactic treatment with ADVATE.
The use of factor VIII on a prophylactic basis is growing among U.S. patients, and is widely considered the optimal therapy for children. ADVATE is the only recombinant factor VIII approved in the United States for prophylactic use in both adults and children. This 2011 FDA approval was based on a study demonstrating that ADVATE prophylaxis significantly reduced the median annual bleed rate in patients with severe or moderately severe hemophilia A from 44 bleeds to one as compared with on-demand treatment, with 42 percent of patients experiencing no bleeds during one year of prophylaxis treatment. Two ADVATE prophylaxis treatments are approved, one of which may offer some patients the option of fewer infusions over one year of treatment.
Serving the Needs of Hospital Pharmacies
Baxter continues to expand its offerings to hospital pharmacies, providing a leading array of therapies and technologies supporting the full medication management process. The company’s portfolio includes premixed parenteral, or intravenous (IV), nutrition products; premixed drugs; IV infusion pumps and administration sets; anesthetics; and other specialty pharmaceuticals. Baxter’s EXACTAMIX automated compounders allow hospital pharmacists to custom-mix nutritional and other multi-ingredient solutions on site. Other technology platforms include the DoseEdge Pharmacy Workflow Manager and ABACUS TPN Order Calculation Software, which support the safe, effective ordering and preparation of medications.
Baxter’s triple-chamber parenteral nutrition systems provide the essential ingredients of balanced nutrition — protein, carbohydrates, lipids and electrolytes — in a single, ready-to-use container. NUMETA (emulsion for infusion), launched in 2011, is the first and only triple-chamber nutritional system for neonatal and pediatric patients (preterm newborns through age 18). OLIMEL (Amino Acids, Dextrose and Lipids, with/without Electrolytes), the company’s newest triple-chamber system for adults, is available in a range of formulations containing various nitrogen levels appropriate for specific patient groups, such as critical care patients and surgery patients. Both products continued to become more widely available in 2012, with more than a dozen launches in new markets across Europe, Asia-Pacific and Latin America.
Above: Since the initial approval
of ADVATE in 2003, nearly
10 billion international units
have been distributed. It is the
number one chosen recombinant
factor VIII worldwide.
Baxter is bringing
its core products
to more patients
around the world.

8
Above Left: Dr. Philip McFarlane
of the Division of Nephrology at
St. Michael’s Hospital, Toronto,
Canada, is the primary investigator
for a clinical trial evaluating Baxter’s
new home hemodialysis technology.
Above Right: Mary Dietz of
the United States infuses
GAMMAGARD LIQUID [Immune
Globulin Infusion (Human)] 10%
subcutaneously to help treat her
primary immunodeficiency.
Below: VIVIA, Baxter’s investigational
home hemodialysis technology,
supports the administration of
High-Dose HD.
Innovation in Home-Based Renal Therapy
When end-stage renal disease patients require dialysis to cleanse their blood of toxins and waste, there are two main therapy options: hemodialysis (HD) and peritoneal dialysis (PD). Baxter, the world’s leading provider of products for in-home PD therapy, is applying its expertise to bring the benefits of home-based treatment to more hemodialysis patients.
Baxter is now in the final development stages of the VIVIA home HD system, which is expected to be approved in Europe in 2013. The technology supports the administration of High-Dose HD, a more frequent and/or longer-duration form of HD that, clinical studies suggest, offers potential benefits in patient survival, heart health, blood pressure and health-related quality of life. VIVIA’s user-friendly interface, safety features and wireless connectivity are all designed to help make patients and their healthcare teams comfortable conducting High-Dose HD in the home setting.
Baxter is also preparing to launch its new automated peritoneal dialysis (APD) system, another home-based option for dialysis patients. The system will offer advantages beyond Baxter’s current HomeChoice APD system and other APD cyclers on the market today, including advances in ease of use, design, portability and automatic data recording for clinicians.
Exploring New Frontiers in the Treatment of Bleeding Disorders
Baxter continues to pursue groundbreaking new technologies in an ongoing effort to address the unmet needs of people living with bleeding disorders. In early 2013 the company announced Phase III study results evaluating the efficacy and safety of routine prophylaxis compared with on-demand treatment of FEIBA NF [Anti-Inhibitor Coagulant Complex], Nanofiltered and Vapor Heated, in patients with hemophilia A or B that develop inhibitors. The study showed a significant reduction in annual bleed rate in all types of bleeds in the prophylaxis arm as compared with the on-demand arm. The results formed the basis of a biologics license application supplement submitted to the FDA in early 2013.
In 2012 the company completed a Phase I clinical trial of a longer-acting recombinant factor VIII protein for the treatment of hemophilia A based on the full-length ADVATE [Antihemophilic Factor (Recombinant), Plasma/Albumin-Free Method] molecule. This may offer a treatment regimen requiring fewer infusions than ADVATE. Through a collaboration with Nektar Therapeutics, the treatment leverages proprietary PEGylation technology designed to extend the duration of activity of proteins. The technology is already being used in a variety of approved treatments. Baxter expects to begin enrollment in a Phase II/III study in the first quarter of 2013.
Baxter announced in June an exclusive agreement with Chatham Therapeutics, LLC, to investigate a gene therapy treatment of hemophilia B based on Chatham’s Biological Nano Particles™ (BNP) technology. BNP is an advanced recombinant adeno-associated virus-based (rAAV-based) technology that could represent an entirely new treatment paradigm for hemophilia patients.
Driving Innovation Through Research and Development

9
Bax
ter
Inte
rnat
iona
l Inc
. 20
12 A
nnua
l Rep
ort
Above: U.S. physicians and
patients have the flexibility to
consider either subcutaneous
or intravenous administration of
GAMMAGARD LIQUID based
on individual patient need.
Below: Frank Serrieskoetter of
Baxter’s Halle/Westfalen, Germany,
facility mixes different oncology
compounds for use in chemotherapy.
Baxter’s leading-edge
R&D has the potential
to alter the treatment
landscape for a range
of critical conditions.
In August Baxter submitted a biologics license application to the FDA for a recombinant factor IX protein being investigated for the treatment and prophylaxis of bleeding episodes for patients over 12 years of age with hemophilia B. And Phase III trials continue on Baxter’s investigational recombinant von Willebrand factor for the treatment and prevention of bleeding episodes in patients with severe von Willebrand’s disease.
New Indications for GAMMAGARD LIQUID
GAMMAGARD LIQUID [Immune Globulin Infusion (Human)] 10% has recently received multiple new approvals and continues to be investigated for its potential to address a wider range of patient needs. In 2011 the FDA approved the subcutaneous (under-the-skin) administration of GAMMAGARD LIQUID for patients with primary immune deficiencies. This option continues to be adopted by a growing number of patients and physicians as an alternative to intravenous administration.
In June 2012 the FDA approved GAMMAGARD LIQUID as a treatment for multifocal motor neuropathy (MMN), a rare, debilitating condition associated with a progressive, asymmetric limb weakness. GAMMAGARD LIQUID is the first immune globulin treatment approved for MMN patients in the United States. The treatment was previously approved in the European Union in 2011.
Baxter also initiated in 2012 the second of two Phase III trials evaluating the use of GAMMAGARD LIQUID for the treatment of mild to moderate Alzheimer’s disease. Results of the first Phase III trial are expected to be announced in the second quarter of 2013.
Pursuing Innovative Therapies in Oncology and Inflammatory Disease
Baxter produces a range of market-leading products widely considered crucial in the treatment of cancer, including ENDOXAN (cyclophosphamide), HOLOXAN (ifosfamide) and UROMITEXAN (mesna). The company is now focused on expanding its oncology portfolio through leading-edge research and development. In September Baxter announced a European licensing agreement with Onconova Therapeutics, Inc., for the novel targeted anti-cancer compound rigosertib. The compound is currently in a Phase III study for the treatment of a group of rare hematologic malignancies called Myelodysplastic Syndromes (MDS). It is also being studied for pancreatic cancer in a Phase III study with interim analysis. Rigosertib’s method of action targets dual pathways (PI-3K and PLK) critical to the growth of cancer cells.
Baxter also announced the start of a Phase I clinical trial of a fully human, recombinant anti-MIF (anti-macrophage migration inhibitory factor) monoclonal antibody to treat patients having malignant solid tumors. The anti-MIF antibody targets the MIF protein, a protein that induces inflammatory responses in the body and has also been shown to influence the growth and spread of tumors.
Baxter is additionally collaborating with Momenta Pharmaceuticals, Inc., to develop and commercialize up to six “biosimilar” biologic products. Biosimilars are intended to be used in place of existing, branded biologics in the treatment of a range of chronic and often life-threatening diseases, holding the potential for lower cost and greater patient access. Baxter’s leadership in biologics research, development and manufacturing, combined with Momenta’s expertise in analytics and reengineering complex products, provides a strong foundation from which to pursue this promising category. In 2012 Baxter selected a monoclonal antibody targeting cancer as the third research candidate in this collaboration. Research is also under way on two additional candidates targeting inflammatory disease.

10
Pursuing Business Development Opportunities
Expanding Baxter’s Renal Care Portfolio: Baxter to Acquire Gambro
In December Baxter announced a definitive agreement to acquire Gambro AB, a global medical technology company focused on products and therapies for treating chronic and acute renal disease. Gambro has a longstanding heritage of innovation in hemodialysis and continuous renal replacement therapy, forming a strong complement to Baxter’s own focus on home-based dialysis technologies. The need for these technologies has never been greater: More than 2 million patients worldwide are on some form of dialysis today, and the number is escalating, due in part to rising rates of diabetes and hypertension.
Upon closing, Baxter and Gambro will join to offer a comprehensive array of treatment options to benefit patients, their families and healthcare practitioners worldwide. The complementary global footprint of the two companies will help expand the reach of these products to patients in more markets around the world. The transaction is expected to close at the end of the second quarter of 2013.
Acquisitions Strengthen Baxter’s Presence in Key Markets
In 2012 Baxter acquired Synovis Life Technologies, Inc., further extending Baxter’s wide-ranging regenerative medicine and biosurgery portfolio. Synovis’s soft tissue repair products are used in a variety of surgical procedures, including patching the lining of the brain, vessels and cardiac defects; hernia repair; staple-line reinforcement in obesity and thoracic procedures; and vascular surgery. The Synovis portfolio also includes devices used in microsurgery procedures, such as joining small diameter vessels during autologous tissue breast reconstruction as well as head, neck and hand procedures.
Baxter also completed the purchase of Sigma International General Medical Apparatus, LLC (SIGMA), culminating a relationship begun in 2009 when Baxter became the exclusive global distributor of SIGMA’s smart infusion pump technology. The SIGMA Spectrum infusion pump offers healthcare providers a range of features emphasizing patient safety and clinician ease of use, including wireless connectivity and technology focused on decreasing intravenous medication errors.
Also in 2012 Baxter integrated new product lines from its 2011 acquisition of Baxa Corporation, including automated compounding devices, filling systems, software and other technologies designed to help improve the safe and efficient handling, packaging and administration of fluid medications. Baxter’s growing portfolio of nutrition products and drug delivery systems is extending the company’s presence and relationships in hospital pharmacies worldwide.
Top Left: Silvio Paulo Alves do
Prado of Londrina, Paraná, Brazil,
uses Baxter peritoneal dialysis
products to treat his end-stage
renal disease.
Top Right: Five-year-old Alexandre
Leony of Salvador, Bahia, Brazil,
uses ADVATE Octocog alfa
(Recombinant Human Coagulation
Factor VIII) to help manage his
hemophilia A.
Above: NUMETA (emulsion for
infusion) is among the newest
products in Baxter’s growing
nutrition portfolio.

Developing Unique Public-Private Partnerships
Increasing the Availability of Recombinant Hemophilia Therapy in Brazil
In November Baxter announced an exclusive 20-year partnership with Hemobrás that will provide greater access to recombinant factor VIII therapy for hemophilia A patients in Brazil. Hemobrás is a company founded by Brazil’s Ministry of Health to focus on the production of life-saving treatments for a range of critical conditions.
More than 10,000 patients in Brazil are living with hemophilia, with less than 1 percent of the market currently treated with recombinant therapy. Through the terms of this innovative partnership, Baxter will be the exclusive provider of Brazil’s recombinant factor VIII treatment over the next 10 years, while collaborating with Hemobrás on a technology transfer to support the development of local manufacturing capacity. Following the technology transfer, Baxter will receive royalties on the recombinant factor VIII produced by Hemobrás. The arrangement will greatly expand the availability of recombinant therapy while advancing local technological capabilities and economic opportunity.
Building Access to Peritoneal Dialysis in Asia-Pacific
Peritoneal dialysis (PD) is the fastest-growing dialysis treatment option across the Asia-Pacific region, with many countries encouraging its use as an effective way to increase access and optimize healthcare outcomes for end-stage renal disease (ESRD) patients. Baxter is supporting these efforts through unique collaborations aimed at enhancing patient care.
Baxter is partnering with China’s National Institute of Hospital Administration under the Ministry of Health on project “Flying Angel,” focused on reducing barriers to therapy for ESRD patients in China’s rural communities. Flying Angel will pilot in six provinces, helping increase access through greater treatment availability, clear standards of care, increased patient awareness and treatment affordability.
In 2012 Baxter also announced the construction of a new PD manufacturing facility in Thailand, supporting increased demand and access to care under Thailand’s “PD First” policy. This policy, in place since 2008, encourages PD as the first-line dialysis treatment option, when appropriate, for new ESRD patients. Baxter expects the investment to result in the creation of up to 400 highly skilled jobs once the plant is fully operational, targeted for 2016.
Collaborating in the Netherlands to Address Demand for Plasma-Based Therapies
In July Baxter announced an agreement with Sanquin Blood Supply Foundation that will provide up to 1.6 million liters of additional plasma fractionation capacity annually to help support the global growth of Baxter’s plasma-derived therapies. Sanquin is a not-for-profit organization in the Netherlands responsible for the country’s blood supply.
Through the 10-year agreement, Sanquin will fractionate plasma supplied by Baxter for therapies to treat immune disorders, hemophilia, trauma and other critical conditions, including GAMMAGARD LIQUID [Immune Globulin Infusion (Human)] 10% (marketed as KIOVIG Human Normal Immunoglobulin (IVIg) outside the United States and Canada) and FLEXBUMIN 25% [Albumin (Human)], USP, 25% Solution. Production is expected to begin in 2014, reaching the annual capacity by the end of 2016.
Right: Approximately 80 percent of
end-stage renal disease patients in
Hong Kong, including Lau Siu Chun,
are on peritoneal dialysis (PD).
Hong Kong’s PD First policy has
been in place for over 25 years.
Innovative public-private
collaborations are helping
increase patient access to
critical therapies.
11
Bax
ter
Inte
rnat
iona
l Inc
. 20
12 A
nnua
l Rep
ort

12
At Baxter sustainability means creating lasting social, environmental and economic value by addressing the needs of the company’s wide- ranging stakeholder base. Baxter’s comprehensive sustainability program is focused on areas where the company is uniquely positioned to make a positive impact.
In line with the company’s mission to save and sustain lives, Baxter’s priorities include increasing access to healthcare globally. Baxter and The Baxter International Foundation provide cash and product donations in support of critical needs, from assisting underserved communities to providing emergency relief for countries experiencing natural disasters.
Baxter’s priorities also include sound environmental stewardship. Throughout 2012 the company continued to implement a range of water conservation strategies and facility-based energy saving initiatives. In the area of product stewardship and life cycle management, Baxter is pursuing efforts such as sustainable design and reduced packaging. Baxter is also responding to the challenges of climate change through innovative greenhouse gas emissions-reduction programs, such as shifting to less carbon-intensive energy sources and modes of product transport.
Baxter’s annual Sustainability Report, at www.sustainability.baxter.com, details the company’s commitment to addressing global sustainability challenges and outlines progress toward key priorities and goals.
Right: Thanks in part to a grant
from The Baxter International
Foundation, children in need of
physical, speech or occupational
therapy can benefit from hippotherapy,
using a horse’s movement for
rehabilitation, at Ride On Therapeutic
Horsemanship in Thousand Oaks,
California. Below: Impoverished
children in New Delhi, India, receive
essential healthcare services from a
Save the Children-supported mobile
health clinic due in part to a grant from
The Baxter International Foundation.
Baxter is proud to be recognized
by or affiliated with these and
other sustainability-related
organizations and programs:
Responsible Corporate Citizenship

UNITED STATES SECURITIES AND EXCHANGE COMMISSIONWashington, D.C. 20549
FORM 10-K(Mark One)
Í ANNUAL REPORT PURSUANT TO SECTION 13 OR 15(d) OF THE SECURITIES EXCHANGE ACTOF 1934For the fiscal year ended December 31, 2012
OR‘ TRANSITION REPORT PURSUANT TO SECTION 13 OR 15(d) OF THE SECURITIES EXCHANGE
ACT OF 1934For the transition period from to
Commission file number 1-4448
Baxter International Inc.(Exact Name of Registrant as Specified in its Charter)
Delaware 36-0781620(State or Other Jurisdiction of
Incorporation or Organization)(I.R.S. Employer Identification No.)
One Baxter Parkway, Deerfield, Illinois 60015(Address of Principal Executive Offices) (Zip Code)
Registrant’s telephone number, including area code 224.948.2000Securities registered pursuant to Section 12(b) of the Act:
Title of Each Class Name of Each Exchange on Which Registered
Common stock, $1.00 par value New York Stock ExchangeChicago Stock Exchange
Securities registered pursuant to Section 12(g) of the Act: None
Indicate by check mark if the registrant is a well-known seasoned issuer, as defined in Rule 405 of the SecuritiesAct. Yes Í No ‘Indicate by check mark if the registrant is not required to file reports pursuant to Section 13 or 15(d) of theAct. Yes ‘ No ÍIndicate by check mark whether the registrant (1) has filed all reports required to be filed by Section 13 or 15(d) of theSecurities Exchange Act of 1934 during the preceding 12 months (or for such shorter period that the registrant was requiredto file such reports), and (2) has been subject to such filing requirements for the past 90 days. Yes Í No ‘Indicate by check mark whether registrant has submitted electronically and posted on its corporate website, if any, everyInteractive Data File required to be submitted and posted pursuant to Rule 405 of Regulation S-T during the preceding12 months (or for such shorter period that the registrant was required to submit and post such files) Yes Í No ‘Indicate by check mark if disclosure of delinquent filers pursuant to Item 405 of Regulation S-K is not contained herein andwill not be contained, to the best of registrant’s knowledge, in definitive proxy or information statements incorporated byreference in Part III of this Form 10-K or any amendment to this Form 10-K. ÍIndicate by check mark whether the registrant is a large accelerated filer, an accelerated filer, a non-accelerated filer or asmaller reporting company. See the definitions of “large accelerated filer,” “accelerated filer” and “smaller reportingcompany” in Rule 12b-2 of the Exchange Act.
Large accelerated filer Í Accelerated filer ‘
Non-accelerated filer ‘ Smaller reporting company ‘
(Do not check if a smaller reporting company)Indicate by check mark whether the registrant is a shell company (as defined in Rule 12b-2 of the Act). Yes ‘ No ÍThe aggregate market value of the voting common equity held by non-affiliates of the registrant as of June 29, 2012 (the lastbusiness day of the registrant’s most recently completed second fiscal quarter), based on the per share closing sale price of$53.15 on that date and the assumption for the purpose of this computation only that all of the registrant’s directors andexecutive officers are affiliates, was approximately $29 billion. There is no non-voting common equity held by non-affiliatesof the registrant.The number of shares of the registrant’s common stock, $1.00 par value, outstanding as of January 31, 2013 was545,928,648.
DOCUMENTS INCORPORATED BY REFERENCEPortions of the registrant’s definitive 2013 proxy statement for use in connection with its Annual Meeting of Shareholders tobe held on May 7, 2013 are incorporated by reference into Part III of this report.

TABLE OF CONTENTS
PageNumber
Item 1. Business . . . . . . . . . . . . . . . . . . . . . . . . . . . . . . . . . . . . . . . . . . . . . . . . . . . . . . . . . . . . . . . . . . 1
Item 1A. Risk Factors . . . . . . . . . . . . . . . . . . . . . . . . . . . . . . . . . . . . . . . . . . . . . . . . . . . . . . . . . . . . . . . 6
Item 1B. Unresolved Staff Comments . . . . . . . . . . . . . . . . . . . . . . . . . . . . . . . . . . . . . . . . . . . . . . . . . . 13
Item 2. Properties . . . . . . . . . . . . . . . . . . . . . . . . . . . . . . . . . . . . . . . . . . . . . . . . . . . . . . . . . . . . . . . . . 13
Item 3. Legal Proceedings . . . . . . . . . . . . . . . . . . . . . . . . . . . . . . . . . . . . . . . . . . . . . . . . . . . . . . . . . . 14
Item 4. Mine Safety Disclosures . . . . . . . . . . . . . . . . . . . . . . . . . . . . . . . . . . . . . . . . . . . . . . . . . . . . . 14
Item 5. Market for Registrant’s Common Equity, Related Stockholder Matters and IssuerPurchases of Equity Securities . . . . . . . . . . . . . . . . . . . . . . . . . . . . . . . . . . . . . . . . . . . . . . . . 16
Item 6. Selected Financial Data . . . . . . . . . . . . . . . . . . . . . . . . . . . . . . . . . . . . . . . . . . . . . . . . . . . . . . 17
Item 7. Management’s Discussion and Analysis of Financial Condition and Resultsof Operations . . . . . . . . . . . . . . . . . . . . . . . . . . . . . . . . . . . . . . . . . . . . . . . . . . . . . . . . . . . . . . 18
Item 7A. Quantitative and Qualitative Disclosures about Market Risk . . . . . . . . . . . . . . . . . . . . . . . . . 46
Item 8. Financial Statements and Supplementary Data . . . . . . . . . . . . . . . . . . . . . . . . . . . . . . . . . . . . 47
Item 9. Changes in and Disagreements with Accountants on Accounting andFinancial Disclosure . . . . . . . . . . . . . . . . . . . . . . . . . . . . . . . . . . . . . . . . . . . . . . . . . . . . . . . . 103
Item 9A. Controls and Procedures . . . . . . . . . . . . . . . . . . . . . . . . . . . . . . . . . . . . . . . . . . . . . . . . . . . . . 103
Item 9B. Other Information . . . . . . . . . . . . . . . . . . . . . . . . . . . . . . . . . . . . . . . . . . . . . . . . . . . . . . . . . . 103
Item 10. Directors, Executive Officers and Corporate Governance . . . . . . . . . . . . . . . . . . . . . . . . . . . 103
Item 11. Executive Compensation . . . . . . . . . . . . . . . . . . . . . . . . . . . . . . . . . . . . . . . . . . . . . . . . . . . . . 104
Item 12. Security Ownership of Certain Beneficial Owners and Management and RelatedStockholder Matters . . . . . . . . . . . . . . . . . . . . . . . . . . . . . . . . . . . . . . . . . . . . . . . . . . . . . . . . . 104
Item 13. Certain Relationships and Related Transactions, and Director Independence . . . . . . . . . . . . 105
Item 14. Principal Accountant Fees and Services . . . . . . . . . . . . . . . . . . . . . . . . . . . . . . . . . . . . . . . . . 105
Item 15. Exhibits and Financial Statement Schedules . . . . . . . . . . . . . . . . . . . . . . . . . . . . . . . . . . . . . . 105

PART I
Item 1. Business.
Company Overview
Baxter International Inc., through its subsidiaries, develops, manufactures and markets products that save andsustain the lives of people with hemophilia, immune disorders, infectious diseases, kidney disease, trauma, andother chronic and acute medical conditions. As a global, diversified healthcare company, Baxter applies a uniquecombination of expertise in medical devices, pharmaceuticals and biotechnology to create products that advancepatient care worldwide. These products are used by hospitals, kidney dialysis centers, nursing homes,rehabilitation centers, doctors’ offices, clinical and medical research laboratories, and by patients at home underphysician supervision. Baxter manufactures products in 27 countries and sells them in more than 100 countries.
Baxter International Inc. was incorporated under Delaware law in 1931. As used in this report, except asotherwise indicated in information incorporated by reference, “Baxter International” means Baxter InternationalInc. and “Baxter,” the “company” or the “Company” means Baxter International and its consolidatedsubsidiaries.
Business Segments and Products
The company’s operations are comprised of the BioScience and Medical Products segments.
The BioScience business processes recombinant and plasma-based proteins to treat hemophilia and otherbleeding disorders; plasma-based therapies to treat immune deficiencies, alpha-1 antitrypsin deficiency, burnsand shock, and other chronic and acute blood-related conditions; biosurgery products; and select vaccines.
The Medical Products business manufactures intravenous (IV) solutions and administration sets, premixed drugsand drug-reconstitution systems, pre-filled vials and syringes for injectable drugs, IV nutrition products, infusionpumps, and inhalation anesthetics. The business also provides products and services related to pharmacycompounding, drug formulation and packaging technologies. In addition, the Medical Products business providesproducts and services to treat end-stage renal disease, or irreversible kidney failure. The business manufacturessolutions and other products for peritoneal dialysis (PD), a home-based therapy, and also distributes products forhemodialysis (HD), which is generally conducted in a hospital or clinic.
For financial information about Baxter’s segments and principal product categories, see Note 14 in Item 8 of thisAnnual Report on Form 10-K.
Sales and Distribution
The company has its own direct sales force and also makes sales to and through independent distributors, drugwholesalers acting as sales agents and specialty pharmacy or other alternate site providers. In the United States,Cardinal Health, Inc. warehouses and ships a significant portion of the company’s products through itsdistribution centers. These centers are generally stocked with adequate inventories to facilitate prompt customerservice. Sales and distribution methods include frequent contact by sales representatives, automatedcommunications via various electronic purchasing systems, circulation of catalogs and merchandising bulletins,direct-mail campaigns, trade publication presence and advertising.
International sales are made and products are distributed on a direct basis or through independent distributors orsales agents in more than 100 countries.
International Operations
Baxter products are manufactured and sold worldwide. The majority of the company’s revenues are generatedoutside of the United States and geographic expansion remains a core component of the company’s strategy.
1

Baxter’s international presence includes operations in Europe, Asia-Pacific, Latin America and Canada. Thecompany is subject to certain risks inherent in conducting business outside the United States. For moreinformation on these risks, see the information under the captions “We are subject to risks associated with doingbusiness globally” and “We are subject to foreign currency exchange risk” in Item 1A of this Annual Report onForm 10-K, all of which information is incorporated herein by reference.
For financial information about foreign and domestic operations and geographic information, see Note 14 inItem 8 of this Annual Report on Form 10-K. For more information regarding foreign currency exchange risk,refer to the discussion under the caption entitled “Financial Instrument Market Risk” in Item 7 of this AnnualReport on Form 10-K.
Contractual Arrangements
Substantial portions of the company’s products are sold through contracts with customers, both within andoutside the United States. Some of these contracts have terms of more than one year and place limits on thecompany’s ability to increase prices. In the case of hospitals, governments and other facilities, these contractsmay specify minimum quantities of a particular product or categories of products to be purchased by thecustomer.
In keeping with the increased emphasis on cost-effectiveness in healthcare delivery, many hospitals and othercustomers of medical products in the United States and in other countries have joined group purchasingorganizations (GPOs), or formed integrated delivery networks (IDNs), to enhance purchasing power. GPOs andIDNs negotiate pricing arrangements with manufacturers and distributors, and the negotiated prices are madeavailable to members. Baxter has purchasing agreements with several of the major GPOs in the United States.GPOs may have agreements with more than one supplier for certain products. Accordingly, in these cases, Baxterfaces competition from other suppliers even where a customer is a member of a GPO under contract with Baxter.
Raw Materials
Raw materials essential to Baxter’s business are purchased from numerous suppliers worldwide in the ordinarycourse of business. Although most of these materials are generally available, Baxter at times may experienceshortages of supply. In an effort to manage risk associated with raw materials supply, Baxter works closely withits suppliers to help ensure availability and continuity of supply while maintaining high quality and reliability.The company also seeks to develop new and alternative sources of supply where beneficial to its overall rawmaterials procurement strategy. In order to produce plasma-based therapies, the company also collects plasma atnumerous collection facilities in the United States and Europe. For more information on plasma collection, referto the discussion under the caption “The nature of producing plasma-based therapies may prevent us from timelyresponding to market forces and effectively managing our production capacity” in Item 1A of this Annual Reporton Form 10-K.
The company also utilizes long-term supply contracts with some suppliers to help maintain continuity of supplyand manage the risk of price increases. Baxter is not always able to recover cost increases for raw materialsthrough customer pricing due to contractual limits and market forces.
Competition and Healthcare Cost Containment
Baxter’s BioScience and Medical Products businesses enjoy leading positions based on a number of competitiveadvantages. The BioScience business benefits from continued innovation in its products and therapies,consistency of its supply of products, and strong customer relationships. The Medical Products business benefitsfrom the breadth and depth of its product offering, as well as strong relationships with customers, includinghospitals, customer purchasing groups and pharmaceutical and biotechnology companies. The Medical Productsbusiness also benefits from its position as one of the world’s leading manufacturers of PD products, as well as its
2

strong relationships with customers and patients, including the many patients who self-administer the home-based therapy supplied by Baxter. Baxter as a whole benefits from efficiencies and cost advantages resultingfrom shared manufacturing facilities and the technological advantages of its products.
Although no single company competes with Baxter in all of its businesses, Baxter faces substantial competitionin each of its segments from international and domestic healthcare and pharmaceutical companies of all sizes.BioScience continues to face competitors from pharmaceutical, biotechnology and other companies. MedicalProducts faces competition from medical device manufacturers and pharmaceutical companies. In addition,global and regional competitors continue to expand their manufacturing capacity for products and sales andmarketing channels. Competition is primarily focused on cost-effectiveness, price, service, product performance,and technological innovation. There has been increasing consolidation in the company’s customer base and by itscompetitors, which continues to result in pricing and market share pressures.
Global efforts toward healthcare cost containment continue to exert pressure on product pricing. Governmentsaround the world use various mechanisms to control healthcare expenditures, such as price controls, productformularies (lists of recommended or approved products), and competitive tenders which require the submissionof a bid to sell products. Sales of Baxter’s products are dependent, in part, on the availability of reimbursementby government agencies and healthcare programs, as well as insurance companies and other private payors. Inthe United States, the federal and many state governments have adopted or proposed initiatives relating toMedicaid and other health programs that may limit reimbursement or increase rebates that Baxter and otherproviders are required to pay to the state. In addition to government regulation, managed care organizations inthe United States, which include medical insurance companies, medical plan administrators, health-maintenanceorganizations, hospital and physician alliances and pharmacy benefit managers, continue to put pressure on theprice and usage of healthcare products. Managed care organizations seek to contain healthcare expenditures, andtheir purchasing strength has been increasing due to their consolidation into fewer, larger organizations and agrowing number of enrolled patients. Baxter faces similar issues outside of the United States. In Europe andLatin America, for example, the government provides healthcare at low cost to patients, and controls itsexpenditures by purchasing products through public tenders, regulating prices, setting reference prices in publictenders or limiting reimbursement or patient access to certain products.
Intellectual Property
Patents and other proprietary rights are essential to Baxter’s business. Baxter relies on patents, trademarks,copyrights, trade secrets, know-how and confidentiality agreements to develop, maintain and strengthen itscompetitive position. Baxter owns a number of patents and trademarks throughout the world and has entered intolicense arrangements relating to various third-party patents and technologies. Products manufactured by Baxterare sold primarily under its own trademarks and trade names. Some products distributed by the company are soldunder the company’s trade names, while others are sold under trade names owned by its suppliers. Trade secretprotection of unpatented confidential and proprietary information is also important to Baxter. The companymaintains certain details about its processes, products and technology as trade secrets and generally requiresemployees, consultants, parties to collaboration agreements and other business partners to enter intoconfidentiality agreements.
Baxter’s policy is to protect its products and technology through patents and trademarks on a worldwide basis.This protection is sought in a manner that balances the cost of such protection against obtaining the greatest valuefor the company. Baxter also recognizes the need to promote the enforcement of its patents and trademarks andtakes commercially reasonable steps to enforce its patents and trademarks around the world against potentialinfringers, including judicial or administrative action where appropriate.
Baxter operates in an industry susceptible to significant patent litigation. At any given time, the company isinvolved as either a plaintiff or defendant in a number of patent infringement and other intellectual property-related actions. Such litigation can result in significant royalty or other payments or result in injunctions that can
3

prevent the sale of products. For more information on patent and other litigation, see Note 13 in Item 8 of thisAnnual Report on Form 10-K.
Research and Development
Baxter’s investment in research and development (R&D) is essential to its future growth and its ability to remaincompetitive in each of its business segments. Accordingly, Baxter continues to focus its investment in R&Dprograms to enhance future growth through clinical differentiation. Expenditures for Baxter’s R&D activitieswere $1.2 billion in 2012, $946 million in 2011 and $915 million in 2010. These expenditures include costsassociated with R&D activities performed at the company’s R&D centers located around the world, whichinclude facilities in Austria, Belgium, Japan and the United States, as well as in-licensing, milestone andreimbursement payments made to partners for R&D work performed at non-Baxter locations. Included inBaxter’s R&D activities in 2012 were upfront payments of $113 million made during the year as the companyentered into new collaboration arrangements.
The company’s research efforts emphasize self-manufactured product development, and portions of that researchrelate to multiple product categories. Baxter supplements its own R&D efforts by acquiring various technologiesand entering into development and other collaboration agreements with third parties. In July 2011, Baxterestablished Baxter Ventures, a strategic initiative to invest up to $200 million in early-stage companiesdeveloping products and therapies to accelerate innovation and growth for the company. For more information onthe company’s R&D activities, refer to the discussion under the caption entitled “Strategic Objectives” in Item 7of this Annual Report on Form 10-K.
Quality Management
Baxter’s success depends upon the quality of its products. Quality management plays an essential role indetermining and meeting customer requirements, preventing defects, facilitating continuous improvement of thecompany’s processes, products and services, and maintaining the integrity of the data that supports the safety andefficacy of the company’s products. Baxter has one quality system deployed globally that enables the design,development, manufacturing, packaging, sterilization, handling, distribution and labeling of the company’sproducts to ensure they conform to customer requirements. In order to continually improve the effectiveness andefficiency of the quality system, various measurements, monitoring and analysis methods such as managementreviews, internal, external and vendor audits are employed at local and central levels.
Each product that Baxter markets is required to meet specific quality standards, both in packaging and in productintegrity and quality. If either of those is determined to be compromised at any time, Baxter takes necessarycorrective and preventive actions, such as notification of the customer of revised labeling, correction of theproduct at the customer location, withdrawal of the product from the market and other actions. For moreinformation on corrective actions taken by Baxter, refer to the discussion under the caption entitled “CertainRegulatory Matters” in Item 7 of this Annual Report on Form 10-K.
Government Regulation
The operations of Baxter and many of the products manufactured or sold by the company are subject to extensiveregulation by numerous government agencies, both within and outside the United States. The Food and DrugAdministration (FDA) in the United States, the European Medicines Agency (EMA) in Europe, the State Foodand Drug Administration (SFDA) in China and other government agencies inside and outside of the UnitedStates, administer requirements covering the testing, safety, effectiveness, manufacturing, labeling, promotionand advertising, distribution and post-market surveillance of Baxter’s products. The company must obtainspecific approval from FDA and non-U.S. regulatory authorities before it can market and sell most of its productsin a particular country. Even after the company obtains regulatory approval to market a product, the product andthe company’s manufacturing processes and quality systems are subject to continued review by FDA and other
4

regulatory authorities globally. State agencies in the United States also regulate the facilities, operations,employees, products and services of the company within their respective states. The company and its facilitiesare subject to periodic inspections and possible administrative and legal actions by FDA and other regulatoryagencies inside and outside the United States. Such actions may include warning letters, product recalls orseizures, monetary sanctions, injunctions to halt manufacture and distribution of products, civil or criminalsanctions, refusal of a government to grant approvals or licenses, restrictions on operations or withdrawal ofexisting approvals and licenses. As situations require, the company takes steps to ensure safety and efficacy of itsproducts, such as removing products found not to meet applicable requirements from the market and improvingthe effectiveness of quality systems. For more information on compliance actions taken by the company, refer tothe discussion under the caption entitled “Certain Regulatory Matters” in Item 7 of this Annual Report onForm 10-K.
The company is also subject to various laws inside and outside the United States concerning our relationshipswith healthcare professionals and government officials, price reporting and regulation, the promotion, sales andmarketing of our products and services, the importation and exportation of our products, the operation of ourfacilities and distribution of our products. In the United States, the company is subject to the oversight of FDA,Office of the Inspector General within the Department of Health and Human Services (OIG), the Center forMedicare/Medicaid Services (CMS), the Department of Justice (DOJ), Environmental Protection Agency,Department of Defense and Customs and Border Protection in addition to others. The company supplies productsand services to healthcare providers that are reimbursed by federally funded programs such as Medicare. As aresult, the company’s activities are subject to regulation by CMS and enforcement by OIG and DOJ. In eachjurisdiction outside the United States, the company’s activities are subject to regulation by government agenciesincluding the EMA in Europe, SFDA in China and other agencies in other jurisdictions. Many of the agenciesenforcing these laws have increased their enforcement activities with respect to healthcare companies in recentyears. These actions appear to be part of a general trend toward increased enforcement activity globally.
In March 2010, the Patient Protection and Affordable Care Act was enacted in the United States. While thislegislation provides for a number of changes in how companies are compensated for providing healthcareproducts and services, many of these changes will be implemented by regulations which have yet to beestablished. For more information on the expected impact of healthcare reform on the company, refer to theinformation under the caption “The implementation of healthcare reform in the United States may adverselyaffect our business” in Item 1A of this Annual Report on Form 10-K all of which information is incorporatedherein by reference.
Environmental policies of the company require compliance with all applicable environmental regulations andcontemplate, among other things, appropriate capital expenditures for environmental protection.
Employees
As of December 31, 2012, Baxter employed approximately 51,000 people.
Available Information
Baxter makes available free of charge on its website at www.baxter.com its Annual Reports on Form 10-K,Quarterly Reports on Form 10-Q, Current Reports on Form 8-K, and amendments to those reports filed orfurnished pursuant to Section 13(a) or 15(d) of the Securities Exchange Act of 1934, as amended (ExchangeAct), as soon as reasonably practicable after electronically filing or furnishing such material to the Securities andExchange Commission.
In addition, Baxter’s Corporate Governance Guidelines, Code of Conduct, and the charters for the committees ofBaxter’s board of directors are available on Baxter’s website at www.baxter.com under “Corporate Governance”and in print upon request by writing to: Corporate Secretary, Baxter International Inc., One Baxter Parkway,
5

Deerfield, Illinois 60015. Information contained on Baxter’s website shall not be deemed incorporated into, or tobe a part of, this Annual Report on Form 10-K.
Item 1A. Risk Factors.
In addition to the other information in this Annual Report on Form 10-K, shareholders or prospective investorsshould carefully consider the following risk factors. If any of the events described below occurs, our business,financial condition and results of operations and future growth prospects could suffer.
If we are unable to successfully introduce new products or fail to keep pace with advances in technology, ourbusiness, financial condition and results of operations could be adversely affected.
We need to successfully introduce new products to achieve our strategic business objectives. Productdevelopment requires substantial investment and there is inherent risk in the research and development process.A successful product development process depends on many factors, including our ability to properly anticipateand satisfy customer needs, adapt to new technologies, obtain regulatory approvals on a timely basis,demonstrate satisfactory clinical results, manufacture products in an economical and timely manner anddifferentiate our products from those of our competitors. If we cannot successfully introduce new products oradapt to changing technologies, our products may become obsolete and our revenue and profitability couldsuffer.
We are subject to a number of existing laws and regulations, non-compliance with which could adverselyaffect our business, financial condition and results of operations, and we are susceptible to a changingregulatory environment.
As a participant in the healthcare industry, our operations and products, and those of our customers, are regulatedby numerous government agencies, both inside and outside the United States. The impact of this on us is direct,to the extent we are subject to these laws and regulations, and indirect in that in a number of situations, eventhough we may not be directly regulated by specific healthcare laws and regulations, our products must becapable of being used by our customers in a manner that complies with those laws and regulations.
The manufacture, distribution, marketing and use of our products are subject to extensive regulation andincreased scrutiny by FDA and other regulatory authorities globally. Any new product must undergo lengthy andrigorous testing and other extensive, costly and time-consuming procedures mandated by FDA and foreignregulatory authorities. Changes to current products may be subject to vigorous review, including additional510(k) and other regulatory submissions, and approvals are not certain. Our facilities must be approved andlicensed prior to production and remain subject to inspection from time to time thereafter. Failure to comply withthe requirements of FDA or other regulatory authorities, including a failed inspection or a failure in our adverseevent reporting system, could result in adverse inspection reports, warning letters, product recalls or seizures,monetary sanctions, injunctions to halt the manufacture and distribution of products, civil or criminal sanctions,refusal of a government to grant approvals or licenses, restrictions on operations or withdrawal of existingapprovals and licenses. Any of these actions could cause a loss of customer confidence in us and our products,which could adversely affect our sales. The requirements of regulatory authorities, including interpretativeguidance, are subject to change and compliance with additional or changing requirements or interpretativeguidance may subject the company to further review, result in product launch delays or otherwise increase ourcosts. For information on current regulatory issues affecting us, please refer to the caption entitled “CertainRegulatory Matters” in Item 7 of this Annual Report on Form 10-K. In connection with these issues, there can beno assurance that additional costs or civil and criminal penalties will not be incurred, that additional regulatoryactions with respect to the company will not occur, that the company will not face civil claims for damages frompurchasers or users, that substantial additional charges or significant asset impairments may not be required, thatsales of other products may not be adversely affected, or that additional regulation will not be introduced thatmay adversely affect the company’s operations and consolidated financial statements.
6

The sales, marketing and pricing of products and relationships that pharmaceutical and medical devicecompanies have with healthcare providers are under increased scrutiny by federal, state and foreign governmentagencies. Compliance with the Anti-Kickback Statute, False Claims Act, Food, Drug and Cosmetic Act(including as these laws relate to off-label promotion of products) and other healthcare related laws, as well ascompetition, data and patient privacy and export and import laws is under increased focus by the agenciescharged with overseeing such activities, including FDA, OIG, DOJ and the Federal Trade Commission. The DOJand the Securities and Exchange Commission have also increased their focus on the enforcement of theU.S. Foreign Corrupt Practices Act (FCPA), particularly as it relates to the conduct of pharmaceutical companies.The FCPA and similar anti-bribery laws generally prohibit companies and their employees, contractors or agentsfrom making improper payments to government officials for the purpose of obtaining or retaining business.Healthcare professionals in many countries are employed by the government and consequently are consideredgovernment officials. Foreign governments have also increased their scrutiny of pharmaceutical companies’ salesand marketing activities and relationships with healthcare providers and competitive practices generally. Thelaws and standards governing the promotion, sale and reimbursement of our products and those governing ourrelationships with healthcare providers and governments can be complicated, are subject to frequent change andmay be violated unknowingly. We have compliance programs in place, including policies, training and variousforms of monitoring, designed to address these risks. Nonetheless, these programs and policies may not alwaysprotect us from conduct by individual employees that violate these laws. Violations, or allegations of violations,of these laws may result in large civil and criminal penalties, debarment from participating in governmentprograms, diversion of management time, attention and resources and may otherwise have an adverse effect onour business, financial condition and results of operations. For more information related to the Company’songoing government investigations, please refer to Note 13 in Item 8 of this Annual Report on Form 10-K.
The laws and regulations discussed above are broad in scope and subject to evolving interpretations, which couldrequire us to incur substantial cost associated with compliance or to alter one or more of our sales and marketingpractices and may subject us to enforcement actions which could adversely affect our business, financialcondition and results of operations.
Issues with product quality could have an adverse effect upon our business, subject us to regulatory actionsand cause a loss of customer confidence in us or our products.
Our success depends upon the quality of our products. Quality management plays an essential role in determiningand meeting customer requirements, preventing defects, improving the company’s products and services andmaintaining the integrity of the data that supports the safety and efficacy of our products. Our future successdepends on our ability to maintain and continuously improve our quality management program. While we haveone quality system deployed globally that covers the lifecycle of our products, quality and safety issues mayoccur with respect to any of our products. A quality or safety issue may result in adverse inspection reports,warning letters, product recalls or seizures, monetary sanctions, injunctions to halt manufacture and distributionof products, civil or criminal sanctions, costly litigation, refusal of a government to grant approvals and licenses,restrictions on operations or withdrawal of existing approvals and licenses. An inability to address a quality orsafety issue in an effective and timely manner may also cause negative publicity, a loss of customer confidencein us or our current or future products, which may result in the loss of sales and difficulty in successfullylaunching new products.
Unaffiliated third party suppliers provide a number of goods and services to our R&D, clinical andmanufacturing organizations. Third party suppliers are required to comply with our quality standards. Failure of athird party supplier to provide compliant raw materials or supplies could result in delays, service interruptions orother quality related issues that may negatively impact our business results. In addition, some of the rawmaterials employed in our production processes are derived from human and animal origins, requiring robustcontrols to eliminate the potential for introduction of pathogenic agents or other contaminants.
For more information on regulatory matters currently affecting us, refer to the discussion under the captionentitled “Certain Regulatory Matters” in Item 7 of this Annual Report on Form 10-K.
7

The implementation of healthcare reform in the United States may adversely affect our business.
The Patient Protection and Affordable Care Act (Act), which was signed into law in March 2010, includesseveral provisions which impact the company’s businesses in the United States, including increased Medicaidrebates and an expansion of the 340B Drug Pricing Program which provides certain qualified entities, such ashospitals serving disadvantaged populations, with discounts on the purchase of drugs for outpatient use and anexcise tax on the sale of certain drugs and medical devices. In 2011, the company became subject to a tax on thesales of its pharmaceutical products to the government. In 2013, the company will be required to pay a 2.3% taxon sales of certain of its medical devices. The impact of the increased Medicaid rebates and the expanded 340BDrug Pricing Program is largely expected to impact our BioScience business, while the additional taxes areexpected to impact both of our business segments. We may also experience downward pricing pressure as theAct reduces Medicare and Medicaid payments to hospitals. While it is intended to expand health insurancecoverage and increase access to medical care generally, the long-term impact of the Act on our business and thedemand of our products is uncertain. Similarly, we cannot predict the impact of the additional regulations thatneed to be established to implement many of the Act’s provisions.
If reimbursement for our current or future products is reduced or modified in the United States or abroad, ourbusiness could suffer.
Sales of our products depend, in part, on the extent to which the costs of our products are paid by both public andprivate payors. These payors include Medicare, Medicaid, and private health care insurers in the United Statesand foreign governments and third-party payors outside the United States. Public and private payors areincreasingly challenging the prices charged for medical products and services. We may continue to experiencecontinued downward pricing pressures from third-party payors which could result in an adverse effect on ourbusiness, financial condition and operational results.
Austerity measures or other reforms by foreign governments may limit, reduce or eliminate payments for ourproducts and adversely affect both our pricing flexibility and demand for our products. Accordingly,reimbursement may not be available or sufficient to allow us to sell our products on a competitive basis.Legislation and regulations affecting reimbursement for our products may change at any time and in ways thatmay be adverse to us.
There is substantial competition in the product markets in which we operate and in the development ofalliances with research, academic and governmental institutions.
Although no single company competes with us in all of our businesses, we face substantial competition in both ofour segments from international and domestic healthcare and pharmaceutical companies of all sizes. Competitionis primarily focused on cost-effectiveness, price, service, product performance, and technological innovation.Competition may increase further as additional companies begin to enter our markets or modify their existingproducts to compete directly with ours. If our competitors respond more quickly to new or emerging technologiesand changes in customer requirements, our products may be rendered obsolete or non-competitive. If ourcompetitors develop more effective or affordable products, or achieve earlier patent protection or productcommercialization than we do, our operations will likely be negatively affected. If we are forced to reduce ourprices due to increased competition, our business could become less profitable. The company’s sales could beadversely affected if any of its contracts with GPOs, IDNs or other customers are terminated due to increasedcompetition or otherwise.
We also face competition for marketing, distribution and collaborative development agreements, for establishingrelationships with academic and research institutions, and for licenses to intellectual property. In addition,academic institutions, government agencies and other public and private research organizations may also conductresearch, seek patent protection and establish collaborative arrangements for discovery, research, clinicaldevelopment and marketing of products similar to ours. These companies and institutions compete with us inrecruiting and retaining qualified scientific and management personnel as well as in acquiring technologies
8

complementary to our programs. If we are unable to successfully compete with these companies and institutions,our business may suffer.
The nature of producing plasma-based therapies may prevent us from timely responding to market forces andeffectively managing our production capacity.
The production of plasma-based therapies is a lengthy and complex process. Efforts to increase the collection ofplasma or the production of plasma-based therapies may include the construction and regulatory approval ofadditional plasma collection facilities and/or plasma fractionation facilities, such as the Covington, Georgiafacility, the site selection of which we announced in April 2012. The development of such facilities can be alengthy regulatory and capital intensive process. As a result, our ability to match our collection and production ofplasma-based therapies to market demand is imprecise and may result in a failure to meet the market demand forour plasma-based therapies or potentially an oversupply of inventory. Failure to meet market demand for ourplasma-based therapies may result in customers transitioning to available competitive products resulting in a lossof segment share or customer confidence. In the event of an oversupply we may be forced to lower the prices wecharge for some of our plasma-based therapies, close collection and processing facilities, record asset impairmentcharges or take other action which may adversely affect our business, financial condition and results ofoperations.
If we are unable to obtain sufficient components or raw materials on a timely basis or if we experience othermanufacturing difficulties, our business may be adversely affected.
The manufacture of our products requires the timely delivery of sufficient amounts of quality components andmaterials. We manufacture our products in more than 50 manufacturing facilities around the world. We acquireour components and materials from many suppliers in various countries. We work closely with our suppliers toensure the continuity of supply but we cannot guarantee these efforts will always be successful. Further, whileefforts are made to diversify our sources of components and materials, in certain instances we acquirecomponents and materials from a sole supplier. In addition, due to the regulatory environment in which weoperate, we may be unable to quickly establish additional or replacement sources for some components ormaterials. A reduction or interruption in supply, and an inability to develop alternative sources for such supply,could adversely affect our ability to manufacture our products in a timely or cost-effective manner, and ourability to make product sales.
Many of our products are difficult to manufacture. This is due to the complex nature of manufacturingpharmaceuticals, including biologics, and devices, as well as the strict regulatory regime governing ourmanufacturing operations. Variations in the manufacturing process may result in production failures which couldlead to launch delays, product shortage, unanticipated costs, lost revenues and damage to our reputation. Afailure to identify and address manufacturing problems prior to the release of products to our customers may alsoresult in a quality or safety issue of the type discussed above.
Several of our products are manufactured at a single manufacturing facility. Loss or damage to a manufacturingfacility due to a natural disaster or otherwise could adversely affect our ability to manufacture sufficientquantities of key products to meet customer demand or contractual requirements which may result in a loss ofrevenue and other adverse business consequences. Because of the time required to approve and license amanufacturing facility a third party manufacturer may not be available on a timely basis to replace productioncapacity in the event we lose manufacturing capacity due to natural disaster, regulatory action or otherwise.
If we are unable to protect our patents or other proprietary rights, or if we infringe the patents or otherproprietary rights of others, our competitiveness and business prospects may be materially damaged.
Patent and other proprietary rights are essential to our business. Our success depends to a significant degree onour ability to obtain and enforce patents and licenses to patent rights, both in the United States and in other
9

countries. We cannot guarantee that pending patent applications will result in issued patents, that patents issuedor licensed will not be challenged or circumvented by competitors, that our patents will not be found to be invalidor that the intellectual property rights of others will not prevent the company from selling certain products orincluding key features in the company’s products.
The patent position of a healthcare company is often uncertain and involves complex legal and factual questions.Significant litigation concerning patents and products is pervasive in our industry. Patent claims includechallenges to the coverage and validity of our patents on products or processes as well as allegations that ourproducts infringe patents held by competitors or other third parties. A loss in any of these types of cases couldresult in a loss of patent protection or the ability to market products, which could lead to a significant loss ofsales, or otherwise materially affect future results of operations.
We also rely on trademarks, copyrights, trade secrets and know-how to develop, maintain and strengthen ourcompetitive positions. Third parties may know, discover or independently develop equivalent proprietaryinformation or techniques, or they may gain access to our trade secrets or disclose our trade secrets to the public.Misappropriation or other loss of our intellectual property would have an adverse effect on our competitiveposition and may cause us to incur substantial litigation costs.
If our business development activities are unsuccessful, our business could suffer and our financialperformance could be adversely affected.
As part of our long-term strategy, we are engaged in business development activities including evaluatingacquisitions, joint development opportunities, technology licensing arrangements and other opportunities. Theseactivities may result in substantial investment of the company’s resources. Our success developing products orexpanding into new markets from such activities will depend on a number of factors, including our ability to findsuitable opportunities for acquisition, investment or alliance; whether we are able to complete an acquisition,investment or alliance on terms that are satisfactory to us; the strength of the other company’s underlyingtechnology, products and ability to execute its business strategies; any intellectual property and litigation relatedto these products or technology; and our ability to successfully integrate the acquired company, business,product, technology or research into our existing operations, including the ability to adequately fund acquired in-process research and development projects. If we are unsuccessful in our business development activities, wemay be unable to meet our financial targets and our financial performance could be adversely affected.
The proposed acquisition of Gambro AB may adversely affect our financial condition and our business.
In December 2012, we announced an agreement to purchase Gambro AB (Gambro). The closing of thetransaction is subject to regulatory approvals (including multiple antitrust approvals) and other closingconditions. While the closing of the transaction is expected to occur at the end of the second quarter of 2013,there can be no assurance that the closing will in fact occur or that significant delays in closing the transactionwill not result. A failure to close the transaction or significant delays in doing so may negatively impact thetrading price of our common stock and our business, financial condition and results of operations. We expect toissue at least $3.0 billion of debt during the first half of 2013 to fund the planned acquisition of Gambro, whichwill significantly increase the company’s outstanding debt. This additional indebtedness will require us todedicate a portion of our cash flow to servicing this debt, thereby reducing the availability of cash to fund otherbusiness initiatives, including stock repurchases. We performed substantial due diligence in connection with thistransaction but undiscovered and unanticipated risks and liabilities may emerge after the closing. The integrationof Gambro’s operations will require significant efforts, including the coordination of information technologies,research and development, sales, marketing, operations, manufacturing and finance. These efforts will result inadditional expenses and involve significant amounts of management’s time that cannot be dedicated to otherprojects. Our failure to successfully integrate Gambro’s operations into our own could result in a failure toachieve expected synergies. A failure to achieve our strategic objectives with respect to the Gambro acquisitioncould result in slower growth, higher than expected costs, the closure of facilities, the recording of asset
10

impairment charges and other actions which could adversely affect our business, financial condition and resultsof operations. For more information on this acquisition, see Note 2 in Item 8 of this Annual Report onForm 10-K.
We are subject to risks associated with doing business globally.
Our operations are subject to risks inherent in conducting business globally and under the laws, regulations andcustoms of various jurisdictions and geographies. These risks include changes in exchange controls and othergovernmental actions, loss of business in government and public tenders that are held annually in many cases,increasingly complex labor environments, availability of raw materials, changes in taxation, export controlrestrictions, changes in or violations of U.S. or local laws, including the FCPA and the United Kingdom BriberyAct, dependence on a few government entities as customers, pricing restrictions, economic and politicalinstability (including instability as it relates to the Euro), disputes between countries, diminished or insufficientprotection of intellectual property, and disruption or destruction of operations in a significant geographic regionregardless of cause, including war, terrorism, riot, civil insurrection or social unrest. Failure to comply with, ormaterial changes to, the laws and regulations that affect our global operations could have an adverse effect on ourbusiness, financial condition or results of operations.
We are subject to foreign currency exchange risk.
We generate the majority of our revenue outside the United States. As a result, our financial results may beadversely affected by fluctuations in foreign currency exchange rates. We cannot predict with any certaintychanges in foreign currency exchange rates or our ability to mitigate these risks. A discussion of the financialimpact of foreign exchange rate fluctuations, and the ways and extent to which we attempt to mitigate suchimpact, including the impact of restrictions on currency exchange imposed by the Venezuelan government, iscontained under the caption “Financial Instrument Market Risk” in Item 7 of this Annual Report on Form 10-K.
Changes in tax laws or exposure to additional income tax liabilities may have a negative impact on ouroperating results.
Tax policy reform continues to be a topic of discussion in the United States. A significant change to the taxsystem in the United States, including changes to the taxation of international income, could have an adverseeffect upon our results of operations. Because we operate in multiple income tax jurisdictions both inside andoutside the United States, we are subject to tax audits in various jurisdictions. Tax authorities may disagree withcertain positions we have taken and assess additional taxes. We regularly assess the likely outcomes of theseaudits in order to determine the appropriateness of our tax provision. However, we may not accurately predict theoutcome of these audits, and as a result the actual outcome of these audits may have an adverse impact on ourfinancial results. For more information on ongoing audits, see Note 12 in Item 8 of this Annual Report on Form10-K.
We may experience difficulties implementing our new global enterprise resource planning system.
We are engaged in a multi-year implementation of a new global enterprise resource planning system (ERP). TheERP is designed to accurately maintain the company’s books and records and provide information important tothe operation of the business to the company’s management team. The company’s ERP will continue to requiresignificant investment of human and financial resources. In implementing the ERP, we may experiencesignificant delays, increased costs and other difficulties. Any significant disruption or deficiency in the designand implementation of the ERP could adversely affect our ability to process orders, ship product, send invoicesand track payments, fulfill contractual obligations or otherwise operate our business. While we have investedsignificant resources in planning and project management, significant implementation issues may arise.
11

We are increasingly dependent on information technology systems and infrastructure.
We increasingly rely upon technology systems and infrastructure. Our technology systems are potentiallyvulnerable to breakdown or other interruption by fire, power loss, system malfunction, unauthorized access andother events. Likewise, data privacy breaches by employees and others with permitted access to our systems maypose a risk that sensitive data may be exposed to unauthorized persons or to the public. While we have investedheavily in the protection of data and information technology and in related training, there can be no assurancethat our efforts will prevent significant breakdowns, breaches in our systems or other cyber incidents that couldhave a material adverse effect upon our reputation, business, operations or financial condition of the company. Inaddition, significant implementation issues may arise as we continue to consolidate and outsource certaincomputer operations and application support activities.
If we fail to attract and retain key employees our business may suffer.
Our ability to compete effectively depends on our ability to attract and retain key employees, including people insenior management, sales, marketing and research positions. Competition for top talent in healthcare can beintense. Our ability to recruit and retain such talent will depend on a number of factors, including hiring practicesof our competitors, compensation and benefits, work location, work environment and industry economicconditions. If we cannot effectively recruit and retain qualified employees, our business could suffer.
We are subject to a number of pending lawsuits.
We are a defendant in a number of pending lawsuits. In addition, we may be named as a defendant in futurepatent, product liability or other lawsuits. These current and future matters may result in a loss of patentprotection, reduced revenue, significant liabilities and diversion of our management’s time, attention andresources. Given the uncertain nature of litigation generally, we are not able in all cases to estimate the amount orrange of loss that could result from an unfavorable outcome in these current matters. In view of theseuncertainties, the outcome of these matters may result in charges in excess of any established reserves, and, to theextent available, liability insurance. We also continue to be self-insured with respect to product liability claims.The absence of third-party insurance coverage for current or future claims increases our potential exposure tounanticipated claims and adverse decisions. Protracted litigation, including any adverse outcomes, may have anadverse impact on the business, operations or financial condition of the company. Even claims without meritcould subject us to adverse publicity and require us to incur significant legal fees. See Note 13 in Item 8 of thisAnnual Report on Form 10-K for more information regarding current lawsuits.
Current or worsening economic conditions may adversely affect our business and financial condition.
The company’s ability to generate cash flows from operations could be affected if there is a material decline inthe demand for the company’s products, in the solvency of its customers or suppliers, or deterioration in thecompany’s key financial ratios or credit ratings. Current or worsening economic conditions may adversely affectthe ability of our customers (including governments) to pay for our products and services, and the amount spenton healthcare generally. This could result in a decrease in the demand for our products and services, decliningcash flows, longer sales cycles, slower adoption of new technologies and increased price competition. Theseconditions may also adversely affect certain of our suppliers, which could cause a disruption in our ability toproduce our products. We continue to do business with foreign governments in certain countries, includingGreece, Spain, Portugal and Italy, that have experienced deterioration in credit and economic conditions. As ofDecember 31, 2012, the company’s net accounts receivable from the public sector in Greece, Spain, Portugal andItaly totaled $385 million (of which $66 million is related to Greece). The global economic conditions andgovernmental actions in these and other countries may continue to result in delays in the collection of receivablesand require us to re-evaluate the collectibility and valuation of our receivables which could result in additionalcredit losses. These conditions may also impact the stability of the Euro. For more information on accountsreceivable and credit matters with respect to certain of these countries, refer to the discussion under the captionentitled “Credit Facilities, Access to Capital and Credit Ratings” in Item 7 of this Annual Report on Form 10-K.
12

Item 1B. Unresolved Staff Comments.
None.
Item 2. Properties.
The company’s corporate offices are owned and located at One Baxter Parkway, Deerfield, Illinois 60015.
Baxter owns or has long-term leases on all of its manufacturing facilities. The company maintains 16manufacturing facilities in the United States and its territories, including three in Puerto Rico. The company alsomanufactures in Australia, Austria, Belgium, Brazil, Canada, Chile, China, Colombia, Costa Rica, the CzechRepublic, Germany, India, Ireland, Italy, Japan, Malta, Mexico, the Philippines, Poland, Saudi Arabia, Singapore,Spain, Switzerland, Tunisia, Turkey and the United Kingdom. The company’s principal manufacturing facilitiesby segment are listed below:
Business Location Owned/Leased
BioScienceOrth, Austria OwnedVienna, Austria OwnedLessines, Belgium OwnedHayward, California LeasedLos Angeles, California OwnedThousand Oaks, California OwnedBohumil, Czech Republic OwnedPisa, Italy OwnedRieti, Italy OwnedWoodlands, Singapore Owned/Leased(1)Neuchatel, Switzerland OwnedElstree, United Kingdom Leased
Medical ProductsMountain Home, Arkansas OwnedToongabbie, Australia OwnedLessines, Belgium OwnedSao Paulo, Brazil OwnedAlliston, Canada OwnedGuangzhou, China Owned(2)Shanghai, China OwnedSuzhou, China OwnedCali, Colombia OwnedEnglewood, Colorado LeasedCartago, Costa Rica OwnedHalle, Germany OwnedRound Lake, Illinois OwnedBloomington, Indiana Owned/Leased(3)Castlebar, Ireland OwnedGrosotto, Italy OwnedMiyazaki, Japan OwnedCuernavaca, Mexico OwnedCleveland, Mississippi LeasedMedina, New York LeasedNorth Cove, North Carolina OwnedAibonito, Puerto Rico Leased
13

Business Location Owned/Leased
Medical Products Guayama, Puerto Rico OwnedJayuya, Puerto Rico LeasedWoodlands, Singapore Owned/Leased(1)Sabinanigo, Spain OwnedSan Vittore, Switzerland OwnedLiverpool, United Kingdom OwnedThetford, United Kingdom Owned
(1) Baxter owns the facility located at Woodlands, Singapore and leases the property upon which it rests. This facility is shared between theMedical Products and BioScience businesses.
(2) The Guangzhou, China facility is owned by a joint venture in which Baxter owns a majority share.
(3) The Bloomington, Indiana location includes both owned and leased facilities.
The company also owns or operates shared distribution facilities throughout the world. In the United States andPuerto Rico, there are 11 shared distribution facilities with the principal facilities located in Memphis,Tennessee; Catano, Puerto Rico; North Cove, North Carolina; and Round Lake, Illinois. Internationally, we havemore than 100 shared distribution facilities located in Argentina, Australia, Austria, Belgium, Brazil, Brunei,Canada, Chile, China, Colombia, Costa Rica, the Czech Republic, Ecuador, France, Germany, Greece,Guatemala, Hong Kong, India, Indonesia, Ireland, Italy, Japan, Korea, Malaysia, Mexico, New Zealand, Panama,Peru, the Philippines, Poland, Portugal, Russia, Singapore, Spain, Sweden, Switzerland, Taiwan, Thailand,Turkey, the United Arab Emirates, the United Kingdom, Venezuela and Vietnam.
The company continually evaluates its plants and production lines and believes that its current facilities plus anyplanned expansions are generally sufficient to meet its expected needs and expected near-term growth. Expansionprojects and facility closings will be undertaken as necessary in response to market needs.
Item 3. Legal Proceedings.
Incorporated by reference to Note 13 in Item 8 of this Annual Report on Form 10-K.
Item 4. Mine Safety Disclosures.
Not Applicable.
Executive Officers of the Registrant
Robert L. Parkinson, Jr., age 62, is Chairman and Chief Executive Officer of Baxter, having served in thatcapacity since April 2004. Prior to joining Baxter, Mr. Parkinson was Dean of Loyola University Chicago Schoolof Business Administration and Graduate School of Business from 2002 to 2004. He retired from AbbottLaboratories in 2001 following a 25-year career, having served in a variety of domestic and internationalmanagement and leadership positions, including as President and Chief Operating Officer. Mr. Parkinson alsoserves on the Board of Directors of Chicago-based Northwestern Memorial HealthCare, as Chairman of theBoard of Northwestern Lake Forest Hospital, and as Vice-Chairman of the Loyola University Chicago Board ofTrustees.
Phillip L. Batchelor, age 51, is Corporate Vice President, Quality and Regulatory Affairs, having served in thatcapacity since February 2013. Mr. Batchelor served as Corporate Vice President, Quality from April 2010 toFebruary 2013 and as Vice President for BioScience Global Operations from April 2005 to April 2010. Prior tothat, Mr. Batchelor served in a variety of positions with Baxter in quality management and manufacturing.
14

Michael J. Baughman, age 48, is Corporate Vice President and Controller, having served in that capacity sinceMay 2006. Mr. Baughman joined Baxter in 2003 as Vice President of Corporate Audit and was appointedController in March 2005. Before joining Baxter, Mr. Baughman spent 16 years at PricewaterhouseCoopers LLP,in roles of increasing responsibility, which included audit partner and partner in the firm’s mergers andacquisitions practice.
Jean-Luc Butel, age 56, is Corporate Vice President and President, International, having served in that capacitysince February 2012. From August 2003 to February 2012, Mr. Butel held various positions with Medtronic, Inc.,the most recent of which was Executive Vice President and Group President, International. Prior to Medtronic,Mr. Butel served as President of Independence Technology, a Johnson & Johnson company, after serving in avariety of leadership roles at Becton, Dickinson Company from 1991 to 1999.
Robert M. Davis, age 46, is Corporate Vice President and President, Medical Products, having served in thatcapacity since October 2010. From May 2006 to July 2010, Mr. Davis served as Corporate Vice President andChief Financial Officer and from July to October 2010, he was Corporate Vice President and President, Renal.Prior to joining Baxter as Treasurer in 2004, Mr. Davis was with Eli Lilly and Company from 1990.
Ludwig N. Hantson, Ph.D., age 50, is Corporate Vice President and President, BioScience, having served in thatcapacity since October 2010. Dr. Hantson joined Baxter in May 2010 as Corporate Vice President and President,International. From 2001 to May 2010, Dr. Hantson held various positions at Novartis PharmaceuticalsCorporation, the most recent of which was Chief Executive Officer, Pharma North America. Prior to Novartis,Dr. Hantson spent 13 years with Johnson & Johnson in roles of increasing responsibility in marketing andclinical research and development.
Robert J. Hombach, age 47, is Corporate Vice President and Chief Financial Officer, having served in thatcapacity since July 2010. From February 2007 to March 2011, Mr. Hombach also served as Treasurer and fromDecember 2004 to February 2007, he was Vice President of Finance, Europe. Prior to that, Mr. Hombach servedin a number of finance positions of increasing responsibility in the planning, manufacturing, operations andtreasury areas at Baxter.
Jeanne K. Mason, Ph.D., age 57, is Corporate Vice President, Human Resources. Prior to joining Baxter in May2006, Dr. Mason was with General Electric from 1988, holding various leadership positions, the most recent ofwhich was with GE Insurance Solutions, a primary insurance and reinsurance business, where she wasresponsible for global human resource functions.
David P. Scharf, age 45, is Corporate Vice President and General Counsel, having served in that capacity sinceAugust 2009. Mr. Scharf joined Baxter in July 2005 and served in a number of positions, including DeputyGeneral Counsel and Corporate Secretary. Prior to joining Baxter, Mr. Scharf was with Guidant Corporationfrom 2002, in roles of increasing responsibility.
All executive officers hold office until the next annual election of officers and until their respective successorsare elected and qualified.
15

PART II
Item 5. Market for Registrant’s Common Equity, Related Stockholder Matters and Issuer Purchases ofEquity Securities.
The following table includes information about the company’s common stock repurchases during the three-month period ended December 31, 2012.
Issuer Purchases of Equity Securities
Period
Total Number ofShares
Purchased(1)(2)Average PricePaid per Share
Total Number of SharesPurchased as Part ofPublicly Announced
Programs(1)(2)
Approximate DollarValue of Sharesthat may yet be
Purchased Under theProgram(2)
October 1, 2012 throughOctober 31, 2012 . . . . . . . . . . . . . . 1,015,000 $61.23 1,015,000
November 1, 2012through November 30, 2012 . . . . . 3,655,900 $65.06 3,655,900
December 1, 2012through December 31, 2012 . . . . . . 1,736,900 $65.88 1,736,900
Total . . . . . . . . . . . . . . . . . . . . . . . . . . 6,407,800 $64.67 6,407,800 $1,933,526,858
(1) In December 2010, the company announced that its board of directors authorized the company to repurchaseup to $2.5 billion of its common stock on the open market or in private transactions. During the fourthquarter of 2012, the company repurchased 5.4 million shares for $348 million under this program. Therewas no remaining availability under this authorization at December 31, 2012.
(2) In July 2012, the company announced that its board of directors authorized the company to repurchase up to$2.0 billion of its common stock on the open market or in private transactions. During the fourth quarter of2012, the company repurchased 1.0 million shares for $66 million under this program. The remainingauthorization under this program totaled approximately $1.9 billion at December 31, 2012. This programdoes not have an expiration date.
Additional information required by this item is incorporated by reference to Note 16 in Item 8 of this AnnualReport on Form 10-K.
16

Item 6. Selected Financial Data.
as of or for the years ended December 31 20121,6 20112,6 20103,6 20094,6 20085,6
Operating Results Net sales . . . . . . . . . . . . . . . . . . . . . . . . . . . . . . . . . . $14,190 13,893 12,843 12,562 12,348(in millions) Net income attributable to Baxter7 . . . . . . . . . . . . . $ 2,326 2,224 1,420 2,205 2,014
Depreciation and amortization . . . . . . . . . . . . . . . . . $ 712 670 685 638 631Research and development expenses . . . . . . . . . . . . $ 1,156 946 915 917 868
Balance Sheet and Capital expenditures . . . . . . . . . . . . . . . . . . . . . . . . $ 1,161 960 963 1,014 954Cash FlowInformation Total assets . . . . . . . . . . . . . . . . . . . . . . . . . . . . . . . . $20,390 19,073 17,489 17,354 15,405(in millions) Long-term debt and lease obligations . . . . . . . . . . . $ 5,580 4,749 4,363 3,440 3,362
Common StockInformation
Average number of common sharesoutstanding (in millions)8 . . . . . . . . . . . . . . . . . . 551 569 590 607 625
Net income attributable to Baxter percommon share
Basic . . . . . . . . . . . . . . . . . . . . . . . . . . . . . . . . $ 4.22 3.91 2.41 3.63 3.22Diluted . . . . . . . . . . . . . . . . . . . . . . . . . . . . . . . $ 4.18 3.88 2.39 3.59 3.16
Cash dividends declared per common share . . . . . . $ 1.570 1.265 1.180 1.070 0.913Year-end market price per common share . . . . . . . . $ 66.66 49.48 50.62 58.68 53.59
Other Information Total shareholder return9 . . . . . . . . . . . . . . . . . . . . . 38.3% 0.0% (11.6%) 11.6% (6.3%)Common shareholders of record at year-end . . . . . . 42,067 43,534 43,715 48,286 48,492
1 Net income attributable to Baxter included a charge totaling $170 million primarily related to the settlement ofcertain pension obligations in the United States, a $150 million business optimization charge, businessdevelopment charges totaling $128 million (including $113 million in R&D charges for collaborationagreements), a benefit of $91 million related to the reduction of certain contingent payment liabilities, and anet benefit of $23 million primarily related to an adjustment to the COLLEAGUE infusion pump reserves.
2 Net income attributable to Baxter included a $192 million business optimization charge, a $79 million chargerelated to litigation and certain historical rebate and discount adjustments, and charges totaling $103 millionprincipally related to the write-down of Greek government bonds and a contribution to the Baxter InternationalFoundation.
3 Net income attributable to Baxter included a $588 million charge related to the recall of COLLEAGUEinfusion pumps. The charge impacted net sales by $213 million. Net income attributable to Baxter alsoincluded a $257 million business optimization charge, a $112 million impairment charge associated with thecompany’s divestiture of its U.S. multi-source generic injectables business, a $62 million litigation-relatedcharge, a $39 million charge to write off a deferred tax asset, business development charges of $34 million anda $28 million charge to write down accounts receivable in Greece.
4 Net income attributable to Baxter included a $79 million business optimization charge, an impairment chargeof $54 million and a charge of $27 million relating to infusion pumps.
5 Net income attributable to Baxter included charges of $125 million relating to infusion pumps, an impairmentcharge of $31 million and charges totaling $19 million relating to in-process research and development.
6 Refer to the notes to the consolidated financial statements for information regarding other charges and incomeitems.
7 Excludes net income attributable to noncontrolling interests of $32 million, $7 million, $10 million, and $11million in 2011, 2010, 2009, and 2008, respectively.
8 Excludes common stock equivalents.
9 Represents the total of appreciation (decline) in market price plus cash dividends declared on common shares.
17

Item 7. Management’s Discussion and Analysis of Financial Condition and Results of Operations.
The following commentary should be read in conjunction with the consolidated financial statements andaccompanying notes.
EXECUTIVE OVERVIEW
Description of the Company and Business SegmentsBaxter International Inc. (Baxter or the company), through its subsidiaries, develops, manufactures and marketsproducts that save and sustain the lives of people with hemophilia, immune disorders, infectious diseases, kidneydisease, trauma, and other chronic and acute medical conditions. As a global, diversified healthcare company,Baxter applies a unique combination of expertise in medical devices, pharmaceuticals and biotechnology tocreate products that advance patient care worldwide.
The company operates in two segments. BioScience processes recombinant and plasma-based proteins to treathemophilia and other bleeding disorders; plasma-based therapies to treat immune deficiencies, alpha-1antitrypsin deficiency, burns and shock, and other chronic and acute blood-related conditions; biosurgeryproducts; and select vaccines. Medical Products manufactures intravenous (IV) solutions and administrationsets, premixed drugs and drug-reconstitution systems, pre-filled vials and syringes for injectable drugs, IVnutrition products, infusion pumps, and inhalation anesthetics, as well as provides products and services relatedto pharmacy compounding, drug formulation and packaging technologies. In addition, the Medical Productsbusiness provides products and services to treat end-stage renal disease, or irreversible kidney failure. Thebusiness manufactures solutions and other products for peritoneal dialysis (PD), a home-based therapy, and alsodistributes products for hemodialysis (HD), which is generally conducted in a hospital or clinic.
Baxter has approximately 51,000 employees and conducts business in over 100 countries. The companygenerates approximately 60% of its revenues outside the United States, and maintains over 50 manufacturingfacilities and over 100 distribution facilities in the United States, Europe, Asia-Pacific, Latin America andCanada.
Financial ResultsBaxter’s 2012 results reflect the company’s success from a financial, operational and strategic perspective, as thecompany was able to generate sales growth and improved profitability through disciplined execution of thecompany’s strategies. Despite a challenging global macroeconomic environment in 2012, Baxter was able tostrengthen its core portfolio by expanding access and increasing standards of care globally while also advancingthe product pipeline through record research and development (R&D) spending and executing multiple businessdevelopment initiatives.
Baxter’s global net sales totaled $14.2 billion in 2012, an increase of 2% over 2011, including an unfavorableforeign currency impact of 3 percentage points. International sales totaled $8.1 billion, a decrease of 1%compared to 2011, including an unfavorable foreign currency impact of 5 percentage points. Sales in the UnitedStates totaled $6.1 billion in 2012, an increase of 6% over 2011.
Baxter’s net income for 2012 totaled $2.3 billion, or $4.18 per diluted share, compared to $2.2 billion, or $3.88per diluted share, in the prior year. Net income in 2012 included certain items which reduced income beforeincome taxes by $334 million and net income by $190 million, or $0.35 per diluted share, as further discussed inthe Results of Operations section below. Net income in 2011 included certain items which reduced income beforeincome taxes by $374 million and net income by $247 million, or $0.43 per diluted share, as further discussed inthe Results of Operations section below. Excluding these special items in both years, Baxter’s adjusted netincome in 2012 was $2.5 billion, which represents an increase of 2% over 2011, while adjusted earnings perdiluted share of $4.53 increased 5% from $4.31 in 2011. Adjusted net income and adjusted earnings per diluted
18

share, each excluding special items, are non-GAAP (generally accepted accounting principles) financialmeasures. The company believes that these non-GAAP measures, when used in conjunction with resultspresented in accordance with GAAP, may provide a more complete understanding of the company’s operationsand may facilitate a fuller analysis of the company’s results of operations, particularly in evaluating performancefrom one period to another.
Baxter’s financial results included R&D expenses totaling $1.2 billion in 2012, which reflects the acceleration ofR&D spending to drive late-stage development programs through product approvals in both developed andemerging markets, while also focusing on enhancing the company’s early-stage and exploratory R&D. Duringthe year, the company obtained regulatory approvals for new products or new indications of existing productsthat will improve clinical outcomes for patients and provide quality-of-life benefits, while also initiating andadvancing a number of clinical trials that have the potential to impact the treatment and delivery of care forvarious chronic diseases, such as hemophilia, and certain forms of cancer. Additionally, the increase in R&Dspending reflects upfront payments made during the year as the company entered into new collaborationarrangements and re-aligned certain of the company’s R&D activities. Refer to the discussion below for furtherinformation regarding R&D activity in 2012.
The company’s financial position remains strong, with cash flows from operations totaling $3.1 billion in 2012.The company has continued to execute on its disciplined capital allocation framework, which was designed tooptimize shareholder value creation through targeted capital investments, share repurchases and dividends, aswell as acquisitions and other business development initiatives as discussed in Strategic Objectives below.
Capital investments totaled $1.2 billion in 2012 as the company continues to invest across its businesses tosupport future growth, including additional investments in support of new and existing product capacityexpansions in the BioScience segment. The company’s investments in capital expenditures in 2012 were focusedon projects that improve the company’s cost structure and manufacturing capabilities and support its strategy ofgeographic expansion with select investments in growing markets.
The company also continued to return value to its shareholders in the form of share repurchases and dividends.During 2012, the company repurchased 25 million shares of common stock for $1.5 billion, and paid cashdividends to its shareholders totaling $804 million.
Strategic ObjectivesBaxter continues to focus on several key objectives to successfully execute its long-term strategy to achievesustainable growth and deliver shareholder value. Baxter’s diversified healthcare model, its broad portfolio ofproducts that treat life-threatening acute or chronic conditions, and its global presence are core components of thecompany’s strategy to achieve these objectives. During 2012, the company further defined its strategic objectivesby identifying four key strategic growth vectors: advancing the core portfolio globally, driving innovationthrough the R&D pipeline, enhancing growth with acquisitions and collaborations, and developing unique public-private partnerships.
Advancing the Core Portfolio GloballyBaxter is well-positioned in the market, despite challenging global economic conditions, due to the breadth anddiversity of the company’s portfolio, which will serve as a solid foundation for future growth. In the BioSciencebusiness, the company’s products treat bleeding disorders and a range of immune and neurological disorders,both of which are under-diagnosed and under-treated globally. The Medical Products business offers innovativeproducts for treatment of end-stage renal disease and other therapies and technologies supporting the work ofhospital pharmacies and serving the needs of patients in acute care settings.
While Baxter is a leader in several of the markets noted above, there is significant potential to expand across thecompany’s core portfolio by ensuring improved access to Baxter’s portfolio, bringing the benefits of theseproducts to more patients globally. The starting point for this growth will be through geographic expansion, new
19
indications, broader access, increased diagnosis, and differentiated value. Through continued innovation,investment and collaboration, Baxter seeks to advance new therapies, improve the safety and cost-effectivenessof treatments and expand access to care.
Baxter has focused on increasing access to plasma-based treatments as a key area to advance the company’s coreportfolio. With demand for plasma-based products growing, in 2012 Baxter initiated construction of a new, state-of-the-art plasma fractionation facility in Covington, Georgia. The expected capital investment of over $1 billionover five years will add up to three million liters of annual fractionation capacity to Baxter’s existing productionlevels, and will provide the flexibility to support further expansion in the future. Commercial operation of thenew facility is expected to begin in 2018.
Baxter also maintains focus on continued international penetration for many of our products, including bringingnew recombinant therapy options to more hemophilia patients worldwide. In 2012, Baxter announced theapproval in China of ADVATE [Recombinant Human Coagulation Factor VIII for injection] for the control andprophylaxis of bleeding episodes in individuals with hemophilia A (congenital factor VIII deficiency). Refer tothe discussion below for additional information on recent ADVATE developments.
Additionally, Baxter has expanded its offerings to hospital pharmacies through the launch of new products andexpansion of existing products into new markets. The company’s portfolio includes premixed parenteral, orintravenous, nutrition products; premixed drugs; IV infusion pumps and administration sets; inhaled anesthetics,and other specialty pharmaceuticals. Baxter launched a line of triple-chamber parenteral nutrition systems in2011 with NUMETA (emulsion for infusion), which became available in several countries in 2012, particularlythroughout Europe. During 2012, the company introduced its latest triple-chamber system for adults, OLIMEL(Amino Acids, Dextrose and Lipids, with/without Electrolytes), into new markets in Asia-Pacific, Europe andLatin America.
Driving Innovation through the R&D PipelineR&D innovation and scientific productivity continue to be key strategic priorities for Baxter. Key developmentsin 2012 included the following:
Expanding portfolio with new product launches in key geographic regions:
• Regulatory approval in China for ADVATE for the control and prophylaxis of bleeding episodes inindividuals with hemophilia A, with an expected product launch in 2013. With this action, ADVATE isnow approved in over 50 countries worldwide;
• Approval of OLIMEL in Asia-Pacific, Europe, Latin America and Canada and NUMETA (pediatricnutritional emulsion for infusion) in select European countries;
• U.S. Food and Drug Administration (FDA) approval of GAMMAGARD LIQUID [Immune GlobulinInfusion (Human)] 10% as a treatment for multifocal motor neuropathy (MMN), the firstimmunoglobulin treatment approved for MMN patients in the United States;
• FDA approval of TISSEEL [Fibrin Sealant] to include the indication for general hemostasis in surgerywhen control of bleeding by standard surgical techniques is ineffective or impractical;
• Regulatory approval in Europe for VEPACEL, a pre-pandemic influenza vaccine against the H5N1subtype of influenza A (commonly known as bird or avian flu), in all European Union Member States;and
• FDA approval and launch of a new 4000 IU dosage strength of ADVATE [Antihemophilic Factor(Recombinant), Plasma/Albumin-Free Method]. As the only company to offer a 4000 IU dosagestrength, Baxter provides the convenience of a single vial dosing opportunity for many adult patients.
20

Products in late-stage development:
• Initiation of a second, confirmatory Phase III trial of Baxter’s clinical program evaluating the use of itsGAMMAGARD LIQUID 10% (marketed as KIOVIG outside the United States and Canada), for thetreatment of mild to moderate Alzheimer’s disease, and
• Initiation of a Phase III pivotal clinical trial to evaluate the efficacy and safety of adult autologous (anindividual’s own) CD34+ stem cells primarily to increase exercise capacity and secondarily to reducechest pain frequency in patients with otherwise unmanageable heart disease, based on a biologicalregenerative approach.
Increasing R&D investment in key focus areas:
• Completion of a Phase I clinical trial of the company’s lead investigational candidate, BAX 855, alonger-acting (PEGylated) form of a full-length recombinant factor VIII (rFVIII) protein, to assess thefrequency of infusions in previously treated patients with severe hemophilia A;
• Completion of the first U.S. study of the company’s home HD system and initiation of a nocturnal in-center trial in Canada. Data from both trials will support the company’s submission for CE Mark inEurope in 2013;
• Submission of a biologics license application to FDA for approval of BAX 326, a recombinant factorIX (rFIX) protein being investigated for the treatment and prophylaxis of bleeding episodes for patientsover 12 years of age with hemophilia B; and
• Initiation of a Phase I clinical trial for patients with malignant solid tumors evaluating a fully-human,recombinant anti-MIF (anti-macrophage migration inhibitory factor) monoclonal antibody withpotential to be a new therapeutic agent in treatment of cancer.
Enhancing Growth with Acquisitions and CollaborationsBaxter has accelerated its pace of acquisitions and collaborations in recent years. Key developments in 2012included the following:
• The acquisition of Synovis Life Technologies, Inc. (Synovis), a publicly-traded company that providesbiological and mechanical products for soft tissue repair used in a variety of surgical procedures, whichcomplements and expands the portfolio of Baxter’s biosurgery products;
• The exercise of an option to purchase the remaining equity of Sigma International General MedicalApparatus, LLC (SIGMA), which culminated the relationship that began in 2009 when Baxter acquireda 40% stake in SIGMA and became the exclusive global distributor of SIGMA’s smart infusion pumptechnology;
• The execution of a European licensing agreement with Onconova Therapeutics, Inc. (Onconova) forrigosertib, a novel targeted anti-cancer compound currently in a Phase III study for the treatment of agroup of rare hematologic malignancies called Myelodysplastic Syndromes and a Phase II/III study forpancreatic cancer, with Baxter obtaining commercialization rights in Europe for these indications;
• The execution of an exclusive agreement with Chatham Therapeutics, LLC (Chatham) for thedevelopment and commercialization of potential treatments for hemophilia B utilizing Chatham’s genetherapy technology; and
• The commencement of activities under the collaboration agreement with Momenta Pharmaceuticals,Inc. (Momenta) to develop and commercialize up to six follow-on biologic products, also known asbiosimilars, which replicate existing, branded biologics used in the treatment of a number of diseases,including cancer, autoimmune disorders and other chronic conditions. The company selected threeproducts under the collaboration agreement during 2012.
21

Baxter also continues to benefit from the integration of prior year acquisitions, including the 2011 acquisition ofBaxa Corporation (Baxa), a privately-held company that manufactures and markets devices, systems andsoftware for the safe and efficient preparation, handling, packaging and administration of fluid medications. Theacquisition complements Baxter’s existing portfolio of nutrition and drug delivery systems and provides Baxterwith a comprehensive solution to fulfill the majority of patients’ nutritional requirements and increase efficiencyin the pharmacy.
In 2012, Baxter began to make equity investments in companies developing high-potential technologies throughBaxter Ventures, a strategic initiative established in 2011 to invest in early-stage companies developing productsand therapies to accelerate innovation and growth for the company.
The company expects to continue to further supplement its internal R&D activities and pursue acceleratedgrowth by fully capitalizing on Baxter’s diversified healthcare model with its investment in other businessdevelopment opportunities, including acquisitions, collaborations and alliances, that complement our currentbusinesses, enhance our portfolio, and leverage our core strengths.
Gambro ABIn December 2012, Baxter entered into a definitive agreement to acquire Gambro AB (Gambro), a privately helddialysis product company based in Lund, Sweden. Gambro is a global medical technology company focused ondeveloping, manufacturing and supplying dialysis products and therapies for patients with acute or chronickidney disease. The transaction will provide Baxter with a broad and complementary dialysis product portfolio,while further advancing the company’s geographic footprint in the dialysis business. In addition, the companywill augment its pipeline by adding Gambro’s next-generation monitors, dialyzers, devices and dialysis solutions.Under the terms of the agreement, Baxter will provide total consideration of approximately $4 billion for theacquisition, including pre-acquisition debt. The transaction is expected to close at the end of the second quarterof 2013, subject to regulatory approvals and other closing conditions.
The company plans to issue at least $3.0 billion of debt during the first half of 2013 to fund the plannedacquisition of Gambro, which will significantly increase the company’s outstanding debt. As a result, stockrepurchases in 2013 are expected to decline from 2012 and 2011 levels. Additionally, the acquisition of Gambrois expected to have a dilutive impact on earnings in 2013 of $0.10 to $0.15 per diluted share, assuming thetransaction closes at the end of the second quarter of 2013.
Inspiration BioPharmaceuticals, Inc. / Ipsen Pharma S.A.S.In January 2013, Baxter agreed to acquire the investigational hemophilia compound OBI-1 and related assetsfrom Inspiration BioPharmaceuticals, Inc. (Inspiration), as well as certain other OBI-1 related assets, includingmanufacturing operations, from Ipsen Pharma S.A.S. in conjunction with Inspiration’s ongoing bankruptcyproceedings. OBI-1 is a recombinant porcine factor VIII (rpFVIII) being investigated for treatment of bleeding inpeople with acquired hemophilia A and congenital hemophilia A patients with inhibitors, and is currently inPhase III clinical studies.
Under the terms of the agreement, Baxter will make an upfront payment of $50 million for the OBI-1 assets,including the manufacturing operations. In the future, Baxter may make payments of up to $20 million based onregulatory approval of the acquired hemophilia A indication in the United States and first additional country.Additional payments may be due upon approval of additional indications, through net sales payments, and assales milestones when sales exceed $100 million. The transaction is subject to regulatory approval and iscurrently under review by the Federal Trade Commission.
22

Public-Private PartnershipsIn addition to the company’s business development activities, Baxter is focused on pursuing innovation throughunique business models and the development of public-private partnerships. During 2012, the company enteredinto the following public-private partnerships:
• An exclusive 20-year partnership with Hemobrás to provide hemophilia patients in Brazil greateraccess to recombinant factor VIII (rFVIII) therapy for the treatment of hemophilia A. Through thisinnovative partnership, Baxter will be the exclusive provider of Brazil’s recombinant FVIII treatmentover the next 10 years, while the companies work together on the technology transfer to supportdevelopment of local manufacturing capacity. Baxter will receive cash payments for product it suppliesto Hemobrás and, following completion of the technology transfer, royalties on recombinant FVIIIproduced by Hemobrás;
• A 10-year contract manufacturing agreement with Sanquin Blood Supply Foundation of theNetherlands to enhance supply of plasma-derived treatments for immune disorders, hemophilia, traumaand other critical conditions (with production scheduled to begin in 2014); and
• A partnership with China’s National Institute of Hospital Administration under the Ministry of Healthto help improve access to PD in China’s rural communities.
In addition to the above public-private partnerships, in 2012 Baxter also started construction of a new PDmanufacturing facility in Thailand, supporting the country’s efforts to reinforce PD as its first-line dialysistreatment.
Responsible Corporate CitizenThe company strives for continued growth and profitability, while maintaining and accelerating its focus onacting as a responsible corporate citizen. At Baxter, sustainability means creating a lasting social, environmentaland economic value by addressing the needs of the company’s wide-ranging stakeholder base.
Baxter’s comprehensive sustainability program is focused on areas where the company is uniquely positioned tomake a positive impact. Baxter and the Baxter International Foundation provide financial support and productdonations in support of critical needs, from assisting underserved communities to providing emergency relief forcountries experiencing natural disasters.
Baxter’s priorities also include sound environmental stewardship. Throughout 2012 the company continued toimplement a range of water conservation strategies and facility-based energy saving initiatives. In the area ofproduct stewardship and life cycle management, Baxter is pursuing efforts such as sustainable design andreduced packaging. Baxter is also responding to the challenges of climate change through innovative greenhousegas emissions-reduction programs, such as shifting to less carbon-intensive energy sources and modes of producttransport.
Risk FactorsThe company’s ability to sustain long-term growth and successfully execute the strategies discussed abovedepends in part on the company’s ability to manage within an increasingly competitive and regulatedenvironment and to address the other risk factors described in Item 1A of this Annual Report on Form 10-K.
23

RESULTS OF OPERATIONS
Special ItemsThe company’s results of operations included special items that have been excluded from its non-GAAPmeasures provided in the Financial Results section above. The following table provides a summary of the impactof special items on the company’s results of operations for 2012, 2011, and 2010.
Percent change
years ended December 31 (in millions) 2012 2011 2010 2012 2011
Net sales . . . . . . . . . . . . . . . . . . . . . . . . . . . . . . . . . . . . . . . . . . . $14,190 $13,893 $12,843 2% 8%COLLEAGUE infusion pump items . . . . . . . . . . . . . . . . . . . . . — — 213
Adjusted net sales . . . . . . . . . . . . . . . . . . . . . . . . . . . . . . . . . . . $14,190 $13,893 $13,056 2% 6%
Gross margin . . . . . . . . . . . . . . . . . . . . . . . . . . . . . . . . . . . . . . . $ 7,301 $ 7,046 $ 5,958 4% 18%COLLEAGUE infusion pump items . . . . . . . . . . . . . . . . . . . . . (23) — 588Business optimization charges (including certain asset
impairments) . . . . . . . . . . . . . . . . . . . . . . . . . . . . . . . . . . . . . . 62 95 132Business development charges . . . . . . . . . . . . . . . . . . . . . . . . . . 6 — —
Adjusted gross margin . . . . . . . . . . . . . . . . . . . . . . . . . . . . . . . $ 7,346 $ 7,141 $ 6,678 3% 7%
% of Adjusted net sales . . . . . . . . . . . . . . . . . . . . . . . . . . . . . . 51.8% 51.4% 51.1% 0.4 pts 0.3 pts
Marketing and administrative expenses . . . . . . . . . . . . . . . . . $ 3,324 $ 3,154 $ 2,907 5% 8%Business optimization charges (including certain asset
impairments) . . . . . . . . . . . . . . . . . . . . . . . . . . . . . . . . . . . . . . (60) (97) (125)Business development charges . . . . . . . . . . . . . . . . . . . . . . . . . . (9) — —Pension-related items . . . . . . . . . . . . . . . . . . . . . . . . . . . . . . . . . (170) — —AWP litigation and historical rebate and discount items . . . . . . — (79) —Asset impairment and other charges . . . . . . . . . . . . . . . . . . . . . — (41) (28)
Adjusted marketing and administrative expenses . . . . . . . . $ 3,085 $ 2,937 $ 2,754 5% 7%
% of Adjusted net sales . . . . . . . . . . . . . . . . . . . . . . . . . . . . . . 21.7% 21.1% 21.1% 0.6 pts 0 pts
Research and development expenses . . . . . . . . . . . . . . . . . . . $ 1,156 $ 946 $ 915 22% 3%Business optimization charges (including certain asset
impairments) . . . . . . . . . . . . . . . . . . . . . . . . . . . . . . . . . . . . . . (28) — —Business development charges . . . . . . . . . . . . . . . . . . . . . . . . . . (113) — (34)
Adjusted research and development expenses . . . . . . . . . . . . $ 1,015 $ 946 $ 881 7% 7%
% of Adjusted net sales . . . . . . . . . . . . . . . . . . . . . . . . . . . . . . 7.2% 6.8% 6.7% 0.4 pts 0.1 pts
Other (income) expense, net . . . . . . . . . . . . . . . . . . . . . . . . . . $ (155) $ 83 $ 159 N/M N/MGains on the reduction of contingent payment liabilities . . . . . . 91 — —Asset impairment and other charges . . . . . . . . . . . . . . . . . . . . . — (62) (112)Litigation-related charges . . . . . . . . . . . . . . . . . . . . . . . . . . . . . . — — (62)
Adjusted other (income) expense, net . . . . . . . . . . . . . . . . . . . $ (64) $ 21 $ (15) N/M N/M
Income tax expense . . . . . . . . . . . . . . . . . . . . . . . . . . . . . . . . . . $ 563 $ 553 $ 463 2% 19%Special items . . . . . . . . . . . . . . . . . . . . . . . . . . . . . . . . . . . . . . . . 144 127 135
Adjusted income tax expense . . . . . . . . . . . . . . . . . . . . . . . . . . $ 707 $ 680 $ 598 4% 14%
% of Adjusted pre-tax income . . . . . . . . . . . . . . . . . . . . . . . . . 21.9% 21.4% 20.1% 0.5 pts 1.3 pts
The company believes that these non-GAAP measures, when used in conjunction with results presented inaccordance with GAAP, may provide a more complete understanding of the company’s operations and mayfacilitate a fuller analysis of the company’s results of operations, particularly in evaluating performance from oneperiod to another.
24

In 2012 and 2010, the company’s results were impacted by certain items related to the recall of the company’sCOLLEAGUE infusion pumps from the U.S. market and other actions the company is taking outside of theUnited States. In 2010, the company recorded a $588 million charge related to the COLLEAGUE infusion pumprecall, with $213 million recorded as a reduction of net sales and $375 million recorded in cost of sales. In 2012,the company recognized a net benefit of $23 million in cost of sales primarily related to an adjustment to theCOLLEAGUE infusion pump reserve when the company substantially completed its recall activities in theUnited States. Refer to Note 6 for further information regarding the COLLEAGUE infusion pump charge andrelated reserve adjustment.
In 2012, 2011 and 2010, the company’s results were impacted by costs associated with actions implemented bythe company to optimize its overall cost structure on a global basis. These actions included streamlining thecompany’s international operations, rationalizing its manufacturing facilities, improving its general andadministrative infrastructure, and, in 2012, re-aligning certain R&D activities. The company recorded pre-taxbusiness optimization charges of $150 million, $192 million, and $257 million in 2012, 2011, and 2010,respectively, which impacted cost of sales, marketing and administrative expenses, and, in 2012, R&D expenses.Refer to Note 6 for further information regarding these charges.
In 2012, the company also recorded pre-tax charges of $170 million primarily related to pension settlementcharges and other pension-related items, and business development charges of $128 million principally related toupfront payments for collaboration agreements. Also included in 2012 results were gains of $53 million in thefirst quarter of 2012 and $38 million in the second quarter of 2012 for the reduction of certain contingentpayment liabilities related to the prior acquisitions of Prism Pharmaceuticals, Inc. (Prism) and ApaTech Limited(ApaTech), respectively. Refer to Note 11 for further information regarding the pension settlement charges, Note4 for further information regarding the business development charges, and Note 8 for further informationregarding the gains from reductions of contingent payment liabilities.
In 2011, the company also recorded pre-tax charges of $79 million related to the resolution of litigationpertaining to average wholesale prices (AWP) and certain historical rebate and discount adjustments, $62 millionin asset impairments primarily related to the write-down of Greek government bonds, and $41 million principallyrelated to a contribution to the Baxter International Foundation.
In 2010, the company also recorded a $112 million impairment charge associated with the company’s divestitureof its U.S. multi-source generic injectables business, a $62 million litigation-related charge, a $39 million chargeto write off a deferred tax asset, business development charges of $34 million and a $28 million charge to writedown accounts receivable in Greece.
25

Net SalesPercent change
At actualcurrency rates
At constantcurrency rates
years ended December 31 (in millions) 2012 2011 2010 2012 2011 2012 2011
BioScience . . . . . . . . . . . . . . . . . . . . . . . . . . . . . . . . . $ 6,237 $ 6,053 $ 5,640 3% 7% 6% 5%Medical Products . . . . . . . . . . . . . . . . . . . . . . . . . . . . . 7,953 7,840 7,203 1% 9% 4% 6%
Total net sales . . . . . . . . . . . . . . . . . . . . . . . . . . . . . . $14,190 $13,893 $12,843 2% 8% 5% 6%
Percent change
At actualcurrency rates
At constantcurrency rates
years ended December 31 (in millions) 2012 2011 2010 2012 2011 2012 2011
United States . . . . . . . . . . . . . . . . . . . . . . . . . . . . . . . . $ 6,056 $ 5,709 $ 5,264 6% 8% 6% 8%International . . . . . . . . . . . . . . . . . . . . . . . . . . . . . . . . 8,134 8,184 7,579 (1%) 8% 4% 4%
Total net sales . . . . . . . . . . . . . . . . . . . . . . . . . . . . . . $14,190 $13,893 $12,843 2% 8% 5% 6%
Foreign currency unfavorably impacted net sales by 3 percentage points in 2012 principally due to thestrengthening of the U.S. Dollar relative to the Euro. Foreign currency favorably impacted net sales by 2percentage points in 2011, principally due to the weakening of the U.S. Dollar relative to the Euro, the AustralianDollar and the Japanese Yen. Excluding the impact of foreign currency, total net sales growth was 5% and 6% in2012 and 2011, respectively, primarily driven by improved sales volumes (demand).
In 2012, the recent acquisitions of Synovis and Baxa contributed 2 percentage points towards sales growth during2012. Total net sales growth in 2011 was favorably impacted by 2 percentage points due to the COLLEAGUEinfusion pump charge, which reduced net sales in the Medical Products segment in 2010 by $213 million.Additionally, included in net sales in the Medical Products segment were sales of $58 million and $198 millionin 2011 and 2010, respectively, related to the U.S. multi-source generic injectables business, which was divestedby the company in the first half of 2011. The divestiture of this business unfavorably impacted total net salesgrowth by 1 percentage point in both 2012 and 2011. Refer to Note 2 for further information regarding thisdivestiture, Note 4 for further information regarding the Synovis and Baxa acquisitions, and Note 6 for furtherinformation regarding the COLLEAGUE infusion pump charge.
The comparisons presented at constant currency rates reflect comparative local currency sales at the prior year’sforeign exchange rates. This measure provides information on the change in net sales assuming that foreigncurrency exchange rates had not changed between the prior and the current period. The company believes that thenon-GAAP measure of change in net sales at constant currency rates, when used in conjunction with the GAAPmeasure of change in net sales at actual currency rates, may provide a more complete understanding of thecompany’s operations and can facilitate a fuller analysis of the company’s results of operations, particularly inevaluating performance from one period to another.
26

BioScienceThe following is a summary of net sales by product category in the BioScience segment.
Percent change
At actualcurrency rates
At constantcurrency rates
years ended December 31 (in millions) 2012 2011 2010 2012 2011 2012 2011
Recombinants . . . . . . . . . . . . . . . . . . . . . . . . . . . . . . . . . $2,234 $2,212 $2,095 1% 6% 4% 3%Antibody Therapy . . . . . . . . . . . . . . . . . . . . . . . . . . . . . 1,593 1,541 1,354 3% 14% 5% 13%Plasma Proteins . . . . . . . . . . . . . . . . . . . . . . . . . . . . . . . 1,464 1,440 1,368 2% 5% 4% 5%Regenerative Medicine . . . . . . . . . . . . . . . . . . . . . . . . . . 673 580 527 16% 10% 19% 8%Other . . . . . . . . . . . . . . . . . . . . . . . . . . . . . . . . . . . . . . . . 273 280 296 (3%) (6%) 5% (15%)
Total BioScience net sales . . . . . . . . . . . . . . . . . . . . . . $6,237 $6,053 $5,640 3% 7% 6% 5%
Net sales in the BioScience segment increased 3% and 7% in 2012 and 2011, respectively (with an unfavorableforeign currency impact of 3 percentage points in 2012 and a favorable foreign currency impact of 2 percentagepoints in 2011). Excluding the impact of foreign currency, the principal drivers impacting net sales were thefollowing:
• In the Recombinants product category, sales growth in both years was driven primarily by strong U.S.demand for the company’s advanced recombinant therapy, ADVATE. Sales growth was partially offsetby lower tender sales in Australia in 2012 and in the United Kingdom in 2011.
• In the Antibody Therapy product category, sales increased in both years primarily as a result of demandin the United States for GAMMAGARD LIQUID, the liquid formulation of the antibody replacementtherapy. Also contributing to sales growth in 2012 was the favorable impact from pricing benefitsrelated to shifts in geographic mix as the company optimized its global supply in light of a planned,temporary facility shutdown during the second half of 2012. Sales growth in 2011 was favorablyimpacted by incremental volume resulting from a competitor being out of the market, while the returnof the competitor to the market partially offset sales growth in 2012.
• Sales in the Plasma Proteins product category were favorably impacted in both years by strong demandfor FEIBA (an anti-inhibitor bypass therapy). Also contributing to sales growth in 2012 were improvedsales of alpha-1 products (for treatment of hereditary emphysema) and higher international sales ofalbumin. Sales growth in 2011 was also driven by improved demand for plasma-derived factor VIIIafter a reduction in sales in 2010.
• In the Regenerative Medicine product category, sales in 2012 increased primarily as a result of the firstquarter 2012 acquisition of Synovis, a biological and mechanical products company. Also contributingto sales growth in both years was increased global demand for the company’s surgical sealants,including FLOSEAL and TISSEEL. Partially offsetting this growth in both years were lower U.S. salesof ACTIFUSE bone void filler products.
• In the Other product category, sales growth in 2012 was primarily driven by higher international salesof FSME-IMMUN (a tick-borne encephalitis vaccine) and milestone payments related to ongoingcollaborations with governments on the development of influenza vaccines. In 2011, strong sales ofFSME-IMMUN driven by strong international demand were more than offset by lower influenzarevenues, as the first quarter of 2010 benefited from sales of CELVAPAN H1N1 pandemic vaccine.
27

Medical ProductsThe following is a summary of net sales by product category in the Medical Products segment.
Percent change
At actualcurrency rates
At constantcurrency rates
years ended December 31 (in millions) 2012 2011 2010 2012 2011 2012 2011
Renal . . . . . . . . . . . . . . . . . . . . . . . . . . . . . . . . . . . . . . . . $2,527 $2,530 $2,389 0% 6% 2% 2%Global Injectables . . . . . . . . . . . . . . . . . . . . . . . . . . . . . . 2,075 2,004 1,891 4% 6% 5% 3%IV Therapies . . . . . . . . . . . . . . . . . . . . . . . . . . . . . . . . . . 1,930 1,802 1,678 7% 7% 10% 5%Infusion Systems . . . . . . . . . . . . . . . . . . . . . . . . . . . . . . 813 901 655 (10%) 38% (9%) 35%Anesthesia . . . . . . . . . . . . . . . . . . . . . . . . . . . . . . . . . . . 545 537 525 1% 2% 3% 1%Other . . . . . . . . . . . . . . . . . . . . . . . . . . . . . . . . . . . . . . . . 63 66 65 (5%) 2% (9%) 2%
Total Medical Products net sales . . . . . . . . . . . . . . . . $7,953 $7,840 $7,203 1% 9% 4% 6%
Net sales in the Medical Products segment increased 1% and 9% in 2012 and 2011, respectively (with anunfavorable foreign currency impact of 3 percentage points in 2012 and a favorable foreign currency impact of 3percentage points in 2011). Excluding the impact of foreign currency, the principal drivers impacting net saleswere the following:
• In the Renal product category, the favorable impact from continued growth in the number of PDpatients in Asia, Latin America and the United States for both years was partially offset by lower salesof HD products.
• Sales growth in the Global Injectables product category in 2012 was primarily driven by a priceincrease for cyclophosphamide (a generic oncology drug) in the United States. Sales in both yearsbenefited from improved sales in the pharmaceutical partnering and pharmacy compoundingbusinesses, in addition to the favorable contribution from the fourth quarter 2011 acquisition of Baxa.The 2011 divestiture of the U.S. multi-source generic injectables business unfavorably impacted totalnet sales growth by 3 and 9 percentage points during 2012 and 2011, respectively.
• IV Therapies sales growth in both years was driven by increased demand for IV solutions and strongsales of nutrition products, including the favorable impact, particularly in 2012, of the Baxaacquisition. Also contributing to growth in 2011 were market share gains in the United States, partiallyas a result of competitor supply issues.
• In the Infusion Systems product category, sales declined during 2012 due to lower global sales ofaccess sets used in the administration of IV solutions and lower sales of SIGMA Spectrum infusionpumps, both of which were related to COLLEAGUE infusion pump recall activities in the UnitedStates which were substantially completed in July of 2012. Sales growth in 2011 reflected increasedsales of SIGMA Spectrum infusion pumps, partially offset by lower global sales of access sets in thesecond half of the year. Sales growth in 2011 was also favorably impacted by 33 percentage points as aresult of the COLLEAGUE infusion pump charge in 2010.
• Within the Anesthesia product category, sales growth in both years was driven primarily by improvedinternational growth from increased penetration of SUPRANE (desflurane) and generic sevoflurane,particularly in Europe and Asia. Sales growth in both years was partially offset by lower demand forinhaled anesthetics in the United States, as well as competitive pricing pressures for genericsevoflurane.
• The Other product category includes revenues of $38 million, $36 million and $46 million for 2012,2011 and 2010, respectively, associated with the manufacturing, distribution and other servicesprovided by the company to Fenwal Inc. subsequent to the divestiture of the Transfusion Therapiesbusiness in 2007, which had previously been reported separately.
28

Gross Margin and Expense RatiosChange
years ended December 31 (as a percent of net sales) 2012 2011 2010 2012 2011
Gross margin . . . . . . . . . . . . . . . . . . . . . . . . . 51.5% 50.7% 46.4% 0.8 pts 4.3 ptsMarketing and administrative expenses . . . . . 23.4% 22.7% 22.6% 0.7 pts 0.1 pts
Gross MarginThe special items identified above had an unfavorable impact of 0.3, 0.7 and 4.7 percentage points on the grossmargin percentage in 2012, 2011, and 2010, respectively. Refer to the Special Items caption above for additionaldetail.
In addition to the impact of the special items, the gross margin percentage in 2012 improved compared to 2011due to the benefit from sales growth in higher margin products in the BioScience segment, the resolution of prioryear manufacturing issues at the company’s Castlebar, Ireland facility, and a modest favorable impact of foreigncurrency. These improvements in gross margin were partially offset by margin dilution from businessdevelopment activities, increased pension plan costs and government austerity measures.
In addition to the impact of the special items, the gross margin percentage in 2011 improved compared to 2010 asa result of the benefit from a favorable business mix due to sales growth of select higher margin products in theBioScience and Medical Products segments, as well as the favorable impact of the divestiture of the lowermargin U.S. multi-source generic injectables business. Refer to Note 2 for further information regarding thedivestiture. Partially offsetting these improvements were costs associated with manufacturing issues at theCastlebar, Ireland facility and an increase in pension plan costs in 2011.
Marketing and Administrative ExpensesThe special items identified above had an unfavorable impact of 1.7, 1.6 and 1.5 percentage points on themarketing and administrative expenses ratio in 2012, 2011, and 2010, respectively. Refer to the Special Itemscaption above for additional detail.
In addition to the unfavorable impact of the special items, the marketing and administrative expenses ratio in2012 increased as a result of incremental expenses from the operations of Baxa and Synovis, acquisition-relatedexpenses, additional spending on marketing and promotional programs, and an increase in pension plan costs asdescribed below. These factors were partially offset by savings from the company’s business optimizationinitiatives and the company’s continued focus on controlling discretionary spending.
Excluding the impact of the special items, the ratio in 2011 was flat to 2010 as the favorable impact of leveragefrom higher sales and the company’s focus on controlling discretionary spending was fully offset by increasedspending relating to certain marketing and promotional programs and increased pension plan costs, as describedbelow.
Pension Plan CostsFluctuations in pension plan costs impacted the company’s gross margin and expense ratios. Pension plan costsincreased $211 million in 2012 and $53 million in 2011, as detailed in Note 11. The 2012 pension plan costsincluded settlement charges of $168 million primarily related to the settlement of certain U.S. pensionobligations. The increase in both 2012 and 2011 was also driven by lower interest rates used to discount theplans’ projected benefit obligations and an increase in amortization of actuarial losses. The increases in 2012 and2011 were partially offset by the favorable impact of additional returns on assets due to discretionary cashcontributions of $150 million and $350 million made to the pension plan in the United States in 2011 and 2010,respectively.
29

Excluding the settlement charge discussed above, costs of the company’s pension plans are expected to increasefrom $266 million in 2012 to approximately $330 million in 2013, principally due to lower interest rates used todiscount the plans’ projected benefit obligations, a decrease in the expected return on plan assets assumption, andan increase in amortization of actuarial losses. The amortization of deferred losses is expected to increase in 2013to $245 million from $209 million in 2012, and will be partially offset by the impact of the immediaterecognition of deferred losses of $168 million in 2012 associated with the settlement of certain plan obligations.Refer to Note 11 for further information on the pension plans.
Research and DevelopmentPercent change
years ended December 31 (in millions) 2012 2011 2010 2012 2011
Research and development expenses . . . . . . . . . . . . $1,156 $946 $915 22% 3%as a percent of net sales . . . . . . . . . . . . . . . . . . . . . . . 8.1% 6.8% 7.1%
R&D expenses increased in both 2012 and 2011. In addition to the special items identified above, R&D expensesalso increased in both years as the company continued to invest in a number of late-stage R&D programs acrossits product pipeline, while reaching certain milestone achievements resulting in additional R&D spending in2012. Refer to the discussion under Strategic Objectives above for additional detail.
Net Interest ExpenseNet interest expense increased by $33 million in 2012 and decreased by $33 million in 2011. The increase in2012 was principally driven by an increase in debt from the issuances of $500 million 1.85% senior unsecurednotes in December 2011, and $700 million 2.40% senior unsecured notes and $300 million 3.65% seniorunsecured notes in August 2012, as well as lower interest income. The decrease in 2011 was principally due to anincrease in interest income and the impact of lower weighted-average interest rates due to the maturity ofBaxter’s 4.75% $500 million notes in October 2010. Refer to Note 2 for a summary of the components of netinterest expense for 2012, 2011 and 2010.
Other (Income) Expense, NetOther (income) expense, net was $155 million of income in 2012, and $83 million and $159 million of expensein 2011 and 2010, respectively. Refer to Note 2 for a table that details the components of other (income) expense,net for the three years ended December 31, 2012. Other (income) expense, net in each year included amountsrelating to equity method investments and foreign currency fluctuations, principally relating to intercompanyreceivables, payables and loans denominated in a foreign currency.
During 2012, other (income) expense, net included gains of $53 million and $38 million for the reduction ofcertain contingent payment liabilities related to the prior acquisitions of Prism and ApaTech, respectively.Additionally, other (income) expense, net included the benefit from a net loss attributable to noncontrollinginterests of $28 million in 2012, which was prospectively classified as other (income) expense, net effectiveJanuary 1, 2012.
During 2011, other (income) expense, net included asset impairment charges totaling $62 million primarilyrelated to the write-down of Greek government bonds. Included in other (income) expense, net in 2010 was animpairment charge of $112 million associated with the company’s divestiture of its U.S. multi-source genericinjectables business and a charge of $62 million associated with litigation related to the company’s 2008 recall ofits heparin sodium injection products in the United States.
30

Pre-Tax IncomeRefer to Note 14 for a summary of financial results by segment. The following is a summary of significantfactors impacting the segments’ financial results.
BioSciencePre-tax income decreased 4% in 2012 and increased 8% in 2011. Included in pre-tax income during 2012 werebusiness development charges of $123 million, primarily related to R&D charges of $50 million, $30 million and$33 million associated with the company’s collaborations with Onconova, Chatham and Momenta, respectively,and a gain of $38 million related to the reduction of a contingent payment liability for certain milestonesassociated with the 2010 acquisition of ApaTech.
Excluding the impact of the above items, pre-tax income in 2012 declined by 1% as sales growth of certainhigher margin products was more than offset by an increase in spending on R&D driven by funding of keyprograms and the achievement of certain milestones, increased spending on new marketing and promotionalprograms, and the unfavorable impact of foreign currency.
During 2011, sales growth for certain higher margin products and improved margins on plasma-based therapieswere partially offset by an increase in spending on new marketing and promotional programs. Also contributingto the increase in pre-tax income were lower inventory reserves related to vaccine products in 2011.
Medical ProductsPre-tax income increased 5% and 130% in 2012 and 2011, respectively. Included in pre-tax income in 2012 wasa gain of $53 million related to the reduction of the contingent payment liability for certain milestones associatedwith the 2011 acquisition of Prism and a net benefit from reserve adjustments of $23 million, which primarilyrelated to an adjustment to the COLLEAGUE infusion pump reserves. Included in pre-tax income in 2010 was acharge of $588 million related to the recall of COLLEAGUE infusion pumps from the U.S. market, the U.S.multi-source generic injectables business impairment charge of $112 million, and a charge of $62 millionassociated with litigation related to the company’s 2008 recall of its heparin sodium injection products in theUnited States.
Excluding the impact of the above items from 2012, pre-tax income in 2012 was flat to 2011 as the favorableimpact of the resolution of prior year manufacturing issues at the company’s Castlebar, Ireland facility was offsetby increases in R&D spending, increases in marketing and administrative expenses, and the unfavorable impactof foreign currency.
In addition to the favorable impact of the above items from 2010, pre-tax income in 2011 also benefited fromsales growth for certain higher margin products, partially offset by increased R&D spending and costs associatedwith manufacturing issues at the company’s Castlebar, Ireland facility.
OtherCertain income and expense amounts are not allocated to a segment. These amounts are detailed in the table inNote 14 and primarily include net interest expense, certain foreign exchange fluctuations (principally relating tointercompany receivables, payables and loans denominated in foreign currency) and certain foreign currencyhedging activities, corporate headquarters costs, stock compensation expense, income and expense related tocertain non-strategic investments, certain employee benefit plan costs (including the 2012 pension settlementcharges), certain nonrecurring gains and losses, certain charges (such as the business optimization, AWPlitigation and historical price reporting, asset impairment, and certain business development charges), andcontributions to the Baxter International Foundation.
31

Income TaxesEffective Income Tax RateThe effective income tax rate was 20% in both 2012 and 2011, and 25% in 2010. The company anticipates thatthe effective income tax rate, calculated in accordance with GAAP, will be approximately 22% in 2013,excluding any impact from additional audit developments or other special items. On January 2, 2013, thePresident signed the American Taxpayer Relief Act of 2012. The company does not expect the enactedlegislation to materially impact its effective income tax rate.
The company’s effective tax rate differs from the U.S. federal statutory rate each year due to certain operationsthat are subject to tax incentives, state and local taxes and foreign taxes that are different than the U.S. federalstatutory rate. In addition, as discussed further below, the company’s effective income tax rate can be impacted ineach year by discrete factors or events. Refer to Note 12 for further information regarding the company’s incometaxes.
Factors impacting the company’s effective tax rate in 2012 were gains of $53 million and $38 million for thereduction of certain contingent payment liabilities related to the prior acquisitions of Prism and ApaTech,respectively, for which there were no tax charges. Also impacting the effective tax rate was a cost of salesreduction of $37 million for an adjustment to the COLLEAGUE infusion pump reserves when the companysubstantially completed the recall in the United States in 2012, for which there was no tax charge. These itemswere offset by a change in the earnings mix from lower tax to higher tax rate jurisdictions compared to the prioryear period.
The decrease in the effective tax rate in 2011 was primarily related to tax benefits from the business optimizationcharge, the AWP litigation and historical price reporting charge, and other charges in 2011 which were incurredin jurisdictions with rates higher than the effective rate. Also impacting the comparison of 2011 to 2010 werecertain items that drove the 2010 rate higher including a charge of $588 million in 2010 related to the recall ofCOLLEAGUE infusion pumps from the U.S. market for which there was no net tax benefit recognized, a$39 million write-off of a deferred tax asset in 2010 as a result of a change in the tax treatment ofreimbursements under the Medicare Part D retiree prescription drug subsidy program under healthcare reformlegislation enacted in the United States, and $34 million of business development charges in 2010 for which thetax benefit was lower than the U.S. statutory rate.
Uncertain Tax PositionsBaxter expects to reduce the amount of its liability for uncertain tax positions within the next 12 months by $299million due principally to the resolution of certain multi-jurisdictional transfer pricing issues and the resolution oftax contingencies in certain foreign jurisdictions. While the final outcome of these matters is inherentlyuncertain, the company believes it has made adequate tax provisions for all years subject to examination.
Income and Earnings per Diluted ShareNet income attributable to Baxter was $2.3 billion in 2012, $2.2 billion in 2011 and $1.4 billion in 2010. Thecorresponding net earnings per diluted share were $4.18 in 2012, $3.88 in 2011 and $2.39 in 2010. Thesignificant factors and events causing the net changes from 2011 to 2012 and from 2010 to 2011 are discussedabove. Additionally, net income attributable to Baxter per diluted share was positively impacted by therepurchase of 25 million shares in 2012 and 30 million shares in both 2011 and 2010. Refer to Note 10 for furtherinformation regarding the company’s stock repurchases.
LIQUIDITY AND CAPITAL RESOURCES
Cash Flows from OperationsCash flows from operations totaled $3.1 billion in 2012, $2.8 billion in 2011 and $3.0 billion in 2010. Theincrease in cash flows in 2012 from 2011 was primarily due to the factors discussed below and was partially
32

offset by lower earnings (before non-cash items and adjustments). Other non-cash items and adjustments of $42million in 2012 included non-cash gains of $91 million from the reduction of certain contingent paymentliabilities from prior acquisitions. Also included in other non-cash items and adjustments in 2012 was $113million in R&D charges associated with upfront payments made for the execution of 2012 collaborationagreements, which have been included in cash flows from investing activities. The decrease in cash flows in 2011compared to 2010 was primarily due to the factors discussed below and was partially offset by higher earnings(before non-cash items and adjustments).
Accounts ReceivableCash flows relating to accounts receivable increased during 2012 and decreased during 2011. Days salesoutstanding were 53.3 days, 53.5 days and 52.5 days for 2012, 2011 and 2010, respectively. The decrease in 2012was due to collections of certain past due balances in Europe, partially offset by longer collection periods in theUnited States and the unfavorable impact of foreign currency. The increase in 2011 was primarily due to longercollection periods in certain international markets and the geographic mix of sales.
InventoriesCash outflows for inventories decreased in 2012 and increased in 2011. The following is a summary ofinventories at December 31, 2012 and 2011, as well as inventory turns by segment for 2012, 2011 and 2010.Inventory turns for the year are calculated as the annualized fourth quarter cost of sales divided by the year-endinventory balance.
Inventories Inventory turns
(in millions, except inventory turn data) 2012 2011 2012 2011 2010
BioScience . . . . . . . . . . . . . . . . . . . . . . . . . . . . . . . . . . . . . . . . . . . . . . . . . . $1,745 $1,627 1.48 1.52 1.90Medical Products . . . . . . . . . . . . . . . . . . . . . . . . . . . . . . . . . . . . . . . . . . . . . 1,058 1,001 4.25 4.52 4.85
Total company . . . . . . . . . . . . . . . . . . . . . . . . . . . . . . . . . . . . . . . . . . . . . . $2,803 $2,628 2.52 2.66 3.04
The increase in inventories in 2012 was principally due to higher levels of plasma protein-related inventories inthe BioScience segment to replenish and build inventory for future growth, as well as higher inventories ofSIGMA Spectrum infusion pumps and additional inventory levels related to Baxa operations in the MedicalProducts segment.
Inventory turns for the total company in 2012 were unfavorably impacted by the increase in inventories and thelower business optimization charge recorded in cost of sales in 2012 as compared to 2011. Of the total charge,$62 million was recorded in cost of sales in 2012 compared to $95 million in 2011. The business optimizationcharges in 2012 and 2011 impacted inventory turns by 0.09 and 0.15, respectively. The lower inventory turns forthe total company in 2011 were driven by the increase in inventories and the impact of the lower 2011 businessoptimization charge recorded in cost of sales in 2011 as compared to 2010. Refer to Note 6 for furtherinformation regarding these charges.
OtherPayments related to the execution of the COLLEAGUE infusion pump recall and the company’s businessoptimization initiatives increased $237 million in 2011 and decreased $64 million in 2012 as the companycompleted its recall activities in the United States in July 2012. Refer to Note 6 for further information regardingthe COLLEAGUE infusion pump recall and the business optimization initiatives.
Cash flows from operations were favorably impacted by $138 million from changes in other balance sheet itemsduring 2012, compared to $8 million during 2011. This change was principally due to the impact of adiscretionary cash contribution of $150 million to the company’s pension plan in the United States in 2011. Cashcontributions to the company’s pension plans totaled $78 million, $251 million and $416 million in 2012, 2011
33

and 2010, respectively, and included discretionary cash contributions to the company’s U.S. pension plan of $150million and $350 million in 2011 and 2010, respectively.
Cash Flows from Investing ActivitiesCapital ExpendituresCapital expenditures totaled $1.2 billion in 2012, $960 million in 2011 and $963 million in 2010. The company’sinvestments in capital expenditures in 2012 were primarily driven by additional investments in support of newand existing product capacity expansions in the BioScience segment. The company also invested in projects thatenhance the company’s cost structure and manufacturing capabilities and support the company’s strategy ofgeographic expansion with select investments in growing markets.
In April 2012, the company announced the selection of a site in Covington, Georgia for a new manufacturingfacility to support longer-term growth of the company’s plasma-based treatments. Construction of the facilitybegan in August 2012, and the facility is expected to start commercial production in 2018. Baxter plans to investmore than $1 billion over the next five years in the facility.
In addition, the company continues to invest to support an ongoing strategic focus on R&D with the expansion offacilities, pilot manufacturing sites and laboratories. Capital expenditures also included the company’s multi-yearinitiative to implement a global enterprise resource planning system designed to consolidate and standardizebusiness processes, data and systems.
The company makes investments in capital expenditures at a level sufficient to support the strategic andoperating needs of the businesses, and continues to improve capital allocation discipline in making investmentsto enhance long-term growth. The company expects to invest approximately $1.7 billion in capital expendituresin 2013, with the increase primarily driven by expected capital expenditures related to the construction of thefacility in Covington, Georgia, and Gambro-related expenditures.
Acquisitions and InvestmentsNet cash outflows related to acquisitions and investments were $515 million in 2012, $590 million in 2011 and$319 million in 2010. Cash outflows in 2012 included $304 million associated with the acquisition of Synovis,$19 million related to the acquisition of Laboratoire Fasonut, and $50 million for an investment in the preferredstock of Onconova. Also included in cash outflows related to acquisitions and investments in 2012 were upfrontpayments of $113 million made to execute collaboration agreements during the period. Refer to Note 4 forfurther information about these acquisitions and investments.
The cash outflows in 2011 principally included $360 million related to the acquisition of Baxa (which excludes aworking capital adjustment received in 2012) and $170 million associated with the acquisition of Prism, as wellas an $18 million payment to exercise an option related to the company’s collaboration agreement for thedevelopment of a home HD machine. Also included in cash outflows in 2011 were $18 million related to aninvestment in the common stock of Enobia Pharma Corporation (Enobia) and a $10 million payment related tothe arrangement with Ceremed, Inc. Refer to Note 4 for further information about the Baxa and Prismacquisitions and Note 8 for further information about the investment in Enobia.
The cash outflows in 2010 principally included $235 million related to the acquisition of ApaTech. Also includedin net cash outflows in 2010 were payments of $30 million related to the licensing and acquisition of hemophilia-related intellectual property and other assets from Archemix Corp., $28 million related to a manufacturing,supply and distribution agreement with Kamada Ltd. for GLASSIA [Alpha1-Proteinase Inhibitor (Human)] (fortreatment of hereditary emphysema), and $18 million related to the company’s collaboration agreement for thedevelopment of a home HD machine.
34

Divestitures and Other Investing ActivitiesNet cash inflows relating to divestitures and other investing activities were $107 million in 2012, $123 million in2011 and $18 million in 2010. Cash inflows in 2012 primarily related to proceeds of $59 million from the saleand maturity of available-for-sale securities (including the sale of Greek government bonds) and $19 millionfrom the sale of the common stock of Enobia.
Cash inflows in 2011 principally consisted of proceeds associated with the company’s divestiture of its U.S.multi-source generic injectables business in May 2011. Cash inflows in 2010 principally consisted of proceedsfrom the divestiture of certain Renal Therapy Services centers in Australia.
Cash Flows from Financing ActivitiesDebt Issuances, Net of Payments of ObligationsNet cash inflows related to debt and other financing obligations were $765 million in 2012, $733 million in 2011,and $91 million in 2010. Net cash inflows in 2012 primarily related to the issuance of $1.0 billion of senior notesin August 2012, partially offset by the repayment of outstanding commercial paper, as further described inNote 7.
In August 2012, the company issued $1.0 billion of senior notes, with $700 million maturing in August 2022 andbearing a 2.40% coupon rate, and $300 million maturing in August 2042 and bearing a 3.65% coupon rate. Thenet proceeds of the debt issuance are being used for general corporate purposes, which includes capitalexpenditures associated with previously announced plans to expand capacity to support longer-term growth ofthe company’s plasma-based treatments, including with respect to the Covington, Georgia facility.
In December 2011, the company issued $500 million of senior notes, maturing in January 2017 and bearing a1.85% coupon rate. In addition, during 2011, the company issued and redeemed commercial paper, of which$250 million was outstanding as of December 31, 2011, with a weighted-average interest rate of 0.24%. In March2010, the company issued $600 million of senior notes, with $300 million maturing in March 2013 and bearing a1.8% coupon rate and $300 million maturing in March 2020 and bearing a 4.25% coupon rate. The net proceedsfrom these issuances were used for general corporate purposes, including in some cases the refinancing ofindebtedness.
In 2010, the company repaid $500 million of its 4.75% notes and settled related cross-currency swaps, both upontheir maturity in October 2010, resulting in a cash outflow of $545 million.
The company’s debt instruments discussed above are unsecured and include certain covenants, includingrestrictions relating to the company’s creation of secured debt.
Other Financing ActivitiesCash dividend payments totaled $804 million in 2012, $709 million in 2011 and $688 million in 2010. InNovember 2012, the board of directors declared a quarterly dividend of $0.45 per share ($1.80 per share on anannualized basis), which was paid on January 3, 2013 to shareholders of record as of December 7, 2012. In July2012, the board of directors declared a quarterly dividend of $0.45 per share ($1.80 per share on an annualizedbasis), which represented an increase of 34% over the previous quarterly rate. In November 2011, the board ofdirectors declared a quarterly dividend of $0.335 per share ($1.34 per share on an annualized basis), whichrepresented an increase of 8% over the previous quarterly rate.
Proceeds and realized excess tax benefits from stock issued under employee benefit plans totaled $512 million,$448 million and $381 million in 2012, 2011 and 2010, respectively. The increase in 2012 was mainly due toincreases in stock option exercises and the weighted-average exercise price. In 2011, an increase in stock optionexercises and the weighted-average exercise price was partially offset by a decrease in realized excess taxbenefits. Realized excess tax benefits, which were $24 million in 2012, $21 million in 2011 and $41 million in
35

2010, are presented in the consolidated statements of cash flows as an outflow in the operating section and aninflow in the financing section.
As authorized by the board of directors, the company repurchases its stock depending on the company’s cashflows, net debt level and market conditions. The company repurchased 25 million shares for $1.5 billion in 2012,30 million shares for $1.6 billion in 2011 and 30 million shares for $1.5 billion in 2010. In December 2010, theboard of directors authorized the repurchase of up to $2.5 billion of the company’s common stock, which wasfully utilized as of December 31, 2012. In July 2012, the board of directors authorized the repurchase of up to anadditional $2.0 billion of the company’s common stock and $1.9 billion remained available as of December 31,2012. The company expects to incur significant debt in 2013 related to the planned acquisition of Gambro and, asa result, stock repurchases in 2013 are expected to decline from 2012 and 2011 levels.
Also included in financing activities in 2012 was a payment of $90 million for the exercise of the SIGMApurchase option. Refer to Note 2 for additional information.
Credit Facilities, Access to Capital and Credit RatingsCredit FacilitiesThe company’s primary revolving credit facility has a maximum capacity of $1.5 billion and matures in June2015. The company also maintains a Euro-denominated credit facility with a maximum capacity ofapproximately $389 million at December 31, 2012. In 2012, the company amended this facility to extend thematurity date to October 2013. As of December 31, 2012 and 2011, there were no outstanding borrowings undereither of these facilities. The company’s facilities enable the company to borrow funds on an unsecured basis atvariable interest rates (determined, in part, by the company’s credit ratings) and contain various covenants,including a maximum net-debt-to-capital ratio. At December 31, 2012, the company was in compliance with thefinancial covenants in these agreements. The non-performance of any financial institution supporting either ofthe credit facilities would reduce the maximum capacity of these facilities by each institution’s respectivecommitment.
In January 2013, Baxter entered into an agreement related to a 364-day bridge loan facility with a maximumcapacity of $3.1 billion in connection with the planned acquisition of Gambro. The terms of the bridge loanfacility are substantially similar to the terms of the company’s primary revolving credit facility. The companyintends to finance the transaction with off-shore cash and the issuance of at least $3.0 billion of debt. Thecompany does not anticipate utilizing the bridge loan facility.
The company also maintains other credit arrangements, as described in Note 7.
Access to CapitalThe company intends to fund short-term and long-term obligations as they mature through cash on hand, futurecash flows from operations or by issuing additional debt. The company had $3.3 billion of cash and equivalentsat December 31, 2012, with adequate cash available to meet operating requirements in each jurisdiction in whichthe company operates. The company invests its excess cash in certificates of deposit and money market funds,and diversifies the concentration of cash among different financial institutions. The company plans to issue atleast $3.0 billion of debt during the first half of 2013 to fund the planned acquisition of Gambro, which willsignificantly increase the company’s outstanding debt.
The company’s ability to generate cash flows from operations, issue debt or enter into other financingarrangements on acceptable terms could be adversely affected if there is a material decline in the demand for thecompany’s products or in the solvency of its customers or suppliers, deterioration in the company’s key financialratios or credit ratings or other significantly unfavorable changes in conditions. However, the company believesit has sufficient financial flexibility to issue debt, enter into other financing arrangements and attract long-termcapital on acceptable terms to support the company’s growth objectives.
36

The company continues to do business with foreign governments in certain countries, including Greece, Spain,Portugal and Italy, that have experienced a deterioration in credit and economic conditions. As of December 31,2012, the company’s net accounts receivable from the public sector in Greece, Spain, Portugal and Italy totaled$385 million (of which $66 million related to Greece). The company’s net accounts receivable from the publicsector for the countries identified above decreased by $139 million during 2012 primarily as a result of thecollection of certain past due receivables in Spain. While the economic downturn has not significantly impactedthe company’s ability to collect receivables, global economic conditions and liquidity issues in certain countrieshave resulted, and may continue to result, in delays in the collection of receivables and credit losses.
With respect to the Greek government bonds, the company collected $17 million in December 2011 upon thematurity of the first tranche of the bonds. However, as a result of continued economic uncertainty and ongoingGreek government negotiations regarding the settlement terms for outstanding bonds, the company recorded animpairment charge of $41 million in 2011 to reduce the remaining Greek government bonds held by the companyto estimated fair value. The estimated fair value of these bonds was calculated using a discounted cash flowmodel that incorporated observable inputs, including interest rate yields. In March 2012, the company’s Greekgovernment debt holdings were restructured into new Greek government bonds with a notional amount of $24million ranging in maturity from 11 to 30 years, and European Financial Stability Facility (EFSF) bonds with anotional amount of $11 million maturing in one to two years. In the second quarter of 2012, the company sold allof its Greek government and EFSF bond holdings, from which the company received $14 million in proceeds.Refer to Note 8 for further information.
The company also previously recorded a charge of $28 million in 2010 to write down its accounts receivable inGreece principally as a result of the Greek government’s announcement of a plan to convert certain past duereceivables into non-interest bearing bonds with maturities of one to three years.
Credit RatingsThe company’s credit ratings at December 31, 2012 were as follows.
Standard & Poor’s Fitch Moody’s
RatingsSenior debt . . . . . . . . . . . . . . . . . . . . . . . . . . . . . . . . . . . . . . . . . . . . . . . A A A3Short-term debt . . . . . . . . . . . . . . . . . . . . . . . . . . . . . . . . . . . . . . . . . . . . A1 F1 P2
Outlook . . . . . . . . . . . . . . . . . . . . . . . . . . . . . . . . . . . . . . . . . . . . . . . . . . . . Stable Negative Negative
In 2012, Standard & Poor’s downgraded the company’s senior debt ratings by one notch from A+ to A, and bothFitch and Moody’s changed their outlook from Stable to Negative. These downgrades were a result of thecompany’s December 2012 announcement of the proposed acquisition of Gambro and the plans to fund theacquisition with at least $3.0 billion of debt, which would significantly increase the company’s debt level.
If Baxter’s credit ratings or outlooks were to be further downgraded, the company’s financing costs related to itscredit arrangements and any future debt issuances could be unfavorably impacted. However, any future creditrating downgrade or change in outlook would not affect the company’s ability to draw on its credit facilities, andwould not result in an acceleration of the scheduled maturities of any of the company’s outstanding debt, unless,with respect to certain debt instruments, preceded by a change in control of the company.
37

Contractual ObligationsAs of December 31, 2012, the company had contractual obligations, excluding accounts payable and accruedliabilities (other than the current portion of unrecognized tax benefits), payable or maturing in the followingperiods.
(in millions) TotalLess thanone year
One tothree years
Three tofive years
More thanfive years
Short-term debt . . . . . . . . . . . . . . . . . . . . . . . . . . . . . . . . . . . . $ 27 $ 27 $ — $ — $ —Long-term debt and capital lease obligations, including
current maturities . . . . . . . . . . . . . . . . . . . . . . . . . . . . . . . . 5,757 323 1,205 1,276 2,953Interest on short- and long-term debt and
capital lease obligations1 . . . . . . . . . . . . . . . . . . . . . . . . . . 1,984 210 372 274 1,128Operating leases . . . . . . . . . . . . . . . . . . . . . . . . . . . . . . . . . . . 816 181 274 210 151Other long-term liabilities2 . . . . . . . . . . . . . . . . . . . . . . . . . . . 1,114 — 313 112 689Purchase obligations3 . . . . . . . . . . . . . . . . . . . . . . . . . . . . . . . 1,455 744 542 150 19Unrecognized tax benefits4 . . . . . . . . . . . . . . . . . . . . . . . . . . . 299 299 — — —
Contractual obligations5 . . . . . . . . . . . . . . . . . . . . . . . . . . . . . $11,452 $1,784 $2,706 $2,022 $4,940
1 Interest payments on debt and capital lease obligations are calculated for future periods using interest rates ineffect at the end of 2012. Projected interest payments include the related effects of interest rate swapagreements. Certain of these projected interest payments may differ in the future based on changes in floatinginterest rates, foreign currency fluctuations or other factors or events. The projected interest payments onlypertain to obligations and agreements outstanding at December 31, 2012. Refer to Note 7 and Note 8 forfurther discussion regarding the company’s debt instruments and related interest rate agreements outstandingat December 31, 2012.
2 The primary components of other long-term liabilities in the company’s consolidated balance sheet areliabilities relating to pension and other postemployment benefit plans, litigation, foreign currency hedges, andcertain income tax-related liabilities. The company projected the timing of the future cash payments based oncontractual maturity dates (where applicable) and estimates of the timing of payments (for liabilities with nocontractual maturity dates). The actual timing of payments could differ from the estimates.
The company contributed $78 million, $251 million and $416 million to its defined benefit pension plans in2012, 2011 and 2010, respectively. Most of the company’s plans are funded. The timing of funding in thefuture is uncertain and is dependent on future movements in interest rates and investment returns, changes inlaws and regulations, and other variables. Therefore, the table above excludes pension plan cash outflows. Thepension plan balance included in other long-term liabilities (and excluded from the table above) totaled $1.7billion at December 31, 2012.
3 Includes the company’s significant contractual unconditional purchase obligations. For cancelable agreements,includes any penalty due upon cancellation. These commitments do not exceed the company’s projectedrequirements and are in the normal course of business. Examples include firm commitments for raw materialpurchases, utility agreements and service contracts.
4 Due to the uncertainty related to the timing of the reversal of uncertain tax positions, the long-term liabilityrelating to unrecognized tax benefits of $218 million at December 31, 2012 has been excluded from the tableabove.
5 Excludes contingent liabilities, including contingent milestone payments of $1.5 billion associated with jointdevelopment and commercialization arrangements and contingent payments of $305 million associated withacquisitions, as well as the company’s unfunded commitment at December 31, 2012 of $37 million as alimited partner in an investment company. These amounts have been excluded from the contractual obligationsabove due to uncertainty regarding the timing and amount of future payments. Refer to Note 9 and Note 4 foradditional information regarding these commitments.
38

Off-Balance Sheet ArrangementsBaxter periodically enters into off-balance sheet arrangements. Certain contingencies arise in the normal courseof business, and are not recorded in the consolidated balance sheet in accordance with GAAP (such as contingentjoint development and commercialization arrangement payments). Also, upon resolution of uncertainties, thecompany may incur charges in excess of presently established liabilities for certain matters (such as contractualindemnifications). For a discussion of the company’s significant off-balance sheet arrangements, refer to Note 9for information regarding joint development and commercialization arrangements and indemnifications, Note 8regarding receivable securitizations and Note 13 regarding legal contingencies.
FINANCIAL INSTRUMENT MARKET RISK
The company operates on a global basis and is exposed to the risk that its earnings, cash flows and equity couldbe adversely impacted by fluctuations in foreign exchange and interest rates. The company’s hedging policyattempts to manage these risks to an acceptable level based on the company’s judgment of the appropriate trade-off between risk, opportunity and costs. Refer to Note 8 for further information regarding the company’sfinancial instruments and hedging strategies.
Currency RiskThe company is primarily exposed to foreign exchange risk with respect to recognized assets and liabilities,forecasted transactions and net assets denominated in the Euro, Japanese Yen, British Pound, Australian Dollar,Canadian Dollar, Brazilian Real, Colombian Peso, and Swedish Krona. The company manages its foreigncurrency exposures on a consolidated basis, which allows the company to net exposures and take advantage ofany natural offsets. In addition, the company uses derivative and nonderivative financial instruments to furtherreduce the net exposure to foreign exchange. Gains and losses on the hedging instruments offset losses and gainson the hedged transactions and reduce the earnings and shareholders’ equity volatility relating to foreignexchange. Financial market and currency volatility may limit the company’s ability to cost-effectively hedgethese exposures.
The company may use options, forwards and cross-currency swaps to hedge the foreign exchange risk to earningsrelating to forecasted transactions denominated in foreign currencies and recognized assets and liabilities. Themaximum term over which the company has cash flow hedge contracts in place related to forecasted transactionsat December 31, 2012 is 12 months. The company also enters into derivative instruments to hedge certainintercompany and third-party receivables and payables and debt denominated in foreign currencies. In December2012, the company entered into option contracts with a total notional amount of $2.8 billion to hedge anticipatedforeign currency cash outflows associated with the planned acquisition of Gambro. These contracts are notformally designated as hedges and mature in June 2013. Changes in the fair value of these contracts arerecognized immediately in earnings and may be significant, subjecting the company’s earnings to additionalvolatility.
Currency restrictions enacted in Venezuela require Baxter to obtain approval from the Venezuelan government toexchange Venezuelan Bolivars for U.S. Dollars and require such exchange to be made at the official exchangerate established by the government. On January 8, 2010, the Venezuelan government devalued the officialexchange rate of 2.15 relative to the U.S. Dollar. The official exchange rate for imported goods classified asessential, such as food and medicine, was changed to 2.6, while the rate for payments for non-essential goodswas changed to 4.3. In 2010, the majority of the company’s products imported into Venezuela were classified asessential goods and qualified for the 2.6 rate. Effective January 1, 2011, the Venezuelan government devaluedthe official currency for imported goods classified as essential to 4.3. Since January 1, 2010, Venezuela has beendesignated as a highly inflationary economy under GAAP and as a result, the functional currency of thecompany’s subsidiary in Venezuela is the U.S. Dollar. The devaluation of the Venezuelan Bolivar anddesignation of Venezuela as highly inflationary did not have a material impact on the financial results of thecompany. As of December 31, 2012, the company’s subsidiary in Venezuela had net assets of $35 milliondenominated in the Venezuelan Bolivar. In 2012, net sales in Venezuela represented less than 1% of Baxter’s
39

total net sales. Effective February 8, 2013, the Venezuelan government devalued the official exchange rate from4.3 to 6.3, which is not expected to have a material impact on the financial results of the company.
As part of its risk-management program, the company performs sensitivity analyses to assess potential changes inthe fair value of its foreign exchange instruments relating to hypothetical and reasonably possible near-termmovements in foreign exchange rates.
A sensitivity analysis of changes in the fair value of foreign exchange option and forward contracts outstandingat December 31, 2012, while not predictive in nature, indicated that if the U.S. Dollar uniformly weakened by10% against all currencies, on a net-of-tax basis, the net asset balance of $37 million with respect to thosecontracts would increase by $10 million. A similar analysis performed with respect to option and forwardcontracts outstanding at December 31, 2011 indicated that, on a net-of-tax basis, the net asset balance of $32million would decrease by $44 million, resulting in a net liability position.
The sensitivity analysis model recalculates the fair value of the foreign exchange option and forward contractsoutstanding at December 31, 2012 by replacing the actual exchange rates at December 31, 2012 with exchangerates that are 10% weaker compared to the actual exchange rates for each applicable currency. All other factorsare held constant. These sensitivity analyses disregard the possibility that currency exchange rates can move inopposite directions and that gains from one currency may or may not be offset by losses from another currency.The analyses also disregard the offsetting change in value of the underlying hedged transactions and balances.
Interest Rate and Other RisksThe company is also exposed to the risk that its earnings and cash flows could be adversely impacted byfluctuations in interest rates. The company’s policy is to manage interest costs using a mix of fixed- and floating-rate debt that the company believes is appropriate. To manage this mix in a cost-efficient manner, the companyperiodically enters into interest rate swaps in which the company agrees to exchange, at specified intervals, thedifference between fixed and floating interest amounts calculated by reference to an agreed-upon notionalamount. The company also periodically uses forward-starting interest rate swaps and treasury rate locks to hedgethe risk to earnings associated with fluctuations in interest rates relating to anticipated issuances of term debt.
As part of its risk management program, the company performs sensitivity analyses to assess potential gains andlosses in earnings relating to hypothetical movements in interest rates. A 32 basis-point increase in interest rates(approximately 10% of the company’s weighted-average interest rate during 2012) affecting the company’sfinancial instruments, including debt obligations and related derivatives, would have an immaterial effect on thecompany’s 2012, 2011 and 2010 earnings and on the fair value of the company’s fixed-rate debt as of the end ofeach fiscal year.
As discussed in Note 8, the fair values of the company’s long-term litigation liabilities and related insurancereceivables were computed by discounting the expected cash flows based on currently available information. A10% movement in the assumed discount rate would have an immaterial effect on the fair values of those assetsand liabilities.
With respect to the company’s investments in affiliates, the company believes any reasonably possible near-termlosses in earnings, cash flows and fair values would not be material to the company’s consolidated financialposition.
CHANGES IN ACCOUNTING STANDARDS
Refer to Note 1 for information on changes in accounting standards.
40
CRITICAL ACCOUNTING POLICIES
The preparation of financial statements in accordance with GAAP requires the company to make estimates andjudgments that affect the reported amounts of assets, liabilities, revenues and expenses. A summary of thecompany’s significant accounting policies is included in Note 1. Certain of the company’s accounting policiesare considered critical because these policies are the most important to the depiction of the company’s financialstatements and require significant, difficult or complex judgments by the company, often requiring the use ofestimates about the effects of matters that are inherently uncertain. Actual results that differ from the company’sestimates could have an unfavorable effect on the company’s results of operations and financial position. Thecompany applies estimation methodologies consistently from year to year. Other than changes required due to theissuance of new accounting pronouncements, there have been no significant changes in the company’sapplication of its critical accounting policies during 2012. The company’s critical accounting policies have beenreviewed with the Audit Committee of the Board of Directors. The following is a summary of accountingpolicies that the company considers critical to the consolidated financial statements.
Revenue Recognition and Related Provisions and AllowancesThe company’s policy is to recognize revenues from product sales and services when earned. Refer to Note 1 foradditional information regarding the company’s accounting policy for revenue recognition, including thecompany’s accounting for arrangements in which it commits to delivering multiple products or services to itscustomers.
Provisions for discounts, rebates to customers, chargebacks to wholesalers, and returns are provided for at thetime the related sales are recorded, and are reflected as a reduction of sales. These estimates are reviewedperiodically and, if necessary, revised, with any revisions recognized immediately as adjustments to sales.
The company periodically and systematically evaluates the collectibility of accounts receivable and determinesthe appropriate reserve for doubtful accounts. In determining the amount of the reserve, the company considershistorical credit losses, the past-due status of receivables, payment history and other customer-specificinformation, and any other relevant factors or considerations.
The company also provides for the estimated costs that may be incurred under its warranty programs when thecost is both probable and reasonably estimable, which is at the time the related revenue is recognized. The cost isdetermined based on actual company experience for the same or similar products as well as other relevantinformation. Estimates of future costs under the company’s warranty programs could change based ondevelopments in the future. The company is not able to estimate the probability or amount of any futuredevelopments that could impact the reserves, but believes presently established reserves are adequate.
Pension and Other Postemployment Benefit (OPEB) PlansThe company provides pension and other postemployment benefits to certain of its employees. These employeebenefit expenses are reported in the same line items in the consolidated income statement as the applicableemployee’s compensation expense. The valuation of the funded status and net periodic benefit cost for the plansare calculated using actuarial assumptions. These assumptions are reviewed annually, and revised if appropriate.The significant assumptions include the following:
• interest rates used to discount pension and OPEB plan liabilities;
• the long-term rate of return on pension plan assets;
• rates of increases in employee compensation (used in estimating liabilities);
• anticipated future healthcare costs (used in estimating the OPEB plan liability); and
• other assumptions involving demographic factors such as retirement, mortality and turnover (used inestimating liabilities).
41

Selecting assumptions involves an analysis of both short-term and long-term historical trends and knowneconomic and market conditions at the time of the valuation (also called the measurement date). The use ofdifferent assumptions would result in different measures of the funded status and net cost. Actual results in thefuture could differ from expected results. The company is not able to estimate the probability of actual resultsdiffering from expected results, but believes its assumptions are appropriate.
The company’s key assumptions are listed in Note 11. The most critical assumptions relate to the plans coveringU.S. and Puerto Rico employees, because these plans are the most significant to the company’s consolidatedfinancial statements.
Discount Rate AssumptionFor the U.S. and Puerto Rico plans, at the measurement date (December 31, 2012), the company used a discountrate of 3.95% and 4.00% to measure its benefit obligations for the pension plans and OPEB plan, respectively.These discount rates will be used in calculating the net periodic benefit cost for these plans for 2013. Thecompany used a broad population of approximately 320 Aa-rated corporate bonds as of December 31, 2012 todetermine the discount rate assumption. All bonds were denominated in U.S. Dollars, with a minimum amountoutstanding of $50 million. This population of bonds was narrowed from a broader universe of over 500Moody’s Aa rated, non-callable (or callable with make-whole provisions) bonds by eliminating the top 10thpercentile and bottom 40th percentile to adjust for any pricing anomalies and to represent the bonds Baxterwould most likely select if it were to actually annuitize its pension and OPEB plan liabilities. This portfolio ofbonds was used to generate a yield curve and associated spot rate curve to discount the projected benefitpayments for the U.S. and Puerto Rico plans. The discount rate is the single level rate that produces the sameresult as the spot rate curve.
For plans in Canada, Japan, the United Kingdom and the Eurozone, the company uses a method essentially thesame as that described for the U.S. and Puerto Rico plans. For the company’s other international plans, thediscount rate is generally determined by reviewing country- and region-specific government and corporate bondinterest rates.
To understand the impact of changes in discount rates on pension and OPEB plan cost, the company performs asensitivity analysis. Holding all other assumptions constant, for each 50 basis point (i.e., one-half of one percent)increase (decrease) in the discount rate, global pre-tax pension and OPEB plan cost would decrease (increase) byapproximately $52 million.
Return on Plan Assets AssumptionIn measuring net periodic cost for 2012, the company used a long-term expected rate of return of 7.75% for thepension plans covering U.S. and Puerto Rico employees. For measuring the net periodic benefit cost for theseplans for 2013, this assumption will decrease to 7.50%. This assumption is not applicable to the company’sOPEB plan because it is not funded.
The company establishes the long-term asset return assumption based on a review of historical compoundaverage asset returns, both company-specific and relating to the broad market (based on the company’s assetallocation), as well as an analysis of current market and economic information and future expectations. Thecurrent asset return assumption is supported by historical market experience for both the company’s actual andtargeted asset allocation. In calculating net pension cost, the expected return on assets is applied to a calculatedvalue of plan assets, which recognizes changes in the fair value of plan assets in a systematic manner over fiveyears. The difference between this expected return and the actual return on plan assets is a component of the totalnet unrecognized gain or loss and is subject to amortization in the future.
To understand the impact of changes in the expected asset return assumption on net cost, the company performs asensitivity analysis. Holding all other assumptions constant, for each 50 basis point increase (decrease) in the assetreturn assumption, global pre-tax pension plan cost would decrease (increase) by approximately $18 million.
42

Other AssumptionsThe company used the RP 2000 mortality table to calculate the pension and OPEB plan benefit obligations for itsplans in the United States and Puerto Rico. For all other pension plans, the company utilized country- and region-specific mortality tables to calculate the plans’ benefit obligations. The company periodically analyzes andupdates its assumptions concerning demographic factors such as retirement, mortality and turnover, consideringhistorical experience as well as anticipated future trends.
The assumptions relating to employee compensation increases and future healthcare costs are based on historicalexperience, market trends, and anticipated future company actions. Refer to Note 11 for information regardingthe sensitivity of the OPEB plan obligation and the total of the service and interest cost components of OPEBplan cost to potential changes in future healthcare costs.
Legal ContingenciesThe company is involved in product liability, patent, commercial, regulatory and other legal proceedings thatarise in the normal course of business. Refer to Note 13 for further information. The company records a liabilitywhen a loss is considered probable and the amount can be reasonably estimated. If the reasonable estimate of aprobable loss is a range, and no amount within the range is a better estimate, the minimum amount in the range isaccrued. If a loss is not probable or a probable loss cannot be reasonably estimated, no liability is recorded. Thecompany has established reserves for certain of its legal matters. The company is not able to estimate the amountor range of any loss for certain of the legal contingencies for which there is no reserve or additional loss formatters already reserved. The company also records any insurance recoveries that are probable of occurring. AtDecember 31, 2012, total legal liabilities were $113 million and total related receivables were $33 million.
The company’s loss estimates are generally developed in consultation with outside counsel and are based onanalyses of potential results. With respect to the recording of any insurance recoveries, after completing theassessment and accounting for the company’s legal contingencies, the company separately and independentlyanalyzes its insurance coverage and records any insurance recoveries that are probable of occurring at the grossamount that is expected to be collected. In performing the assessment, the company reviews availableinformation, including historical company-specific and market collection experience for similar claims, currentfacts and circumstances pertaining to the particular insurance claim, the financial viability of the applicableinsurance company or companies, and other relevant information.
While the liability of the company in connection with certain claims cannot be estimated with any certainty, andalthough the resolution in any reporting period of one or more of these matters could have a significant impact onthe company’s results of operations and cash flows for that period, the outcome of these legal proceedings is notexpected to have a material adverse effect on the company’s consolidated financial position. While the companybelieves it has valid defenses in these matters, litigation is inherently uncertain, excessive verdicts do occur, andthe company may in the future incur material judgments or enter into material settlements of claims.
Deferred Tax Asset Valuation Allowances and Reserves for Uncertain Tax PositionsThe company maintains valuation allowances unless it is more likely than not that all or a portion of the deferredtax asset will be realized. Changes in valuation allowances are included in the company’s tax provision in theperiod of change. In determining whether a valuation allowance is warranted, the company evaluates factors suchas prior earnings history, expected future earnings, carryback and carryforward periods, and tax strategies thatcould potentially enhance the likelihood of realization of a deferred tax asset. The realizability assessments madeat a given balance sheet date are subject to change in the future, particularly if earnings of a subsidiary aresignificantly higher or lower than expected, or if the company takes operational or tax planning actions that couldimpact the future taxable earnings of a subsidiary.
In the normal course of business, the company is audited by federal, state and foreign tax authorities, and isperiodically challenged regarding the amount of taxes due. These challenges relate to the timing and amount of
43

deductions and the allocation of income among various tax jurisdictions. The company believes the company’stax positions comply with applicable tax law and the company intends to defend its positions. In evaluating theexposure associated with various tax filing positions, the company records reserves for uncertain tax positions inaccordance with GAAP, based on the technical support for the positions, the company’s past audit experiencewith similar situations, and potential interest and penalties related to the matters. The company’s results ofoperations and effective tax rate in a given period could be impacted if, upon final resolution with taxingauthorities, the company prevailed in positions for which reserves have been established, or was required to payamounts in excess of established reserves.
Valuation of Intangible Assets, Including IPR&DThe company acquires intangible assets and records them at fair value. Valuations are generally completed forbusiness acquisitions using a discounted cash flow analysis, incorporating the stage of completion andconsideration of market participant assumptions. The most significant estimates and assumptions inherent in adiscounted cash flow analysis include the amount and timing of projected future cash flows, the discount rateused to measure the risks inherent in the future cash flows, the assessment of the asset’s life cycle, and thecompetitive and other trends impacting the asset, including consideration of technical, legal, regulatory,economic and other factors. Each of these factors and assumptions can significantly affect the value of theintangible asset.
Acquired in-process R&D (IPR&D) is the value assigned to acquired technology or products under developmentwhich have not received regulatory approval and have no alternative future use.
Acquired IPR&D included in a business combination is capitalized as an indefinite-lived intangible asset.Development costs incurred after the acquisition are expensed as incurred. Upon receipt of regulatory approval ofthe related technology or product, the indefinite-lived intangible asset is then accounted for as a finite-livedintangible asset and amortized on a straight-line basis over its estimated useful life. If the R&D project isabandoned, the indefinite-lived asset is charged to expense.
R&D acquired in transactions that are not business combinations is expensed immediately. For such transactions,payments made to third parties subsequent to regulatory approval are capitalized and amortized over theremaining useful life of the related asset, and are classified as intangible assets.
Due to the inherent uncertainty associated with R&D projects, there is no assurance that actual results will notdiffer materially from the underlying assumptions used to prepare discounted cash flow analyses, nor that theR&D project will result in a successful commercial product.
Impairment of AssetsGoodwill and other indefinite-lived intangible assets are subject to impairment reviews annually, and wheneverindicators of impairment exist. Intangible assets with definite lives and other long-lived assets (such as fixedassets) are reviewed for impairment whenever events or changes in circumstances indicate that the carryingamount of an asset may not be recoverable. Refer to Note 1 for further information. The company’s impairmentreviews are based on an estimated future cash flow approach that requires significant judgment with respect tofuture volume, revenue and expense growth rates, changes in working capital use, foreign currency exchangerates, the selection of an appropriate discount rate, asset groupings, and other assumptions and estimates. Theestimates and assumptions used are consistent with the company’s business plans and a market participant’sviews of the company and similar companies. The use of alternative estimates and assumptions could increase ordecrease the estimated fair values of the assets, and potentially result in different impacts to the company’sresults of operations. Actual results may differ from the company’s estimates.
Stock-Based Compensation PlansStock-based compensation cost is estimated at the grant date based on the fair value of the award, and the cost isrecognized as expense ratably over the substantive vesting period. Determining the appropriate fair value model
44

to use requires judgment. Determining the assumptions that enter into the model is highly subjective and alsorequires judgment. The company’s stock compensation costs primarily relate to awards of stock options,restricted stock units (RSUs), and performance share units (PSUs). The company uses the Black-Scholes modelfor estimating the fair value of stock options, and significant assumptions include long-term projectionsregarding stock price volatility, employee exercise, post-vesting termination and pre-vesting forfeiture behaviors,interest rates and dividend yields. The fair value of RSUs is equal to the quoted price of the company’s commonstock on the date of grant. The company uses a Monte Carlo model for estimating the fair value of PSUs, andsignificant inputs include the risk-free rate, volatility of returns and correlation of returns. Refer to Note 10 foradditional information.
CERTAIN REGULATORY MATTERS
In July 2010, FDA issued a final order regarding the recall of the company’s COLLEAGUE infusion pumps thenin use in the United States. The company substantially completed the recall in July 2012 and FDA closed therecall in November 2012.
In June 2010, the company received a Warning Letter from FDA in connection with an inspection of its Renalbusiness’s McGaw Park, Illinois headquarters facility. The Warning Letter pertains to the processes by which thecompany analyzes and addresses product complaints through corrective and preventative actions, and reportsrelevant information to FDA. The company is working with FDA to resolve this matter.
Please see Item 1A of this Annual Report on Form 10-K for additional discussion of regulatory matters and howthey may impact the company.
FORWARD-LOOKING INFORMATION
This annual report includes forward-looking statements, including statements regarding accounting estimates andassumptions, litigation-related matters including outcomes, future regulatory filings and the company’s R&Dpipeline, strategic objectives, credit exposure to foreign governments, potential developments with respect tocredit ratings, investment of foreign earnings, estimates of liabilities including those related to uncertain taxpositions, contingent payments, future pension plan contributions, costs, discount rates and rates of return, thecompany’s exposure to financial market volatility and foreign currency and interest rate risk, geographicexpansion, business development activities, the pending Gambro acquisition, including its expected closing,financing and financial impact, future capital and R&D expenditures, including with respect to the Covington,Georgia facility, future stock repurchases and debt issuances, the impact of healthcare reform, the sufficiency ofthe company’s facilities and financial flexibility, the adequacy of credit facilities, tax provisions and reserves, theeffective tax rate in 2013, the impact on the company of recent tax legislation and all other statements that do notrelate to historical facts. The statements are based on assumptions about many important factors, including:
• demand for and market acceptance risks for and competitive pressures related to new and existingproducts, such as ADVATE and plasma-based therapies (including Antibody Therapy), and othertherapies;
• fluctuations in supply and demand and the pricing of plasma-based therapies;
• the impact of U.S. healthcare reform and other similar actions undertaken by foreign governments withrespect to pricing, reimbursement, taxation and rebate policies;
• additional legislation, regulation and other governmental pressures in the United States or globally,which may affect pricing, reimbursement, taxation and rebate policies of government agencies andprivate payers or other elements of the company’s business;
• future actions of third parties, including third-party payors, as healthcare reform and other similarmeasures are implemented in the United States and globally;
45

• the company’s ability to identify business development and growth opportunities;
• receipt of regulatory approvals and satisfaction of closing conditions related to the pending Gambroacquisition;
• product quality or patient safety issues, leading to product recalls, withdrawals, launch delays,sanctions, seizures, litigation, or declining sales;
• future actions of FDA, EMA or any other regulatory body or government authority that could delay,limit or suspend product development, manufacturing or sale or result in seizures, recalls, injunctions,monetary sanctions or criminal or civil liabilities;
• fluctuations in foreign exchange and interest rates;
• product development risks, including satisfactory clinical performance, the ability to manufacture atappropriate scale, and the general unpredictability associated with the product development cycle;
• the ability to enforce the company’s patent rights or patents of third parties preventing or restricting thecompany’s manufacture, sale or use of affected products or technology;
• the impact of geographic and product mix on the company’s sales;
• the impact of competitive products and pricing, including generic competition, drug reimportation anddisruptive technologies;
• inventory reductions or fluctuations in buying patterns by wholesalers or distributors;
• the availability and pricing of acceptable raw materials and component supply;
• global regulatory, trade and tax policies;
• any changes in law concerning the taxation of income, including income earned outside the UnitedStates;
• actions by tax authorities in connection with ongoing tax audits;
• the company’s ability to realize the anticipated benefits of its business optimization and transformationinitiatives;
• the successful implementation of the company’s global enterprise resource planning system;
• the company’s ability to realize the anticipated benefits from its joint product development andcommercialization arrangements, including governmental collaborations;
• changes in credit agency ratings;
• the impact of global economic conditions on the company and its customers and suppliers, includingforeign governments in certain countries in which the company operates; and
• other factors identified elsewhere in this Annual Report on Form 10-K including those factorsdescribed in Item 1A and other filings with the Securities and Exchange Commission, all of which areavailable on the company’s website.
Actual results may differ materially from those projected in the forward-looking statements. The company doesnot undertake to update its forward-looking statements.
Item 7A. Quantitative and Qualitative Disclosures About Market Risk.
Incorporated by reference to the section entitled “Financial Instrument Market Risk” in “Management’sDiscussion and Analysis of Financial Condition and Results of Operations” in Item 7 of this Annual Report onForm 10-K.
46

Item 8. Financial Statements and Supplementary Data.
CONSOLIDATED BALANCE SHEETS
as of December 31 (in millions, except share information) 2012 2011
Current Assets Cash and equivalents . . . . . . . . . . . . . . . . . . . . . . . . . . . . . . . . . . . . . $ 3,270 $ 2,905Accounts and other current receivables, net . . . . . . . . . . . . . . . . . . . . 2,425 2,420Inventories . . . . . . . . . . . . . . . . . . . . . . . . . . . . . . . . . . . . . . . . . . . . . 2,803 2,628Short-term deferred income taxes . . . . . . . . . . . . . . . . . . . . . . . . . . . . 344 295Prepaid expenses and other . . . . . . . . . . . . . . . . . . . . . . . . . . . . . . . . . 418 402
Total current assets . . . . . . . . . . . . . . . . . . . . . . . . . . . . . . . . . . . . . . 9,260 8,650
Property, Plant and Equipment, Net . . . . . . . . . . . . . . . . . . . . . . . . . . . . . . . . . . . . . . . . . . . . . . . . . . . . 6,098 5,525
Other Assets Goodwill . . . . . . . . . . . . . . . . . . . . . . . . . . . . . . . . . . . . . . . . . . . . . . . 2,502 2,317Other intangible assets, net . . . . . . . . . . . . . . . . . . . . . . . . . . . . . . . . . 814 826Other . . . . . . . . . . . . . . . . . . . . . . . . . . . . . . . . . . . . . . . . . . . . . . . . . . 1,716 1,755
Total other assets . . . . . . . . . . . . . . . . . . . . . . . . . . . . . . . . . . . . . . . 5,032 4,898
Total assets . . . . . . . . . . . . . . . . . . . . . . . . . . . . . . . . . . . . . . . . . . . . $20,390 $19,073
Current Liabilities Short-term debt . . . . . . . . . . . . . . . . . . . . . . . . . . . . . . . . . . . . . . . . . . $ 27 $ 256Current maturities of long-term debt and lease obligations . . . . . . . . 323 190Accounts payable and accrued liabilities . . . . . . . . . . . . . . . . . . . . . . 4,409 4,411
Total current liabilities . . . . . . . . . . . . . . . . . . . . . . . . . . . . . . . . . . . 4,759 4,857
Long-Term Debt and Lease Obligations . . . . . . . . . . . . . . . . . . . . . . . . . . . . . . . . . . . . . . . . . . . . . . . . . 5,580 4,749
Other Long-Term Liabilities . . . . . . . . . . . . . . . . . . . . . . . . . . . . . . . . . . . . . . . . . . . . . . . . . . . . . . . . . . . 3,073 2,639
Commitments and Contingencies
Equity Common stock, $1 par value, authorized2,000,000,000 shares, issued683,494,944 shares in 2012 and 2011 . . . . . . . . . . . . . . . . . . . . . . 683 683
Common stock in treasury, at cost,137,281,399 shares in 2012 and 122,524,448 shares in 2011 . . . . (7,592) (6,719)
Additional contributed capital . . . . . . . . . . . . . . . . . . . . . . . . . . . . . . 5,769 5,783Retained earnings . . . . . . . . . . . . . . . . . . . . . . . . . . . . . . . . . . . . . . . . 10,888 9,429Accumulated other comprehensive loss . . . . . . . . . . . . . . . . . . . . . . . (2,810) (2,591)
Total Baxter International Inc. (Baxter)shareholders’ equity . . . . . . . . . . . . . . . . . . . . . . . . . . . . . . . . . . . 6,938 6,585
Noncontrolling interests . . . . . . . . . . . . . . . . . . . . . . . . . . . . . . 40 243
Total equity . . . . . . . . . . . . . . . . . . . . . . . . . . . . . . . . . . . . . . . . . . . . 6,978 6,828
Total liabilities and equity . . . . . . . . . . . . . . . . . . . . . . . . . . . . . . . . $20,390 $19,073
The accompanying notes are an integral part of these consolidated financial statements.
47

CONSOLIDATED STATEMENTS OF INCOME
years ended December 31 (in millions, except per share data) 2012 2011 2010
Net sales . . . . . . . . . . . . . . . . . . . . . . . . . . . . . . . . . . . . . . . . . . . . . . . . . . . . . . . . . . . . . . . . . . . $14,190 $13,893 $12,843Cost of sales . . . . . . . . . . . . . . . . . . . . . . . . . . . . . . . . . . . . . . . . . . . . . . . . . . . . . . . . . . . . . . . . 6,889 6,847 6,885
Gross margin . . . . . . . . . . . . . . . . . . . . . . . . . . . . . . . . . . . . . . . . . . . . . . . . . . . . . . . . . . . . . . . . 7,301 7,046 5,958
Marketing and administrative expenses . . . . . . . . . . . . . . . . . . . . . . . . . . . . . . . . . . . . . . . . . . . 3,324 3,154 2,907Research and development expenses . . . . . . . . . . . . . . . . . . . . . . . . . . . . . . . . . . . . . . . . . . . . . 1,156 946 915Net interest expense . . . . . . . . . . . . . . . . . . . . . . . . . . . . . . . . . . . . . . . . . . . . . . . . . . . . . . . . . . 87 54 87Other (income) expense, net . . . . . . . . . . . . . . . . . . . . . . . . . . . . . . . . . . . . . . . . . . . . . . . . . . . . (155) 83 159
Income before income taxes . . . . . . . . . . . . . . . . . . . . . . . . . . . . . . . . . . . . . . . . . . . . . . . . . . . . 2,889 2,809 1,890Income tax expense . . . . . . . . . . . . . . . . . . . . . . . . . . . . . . . . . . . . . . . . . . . . . . . . . . . . . . . . . . . 563 553 463
Net income . . . . . . . . . . . . . . . . . . . . . . . . . . . . . . . . . . . . . . . . . . . . . . . . . . . . . . . . . . . . . . . . . 2,326 2,256 1,427
Less: Net income attributable to noncontrolling interests . . . . . . . . . . . . . . . . . . . . . . . . . . — 32 7
Net income attributable to Baxter . . . . . . . . . . . . . . . . . . . . . . . . . . . . . . . . . . . . . . . . . . . . . . $ 2,326 $ 2,224 $ 1,420
Net income attributable to Baxter per common shareBasic . . . . . . . . . . . . . . . . . . . . . . . . . . . . . . . . . . . . . . . . . . . . . . . . . . . . . . . . . . . . . . . . . . $ 4.22 $ 3.91 $ 2.41
Diluted . . . . . . . . . . . . . . . . . . . . . . . . . . . . . . . . . . . . . . . . . . . . . . . . . . . . . . . . . . . . . . . . . $ 4.18 $ 3.88 $ 2.39
Weighted-average number of common shares outstandingBasic . . . . . . . . . . . . . . . . . . . . . . . . . . . . . . . . . . . . . . . . . . . . . . . . . . . . . . . . . . . . . . . . . . 551 569 590
Diluted . . . . . . . . . . . . . . . . . . . . . . . . . . . . . . . . . . . . . . . . . . . . . . . . . . . . . . . . . . . . . . . . . 556 573 594
The accompanying notes are an integral part of these consolidated financial statements.
48

CONSOLIDATED STATEMENTS OF COMPREHENSIVE INCOME
years ended December 31 (in millions) 2012 2011 2010
Net income . . . . . . . . . . . . . . . . . . . . . . . . . . . . . . . . . . . . . . . . . . . . . . . . . . . . . . . . . . . . . . . . . . . . $2,326 $2,256 $1,427Other comprehensive loss, net of tax:
Currency translation adjustments, net of tax expense (benefit) of$22 in 2012, ($12) in 2011 and ($5) in 2010 . . . . . . . . . . . . . . . . . . . . . . . . . . . . . . . . . . . . . . (98) (205) (342)
Pension and other employee benefits, net of tax benefitof ($1) in 2012, ($151) in 2011 and ($32) in 2010 . . . . . . . . . . . . . . . . . . . . . . . . . . . . . . . . . . (111) (263) (57)
Hedging activities, net of tax (benefit) expense of ($6) in 2012,$5 in 2011 and ($2) in 2010 . . . . . . . . . . . . . . . . . . . . . . . . . . . . . . . . . . . . . . . . . . . . . . . . . . . (7) 5 (6)
Other, net of tax (benefit) expense of ($2) in 2012, $1 in 2011and $2 in 2010 . . . . . . . . . . . . . . . . . . . . . . . . . . . . . . . . . . . . . . . . . . . . . . . . . . . . . . . . . . . . . . (3) 1 3
Total other comprehensive loss, net of tax . . . . . . . . . . . . . . . . . . . . . . . . . . . . . . . . . . . . . . . . . . . . (219) (462) (402)
Comprehensive income . . . . . . . . . . . . . . . . . . . . . . . . . . . . . . . . . . . . . . . . . . . . . . . . . . . . . . . . . . . 2,107 1,794 1,025
Less: Comprehensive income attributable tononcontrolling interests . . . . . . . . . . . . . . . . . . . . . . . . . . . . . . . . . . . . . . . . . . . . . . . . . . . . . . . — 22 6
Comprehensive income attributable to Baxter . . . . . . . . . . . . . . . . . . . . . . . . . . . . . . . . . . . . . . . $2,107 $1,772 $1,019
The accompanying notes are an integral part of these consolidated financial statements.
49

CONSOLIDATED STATEMENTS OF CASH FLOWS
years ended December 31 (in millions) (brackets denote cash outflows) 2012 2011 2010
Cash Flows Net income . . . . . . . . . . . . . . . . . . . . . . . . . . . . . . . . . . . . . . $ 2,326 $ 2,256 $ 1,427from Operations Adjustments
Depreciation and amortization . . . . . . . . . . . . . . . . . . . . 712 670 685Deferred income taxes . . . . . . . . . . . . . . . . . . . . . . . . . . . (17) 172 76Stock compensation . . . . . . . . . . . . . . . . . . . . . . . . . . . . . 130 119 120Realized excess tax benefits from stock issued under
employee benefit plans . . . . . . . . . . . . . . . . . . . . . . . . (24) (21) (41)Infusion pump charge . . . . . . . . . . . . . . . . . . . . . . . . . . . — — 588Business optimization charges . . . . . . . . . . . . . . . . . . . . 150 192 257Asset impairment and other charges . . . . . . . . . . . . . . . . — 182 140Pension settlement charges . . . . . . . . . . . . . . . . . . . . . . . 168 — —Litigation-related charge . . . . . . . . . . . . . . . . . . . . . . . . . — — 62Other . . . . . . . . . . . . . . . . . . . . . . . . . . . . . . . . . . . . . . . . (42) 32 57Changes in balance sheet items
Accounts and other current receivables, net . . . . . . . . (41) (229) (122)Inventories . . . . . . . . . . . . . . . . . . . . . . . . . . . . . . . . . . (129) (315) 20Accounts payable and accrued liabilities . . . . . . . . . . 18 98 26Infusion pump and business
optimization payments . . . . . . . . . . . . . . . . . . . . . . . (283) (347) (110)Other . . . . . . . . . . . . . . . . . . . . . . . . . . . . . . . . . . . . . . 138 8 (182)
Cash flows from operations . . . . . . . . . . . . . . . . . . . . . . . 3,106 2,817 3,003
Cash Flows fromInvesting Activities
Capital expenditures (including additions to the pool ofequipment placed with or leased to customers of $150 in2012, $155 in 2011 and $112 in 2010) . . . . . . . . . . . . . . (1,161) (960) (963)
Acquisitions and investments . . . . . . . . . . . . . . . . . . . . . . . (515) (590) (319)Divestitures and other investing activities . . . . . . . . . . . . . . 107 123 18
Cash flows from investing activities . . . . . . . . . . . . . . . . . (1,569) (1,427) (1,264)
Cash Flows from Issuances of debt . . . . . . . . . . . . . . . . . . . . . . . . . . . . . . . . . 1,037 506 658Financing Activities Payments of obligations . . . . . . . . . . . . . . . . . . . . . . . . . . . (22) (23) (567)
(Decrease) increase in debt with original maturities ofthree months or less, net . . . . . . . . . . . . . . . . . . . . . . . . . (250) 250 —
Cash dividends on common stock . . . . . . . . . . . . . . . . . . . . (804) (709) (688)Proceeds and realized excess tax benefits from stock
issued under employee benefit plans . . . . . . . . . . . . . . . . 512 448 381Purchases of treasury stock . . . . . . . . . . . . . . . . . . . . . . . . . (1,480) (1,583) (1,453)Other . . . . . . . . . . . . . . . . . . . . . . . . . . . . . . . . . . . . . . . . . . (108) (26) (47)
Cash flows from financing activities . . . . . . . . . . . . . . . . (1,115) (1,137) (1,716)
Effect of Foreign Exchange Rate Changes on Cash and Equivalents . . . . . . . . . . . . . . . . . . (57) (33) (124)
Increase (Decrease) in Cash and Equivalents . . . . . . . . . . . . . . . . . . . . . . . . . . . . . . . . . . . . . . 365 220 (101)
Cash and Equivalents at Beginning of Year . . . . . . . . . . . . . . . . . . . . . . . . . . . . . . . . . . . . . . . 2,905 2,685 2,786
Cash and Equivalents at End of Year . . . . . . . . . . . . . . . . . . . . . . . . . . . . . . . . . . . . . . . . . . . . $ 3,270 $ 2,905 $ 2,685
Other supplemental informationInterest paid, net of portion capitalized . . . . . . . . . . . . . . . . . . . . . . . . . . . . . . . . . . . . . . . . . . . . . $ 135 $ 88 $ 112Income taxes paid . . . . . . . . . . . . . . . . . . . . . . . . . . . . . . . . . . . . . . . . . . . . . . . . . . . . . . . . . . . . . $ 415 $ 357 $ 353
The accompanying notes are an integral part of these consolidated financial statements.
50
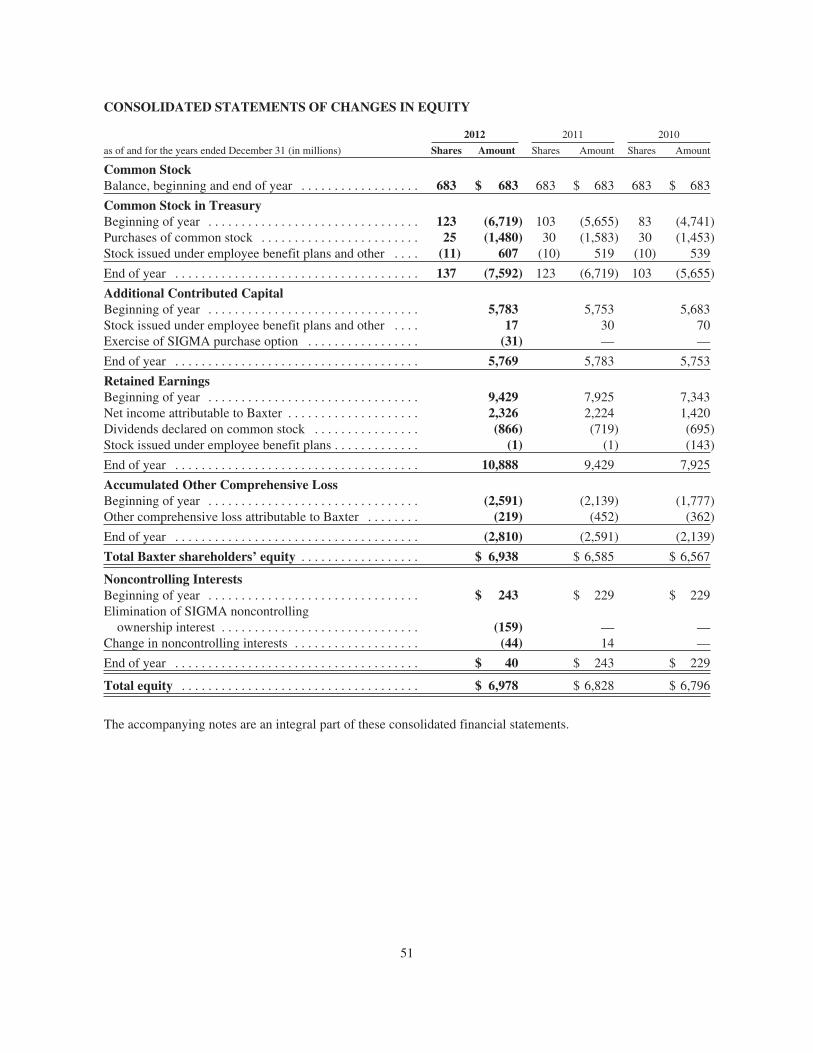
CONSOLIDATED STATEMENTS OF CHANGES IN EQUITY
2012 2011 2010
as of and for the years ended December 31 (in millions) Shares Amount Shares Amount Shares Amount
Common StockBalance, beginning and end of year . . . . . . . . . . . . . . . . . . 683 $ 683 683 $ 683 683 $ 683
Common Stock in TreasuryBeginning of year . . . . . . . . . . . . . . . . . . . . . . . . . . . . . . . . 123 (6,719) 103 (5,655) 83 (4,741)Purchases of common stock . . . . . . . . . . . . . . . . . . . . . . . . 25 (1,480) 30 (1,583) 30 (1,453)Stock issued under employee benefit plans and other . . . . (11) 607 (10) 519 (10) 539
End of year . . . . . . . . . . . . . . . . . . . . . . . . . . . . . . . . . . . . . 137 (7,592) 123 (6,719) 103 (5,655)
Additional Contributed CapitalBeginning of year . . . . . . . . . . . . . . . . . . . . . . . . . . . . . . . . 5,783 5,753 5,683Stock issued under employee benefit plans and other . . . . 17 30 70Exercise of SIGMA purchase option . . . . . . . . . . . . . . . . . (31) — —
End of year . . . . . . . . . . . . . . . . . . . . . . . . . . . . . . . . . . . . . 5,769 5,783 5,753
Retained EarningsBeginning of year . . . . . . . . . . . . . . . . . . . . . . . . . . . . . . . . 9,429 7,925 7,343Net income attributable to Baxter . . . . . . . . . . . . . . . . . . . . 2,326 2,224 1,420Dividends declared on common stock . . . . . . . . . . . . . . . . (866) (719) (695)Stock issued under employee benefit plans . . . . . . . . . . . . . (1) (1) (143)
End of year . . . . . . . . . . . . . . . . . . . . . . . . . . . . . . . . . . . . . 10,888 9,429 7,925
Accumulated Other Comprehensive LossBeginning of year . . . . . . . . . . . . . . . . . . . . . . . . . . . . . . . . (2,591) (2,139) (1,777)Other comprehensive loss attributable to Baxter . . . . . . . . (219) (452) (362)
End of year . . . . . . . . . . . . . . . . . . . . . . . . . . . . . . . . . . . . . (2,810) (2,591) (2,139)
Total Baxter shareholders’ equity . . . . . . . . . . . . . . . . . . $ 6,938 $ 6,585 $ 6,567
Noncontrolling InterestsBeginning of year . . . . . . . . . . . . . . . . . . . . . . . . . . . . . . . . $ 243 $ 229 $ 229Elimination of SIGMA noncontrolling
ownership interest . . . . . . . . . . . . . . . . . . . . . . . . . . . . . . (159) — —Change in noncontrolling interests . . . . . . . . . . . . . . . . . . . (44) 14 —
End of year . . . . . . . . . . . . . . . . . . . . . . . . . . . . . . . . . . . . . $ 40 $ 243 $ 229
Total equity . . . . . . . . . . . . . . . . . . . . . . . . . . . . . . . . . . . . $ 6,978 $ 6,828 $ 6,796
The accompanying notes are an integral part of these consolidated financial statements.
51

NOTES TO CONSOLIDATED FINANCIAL STATEMENTS
NOTE 1SUMMARY OF SIGNIFICANT ACCOUNTING POLICIES
Nature of OperationsBaxter International Inc. (Baxter or the company), through its subsidiaries, develops, manufactures and marketsproducts that save and sustain the lives of people with hemophilia, immune disorders, infectious diseases, kidneydisease, trauma, and other chronic and acute medical conditions. As a global, diversified healthcare company,Baxter applies a unique combination of expertise in medical devices, pharmaceuticals and biotechnology tocreate products that advance patient care worldwide. The company operates in two segments, BioScience andMedical Products, which are described in Note 14.
Use of EstimatesThe preparation of the financial statements in conformity with generally accepted accounting principles (GAAP)requires the company to make estimates and assumptions that affect reported amounts and related disclosures.Actual results could differ from those estimates.
Basis of ConsolidationThe consolidated financial statements include the accounts of Baxter and its majority-owned subsidiaries, anyminority-owned subsidiaries that Baxter controls, and variable interest entities (VIEs) in which Baxter is theprimary beneficiary, after elimination of intercompany transactions. During 2012, the company exercised itsoption to purchase the remaining equity of Sigma International General Medical Apparatus, LLC (SIGMA),which Baxter previously consolidated as the primary beneficiary of the VIE. The company did not enter into anynew arrangements in which it determined that it was the primary beneficiary of a VIE, and there were no VIEsconsolidated by the company as of December 31, 2012. Refer to Note 2 for additional information about theSIGMA option exercise.
Certain reclassifications have been made to conform the prior period consolidated financial statements to thecurrent period presentation.
Revenue RecognitionThe company recognizes revenues from product sales and services when earned. Specifically, revenue isrecognized when persuasive evidence of an arrangement exists, delivery has occurred (or services have beenrendered), the price is fixed or determinable, and collectibility is reasonably assured. For product sales, revenueis not recognized until title and risk of loss have transferred to the customer. The shipping terms for the majorityof the company’s revenue arrangements are FOB destination. The recognition of revenue is delayed if there aresignificant post-delivery obligations, such as training, installation or other services. Provisions for discounts,rebates to customers, chargebacks to wholesalers and returns are provided for at the time the related sales arerecorded, and are reflected as a reduction to gross sales to arrive at net sales.
The company sometimes enters into arrangements in which it commits to delivering multiple products or servicesto its customers. In these cases, total arrangement consideration is allocated to the deliverables based on theirrelative selling prices. Then the allocated consideration is recognized as revenue in accordance with theprinciples described above. Selling prices are determined by applying a selling price hierarchy. Selling prices aredetermined using vendor specific objective evidence (VSOE), if it exists. Otherwise, selling prices aredetermined using third party evidence (TPE). If neither VSOE nor TPE is available, the company uses its bestestimate of selling prices.
52

Accounts Receivable and Allowance for Doubtful AccountsIn the normal course of business, the company provides credit to its customers, performs credit evaluations ofthese customers and maintains reserves for potential credit losses. In determining the amount of the allowance fordoubtful accounts, the company considers, among other items, historical credit losses, the past-due status ofreceivables, payment histories and other customer-specific information. Receivables are written off when thecompany determines they are uncollectible. The allowance for doubtful accounts was $127 million atDecember 31, 2012 and $128 million at December 31, 2011.
Product WarrantiesThe company provides for the estimated costs relating to product warranties at the time the related revenue isrecognized. The cost is determined based on actual company experience for the same or similar products, as wellas other relevant information. Product warranty liabilities are adjusted based on changes in estimates.
Cash and EquivalentsCash and equivalents include cash, certificates of deposit and money market funds with an original maturity ofthree months or less.
Inventories
as of December 31 (in millions) 2012 2011
Raw materials . . . . . . . . . . . . . . . . . . . . . . . . . . . . . . . . . . . . . . . . . . . . . . . . . . . . . . . . . . . . . . . . $ 765 $ 596Work in process . . . . . . . . . . . . . . . . . . . . . . . . . . . . . . . . . . . . . . . . . . . . . . . . . . . . . . . . . . . . . . . 898 923Finished goods . . . . . . . . . . . . . . . . . . . . . . . . . . . . . . . . . . . . . . . . . . . . . . . . . . . . . . . . . . . . . . . . 1,140 1,109
Inventories . . . . . . . . . . . . . . . . . . . . . . . . . . . . . . . . . . . . . . . . . . . . . . . . . . . . . . . . . . . . . . . . . . . $2,803 $2,628
Inventories are stated at the lower of cost (first-in, first-out method) or market value. Market value for rawmaterials is based on replacement costs, and market value for work in process and finished goods is based on netrealizable value. The company reviews inventories on hand at least quarterly and records provisions for estimatedexcess, slow-moving and obsolete inventory, as well as inventory with a carrying value in excess of net realizablevalue.
Property, Plant and Equipment, Net
as of December 31 (in millions) 2012 2011
Land . . . . . . . . . . . . . . . . . . . . . . . . . . . . . . . . . . . . . . . . . . . . . . . . . . . . . . . . . . . . . . . . . . . . . . $ 190 $ 184Buildings and leasehold improvements . . . . . . . . . . . . . . . . . . . . . . . . . . . . . . . . . . . . . . . . . . 2,181 2,099Machinery and equipment . . . . . . . . . . . . . . . . . . . . . . . . . . . . . . . . . . . . . . . . . . . . . . . . . . . . . 6,691 6,384Equipment with customers . . . . . . . . . . . . . . . . . . . . . . . . . . . . . . . . . . . . . . . . . . . . . . . . . . . . 1,295 1,205Construction in progress . . . . . . . . . . . . . . . . . . . . . . . . . . . . . . . . . . . . . . . . . . . . . . . . . . . . . . 1,512 1,101
Total property, plant and equipment, at cost . . . . . . . . . . . . . . . . . . . . . . . . . . . . . . . . . . . . . . . 11,869 10,973Accumulated depreciation and amortization . . . . . . . . . . . . . . . . . . . . . . . . . . . . . . . . . . . . . . . (5,771) (5,448)
Property, plant and equipment (PP&E), net . . . . . . . . . . . . . . . . . . . . . . . . . . . . . . . . . . . . . . . $ 6,098 $ 5,525
Depreciation and amortization expense is calculated using the straight-line method over the estimated useful livesof the related assets, which range from 20 to 50 years for buildings and improvements and from three to 15 yearsfor machinery and equipment. Leasehold improvements are amortized over the life of the related facility lease(including any renewal periods, if appropriate) or the asset, whichever is shorter. Baxter capitalizes in machineryand equipment certain computer software and software development costs incurred in connection withdeveloping or obtaining software for internal use. Capitalized software costs are amortized on a straight-linebasis over the estimated useful lives of the software. Straight-line and accelerated methods of depreciation are
53

used for income tax purposes. Depreciation and amortization expense was $597 million in 2012, $572 million in2011 and $592 million in 2010. Repairs and maintenance expense was $297 million in 2012, $269 million in2011 and $254 million in 2010.
AcquisitionsResults of operations of acquired companies are included in the company’s results of operations as of therespective acquisition dates. The purchase price of each acquisition is allocated to the net assets acquired basedon estimates of their fair values at the date of the acquisition. Contingent consideration is recognized at theestimated fair value on the acquisition date. Subsequent changes to the fair value of contingent payments arerecognized in earnings. Any purchase price in excess of these net assets is recorded as goodwill. The allocationof purchase price in certain cases may be subject to revision based on the final determination of fair valuesduring the measurement period, which may be up to one year from the acquisition date.
Research and DevelopmentResearch and development (R&D) costs are expensed as incurred. Acquired in-process R&D (IPR&D) is thevalue assigned to acquired technology or products under development which have not received regulatoryapproval and have no alternative future use. Valuations are generally completed for business acquisitions using adiscounted cash flow analysis, incorporating the stage of completion and consideration of market participantassumptions. The most significant estimates and assumptions inherent in a discounted cash flow analysis includethe amount and timing of projected future cash flows, the discount rate used to measure the risks inherent in thefuture cash flows, the assessment of the asset’s life cycle, and the competitive and other trends impacting theasset, including consideration of technical, legal, regulatory, economic and other factors. Each of these factorscan significantly affect the value of the IPR&D.
Acquired IPR&D included in a business combination is capitalized as an indefinite-lived intangible asset.Development costs incurred after the acquisition are expensed as incurred. Upon receipt of regulatory approval ofthe related technology or product, the indefinite-lived intangible asset is then accounted for as a finite-livedintangible asset and amortized on a straight-line basis over its estimated useful life, subject to impairmentreviews as discussed below. If the R&D project is abandoned, the indefinite-lived asset is charged to expense.
R&D acquired in transactions that are not business acquisitions is expensed immediately. Payments made to thirdparties subsequent to regulatory approval are capitalized and amortized over the remaining useful life of therelated asset, and are classified as intangible assets.
Collaborative ArrangementsIn the normal course of business, Baxter enters into collaborative arrangements with third parties. Certain ofthese collaborative arrangements include joint operating activities involving active participation by both partners,where both Baxter and the other entity are exposed to risks and rewards dependent on the commercial success ofthe activity. These collaborative arrangements exist in both of the company’s segments, take a number of formsand structures, principally pertain to the joint development and commercialization of new products, and aredesigned to enhance and expedite long-term sales and profitability growth.
The company’s joint product development and commercialization arrangements generally provide that Baxterlicense certain rights to manufacture, market or distribute a specified technology or product under development.Baxter’s consideration for the rights generally consists of some combination of upfront payments, ongoing R&Dcost reimbursements, royalties, and contingent payments relating to the achievement of specified pre-clinical,clinical, regulatory approval or sales milestones. Joint steering committees often exist to manage the variousstages and activities of the arrangement. Control over the R&D activities may be shared or may be performed byBaxter. Baxter generally controls the commercialization phase, sometimes purchasing inventories from thecollaboration partner.
54

During the development phase, Baxter’s R&D costs are expensed as incurred. These costs may include R&D costreimbursements to the partner, as well as upfront and milestone payments made to the partner prior to the datethe product receives regulatory approval. Milestone payments made to the partner subsequent to regulatoryapproval are capitalized as other intangible assets and amortized to cost of sales over the estimated useful life ofthe related asset. Royalty payments are expensed as cost of sales when they become due and payable. Anypurchases of inventory from the partner during the development stage are expensed as R&D, while suchpurchases during the commercialization phase are capitalized as inventory and recognized as cost of sales whenthe related finished products are sold. Baxter generally records the amount invoiced to the third-party customerfor the finished product as sales, as Baxter is the principal and primary obligor in the arrangement.
Payments to collaborative partners classified in cost of sales were not significant in 2012, 2011 and 2010.Payments to collaborative partners classified in R&D expenses were $138 million, $18 million and $52 millionin 2012, 2011 and 2010, respectively. In 2012, the payments related primarily to upfront payments for thebusiness development arrangements described in Note 4. In 2011 and 2010, the payments primarily related to thedevelopment of longer-acting forms of blood clotting proteins to treat hemophilia and a home hemodialysis (HD)device. Payments in 2010 also related to the development of tissue repair products under a collaborationagreement which was terminated in 2011.
Business Optimization ChargesThe company records liabilities for costs associated with exit or disposal activities in the period in which theliability is incurred. Employee termination costs are primarily recorded when actions are probable and estimable.Costs for one-time termination benefits in which the employee is required to render service until termination inorder to receive the benefits are recognized ratably over the future service period. Refer to the discussion belowregarding the accounting for asset impairment charges.
Impairment ReviewsBaxter has made and continues to make significant investments in assets, including inventory and PP&E, whichrelate to potential new products or modifications to existing products. Additionally, Baxter has made andcontinues to make significant investments related to business development activities, which result in theacquisition of certain intangible assets and other long-lived assets. The company’s ability to realize value fromthese investments is contingent on, among other things, regulatory approvals, market acceptance of these new ormodified products, and realization of synergies associated with business acquisitions. The company may not beable to realize the expected returns from these investments, potentially resulting in asset impairments in thefuture.
GoodwillGoodwill is not amortized, but is subject to an impairment review annually and whenever indicators ofimpairment exist. Goodwill would be impaired if the carrying amount of a reporting unit exceeded the fair valueof that reporting unit, calculated as the present value of estimated cash flows discounted using a risk-free marketrate adjusted for a market participant’s view of similar companies and perceived risks in the cash flows. Theimplied fair value of goodwill is then determined by subtracting the fair value of all identifiable net assets otherthan goodwill from the fair value of the reporting unit, with an impairment charge recorded for the excess, if any,of carrying amount of goodwill over the implied fair value.
The company assesses goodwill for impairment based on its reporting units, which are the same as its operatingsegments, which are BioScience and Medical Products. As of December 31, 2012, the date of the company’sannual impairment review, the fair values of the company’s reporting units were substantially in excess of theircarrying values. Baxter’s market capitalization as of December 31, 2012 was approximately $36 billion.
55

Intangible Assets Not Subject to AmortizationIndefinite-lived intangible assets, such as trademarks with indefinite lives and certain acquired IPR&D, aresubject to an impairment review annually and whenever indicators of impairment exist. Indefinite-livedintangible assets would be impaired if the carrying amount of the asset exceeded the fair value of the asset.
Other Long-Lived AssetsThe company reviews the carrying amounts of long-lived assets, other than goodwill and intangible assets notsubject to amortization, for potential impairment when events or changes in circumstances indicate that thecarrying amount of an asset may not be recoverable. Examples of such a change in circumstances include asignificant decrease in market price, a significant adverse change in the extent or manner in which an asset isbeing used, or a significant adverse change in the legal or business climate. In evaluating recoverability, thecompany groups assets and liabilities at the lowest level such that the identifiable cash flows relating to the groupare largely independent of the cash flows of other assets and liabilities. The company then compares the carryingamounts of the assets or asset groups with the related estimated undiscounted future cash flows. In the eventimpairment exists, an impairment charge is recorded as the amount by which the carrying amount of the asset orasset group exceeds the fair value. Depending on the asset and the availability of information, fair value may bedetermined by reference to estimated selling values of assets in similar condition, or by using a discounted cashflow model. In addition, the remaining amortization period for the impaired asset would be reassessed and, ifnecessary, revised.
Shipping and Handling CostsShipping costs, which are costs incurred to physically move product from Baxter’s premises to the customer’spremises, are classified as marketing and administrative expenses. Handling costs, which are costs incurred tostore, move and prepare products for shipment, are classified as cost of sales. Approximately $265 million in2012, $260 million in 2011 and $233 million in 2010 of shipping costs were classified in marketing andadministrative expenses.
Income TaxesDeferred taxes are recognized for the future tax effects of temporary differences between financial and incometax reporting based on enacted tax laws and rates. The company maintains valuation allowances unless it is morelikely than not that the deferred tax asset will be realized. With respect to uncertain tax positions, the companydetermines whether the position is more likely than not to be sustained upon examination, based on the technicalmerits of the position. Any tax position that meets the more-likely-than-not recognition threshold is measuredand recognized in the consolidated financial statements at the largest amount of benefit that is greater than 50%likely of being realized upon ultimate settlement. The liability relating to uncertain tax positions is classified ascurrent in the consolidated balance sheets to the extent the company anticipates making a payment within oneyear. Interest and penalties associated with income taxes are classified in the income tax expense line in theconsolidated statements of income.
Foreign Currency TranslationCurrency translation adjustments (CTA) related to foreign operations are principally included in othercomprehensive income (OCI). For foreign operations in highly inflationary economies, translation gains andlosses are included in other (income) expense, net, and were not material in 2012, 2011 and 2010.
Derivatives and Hedging ActivitiesAll derivative instruments are recognized as either assets or liabilities at fair value in the consolidated balancesheets and are classified as short-term or long-term based on the scheduled maturity of the instrument. Basedupon the exposure being hedged, the company designates its hedging instruments as cash flow or fair valuehedges.
56

For each derivative instrument that is designated and effective as a cash flow hedge, the gain or loss on thederivative is accumulated in accumulated other comprehensive income (AOCI) and then recognized in earningsconsistent with the underlying hedged item. Option premiums or net premiums paid are initially recorded asassets and reclassified to OCI over the life of the option, and then recognized in earnings consistent with theunderlying hedged item. Cash flow hedges are classified in net sales, cost of sales, and net interest expense, andprimarily related to forecasted third-party sales denominated in foreign currencies, forecasted intercompany salesdenominated in foreign currencies and anticipated issuances of debt, respectively.
For each derivative instrument that is designated and effective as a fair value hedge, the gain or loss on thederivative is recognized immediately to earnings, and offsets the loss or gain on the underlying hedged item. Fairvalue hedges are classified in net interest expense, as they hedge the interest rate risk associated with certain ofthe company’s fixed-rate debt.
For derivative instruments that are not designated as hedges, the change in fair value is recorded directly to other(income) expense, net.
If it is determined that a derivative or nonderivative hedging instrument is no longer highly effective as a hedge,the company discontinues hedge accounting prospectively. If the company removes the cash flow hedgedesignation because the hedged forecasted transactions are no longer probable of occurring, any gains or lossesare immediately reclassified from AOCI to earnings. Gains or losses relating to terminations of effective cashflow hedges in which the forecasted transactions are still probable of occurring are deferred and recognizedconsistent with the income or loss recognition of the underlying hedged items. If the company terminates a fairvalue hedge, an amount equal to the cumulative fair value adjustment to the hedged items at the date oftermination is amortized to earnings over the remaining term of the hedged item.
Derivatives, including those that are not designated as a hedge, are principally classified in the operating sectionof the consolidated statements of cash flows, in the same category as the related consolidated balance sheetaccount.
Refer to the Foreign Currency and Interest Rate Risk Management section of Note 8 for further informationregarding the company’s derivative and hedging activities.
Changes in Accounting StandardsOn January 1, 2012, the company adopted a new accounting standard which eliminated the company’s previouselection to present other comprehensive income within the consolidated statements of changes in equity, andprovided the option to present the components of net income and other comprehensive income either as onecontinuous statement of comprehensive income or as two separate but consecutive statements. The standard isreflected in the company’s consolidated statements of comprehensive income, presented as a separateconsecutive statement to the consolidated statements of income, and was retrospectively applied to all priorperiods presented.
NOTE 2SUPPLEMENTAL FINANCIAL INFORMATION
Other Long-Term Assets
as of December 31 (in millions) 2012 2011
Deferred income taxes . . . . . . . . . . . . . . . . . . . . . . . . . . . . . . . . . . . . . . . . . . . . . . . . . . . . . . . . . . $1,156 $1,123Other long-term receivables . . . . . . . . . . . . . . . . . . . . . . . . . . . . . . . . . . . . . . . . . . . . . . . . . . . . . 154 195Other . . . . . . . . . . . . . . . . . . . . . . . . . . . . . . . . . . . . . . . . . . . . . . . . . . . . . . . . . . . . . . . . . . . . . . . 406 437
Other long-term assets . . . . . . . . . . . . . . . . . . . . . . . . . . . . . . . . . . . . . . . . . . . . . . . . . . . . . . . . . . $1,716 $1,755
57

Accounts Payable and Accrued Liabilities
as of December 31 (in millions) 2012 2011
Accounts payable, principally trade . . . . . . . . . . . . . . . . . . . . . . . . . . . . . . . . . . . . . . . . . . . . . . . $ 766 $ 795Income taxes payable . . . . . . . . . . . . . . . . . . . . . . . . . . . . . . . . . . . . . . . . . . . . . . . . . . . . . . . . . . 451 353Deferred income taxes . . . . . . . . . . . . . . . . . . . . . . . . . . . . . . . . . . . . . . . . . . . . . . . . . . . . . . . . . . 878 738Common stock dividends payable . . . . . . . . . . . . . . . . . . . . . . . . . . . . . . . . . . . . . . . . . . . . . . . . . 246 188Employee compensation and withholdings . . . . . . . . . . . . . . . . . . . . . . . . . . . . . . . . . . . . . . . . . . 567 517Property, payroll and certain other taxes . . . . . . . . . . . . . . . . . . . . . . . . . . . . . . . . . . . . . . . . . . . . 152 150Infusion pump reserves . . . . . . . . . . . . . . . . . . . . . . . . . . . . . . . . . . . . . . . . . . . . . . . . . . . . . . . . . 37 202Business optimization reserves . . . . . . . . . . . . . . . . . . . . . . . . . . . . . . . . . . . . . . . . . . . . . . . . . . . 151 176Accrued rebates . . . . . . . . . . . . . . . . . . . . . . . . . . . . . . . . . . . . . . . . . . . . . . . . . . . . . . . . . . . . . . . 291 267Other . . . . . . . . . . . . . . . . . . . . . . . . . . . . . . . . . . . . . . . . . . . . . . . . . . . . . . . . . . . . . . . . . . . . . . . 870 1,025
Accounts payable and accrued liabilities . . . . . . . . . . . . . . . . . . . . . . . . . . . . . . . . . . . . . . . . . . . $4,409 $4,411
Other Long-Term Liabilities
as of December 31 (in millions) 2012 2011
Pension and other employee benefits . . . . . . . . . . . . . . . . . . . . . . . . . . . . . . . . . . . . . . . . . . . . . . $2,427 $1,920Litigation reserves . . . . . . . . . . . . . . . . . . . . . . . . . . . . . . . . . . . . . . . . . . . . . . . . . . . . . . . . . . . . . 32 63Infusion pump reserves . . . . . . . . . . . . . . . . . . . . . . . . . . . . . . . . . . . . . . . . . . . . . . . . . . . . . . . . . 90 74Business optimization reserves . . . . . . . . . . . . . . . . . . . . . . . . . . . . . . . . . . . . . . . . . . . . . . . . . . . 69 49Other . . . . . . . . . . . . . . . . . . . . . . . . . . . . . . . . . . . . . . . . . . . . . . . . . . . . . . . . . . . . . . . . . . . . . . . 455 533
Other long-term liabilities . . . . . . . . . . . . . . . . . . . . . . . . . . . . . . . . . . . . . . . . . . . . . . . . . . . . . . . $3,073 $2,639
Net Interest Expense
years ended December 31 (in millions) 2012 2011 2010
Interest costs . . . . . . . . . . . . . . . . . . . . . . . . . . . . . . . . . . . . . . . . . . . . . . . . . . . . . . . . . . . . . . $165 $132 $148Interest costs capitalized . . . . . . . . . . . . . . . . . . . . . . . . . . . . . . . . . . . . . . . . . . . . . . . . . . . . . (52) (40) (33)
Interest expense . . . . . . . . . . . . . . . . . . . . . . . . . . . . . . . . . . . . . . . . . . . . . . . . . . . . . . . . . . . . 113 92 115Interest income . . . . . . . . . . . . . . . . . . . . . . . . . . . . . . . . . . . . . . . . . . . . . . . . . . . . . . . . . . . . (26) (38) (28)
Net interest expense . . . . . . . . . . . . . . . . . . . . . . . . . . . . . . . . . . . . . . . . . . . . . . . . . . . . . . . . $ 87 $ 54 $ 87
Other (Income) Expense, Net
years ended December 31 (in millions) 2012 2011 2010
Impairment charges . . . . . . . . . . . . . . . . . . . . . . . . . . . . . . . . . . . . . . . . . . . . . . . . . . . . . . . . $ 9 $ 62 $112Gains related to the reduction of contingent payment liabilities . . . . . . . . . . . . . . . . . . . . . . (91) — —Foreign exchange . . . . . . . . . . . . . . . . . . . . . . . . . . . . . . . . . . . . . . . . . . . . . . . . . . . . . . . . . . (49) (10) (67)Securitization and factoring arrangements . . . . . . . . . . . . . . . . . . . . . . . . . . . . . . . . . . . . . . . 18 14 11Equity method investments . . . . . . . . . . . . . . . . . . . . . . . . . . . . . . . . . . . . . . . . . . . . . . . . . . 1 4 (1)Litigation-related charge . . . . . . . . . . . . . . . . . . . . . . . . . . . . . . . . . . . . . . . . . . . . . . . . . . . . — — 62Noncontrolling interests . . . . . . . . . . . . . . . . . . . . . . . . . . . . . . . . . . . . . . . . . . . . . . . . . . . . . (28) — —Other . . . . . . . . . . . . . . . . . . . . . . . . . . . . . . . . . . . . . . . . . . . . . . . . . . . . . . . . . . . . . . . . . . . . (15) 13 42
Other (income) expense, net . . . . . . . . . . . . . . . . . . . . . . . . . . . . . . . . . . . . . . . . . . . . . . . . . . $(155) $ 83 $159
During 2012, the company recorded gains of $53 million and $38 million related to the reduction of contingentpayment liabilities for certain milestones associated with the 2011 acquisition of Prism Pharmaceuticals, Inc.
58

(Prism) and the 2010 acquisition of ApaTech Limited (ApaTech), respectively. The $53 million gain related tothe Prism acquisition was included in the Medical Products segment’s pre-tax income and the $38 million gainrelated to the ApaTech acquisition was included in the BioScience segment’s pre-tax income. Refer to Note 8 forfurther information about these gains. Other (income) expense, net also includes the benefit from a net lossattributable to noncontrolling interests of $28 million in 2012, which has been prospectively reclassified as other(income) expense, net effective January 1, 2012 based on materiality.
During 2011, the company recorded impairment charges of $62 million principally related to the write-down ofthe company’s Greek government bonds, which was recorded at the corporate level and not allocated to asegment. See Note 8 for further information about the impairment of the Greek government bonds. During 2010,the company recorded a $112 million impairment charge associated with the company’s divestiture of its U.S.multi-source generic injectables business which was completed in May 2011. See below for further informationabout this charge. The litigation charge in 2010 related to litigation associated with the company’s 2008 recall ofits heparin sodium injection products in the United States. These 2010 charges were included in the MedicalProducts segment’s pre-tax income.
Sale of BusinessIn May 2011, the company completed the divestiture of its U.S. multi-source generic injectables business toHikma Pharmaceuticals PLC (Hikma). The consideration for the divestiture arrangement totaled $104 million,after closing-related adjustments. Hikma acquired Baxter’s high-volume, multi-source generic injectableproducts in vials and ampoules, including chronic pain, anti-infective and anti-emetic products, along with amanufacturing facility located in Cherry Hill, New Jersey, and a warehouse and distribution center located inMemphis, Tennessee.
An impairment charge of $112 million, primarily related to PP&E and intangible assets, was recorded in 2010 toreflect the fair values of these assets based on the expected sale price of the business. The impairment charge wasincluded in other (income) expense, net in the consolidated statement of income, and was included in the MedicalProducts segment’s pre-tax income.
Net sales related to the U.S. multi-source generic injectables business, which were reported in the MedicalProducts segment prior to the divestiture, totaled $58 million and $198 million in 2011 and 2010, respectively.Pre-tax earnings related to this business were not significant to Baxter’s consolidated financial statements in2011 and 2010.
Exercise of SIGMA OptionIn April 2012, the company exercised its option to purchase the remaining equity of SIGMA for a cash paymentof $90 million. Since the 2009 acquisition of a 40% stake in SIGMA, the company has consolidated the financialstatements of SIGMA, with the equity owned by existing SIGMA equity holders reported as noncontrollinginterests. As a result, the exercise of the option was treated as an equity transaction and no additional assets wererecognized by Baxter related to the additional ownership interest acquired. On the date of exercise, the carryingvalue of the noncontrolling interest was eliminated to reflect Baxter’s change in ownership interest in SIGMA’sequity and the carrying value of the call option was also eliminated. The exercise of the SIGMA purchase optionhad no direct impact on the company’s results of operations, and the payment was classified as a financingactivity on the consolidated statement of cash flows. Effective as of the date of the option exercise, 100% ofSIGMA’s pre-tax income has been reflected in the company’s results of operations and, as a result, the companyno longer reports noncontrolling interest related to SIGMA.
Gambro ABIn December 2012, Baxter entered into a definitive agreement to acquire Gambro AB (Gambro), a privately helddialysis product company based in Lund, Sweden. Gambro is a global medical technology company focused on
59

developing, manufacturing and supplying dialysis products and therapies for patients with acute or chronickidney disease. The transaction will provide Baxter with a broad and complementary dialysis product portfolio,while further advancing the company’s geographic footprint in the dialysis business. In addition, the companywill augment its pipeline by adding Gambro’s next-generation monitors, dialyzers, devices and dialysis solutions.Under the terms of the agreement, Baxter will provide total consideration of approximately $4 billion for theacquisition, including pre-acquisition debt. The transaction is expected to close at the end of the second quarterof 2013, subject to regulatory approvals and other closing conditions.
NOTE 3EARNINGS PER SHARE
The numerator for both basic and diluted earnings per share (EPS) is net income attributable to Baxter. Thedenominator for basic EPS is the weighted-average number of common shares outstanding during the period. Thedilutive effect of outstanding stock options, restricted stock units (RSUs) and performance share units (PSUs) isreflected in the denominator for diluted EPS using the treasury stock method.
The following is a reconciliation of basic shares to diluted shares.
years ended December 31 (in millions) 2012 2011 2010
Basic shares . . . . . . . . . . . . . . . . . . . . . . . . . . . . . . . . . . . . . . . . . . . . . . . . . . . . . . . . . . . . . . . . . 551 569 590Effect of dilutive securities . . . . . . . . . . . . . . . . . . . . . . . . . . . . . . . . . . . . . . . . . . . . . . . . . . . . . 5 4 4
Diluted shares . . . . . . . . . . . . . . . . . . . . . . . . . . . . . . . . . . . . . . . . . . . . . . . . . . . . . . . . . . . . . . . . 556 573 594
The effect of dilutive securities included unexercised stock options, unvested RSUs and contingently issuableshares related to PSUs. The computation of diluted EPS excluded stock options to purchase 16 million,19 million and 27 million shares in 2012, 2011 and 2010, respectively, because their inclusion would have had ananti-dilutive effect on diluted EPS. Refer to Note 10 for additional information regarding items impacting basicshares.
NOTE 4ACQUISITIONS AND COLLABORATIONS
In 2012, 2011 and 2010, net cash outflows related to acquisitions and investments totaled $515 million, $590million and $319 million, respectively. Net cash outflows primarily related to upfront payments to acquire certainbusinesses and execute collaboration agreements. Also included were net cash outflows related to the company’sinvestments, which are further described in Note 8.
The company recorded charges related to business development activities of $128 million in 2012, whichprincipally related to R&D charges of $113 million associated with upfront payments made for the execution ofcollaboration agreements during the period, as discussed below. The company recorded business developmentcharges of $34 million in 2010 principally related to an R&D charge of $30 million related to an upfront paymentmade for the execution of a collaboration agreement, as discussed below. There were no significant businessdevelopment charges recognized in 2011.
As of December 31, 2012, the company’s consolidated balance sheet included contingent payment liabilities of$86 million related to acquisitions and investments. During 2012, the company recognized gains of $53 millionand $38 million for the reduction of certain contingent payment liabilities related to the prior acquisitions ofPrism and ApaTech, respectively. Refer to Note 8 for additional information.
60

AcquisitionsThe following table summarizes the fair value of consideration transferred and the recognized amounts of theassets acquired and liabilities assumed as of the acquisition date for the company’s significant acquisitions in2012, 2011 and 2010.
2012 2011 2010
(in millions) Synovis Baxa Prism ApaTech
Consideration transferredCash, net of cash acquired . . . . . . . . . . . . . . . . . . . . . . . . . . . . . . . . . . . . . . . . . . . $304 $358 $170 $235Contingent payments . . . . . . . . . . . . . . . . . . . . . . . . . . . . . . . . . . . . . . . . . . . . . . . — — 67 70
Fair value of consideration transferred . . . . . . . . . . . . . . . . . . . . . . . . . . . . . . . . . $304 $358 $237 $305
Assets acquired and liabilities assumedOther intangible assets . . . . . . . . . . . . . . . . . . . . . . . . . . . . . . . . . . . . . . . . . . . . . $115 $145 $229 $ 77Other assets (liabilities), net . . . . . . . . . . . . . . . . . . . . . . . . . . . . . . . . . . . . . . . . . 25 (24) (64) 2Goodwill . . . . . . . . . . . . . . . . . . . . . . . . . . . . . . . . . . . . . . . . . . . . . . . . . . . . . . . . 164 237 72 226
Total assets acquired and liabilities assumed . . . . . . . . . . . . . . . . . . . . . . . . . . . . $304 $358 $237 $305
Pro forma financial information has not been included because the acquisitions, individually and in theaggregate, did not have a material impact on the company’s financial position or results of operations. The recentacquisitions of Synovis Life Technologies, Inc. (Synovis) and Baxa Corporation (Baxa) contributed 2 percentagepoints towards sales growth for the year ended December 31, 2012.
The company’s acquisitions have provided Baxter with complementary and expanded product portfolios in itsBioScience and Medical Products businesses. Additional information regarding the above acquisitions has beenprovided below.
SynovisIn February 2012, the company acquired Synovis, a publicly-traded company which develops, manufactures andmarkets biological and mechanical products for soft tissue repair used in a variety of surgical procedures.
Goodwill of $164 million includes expected synergies and other benefits the company believes will result fromthe acquisition, including an expanded product portfolio and the impact of a larger sales force to supportsurgeons across a range of procedures. The goodwill is not deductible for tax purposes. Other intangible assets of$115 million relate to developed technology and are being amortized on a straight-line basis over an estimatedaverage useful life of 12 years.
The final allocation of the purchase price may result in an adjustment to the recognized amounts of assets andliabilities; however, no material adjustments are anticipated. The results of operations, assets and liabilities ofSynovis are included in the BioScience segment, and the goodwill is also included in this reporting unit.
BaxaIn November 2011, the company acquired privately-held Baxa, which manufactures and markets devices,systems and software for the safe and efficient preparation, handling, packaging and administration of fluidmedications.
Goodwill of $237 million includes expected synergies and other benefits the company believes will result fromthe acquisition, including additional growth opportunities and an enhanced ability to treat all patient segments.The goodwill is not deductible for tax purposes. Other intangible assets of $145 million primarily relate tocustomer relationships and are being amortized on a straight-line basis over an estimated average useful life of 13years. The results of operations, assets and liabilities of Baxa are included in the Medical Products segment, andthe goodwill is also included in this reporting unit.
PrismIn May 2011, the company acquired privately-held Prism, a specialty pharmaceutical company whose productsinclude NEXTERONE (amiodarone HCl), an antiarrhythmic agent used for ventricular tachyarrhythmias, or fastforms of irregular heartbeat.
61

Goodwill of $72 million includes expected synergies in manufacturing and formulation expertise and otherbenefits the company believes will result from the acquisition, including opportunities for revenue growththrough existing sales channels. The goodwill is not deductible for tax purposes. Other intangible assets of $225million, excluding IPR&D of $4 million, relate to developed technology and are being amortized on a straight-line basis over an estimated average useful life of 14 years. The results of operations, assets and liabilities ofPrism are included in the Medical Products segment, and the goodwill is also included in this reporting unit.
The terms of the acquisition included contingent payments of up to $168 million associated with the achievementof specified sales milestones through 2017. The estimated fair value of the contingent payments at the acquisitiondate was $67 million, based on the probability of achieving the specified sales milestones, and was recorded inother long-term liabilities as part of the consideration transferred. As of December 31, 2012, the estimated fairvalue of the contingent payments was $17 million, with changes in the estimated fair value recognized inearnings. Refer to Note 8 for additional information regarding the Prism contingent payment liability.
ApaTechIn March 2010, Baxter acquired ApaTech, an orthobiologic products company based in the United Kingdomwhose products include ACTIFUSE, a silicate substituted calcium phosphate synthetic bone graft material.
Goodwill of $226 million includes expected synergies and other benefits the company believes will result fromthe acquisition. The majority of the goodwill is not deductible for tax purposes. Other intangible assets of $77million primarily relate to developed technology and are being amortized on a straight-line basis over anestimated average useful life of nine years. The results of operations and assets and liabilities of ApaTech areincluded in the BioScience segment, and the goodwill is also included in this reporting unit.
The terms of the acquisition included contingent payments of up to $90 million associated with the achievementof specified commercial milestones. The estimated fair value of the contingent payments at the acquisition datewas $70 million, based on the probability of achieving the specified commercial milestones, and was recorded inother long-term liabilities as part of the consideration transferred. As of December 31, 2012, the estimated fairvalue of the contingent payments was $30 million, with changes in the estimated fair value recognized inearnings. Refer to Note 8 for additional information regarding the ApaTech contingent payment liability.
CollaborationsOnconova Therapeutics, Inc.In September 2012, Baxter executed a licensing agreement with Onconova Therapeutics, Inc. (Onconova) forrigosertib, a novel targeted anti-cancer compound for the treatment of a group of rare hematologic malignanciescalled Myelodysplastic Syndromes, which is currently in a Phase III study, and pancreatic cancer, which is in aPhase II/III study. The agreement provides Baxter with commercialization rights for the compound in Europe forthose indications. In the third quarter of 2012, Baxter recognized an R&D charge of $50 million related to anupfront cash payment associated with the execution of the agreement. Baxter may make additional payments ofup to $515 million related to the achievement of pre-commercial development and regulatory milestones, inaddition to future sales milestones and royalties.
In July 2012, Baxter acquired approximately 3 million shares of Onconova preferred stock for $50 million. Referto Note 8 for additional information regarding this investment.
Chatham Therapeutics, LLCIn May 2012, Baxter executed an exclusive agreement with Chatham Therapeutics, LLC (Chatham), an affiliateof Asklepios BioPharmaceutical, Inc., for the development and commercialization of potential treatments forhemophilia B utilizing Chatham’s gene therapy technology. Under the agreement, Baxter and Chatham willinvestigate Chatham’s gene therapy technology through U.S.-based hemophilia B clinical trials and Baxter hasglobal rights for the marketing and commercialization of new treatments. In the second quarter of 2012, Baxter
62

recognized an R&D charge of $30 million related to upfront cash payments associated with the execution of theagreement. Baxter may make additional payments of up to $60 million over the next several years related to theachievement of development and commercial milestones. In addition, Baxter has certain responsibilities relatedto development and commercialization activities under the agreement.
Momenta Pharmaceuticals, Inc.In 2011, the company announced a global collaboration with Momenta Pharmaceuticals, Inc. (Momenta) todevelop and commercialize follow-on biologic products, also known as biosimilars. Biosimilars replicateexisting, branded biologics used in the treatment of a variety of diseases, including cancer, autoimmune disordersand other chronic conditions. In February 2012, Baxter made an upfront cash payment of $33 million toMomenta for the development of up to six biosimilars, which was recognized as an R&D charge. As ofDecember 31, 2012, Baxter has named three products and, as a result, may make additional payments of up toapproximately $200 million over the next several years related to option exercises and the achievement oftechnical, development and regulatory milestones for these products. Baxter may be responsible for additionalfuture payments contingent upon the company’s exercise of the remaining product options. The arrangement alsoincludes specified funding by Baxter, as well as other responsibilities, relating to development andcommercialization activities.
ArchemixIn December 2010, Baxter acquired all of the hemophilia-related assets of Archemix Corp. (Archemix), aprivately-held biopharmaceutical company, and entered into an exclusive license agreement for certain relatedintellectual property assets. The upfront payment associated with the transaction of $30 million was recognizedas an R&D charge in 2010 as the technology had not received regulatory approval and had no alternative futureuse. In February 2012, Baxter discontinued the Phase I clinical trial in the United Kingdom related to the leadproduct associated with the arrangement, BAX 499, a synthetic subcutaneously-administered hemophilia therapy.The agreement was terminated during 2012 and Baxter will not be required to make additional contingentpayments in the future.
NOTE 5GOODWILL AND OTHER INTANGIBLE ASSETS, NET
GoodwillThe following is a summary of the activity in goodwill by segment.
(in millions) BioScienceMedicalProducts Total
December 31, 2010 . . . . . . . . . . . . . . . . . . . . . . . . . . . . . . . . . . . . . . . . . . . . . . . . . . . $809 $1,206 $2,015Additions . . . . . . . . . . . . . . . . . . . . . . . . . . . . . . . . . . . . . . . . . . . . . . . . . . . . . . . . . . 1 328 329Currency translation and other adjustments . . . . . . . . . . . . . . . . . . . . . . . . . . . . . . . . (4) (23) (27)
December 31, 2011 . . . . . . . . . . . . . . . . . . . . . . . . . . . . . . . . . . . . . . . . . . . . . . . . . . . 806 1,511 2,317Additions . . . . . . . . . . . . . . . . . . . . . . . . . . . . . . . . . . . . . . . . . . . . . . . . . . . . . . . . . . 161 21 182Currency translation and other adjustments . . . . . . . . . . . . . . . . . . . . . . . . . . . . . . . . 8 (5) 3
December 31, 2012 . . . . . . . . . . . . . . . . . . . . . . . . . . . . . . . . . . . . . . . . . . . . . . . . . . . $975 $1,527 $2,502
Goodwill additions in 2012 principally related to the acquisition of Synovis and an additional $19 million fromthe 2012 acquisition of Laboratoire Fasonut (Fasonut), a privately-held French pharmaceutical companyspecializing in parenteral nutrition compounding for hospitals, in which Baxter had previously held a 20% equityinterest. Goodwill additions in 2011 principally related to the acquisitions of Baxa and Prism, in addition to theexercise of a $25 million option related to the company’s collaboration agreement for the development of a homeHD machine with HHD, LLC (HHD), DEKA Products Limited Partnership and DEKA Research andDevelopment Corp. (collectively, DEKA). Synovis is included in the BioScience segment and Fasonut, Baxa,Prism and HHD are included in the Medical Products segment. See Note 4 for further information regardingSynovis, Baxa, and Prism.
63

As of December 31, 2012, there were no accumulated goodwill impairment losses.
Other Intangible Assets, NetIntangible assets with finite useful lives are amortized on a straight-line basis over their estimated useful lives.The company also has intangible assets not subject to amortization, which include a trademark with an indefinitelife and certain acquired IPR&D associated with products that have not yet received regulatory approval.
The following is a summary of the company’s other intangible assets.
(in millions)Developed technology,
including patentsOther amortizedintangible assets
Indefinite-livedintangible assets Total
December 31, 2012Gross other intangible assets . . . . . . . . . . . . . . . . . . $1,192 $ 280 $22 $1,494Accumulated amortization . . . . . . . . . . . . . . . . . . . . (578) (102) — (680)
Other intangible assets, net . . . . . . . . . . . . . . . . . . . . $ 614 $ 178 $22 $ 814
December 31, 2011Gross other intangible assets . . . . . . . . . . . . . . . . . . $1,100 $ 276 $35 $1,411Accumulated amortization . . . . . . . . . . . . . . . . . . . . (504) (81) — (585)
Other intangible assets, net . . . . . . . . . . . . . . . . . . . . $ 596 $ 195 $35 $ 826
The amortization expense for these intangible assets was $101 million in 2012, $81 million in 2011 and $79million in 2010. The anticipated annual amortization expense for intangible assets recorded as of December 31,2012 is $99 million in 2013, $96 million in 2014, $95 million in 2015, $91 million in 2016 and $73 million in2017.
The increase in gross other intangible assets is primarily related to the acquisition of Synovis. Refer to Note 4 forfurther information regarding the Synovis acquisition.
NOTE 6INFUSION PUMP AND BUSINESS OPTIMIZATION CHARGES
Infusion Pump ChargesIn July 2005, the company stopped shipment of COLLEAGUE infusion pumps in the United States. Following anumber of Class I recalls relating to the performance of the pumps, as well as the seizure litigation described inNote 13, on July 13, 2010, the U.S. Food and Drug Administration (FDA) issued a final order requiring thecompany to recall its approximately 200,000 COLLEAGUE infusion pumps from the U.S. market. Pursuant tothe terms of the order, Baxter offered replacement infusion pumps or monetary consideration to owners ofCOLLEAGUE pumps, and the recall was closed by FDA in November 2012.
In 2010, following FDA’s issuance of its initial order dated April 30, 2010, the company recorded a charge of$588 million in connection with this recall and other actions the company is undertaking outside of the UnitedStates. Of the total charge, $213 million was recorded as a reduction of net sales and $375 million was recordedin cost of sales. The amount recorded in net sales principally related to estimated cash payments to customers.Prior to the charge recorded in 2010, from 2005 through 2009, the company recorded charges and other coststotaling $337 million related to its COLLEAGUE and SYNDEO infusion pumps. In aggregate, the total chargesincurred from 2005 through 2011 included $716 million of cash costs and $209 million principally related toasset impairments. The asset impairments related to inventory, lease receivables and other assets relating to therecalled pumps. The reserve for cash costs principally included an estimate of cash refunds or replacementinfusion pumps that were offered to owners in exchange for their COLLEAGUE infusion pumps. Cash costs alsoincluded costs associated with the execution of the remediation and recall programs and customeraccommodations.
64

During the second quarter of 2012, the company recorded an adjustment of $37 million in cost of sales to reducethe COLLEAGUE infusion pump reserves as the company substantially completed its recall activities in theUnited States. The company also further refined the original expectations for cash and non-cash activities relatedto the recall and recorded a $63 million adjustment to increase reserves for cash costs with a correspondingdecrease to non-cash reserves, which had no impact on the results of operations. The net impact of theseadjustments was an increase in cash reserves of $26 million during 2012.
The following table summarizes cash activity in the company’s COLLEAGUE and SYNDEO infusion pumpreserves through December 31, 2012.
(in millions)
Charges and adjustments in 2005 through 2009 . . . . . . . . . . . . . . . . . . . . . . . . . . . . . . . . . . . . . . . . . . . . . . $ 270Utilization in 2005 through 2009 . . . . . . . . . . . . . . . . . . . . . . . . . . . . . . . . . . . . . . . . . . . . . . . . . . . . . . . . . . (171)
Reserves at December 31, 2009 . . . . . . . . . . . . . . . . . . . . . . . . . . . . . . . . . . . . . . . . . . . . . . . . . . . . . . . . . . . 99Charge . . . . . . . . . . . . . . . . . . . . . . . . . . . . . . . . . . . . . . . . . . . . . . . . . . . . . . . . . . . . . . . . . . . . . . . . . . . . . . 446Utilization . . . . . . . . . . . . . . . . . . . . . . . . . . . . . . . . . . . . . . . . . . . . . . . . . . . . . . . . . . . . . . . . . . . . . . . . . . . (32)
Reserves at December 31, 2010 . . . . . . . . . . . . . . . . . . . . . . . . . . . . . . . . . . . . . . . . . . . . . . . . . . . . . . . . . . . 513Utilization . . . . . . . . . . . . . . . . . . . . . . . . . . . . . . . . . . . . . . . . . . . . . . . . . . . . . . . . . . . . . . . . . . . . . . . . . . . (237)
Reserves at December 31, 2011 . . . . . . . . . . . . . . . . . . . . . . . . . . . . . . . . . . . . . . . . . . . . . . . . . . . . . . . . . . . 276Utilization . . . . . . . . . . . . . . . . . . . . . . . . . . . . . . . . . . . . . . . . . . . . . . . . . . . . . . . . . . . . . . . . . . . . . . . . . . . (175)Other . . . . . . . . . . . . . . . . . . . . . . . . . . . . . . . . . . . . . . . . . . . . . . . . . . . . . . . . . . . . . . . . . . . . . . . . . . . . . . . 26
Reserves at December 31, 2012 . . . . . . . . . . . . . . . . . . . . . . . . . . . . . . . . . . . . . . . . . . . . . . . . . . . . . . . . . . . $ 127
The reserve for remediation activities in the United States has been substantially utilized, with remaining reservesrelated to remediation activities outside of the United States continuing to be utilized beyond 2012. The companybelieves that the remaining infusion pump reserves are adequate. However, additional adjustments may berecorded in the future as the programs are completed.
It is possible that substantial additional cash and non-cash charges may be required in future periods based onnew information, changes in estimates, and actions the company may be required to undertake in markets outsidethe United States. While the company continues to work to resolve the issues, there can be no assurance thatadditional costs or civil and criminal penalties will not be incurred, that additional regulatory actions with respectto the company will not occur, that the company will not face civil claims for damages from purchasers or users,that substantial additional charges or significant asset impairments may not be required, or that sales of otherproducts may not be adversely affected.
Business Optimization ChargesIn 2012, 2011 and 2010, the company recorded charges of $150 million, $192 million and $257 million,respectively, primarily related to costs associated with optimizing its overall cost structure on a global basis, asthe company streamlines its international operations, rationalizes its manufacturing facilities, enhances itsgeneral and administrative infrastructure and, in 2012, re-aligns certain R&D activities. The charges includedseverance costs, as well as asset impairments and contract terminations associated with discontinued productsand projects, the terminations of which do not have a material impact on the company’s future results ofoperations.
Included in the 2012, 2011 and 2010 charges were cash costs of $98 million, $156 million and $184 million,respectively, principally pertaining to severance and other employee-related costs in Europe and the UnitedStates. Also included in total charges were asset impairments relating to fixed assets, inventory and other assetsassociated with discontinued products and projects. These other costs totaled $52 million, $36 million and $73million in 2012, 2011 and 2010, respectively.
65

Of the total 2012 charge, $62 million was recorded in cost of sales, $60 million was recorded in marketing andadministrative expenses, and $28 million was recorded in research and development expenses. Of the total 2011charge, $95 million was recorded in cost of sales and $97 million was recorded in marketing and administrativeexpenses. Of the total 2010 charge, $132 million was recorded in cost of sales and $125 million was recorded inmarketing and administrative expenses. The charges were recorded at the corporate level and were not allocatedto a segment.
The following table summarizes cash activity in the reserves related to the company’s business optimizationinitiatives.
(in millions)
Reserve at December 31, 2009 . . . . . . . . . . . . . . . . . . . . . . . . . . . . . . . . . . . . . . . . . . . . . . . . . . . . . . . . . . . $ 642010 Charge . . . . . . . . . . . . . . . . . . . . . . . . . . . . . . . . . . . . . . . . . . . . . . . . . . . . . . . . . . . . . . . . . . . . . . . . . . 184Utilization in 2010 . . . . . . . . . . . . . . . . . . . . . . . . . . . . . . . . . . . . . . . . . . . . . . . . . . . . . . . . . . . . . . . . . . . . . (68)
Reserve at December 31, 2010 . . . . . . . . . . . . . . . . . . . . . . . . . . . . . . . . . . . . . . . . . . . . . . . . . . . . . . . . . . . 1802011 Charge . . . . . . . . . . . . . . . . . . . . . . . . . . . . . . . . . . . . . . . . . . . . . . . . . . . . . . . . . . . . . . . . . . . . . . . . . . 156Utilization in 2011 . . . . . . . . . . . . . . . . . . . . . . . . . . . . . . . . . . . . . . . . . . . . . . . . . . . . . . . . . . . . . . . . . . . . . (110)CTA . . . . . . . . . . . . . . . . . . . . . . . . . . . . . . . . . . . . . . . . . . . . . . . . . . . . . . . . . . . . . . . . . . . . . . . . . . . . . . . . (1)
Reserve at December 31, 2011 . . . . . . . . . . . . . . . . . . . . . . . . . . . . . . . . . . . . . . . . . . . . . . . . . . . . . . . . . . . 2252012 Charge . . . . . . . . . . . . . . . . . . . . . . . . . . . . . . . . . . . . . . . . . . . . . . . . . . . . . . . . . . . . . . . . . . . . . . . . . . 98Utilization in 2012 . . . . . . . . . . . . . . . . . . . . . . . . . . . . . . . . . . . . . . . . . . . . . . . . . . . . . . . . . . . . . . . . . . . . . (99)CTA . . . . . . . . . . . . . . . . . . . . . . . . . . . . . . . . . . . . . . . . . . . . . . . . . . . . . . . . . . . . . . . . . . . . . . . . . . . . . . . . (4)
Reserve at December 31, 2012 . . . . . . . . . . . . . . . . . . . . . . . . . . . . . . . . . . . . . . . . . . . . . . . . . . . . . . . . . . . $ 220
The reserves are expected to be substantially utilized by the end of 2014. The company believes that the reservesare adequate. However, adjustments may be recorded in the future as the programs are completed.
66

NOTE 7DEBT, CREDIT FACILITIES AND LEASE COMMITMENTS
Debt OutstandingAt December 31, 2012 and 2011, the company had the following debt outstanding.
as of December 31 (in millions) 2012 2011
Commercial paper . . . . . . . . . . . . . . . . . . . . . . . . . . . . . . . . . . . . . . . . . . . . . . . . $— $250Other short-term debt . . . . . . . . . . . . . . . . . . . . . . . . . . . . . . . . . . . . . . . . . . . . . 27 6
Short-term debt . . . . . . . . . . . . . . . . . . . . . . . . . . . . . . . . . . . . . . . . . . . . . . . . . . $27 $256
as of December 31 (in millions)Effective interest
rate in 20121 20122 20112
Variable-rate loan due 2012 . . . . . . . . . . . . . . . . . . . . . . . . . . . . . . . . . . . . . . . . — $ — $ 1801.8% notes due 2013 . . . . . . . . . . . . . . . . . . . . . . . . . . . . . . . . . . . . . . . . . . . . . . 2.0% 301 3054.0% notes due 2014 . . . . . . . . . . . . . . . . . . . . . . . . . . . . . . . . . . . . . . . . . . . . . . 4.2% 358 365Variable-rate loan due 2015 . . . . . . . . . . . . . . . . . . . . . . . . . . . . . . . . . . . . . . . . 0.9% 243 2574.625% notes due 2015 . . . . . . . . . . . . . . . . . . . . . . . . . . . . . . . . . . . . . . . . . . . . 4.8% 646 6675.9% notes due 2016 . . . . . . . . . . . . . . . . . . . . . . . . . . . . . . . . . . . . . . . . . . . . . . 6.0% 631 6391.85% notes due 2017 . . . . . . . . . . . . . . . . . . . . . . . . . . . . . . . . . . . . . . . . . . . . . 2.0% 500 499Variable-rate loan due 2017 . . . . . . . . . . . . . . . . . . . . . . . . . . . . . . . . . . . . . . . . 0.6% 170 —5.375% notes due 2018 . . . . . . . . . . . . . . . . . . . . . . . . . . . . . . . . . . . . . . . . . . . . 5.5% 499 4994.5% notes due 2019 . . . . . . . . . . . . . . . . . . . . . . . . . . . . . . . . . . . . . . . . . . . . . . 4.6% 566 5564.25% notes due 2020 . . . . . . . . . . . . . . . . . . . . . . . . . . . . . . . . . . . . . . . . . . . . . 4.4% 299 2992.40% notes due 2022 . . . . . . . . . . . . . . . . . . . . . . . . . . . . . . . . . . . . . . . . . . . . . 2.3% 697 —6.625% debentures due 2028 . . . . . . . . . . . . . . . . . . . . . . . . . . . . . . . . . . . . . . . . 6.7% 133 1346.25% notes due 2037 . . . . . . . . . . . . . . . . . . . . . . . . . . . . . . . . . . . . . . . . . . . . . 6.3% 499 4993.65% notes due 2042 . . . . . . . . . . . . . . . . . . . . . . . . . . . . . . . . . . . . . . . . . . . . . 3.4% 298 —Other . . . . . . . . . . . . . . . . . . . . . . . . . . . . . . . . . . . . . . . . . . . . . . . . . . . . . . . . . . — 63 40
Total debt and capital lease obligations . . . . . . . . . . . . . . . . . . . . . . . . . . . . . . . 5,903 4,939Current portion . . . . . . . . . . . . . . . . . . . . . . . . . . . . . . . . . . . . . . . . . . . . . . . . . . (323) (190)
Long-term portion . . . . . . . . . . . . . . . . . . . . . . . . . . . . . . . . . . . . . . . . . . . . . . . . $5,580 $4,749
1 Excludes the effect of any related interest rate swaps.2 Book values include any discounts, premiums and adjustments related to hedging instruments.
Significant Debt IssuancesIn August 2012, the company issued $1.0 billion of senior notes, with $700 million maturing in August 2022 andbearing a 2.40% coupon rate, and $300 million maturing in August 2042 and bearing a 3.65% coupon rate. InDecember 2011, the company issued $500 million of senior notes maturing in January 2017 and bearing a 1.85%coupon rate. In March 2010, the company issued $600 million of senior notes, with $300 million maturing inMarch 2013 and bearing a 1.8% coupon rate, and $300 million maturing in March 2020 and bearing a 4.25%coupon rate.
The net proceeds of the August 2012 debt issuance were used for general corporate purposes, which includedcapital expenditures associated with previously announced plans to expand capacity to support longer-termgrowth of the company’s plasma-based treatments. The net proceeds of the debt issuances from prior years wereused for general corporate purposes, which in some cases included the refinancing of indebtedness. The debtinstruments are unsecured and include certain covenants, including restrictions relating to the company’s creationof secured debt.
67

Commercial PaperThe company did not have any commercial paper outstanding at December 31, 2012. The company hadcommercial paper of $250 million outstanding at December 31, 2011, with a weighted-average interest rate of0.24%.
Credit FacilitiesThe company had $3.3 billion of cash and equivalents at December 31, 2012, and $2.9 billion of cash andequivalents at December 31, 2011. The company’s primary revolving credit facility has a maximum capacity of$1.5 billion and matures in June 2015. The company also maintains a Euro-denominated credit facility with amaximum capacity of approximately $389 million at December 31, 2012. In 2012, the company amended theagreement related to this facility to extend the maturity date to October 2013. As of December 31, 2012 and2011, there were no outstanding borrowings under either of these facilities. The company’s facilities enable thecompany to borrow funds on an unsecured basis at variable interest rates, and contain various covenants,including a maximum net-debt-to-capital ratio. At December 31, 2012, the company was in compliance with thefinancial covenants in these agreements. The non-performance of any financial institution supporting either ofthe credit facilities would reduce the maximum capacity of these facilities by each institution’s respectivecommitment.
The company also maintains other credit arrangements, which totaled $332 million at December 31, 2012 and$232 million at December 31, 2011. Borrowings outstanding under these facilities totaled $27 million atDecember 31, 2012 and $6 million at December 31, 2011.
In January 2013, Baxter entered into an agreement related to a 364-day bridge loan facility with a maximumcapacity of $3.1 billion in support of the planned acquisition of Gambro. The terms of the bridge loan facility aresubstantially similar to the terms of the company’s primary revolving credit facility. The company intends tofinance the transaction with off-shore cash and the issuance of at least $3.0 billion of term debt. The companydoes not anticipate utilizing the bridge loan facility.
LeasesThe company leases certain facilities and equipment under capital and operating leases expiring at various dates.The leases generally provide for the company to pay taxes, maintenance, insurance and certain other operatingcosts of the leased property. Most of the operating leases contain renewal options. Operating lease rent expensewas $202 million in 2012, $203 million in 2011 and $184 million in 2010.
Future Minimum Lease Payments and Debt Maturities
as of and for the years ended December 31 (in millions)Operating
leases
Debt maturitiesand capital
leases
2013 . . . . . . . . . . . . . . . . . . . . . . . . . . . . . . . . . . . . . . . . . . . . . . . . . . . . . . . . . . . . . . . . . . $181 $ 3232014 . . . . . . . . . . . . . . . . . . . . . . . . . . . . . . . . . . . . . . . . . . . . . . . . . . . . . . . . . . . . . . . . . . 148 3602015 . . . . . . . . . . . . . . . . . . . . . . . . . . . . . . . . . . . . . . . . . . . . . . . . . . . . . . . . . . . . . . . . . . 126 8452016 . . . . . . . . . . . . . . . . . . . . . . . . . . . . . . . . . . . . . . . . . . . . . . . . . . . . . . . . . . . . . . . . . . 110 6032017 . . . . . . . . . . . . . . . . . . . . . . . . . . . . . . . . . . . . . . . . . . . . . . . . . . . . . . . . . . . . . . . . . . 100 673Thereafter . . . . . . . . . . . . . . . . . . . . . . . . . . . . . . . . . . . . . . . . . . . . . . . . . . . . . . . . . . . . . . 151 2,953
Total obligations and commitments . . . . . . . . . . . . . . . . . . . . . . . . . . . . . . . . . . . . . . . . . . 816 5,757Interest on capital leases, discounts and premiums, and adjustments relating to
hedging instruments . . . . . . . . . . . . . . . . . . . . . . . . . . . . . . . . . . . . . . . . . . . . . . . . . . . . n/a 146
Total debt and lease obligations . . . . . . . . . . . . . . . . . . . . . . . . . . . . . . . . . . . . . . . . . . . . . $816 $5,903
68

NOTE 8FINANCIAL INSTRUMENTS AND RELATED FAIR VALUE MEASUREMENTS
Receivable SecuritizationsFor trade receivables originated in Japan, the company has entered into agreements with financial institutions inwhich the entire interest in and ownership of the receivable is sold. The company continues to service thereceivables in its Japanese securitization arrangement. Servicing assets or liabilities are not recognized becausethe company receives adequate compensation to service the sold receivables. The Japanese securitizationarrangement includes limited recourse provisions, which are not material.
The following is a summary of the activity relating to the securitization arrangement.
as of and for the years ended December 31 (in millions) 2012 2011 2010
Sold receivables at beginning of year . . . . . . . . . . . . . . . . . . . . . . . . . . . . . . . . . . . . . . . . . $ 160 $ 157 $ 147Proceeds from sales of receivables . . . . . . . . . . . . . . . . . . . . . . . . . . . . . . . . . . . . . . . . . . . 630 615 557Cash collections (remitted to the owners of the receivables) . . . . . . . . . . . . . . . . . . . . . . . (624) (622) (555)Effect of currency exchange rate changes . . . . . . . . . . . . . . . . . . . . . . . . . . . . . . . . . . . . . . (9) 10 8
Sold receivables at end of year . . . . . . . . . . . . . . . . . . . . . . . . . . . . . . . . . . . . . . . . . . . . . . $ 157 $ 160 $ 157
The net losses relating to the sales of receivables were immaterial for each year.
Concentrations of Credit RiskThe company invests excess cash in certificates of deposit or money market funds and diversifies theconcentration of cash among different financial institutions. With respect to financial instruments, whereappropriate, the company has diversified its selection of counterparties, and has arranged collateralization andmaster-netting agreements to minimize the risk of loss.
The company continues to do business with foreign governments in certain countries, including Greece, Spain,Portugal and Italy, that have experienced a deterioration in credit and economic conditions. As of December 31,2012, the company’s net accounts receivable from the public sector in Greece, Spain, Portugal and Italy totaled$385 million (of which $66 million related to Greece). The company’s net accounts receivable from the publicsector for the countries identified above decreased by $139 million during 2012 primarily as a result of thecollection of past due receivables in Spain. Refer to the discussion below for information regarding the Greekgovernment bonds previously held by the company.
Global economic conditions and liquidity issues in certain countries have resulted, and may continue to result, indelays in the collection of receivables and credit losses. Global economic conditions, governmental actions andcustomer-specific factors may require the company to re-evaluate the collectibility of its receivables and thecompany could potentially incur additional credit losses. These conditions may also impact the stability of theEuro.
Foreign Currency and Interest Rate Risk ManagementThe company operates on a global basis and is exposed to the risk that its earnings, cash flows and equity couldbe adversely impacted by fluctuations in foreign exchange and interest rates. The company’s hedging policyattempts to manage these risks to an acceptable level based on the company’s judgment of the appropriate trade-off between risk, opportunity and costs.
The company is primarily exposed to foreign exchange risk with respect to recognized assets and liabilities,forecasted transactions and net assets denominated in the Euro, Japanese Yen, British Pound, Australian Dollar,Canadian Dollar, Brazilian Real, Colombian Peso and Swedish Krona. The company manages its foreign
69

currency exposures on a consolidated basis, which allows the company to net exposures and take advantage ofany natural offsets. In addition, the company uses derivative and nonderivative instruments to further reduce thenet exposure to foreign exchange. Gains and losses on the hedging instruments offset losses and gains on thehedged transactions and reduce the earnings and equity volatility resulting from foreign exchange. Financialmarket and currency volatility may limit the company’s ability to cost-effectively hedge these exposures.
The company is also exposed to the risk that its earnings and cash flows could be adversely impacted byfluctuations in interest rates. The company’s policy is to manage interest costs using a mix of fixed- and floating-rate debt that the company believes is appropriate. To manage this mix in a cost-efficient manner, the companyperiodically enters into interest rate swaps in which the company agrees to exchange, at specified intervals, thedifference between fixed and floating interest amounts calculated by reference to an agreed-upon notionalamount.
The company does not hold any instruments for trading purposes and none of the company’s outstandingderivative instruments contain credit-risk-related contingent features.
Cash Flow HedgesThe company may use options, including collars and purchased options, forwards and cross-currency swaps tohedge the foreign exchange risk to earnings relating to forecasted transactions and recognized assets andliabilities. The company periodically uses forward-starting interest rate swaps and treasury rate locks to hedge therisk to earnings associated with movements in interest rates relating to anticipated issuances of debt. Certainother firm commitments and forecasted transactions are also periodically hedged. Cash flow hedges primarilyrelated to forecasted intercompany sales denominated in foreign currencies, anticipated issuances of debt, and,prior to 2011, a hedge of U.S. Dollar-denominated debt issued by a foreign subsidiary.
The notional amounts of foreign exchange contracts were $1.5 billion as of both December 31, 2012 and 2011. In2010, in conjunction with the maturity of $500 million of U.S. Dollar-denominated debt held by a foreignsubsidiary, the company terminated cross-currency swaps that had been used to hedge this debt. The cashoutflow resulting from this termination was $45 million, which was reported in the financing section of theconsolidated statements of cash flows. The notional amounts of interest rate contracts designated as cash flowhedges outstanding as of December 31, 2012 and 2011 were $250 million and $200 million, respectively. In2010, in conjunction with the 2010 debt issuance disclosed in Note 7, interest rate contracts hedging the issuanceof this debt were terminated, resulting in a gain of $18 million that is being amortized to net interest expense overthe life of the related debt. The maximum term over which the company has cash flow hedge contracts in placerelated to forecasted transactions at December 31, 2012 is 12 months.
Fair Value HedgesThe company uses interest rate swaps to convert a portion of its fixed-rate debt into variable-rate debt. Theseinstruments hedge the company’s earnings from changes in the fair value of debt due to fluctuations in thedesignated benchmark interest rate.
The total notional amount of interest rate contracts designated as fair value hedges was $500 million and $675million as of December 31, 2012 and 2011, respectively.
DedesignationsThe company terminated $175 million and $1.7 billion of interest rate contracts in 2012 and 2011, respectively,which had been designated as fair value hedges. The terminations resulted in net gains of $21 million and $121million in 2012 and 2011, respectively, that were deferred and are being amortized as a reduction of net interestexpense over the remaining terms of the underlying debt.
70

There were no hedge dedesignations in 2012, 2011 or 2010 resulting from changes in the company’s assessmentof the probability that the hedged forecasted transactions would occur.
Undesignated Derivative InstrumentsThe company uses forward contracts to hedge earnings from the effects of foreign exchange relating to certain ofthe company’s intercompany and third-party receivables and payables denominated in a foreign currency. Thesederivative instruments are generally not formally designated as hedges and the terms of these instrumentsgenerally do not exceed one month.
The total notional amount of undesignated derivative instruments was $3.2 billion and $346 million as ofDecember 31, 2012 and 2011, respectively. In December 2012, the company entered into option contracts with atotal notional amount of $2.8 billion to hedge anticipated foreign currency cash outflows associated with theplanned acquisition of Gambro discussed in Note 2. These contracts are not formally designated as hedges andmature in June 2013.
Gains and Losses on Derivative InstrumentsThe following tables summarize the gains and losses on the company’s derivative instruments for the years endedDecember 31, 2012 and 2011.
Gain (loss)recognized in OCI
Location of gain (loss) inincome statement
Gain (loss)reclassified from
AOCI into income
(in millions) 2012 2011 2012 2011
Cash flow hedgesInterest rate contracts . . . . . . . . . . . . . . . . . . . . . . . . . $(10) $(11) Net interest expense $ — $ —Foreign exchange contracts . . . . . . . . . . . . . . . . . . . . . (3) (1) Net sales (3) (2)Foreign exchange contracts . . . . . . . . . . . . . . . . . . . . . — (14) Cost of sales 3 (34)
Total . . . . . . . . . . . . . . . . . . . . . . . . . . . . . . . . . . . . . . . . . $(13) $(26) $ — $(36)
Location of gain (loss) inincome statement
Gain (loss)recognized in income
(in millions) 2012 2011
Fair value hedgesInterest rate contracts . . . . . . . . . . . . . . . . . . . . . . . . . . . . . Net interest expense $11 $62
Undesignated derivative instrumentsForeign exchange contracts . . . . . . . . . . . . . . . . . . . . . . . . Other (income) expense, net $ (7) $ (6)
For the company’s fair value hedges, equal and offsetting losses of $11 million and $62 million were recognizedin net interest expense in 2012 and 2011, respectively, as adjustments to the underlying hedged items, fixed-ratedebt. Ineffectiveness related to the company’s cash flow and fair value hedges for the year ended December 31,2012 was not material.
The following table summarizes net-of-tax activity in AOCI, a component of shareholders’ equity, related to thecompany’s cash flow hedges.
as of and for the years ended December 31 (in millions) 2012 2011 2010
Accumulated other comprehensive income (loss) balance at beginning of year . . . . . . . . . . . . $ 2 $ (3) $ 3(Loss) gain in fair value of derivatives during the year . . . . . . . . . . . . . . . . . . . . . . . . . . . . . . . (7) (31) 45Amount reclassified to earnings during the year . . . . . . . . . . . . . . . . . . . . . . . . . . . . . . . . . . . . — 36 (51)
Accumulated other comprehensive (loss) income balance at end of year . . . . . . . . . . . . . . . . . $ (5) $ 2 $ (3)
71

As of December 31, 2012, $1 million of deferred, net after-tax losses on derivative instruments included in AOCIare expected to be recognized in earnings during the next 12 months, coinciding with when the hedged items areexpected to impact earnings.
Fair Values of Derivative InstrumentsThe following table summarizes the classification and fair value amounts of derivative instruments reported inthe consolidated balance sheet as of December 31, 2012.
Derivatives in asset positions Derivatives in liability positions
(in millions) Balance sheet locationFair
value Balance sheet locationFair
value
Derivative instruments designated as hedges
Interest rate contracts . . . . . . . . . . . . . . . . . . . . . . Other long-term assets $ 67Accounts payable
and accrued liabilities $21
Foreign exchange contracts . . . . . . . . . . . . . . . . . Prepaid expenses and other 28Accounts payable
and accrued liabilities 5
Total derivative instruments designated as hedges . . . . . . . . . . . . . . . . . . . . . . . . . . $ 95 $26
Undesignated derivative instruments
Foreign exchange contracts . . . . . . . . . . . . . . . . . Prepaid expenses and other $ 47Accounts payable
and accrued liabilities $11
Total derivative instruments . . . . . . . . . . . . . . . . . . . . . . . . . . . . . . . . . . . . . . . . . . . $142 $37
The following table summarizes the classification and fair value amounts of derivative instruments reported inthe consolidated balance sheet as of December 31, 2011.
Derivatives in asset positions Derivatives in liability positions
(in millions) Balance sheet locationFair
value Balance sheet locationFair
value
Derivative instruments designated as hedgesInterest rate contracts . . . . . . . . . . . . . . . . . . . . . . Other long-term assets $ 77 Other long-term liabilities $11
Foreign exchange contracts . . . . . . . . . . . . . . . . . Prepaid expenses and other 54Accounts payable
and accrued liabilities 3Foreign exchange contracts . . . . . . . . . . . . . . . . . Other long-term assets 1 Other long-term liabilities —
Total derivative instruments designated as hedges . . . . . . . . . . . . . . . . . . . . . . . . . . $132 $14
Undesignated derivative instruments
Foreign exchange contracts . . . . . . . . . . . . . . . . . Prepaid expenses and other $ —Accounts payable
and accrued liabilities $ 1
Total derivative instruments . . . . . . . . . . . . . . . . . . . . . . . . . . . . . . . . . . . . . . . . . . . $132 $15
Fair Value MeasurementsThe fair value hierarchy under the accounting standard for fair value measurements consists of the followingthree levels:
• Level 1 — Quoted prices in active markets that the company has the ability to access for identicalassets or liabilities;
• Level 2 — Quoted prices for similar instruments in active markets, quoted prices for identical orsimilar instruments in markets that are not active, and model-based valuations in which all significantinputs are observable in the market; and
• Level 3 — Valuations using significant inputs that are unobservable in the market and include the useof judgment by the company’s management about the assumptions market participants would use inpricing the asset or liability.
72

The following tables summarize the bases used to measure financial assets and liabilities that are carried at fairvalue on a recurring basis in the consolidated balance sheets.
Basis of fair value measurement
(in millions)
Balance atDecember 31,
2012
Quoted prices inactive markets for
identical assets(Level 1)
Significant otherobservable inputs
(Level 2)
Significantunobservable inputs
(Level 3)
AssetsForeign currency hedges . . . . . . . . . . . . . . . . . . $ 75 $— $ 75 $—Interest rate hedges . . . . . . . . . . . . . . . . . . . . . . . 67 — 67 —Available-for-sale securities
Equity securities . . . . . . . . . . . . . . . . . . . . . . . 15 15 — —Preferred stock . . . . . . . . . . . . . . . . . . . . . . . . 51 — — 51Foreign government debt securities . . . . . . . . 16 — 16 —
Total assets . . . . . . . . . . . . . . . . . . . . . . . . . $224 $15 $158 $51
LiabilitiesForeign currency hedges . . . . . . . . . . . . . . . . . . $ 16 $— $ 16 $—Interest rate hedges . . . . . . . . . . . . . . . . . . . . . . . 21 — 21 —Contingent payments related to acquisitions
and investments . . . . . . . . . . . . . . . . . . . . . . . 86 — — 86
Total liabilities . . . . . . . . . . . . . . . . . . . . . . $123 $— $ 37 $86
Basis of fair value measurement
(in millions)
Balance atDecember 31,
2011
Quoted prices inactive markets for
identical assets(Level 1)
Significant otherobservable inputs
(Level 2)
Significantunobservable inputs
(Level 3)
AssetsForeign currency hedges . . . . . . . . . . . . . . . . . . $ 55 $— $ 55 $ —Interest rate hedges . . . . . . . . . . . . . . . . . . . . . . . 77 — 77 —Available-for-sale securities
Equity securities . . . . . . . . . . . . . . . . . . . . . . . 21 21 — —
Total assets . . . . . . . . . . . . . . . . . . . . . . . . . $153 $21 $132 $ —
LiabilitiesForeign currency hedges . . . . . . . . . . . . . . . . . . $ 4 $— $ 4 $ —Interest rate hedges . . . . . . . . . . . . . . . . . . . . . . . 11 — 11 —Contingent payments related to acquisitions
and investments . . . . . . . . . . . . . . . . . . . . . . . 234 — — 234
Total liabilities . . . . . . . . . . . . . . . . . . . . . . $249 $— $ 15 $234
As of December 31, 2012, cash and equivalents of $3.3 billion included money market funds of approximately$1.0 billion, which would be considered Level 2 in the fair value hierarchy.
For assets that are measured using quoted prices in active markets, the fair value is the published market price perunit multiplied by the number of units held, without consideration of transaction costs. The majority of thederivatives entered into by the company are valued using internal valuation techniques as no quoted marketprices exist for such instruments. The principal techniques used to value these instruments are discounted cashflow and Black-Scholes models. The key inputs are considered observable and vary depending on the type ofderivative, and include contractual terms, interest rate yield curves, foreign exchange rates and volatility. The fairvalues of foreign government debt securities are obtained from pricing services or broker/dealers who useproprietary pricing applications, which include observable market information for like or same securities. The
73

preferred stock is valued based upon recent transactions, as well as the financial information of the investee. Thecontingent payments are valued using a discounted cash flow technique that reflects management’s expectationsabout probability of payment, which can range from 0 to 100 percent. Significant increases or decreases in theprobability of payment would result in an increase or decrease, respectively, in the fair value. The weighted-average probability used as of December 31, 2012 was approximately 60%.
At December 31, 2012, the company held available-for-sale equity securities that had an amortized cost basis andfair value of $13 million and $15 million, respectively, with $2 million of cumulative unrealized gains. AtDecember 31, 2011, the amortized cost basis and fair value of the available-for-sale equity securities was $14million and $21 million, respectively, with $7 million in cumulative unrealized gains.
In July 2012, Baxter acquired approximately 3 million shares of Onconova preferred stock for $50 million. Thepreferred stock included a redemption right for Baxter and the company has classified the investment as anavailable-for-sale debt security. In March 2012, the company’s Greek government debt holdings wererestructured into new Greek government bonds with a notional amount of $24 million ranging in maturity from11 to 30 years, and European Financial Stability Facility (EFSF) bonds with a notional amount of $11 millionmaturing in one to two years. In the first quarter of 2012, the company recorded a loss of $5 million in other(income) expense, net related to the write-down of the fair value of the original Greek government bonds of $21million to the fair value of the new bonds of $16 million. In the second quarter of 2012, the company sold all ofits Greek government and EFSF bond holdings, from which the company received $14 million in proceeds andrecognized a realized loss of $3 million in other (income) expense, net.
In February 2012, as a result of the company’s acquisition of Synovis, the company acquired marketablesecurities, which included municipal securities, corporate bonds, and U.S. government agency issues, which hadbeen classified as available-for-sale, with primarily all of these securities maturing within one year. The companyreceived proceeds of $45 million from the sale and maturity of all of these securities in 2012.
As of December 31, 2012, the cumulative unrealized gains for the company’s available-for-sale debt securitieswere less than $1 million.
Refer to Note 11 for fair value disclosures related to the company’s pension plans.
The following table is a reconciliation of the fair value measurements that use significant unobservable inputs(Level 3), which consist of contingent payments related to acquisitions and investments and preferred stock.
(in millions)Contingent
paymentsPreferred
stock
Fair value as of December 31, 2010 . . . . . . . . . . . . . . . . . . . . . . . . . . . . . . . . . . . . . . . . . . . . . $ 125 $—Additions, net of payments of $13 . . . . . . . . . . . . . . . . . . . . . . . . . . . . . . . . . . . . . . . . . . . . . . 102 —Loss recognized in earnings . . . . . . . . . . . . . . . . . . . . . . . . . . . . . . . . . . . . . . . . . . . . . . . . . . . 7 —
Fair value as of December 31, 2011 . . . . . . . . . . . . . . . . . . . . . . . . . . . . . . . . . . . . . . . . . . . . . 234 —Purchases . . . . . . . . . . . . . . . . . . . . . . . . . . . . . . . . . . . . . . . . . . . . . . . . . . . . . . . . . . . . . . . . . . — 50Payments . . . . . . . . . . . . . . . . . . . . . . . . . . . . . . . . . . . . . . . . . . . . . . . . . . . . . . . . . . . . . . . . . . (40) —Gains recognized in earnings . . . . . . . . . . . . . . . . . . . . . . . . . . . . . . . . . . . . . . . . . . . . . . . . . . (108) —CTA . . . . . . . . . . . . . . . . . . . . . . . . . . . . . . . . . . . . . . . . . . . . . . . . . . . . . . . . . . . . . . . . . . . . . . — 1
Fair value as of December 31, 2012 . . . . . . . . . . . . . . . . . . . . . . . . . . . . . . . . . . . . . . . . . . . . . $ 86 $51
The company’s payments in 2012 principally related to milestones associated with the SIGMA agreement. Asdiscussed in Note 4, the gains recognized in earnings in 2012 included $53 million and $38 million related to thereduction of the contingent payment liabilities for certain milestones associated with the 2011 acquisition ofPrism and the 2010 acquisition of ApaTech, respectively. These gains were reported in other (income) expense,
74

net. The contingent liabilities were reduced based on updated information indicating that the probability ofachieving certain milestones was lower than previously expected.
The loss recognized in earnings in 2011 related to liabilities held at December 31, 2011 and was reported in costof sales and R&D expenses. The additions during 2011 principally related to the fair value of contingentpayments associated with the company’s acquisition of Prism and the arrangement with Ceremed, Inc. (Ceremed)related to Ceremed’s OSTENE brand bone hemostasis product line, as well as its AOC PolymerBlendtechnology, which is used in manufacturing Baxter’s ACTIFUSE product, a silicate substituted calciumphosphate synthetic bone graft material. Refer to Note 4 for more information regarding the Prism acquisition.
As discussed further in Note 6, the company recorded asset impairment charges related to its COLLEAGUE andSYNDEO infusion pumps and business optimization initiatives in 2012, 2011, and 2010. As these assets had noalternative use and no salvage value, the fair values, measured using significant unobservable inputs (Level 3),were assessed to be zero.
Book Values and Fair Values of Financial InstrumentsIn addition to the financial instruments that the company is required to recognize at fair value on the consolidatedbalance sheets, the company has certain financial instruments that are recognized at historical cost or some basisother than fair value. For these financial instruments, the following table provides the values recognized on theconsolidated balance sheets and the approximate fair values.
Book valuesApproximate
fair values
as of December 31 (in millions) 2012 2011 2012 2011
AssetsLong-term insurance receivables . . . . . . . . . . . . . . . . . . . . . . . . . . . . . . . . . . $ 2 $ 15 $ 2 $ 15Investments . . . . . . . . . . . . . . . . . . . . . . . . . . . . . . . . . . . . . . . . . . . . . . . . . . . 46 85 49 94LiabilitiesShort-term debt . . . . . . . . . . . . . . . . . . . . . . . . . . . . . . . . . . . . . . . . . . . . . . . . 27 256 27 256Current maturities of long-term debt and lease obligations . . . . . . . . . . . . . . 323 190 324 190Long-term debt and lease obligations . . . . . . . . . . . . . . . . . . . . . . . . . . . . . . . 5,580 4,749 6,201 5,312Long-term litigation liabilities . . . . . . . . . . . . . . . . . . . . . . . . . . . . . . . . . . . . 32 63 31 62
The following table summarizes the bases used to measure the approximate fair value of the financial instrumentsas of December 31, 2012.
Basis of fair value measurement
(in millions)
Balance as ofDecember 31,
2012
Quoted prices inactive markets for
identical assets(Level 1)
Significant otherobservable inputs
(Level 2)
Significantunobservable inputs
(Level 3)
AssetsLong-term insurance receivables . . . . . . . . . . . . $ 2 $— $ 2 $—Investments . . . . . . . . . . . . . . . . . . . . . . . . . . . . 49 — 19 30
Total assets . . . . . . . . . . . . . . . . . . . . . . . . . . . $ 51 $— $ 21 $30
LiabilitiesShort-term debt . . . . . . . . . . . . . . . . . . . . . . . . . . $ 27 $— $ 27 $—Current maturities of long-term debt and lease
obligations . . . . . . . . . . . . . . . . . . . . . . . . . . . 324 — 324 —Long-term debt and lease obligations . . . . . . . . 6,201 — 6,201 —Long-term litigation liabilities . . . . . . . . . . . . . . 31 — 31 —
Total liabilities . . . . . . . . . . . . . . . . . . . . . . . . $6,583 $— $6,583 $—
75

The estimated fair values of long-term insurance receivables and long-term litigation liabilities were computedby discounting the expected cash flows based on currently available information, which in many cases does notinclude final orders or settlement agreements. The discount factors used in the calculations reflect the non-performance risk of the insurance providers and the company, respectively.
Investments in 2012 principally included certain cost method investments and held-to-maturity debt securities.The decrease in investments in 2012 primarily related to the first quarter 2012 restructuring of the company’sGreek government bonds and subsequent classification as available-for-sale, as discussed above, and the sale ofthe company’s common stock investment in Enobia Pharma Corporation (Enobia), which the company originallypurchased in 2011. An $18 million investment was made in 2011 in the common stock of Enobia, a privately-held company that develops therapies to treat serious genetic bone disorders for which there are no approvedtreatments, which had been classified as a cost method investment. In determining the fair value of cost methodinvestments, the company had taken into consideration recent transactions, as well as the financial information ofthe investee.
Investments in 2011 principally included held-to-maturity debt securities, as well as certain cost methodinvestments. In 2011, certain past due receivables with the Greek government were converted into non-interestbearing bonds with maturities of one to three years. In December 2011, the company collected $17 million uponthe maturity of the first tranche of the bonds, which is reported in the investing section of the consolidatedstatement of cash flows. However, as a result of continued economic uncertainty and ongoing Greek governmentnegotiations regarding the settlement terms for outstanding bonds, the company recorded an impairment chargeof $41 million in the fourth quarter of 2011 to reduce the remaining Greek government bonds to estimated fairvalue, which is reported in other (income) expense, net. The estimated fair value of these bonds was calculatedusing a discounted cash flow model that incorporated observable inputs, including interest rate yields. As ofDecember 31, 2011, these bonds had both a book value and fair value of $21 million.
The fair value of held-to-maturity debt securities is calculated using a discounted cash flow model thatincorporates observable inputs, including interest rate yields, which represents a Level 2 basis of fair valuemeasurement. In determining the fair value of cost method investments, the company takes into considerationrecent transactions, as well as the financial information of the investee, which represents a Level 3 basis of fairvalue measurement.
The estimated fair values of current and long-term debt were computed by multiplying price by the notionalamount of the respective debt instrument. Price is calculated using the stated terms of the respective debtinstrument and yield curves commensurate with the company’s credit risk. The carrying values of the otherfinancial instruments approximate their fair values due to the short-term maturities of most of these assets andliabilities.
NOTE 9COMMITMENTS AND CONTINGENCIES
Joint Development and Commercialization ArrangementsAs discussed in Note 1, the company has entered into certain collaborative arrangements which includecontingent milestone payments. At December 31, 2012, the company’s unfunded contingent milestone paymentsassociated with all of its arrangements totaled $1.5 billion. This total excludes any contingent royalties. Based onthe company’s projections, any contingent payments made in the future will be more than offset over time by theestimated net future cash flows relating to the rights acquired for those payments. The majority of the contingentpayments relate to arrangements in the BioScience segment and principally relate to the business developmentarrangements described in Note 4.
76

Other CommitmentIn connection with the company’s initiative to invest in early-stage products and therapies, the company has anunfunded commitment of $37 million as a limited partner in an investment company as of December 31, 2012.
IndemnificationsDuring the normal course of business, Baxter makes indemnities, commitments and guarantees pursuant to whichthe company may be required to make payments related to specific transactions. Indemnifications include:(i) intellectual property indemnities to customers in connection with the use, sales or license of products andservices; (ii) indemnities to customers in connection with losses incurred while performing services on theirpremises; (iii) indemnities to vendors and service providers pertaining to claims based on negligence or willfulmisconduct; and (iv) indemnities involving the representations and warranties in certain contracts. In addition,under Baxter’s Amended and Restated Certificate of Incorporation, and consistent with Delaware GeneralCorporation Law, the company has agreed to indemnify its directors and officers for certain losses and expensesupon the occurrence of certain prescribed events. The majority of these indemnities, commitments andguarantees do not provide for any limitation on the maximum potential for future payments that the companycould be obligated to make. To help address some of these risks, the company maintains various insurancecoverages. Based on historical experience and evaluation of the agreements, the company does not believe thatany significant payments related to its indemnifications will result, and therefore the company has not recordedany associated liabilities.
Legal ContingenciesRefer to Note 13 for a discussion of the company’s legal contingencies.
NOTE 10SHAREHOLDERS’ EQUITY
Stock-Based CompensationThe company’s stock-based compensation generally includes stock options, restricted stock units (RSUs),performance share units (PSUs) and purchases under the company’s employee stock purchase plan. Shares issuedrelating to the company’s stock-based plans are generally issued out of treasury stock.
In 2011, shareholders approved the Baxter International Inc. 2011 Incentive Plan which provides for 40 millionadditional shares of common stock available for issuance with respect to awards for participants. As ofDecember 31, 2012, approximately 50 million authorized shares are available for future awards under thecompany’s stock-based compensation plans.
Stock Compensation ExpenseStock compensation expense recognized in the consolidated statements of income was $130 million, $119million and $120 million in 2012, 2011 and 2010, respectively. The related tax benefit recognized was $40million in 2012 and $36 million in both 2011 and 2010.
Stock compensation expense is recorded at the corporate level and is not allocated to a segment. Over 70% ofstock compensation expense is classified in marketing and administrative expenses, with the remainder classifiedin cost of sales and R&D expenses. Costs capitalized in the consolidated balance sheets at December 31, 2012and 2011 were not significant.
Stock compensation expense is based on awards expected to vest, and therefore has been reduced by estimatedforfeitures.
77

Stock OptionsStock options are granted to employees and non-employee directors with exercise prices at least equal to 100%of the market value on the date of grant. Stock options granted to employees generally vest in one-thirdincrements over a three-year period. Stock options granted to non-employee directors generally cliff-vest 100%one year from the grant date. Stock options typically have a contractual term of 10 years. The grant-date fairvalue, adjusted for estimated forfeitures, is recognized as expense on a straight-line basis over the substantivevesting period.
The fair value of stock options is determined using the Black-Scholes model. The weighted-average assumptionsused in estimating the fair value of stock options granted during each year, along with the weighted-averagegrant-date fair values, were as follows.
years ended December 31 2012 2011 2010
Expected volatility . . . . . . . . . . . . . . . . . . . . . . . . . . . . . . . . . . . . . . . . . . . . . . . . . . . . . . . . . 25% 25% 22%Expected life (in years) . . . . . . . . . . . . . . . . . . . . . . . . . . . . . . . . . . . . . . . . . . . . . . . . . . . . . 5.5 5.0 4.5Risk-free interest rate . . . . . . . . . . . . . . . . . . . . . . . . . . . . . . . . . . . . . . . . . . . . . . . . . . . . . . 1.0% 2.2% 2.0%Dividend yield . . . . . . . . . . . . . . . . . . . . . . . . . . . . . . . . . . . . . . . . . . . . . . . . . . . . . . . . . . . . 2.3% 2.3% 2.0%Fair value per stock option . . . . . . . . . . . . . . . . . . . . . . . . . . . . . . . . . . . . . . . . . . . . . . . . . . $10 $10 $10
Effective with the March 2012 annual stock compensation grants, the company’s expected volatility assumptionis based on a weighted-average of the historical volatility of Baxter’s stock and the implied volatility from tradedoptions on Baxter’s stock, with historical volatility more heavily weighted. Prior to the March 2012 grants, theexpected volatility assumption was based on an equal weighting of the historical and implied volatilities. Theexpected life assumption is primarily based on the vesting terms of the stock option, historical employee exercisepatterns and employee post-vesting termination behavior. The risk-free interest rate for the expected life of theoption is based on the U.S. Treasury yield curve in effect at the time of grant. The dividend yield reflectshistorical experience as well as future expectations over the expected life of the option.
The following table summarizes stock option activity for the year ended December 31, 2012 and stock optioninformation at December 31, 2012.
(options and aggregate intrinsic values in thousands) Options
Weighted-averageexercise
price
Weighted-averageremaining
contractualterm (in years)
Aggregateintrinsic
value
Outstanding at January 1, 2012 . . . . . . . . . . . . . . . . . . . . . . . . . . 36,484 $50.54Granted . . . . . . . . . . . . . . . . . . . . . . . . . . . . . . . . . . . . . . . . . . . . . 6,236 57.48Exercised . . . . . . . . . . . . . . . . . . . . . . . . . . . . . . . . . . . . . . . . . . . (9,414) 47.24Forfeited . . . . . . . . . . . . . . . . . . . . . . . . . . . . . . . . . . . . . . . . . . . . (844) 56.39Expired . . . . . . . . . . . . . . . . . . . . . . . . . . . . . . . . . . . . . . . . . . . . . (407) 57.47
Outstanding at December 31, 2012 . . . . . . . . . . . . . . . . . . . . . . . 32,055 $52.62 6.2 $450,331
Vested or expected to vest as of December 31, 2012 . . . . . . . . . . 31,366 $52.53 6.1 $443,454
Exercisable at December 31, 2012 . . . . . . . . . . . . . . . . . . . . . . . . 20,685 $50.42 4.9 $336,108
The aggregate intrinsic value in the table above represents the difference between the exercise price and thecompany’s closing stock price on the last trading day of the year. The total intrinsic value of options exercisedwas $129 million, $102 million and $110 million in 2012, 2011 and 2010, respectively.
As of December 31, 2012, $53 million of unrecognized compensation cost related to stock options is expected tobe recognized as expense over a weighted-average period of approximately 1.8 years.
78

RSUsRSUs are granted to employees and non-employee directors. RSUs granted to employees generally vest in one-third increments over a three-year period. RSUs granted to non-employee directors generally cliff-vest one yearfrom the grant date. The grant-date fair value, adjusted for estimated forfeitures, is recognized as expense on astraight-line basis over the substantive vesting period. The fair value of RSUs is determined based on the numberof shares granted and the quoted price of the company’s common stock on the date of grant.
The following table summarizes nonvested RSU activity for the year ended December 31, 2012.
(share units in thousands) Share units
Weighted-averagegrant-datefair value
Nonvested RSUs at January 1, 2012 . . . . . . . . . . . . . . . . . . . . . . . . . . . . . . . . . . . . . . . 1,310 $53.35Granted . . . . . . . . . . . . . . . . . . . . . . . . . . . . . . . . . . . . . . . . . . . . . . . . . . . . . . . . . . . . . 1,185 57.03Vested . . . . . . . . . . . . . . . . . . . . . . . . . . . . . . . . . . . . . . . . . . . . . . . . . . . . . . . . . . . . . . (348) 53.62Forfeited . . . . . . . . . . . . . . . . . . . . . . . . . . . . . . . . . . . . . . . . . . . . . . . . . . . . . . . . . . . . . (168) 55.07
Nonvested RSUs at December 31, 2012 . . . . . . . . . . . . . . . . . . . . . . . . . . . . . . . . . . . . 1,979 $55.36
As of December 31, 2012, $60 million of unrecognized compensation cost related to RSUs is expected to berecognized as expense over a weighted-average period of approximately 2.3 years. The weighted-average grant-date fair value of RSUs in 2012, 2011 and 2010 was $57.03, $53.87 and $47.06, respectively. The fair value ofRSUs vested in 2012, 2011 and 2010 was $21 million, $7 million and $9 million, respectively.
PSUsThe company’s annual equity awards stock compensation program for senior management includes the issuanceof PSUs with market-based conditions. The company’s overall mix of annual stock compensation awards forofficers is approximately 50% stock options and 50% PSUs.
The payout resulting from the vesting of the PSUs is based on Baxter’s growth in shareholder value versus thegrowth in shareholder value of the healthcare companies in Baxter’s peer group during the three-yearperformance period commencing with the year in which the PSUs are granted. Depending on Baxter’s growth inshareholder value relative to the peer group, a holder of PSUs is entitled to receive a number of shares ofcommon stock equal to a percentage, ranging from 0% to 200%, of the PSUs granted. The grant-date fair value,adjusted for estimated forfeitures, is recognized as expense on a straight-line basis over the substantive vestingperiod.
The fair value of PSUs is determined using a Monte Carlo model. A Monte Carlo model uses stock pricevolatility and other variables to estimate the probability of satisfying the market conditions and the resulting fairvalue of the award. The assumptions used in estimating the fair value of PSUs granted during each year, alongwith the weighted-average grant-date fair values, were as follows.
years ended December 31 2012 2011 2010
Baxter volatility . . . . . . . . . . . . . . . . . . . . . . . . . . . . . . . . . . . . . . . . . . . . . . . 24% 28% 26%Peer group volatility . . . . . . . . . . . . . . . . . . . . . . . . . . . . . . . . . . . . . . . . . . . . 14%-50% 19%-55% 20%-59%Correlation of returns . . . . . . . . . . . . . . . . . . . . . . . . . . . . . . . . . . . . . . . . . . . 0.26-0.54 0.29-0.61 0.29-0.63Risk-free interest rate . . . . . . . . . . . . . . . . . . . . . . . . . . . . . . . . . . . . . . . . . . . 0.4% 1.2% 1.3%Fair value per PSU . . . . . . . . . . . . . . . . . . . . . . . . . . . . . . . . . . . . . . . . . . . . . $72 $62 $63
The company granted approximately 415,000, 436,000 and 590,000 PSUs in 2012, 2011 and 2010, respectively.Unrecognized compensation cost related to all unvested PSUs of $22 million at December 31, 2012 is expectedto be recognized as expense over a weighted-average period of 1.7 years.
79

The following table summarizes nonvested PSU activity for the year ended December 31, 2012.
(share units in thousands) Share units
Weighted-averagegrant-date fair
value
Nonvested PSUs at January 1, 2012 . . . . . . . . . . . . . . . . . . . . . . . . . . . . . . . . . . . . . . . 874 $62.28Granted . . . . . . . . . . . . . . . . . . . . . . . . . . . . . . . . . . . . . . . . . . . . . . . . . . . . . . . . . . . . . 415 71.51Vested . . . . . . . . . . . . . . . . . . . . . . . . . . . . . . . . . . . . . . . . . . . . . . . . . . . . . . . . . . . . . . (444) 62.81Forfeited . . . . . . . . . . . . . . . . . . . . . . . . . . . . . . . . . . . . . . . . . . . . . . . . . . . . . . . . . . . . . (41) 64.68
Nonvested PSUs at December 31, 2012 . . . . . . . . . . . . . . . . . . . . . . . . . . . . . . . . . . . . 804 $66.63
Employee Stock Purchase PlanNearly all employees are eligible to participate in the company’s employee stock purchase plan. The employeepurchase price is 85% of the closing market price on the purchase date.
In 2011, shareholders approved the Baxter International Inc. Employee Stock Purchase Plan which reflected themerger of the previous plans for U.S. and international employees. This employee stock purchase plan providesfor 10 million shares of common stock available for issuance to eligible participants.
During 2012, 2011 and 2010, the company issued approximately 0.9 million, 0.9 million and 1.0 million shares,respectively, under the prior and current employee stock purchase plans. The number of shares undersubscription at December 31, 2012 totaled approximately 0.6 million.
Realized Excess Income Tax Benefits and the Impact on the Statement of Cash FlowsRealized excess tax benefits associated with stock compensation are presented in the consolidated statement ofcash flows as an outflow within the operating section and an inflow within the financing section. Realized excesstax benefits from stock-based compensation were $24 million, $21 million and $41 million in 2012, 2011 and2010, respectively.
Cash DividendsTotal cash dividends declared per common share for 2012, 2011, and 2010 were $1.570, $1.265, and $1.180,respectively. In November 2012, the board of directors declared a quarterly dividend of $0.45 per share ($1.80per share on an annualized basis), which was paid on January 3, 2013 to shareholders of record as ofDecember 7, 2012.
In July 2012, the board of directors declared a quarterly dividend of $0.45 per share ($1.80 per share on anannualized basis), which represented an increase of 34% over the previous quarterly rate. In November 2011, theboard of directors declared a quarterly dividend of $0.335 per share ($1.34 per share on an annualized basis),which represented an increase of 8% over the previous quarterly rate.
Stock Repurchase ProgramsAs authorized by the board of directors, the company repurchases its stock depending on the company’s cashflows, net debt level and market conditions. The company repurchased 25 million shares for $1.5 billion in 2012,30 million shares for $1.6 billion in 2011, and 30 million shares for $1.5 billion in 2010. In December 2010, theboard of directors authorized the repurchase of up to $2.5 billion of the company’s common stock, which wasfully utilized as of December 31, 2012. In July 2012, the board of directors authorized the repurchase of up to anadditional $2.0 billion of the company’s common stock and $1.9 billion remained available as of December 31,2012.
80

Accumulated Other Comprehensive IncomeComprehensive income includes all changes in shareholders’ equity that do not arise from transactions withshareholders, and consists of net income, CTA, pension and other employee benefits, unrealized gains and losseson cash flow hedges and unrealized gains and losses on unrestricted available-for-sale marketable equitysecurities. The net-of-tax components of AOCI, a component of shareholders’ equity, were as follows.
as of December 31 (in millions) 2012 2011 2010
CTA . . . . . . . . . . . . . . . . . . . . . . . . . . . . . . . . . . . . . . . . . . . . . . . . . . . . . . . . . . . . . . $(1,227) $(1,129) $ (934)Pension and other employee benefits . . . . . . . . . . . . . . . . . . . . . . . . . . . . . . . . . . . . . (1,619) (1,508) (1,245)Hedging activities . . . . . . . . . . . . . . . . . . . . . . . . . . . . . . . . . . . . . . . . . . . . . . . . . . . . (5) 2 (3)Other . . . . . . . . . . . . . . . . . . . . . . . . . . . . . . . . . . . . . . . . . . . . . . . . . . . . . . . . . . . . . . 41 44 43
Accumulated other comprehensive loss . . . . . . . . . . . . . . . . . . . . . . . . . . . . . . . . . . . $(2,810) $(2,591) $(2,139)
NOTE 11RETIREMENT AND OTHER BENEFIT PROGRAMS
The company sponsors a number of qualified and nonqualified pension plans for eligible employees. Thecompany also sponsors certain unfunded contributory healthcare and life insurance benefits for substantially alldomestic retired employees. Newly hired employees in the United States and Puerto Rico are not eligible toparticipate in the pension plans but receive a higher level of company contributions in the defined contributionplans.
On August 31, 2012, Baxter announced an offer to terminated-vested participants in the U.S. pension plan(approximately 16,000 participants) to pay a lump-sum payment which would fully settle the company’s pensionplan obligation to these participants. The company offered the one-time voluntary lump-sum payment in an effortto reduce its long-term pension obligations and ongoing annual pension expense. The final acceptance rate byparticipants was approximately 50 percent, which resulted in a final payout of $377 million from plan assets inDecember 2012. The company recorded a non-cash settlement charge of $164 million in the fourth quarter of2012 to immediately expense the unrealized actuarial losses related to the obligations that were settled, whichwere previously deferred in AOCI. The settlement charge was recognized in marketing and administrativeexpenses since the terminated-vested participants subject to the settlement were no longer contributing to theactivities of the company.
81

Reconciliation of Pension and Other Postemployment Benefits (OPEB) Plan Obligations, Assets andFunded StatusThe benefit plan information in the table below pertains to all of the company’s pension and OPEB plans, both inthe United States and in other countries.
Pension benefits OPEB
as of and for the years ended December 31 (in millions) 2012 2011 2012 2011
Benefit obligationsBeginning of period . . . . . . . . . . . . . . . . . . . . . . . . . . . . . . . . . . . . . . . . . . . . . $ 4,944 $ 4,438 $ 618 $ 532Service cost . . . . . . . . . . . . . . . . . . . . . . . . . . . . . . . . . . . . . . . . . . . . . . . . . . . 110 112 7 6Interest cost . . . . . . . . . . . . . . . . . . . . . . . . . . . . . . . . . . . . . . . . . . . . . . . . . . . 235 237 29 28Participant contributions . . . . . . . . . . . . . . . . . . . . . . . . . . . . . . . . . . . . . . . . . 9 9 14 13Actuarial loss . . . . . . . . . . . . . . . . . . . . . . . . . . . . . . . . . . . . . . . . . . . . . . . . . . 652 333 18 71Benefit payments . . . . . . . . . . . . . . . . . . . . . . . . . . . . . . . . . . . . . . . . . . . . . . . (196) (178) (36) (32)Settlements . . . . . . . . . . . . . . . . . . . . . . . . . . . . . . . . . . . . . . . . . . . . . . . . . . . . (387) — — —Foreign exchange and other . . . . . . . . . . . . . . . . . . . . . . . . . . . . . . . . . . . . . . . (3) (7) — —
End of period . . . . . . . . . . . . . . . . . . . . . . . . . . . . . . . . . . . . . . . . . . . . . . . . . . 5,364 4,944 650 618
Fair value of plan assetsBeginning of period . . . . . . . . . . . . . . . . . . . . . . . . . . . . . . . . . . . . . . . . . . . . . 3,673 3,479 — —Actual return on plan assets . . . . . . . . . . . . . . . . . . . . . . . . . . . . . . . . . . . . . . . 464 120 — —Employer contributions . . . . . . . . . . . . . . . . . . . . . . . . . . . . . . . . . . . . . . . . . . 78 251 22 19Participant contributions . . . . . . . . . . . . . . . . . . . . . . . . . . . . . . . . . . . . . . . . . 9 9 14 13Benefit payments . . . . . . . . . . . . . . . . . . . . . . . . . . . . . . . . . . . . . . . . . . . . . . . (196) (178) (36) (32)Settlements . . . . . . . . . . . . . . . . . . . . . . . . . . . . . . . . . . . . . . . . . . . . . . . . . . . . (387) — — —Foreign exchange and other . . . . . . . . . . . . . . . . . . . . . . . . . . . . . . . . . . . . . . . 1 (8) — —
End of period . . . . . . . . . . . . . . . . . . . . . . . . . . . . . . . . . . . . . . . . . . . . . . . . . . 3,642 3,673 — —
Funded status at December 31 . . . . . . . . . . . . . . . . . . . . . . . . . . . . . . . . . . . . . $(1,722) $(1,271) $(650) $(618)
Amounts recognized in the consolidated balance sheetsNoncurrent asset . . . . . . . . . . . . . . . . . . . . . . . . . . . . . . . . . . . . . . . . . . . . . . . . $ 38 $ 25 $ — $ —Current liability . . . . . . . . . . . . . . . . . . . . . . . . . . . . . . . . . . . . . . . . . . . . . . . . (19) (19) (25) (28)Noncurrent liability . . . . . . . . . . . . . . . . . . . . . . . . . . . . . . . . . . . . . . . . . . . . . (1,741) (1,277) (625) (590)
Net liability recognized at December 31 . . . . . . . . . . . . . . . . . . . . . . . . . . . . . $(1,722) $(1,271) $(650) $(618)
Accumulated Benefit Obligation InformationThe pension obligation information in the table above represents the projected benefit obligation (PBO). ThePBO incorporates assumptions relating to future compensation levels. The accumulated benefit obligation (ABO)is the same as the PBO except that it includes no assumptions relating to future compensation levels. The ABOfor all of the company’s pension plans was $4.95 billion and $4.60 billion at the 2012 and 2011 measurementdates, respectively.
The information in the funded status table above represents the totals for all of the company’s pension plans. Thefollowing is information relating to the individual plans in the funded status table above that have an ABO inexcess of plan assets.
as of December 31 (in millions) 2012 2011
ABO . . . . . . . . . . . . . . . . . . . . . . . . . . . . . . . . . . . . . . . . . . . . . . . . . . . . . . . . . . . . . . . . . . . . . . . $4,816 $4,392Fair value of plan assets . . . . . . . . . . . . . . . . . . . . . . . . . . . . . . . . . . . . . . . . . . . . . . . . . . . . . . . . 3,452 3,393
82

The following is information relating to the individual plans in the funded status table above that have a PBO inexcess of plan assets (many of which also have an ABO in excess of assets, and are therefore also included in thetable directly above).
as of December 31 (in millions) 2012 2011
PBO . . . . . . . . . . . . . . . . . . . . . . . . . . . . . . . . . . . . . . . . . . . . . . . . . . . . . . . . . . . . . . . . . . . . . . . . $5,211 $4,783Fair value of plan assets . . . . . . . . . . . . . . . . . . . . . . . . . . . . . . . . . . . . . . . . . . . . . . . . . . . . . . . . 3,452 3,487
Expected Net Pension and OPEB Plan Payments for the Next 10 Years
(in millions)Pensionbenefits OPEB
2013 . . . . . . . . . . . . . . . . . . . . . . . . . . . . . . . . . . . . . . . . . . . . . . . . . . . . . . . . . . . . . . . . . . . . . . . . . $ 197 $ 252014 . . . . . . . . . . . . . . . . . . . . . . . . . . . . . . . . . . . . . . . . . . . . . . . . . . . . . . . . . . . . . . . . . . . . . . . . . 209 272015 . . . . . . . . . . . . . . . . . . . . . . . . . . . . . . . . . . . . . . . . . . . . . . . . . . . . . . . . . . . . . . . . . . . . . . . . . 219 282016 . . . . . . . . . . . . . . . . . . . . . . . . . . . . . . . . . . . . . . . . . . . . . . . . . . . . . . . . . . . . . . . . . . . . . . . . . 231 302017 . . . . . . . . . . . . . . . . . . . . . . . . . . . . . . . . . . . . . . . . . . . . . . . . . . . . . . . . . . . . . . . . . . . . . . . . . 248 322018 through 2022 . . . . . . . . . . . . . . . . . . . . . . . . . . . . . . . . . . . . . . . . . . . . . . . . . . . . . . . . . . . . . . 1,434 176
Total expected net benefit payments for next 10 years . . . . . . . . . . . . . . . . . . . . . . . . . . . . . . . . . . $2,538 $318
The expected net benefit payments above reflect the company’s share of the total net benefits expected to be paidfrom the plans’ assets (for funded plans) or from the company’s assets (for unfunded plans). The total expectedOPEB benefit payments for the next ten years are net of approximately $48 million of expected federal subsidiesrelating to the Medicare Prescription Drug, Improvement and Modernization Act, including $3 million, $4million, $4 million, $4 million and $5 million in each of the years 2013, 2014, 2015, 2016 and 2017,respectively.
Amounts Recognized in AOCIThe pension and OPEB plans’ gains or losses, prior service costs or credits, and transition assets or obligationsnot yet recognized in net periodic benefit cost are recognized on a net-of-tax basis in AOCI and will be amortizedfrom AOCI to net periodic benefit cost in the future.
The following is a summary of the pre-tax losses included in AOCI at December 31, 2012 and December 31,2011.
(in millions)Pensionbenefits OPEB
Actuarial loss . . . . . . . . . . . . . . . . . . . . . . . . . . . . . . . . . . . . . . . . . . . . . . . . . . . . . . . . . . . . . . . . . . $2,247 $163Prior service cost (credit) and transition obligation . . . . . . . . . . . . . . . . . . . . . . . . . . . . . . . . . . . . . 1 (1)
Total pre-tax loss recognized in AOCI at December 31, 2012 . . . . . . . . . . . . . . . . . . . . . . . . . . . . $2,248 $162
Actuarial loss . . . . . . . . . . . . . . . . . . . . . . . . . . . . . . . . . . . . . . . . . . . . . . . . . . . . . . . . . . . . . . . . . . $2,146 $153Prior service cost (credit) and transition obligation . . . . . . . . . . . . . . . . . . . . . . . . . . . . . . . . . . . . . 2 (3)
Total pre-tax loss recognized in AOCI at December 31, 2011 . . . . . . . . . . . . . . . . . . . . . . . . . . . . $2,148 $150
83

Refer to Note 10 for the net-of-tax balances included in AOCI as of each of the year-end dates. The following isa summary of the net-of-tax amounts recorded in OCI relating to pension and OPEB plans.
years ended December 31 (in millions) 2012 2011 2010
Charge arising during the year, net of tax benefit of ($143) in 2012, ($214) in2011 and ($74) in 2010 . . . . . . . . . . . . . . . . . . . . . . . . . . . . . . . . . . . . . . . . . . . . . . . . . . $(353) $(375) $(135)
Settlement charge, net of tax expense of $65 in 2012 . . . . . . . . . . . . . . . . . . . . . . . . . . . . . 103 — —Amortization of loss to earnings, net of tax expense of $77 in 2012, $63 in
2011 and $42 in 2010 . . . . . . . . . . . . . . . . . . . . . . . . . . . . . . . . . . . . . . . . . . . . . . . . . . . 139 112 78
Pension and other employee benefits charge . . . . . . . . . . . . . . . . . . . . . . . . . . . . . . . . . . . $(111) $(263) $ (57)
Due to the settlement of certain of the company’s pension obligations in 2012, $168 million ($103 million on anafter-tax basis) of prior unrecognized actuarial losses have been recognized from AOCI into the company’searnings. The impact of the settlement on AOCI was more than offset by current year actuarial losses. Activityrelating to prior service costs and credits and transition obligations was insignificant.
Amounts Expected to be Amortized From AOCI to Net Periodic Benefit Cost in 2013
With respect to the AOCI balance at December 31, 2012, the following is a summary of the pre-tax amountsexpected to be amortized to net periodic benefit cost in 2013.
(in millions)Pensionbenefits OPEB
Actuarial loss . . . . . . . . . . . . . . . . . . . . . . . . . . . . . . . . . . . . . . . . . . . . . . . . . . . . . . . . . . . . . . . . . . $244 $10Prior service cost (credit) and transition obligation . . . . . . . . . . . . . . . . . . . . . . . . . . . . . . . . . . . . . 1 (1)
Total pre-tax amount expected to be amortized from AOCI to net pensionand OPEB cost in 2013 . . . . . . . . . . . . . . . . . . . . . . . . . . . . . . . . . . . . . . . . . . . . . . . . . . . . . . . . . $245 $ 9
Net Periodic Benefit Costyears ended December 31 (in millions) 2012 2011 2010
Pension benefitsService cost . . . . . . . . . . . . . . . . . . . . . . . . . . . . . . . . . . . . . . . . . . . . . . . . . . . . . . . . . . . . . $ 110 $ 112 $ 99Interest cost . . . . . . . . . . . . . . . . . . . . . . . . . . . . . . . . . . . . . . . . . . . . . . . . . . . . . . . . . . . . . 235 237 228Expected return on plan assets . . . . . . . . . . . . . . . . . . . . . . . . . . . . . . . . . . . . . . . . . . . . . . (288) (303) (282)Amortization of net losses and other deferred amounts . . . . . . . . . . . . . . . . . . . . . . . . . . . 209 177 125Settlement losses . . . . . . . . . . . . . . . . . . . . . . . . . . . . . . . . . . . . . . . . . . . . . . . . . . . . . . . . . 168 — —
Net periodic pension benefit cost . . . . . . . . . . . . . . . . . . . . . . . . . . . . . . . . . . . . . . . . . . . . $ 434 $ 223 $ 170
OPEBService cost . . . . . . . . . . . . . . . . . . . . . . . . . . . . . . . . . . . . . . . . . . . . . . . . . . . . . . . . . . . . . $ 7 $ 6 $ 6Interest cost . . . . . . . . . . . . . . . . . . . . . . . . . . . . . . . . . . . . . . . . . . . . . . . . . . . . . . . . . . . . . 29 28 30Amortization of net loss and prior service credit . . . . . . . . . . . . . . . . . . . . . . . . . . . . . . . . 7 (2) (5)
Net periodic OPEB cost . . . . . . . . . . . . . . . . . . . . . . . . . . . . . . . . . . . . . . . . . . . . . . . . . . . $ 43 $ 32 $ 31
84
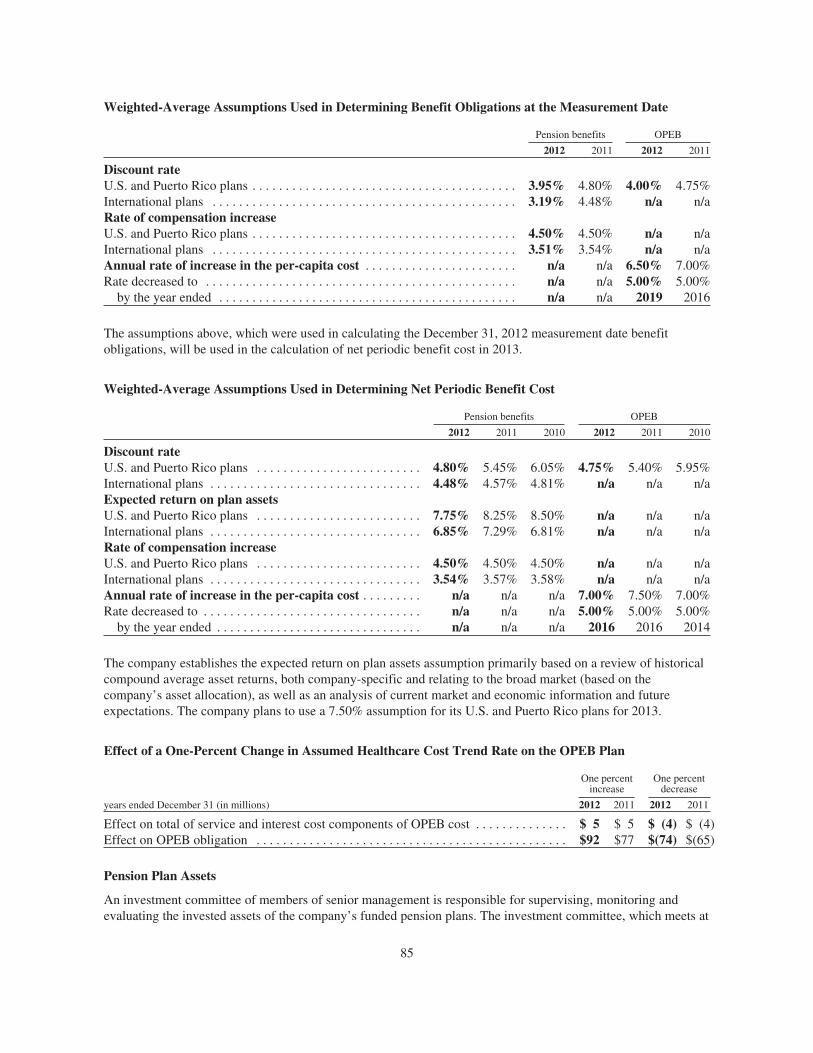
Weighted-Average Assumptions Used in Determining Benefit Obligations at the Measurement Date
Pension benefits OPEB
2012 2011 2012 2011
Discount rateU.S. and Puerto Rico plans . . . . . . . . . . . . . . . . . . . . . . . . . . . . . . . . . . . . . . . . 3.95% 4.80% 4.00% 4.75%International plans . . . . . . . . . . . . . . . . . . . . . . . . . . . . . . . . . . . . . . . . . . . . . . 3.19% 4.48% n/a n/aRate of compensation increaseU.S. and Puerto Rico plans . . . . . . . . . . . . . . . . . . . . . . . . . . . . . . . . . . . . . . . . 4.50% 4.50% n/a n/aInternational plans . . . . . . . . . . . . . . . . . . . . . . . . . . . . . . . . . . . . . . . . . . . . . . 3.51% 3.54% n/a n/aAnnual rate of increase in the per-capita cost . . . . . . . . . . . . . . . . . . . . . . . n/a n/a 6.50% 7.00%Rate decreased to . . . . . . . . . . . . . . . . . . . . . . . . . . . . . . . . . . . . . . . . . . . . . . . n/a n/a 5.00% 5.00%
by the year ended . . . . . . . . . . . . . . . . . . . . . . . . . . . . . . . . . . . . . . . . . . . . . n/a n/a 2019 2016
The assumptions above, which were used in calculating the December 31, 2012 measurement date benefitobligations, will be used in the calculation of net periodic benefit cost in 2013.
Weighted-Average Assumptions Used in Determining Net Periodic Benefit Cost
Pension benefits OPEB
2012 2011 2010 2012 2011 2010
Discount rateU.S. and Puerto Rico plans . . . . . . . . . . . . . . . . . . . . . . . . . 4.80% 5.45% 6.05% 4.75% 5.40% 5.95%International plans . . . . . . . . . . . . . . . . . . . . . . . . . . . . . . . . 4.48% 4.57% 4.81% n/a n/a n/aExpected return on plan assetsU.S. and Puerto Rico plans . . . . . . . . . . . . . . . . . . . . . . . . . 7.75% 8.25% 8.50% n/a n/a n/aInternational plans . . . . . . . . . . . . . . . . . . . . . . . . . . . . . . . . 6.85% 7.29% 6.81% n/a n/a n/aRate of compensation increaseU.S. and Puerto Rico plans . . . . . . . . . . . . . . . . . . . . . . . . . 4.50% 4.50% 4.50% n/a n/a n/aInternational plans . . . . . . . . . . . . . . . . . . . . . . . . . . . . . . . . 3.54% 3.57% 3.58% n/a n/a n/aAnnual rate of increase in the per-capita cost . . . . . . . . . n/a n/a n/a 7.00% 7.50% 7.00%Rate decreased to . . . . . . . . . . . . . . . . . . . . . . . . . . . . . . . . . n/a n/a n/a 5.00% 5.00% 5.00%
by the year ended . . . . . . . . . . . . . . . . . . . . . . . . . . . . . . . n/a n/a n/a 2016 2016 2014
The company establishes the expected return on plan assets assumption primarily based on a review of historicalcompound average asset returns, both company-specific and relating to the broad market (based on thecompany’s asset allocation), as well as an analysis of current market and economic information and futureexpectations. The company plans to use a 7.50% assumption for its U.S. and Puerto Rico plans for 2013.
Effect of a One-Percent Change in Assumed Healthcare Cost Trend Rate on the OPEB Plan
One percentincrease
One percentdecrease
years ended December 31 (in millions) 2012 2011 2012 2011
Effect on total of service and interest cost components of OPEB cost . . . . . . . . . . . . . . $ 5 $ 5 $ (4) $ (4)Effect on OPEB obligation . . . . . . . . . . . . . . . . . . . . . . . . . . . . . . . . . . . . . . . . . . . . . . . $92 $77 $(74) $(65)
Pension Plan Assets
An investment committee of members of senior management is responsible for supervising, monitoring andevaluating the invested assets of the company’s funded pension plans. The investment committee, which meets at
85

least quarterly, abides by documented policies and procedures relating to investment goals, targeted assetallocations, risk management practices, allowable and prohibited investment holdings, diversification, use ofderivatives, the relationship between plan assets and benefit obligations, and other relevant factors andconsiderations.
The investment committee’s documented policies and procedures include the following:
• Ability to pay all benefits when due;
• Targeted long-term performance expectations relative to applicable market indices, such as Standard &Poor’s, Russell, MSCI EAFE, and other indices;
• Targeted asset allocation percentage ranges (summarized below), and periodic reviews of theseallocations;
• Diversification of assets among third-party investment managers, and by geography, industry, stage ofbusiness cycle and other measures;
• Specified investment holding and transaction prohibitions (for example, private placements or otherrestricted securities, securities that are not traded in a sufficiently active market, short sales, certainderivatives, commodities and margin transactions);
• Specified portfolio percentage limits on holdings in a single corporate or other entity (generally 5%,except for holdings in U.S. government or agency securities);
• Specified average credit quality for the fixed-income securities portfolio (at least A- by Standard &Poor’s or A3 by Moody’s);
• Specified portfolio percentage limits on foreign holdings; and
• Periodic monitoring of investment manager performance and adherence to the investment committee’spolicies.
Plan assets are invested using a total return investment approach whereby a mix of equity securities, debtsecurities and other investments are used to preserve asset values, diversify risk and exceed the plannedbenchmark investment return. Investment strategies and asset allocations are based on consideration of planliabilities, the plans’ funded status and other factors, such as the plans’ demographics and liability durations.Investment performance is reviewed by the investment committee on a quarterly basis and asset allocations arereviewed at least annually.
Plan assets are managed in a balanced portfolio comprised of two major components: equity securities and fixedincome securities. The target allocations for plan assets are 60 percent in equity securities and 40 percent in fixedincome securities and other holdings. The documented policy includes an allocation range based on eachindividual investment type within the major components that allows for a variance from the target allocations ofapproximately 5 percentage points. Equity securities primarily include common stock of U.S. and internationalcompanies, common/collective trust funds, mutual funds, and partnership investments. Fixed income securitiesand other holdings primarily include cash, money market funds with an original maturity of three months or less,U.S. and foreign government and governmental agency issues, corporate bonds, municipal securities, hedgefunds, derivative contracts and asset-backed securities.
While the investment committee provides oversight over plan assets for U.S. and international plans, thesummary above is specific to the plans in the United States. The plan assets for international plans are managedand allocated by the entities in each country, with input and oversight provided by the investment committee.The plan assets for the U.S. and international plans are included in the table below.
86

The following tables summarize the bases used to measure the pension plan assets and liabilities that are carriedat fair value on a recurring basis.
Basis of fair value measurement
(in millions)Balance at
December 31, 2012
Quoted prices inactive markets for
identical assets(Level 1)
Significant otherobservable inputs
(Level 2)
Significantunobservable
inputs(Level 3)
AssetsFixed income securities
Cash and cash equivalents . . . . . . . . . . . . . $ 324 $ 210 $ 114 $ —U.S. government and government
agency issues . . . . . . . . . . . . . . . . . . . . . 252 — 252 —Corporate bonds . . . . . . . . . . . . . . . . . . . . 657 — 657 —
Equity securitiesCommon stock:
Large cap . . . . . . . . . . . . . . . . . . . . . . . . 807 807 — —Mid cap . . . . . . . . . . . . . . . . . . . . . . . . . 426 426 — —Small cap . . . . . . . . . . . . . . . . . . . . . . . . 121 121 — —
Total common stock . . . . . . . . . . . . . 1,354 1,354 — —
Mutual funds . . . . . . . . . . . . . . . . . . . . . . . 317 143 174 —Common/collective trust funds . . . . . . . . . 467 — 462 5Partnership investments . . . . . . . . . . . . . . 180 — — 180
Other holdings . . . . . . . . . . . . . . . . . . . . . . . . 91 8 81 2Collateral held on loaned securities . . . . . . . 168 — 168 —
LiabilitiesCollateral to be paid on loaned securities . . . (168) (60) (108) —
Fair value of pension plan assets . . . . . . . . . . . . $3,642 $1,655 $1,800 $187
87

Basis of fair value measurement
(in millions)Balance at
December 31, 2011
Quoted prices inactive markets for
identical assets(Level 1)
Significant otherobservable inputs
(Level 2)
Significantunobservable
inputs(Level 3)
AssetsFixed income securities
Cash and cash equivalents . . . . . . . . . . . . . $ 233 $ 16 $ 217 $ —U.S. government and government
agency issues . . . . . . . . . . . . . . . . . . . . . 342 — 342 —Corporate bonds . . . . . . . . . . . . . . . . . . . . 627 — 627 —
Equity securitiesCommon stock:
Large cap . . . . . . . . . . . . . . . . . . . . . . . . 893 893 — —Mid cap . . . . . . . . . . . . . . . . . . . . . . . . . 447 447 — —Small cap . . . . . . . . . . . . . . . . . . . . . . . . 182 182 — —
Total common stock . . . . . . . . . . . . . 1,522 1,522 — —
Mutual funds . . . . . . . . . . . . . . . . . . . . . . . 267 117 150 —Common/collective trust funds . . . . . . . . . 416 — 412 4Partnership investments . . . . . . . . . . . . . . 170 — — 170
Other holdings . . . . . . . . . . . . . . . . . . . . . . . . 96 4 90 2Collateral held on loaned securities . . . . . . . 134 — 134 —
LiabilitiesCollateral to be paid on loaned securities . . . (134) (85) (49) —
Fair value of pension plan assets . . . . . . . . . . . . $3,673 $1,574 $1,923 $176
The following is a reconciliation of changes in fair value measurements that used significant unobservable inputs(Level 3).
(in millions) TotalCommon/collective
trust fundsPartnershipinvestments Other holdings
Balance at December 31, 2010 . . . . . . . . . . . . . . $158 $ 5 $151 $ 2Actual return on plan assets still held
at year end . . . . . . . . . . . . . . . . . . . . . . . . . (2) (1) (1) —Actual return on plan assets sold during
the year . . . . . . . . . . . . . . . . . . . . . . . . . . . . (2) — (2) —Purchases, sales and settlements . . . . . . . . . . 22 — 22 —
Balance at December 31, 2011 . . . . . . . . . . . . . . 176 4 170 2Actual return on plan assets still held
at year end . . . . . . . . . . . . . . . . . . . . . . . . . 12 1 11 —Actual return on plan assets sold during
the year . . . . . . . . . . . . . . . . . . . . . . . . . . . . — — — —Purchases, sales and settlements . . . . . . . . . . (1) — (1) —
Balance at December 31, 2012 . . . . . . . . . . . . . . $187 $ 5 $180 $ 2
88

The assets and liabilities of the company’s pension plans are valued using the following valuation methods:
Investment category Valuation methodology
Cash and cash equivalents . . . . . . . . These largely consist of a short-term investment fund, U.S. Dollars andforeign currency. The fair value of the short-term investment fund isbased on the net asset value
U.S. government and governmentagency issues . . . . . . . . . . . . . . . . .
Values are based on reputable pricing vendors, who typically use pricingmatrices or models that use observable inputs
Corporate bonds . . . . . . . . . . . . . . . . Values are based on reputable pricing vendors, who typically use pricingmatrices or models that use observable inputs
Common stock . . . . . . . . . . . . . . . . . Values are based on the closing prices on the valuation date in an activemarket on national and international stock exchanges
Mutual funds . . . . . . . . . . . . . . . . . . . Values are based on the net asset value of the units held in the respectivefund which are obtained from national and international exchanges orbased on the net asset value of the underlying assets of the fundprovided by the fund manager
Common/collective trust funds . . . . . Values are based on the net asset value of the units held at year end
Partnership investments . . . . . . . . . . Values are based on the estimated fair value of the participation by thecompany in the investment as determined by the general partner orinvestment manager of the respective partnership
Other holdings . . . . . . . . . . . . . . . . . . The value of these assets vary by investment type, but primarily aredetermined by reputable pricing vendors, who use pricing matrices ormodels that use observable inputs
Collateral held on loanedsecurities . . . . . . . . . . . . . . . . . . . .
Values are based on the net asset value per unit of the fund in which thecollateral is invested
Collateral to be paid on loanedsecurities . . . . . . . . . . . . . . . . . . . .
Values are based on the fair value of the underlying securities loaned onthe valuation date
Expected Pension and OPEB Plan FundingThe company’s funding policy for its pension plans is to contribute amounts sufficient to meet legal fundingrequirements, plus any additional amounts that the company may determine to be appropriate considering thefunded status of the plans, tax deductibility, the cash flows generated by the company, and other factors.Volatility in the global financial markets could have an unfavorable impact on future funding requirements. Thecompany has no obligation to fund its principal plans in the United States in 2013. The company continuallyreassesses the amount and timing of any discretionary contributions. The company expects to make cashcontributions to its pension plans of at least $49 million in 2013, primarily related to the company’s internationalplans. The company expects to have net cash outflows relating to its OPEB plan of approximately $25 million in2013.
89

The table below details the funded status percentage of the company’s pension plans as of December 31, 2012,including certain plans that are unfunded in accordance with the guidelines of the company’s funding policyoutlined above.
United States and Puerto Rico International
as of December 31, 2012 (in millions)Qualified
plansNonqualified
plan Funded plansUnfunded
plans Total
Fair value of plan assets . . . . . . . . . . . . . . . . . . . . . . . . $3,015 n/a $627 n/a $3,642PBO . . . . . . . . . . . . . . . . . . . . . . . . . . . . . . . . . . . . . . . 3,968 $194 895 $307 5,364Funded status percentage . . . . . . . . . . . . . . . . . . . . . . . 76% n/a 70% n/a 68%
U.S. Defined Contribution PlanMost U.S. employees are eligible to participate in a qualified defined contribution plan. Company contributionswere $39 million in 2012, $37 million in 2011 and $39 million in 2010.
NOTE 12INCOME TAXES
Income Before Income Tax Expense by Category
years ended December 31 (in millions) 2012 2011 2010
United States . . . . . . . . . . . . . . . . . . . . . . . . . . . . . . . . . . . . . . . . . . . . . . . . . . . . . . . . . $ 386 $ 399 $ 191International . . . . . . . . . . . . . . . . . . . . . . . . . . . . . . . . . . . . . . . . . . . . . . . . . . . . . . . . . . 2,503 2,410 1,699
Income before income taxes . . . . . . . . . . . . . . . . . . . . . . . . . . . . . . . . . . . . . . . . . . . . . . $2,889 $2,809 $1,890
Income Tax Expense
years ended December 31 (in millions) 2012 2011 2010
CurrentUnited States
Federal . . . . . . . . . . . . . . . . . . . . . . . . . . . . . . . . . . . . . . . . . . . . . . . . . . . . . . . . . . $122 $ 75 $ 73State and local . . . . . . . . . . . . . . . . . . . . . . . . . . . . . . . . . . . . . . . . . . . . . . . . . . . . 55 32 17
International . . . . . . . . . . . . . . . . . . . . . . . . . . . . . . . . . . . . . . . . . . . . . . . . . . . . . . . . 403 274 297
Current income tax expense . . . . . . . . . . . . . . . . . . . . . . . . . . . . . . . . . . . . . . . . . . . . . . 580 381 387
DeferredUnited States
Federal . . . . . . . . . . . . . . . . . . . . . . . . . . . . . . . . . . . . . . . . . . . . . . . . . . . . . . . . . . 112 155 178State and local . . . . . . . . . . . . . . . . . . . . . . . . . . . . . . . . . . . . . . . . . . . . . . . . . . . . (81) (6) 16
International . . . . . . . . . . . . . . . . . . . . . . . . . . . . . . . . . . . . . . . . . . . . . . . . . . . . . . . . (48) 23 (118)
Deferred income tax (benefit) expense . . . . . . . . . . . . . . . . . . . . . . . . . . . . . . . . . . . . . (17) 172 76
Income tax expense . . . . . . . . . . . . . . . . . . . . . . . . . . . . . . . . . . . . . . . . . . . . . . . . . . . . $563 $553 $463
90

The company’s 2012 state income tax expense was lower due to a reversal of a valuation allowance and anadjustment to prior year accruals.
Deferred Tax Assets and Liabilitiesas of December 31 (in millions) 2012 2011
Deferred tax assetsAccrued expenses . . . . . . . . . . . . . . . . . . . . . . . . . . . . . . . . . . . . . . . . . . . . . . . . . . . . . . . . . . . $ 171 $ 251Retirement benefits . . . . . . . . . . . . . . . . . . . . . . . . . . . . . . . . . . . . . . . . . . . . . . . . . . . . . . . . . . 804 658Alternative minimum tax credit . . . . . . . . . . . . . . . . . . . . . . . . . . . . . . . . . . . . . . . . . . . . . . . . — 54Tax credits and net operating losses . . . . . . . . . . . . . . . . . . . . . . . . . . . . . . . . . . . . . . . . . . . . . 169 198Valuation allowances . . . . . . . . . . . . . . . . . . . . . . . . . . . . . . . . . . . . . . . . . . . . . . . . . . . . . . . . (104) (116)
Total deferred tax assets . . . . . . . . . . . . . . . . . . . . . . . . . . . . . . . . . . . . . . . . . . . . . . . . . . . . . . . . 1,040 1,045
Deferred tax liabilitiesSubsidiaries’ unremitted earnings . . . . . . . . . . . . . . . . . . . . . . . . . . . . . . . . . . . . . . . . . . . . . . . 222 211Asset basis differences . . . . . . . . . . . . . . . . . . . . . . . . . . . . . . . . . . . . . . . . . . . . . . . . . . . . . . . 294 270
Total deferred tax liabilities . . . . . . . . . . . . . . . . . . . . . . . . . . . . . . . . . . . . . . . . . . . . . . . . . . . . . 516 481
Net deferred tax asset . . . . . . . . . . . . . . . . . . . . . . . . . . . . . . . . . . . . . . . . . . . . . . . . . . . . . . . . . . $ 524 $ 564
At December 31, 2012, the company had U.S. operating loss carryforwards totaling $53 million. The operatingloss carryforwards expire between 2013 and 2031. At December 31, 2012, the company had foreign operatingloss carryforwards totaling $274 million and foreign tax credit carryforwards totaling $63 million. Of theseforeign amounts, $2 million expires in 2013, $8 million expires in 2014, $10 million expires in 2015, $10 millionexpires in 2016, $74 million expires in 2017, $4 million expires in 2018, $45 million expires after 2018 and $184million has no expiration date. Realization of these operating loss and tax credit carryforwards depends ongenerating sufficient taxable income in future periods. A valuation allowance of $104 million and $116 millionwas recorded at December 31, 2012 and 2011, respectively, to reduce the deferred tax assets associated with netoperating loss and tax credit carryforwards, because the company does not believe it is more likely than not thatthese assets will be fully realized prior to expiration. The company will continue to evaluate the need foradditional valuation allowances and, as circumstances change, the valuation allowance may change.
Income Tax Expense Reconciliation
years ended December 31 (in millions) 2012 2011 2010
Income tax expense at U.S. statutory rate . . . . . . . . . . . . . . . . . . . . . . . . . . . . . . . . . . . . . $1,011 $ 983 $ 662Operations subject to tax incentives . . . . . . . . . . . . . . . . . . . . . . . . . . . . . . . . . . . . . . . . . (439) (510) (325)State and local taxes . . . . . . . . . . . . . . . . . . . . . . . . . . . . . . . . . . . . . . . . . . . . . . . . . . . . . (11) 25 18Foreign tax (benefit) expense . . . . . . . . . . . . . . . . . . . . . . . . . . . . . . . . . . . . . . . . . . . . . . (15) 32 (40)Tax on repatriations of foreign earnings . . . . . . . . . . . . . . . . . . . . . . . . . . . . . . . . . . . . . . — — 38Contingent tax matters . . . . . . . . . . . . . . . . . . . . . . . . . . . . . . . . . . . . . . . . . . . . . . . . . . . . 30 39 39Medicare Part D subsidies . . . . . . . . . . . . . . . . . . . . . . . . . . . . . . . . . . . . . . . . . . . . . . . . . — — 39Other factors . . . . . . . . . . . . . . . . . . . . . . . . . . . . . . . . . . . . . . . . . . . . . . . . . . . . . . . . . . . (13) (16) 32
Income tax expense . . . . . . . . . . . . . . . . . . . . . . . . . . . . . . . . . . . . . . . . . . . . . . . . . . . . . . $ 563 $ 553 $ 463
The company recognized income tax expense of $57 million during 2012 relating to 2012 earnings outside theUnited States that are not deemed indefinitely reinvested. The company continues to evaluate whether toindefinitely reinvest earnings in certain foreign jurisdictions as it continues to analyze the company’s globalfinancial structure. Currently, management intends to continue to reinvest past earnings in several jurisdictionsoutside of the United States indefinitely, particularly due to the company’s planned acquisition of Gambro (asdiscussed in Note 2) which will use substantial foreign cash, and therefore has not recognized U.S. income taxexpense on these earnings. U.S. federal and state income taxes, net of applicable credits, on these foreign
91

unremitted earnings of $10.6 billion as of December 31, 2012 would be approximately $3.4 billion. As ofDecember 31, 2011 the foreign unremitted earnings and U.S. federal and state income tax amounts were $8.9billion and $3.0 billion, respectively.
Effective Income Tax RateThe effective income tax rate was 20% in both 2012 and 2011, and 25% in 2010. As detailed in the income taxexpense reconciliation table above, the company’s effective tax rate differs from the U.S. federal statutory rateeach year due to certain operations that are subject to tax incentives, state and local taxes, and foreign taxes thatare different than the U.S. federal statutory rate. In addition, the effective tax rate can be impacted each period bydiscrete factors and events.
Factors impacting the company’s effective tax rate in 2012 were gains of $53 million and $38 million for thereduction of certain contingent payment liabilities related to the prior acquisitions of Prism and ApaTech,respectively, for which there were no tax charges. Also impacting the effective tax rate was a cost of salesreduction of $37 million for an adjustment to the COLLEAGUE infusion pump reserves when the companysubstantially completed the recall in the United States in 2012, for which there was no tax charge. These itemswere offset by a change in the earnings mix from lower tax to higher tax rate jurisdictions compared to the prioryear period.
The decrease in the effective tax rate in 2011 was primarily related to tax benefits from the business optimizationcharge, the average wholesale price (AWP) litigation and historical price reporting charge, and other charges in2011 which were incurred in jurisdictions with rates higher than the effective rate. Also impacting thecomparison of 2011 to 2010 were certain items that drove the 2010 rate higher including a charge of $588 millionin 2010 related to the recall of COLLEAGUE infusion pumps from the U.S. market for which there was no nettax benefit recognized, a $39 million write-off of a deferred tax asset in 2010 as a result of a change in the taxtreatment of reimbursements under the Medicare Part D retiree prescription drug subsidy program underhealthcare reform legislation enacted in the United States, and $34 million of business development charges in2010 for which the tax benefit was lower than the U.S. statutory rate.
Unrecognized Tax BenefitsThe company classifies interest and penalties associated with income taxes in the income tax expense line in theconsolidated statements of income. Net interest and penalties recorded during 2012, 2011 and 2010 were $12million, $18 million and $8 million, respectively. The liability recorded at December 31, 2012 and 2011 relatedto interest and penalties was $79 million and $67 million, respectively.
The following is a reconciliation of the company’s unrecognized tax benefits for the years ended December 31,2012, 2011 and 2010.
as of and for the years ended (in millions) 2012 2011 2010
Balance at beginning of the year . . . . . . . . . . . . . . . . . . . . . . . . . . . . . . . . . . . . . . . . . . . . . $443 $423 $403Increase associated with tax positions taken during the current year . . . . . . . . . . . . . . . . . 25 37 78Increase associated with tax positions taken during a prior year . . . . . . . . . . . . . . . . . . . . 31 15 —Settlements . . . . . . . . . . . . . . . . . . . . . . . . . . . . . . . . . . . . . . . . . . . . . . . . . . . . . . . . . . . . . (21) (18) (15)Decrease associated with lapses in statutes of limitations . . . . . . . . . . . . . . . . . . . . . . . . . (1) (14) (43)
Balance at end of the year . . . . . . . . . . . . . . . . . . . . . . . . . . . . . . . . . . . . . . . . . . . . . . . . . . $477 $443 $423
Of the gross unrecognized tax benefits, $517 million and $471 million were recognized as liabilities in theconsolidated balance sheets as of December 31, 2012 and 2011, respectively.
None of the positions included in the liability for uncertain tax positions related to tax positions for which theultimate deductibility is highly certain but for which there is uncertainty about the timing of such deductibility.
92

Tax IncentivesThe company has received tax incentives in Puerto Rico, Switzerland, and certain other taxing jurisdictionsoutside the United States. The financial impact of the reductions as compared to the U.S. federal statutory rate isindicated in the income tax expense reconciliation table above. The tax reductions as compared to the localstatutory rate favorably impacted earnings per diluted share by $0.50 in 2012, $0.56 in 2011 and $0.51 in 2010.The Puerto Rico grant provides that the company’s manufacturing operations will be partially exempt from localtaxes until the year 2018. The Switzerland grant provides that the company’s manufacturing operations will bepartially exempt from local taxes until the year 2014, at which time the tax rate will be approximately 8%. TheSwitzerland grant benefit that will expire at the end of 2013 represented approximately $0.08 of earnings perdiluted share in 2012. The tax incentives in the other jurisdictions continue through at least 2013.
Examinations of Tax ReturnsAs of December 31, 2012, Baxter had ongoing audits in the United States, Germany, Switzerland, Turkey, andother jurisdictions, as well as bilateral Advance Pricing Agreement proceedings that the company voluntarilyinitiated between the U.S. government and the government of Switzerland with respect to intellectual property,product, and service transfer pricing arrangements. Baxter expects to reduce the amount of its liability foruncertain tax positions within the next 12 months by $299 million due principally to the resolution of certainmulti-jurisdictional transfer pricing issues and the resolution of tax contingencies in certain foreign jurisdictions.While the final outcome of these matters is inherently uncertain, the company believes it has made adequate taxprovisions for all years subject to examination.
NOTE 13LEGAL PROCEEDINGS
Baxter is involved in product liability, patent, commercial, and other legal matters that arise in the normal courseof the company’s business. The company records a liability when a loss is considered probable and the amountcan be reasonably estimated. If the reasonable estimate of a probable loss is a range, and no amount within therange is a better estimate, the minimum amount in the range is accrued. If a loss is not probable or a probable losscannot be reasonably estimated, no liability is recorded. As of December 31, 2012, the company’s total recordedreserves with respect to legal matters were $113 million and the total related receivables were $33 million.
Baxter has established reserves for certain of the matters discussed below. The company is not able to estimatethe amount or range of any loss for certain contingencies for which there is no reserve or additional loss formatters already reserved. While the liability of the company in connection with the claims cannot be estimatedwith any certainty and although the resolution in any reporting period of one or more of these matters could havea significant impact on the company’s results of operations and cash flows for that period, the outcome of theselegal proceedings is not expected to have a material adverse effect on the company’s consolidated financialposition. While the company believes that it has valid defenses in these matters, litigation is inherently uncertain,excessive verdicts do occur, and the company may incur material judgments or enter into material settlements ofclaims.
In addition to the matters described below, the company remains subject to other potential administrative andlegal actions. With respect to governmental and regulatory matters, these actions may lead to product recalls,injunctions, and other restrictions on the company’s operations and monetary sanctions, including significantcivil or criminal penalties. With respect to intellectual property, the company may be exposed to significantlitigation concerning the scope of the company’s and others’ rights. Such litigation could result in a loss of patentprotection or the ability to market products, which could lead to a significant loss of sales, or otherwisematerially affect future results of operations.
93

Patent LitigationSince April 2003, Baxter has been pursuing a patent infringement action against Fresenius Medical CareHoldings, Inc. for infringement of certain Baxter patents. The patents cover Fresenius’ 2008K hemodialysisinstrument. In 2007, the court entered judgment in Baxter’s favor and in April 2008, the U.S.D.C. for theNorthern District of California granted Baxter’s motion for permanent injunction. In September 2009, theappellate court affirmed Fresenius’ liability for infringing valid claims of Baxter’s main patent, invalidatedcertain claims of other patents, and remanded the case to the district court. After a hearing in December 2011, thedistrict court entered an order in March 2012 awarding Baxter $9.3 million in royalties, which are in addition tothe past damages and interest of $20 million owed by Fresenius to Baxter. In March 2010, the United StatesPatent and Trademark Office’s (USPTO) appellate board affirmed the previous determination by the USPTOpatent examiner that the remaining patent was invalid. In February 2012, the Federal Circuit affirmed theUSPTO’s decision. Fresenius has appealed whether Baxter can collect on its judgment in view of the decision bythe USPTO. A hearing is expected to occur in the first half of 2013.
Product Liability LitigationIn connection with the recall of heparin products in the United States, approximately 400 lawsuits remainpending alleging that plaintiffs suffered various reactions to a heparin contaminant, in some cases resulting infatalities. The majority of these cases are subject to settlement agreements, but remain pending while settlementdocumentation is being completed.
General LitigationBaxter is a defendant in a number of suits alleging that certain of the company’s current and former executiveofficers and its board of directors failed to adequately oversee the operations of the company and issuedmaterially false and misleading statements regarding the company’s plasma-based therapies business, thecompany’s remediation of its COLLEAGUE infusion pumps, its heparin product, and other quality issues.Plaintiffs allege these actions damaged the company and its shareholders by resulting in a decline in stock pricein the second quarter of 2010, payment of excess compensation to the board of directors and certain of thecompany’s current and former executive officers, and other damage to the company. In September 2012, afederal court dismissed a consolidated derivative suit pending in the U.S.D.C. for the Northern District ofIllinois, and in October 2012, the plaintiffs appealed this dismissal to the U.S. Court of Appeals for the SeventhCircuit. An action pending in the Circuit Court of Lake County, Illinois has been stayed pending the outcome ofthe federal action. In addition, a consolidated alleged class action is pending in the U.S.D.C. for the NorthernDistrict of Illinois against the company and certain of its current executive officers seeking to recover the lostvalue of investors’ stock. In January 2012, the court denied the company’s motion to dismiss certain of theclaims related to the class action suits. In April 2012, the court granted the company’s motion to certify an appealof that decision to the U.S. Court of Appeals for the Seventh Circuit, however that motion was denied by theappellate court in June 2012.
The company is a defendant, along with others, in a number of lawsuits consolidated for pretrial proceedings inthe U.S.D.C. for the Northern District of Illinois alleging that Baxter and certain of its competitors conspired torestrict output and artificially increase the price of plasma-derived therapies since 2003. The complaints attemptto state a claim for class action relief and in some cases demand treble damages. In February 2011, the courtdenied the company’s motion to dismiss certain of the claims and the parties are proceeding with discovery. InJanuary 2012, the court granted the company’s motion to dismiss certain federal claims brought by indirectpurchasers. The trial court returned the remaining indirect purchaser claims to the court of original jurisdiction(U.S.D.C. for the Northern District of California) in August 2012.
OtherIn October 2005, the United States filed a complaint in the U.S.D.C. for the Northern District of Illinois to effectthe seizure of COLLEAGUE and SYNDEO infusion pumps that were on hold in Northern Illinois. In June 2006,
94

Baxter Healthcare Corporation entered into a Consent Decree for Condemnation and Permanent Injunction withthe United States to resolve this seizure litigation. Pursuant to the Consent Decree, on July 13, 2010 FDA issueda final order regarding the recall of the company’s COLLEAGUE infusion pumps then in use in the UnitedStates. The company substantially completed the recall in July 2012 and FDA closed the recall in November2012. Additional claims may be raised in connection with the COLLEAGUE matter by the United States or otherthird parties.
In March 2012, the company received a subpoena from the SEC requesting the production of documents andother records related to the company’s accounting treatment, financial reporting and disclosures relating to theremediation and recall of the company’s COLLEAGUE and SYNDEO infusion pumps. In December 2012, thecompany was informed by the SEC that this investigation was completed with no recommendation forenforcement.
The company has received an inquiry from the U.S. Department of Justice and the SEC requesting that thecompany provide information about its business activities in a number of countries. The company isfully cooperating with the agencies and understands that this inquiry is part of a broader review of industrypractices for compliance with the U.S. Foreign Corrupt Practices Act.
In the fourth quarter of 2012, the company received two investigative demands from the United States Attorneyfor the Western District of North Carolina for information regarding its quality and manufacturing practices andprocedures at its North Cove facility. The company is fully cooperating with this investigation.
NOTE 14SEGMENT INFORMATION
Baxter’s two segments, BioScience and Medical Products, are strategic businesses that are managed separatelybecause each business develops, manufactures and markets distinct products and services. The segments and adescription of their products and services are as follows:
The BioScience business processes recombinant and plasma-based proteins to treat hemophilia and otherbleeding disorders; plasma-based therapies to treat immune deficiencies, alpha-1 antitrypsin deficiency, burnsand shock, and other chronic and acute blood-related conditions; biosurgery products; and select vaccines.
The Medical Products business manufactures IV solutions and administration sets, premixed drugs and drug-reconstitution systems, pre-filled vials and syringes for injectable drugs, IV nutrition products, infusion pumps,and inhalation anesthetics. The business also provides products and services related to pharmacy compounding,drug formulation and packaging technologies. In addition, the Medical Products business provides products andservices to treat end-stage renal disease, or irreversible kidney failure. The business manufactures solutions andother products for peritoneal dialysis (PD), a home-based therapy, and also distributes products for hemodialysis,which is generally conducted in a hospital or clinic. In May 2011, the company completed the divestiture of itsU.S. multi-source generic injectables business. Refer to Note 2 for further information regarding this divestiture.
Also included in the Medical Products business are revenues and costs related to the manufacturing, distributionand other transition agreements with Fenwal Inc. associated with the 2007 divestiture of the TransfusionTherapies business. Post-divestiture revenues associated with these transition agreements, which had previouslybeen reported at the corporate level (Corporate) and not allocated to a segment, totaled $38 million, $36 millionand $46 million in 2012, 2011 and 2010, respectively. The prior period segment presentation has been recast toconform to the current period presentation.
The company uses more than one measurement and multiple views of data to measure segment performance andto allocate resources to the segments. However, the dominant measurements are consistent with the company’s
95

consolidated financial statements and, accordingly, are reported on the same basis in this report. The companyevaluates the performance of its segments and allocates resources to them primarily based on pre-tax incomealong with cash flows and overall economic returns. Intersegment sales are generally accounted for at amountscomparable to sales to unaffiliated customers, and are eliminated in consolidation. The accounting policies of thesegments are substantially the same as those described in the summary of significant accounting policies inNote 1.
Effective in 2012, the segment measures of total assets and capital expenditures reflect a re-allocation of certainassets between segments to reflect management’s use of updated segment measures to allocate resources. Theprior period presentation has been recast to conform to the current period presentation. The impact on thesegment measures in prior periods was a shift between Medical Products and BioScience of $988 million and $25million for total assets and capital expenditures in 2011, respectively, and $901 million and $43 million for totalassets and capital expenditures in 2010, respectively. The company considered the impact of this re-allocation onthe goodwill impairment reviews completed in prior years and there was no impact as the fair values of thecompany’s reporting units were substantially in excess of the carrying values.
Certain items are maintained at Corporate and are not allocated to a segment. They primarily include most of thecompany’s debt and cash and equivalents and related net interest expense, certain foreign exchange fluctuations(principally relating to intercompany receivables, payables and loans denominated in a foreign currency) and themajority of the foreign currency hedging activities, corporate headquarters costs, stock compensation expense,certain non-strategic investments and related income and expense, certain employee benefit plan costs (includingthe 2012 pension settlement charges), certain nonrecurring gains and losses, certain other charges (such as thebusiness optimization, AWP litigation and historical price reporting, asset impairment, and certain businessdevelopment charges), contributions to the Baxter International Foundation, deferred income taxes, and certainlitigation liabilities and related receivables. With respect to depreciation and amortization and expenditures forlong-lived assets, the difference between the segment totals and the consolidated totals principally relate to assetsmaintained at Corporate.
In 2012, the BioScience segment’s pre-tax income included charges related to business development activities of$123 million, which principally related to R&D charges of $33 million associated with the company’scollaboration with Momenta, $30 million associated with the company’s collaboration with Chatham and $50million associated with the company’s agreement with Onconova. Additionally, the BioScience segment’s pre-tax income included a gain of $38 million related to the reduction of the contingent payment liability for certainmilestones associated with the 2010 acquisition of ApaTech.
In 2012, the Medical Products segment’s pre-tax income included a gain of $53 million related to the reductionof a contingent payment liability for certain milestones associated with the 2011 acquisition of Prism and a netbenefit from reserve adjustments of $23 million, which primarily related to an adjustment to the COLLEAGUEinfusion pump reserves. In 2010, the Medical Products segment’s pre-tax income included a charge of $588million related to COLLEAGUE and SYNDEO infusion pumps. Refer to Note 6 for further informationregarding this charge. Also included in the Medical Products segment’s pre-tax income in 2010 was a $112million impairment charge associated with the company’s divestiture of its U.S. multi-source generic injectablesbusiness and a $62 million charge related to litigation associated with the company’s 2008 recall of its heparinsodium injection products in the United States.
Significant charges not allocated to a segment in 2012 included pension settlement charges of $168 millionprimarily related to the U.S. pension plan, as further discussed in Note 11, and a $150 million charge related tobusiness optimization initiatives, as further discussed in Note 6. Significant charges not allocated to a segment in2011 included a $192 million charge related to business optimization initiatives, as further discussed in Note 6,charges totaling $103 million principally related to the write-down of Greek government bonds and acontribution to the Baxter International Foundation, and a charge totaling $79 million related to AWP litigationand historical price reporting. Significant charges not allocated to a segment in 2010 included a $257 million
96

charge related to business optimization initiatives, as further discussed in Note 6, a charge of $28 million to writedown accounts receivable in Greece, and business development charges of $34 million.
Segment Information
as of and for the years ended December 31 (in millions) BioScienceMedicalProducts Other Total
2012Net sales . . . . . . . . . . . . . . . . . . . . . . . . . . . . . . . . . . . . . . . . . . . . . . . . . . $6,237 $7,953 $ — $14,190Depreciation and amortization . . . . . . . . . . . . . . . . . . . . . . . . . . . . . . . . . 243 385 84 712Pre-tax income (loss) . . . . . . . . . . . . . . . . . . . . . . . . . . . . . . . . . . . . . . . . 2,309 1,592 (1,012) 2,889Assets . . . . . . . . . . . . . . . . . . . . . . . . . . . . . . . . . . . . . . . . . . . . . . . . . . . . 7,380 7,568 5,442 20,390Capital expenditures . . . . . . . . . . . . . . . . . . . . . . . . . . . . . . . . . . . . . . . . . 570 495 96 1,161
2011Net sales . . . . . . . . . . . . . . . . . . . . . . . . . . . . . . . . . . . . . . . . . . . . . . . . . . $6,053 $7,840 $ — $13,893Depreciation and amortization . . . . . . . . . . . . . . . . . . . . . . . . . . . . . . . . . 209 341 120 670Pre-tax income (loss) . . . . . . . . . . . . . . . . . . . . . . . . . . . . . . . . . . . . . . . . 2,416 1,522 (1,129) 2,809Assets . . . . . . . . . . . . . . . . . . . . . . . . . . . . . . . . . . . . . . . . . . . . . . . . . . . . 6,533 7,495 5,045 19,073Capital expenditures . . . . . . . . . . . . . . . . . . . . . . . . . . . . . . . . . . . . . . . . . 370 467 123 960
2010Net sales . . . . . . . . . . . . . . . . . . . . . . . . . . . . . . . . . . . . . . . . . . . . . . . . . . $5,640 $7,203 $ — $12,843Depreciation and amortization . . . . . . . . . . . . . . . . . . . . . . . . . . . . . . . . . 211 401 73 685Pre-tax income (loss) . . . . . . . . . . . . . . . . . . . . . . . . . . . . . . . . . . . . . . . . 2,232 663 (1,005) 1,890Assets . . . . . . . . . . . . . . . . . . . . . . . . . . . . . . . . . . . . . . . . . . . . . . . . . . . . 6,165 6,604 4,720 17,489Capital expenditures . . . . . . . . . . . . . . . . . . . . . . . . . . . . . . . . . . . . . . . . . 410 409 144 963
Pre-Tax Income Reconciliationyears ended December 31 (in millions) 2012 2011 2010
Total pre-tax income from segments . . . . . . . . . . . . . . . . . . . . . . . . . . . . . . . . . . . . . $3,901 $3,938 $2,895Unallocated amounts
Net interest expense . . . . . . . . . . . . . . . . . . . . . . . . . . . . . . . . . . . . . . . . . . . . . . (87) (54) (87)Certain foreign exchange fluctuations and hedging activities . . . . . . . . . . . . . . 53 (16) 52Stock compensation . . . . . . . . . . . . . . . . . . . . . . . . . . . . . . . . . . . . . . . . . . . . . . (130) (119) (120)Business optimization charges . . . . . . . . . . . . . . . . . . . . . . . . . . . . . . . . . . . . . . (150) (192) (257)AWP litigation and historical price reporting charge . . . . . . . . . . . . . . . . . . . . — (79) —Asset impairment and other charges . . . . . . . . . . . . . . . . . . . . . . . . . . . . . . . . . — (103) (28)Pension settlement charges . . . . . . . . . . . . . . . . . . . . . . . . . . . . . . . . . . . . . . . . (168) — —Other Corporate items . . . . . . . . . . . . . . . . . . . . . . . . . . . . . . . . . . . . . . . . . . . . (530) (566) (565)
Consolidated income before income taxes . . . . . . . . . . . . . . . . . . . . . . . . . . . . . . . . . $2,889 $2,809 $1,890
Assets Reconciliationas of December 31 (in millions) 2012 2011
Total segment assets . . . . . . . . . . . . . . . . . . . . . . . . . . . . . . . . . . . . . . . . . . . . . . . . . . . . . . . . . $14,948 $14,028Cash and equivalents . . . . . . . . . . . . . . . . . . . . . . . . . . . . . . . . . . . . . . . . . . . . . . . . . . . . . 3,270 2,905Deferred income taxes . . . . . . . . . . . . . . . . . . . . . . . . . . . . . . . . . . . . . . . . . . . . . . . . . . . . 1,500 1,418PP&E, net . . . . . . . . . . . . . . . . . . . . . . . . . . . . . . . . . . . . . . . . . . . . . . . . . . . . . . . . . . . . . 461 464Other Corporate assets . . . . . . . . . . . . . . . . . . . . . . . . . . . . . . . . . . . . . . . . . . . . . . . . . . . 211 258
Consolidated total assets . . . . . . . . . . . . . . . . . . . . . . . . . . . . . . . . . . . . . . . . . . . . . . . . . . . . . . $20,390 $19,073
97

Geographic Information
Net sales are based on product shipment destination and assets are based on physical location.
years ended December 31 (in millions) 2012 2011 2010
Net salesUnited States . . . . . . . . . . . . . . . . . . . . . . . . . . . . . . . . . . . . . . . . . . . . . . . . . . . . . . $ 6,056 $ 5,709 $ 5,264Europe . . . . . . . . . . . . . . . . . . . . . . . . . . . . . . . . . . . . . . . . . . . . . . . . . . . . . . . . . . . 4,196 4,392 4,188Asia-Pacific . . . . . . . . . . . . . . . . . . . . . . . . . . . . . . . . . . . . . . . . . . . . . . . . . . . . . . . 2,229 2,107 1,873Latin America and Canada . . . . . . . . . . . . . . . . . . . . . . . . . . . . . . . . . . . . . . . . . . . . 1,709 1,685 1,518
Consolidated net sales . . . . . . . . . . . . . . . . . . . . . . . . . . . . . . . . . . . . . . . . . . . . . . . $14,190 $13,893 $12,843
as of December 31 (in millions) 2012 2011 2010
Total assetsUnited States . . . . . . . . . . . . . . . . . . . . . . . . . . . . . . . . . . . . . . . . . . . . . . . . . . . . . . $ 8,034 $ 7,524 $ 6,886Europe . . . . . . . . . . . . . . . . . . . . . . . . . . . . . . . . . . . . . . . . . . . . . . . . . . . . . . . . . . . 8,597 8,096 6,789Asia-Pacific . . . . . . . . . . . . . . . . . . . . . . . . . . . . . . . . . . . . . . . . . . . . . . . . . . . . . . . 1,943 1,807 1,577Latin America and Canada . . . . . . . . . . . . . . . . . . . . . . . . . . . . . . . . . . . . . . . . . . . . 1,816 1,646 2,237
Consolidated total assets . . . . . . . . . . . . . . . . . . . . . . . . . . . . . . . . . . . . . . . . . . . . . $20,390 $19,073 $17,489
as of December 31 (in millions) 2012 2011 2010
PP&E, netUnited States . . . . . . . . . . . . . . . . . . . . . . . . . . . . . . . . . . . . . . . . . . . . . . . . . . . . . . $2,333 $2,091 $2,072Austria . . . . . . . . . . . . . . . . . . . . . . . . . . . . . . . . . . . . . . . . . . . . . . . . . . . . . . . . . . . 802 786 787Other countries . . . . . . . . . . . . . . . . . . . . . . . . . . . . . . . . . . . . . . . . . . . . . . . . . . . . . 2,963 2,648 2,401
Consolidated PP&E, net . . . . . . . . . . . . . . . . . . . . . . . . . . . . . . . . . . . . . . . . . . . . . . $6,098 $5,525 $5,260
Significant Product Sales
The following is a summary of net sales as a percentage of consolidated net sales for the company’s principalproduct categories.
years ended December 31 2012 2011 2010
Renal1 . . . . . . . . . . . . . . . . . . . . . . . . . . . . . . . . . . . . . . . . . . . . . . . . . . . . . . . . . . . 18% 18% 19%Recombinants2 . . . . . . . . . . . . . . . . . . . . . . . . . . . . . . . . . . . . . . . . . . . . . . . . . . . . 16% 16% 16%Global Injectables3 . . . . . . . . . . . . . . . . . . . . . . . . . . . . . . . . . . . . . . . . . . . . . . . . . 15% 14% 15%IV Therapies4 . . . . . . . . . . . . . . . . . . . . . . . . . . . . . . . . . . . . . . . . . . . . . . . . . . . . . 14% 13% 13%Antibody Therapy5 . . . . . . . . . . . . . . . . . . . . . . . . . . . . . . . . . . . . . . . . . . . . . . . . . 11% 11% 11%Plasma Proteins6 . . . . . . . . . . . . . . . . . . . . . . . . . . . . . . . . . . . . . . . . . . . . . . . . . . 10% 10% 11%
1 Consists of PD and HD therapies.2 Consists of recombinant FVIII therapies.3 Primarily consists of the company’s enhanced packaging, premixed drugs, pharmacy compounding,
pharmaceutical partnering business and generic injectables. The company divested its U.S. multi-sourcegeneric injectables business in May 2011.
4 Principally includes IV solutions and nutritional products.5 Primarily consists of the company’s liquid formulation of the antibody-replacement therapy immunoglobulin
product (GAMMAGARD LIQUID).6 Includes plasma-based therapies such as plasma-derived hemophilia (FVII, FVIII and FEIBA), albumin and
alpha-1 antitrypsin products.
98

NOTE 15SUBSEQUENT EVENT
Inspiration BioPharmaceuticals, Inc. / Ipsen Pharma S.A.S.In January 2013, Baxter agreed to acquire the investigational hemophilia compound OBI-1 and related assetsfrom Inspiration BioPharmaceuticals, Inc. (Inspiration), as well as certain other OBI-1 related assets, includingmanufacturing operations, from Ipsen Pharma S.A.S. in conjunction with Inspiration’s ongoing bankruptcyproceedings. OBI-1 is a recombinant porcine factor VIII (rpFVIII) being investigated for treatment of bleeding inpeople with acquired hemophilia A and congenital hemophilia A patients with inhibitors, and is currently inPhase III clinical studies.
Under the terms of the agreement, Baxter will make an upfront payment of $50 million for the OBI-1 assets,including the manufacturing operations. In the future, Baxter may make payments of up to $20 million based onregulatory approval of the acquired hemophilia A indication in the United States and first additional country.Additional payments may be due upon approval of additional indications, through net sales payments, and assales milestones when sales exceed $100 million. The transaction is subject to regulatory approval and iscurrently under review by the Federal Trade Commission.
99

NOTE 16QUARTERLY FINANCIAL RESULTS AND MARKET FOR THE COMPANY’S STOCK(UNAUDITED)
years ended December 31 (in millions, except per share data)First
quarterSecondquarter
Thirdquarter
Fourthquarter Full year
2012Net sales . . . . . . . . . . . . . . . . . . . . . . . . . . . . . . . . . . . $3,388 $3,572 $3,477 $3,753 $14,190Gross margin1 . . . . . . . . . . . . . . . . . . . . . . . . . . . . . . . 1,714 1,872 1,810 1,905 7,301Net income attributable to Baxter1 . . . . . . . . . . . . . . . 588 661 583 494 2,326Earnings per common share1
Basic . . . . . . . . . . . . . . . . . . . . . . . . . . . . . . . . . . . . 1.05 1.20 1.07 0.90 4.22Diluted . . . . . . . . . . . . . . . . . . . . . . . . . . . . . . . . . . 1.04 1.19 1.06 0.89 4.18
Cash dividends declared per common share . . . . . . . 0.335 0.335 0.45 0.45 1.57Market price per common share
High . . . . . . . . . . . . . . . . . . . . . . . . . . . . . . . . . . . . 60.26 60.27 61.15 68.81 68.81Low . . . . . . . . . . . . . . . . . . . . . . . . . . . . . . . . . . . . . 49.66 49.03 53.58 60.09 49.03
2011Net sales . . . . . . . . . . . . . . . . . . . . . . . . . . . . . . . . . . . $3,284 $3,536 $3,479 $3,594 $13,893Gross margin2 . . . . . . . . . . . . . . . . . . . . . . . . . . . . . . . 1,675 1,835 1,771 1,765 7,046Net income attributable to Baxter2 . . . . . . . . . . . . . . . 570 615 576 463 2,224Earnings per common share2
Basic . . . . . . . . . . . . . . . . . . . . . . . . . . . . . . . . . . . . 0.99 1.08 1.02 0.82 3.91Diluted . . . . . . . . . . . . . . . . . . . . . . . . . . . . . . . . . . 0.98 1.07 1.01 0.82 3.88
Cash dividends declared per common share . . . . . . . 0.31 0.31 0.31 0.335 1.265Market price per common share
High . . . . . . . . . . . . . . . . . . . . . . . . . . . . . . . . . . . . 53.91 60.33 62.41 57.05 62.41Low . . . . . . . . . . . . . . . . . . . . . . . . . . . . . . . . . . . . . 48.38 53.55 50.31 47.65 47.65
1 The first quarter of 2012 included a $53 million gain related to the reduction of a contingent payment liabilityfor certain milestones associated with the 2011 acquisition of Prism and business development charges of $48million which primarily related to an R&D charge associated with the company’s collaboration with Momenta.The second quarter of 2012 included a $38 million gain related to the reduction of a contingent paymentliability for certain milestones associated with the 2010 acquisition of ApaTech, business development chargesof $30 million which related to an R&D charge associated with the company’s collaboration with Chathamand a $23 million net benefit from reserve adjustments which primarily related to an adjustment to theCOLLEAGUE infusion pump reserves. The third quarter of 2012 included an R&D charge of $50 millionrelated to the company’s agreement with Onconova. The fourth quarter of 2012 included charges of $170million primarily related to the settlement of certain pension obligations and $150 million related to businessoptimization initiatives (of which $62 million was recorded in cost of sales). Refer to Notes 4, 6, 8, and 11 forfurther information regarding these items.
2 The third quarter of 2011 included a $79 million charge related to the resolution of litigation pertaining toAWP and certain historical rebate and discount adjustments. The fourth quarter of 2011 included a $192million charge related to business optimization initiatives (of which $95 million was recorded in cost of sales)and charges totaling $103 million principally related to the write-down of Greek government bonds and acontribution to the Baxter International Foundation.
Baxter common stock is listed on the New York, Chicago and SIX Swiss stock exchanges. The New York StockExchange is the principal market on which the company’s common stock is traded. At January 31, 2013, therewere 41,770 holders of record of the company’s common stock.
100

Management’s Responsibility for Consolidated Financial Statements
Management is responsible for the preparation of the company’s consolidated financial statements and relatedinformation appearing in this report. Management believes that the consolidated financial statements fairlyreflect the form and substance of transactions and that the financial statements reasonably present the company’sfinancial position, results of operations and cash flows in conformity with accounting principles generallyaccepted in the United States of America. Management has also included in the company’s consolidated financialstatements amounts that are based on estimates and judgments, which it believes are reasonable under thecircumstances.
PricewaterhouseCoopers LLP, an independent registered public accounting firm, has audited the company’sconsolidated financial statements in accordance with the standards established by the Public CompanyAccounting Oversight Board and provides an opinion on whether the consolidated financial statements presentfairly, in all material respects, the financial position, results of operations and cash flows of the company.
Management’s Report on Internal Control Over Financial Reporting
Management is responsible for establishing and maintaining adequate internal control over financial reporting, asdefined in Rules 13a-15(f) and 15d-15(f) under the Securities Exchange Act of 1934, as amended. Thecompany’s internal control over financial reporting is a process designed under the supervision of the principalexecutive and financial officers, and effected by the board of directors, management and other personnel, toprovide reasonable assurance regarding the reliability of financial reporting and the preparation of financialstatements for external purposes in accordance with accounting principles generally accepted in the United Statesof America.
Management performed an assessment of the effectiveness of the company’s internal control over financialreporting as of December 31, 2012. In making this assessment, management used the framework in InternalControl-Integrated Framework issued by the Committee of Sponsoring Organizations of the TreadwayCommission.
Based on that assessment under the framework in Internal Control-Integrated Framework, managementconcluded that the company’s internal control over financial reporting was effective as of December 31, 2012.The effectiveness of the company’s internal control over financial reporting as of December 31, 2012 has beenaudited by PricewaterhouseCoopers LLP, an independent registered public accounting firm, as stated in theirreport which appears herein.
/s/ ROBERT L. PARKINSON, JR.Robert L. Parkinson, Jr.Chairman of the Board andChief Executive Officer
/s/ ROBERT J. HOMBACHRobert J. HombachCorporate Vice President andChief Financial Officer
101

Report of Independent Registered Public Accounting Firm
To the Board of Directors and Shareholders of Baxter International Inc.:
In our opinion, the consolidated financial statements listed in the index appearing under Item 15(1) present fairly,in all material respects, the financial position of Baxter International Inc. and its subsidiaries at December 31,2012 and December 31, 2011, and the results of their operations and their cash flows for each of the three yearsin the period ended December 31, 2012 in conformity with accounting principles generally accepted in theUnited States of America. Also in our opinion, the company maintained, in all material respects, effectiveinternal control over financial reporting as of December 31, 2012, based on criteria established in InternalControl - Integrated Framework issued by the Committee of Sponsoring Organizations of the TreadwayCommission (COSO). The company’s management is responsible for these financial statements, for maintainingeffective internal control over financial reporting and for its assessment of the effectiveness of internal controlover financial reporting, included in Management’s Report on Internal Control over Financial Reportingincorporated by reference under Item 9A. Our responsibility is to express opinions on these financial statementsand on the company’s internal control over financial reporting based on our integrated audits. We conducted ouraudits in accordance with the standards of the Public Company Accounting Oversight Board (United States).Those standards require that we plan and perform the audits to obtain reasonable assurance about whether thefinancial statements are free of material misstatement and whether effective internal control over financialreporting was maintained in all material respects. Our audits of the financial statements included examining, on atest basis, evidence supporting the amounts and disclosures in the financial statements, assessing the accountingprinciples used and significant estimates made by management, and evaluating the overall financial statementpresentation. Our audit of internal control over financial reporting included obtaining an understanding ofinternal control over financial reporting, assessing the risk that a material weakness exists, and testing andevaluating the design and operating effectiveness of internal control based on the assessed risk. Our audits alsoincluded performing such other procedures as we considered necessary in the circumstances. We believe that ouraudits provide a reasonable basis for our opinions.
A company’s internal control over financial reporting is a process designed to provide reasonable assuranceregarding the reliability of financial reporting and the preparation of financial statements for external purposes inaccordance with generally accepted accounting principles. A company’s internal control over financial reportingincludes those policies and procedures that (i) pertain to the maintenance of records that, in reasonable detail,accurately and fairly reflect the transactions and dispositions of the assets of the company; (ii) provide reasonableassurance that transactions are recorded as necessary to permit preparation of financial statements in accordancewith generally accepted accounting principles, and that receipts and expenditures of the company are being madeonly in accordance with authorizations of management and directors of the company; and (iii) provide reasonableassurance regarding prevention or timely detection of unauthorized acquisition, use, or disposition of thecompany’s assets that could have a material effect on the financial statements.
Because of its inherent limitations, internal control over financial reporting may not prevent or detectmisstatements. Also, projections of any evaluation of effectiveness to future periods are subject to the risk thatcontrols may become inadequate because of changes in conditions, or that the degree of compliance with thepolicies or procedures may deteriorate.
/s/ PricewaterhouseCoopers LLPChicago, IllinoisFebruary 21, 2013
102

Item 9. Changes in and Disagreements with Accountants on Accounting and Financial Disclosure.
None.
Item 9A. Controls and Procedures.
Evaluation of Disclosure Controls and Procedures
Baxter carried out an evaluation, under the supervision and with the participation of its Disclosure Committeeand management, including the Chief Executive Officer and Chief Financial Officer, of the effectiveness ofBaxter’s disclosure controls and procedures (as defined in Rules 13a-15(e) and 15d-15(e) under the ExchangeAct) as of December 31, 2012. Baxter’s disclosure controls and procedures are designed to ensure thatinformation required to be disclosed by Baxter in the reports it files or submits under the Exchange Act isrecorded, processed, summarized and reported on a timely basis and that such information is communicated tomanagement, including the Chief Executive Officer, Chief Financial Officer and its board of directors, to allowtimely decisions regarding required disclosure.
Based on that evaluation the Chief Executive Officer and Chief Financial Officer concluded that the company’sdisclosure controls and procedures were effective as of December 31, 2012.
Assessment of Internal Control Over Financial Reporting
Baxter’s report of management’s assessment of the effectiveness of its internal control over financial reporting asof December 31, 2012 and the audit report regarding the same of Baxter’s independent auditor,PricewaterhouseCoopers LLP, an independent registered public accounting firm, are included in this AnnualReport on Form 10-K and are incorporated herein by reference.
Changes in Internal Control over Financial Reporting
In the second quarter of 2010, the company began the implementation of a new global enterprise resourceplanning system. In addition, the company is consolidating and outsourcing certain computer operations andapplication support activities. These multi-year initiatives will be conducted in phases and include modificationsto the design and operation of controls over financial reporting. The company is testing internal controls overfinancial reporting for design effectiveness prior to implementation of each phase, and has monitoring controls inplace over the implementation of these changes. There have been no other changes in Baxter’s internal controlover financial reporting (as such term is defined in Rules 13a-15(f) and 15d-15(f) under the Exchange Act)during the quarter ended December 31, 2012 that have materially affected, or are reasonably likely to materiallyaffect, Baxter’s internal control over financial reporting.
Item 9B. Other Information.
None.
PART III
Item 10. Directors, Executive Officers and Corporate Governance.
Refer to information under the captions entitled “Proposal 1 — Election of Directors,” “Committees of the Board— Audit Committee,” “Corporate Governance — Director Qualifications,” “Corporate Governance — Code ofConduct,” and “Section 16(a) Beneficial Ownership Reporting Compliance” in Baxter’s definitive proxystatement to be filed with the Securities and Exchange Commission and delivered to shareholders in connectionwith the Annual Meeting of Shareholders to be held on May 7, 2013 (the Proxy Statement), all of whichinformation is incorporated herein by reference. Also refer to information regarding executive officers of Baxterunder the caption entitled “Executive Officers of the Registrant” in Part I of this Annual Report on Form 10-K.
103

Item 11. Executive Compensation.
Refer to information under the captions entitled “Executive Compensation”, “Compensation Committee Report”,and “Director Compensation” in the Proxy Statement, all of which information is incorporated herein byreference.
Item 12. Security Ownership of Certain Beneficial Owners and Management and Related StockholderMatters.
EQUITY COMPENSATION PLAN INFORMATION
The following table provides information relating to shares of common stock that may be issued under Baxter’sexisting equity compensation plans as of December 31, 2012.
Plan Category
Number of Sharesto be Issued upon
Exercise ofOutstanding
Options,Warrants and
Rights (a)
Weighted-AverageExercise Price of
OutstandingOptions, Warrants
and Rights (b)
Number of Shares RemainingAvailable for Future Issuance
Under Equity Compensation Plans(Excluding Shares Reflected in
Column (a)) (c)
Equity Compensation Plans Approvedby Shareholders . . . . . . . . . . . . . . . . . . . 34,889,914(1) $52.74(2) 50,159,864(3)
Equity Compensation Plans NotApproved by Shareholders . . . . . . . . . . 500,264(4) $44.76 —
Total . . . . . . . . . . . . . . . . . . . . . . . . . . . . . 35,390,178(5) $52.62(2) 50,159,864
(1) Excludes purchase rights under the Employee Stock Purchase Plan. Under the Employee Stock PurchasePlan, eligible employees may purchase shares of common stock through payroll deductions of up to15 percent of base pay at a purchase price equal to 85 percent of the closing market price on the purchasedate (as defined by the Employee Stock Purchase Plan). A participating employee may not purchase morethan $25,000 in fair market value of common stock under the Employee Stock Purchase Plan in anycalendar year and may withdraw from the Employee Stock Purchase Plan at any time.
(2) Restricted stock units and performance share units are excluded when determining the weighted-averageexercise price of outstanding options.
(3) Includes (i) 8,728,827 shares of common stock available for purchase under the Employee Stock PurchasePlan; (ii) 51,673 shares of common stock available under the 2003 Incentive Compensation Program;(iii) 1,801,493 shares of common stock available under the 2007 Incentive Plan, and (iv) 39,577,871 sharesof common stock available under the 2011 Incentive Plan. Pursuant to the terms of the 2003 IncentiveCompensation Program no grants may be issued thereunder after May 6, 2013.
(4) Includes shares of common stock issuable upon exercise of options granted under the 2001 IncentiveCompensation Program. These shares were made available pursuant to an amendment thereto not approvedby shareholders. These additional shares were approved by the company’s board of directors, not thecompany’s shareholders, although the company shareholders have approved the 2001 IncentiveCompensation Program.
(5) Includes outstanding awards of 32,055,363 stock options, which have a weighted-average exercise price of$52.62 and a weighted-average remaining term of 6.2 years, 2,033,368 shares of common stock issuableupon vesting of restricted stock units, and 1,301,447 shares of common stock reserved for issuance inconnection with performance share unit grants.
Refer to information under the captions entitled “Security Ownership by Directors and Executive Officers” and“Security Ownership by Certain Beneficial Owners” in the Proxy Statement, all of which information isincorporated herein by reference.
104

Item 13. Certain Relationships and Related Transactions, and Director Independence.
Refer to the information under the captions entitled “Board of Directors,” “Corporate Governance — DirectorIndependence” and “Certain Relationships and Related Transactions” in the Proxy Statement, all of whichinformation is incorporated herein by reference.
Item 14. Principal Accountant Fees and Services.
Refer to the information under the caption entitled “Audit and Non-Audit Fees” in the Proxy Statement, all ofwhich information is incorporated herein by reference.
PART IV
Item 15. Exhibits and Financial Statement Schedules.
The following documents are filed as a part of this report:
PageNumber
(1) Financial Statements:Consolidated Balance Sheets . . . . . . . . . . . . . . . . . . . . . . . . . . . . . . . . . . . . . . . . . . . . . . . . . . . . . . . 47Consolidated Statements of Income . . . . . . . . . . . . . . . . . . . . . . . . . . . . . . . . . . . . . . . . . . . . . . . . . . 48Consolidated Statements of Comprehensive Income . . . . . . . . . . . . . . . . . . . . . . . . . . . . . . . . . . . . . 49Consolidated Statements of Cash Flows . . . . . . . . . . . . . . . . . . . . . . . . . . . . . . . . . . . . . . . . . . . . . . . 50Consolidated Statements of Changes in Equity . . . . . . . . . . . . . . . . . . . . . . . . . . . . . . . . . . . . . . . . . 51Notes to Consolidated Financial Statements . . . . . . . . . . . . . . . . . . . . . . . . . . . . . . . . . . . . . . . . . . . . 52Report of Independent Registered Public Accounting Firm . . . . . . . . . . . . . . . . . . . . . . . . . . . . . . . . 102
(2) Schedules required by Article 12 of Regulation S-X:Report of Independent Registered Public Accounting Firm on Financial Statement Schedule . . . . . 111Schedule II — Valuation and Qualifying Accounts . . . . . . . . . . . . . . . . . . . . . . . . . . . . . . . . . . . . . . 112All other schedules have been omitted because they are not applicable or not required.
(3) Exhibits required by Item 601 of Regulation S-K are listed in the Exhibit Index, which isincorporated herein by reference. Exhibits in the Exhibit Index marked with a “C” in the leftmargin constitute management contracts or compensatory plans or arrangements contemplated byItem 15(b) of Form 10-K.
105

SIGNATURES
Pursuant to the requirements of Section 13 or 15(d) of the Securities Exchange Act of 1934, the registranthas duly caused this report to be signed on its behalf by the undersigned, thereunto duly authorized.
BAXTER INTERNATIONAL INC.
By: /s/ ROBERT L. PARKINSON, JR.
Robert L. Parkinson, Jr.Chairman and Chief Executive Officer
DATE: February 21, 2013
Pursuant to the requirements of the Securities Exchange Act of 1934, this report has been signed below bythe following persons on behalf of the registrant and in the capacities indicated on February 21, 2013.
Signature Title
/s/ ROBERT L. PARKINSON, JR. Chairman and Chief Executive Officer(principal executive officer)Robert L. Parkinson, Jr.
/s/ ROBERT J. HOMBACH Corporate Vice President and Chief Financial Officer(principal financial officer)Robert J. Hombach
/s/ MICHAEL J. BAUGHMAN Corporate Vice President and Controller(principal accounting officer)Michael J. Baughman
/s/ THOMAS F. CHEN Director
Thomas F. Chen
/s/ UMA CHOWDHRY, PH.D. Director
Uma Chowdhry, Ph.D.
/s/ BLAKE E. DEVITT Director
Blake E. Devitt
/s/ JOHN D. FORSYTH Director
John D. Forsyth
/s/ GAIL D. FOSLER Director
Gail D. Fosler
/s/ JAMES R. GAVIN III, M.D., PH.D. Director
James R. Gavin III, M.D., Ph.D.
/s/ PETER S. HELLMAN Director
Peter S. Hellman
/s/ WAYNE T. HOCKMEYER, PH.D. Director
Wayne T. Hockmeyer, Ph.D.
106

Signature Title
/s/ CAROLE J. SHAPAZIAN Director
Carole J. Shapazian
/s/ THOMAS T. STALLKAMP Director
Thomas T. Stallkamp
/s/ K.J. STORM Director
K.J. Storm
/s/ ALBERT P. L. STROUCKEN Director
Albert P. L. Stroucken
107

EXHIBIT INDEX
Number and Description of Exhibit
2.1 Share Purchase Agreement, dated as of December 4, 2012 by and between Baxter International Inc.and Indap Sweden AB (incorporated by reference to Exhibit 2.1 to the Company’s Current Report onForm 8-K, filed on December 4, 2012).
3.1 Amended and Restated Certificate of Incorporation (incorporated by reference to Exhibit 3.1 to theCompany’s Current Report on Form 8-K, filed on May 18, 2006).
3.2 Bylaws, as amended and restated on November 11, 2008 (incorporated by reference to Exhibit 3.1 tothe Company’s Current Report on Form 8-K, filed on November 17, 2008).
4.1 Form of Common Stock Certificate of the Company (incorporated by reference to Exhibit(a) to theCompany’s Registration Statement on Form S-16 (Registration No. 02-65269), filed on August 17,1979).
4.2 Indenture, dated as of April 26, 2002, between the Company and Bank One Trust Company, N.A., asTrustee (incorporated by reference to Exhibit 4.5 to Amendment No. 1 to Form 8-A, filed onDecember 23, 2002).
4.3 Second Supplemental Indenture, dated as of March 10, 2003, to Indenture dated as of April 26, 2002,between the Company and Bank One Trust Company, N.A., as Trustee (including form of4.625% Notes due 2015) (incorporated by reference to Exhibit 4.2 to the Company’s RegistrationStatement on Form S-4 (Registration No. 333-109329), filed on September 30, 2003).
4.4 Indenture, dated August 8, 2006, between the Company and J.P. Morgan Trust Company, NationalAssociation, as Trustee (incorporated by reference to Exhibit 4.1 to the Company’s Current Report onForm 8-K, filed on August 9, 2006).
4.5 First Supplemental Indenture, dated August 8, 2006, between the Company and J.P. MorganTrust Company, National Association, as Trustee (including form of 5.90% Senior Note due 2016)(incorporated by reference to Exhibit 4.2 to the Company’s Current Report on Form 8-K, filed onAugust 9, 2006).
4.6 Second Supplemental Indenture, dated December 7, 2007, between the Company and The Bank ofNew York Trust Company, N.A. (as successor in interest to J.P. Morgan Trust Company, NationalAssociation), as Trustee (including form of 6.250% Senior Note due 2037) (incorporated byreference to Exhibit 4.1 to the Company’s Current Report on Form 8-K, filed on December 7, 2007).
4.7 Third Supplemental Indenture, dated May 22, 2008, between the Company and The Bank of NewYork Trust Company, N.A. (as successor in interest to J.P. Morgan Trust Company, NationalAssociation), as Trustee (including form of 5.375% Senior Notes due 2018) (incorporated byreference to Exhibit 4.1 to the Company’s Current Report on Form 8-K, filed on May 22, 2008).
4.8 Fourth Supplemental Indenture, dated February 26, 2009, between the Company and The Bank ofNew York Mellon Trust Company, N.A. (as successor in interest to J.P. Morgan Trust Company,National Association), as Trustee (including form of 4.00% Senior Notes due 2014) (incorporated byreference to Exhibit 4.1 to the Company’s Current Report on Form 8-K, filed on February 26, 2009).
4.9 Fifth Supplemental Indenture, dated as of August 20, 2009, between the Company and The Bank ofNew York Mellon Trust Company, N.A. (as successor in interest to J.P. Morgan Trust Company,National Association), as Trustee (including form of 4.50% Senior Notes due 2019) (incorporated byreference to Exhibit 4.1 to the Company’s Current Report on Form 8-K filed on August 20, 2009).
108

Number and Description of Exhibit
4.10 Sixth Supplemental Indenture, dated March 9, 2010, between the Company and The Bank ofNew York Mellon Trust Company, N.A. (as successor in interest to J.P. Morgan Trust Company,National Association), as Trustee, (including forms of 1.800% Senior Notes due 2013 and4.250% Senior Notes due 2020) (incorporated by reference to Exhibit 4.1 to the Company’s CurrentReport on Form 8-K filed on March 9, 2010).
4.11 Seventh Supplemental Indenture, dated December 19, 2011, between the Company and The Bank ofNew York Mellon Trust Company, N.A. (as successor in interest to J.P. Morgan Trust Company,National Association), as Trustee (including form of 1.850% Senior Notes due 2017) (incorporatedby reference to Exhibit 4.1 to the Company’s Current Report on Form 8-K, filed on December 19,2011).
4.12 Eighth Supplemental Indenture, dated August 13, 2012, between the Company and The Bank ofNew York Mellon Trust Company, N.A. (as successor in interest to J.P. Morgan Trust Company,National Association), as Trustee (including forms of 2.400% Senior Notes due 2022 and 3.650%Senior Notes due 2042) (incorporated by reference to Exhibit 4.1 to the Company’s Current Reporton Form 8-K, filed on August 13, 2012).
10.1 Four-Year Credit Agreement, dated June 17, 2011, among Baxter International Inc. as Borrower,JPMorgan Chase Bank, National Association , as Administrative Agent and certain other financialinstitutions named therein (incorporated by reference to Exhibit 10.18 to the Company’s CurrentReport on Form 8-K, filed on June 22, 2011).
10.2 Consent Decree for Condemnation and Permanent Injunction with the United States of America(incorporated by reference to Exhibit 10.1 to the Company’s Current Report on Form 8-K, filed onJune 29, 2006).
10.3 364-Day Credit Agreement, dated January 25, 2013, among Baxter International Inc. as Borrower,JPMorgan Chase Bank, National Association, as Administrative Agent and certain other financialinstitutions named therein (incorporated by reference to Exhibit 10.17 to the Company’s CurrentReport on Form 8-K, filed on January 29, 2013).
C 10.4 Form of Indemnification Agreement entered into with directors and officers (incorporated byreference to Exhibit 19.4 to the Company’s Quarterly Report on Form 10-Q, filed on November 14,1986).
C 10.5 Baxter International Inc. 2003 Incentive Compensation Program (incorporated by reference toExhibit A to the Company’s Definitive Proxy Statement on Schedule 14A, filed on March 21,2003).
C 10.6 Baxter International Inc. 2007 Incentive Plan (incorporated by reference to Appendix A to theCompany’s Definitive Proxy Statement on Schedule 14A, filed on March 20, 2007).
C 10.7 Baxter International Inc. Equity Plan (incorporated by reference to Exhibit 10.1 to the Company’sCurrent Report on Form 8-K, filed on March 16, 2007).
C 10.8 Baxter International Inc. 2011 Incentive Plan (incorporated by reference to Appendix B to theCompany’s Definitive Proxy Statement on Schedule 14A, filed on March 18, 2011).
C 10.9 Baxter International Inc. Equity Plan (incorporated by reference to Exhibit 10.1 to the Company’sQuarterly Report on Form 10-Q, filed on May 3, 2011).
C 10.10 Baxter International Inc. Directors’ Deferred Compensation Plan (amended and restated effectiveJanuary 1, 2009) and Amendment No. 1 thereto effective January 1, 2012 (incorporated byreference to Exhibit 10.9 to the Company’s Annual Report on Form 10-K filed on February 23,2012).
109

Number and Description of Exhibit
C 10.11 Amended and Restated Employment Agreement, between Robert L. Parkinson, Jr. and BaxterInternational Inc., dated December 12, 2008 (incorporated by reference to Exhibit 10.1 to theCompany’s Current Report on Form 8-K, filed on December 17, 2008).
C 10.12 Form of Severance Agreement entered into with executive officers (amended and restatedeffective December 18, 2008) (incorporated by reference to Exhibit 10.17 to the Company’sAnnual Report on Form 10-K filed on February 19, 2009).
C 10.13 Baxter International Inc. and Subsidiaries Supplemental Pension Plan (amended and restatedeffective January 1, 2009) (incorporated by reference to Exhibit 10.18 to the Company’s AnnualReport on Form 10-K, filed on February 19, 2009).
C 10.14 Baxter International Inc. and Subsidiaries Deferred Compensation Plan (amended and restatedeffective January 1, 2009) (incorporated by reference to Exhibit 10.19 to the Company’s AnnualReport on Form 10-K, filed on February 19, 2009).
C 10.15 Baxter International Inc. Employee Stock Purchase Plan (as amended and restated effective July1, 2011) (incorporated by reference to Appendix A to the Company’s Definitive Proxy Statementon Schedule 14A, filed on March 18, 2011).
C 10.16* Baxter International Inc. Non-Employee Director Compensation Plan (as amended and restatedeffective January 1, 2013).
12.* Computation of Ratio of Earnings to Fixed Charges.
21.* Subsidiaries of Baxter International Inc.
23.* Consent of PricewaterhouseCoopers LLP.
31.1* Certification of Chief Executive Officer pursuant to Rules 13a-14(a) and 15d-14(a) of theSecurities Exchange Act of 1934, as amended.
31.2* Certification of Chief Financial Officer pursuant to Rules 13a-14(a) and 15d-14(a) and 15d-14(a)of the Securities Exchange Act of 1934, as amended.
32.1* Certification of Chief Executive Officer pursuant to 18 U.S.C. Section 1350, as adopted pursuantto Section 906 of the Sarbanes-Oxley Act of 2002.
32.2* Certification of Chief Financial Officer pursuant to 18 U.S.C. Section 1350, as adopted pursuantto Section 906 of the Sarbanes-Oxley Act of 2002.
101.INS* XBRL Instance Document
101.SCH* XBRL Taxonomy Extension Schema Document
101.CAL* XBRL Taxonomy Extension Calculation Linkbase Document
101.DEF* XBRL Taxonomy Extension Definition Linkbase Document
101.LAB* XBRL Taxonomy Extension Label Linkbase Document
101.PRE* XBRL Taxonomy Extension Presentation Linkbase Document
* Filed herewith.
C Management contract or compensatory plan or arrangement.
110

REPORT OF INDEPENDENT REGISTERED PUBLIC ACCOUNTING FIRM ONFINANCIAL STATEMENT SCHEDULE
To the Board of Directors and Shareholders of Baxter International Inc.:
Our audits of the consolidated financial statements and of the effectiveness of internal control over financialreporting referred to in our report dated February 21, 2013 listed in the index appearing under Item 15(1) in thisForm 10-K also included an audit of the financial statement schedule listed in the index appearing underItem 15(2) of this Annual Report on Form 10-K. In our opinion, this financial statement schedule presents fairly,in all material respects, the information set forth therein when read in conjunction with the related consolidatedfinancial statements.
/s/ PricewaterhouseCoopers LLPChicago, IllinoisFebruary 21, 2013
111

SCHEDULE II
Additions Charged(credited)to other
accounts (1)Valuation and Qualifying Accounts
(in millions)
Balance atbeginningof period
Charged tocosts andexpenses
Deductionsfrom
reserves (2)
Balance atend ofperiod
Year ended December 31, 2012:Allowance for doubtful accounts . . . . . . . . . . . . . . $128 12 (2) (11) $127Inventory reserves . . . . . . . . . . . . . . . . . . . . . . . . . . $302 199 4 (221) $284Deferred tax asset valuation allowance . . . . . . . . . . $116 10 (4) (18) $104
Year ended December 31, 2011:Allowance for doubtful accounts . . . . . . . . . . . . . . $139 32 (6) (37) $128Inventory reserves . . . . . . . . . . . . . . . . . . . . . . . . . . $359 144 (10) (191) $302Deferred tax asset valuation allowance . . . . . . . . . . $118 11 (4) (9) $116
Year ended December 31, 2010:Allowance for doubtful accounts . . . . . . . . . . . . . . $118 41 (1) (19) $139Inventory reserves . . . . . . . . . . . . . . . . . . . . . . . . . . $273 240 (3) (151) $359Deferred tax asset valuation allowance . . . . . . . . . . $144 13 21 (60) $118
(1) Valuation accounts of acquired or divested companies and foreign currency translation adjustments.
(2) Deductions from reserves includes the write-off of previously reserved inventory that was used in researchand development (R&D) and recorded in R&D expenses in the year reserved.
Reserves are deducted from assets to which they apply.
112

EXHIBIT 12
Baxter International Inc. and Subsidiaries
Computation of Ratio of Earnings to Fixed Charges(unaudited — in millions, except ratios)
Years ended December 31, 2012 2011 2010 2009 2008
Income before income taxes . . . . . . . . . . . . . . . . . . . . . . . . . . . . . . . $2,889 $2,809 $1,890 $2,734 $2,462
Fixed chargesInterest costs(1) . . . . . . . . . . . . . . . . . . . . . . . . . . . . . . . . . . . . . . 165 132 148 145 165
Estimated interest in rentals(2) . . . . . . . . . . . . . . . . . . . . . . . . . . . 67 68 61 57 54
Fixed charges as defined . . . . . . . . . . . . . . . . . . . . . . . . . . . . . . . . . 232 200 209 202 219
Adjustments to incomeInterest costs capitalized . . . . . . . . . . . . . . . . . . . . . . . . . . . . . . . (52) (40) (33) (28) (17)Net losses (gains) of less than majority-owned affiliates, net of
dividends . . . . . . . . . . . . . . . . . . . . . . . . . . . . . . . . . . . . . . . . . 1 4 (1) — 1
Income as adjusted . . . . . . . . . . . . . . . . . . . . . . . . . . . . . . . . . . . . $3,070 $2,973 $2,065 $2,908 $2,665
Ratio of earnings to fixed charges(3) . . . . . . . . . . . . . . . . . . . . . . . . 13.23 14.87 9.88 14.40 12.17
(1) Excludes interest on uncertain tax positions.
(2) Represents the estimated interest portion of rents.
(3) Excluding the following pre-tax special items included in “Income before income taxes,” the ratio ofearnings to fixed charges was 14.67, 16.74, 15.05, 15.19, and 12.97 in 2012, 2011, 2010, 2009, and 2008,respectively.
2012: $170 million charge primarily related to the settlement of certain pension obligations, $150million business optimization charge, business development charges of $128 millionprincipally related to upfront payments for collaboration agreements, a benefit of $91 millionrelated to the reduction of certain contingent payment liabilities, and a net benefit of $23million primarily related to an adjustment to infusion pump reserves.
2011: $192 million business optimization charge, $103 million of charges principally related toasset impairments and a contribution to the Baxter International Foundation and a $79 millioncharge relating to the resolution of litigation pertaining to average wholesale prices andcertain historical rebate and discount adjustments.
2010: $588 million charge relating to infusion pumps, $257 million business optimization charge,$112 million impairment charge, $62 million litigation-related charge, $34 million ofbusiness development charges and a $28 million charge to write down accounts receivable inGreece.
2009: $79 million business optimization charge, $27 million charge relating to infusion pumps and a$54 million impairment charge.
2008: $125 million charge relating to infusion pumps; $31 million impairment charge and $19million of charges relating to acquired in-process research and development.

EXHIBIT 21
Subsidiaries of Baxter International Inc.
Subsidiary Organized under laws of
% owned byimmediateparent(1)
Baxter International Inc. . . . . . . . . . . . . . . . . . . . . . . . . . . . . . . . . . . . . . . . . . . . . . . . . . . . . . . . . . DelawareBaxter Colorado Holding Inc. . . . . . . . . . . . . . . . . . . . . . . . . . . . . . . . . . . . . . . . . . . . . . . . . . . . Colorado 100
Baxa Corporation . . . . . . . . . . . . . . . . . . . . . . . . . . . . . . . . . . . . . . . . . . . . . . . . . . . . . . . . . Colorado 100Baxter Healthcare Corporation . . . . . . . . . . . . . . . . . . . . . . . . . . . . . . . . . . . . . . . . . . . . . . . . . . Delaware 100
Baxter Pharmaceutical Solutions LLC . . . . . . . . . . . . . . . . . . . . . . . . . . . . . . . . . . . . . . . . Delaware 100BioLife Plasma Services L.P. . . . . . . . . . . . . . . . . . . . . . . . . . . . . . . . . . . . . . . . . . . . . . . . Pennsylvania 99(2)
Baxter Holding Services Company . . . . . . . . . . . . . . . . . . . . . . . . . . . . . . . . . . . . . . . . . . . . . . . Delaware 100Synovis Life Technologies, Inc. . . . . . . . . . . . . . . . . . . . . . . . . . . . . . . . . . . . . . . . . . . . . . Minnesota 100
Baxter World Trade Corporation . . . . . . . . . . . . . . . . . . . . . . . . . . . . . . . . . . . . . . . . . . . . . . . . . Delaware 100Baxter Corporation . . . . . . . . . . . . . . . . . . . . . . . . . . . . . . . . . . . . . . . . . . . . . . . . . . . . . . . Canada 100Baxter de Venezuela, C.A. . . . . . . . . . . . . . . . . . . . . . . . . . . . . . . . . . . . . . . . . . . . . . . . . . Venezuela 100Baxter Export Corporation . . . . . . . . . . . . . . . . . . . . . . . . . . . . . . . . . . . . . . . . . . . . . . . . . Nevada 100Baxter Global Holdings Inc. . . . . . . . . . . . . . . . . . . . . . . . . . . . . . . . . . . . . . . . . . . . . . . . . Delaware 100
Baxter Healthcare Pty Ltd . . . . . . . . . . . . . . . . . . . . . . . . . . . . . . . . . . . . . . . . . . . . . . . . Australia 99.999(2)Baxter Healthcare Limited . . . . . . . . . . . . . . . . . . . . . . . . . . . . . . . . . . . . . . . . . . . . . . . . . . Taiwan 100Baxter Holding Mexico, S. de R.L. de C.V. . . . . . . . . . . . . . . . . . . . . . . . . . . . . . . . . . . . . Mexico 99.999(2)
Baxter S.A. de C.V. . . . . . . . . . . . . . . . . . . . . . . . . . . . . . . . . . . . . . . . . . . . . . . . . . . . . . Mexico 99.99(2)Baxter Holdings Limited . . . . . . . . . . . . . . . . . . . . . . . . . . . . . . . . . . . . . . . . . . . . . . . . . . . Japan 100
Baxter Limited . . . . . . . . . . . . . . . . . . . . . . . . . . . . . . . . . . . . . . . . . . . . . . . . . . . . . . . . . Japan 100Baxter Sales and Distribution Corp. . . . . . . . . . . . . . . . . . . . . . . . . . . . . . . . . . . . . . . . . . . Delaware 100(3)
Baxter Healthcare Corporation of Puerto Rico . . . . . . . . . . . . . . . . . . . . . . . . . . . . . . . . Alaska 100Baxter Global Holdings II Inc. . . . . . . . . . . . . . . . . . . . . . . . . . . . . . . . . . . . . . . . . . . Delaware 100
Baxter Holding B.V. . . . . . . . . . . . . . . . . . . . . . . . . . . . . . . . . . . . . . . . . . . . . . . . . The Netherlands 100ApaTech Limited . . . . . . . . . . . . . . . . . . . . . . . . . . . . . . . . . . . . . . . . . . . . . . . . . United Kingdom 100Baxter AG . . . . . . . . . . . . . . . . . . . . . . . . . . . . . . . . . . . . . . . . . . . . . . . . . . . . . . Switzerland 100Baxter Argentina S.A. . . . . . . . . . . . . . . . . . . . . . . . . . . . . . . . . . . . . . . . . . . . . . Argentina 93.08(2)Baxter Healthcare (Holdings) Limited . . . . . . . . . . . . . . . . . . . . . . . . . . . . . . . . United Kingdom 100
Baxter Healthcare Limited . . . . . . . . . . . . . . . . . . . . . . . . . . . . . . . . . . . . . . . . United Kingdom 100Baxter (Hellas) EPE . . . . . . . . . . . . . . . . . . . . . . . . . . . . . . . . . . . . . . . . . . Greece 99.8(2)
Baxter Healthcare Holding GmbH . . . . . . . . . . . . . . . . . . . . . . . . . . . . . . . . . . . Switzerland 100Baxter Healthcare SA . . . . . . . . . . . . . . . . . . . . . . . . . . . . . . . . . . . . . . . . . Switzerland 100
Baxter Healthcare Pharmaceutical Limited . . . . . . . . . . . . . . . . . . . . . . . United Kingdom 100Baxter Pacific Investments Pte Ltd . . . . . . . . . . . . . . . . . . . . . . . . . . . . . Singapore 100
Baxter (China) Investment Co., Ltd. . . . . . . . . . . . . . . . . . . . . . . . . . . China 100Baxter Healthcare (Guangzhou) Company Ltd . . . . . . . . . . . . . . . . China 87.5Baxter Healthcare (Suzhou) Company Ltd. . . . . . . . . . . . . . . . . . . China 100Baxter Healthcare (Shanghai) Company Ltd . . . . . . . . . . . . . . . . . . China 100
Baxter (India) Private Limited . . . . . . . . . . . . . . . . . . . . . . . . . . . . . . . India 99.99(2)Baxter Healthcare Trading (Shanghai) Company Ltd. . . . . . . . . . . . . China 100
Baxter Productos Medicos LTDA . . . . . . . . . . . . . . . . . . . . . . . . . . . . . . Costa Rica 100Baxter Trading GmbH . . . . . . . . . . . . . . . . . . . . . . . . . . . . . . . . . . . . . . . Switzerland 100
Baxter BioScience Manufacturing Sarl . . . . . . . . . . . . . . . . . . . . . . . . Switzerland 100Baxter Innovations GmbH . . . . . . . . . . . . . . . . . . . . . . . . . . . . . . . . . . Austria 100
Baxter AG . . . . . . . . . . . . . . . . . . . . . . . . . . . . . . . . . . . . . . . . . . . . Austria 100Baxter Hospitalar Ltda. . . . . . . . . . . . . . . . . . . . . . . . . . . . . . . . . . . . . . . . . . . . . Brazil 99.999(2)Baxter Incorporated . . . . . . . . . . . . . . . . . . . . . . . . . . . . . . . . . . . . . . . . . . . . . . . Republic of Korea 100Baxter Netherlands Holding B.V. . . . . . . . . . . . . . . . . . . . . . . . . . . . . . . . . . . . . The Netherlands 100
Baxter S.A. . . . . . . . . . . . . . . . . . . . . . . . . . . . . . . . . . . . . . . . . . . . . . . . . . . . Belgium 99.97(2)Eczacibasi-Baxter Hastane Urunleri Sanayi ve Ticaret A.S. . . . . . . . . . . . . Turkey 49.999(4)
Baxter Deutschland Holding GmbH . . . . . . . . . . . . . . . . . . . . . . . . . . . . . . . . Germany 94(2)Baxter Deutschland GmbH . . . . . . . . . . . . . . . . . . . . . . . . . . . . . . . . . . . . . Germany 100Baxter Oncology GmbH . . . . . . . . . . . . . . . . . . . . . . . . . . . . . . . . . . . . . . . Germany 100
Baxter World Trade SPRL . . . . . . . . . . . . . . . . . . . . . . . . . . . . . . . . . . . . . . . . . Belgium 99.999(2)Baxter World Trade Italy S.R.L. . . . . . . . . . . . . . . . . . . . . . . . . . . . . . . . . . . . . . . . . . . . . . Italy 100
Baxter S.p.A. . . . . . . . . . . . . . . . . . . . . . . . . . . . . . . . . . . . . . . . . . . . . . . . . . . . . . . . . Italy 98.98(2)Baxter Manufacturing S.p.A. . . . . . . . . . . . . . . . . . . . . . . . . . . . . . . . . . . . . . . . . . . . . Italy 98.98(2)
Bieffe Medital S.p.A. . . . . . . . . . . . . . . . . . . . . . . . . . . . . . . . . . . . . . . . . . . . . . . Italy 99.46Bieffe Medital Nederland NV . . . . . . . . . . . . . . . . . . . . . . . . . . . . . . . . . . . . . The Netherlands 100
Sapa Prodotti Plastici Sagl . . . . . . . . . . . . . . . . . . . . . . . . . . . . . . . . . . . . . . Switzerland 100Laboratorios Baxter S.A. . . . . . . . . . . . . . . . . . . . . . . . . . . . . . . . . . . . . . . . . . . . . . . . . . . . Delaware 100
RTS Worldwide Holdings Inc. . . . . . . . . . . . . . . . . . . . . . . . . . . . . . . . . . . . . . . . . . . . . . . . . . . Delaware 100RTS Americas Inc. . . . . . . . . . . . . . . . . . . . . . . . . . . . . . . . . . . . . . . . . . . . . . . . . . . . . . . . Delaware 100
RTS Colombia Ltda. . . . . . . . . . . . . . . . . . . . . . . . . . . . . . . . . . . . . . . . . . . . . . . . . . . . . Colombia 99.51(2)RTS S A S . . . . . . . . . . . . . . . . . . . . . . . . . . . . . . . . . . . . . . . . . . . . . . . . . . . . . . . . . . Colombia 100
Subsidiaries omitted from this list, considered in aggregate as a single subsidiary, would not constitute a significant subsidiary. Allsubsidiaries set forth herein are reported in the Company’s financial statements through consolidation or under the equity method ofaccounting.
(1) Including nominee shares.(2) Remaining shares owned by the Company, or other subsidiaries of the Company.(3) Of common stock, with preferred stock held by Baxter Healthcare Corporation.(4) Baxter’s total ownership in this joint venture is 50%. The remaining .001% is owned by other Baxter entities.

EXHIBIT 23
CONSENT OF INDEPENDENT REGISTERED PUBLIC ACCOUNTING FIRM
We hereby consent to the incorporation by reference in the Registration Statements on Form S-8 (Nos. 333-43563, 333-47019, 333-88257, 333-48906, 333-62820, 333-102140, 333-104420, 333-104421, 333-105032, 333-143063, 333-174400 and 333-174401) and on Form S-3 (Nos. 333-123811 and 333-183099) of BaxterInternational Inc. of our reports dated February 21, 2013 relating to the financial statements, the financialstatement schedule and the effectiveness of internal control over financial reporting, which appear in thisForm 10-K.
/s/ PricewaterhouseCoopers LLPChicago, IllinoisFebruary 21, 2013

EXHIBIT 31.1
Certification of Chief Executive OfficerPursuant to Rules 13a-14(a) and 15d-14(a) of the Securities Exchange Act of 1934, as Amended
I, Robert L. Parkinson, Jr., certify that:
1. I have reviewed this Annual Report on Form 10-K of Baxter International Inc.;
2. Based on my knowledge, this report does not contain any untrue statement of a material fact or omit tostate a material fact necessary to make the statements made, in light of the circumstances under whichsuch statements were made, not misleading with respect to the period covered by this report;
3. Based on my knowledge, the financial statements, and other financial information included in thisreport, fairly present in all material respects the financial condition, results of operations and cash flowsof the registrant as of, and for, the periods presented in this report;
4. The registrant’s other certifying officer and I are responsible for establishing and maintaining disclosurecontrols and procedures (as defined in Exchange Act Rules 13a-15(e) and 15d-15(e)) and internalcontrol over financial reporting (as defined in Exchange Act Rules 13a-15(f) and 15d-15(f)) for theregistrant and have:
(a) Designed such disclosure controls and procedures, or caused such disclosure controls andprocedures to be designed under our supervision, to ensure that material information relatingto the registrant, including its consolidated subsidiaries, is made known to us by others withinthose entities, particularly during the period in which this report is being prepared;
(b) Designed such internal control over financial reporting, or caused such internal control overfinancial reporting to be designed under our supervision, to provide reasonable assuranceregarding the reliability of financial reporting and the preparation of financial statements forexternal purposes in accordance with generally accepted accounting principles;
(c) Evaluated the effectiveness of the registrant’s disclosure controls and procedures andpresented in this report our conclusions about the effectiveness of the disclosure controls andprocedures, as of the end of the period covered by this report based on such evaluation; and
(d) Disclosed in this report any change in the registrant’s internal control over financial reportingthat occurred during the registrant’s most recent fiscal quarter (the registrant’s fourth fiscalquarter in the case of an annual report) that has materially affected, or is reasonably likely tomaterially affect, the registrant’s internal control over financial reporting; and
5. The registrant’s other certifying officer and I have disclosed, based on our most recent evaluation ofinternal control over financial reporting, to the registrant’s auditors and the audit committee of theregistrant’s board of directors (or persons performing the equivalent functions):
(a) All significant deficiencies and material weaknesses in the design or operation of internalcontrol over financial reporting which are reasonably likely to adversely affect the registrant’sability to record, process, summarize and report financial information; and
(b) Any fraud, whether or not material, that involves management or other employees who have asignificant role in the registrant’s internal control over financial reporting.
/s/ ROBERT L. PARKINSON, JR.
Robert L. Parkinson, Jr.Chairman of the Board andChief Executive Officer
Date: February 21, 2013

EXHIBIT 31.2
Certification of Chief Financial OfficerPursuant to Rules 13a-14(a) and 15d-14(a) of the Securities Exchange Act of 1934, as Amended
I, Robert J. Hombach, certify that:
1. I have reviewed this Annual Report on Form 10-K of Baxter International Inc.;
2. Based on my knowledge, this report does not contain any untrue statement of a material fact or omit tostate a material fact necessary to make the statements made, in light of the circumstances under whichsuch statements were made, not misleading with respect to the period covered by this report;
3. Based on my knowledge, the financial statements, and other financial information included in thisreport, fairly present in all material respects the financial condition, results of operations and cash flowsof the registrant as of, and for, the periods presented in this report;
4. The registrant’s other certifying officer and I are responsible for establishing and maintaining disclosurecontrols and procedures (as defined in Exchange Act Rules 13a-15(e) and 15d-15(e)) and internalcontrol over financial reporting (as defined in Exchange Act Rules 13a-15(f) and 15d-15(f)) for theregistrant and have:
(a) Designed such disclosure controls and procedures, or caused such disclosure controls andprocedures to be designed under our supervision, to ensure that material information relatingto the registrant, including its consolidated subsidiaries, is made known to us by others withinthose entities, particularly during the period in which this report is being prepared;
(b) Designed such internal control over financial reporting, or caused such internal control overfinancial reporting to be designed under our supervision, to provide reasonable assuranceregarding the reliability of financial reporting and the preparation of financial statements forexternal purposes in accordance with generally accepted accounting principles;
(c) Evaluated the effectiveness of the registrant’s disclosure controls and procedures andpresented in this report our conclusions about the effectiveness of the disclosure controls andprocedures, as of the end of the period covered by this report based on such evaluation; and
(d) Disclosed in this report any change in the registrant’s internal control over financial reportingthat occurred during the registrant’s most recent fiscal quarter (the registrant’s fourth fiscalquarter in the case of an annual report) that has materially affected, or is reasonably likely tomaterially affect, the registrant’s internal control over financial reporting; and
5. The registrant’s other certifying officer and I have disclosed, based on our most recent evaluation ofinternal control over financial reporting, to the registrant’s auditors and the audit committee of theregistrant’s board of directors (or persons performing the equivalent functions):
(a) All significant deficiencies and material weaknesses in the design or operation of internalcontrol over financial reporting which are reasonably likely to adversely affect the registrant’sability to record, process, summarize and report financial information; and
(b) Any fraud, whether or not material, that involves management or other employees who have asignificant role in the registrant’s internal control over financial reporting.
/s/ ROBERT J. HOMBACH
Robert J. HombachCorporate Vice President and Chief Financial Officer
Date: February 21, 2013

EXHIBIT 32.1
Certification of Chief Executive Officer Pursuant to 18 U.S.C. Section 1350,as Adopted Pursuant to Section 906 of the Sarbanes-Oxley Act of 2002
Robert L. Parkinson, Jr., as Chairman of the Board and Chief Executive Officer of Baxter International Inc. (the“Company”), certifies, pursuant to 18 U.S.C. Section 1350, as adopted pursuant to Section 906 of the Sarbanes-Oxley Act of 2002, that:
(1) the Company’s Annual Report on Form 10-K for the year ended December 31, 2012 as filed withthe Securities and Exchange Commission on the date hereof (the “Report”) fully complies with therequirements of Section 13(a) or 15(d) of the Securities Exchange Act of 1934; and
(2) the information contained in the Report fairly presents, in all material respects, the financialcondition and results of operations of the Company.
/s/ ROBERT L. PARKINSON, JR.
Robert L. Parkinson, Jr.Chairman of the Board andChief Executive Officer
February 21, 2013

EXHIBIT 32.2
Certification of Chief Financial Officer Pursuant to 18 U.S.C. Section 1350,as Adopted Pursuant to Section 906 of the Sarbanes-Oxley Act of 2002
Robert J. Hombach, as Corporate Vice President and Chief Financial Officer of Baxter International Inc. (the“Company”), certifies, pursuant to 18 U.S.C. Section 1350, as adopted pursuant to Section 906 of the Sarbanes-Oxley Act of 2002, that:
(1) the Company’s Annual Report on Form 10-K for the year ended December 31, 2012 as filed withthe Securities and Exchange Commission on the date hereof (the “Report”) fully complies with therequirements of Section 13(a) or 15(d) of the Securities Exchange Act of 1934; and
(2) the information contained in the Report fairly presents, in all material respects, the financialcondition and results of operations of the Company.
/s/ ROBERT J. HOMBACH
Robert J. HombachCorporate Vice President andChief Financial Officer
February 21, 2013

(This page intentionally left blank)
Thomas F. Chen Former Senior Vice President and President, International Nutrition Abbott Laboratories
Uma Chowdhry, Ph.D. Former Senior Vice President and Chief Science and Technology Officer E. I. DuPont de Nemours & Company
Blake E. Devitt Former Senior Audit Partner and Director, Pharmaceutical and Medical Device Industry Practice Ernst & Young LLP
John D. Forsyth Chairman and Chief Executive Officer Wellmark Blue Cross and Blue Shield
Gail D. Fosler President The GailFosler Group LLC
James R. Gavin III, M.D., Ph.D. Chief Executive Officer and Chief Medical Officer Healing Our Village, Inc.
Peter S. Hellman Former President and Chief Financial and Administrative Officer Nordson Corporation
Wayne T. Hockmeyer, Ph.D. Founder and Former Chairman of the Board MedImmune, Inc.
Robert L. Parkinson, Jr. Chairman and Chief Executive Officer Baxter International Inc.
Carole J. Shapazian Former Executive Vice President Maytag Corporation
Thomas T. Stallkamp Founder and Principal Collaborative Management LLC
K. J. Storm Former Chairman of the Executive Board AEGON N.V. (The Netherlands)
Albert P.L. Stroucken Chairman, President and Chief Executive Officer Owens-Illinois, Inc.
Board of Directors
Phillip L. Batchelor* Vice President, Quality and Regulatory Affairs
Michael J. Baughman Controller
Jean-Luc Butel* President, International
Robert M. Davis* President, Medical Products
Ludwig N. Hantson, Ph.D.* President, BioScience
Robert J. Hombach* Chief Financial Officer
Wolf F. Kupatt President, Latin America and Canada
Mary Kay Ladone Vice President, Investor Relations
Gerald Lema President, Asia Pacific
Paul E. Martin Chief Information Officer
Jeanne K. Mason, Ph.D.* Vice President, Human Resources
Peter Nicklin President, EMEA
Robert L. Parkinson, Jr.* Chairman and Chief Executive Officer
James K. Saccaro Treasurer
David P. Scharf* General Counsel
Stephanie A. Shinn Corporate Secretary
*executive officer
Executive Management

Corporate Headquarters Baxter International Inc. One Baxter Parkway Deerfield, IL 60015-4625 Telephone: (224) 948-2000 Website: www.baxter.com
Annual Meeting The 2013 Annual Meeting of Shareholders will be held on Tuesday, May 7, at 9:00 a.m. at Baxter’s Corporate Headquarters, located at One Baxter Parkway, Deerfield, Illinois. If you plan to attend the Annual Meeting, please review the information regarding attendance contained in the 2013 Proxy Statement.
Stock Exchange Listings The New York Stock Exchange is the principal market on which the company’s common stock is traded (Ticker Symbol: BAX). The company’s common stock is also listed on the Chicago and SIX Swiss stock exchanges.
Transfer Agent and Registrar Correspondence concerning Baxter International Inc. common stock holdings, lost or missing certificates or dividend checks, duplicate mailing or changes of address should be directed to:
Baxter International Inc. Common Stock Computershare Trust Company, N.A. P.O. Box 43069 Providence, RI 02940-3069 Telephone: (888) 359-8645 Hearing Impaired Telephone: (800) 952-9245 Website: www.computershare.com
Dividend Reinvestment The company offers an automatic dividend-reinvestment program to all holders of Baxter International Inc. common stock. The company has appointed Computershare Trust Company, N.A. to administer the program.
Independent Registered Public Accounting Firm PricewaterhouseCoopers LLP, Chicago, IL
Information Resources Please visit Baxter’s website for information on the company and its products and services.
Information regarding corporate governance at Baxter, including Baxter’s code of conduct, ethics and compliance standards for Baxter’s suppliers, and the charters for the committees of Baxter’s board of directors, is available on Baxter’s website at www.baxter.com under “About Baxter–Corporate Governance.”
Investor Relations Securities analysts, investment professionals and investors seeking additional investor information should contact:
Mary Kay Ladone Clare Trachtman Vice President, Investor Relations Director, Investor Relations Telephone: (224) 948-3371 Telephone: (224) 948-3085 Fax: (224) 948-4498 Fax: (224) 948-4498
Customer Inquiries Customers who would like general information about Baxter’s products and services may call the Center for One Baxter toll free in the United States at (800) 422-9837 or by dialing (224) 948-4770.
Form 10-K and Other Reports A paper copy of the company’s Form 10-K for the year ended December 31, 2012, may be obtained without charge by writing to Baxter International Inc., Investor Relations, One Baxter Parkway, Deerfield, IL 60015-4625. A copy of the company’s Form 10-K and other filings with the U.S. Securities and Exchange Commission (SEC) may be obtained from the SEC’s website at www.sec.gov or the company’s website at www.baxter.com.
Trademarks Baxter, Abacus, Actifuse, Advate, Apatech, Baxa, Celvapan, Colleague, DoseEdge, Endoxan, Exactamix, Feiba, Flexbumin, Floseal, Fsme-Immun, Gammagard, Holoxan, Homechoice, Kiovig, Nexterone, Numeta, Olimel, Ostene, Prism, Sigma, Spectrum, Subcuvia, Suprane, Syndeo, Synovis, Tisseel, Uromitexan, Vepacel, and Vivia are trademarks of Baxter International Inc., its subsidiaries or affiliates. All other products or trademarks appearing herein are the property of their respective owners.
Company Information
The following graph compares the change in Baxter’s cumulative total shareholder return on its common stock with the Standard & Poor’s 500 Composite Index and the Standard & Poor’s 500 Health Care Index as of December 31 of each year.
Performance Graph
Des
ign
: pa
ragr
aphs
.com
Newsweek 2012 Green Rankings Logo, ©2012 Newsweek/The Daily Beast Company LLC. Used by permission and protected by the Copyright Laws of the United States. For more information, visit www.newsweek.com/green.
© Baxter International Inc., 2013. All rights reserved. References in this report to Baxter are intended to refer collectively to Baxter International Inc. and its U.S. and international subsidiaries.

Baxter International Inc.One Baxter ParkwayDeerfield, Illinois 60015-4625USA
www.baxter.com
Printed on recycled paper using soy-based inks.The cover and narrative pages of this annual report contain 10% post-consumer recovered fiber.The financial pages contain 30% post-consumer recovered fiber.