Embed Size (px)
Citation preview

1
BATWA DATA
OF
DEC 2007
ABOUT
KISORO, KABALE, KANUNGU, KATOVU,MBARARA
AND
NTUNGAMO.
IMPLEMENTED BY UOBDU
FUNDED BY MRG

2
ACRONYMS
UOBDU: United Organisation for Batwa Development in Uganda.
MRGI : Minority Rights Group International.
HIV : Human Immunity Virus
AIDS : Acquired Immune Deficiency Syndrome:
ADRA : Adventist Development Relief Agency.
BMCT : Bwindi Mgahinga Conservation Trust
AICM : African International Christian Ministry.
HH : Household
ARV : Antiretroviral

3
Table of contentsAcronyms………………………………………………………………..pg 2Executive summary……………………………………………………..pg 5Population of Batwa in Kisoro district...………………………..……pg 12Kisoro Batwa population by Age……………………………………..pg 14Head of Batwa families in Kisoro district……………………….…...pg 16Summary of Batwa population by sub-county…………………...….pg 17Kisoro Batwa land characteristics…………………….......………….pg 18Organisations in Kisoro that bought land for Batwa….....................pg 19Batwa education in Kisoro district……………………...……………pg 21Kisoro Batwa at primary level………………………………………..pg 21Kisoro Batwa at secondary level……………………………………...pg 22Kisoro Batwa literacy level ………………………………………...…pg 23House holds with iron roofed houses &pit latrine………………..…pg 25House holds that has radios in Kisoro district………………………pg 26Sources of water in Kisoro Batwa communities……………………..pg 27Immunisation and antenatal households…….....................................pg 28House holds that lost children in Kisoro district…………………….pg 29Causes of death of Batwa children in Kisoro…………………..……pg 30HIV testing and ARV awareness in Kisoro Batwa……………….....pg 31Kabale Batwa settlements and their sub-counties…………………..pg 33Kabale Batwa population by age……………………………………..pg 35Kabale Batwa head of families………………………………………..pg 37Kabale Batwa land and land ownership………………......................pg 37Organisations that purchased land for Batwa of Kabale………..…pg 38Primary education for the Batwa of Kabale………………………...pg 39Secondary level for Batwa of Kabale district………………………..pg 40Causes of high school drop out………………………...…………......pg 40House holds that lost children in Batwa communities………………pg 41Causes of death for Batwa children in Kabale district…..………….pg 41Households with iron roofed houses & pit latrine…………………..pg 43Sources of water in Batwa communities of Kabale………………….pg 44HIV testing and ARV awareness in Kabale Batwa………………….pg 45House holds that use immunisation and antenatal services…..…….pg 46House holds that have radios…………………………………………pg 46Mbarara Batwa population by sex…………………………………...pg 48Mbarara Batwa population composition by age…………………….pg 49Problems identified with Mbarara Batwa communities……...…….pg 50Primary level of Mbarara Batwa children…………………………..pg 51

4
Literacy level of Batwa of Mbarara………………………………..pg 51Households of Mbarara Batwa community with radios……….….pg 52Batwa households with pit latrine & iron roofed houses………….pg 53Mbarara Batwa households that lost children……………………..pg 53Causes of death for Batwa children in Mbarara…………………...pg 53HIV testing and ARV awareness…………………………………….pg 54Ntungamo Batwa population by gender…………………………….pg 56Head of families in Ntungamo Batwa………………………………..pg 57Problems identified in Ntungamo Batwa homestead……….............pg 57Land status among Batwa of Ntungamo…………………………….pg 58Education for the Batwa children of Ntungamo………………….....pg 58Households with radios in Ntungamo Batwa community…………..pg 58Immunization, antenatal and HIV awareness……………………….pg 58Katovu Batwa population by sex……………………………………..pg 60Population distribution by age………………………………………..pg 60Land characteristics for katovu Batwa………………………………pg 61Education levels for Katovu Batwa…………………………………..pg 61Literacy levels in katovu Batwa community…………………………pg 62Health…………………………………………………………………..pg 62Kanungu Batwa data………………………………………………….pg 63Population distribution by sex………………………………………..pg 63Population distribution by age………………………………………..pg 64Head of families……………………………………………………......pg 65Land…………………………………………………………………….pg 66Organisations that purchased land………………………………..…pg 67Education………………………………………………………………pg 67Primary level………………………………………………………......pg 68Secondary level………………………………………………………..pg 69Literacy rate or level…………………………………….……………pg 69Sanitation………………………………………………………………pg 70Iron roofed house……………………………………...………………pg 71Households with radios………………………………………………..pg 72Houses holds that lost children…………………………………….....pg 73Causes of Batwa children death………………………………………pg 74HIV testing and ARV awareness……………………………………..pg 75

5
EXECUTIVE SUMMARY
UOBDU carried out this data updation process in December 2007 and theresult shows different findings in the Batwa of Kisoro, Kanungu, Kabale,Mbarara, Ntungamo and katovu. It looked at population, Education, healthand organisation growth issues in the Batwa communities.This survey was funded by Minority Rights group (MRG).The importance of this data is to help in the implementation of UOBDU fiveyears strategic plan (2008-2012).
A. POPULATION
The table A shows population of the Batwa by sex
District Male Female Total Households
Kisoro 738 829 1,567 397Kabale 382 392 774 215Mbarara 39 34 73 27Ntungamo 24 16 40 12Katovu 18 17 35 12Kanungu 315 331 646 158TOTAL 1,516 1,617 3,135 821
In the table Kisoro has the highest number of the Batwa in the districts thatwere visited followed by Kabale, Kanungu, Mbarara, Ntungamo and katovuin that order.
B. Population by age compositionThis table will show different age composition of the Batwa in the areaswhere the data was carried out.
Table b, shows population by age
District 0-8 9-17 18-45 Above 45Kisoro 542 284 595 146Kabale 245 141 320 68Mbarara 18 24 27 4

6
Ntungamo 12 7 17 4Katovu 11 8 15 1Kanungu 206 136 247 57TOTAL 1,034 600 1,221 280
Table b shows population by age and about 1034 Batwa are below 8 yearswhile the adults are about 1,221 in all the districts of Kisoro, Mbarara,Kabale, Kanungu, Ntungamo and katovu. The population below eight yearsrepresent about 32.9% of the Batwa total population in the districts visited.
C. Head of familyThe data identified different heads of house holds in terms of sex, that isman, woman and child.Table c shows head of families
District Man Woman ChildKisoro 291 80 1Kanungu 127 25 -Mbarara 11 9 7Ntungamo 9 3 -Katovu 6 5 1Kabale 164 34 2TOTAL 608 156 11This summary table shows that 167 families are being headed by eitherwomen or child which may be explaining the high levels of poverty inBatwa communities.
D. LANDLand being aback born for agriculture, it critical to understand how Batwaown this important resource. Table d will show households that have land,landless and levels of ownership.
Table d, shows land and its ownership
District land landless OwnershipKisoro 197 200 97Kabale 83 132 49Kanungu 125 33 68Mbarara - 27 -

7
katovu - 12 -Ntungamo - 12 -TOTAL 405 416 214
Comparing the total house holds and the households in table d, it shows thatthe landless in Kisoro represent 50.4%, Kabale 61.4%, Kanungu 20.9%,while Mbarara, Katovu and Ntungamo landless represent 100% of the totalhouse holds.Also in total it was found out that about 50.7% of the Batwa households inthese districts are landless.
In addition the data shows different organisation that purchased land for theBatwa. These include among others TRUST, ADRA Kisoro Diocese,Busingye, Statton, Dr.scott and Compassion.
E. EducationAll levels of education were considered in this data and the summary isshown below in different tables.Primary levelTable e shows pupils and their classes.
DISTRICT P.1 P.2 P.3 P.4 P.5 P.6 P.7Sex M F M F M F M F M F M F M FKISORO 77 57 21 18 17 17 4 3 6 - - - 4 3KABALE 59 43 20 17 8 4 1 1 1 1 1 1 2 -MBARARA 2 2 - - 2 1 1 - - - - - - 1NTUNGAMO 1 - - - - - - - - - - - - -KATOVU - 2 1 - - - 1 - - - - - - -KANUNGU 21 26 18 14 7 15 12 7 5 3 4 - - -TOTAL 160 130 60 49 34 37 19 11 12 4 5 1 6 4
Table e shows that primary one and two have high numbers of pupils but asyou get up in higher classes the number drastically reduce thus causing highlevels of school drop out. The cause for high school drop out were alsoidentifies as early marriages, lack of food, lack of Batwa educated examples,marginalisation and ignorance of parents.

8
Secondary levelsTable f shows secondary studentsDistict S.1 S.2 S.3 S.4 S.5 S.6Sex M F M F M F M F M F M FKisoro - 2 - - - - - - - - - 1Kabale 1 - - - - - - - - - - -Kanungu 1 2 - - - - 1 1 - - - -TOTAL 2 4 - - - - 1 1 - - - 1
Table f shows that females are more than males in secondary level in all theBatwa where this data was carried out.
Vocational trainingThe data shows that there are three females and one male in vocationaltraining and they all come from Kisoro district.
G. literacy levelsThe level of literacy was found to be low of about 7.7%. The table showsnumber of Batwa who know how to read and write in different districts.
Table g shows literacy levelsDistrict Male female TotalKisoro 64 46 110Kabale 21 10 31Mbarara 16 5 21Ntungamo - - -katovu 5 - 5Kanungu 42 33 75Total 148 94 242
H.HEALTHDifferent indicators were considered which included knowledge about ARV,sources of water, presence of latrines, iron roofed houses, levels ofimmunisation and antenatal services.

9
Table h show iron roofed houses and latrineDistrict iron roofed hse latrine Public LatrinesKisoro 50 139 32Kabale 12 37 33Mbarara - 22 -Ntungamo - - -katovu - 12 -Kanungu 45 83 10Total 107 293 75
Table h shows that only 475 families out of 821house holds have latrines.However it should be noted that these public latrines are not properlymanaged by the Batwa.
I. Sources of waterThe data found out that most households use dirty water since theircommunities are located in high or raised land.
Table I shows different sources of water.
District Wells Spring Boreholes Rainharvest
Rivers Tap lakes
Kisoro 174 98 - 5 38 40 -Kabale 82 108 - 8 5 - 12Mbarara 17 - - - - 10 -Ntungamo - - 12 - - - -Katovu 12 - - - - - -Kanungu 66 58 18 1 15 - -Total 339 264 30 14 58 50 12
The table shows that most Batwa families drink dirty water since theirsources are bad like wells, lakes and rivers. In addition it was observed thateven some springs are dirty too and yet the Batwa don’t boil drinking water.
J. Immunisation, antenatal services and HIV testing.HIV testingDistrict Immunisation Antenatalmale Female
Kisoro 205 215 2 2Kabale 120 104 4 4

10
Mbarara 14 16 - -Ntungamo 3 3 - -Kanungu 100 104 79 115Katovu - - - -Total 442 442 85 121
In table j immunisation and antenatal the data was considering householdswhile HIV testing it considers individuals.For HIV/AIDS Female test more than men and Kanungu has a high numberof individuals who have tested. This is because the health services are freefor Batwa however the data collector we informed that the health centredon’t avail them with their results.
K. RadioThe Data took into consideration on how many Batwa house holds haveradios. The table below will have the summary of this question
Table k show number of house holds with radiosDistrict Radio Total house holdsKisoro 70 397Kabale 23 215Ntungamo 5 12Mbarara 2 27katovu 2 12Kanungu 58 158Total 160 821
In table k the numbers of house holds that have radios are only 160 whichrepresent 19.5% of the total household.
L. causes of death of children below eight year.The data collector established different causes of death for Batwa children

11
Table l shows causes of death
District Malaria kafura poison pneumonia kwashiorkor
measles Badspirit/demons
worms dysentery
Kisoro 68 14 2 8 11 2 3 1 1Kabale 68 16 2 13 8 4 - - 2Ntungamo 2 - - - - 1 - - -Mbarara 4 - - - - 2 - - -Katovu 4 - - - - - - - -Kanungu 51 - - 3 - 3 8 - 2Total 197 30 4 24 19 14 11 1 5
This table considers families and from the analysis malaria has claimedmany Batwa children than all other deaths.

12
1. KISORO DISTRICT
Data collection team in Nteko/ Sanuriro Batwa community
Population
District Profile
(a) Summary of the data on the population by sex
Table 1. 1 Shows the composition of the population by sex in both 2004and 2007Year Male Female Total
2004 643 746 13892007 738 829 1567
In 2007, the population of Batwa in Kisoro increased by 167 whichrepresents an increment of 12.023% from the population of 2004.In addition males increased from 643 to 733 while female increased from746 to 823; this is a positive indicator to Batwa population growth.
(b)Population composition from Batwa community in Kisoro.
The table below shows different Batwa communities or villages of Kisorodistrict.

13
Table 1.2 shows population by sex
Community Male Female Total No. ofHouse hold
Mukungu 58 71 129 32Sanuriro 32 36 68 18Rushaga 27 37 64 14Kashija 12 21 33 8Birara 55 52 107 32Rugeshi 23 25 48 12Biizi 35 43 78 19Kamugyemanyi 16 20 36 10Gatera 30 44 74 25Kagano 29 21 50 12Gitebe 96 95 191 52Kamugoyi 21 33 54 11Rushyeke 9 13 22 5Rukeri 54 57 111 28Musasa 38 31 69 17Kanyabukungu 25 38 63 12Mperwa 25 20 45 12Town Council 65 71 136 30Muyove 22 27 49 11Ryamigogo 34 38 72 19Ryabitukuru 27 30 57 14Mabungo 5 6 11 4TOTAL 738 829 1,567 397
Table 1.2 represents the composition by sex from all the Batwa communitiesof Kisoro. From this table Gitebe Batwa community has the highest numbersof males and females 96 and 95 respectively.
Also from table 1.2 Mabungo has the least number of females and male of 6and 5 respectively.

14
Table 1.2.1 shows percentage of males and females
Particular Numbers Percentage
Males 738 47.1Females 829 52.9Total 1,567 100Table 1.2.1 shows that the ratio of female to male is 1:1.1 this implies thatfor every one male there is 1.1 female. However, this ratio is less than theone for 2004 data collected which was 1:1.2.
(c) Population by AgeTable 1.3 shows Kisoro Batwa population in different age brackets.
Community 0- 8 9-18 18-45 Above 45 TotalMukungu 45 26 48 10 129Sanuriro 23 13 30 2 68Rushaga 22 16 23 3 64Kashija 17 2 13 1 33Birara 40 14 45 8 107Rugeshi 18 10 17 3 48Biizi 27 17 22 12 78Kamugyemanyi 12 7 15 2 36Gatera 22 8 35 9 74Kagano 18 5 21 6 50Gitebe 75 23 75 18 191Kamugoyi 23 12 11 8 54Rushekye 7 3 10 2 22Rukyeri 42 22 35 12 111Musasa 20 15 31 3 69Kanyabukungu 18 16 25 4 63Mperwa 13 11 13 8 45Town council 46 20 53 17 136Muyove 14 11 19 5 49Ryamigogo 23 16 25 8 72Ryabitukuru 15 15 26 1 57

15
Mabungo 2 2 3 4 11TOTAL 542 284 595 146 1567
Table 1.3 shows that there are 542 children with Gitebe Batwa communityhaving the highest number of Batwa children that is 75 children whichrepresent 13.8%, 284 youth with highest number of youth being in Mukungucommunity (26 people which represent 9.2%) from the same table 595represents the adult with Gitebe being the highest with 75 Adults thatrepresents 12.6%.
For the elderly (above 45 years) Kisoro has 146 people with Gitebe havingthe highest number of 18 elders followed by Kisoro town council with 17while the least community with less number of elders being Kashaija andRyabitukuru each with one person.
Percentage of population for selected age group.
Table 1.3.1
Age bracket Numbers Percentage
1-8 540 34.79-18 282 18.118-45 592 38.1
Above 45 142 9.1
Table 1.3.1 shows the proportions of different age brackets in relation tothe total population of Kisoro district. According to table 1.3.1 adults aremore with a percentage of 38.1% followed by children at 34.7%, thenyouth with 18.1% and lastly the old with 9.1%.
16
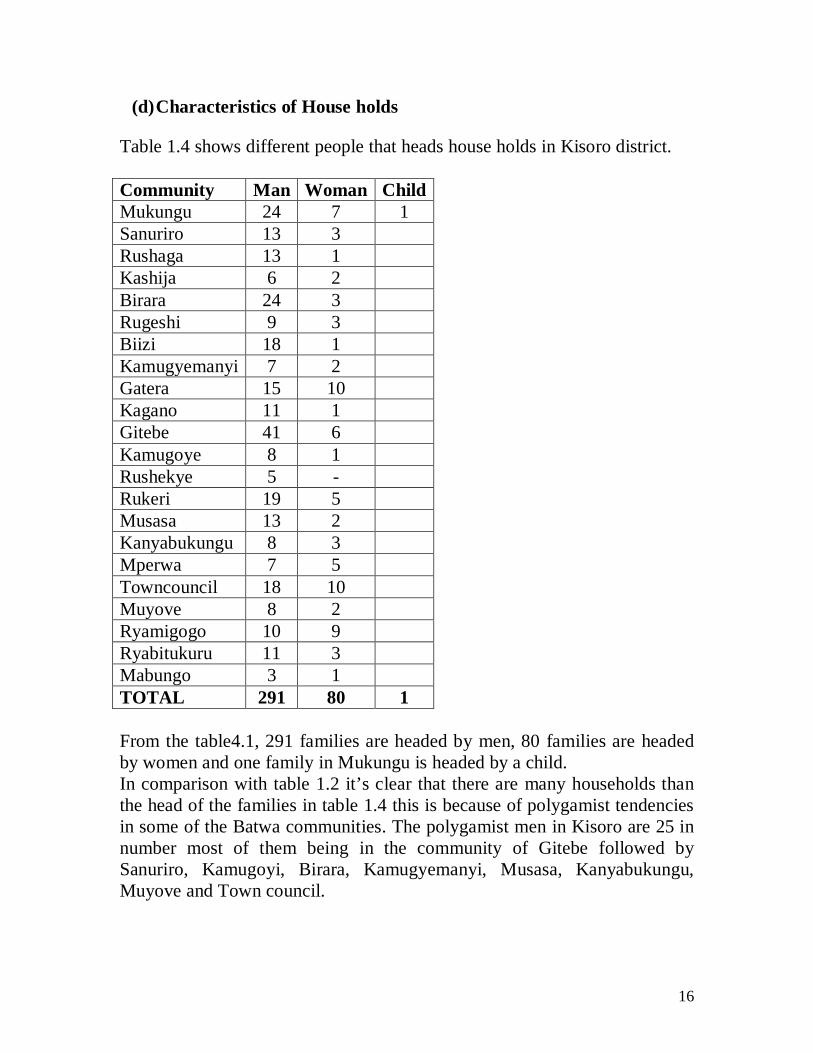
(d)Characteristics of House holds
Table 1.4 shows different people that heads house holds in Kisoro district.
Community Man Woman ChildMukungu 24 7 1Sanuriro 13 3Rushaga 13 1Kashija 6 2Birara 24 3Rugeshi 9 3Biizi 18 1Kamugyemanyi 7 2Gatera 15 10Kagano 11 1Gitebe 41 6Kamugoye 8 1Rushekye 5 -Rukeri 19 5Musasa 13 2Kanyabukungu 8 3Mperwa 7 5Towncouncil 18 10Muyove 8 2Ryamigogo 10 9Ryabitukuru 11 3Mabungo 3 1TOTAL 291 80 1
From the table4.1, 291 families are headed by men, 80 families are headedby women and one family in Mukungu is headed by a child.In comparison with table 1.2 it’s clear that there are many households thanthe head of the families in table 1.4 this is because of polygamist tendenciesin some of the Batwa communities. The polygamist men in Kisoro are 25 innumber most of them being in the community of Gitebe followed bySanuriro, Kamugoyi, Birara, Kamugyemanyi, Musasa, Kanyabukungu,Muyove and Town council.

17
e. Percentage of characteristics of households.
Particulars Numbers/ Percentage/ House holds proportion
Male headed 291 78.2Female headed 80 21.5Child headed 1 0.3
Although most families are headed by men also women head 21.5% which isa big section of the house hold since such homes have higher levels ofpoverty in society. These households call for special attention andintervention to improve their house hold income.
f. Mean of the population per household
The Average of Kisoro Batwa population in relation to the households is3.95 this implies at least each Mutwa household has at least 3.95 people.
g. Summary of Kisoro Batwa population by sub-county.
Sub-county Batwa popln by2007
Total poplncensus 02
% of Batwa poplnvs. total popln.
Nyondo 129 10705 1.2Nyabwishenya 104 11128 0.94Kirundo 226 15647 1.4Murora 126 15477 0.8Bukimbiri 129 11604 1.1Busanza 123 14525 0.8Kanaba 295 12895 2.2Nyarusiza 191 22348 0.9Nyakabande 108 21495 0.5Town council 136 11328 1.2TOTAL 1567 147152 1.1
In the table above kanaba sub-county has the highest number of the Batwa ofabout 295 which represents 2.29% of the counties population while

18
Nyakabande has the least number of Batwa of 108 which represents 0.5% ofthe total population of the county.
Batwa communities in the sub counties.In Nyondo sub county there is mukungu, Nyabwishenya sub-county hasSanuriro &Kamugemanyi, Kirundo sub-county has Rushaga, Kashija,Rwamigogo,Ryabitukuru, Murora sub-county has Rugeshi$Biizi,Bukimbiri sub-county has Birara,Rushekye, Busanza sob-county hasGatera,Muyove, Kanaba sub-county has Kagano, Gitebe & kamugoyi,Nyarusiza sub-county has Rukeri, Rushekye, Kabala&Mabungo,Nyakabande sub-county has Mperwa& Kanyabukungu and Town council isalone.
2. LAND:
Land is one of the main important resources to practice agriculture, the tablebelow shows land ownership in different batwa communities in Kisorodistrict.Table 2.1 shows the Batwa who have land, or landless and theownership status.Community Land Landless OwnershipMukungu 18 14 0Sanuriro 15 3 15Rushaga 14 0 0Kashija 8 0 0Birara 18 14 18Rugeshi 0 12 0Biizi 11 8 0Kamugyemanyi 9 1 9Gatera 18 7 17Kagano 0 12 0Gitebe 24 28 24Kamugoye 4 7 4Rushekye 2 3 2Rukeri 7 21 3Musasa 0 17 0Kanyabukungu 6 6 3Mperwa 11 1 0

19
Towncouncil 6 24 2Muyove 8 3 0Ryamigogo 6 13 0Ryabitukuru 12 2 0Mabungo 0 4 0TOTAL 197 200 97
Ownership in this Data means those Batwa who have agreements withorganisations/individuals who resettled them these plots of land. During thedata collection most Batwa extended their fear of lack of ownership to theplots of land they live on. This attributes to low production of food in someBatwa settlements.
In table 2.1 out of 397 households in Kisoro only 197 have land whichrepresents 49.6% while out of 197 that have land only 97 have ownershipwhich represents 49.2% of the population with land, in addition the landlesshouseholds represents 50.4% of the total households.It should also be noted that most families who have land still have smallportions which can not be used to produce enough food to satisfy theirfamilies as well as sell to get some income.
ORGANISATIONS THAT BOUGHT LAND.
Various organisation purchased land for the Batwa in Kisoro district theseinclude Bwindi Mgahinga Conservation Trust (BMCT), AdventistDevelopment Relief Agency (ADRA), Muhabura Diocese, Compassion,Missionaries and a few Batwa individuals inherited land from their grandparents and former colonial chiefs this is shown in table below.
Table 2.1.1 shows organisations that bought land for the Batwa
Community TRUST ADRA INHERITED KSRODIOCESE
COMPERSSION
Mukungu 18 - - 3 -Sanuriro 14 - 1 - -Rushaga 14 - - - -Kashija 8 - - - -Birara - 18 - - -Rugeshi - - - - -

20
Biizi 8 3 - - -Kamugyemanyi - - 9 - -Gatera - 12 6 - -Kagano - - - - -Gitebe - 24 1 - -Kamugoye - 4 - - -Rushekye 2 - - - -Rukeri &Kabale
1 2 4 - -
Musasa - - - - -Kanyabukungu - 1 4 - 1Mperwa - - 11 - -Towncouncil - 3 3 17 -Muyove - - 8 - -Ryamigogo 6 - - - -Ryabitukuru 12 - - - -Mabungo - - - - -TOTAL 83 67 47 20 1
In table 2.1.1 show that Trust resettled about 83 households which represent42.196 of the 197 of the household resettled in Kisoro while ADRA resettled67 households which represent 34%.In addition Rtd. Bishop Sharita under the Muhabura Diocese set up 17housing units for households. Further more 47 households that represent23.9 % of the total household that have land in Kisoro inherited land fromtheir parents.
According to this data in table 2.1.1, it’s clear that 4 people benefited frommore than one organisation for pieces of Land this deprived the rest not toget land, this was mainly the organisation which bought land didn’t consultthe Batwa organisation. In a similar development these organisations bought land in hilly areaswhich are not fertile this has caused some Batwa not permanently stay onsuch land this was caused by not involving the Batwa during purchasing ofthis land.

21
3. EDUCATION:Education is the key for development and social transformation in anysociety however the Batwa have not yet embraced this practice which maketheir society backwards. In this data, education is categorised according todifferent levels i.e. primary level, secondary level and tertiary level
Primary levelIt will be realised that most Batwa children are in this level of education asmay be shown in the following table.
Table 3.1 shows Batwa children and their classes.Community P.1 P.2 P.3 P.4 P.5 P.6 P.7Sex M F M F M F M F M F M F M FMukungu 11 6 3 4 1 5 - - - - - - - -Sanuriro 10 5 3 3 1 1 - - 2 - - - - -Rushaga 9 4 - - - 1 - - - - - - - -Kashija 1 2 - 1 - 1 - - - - - - 1 1Birara 12 3 - 1 - - 1 - - - - - - -Rugeshi - - - - - - - - - - - - - -Biizi 6 4 - 2 1 1 - 1 1 - - - - -Kamugyemanyi - - 2 2 - - - - - - - - - -Gatera 2 5 1 - 1 2 1 - - - 1 - - -Kagano 1 - - - - - 1 - - - - - - -Gitebe 10 8 3 2 3 1 - 1 - - 1 - 1 -Kamugoyi - 5 1 - - - - - - - - - - -Rushekye - 1 - - - - - - - - - - - -Rukeri 2 2 3 - 3 2 1 - - - - - - -Kabale&Musasa - - - - 2 - - 1 - - 1 - - -Kanyabukungu - - - 1 1 1 - - 1 - 1 - - -Mperwa 4 1 1 - 1 - - - 1 - - - - --Towncouncil 2 4 2 1 2 1 - - - - - - 1 2Muyove 1 4 2 - - - - - 1 - 1 - 1 -Ryamigogo 6 3 - 1 1 1 - - - - - - - -Mabungo - - - - - - - - - - - - - -TOTAL 77 57 21 18 17 17 4 3 6 - 5 - 4 3
From table 3.1, 134 males are in primary level in Kisoro District whichrepresents 57.8 % of the total children at primary level while 98 females thatrepresents 42.2 of total children at primary level. In addition about 74.6%

22
are in both primary one and primary two while 10.8% are from primary 2-7,this is a clear indication that most Batwa children drop out because ofvarious reasons including luck of food, early marriages, starting school at anold age, much harassment at school. Comparing 2004 Data and 2007
Table 3.1.2 Compares 2004 and 2007
Particular % of 2004 % of 2007
Males 48.5 57.8Females 51.6 42.2
According to the table 3.1.2 the percentage of girls at school has greatlydeclined due to especially early marriages, looking for food for the familyand involving them at work as maids in other people’s homes. This is anissue to address in order to reduce the rate of school drop out.
Secondary levelThis is shown in table 3.2 below, with only three children at this level.Table 3.2 shows students and their classes.
Community S.1 S.2 S.3 S.4 S.5 S.6Sex M F M F M F M F M F M FGatera - 2 - - - - - - - - - 1TOTAL - 2 - - - - - - - - - 1
In table 3.2, there are two females in senior one and senior six in the wholeof Kisoro Batwa communities. These students come from Gatera Batwacommunity. The factor which may have influenced these girls may be thereligion of Adventist in the area and support from ADRA.
Vocational levelTable 3.3 shows youth in vocational training
community Male Female TotalMuyove 1 3 4
Although this is the level of education where Batwa communities/societycan benefit from since graduates from such trainings can easily get workthus money which they may ably utilise to transform the Batwa society.

23
According to table 3.3 one male and three females are under vocationalTraining all these come from Muyove Batwa community Busanza sub-county. This is due to the presence of Adventist religion in the area thatsponsored the Batwa in education and other social activities as well aseconomic activities.
Literacy rateHere the term looked at the Batwa who know how to read and write howeverit should be noted that the Batwa who are shown below may not be eloquentin speaking or reading English.
Table 3.4 shows Batwa in their communities who know how to read andwrite.Community Male Female TotalMukungu 7 5 12Sanuriro 8 3 11Rushaga - 1 1Kashija 1 1 2Birara 2 1 3Rugeshi - - -Biizi 3 4 7Kamugyemanyi 1 1`Gatera 3 5 8Kagano 3 - 3Gitebe 4 2 6Kamugoye - - -Rushekye - - -Rukeri 9 5 14Musasa & Kabale 3 1 4Kanyabukungu 6 4 10Mperwa 2 - 2Towncouncil 6 8 14Muyove 4 4 8Ryamigogo 2 1 3Ryabitukuru 1 - 1mabungo - - -TOTAL 64 46 110

24
According to table 3.4 Kisoro literacy rate is at 7.1% while the literacy ratefor Kisoro district (according to 2002 Uganda population and housingcensus is at 55.9%.Also literacy rate for Batwa males is at 8.7% compared to Kisoro maleliteracy rate of 70.1% (according to 2002 census) while it is at 5.6% inBatwa females compared to 45.3% in total female population of Kisoro.
Literacy rate in percentage
Table 3.4.1Community % rate of those who know how to read
Mukungu 10.9Sanuriro 10Rushaga 0.9Kashija 1.8Birara 3.6Rugeshi 0Biizi 6.4Kamugemanyi 0.9Gatera 7.3Kagano 2.7Gitebe 5.6Kamugoyi -Rusheke -Rukeri 12.7Kabale & musasa 3.6Kanyabukungu 9.1Mperwa 1.8Town council 12.7Muyove 7.3Ryamugogo 2.7

25
4. HealthIron roofed houses and pit latrines
Tables 4.1 shows Batwa with iron roofed house and pit latrines
Community Iron roofed house Latrine Public latrineMukungu 4 7 -Sanuriro 2 12 -Rushaga - 12 -Kashija 1 2 -Birara 4 18 -Rugeshi - 7 -Biizi 2 13 -Kamugyemanyi - - 8Gatera 3 12 -Kagano - 10 -Gitebe 6 22 -Kamugoye - - -Rushekye 1 1 3Rukeri 1 2 -Musasa - 1 -Kanyabukungu 3 3 -Mperwa - 3 -Towncouncil 14 3 21Muyove 8 8 -Ryamigogo - - -Ryabitukuru - - -Mabungo - - -Kabale 1 3 -TOTAL 50 139 32
According to table 4.1, 50 households have iron roofed houses theserepresents 12.7% of the total households in Kisoro however according to2002 Uganda census Kisoro has about 36,844 iron roofed houses whichrepresents 75.9% of the total Kisoro households.This indicates that the Batwa who have iron roofed house are few that thedistrict’s average which is an indicator of high level of poverty in thesociety.

26
Also in table 4.1, 139 households have pit latrines this represents 35.4% ofBatwa households in Kisoro.This is a low percentage since toilets are important in fighting unhygienicconditions or diseases.In addition 32 households use public toilets in their communities.This represents 8.1% of total Batwa households in Kisoro however thesepublic pit latrines were found to be dirty since they below to no oneaccording to the Batwa.
4.2 CommunicationSince information is power there was need to ascertain whether the Batwahave access to information through radios. The results are represented as inthe table below.
Table 4.2 shows number of house hold that have radios.
Community Presence ofradio
Total households
%of HH withradios
Mukungu - 32 -Sanuriro 11 18 61.1%Rushaga - 14 -Kashija 4 8 50%Birara 10 32 31.2%Rugeshi 1 12 8.3%Biizi 4 19 21.1%Kamugyemanyi - 10 -Gatera 2 25 8%Kagano 4 12 33.3%Gitebe 15 52 28.8%Kamugoye - 11 -Rushekye - 5 -Rukeri 2 28 7.1%Musasa 4 17 23.5%Kanyabukungu 2 12 16.6%Mperwa 4 12 33.3%Towncouncil 6 30 20%Muyove 1 11 9.1%Ryamigogo - 19 -
27
Ryabitukuru - 14 -Mabungo - 4 -TOTAL 70 397 17.6%
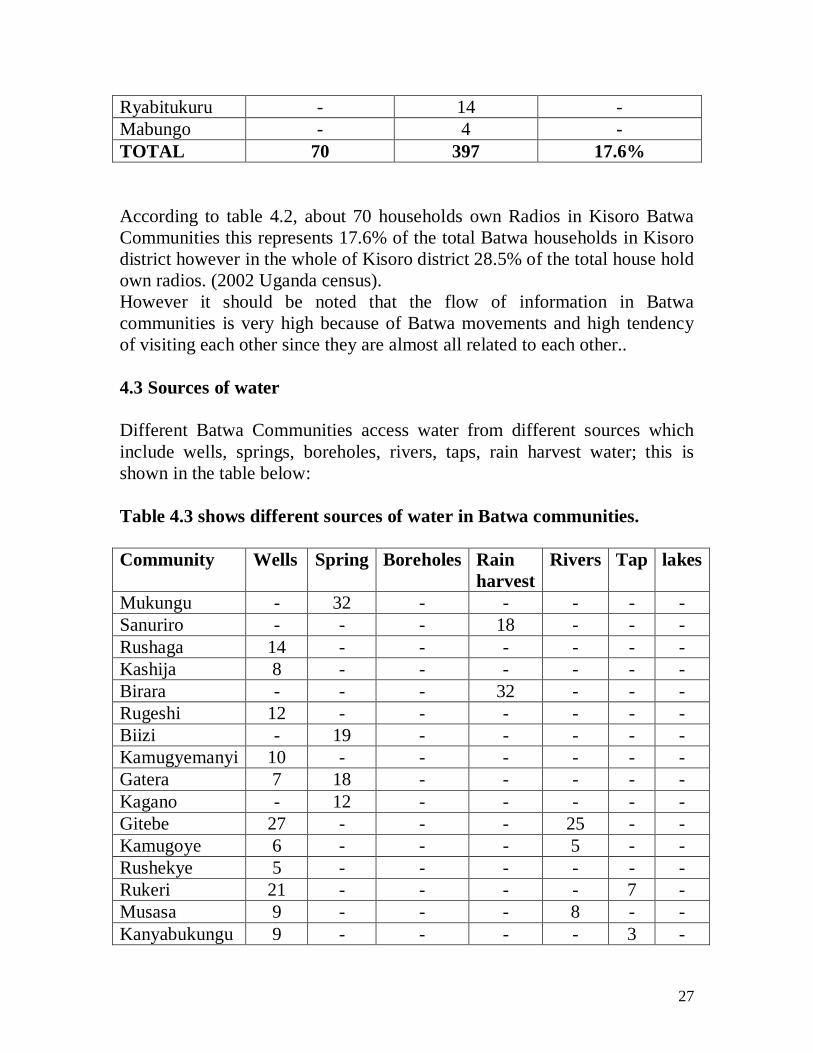
According to table 4.2, about 70 households own Radios in Kisoro BatwaCommunities this represents 17.6% of the total Batwa households in Kisorodistrict however in the whole of Kisoro district 28.5% of the total house holdown radios. (2002 Uganda census).However it should be noted that the flow of information in Batwacommunities is very high because of Batwa movements and high tendencyof visiting each other since they are almost all related to each other..
4.3 Sources of water
Different Batwa Communities access water from different sources whichinclude wells, springs, boreholes, rivers, taps, rain harvest water; this isshown in the table below:
Table 4.3 shows different sources of water in Batwa communities.
Community Wells Spring Boreholes Rainharvest
Rivers Tap lakes
Mukungu - 32 - - - - -Sanuriro - - - 18 - - -Rushaga 14 - - - - - -Kashija 8 - - - - - -Birara - - - 32 - - -Rugeshi 12 - - - - - -Biizi - 19 - - - - -Kamugyemanyi 10 - - - - - -Gatera 7 18 - - - - -Kagano - 12 - - - - -Gitebe 27 - - - 25 - -Kamugoye 6 - - - 5 - -Rushekye 5 - - - - - -Rukeri 21 - - - - 7 -Musasa 9 - - - 8 - -Kanyabukungu 9 - - - - 3 -

28
Mperwa 6 6 - - - - -Towncouncil - - - - - 30 -Muyove - 11 - - - - -Ryamigogo 19 - - - - - -Ryabitukuru 14 - - - - - -Mabungo 7 - - - - - -TOTAL 174 98 - 50 38 40 -
According to table 4.3, the majority of the kisoro communities obtain theirwater from the wells followed by spring, rain harvesting , taps and riversources in that order. This implies that 310 families use dirty water sincethey obtained it from sources which are not treated. These families representabout 77.5% of the total house holds in kisoro district Batwa communities.Also during this exercise the Batwa who get water from taps especially inthe town council explained that it is costly sometimes for them to get moneyto buy a jerican of water which implied that they some times get water inother sources which may not be clean.
4.4 Immunisation and antenatalDuring the data collection the Batwa were asked whether they access healthservices that include immunisation and antenatal services from their near byhealth centres since they are freely provided by the government.The results are shown in table 4.4
Table 4.4 shows number of households that access health services.
Community Immunisation AntenatalMukungu 25 25Sanuriro 17 17Rushaga 10 11Kashija 7 8Birara 15 15Rugeshi 8 7Biizi 15 15Kamugyemanyi - -Gatera 13 13Kagano 11 10Gitebe 28 29Kamugoye - 1

29
Rushekye 2 2Rukeri 9 12Musasa 1 1Kanyabukungu 4 4Mperwa 5 5Towncouncil 4 5Muyove 5 7Ryamigogo 13 14Ryabitukuru 13 14Mabungo - -TOTAL 205 215
Table 4.4 shows that 205 families take their children for immunisation while215 attend antenatal care from hospitals near their communities. Howeverimmunisation is at 51.6% while antenatal is at 54.2% compared to totalhouseholds of Kisoro Batwa communities.Although the percentages show above 50% they are still low since theseservices are freely provided by the government health centres in Uganda.
4.5 Households that lost children
Various families have lost children and therefore for proper planning theOrganisation wanted to know how many households have lost children.Table 4.5 shows households that have lost children
Community No: of H/Hwho lost achild
Total H/H
Mukungu 7 32Sanuriro 8 18Rushaga 4 14Kashija 2 8Birara 10 32Rugeshi 5 12Biizi 4 19Kamugyemanyi 3 10Gatera 5 25Kagano 5 12Gitebe 20 52

30
Kamugoye 2 11Rushekye - 5Rukeri 5 28Musasa 5 17Kanyabukungu 1 12Mperwa 5 12Towncouncil 3 30Muyove 4 11Ryamigogo 8 19Ryabitukuru 1 14Mabungo 3 4TOTAL 110 397
Table 4.5 shows that about 110 families have ever lost a child whichrepresent 27.7% of the total households in Kisoro district.
4.6 Causes of death of childrenTable 4.6 shows various causes of death for children in kisoro
Community Malaria kafura poison pneumonia kwashiorkor
measles Badspirit/demons
worms dysentery
Mukungu 6 - 1 - - - - - -Sanuriro 2 - - 1 2 1 2 -Rushaga 3 1 - - - - - - -Kashija 2 - - - - - - - -Birara 8 1 - - - - - 1 -Rugeshi 3 - - 2 - - - - -Biizi 1 - - 2 - 1 - - -Kamugyemanyi
3 - - - - - - - -
Gatera 2 - - 1 2 - - - -Kagano 5 - - - - - - - -Gitebe 6 8 1 2 3 - - - -Kamugoye 1 - - - 1 - - - -Rushekye - - - - - - - - -Rukeri 4 1 - - - - - - -Musasa 3 2 - - - - - - -Kanyabukungu
1 - - - - - - - -

31
Mperwa 2 1 - - 1 - - - 1Towncouncil 3 - - - - - - - -Muyove 4 - - - - - - - -Ryamigogo 6 - - - 2 - - - -Ryabitukuru - - - - - - 1 - -Mabungo 3 - - - - - - - -TOTAL 68 14 2 8 11 2 3 1 1
According to table 4.6 about 68 families declared that it was malaria thatclaimed the death of their children and this represents 61.8% of the totalhouse holds that lost kids in Kisoro. More so all the diseases identified arepreventable and therefore there is need to address the hygiene problem inBatwa communities plus sensitising these communities about the importanceof visiting health centres whenever they are not feeling well.
4.7 HIV testing and ARVs awareness in Kisoro
TestedCommunityM F
knowledge aboutARVs
Mukungu - - -Sanuriro 2 3 2Rushaga - - 6Kashija - - -Birara - - 6Rugeshi - - -Biizi - - -Kamugyemanyi - - -Gatera - - 3Kagano - - 5Gitebe - - -Kamugoye - - -Rushekye - - -Rukeri - - -Musasa - - -Kanyabukungu - - -Mperwa - - -Towncouncil 2 2 2Muyove - - 4Ryamigogo - - -

32
Ryabitukuru - - -Mabungo - - -TOTAL 2 5 28
According to table 4.7 only 7 Batwa have ever tested HIV /AIDS in Kisorowhile 28 Batwa know about ARVs. This is a very low number yet somecommunities are near towns or trading centres. There is need to educate theBatwa about AIDS through show of videos and drama which has a strongimpact in society.
Comparison of some developmental indicators in Kisoro district;The following table will show some developmental indicators in Kisorodistrict compared to the Batwa in the same district.
Table showing developmental indicators:
Particular Batwa Kisoro population % of Batwa vs. totalPopulation.
Iron roofed house 50 36844 0.14%Radio ownership 70 13833 0.5%Open wells 174 22037 0.8%Bore hole - 550 -Spring 98 12705 0.77%Rain harvest 50 4977 1%River 38 - -Tap 40 6603 0.6%latrine 171 5982 2.9%

33
5.0 DATA REPORT FOR KABALE
Batwa of Murubindi on data collection day.
Kabale district sub-counties were Batwa communities are situated. This isrepresented in a table as below.Sub-county Batwa communityIkumba kaaraMuko Karengyere& RwamahanoBufundi Muribindi, Kashasha &KinyarushengyeButanda Makanga & Mirambo
5.1 Population composition
Kabale district has 9 Batwa communities with 774 Batwa male and femalein different sub-counties of Kabale.The table below shows communities and their population according to theirsex status.
Table 5.1 shows Kabale Batwa population by sex
Community Male Female Total No: of householdMurubindi 87 89 176 51Kisenyi 22 21 43 11Makanga 34 38 72 22Kinyarushengye 52 42 94 21Nyakabungo 31 28 59 14Mirambo 21 23 44 14Karengyere 44 49 93 25Rwamahano 81 94 175 53

34
Kaara 10 8 18 4TOTAL 382 392 774 215
Table 5.1 shows that out of 9 Batwa communities in Kabale districtMurubindi has the highest number of Batwa totalling to 176 men andwomen followed by Rwamahano with 175 while the community with theleast population is Kaara with 18 Batwa and 4 families.In the same table the number of house hold within 9 Batwa communities is215 house holds with Rwamahano having 53 families which represents24.7% of the total house holds in Kabale district.
According to the table 5.1 there are 385 males compared to 395 females.These figures show that the ratio of males to females is 1:1.03.In addition 385 males represent 49.9% of the whole population while 385females represent 51% of the total population. The above ration shows thatfor every one male there are 1.03 females.
5.2 Percentage of house holds in relation to total house holds in KabaleTable 5.2 shows percentage of households.
Community House hold Percentage(%)
Murubindi 23.7Kisenyi 5.1Makanga 10.2Kinyarushengye 9.8Mirambo 6.5Karengyere 11.6Rwamahano 24.7Kaara 1.9Nyakabungo 6.5Total house holds is 215.
Table 5.2 shows the percentage of the households of different communitiesin relation to the total house holds in Kabale Batwa communities.According to the table Rwamahano has 24.7% of the total house hold inKabale while Kaara has 1.9% of house holds which is the community withleast number of household.

35
5.3 Composition by ages
According to this data children are between 0-8, youth 9-18, Adult 18- 45and old above 45 years. The table below shows different age brackets withrespective population.
Table 5.3 shows population by age.
Community 0-8 9-18 18-45 Above 45 TotalMurubindi 63 23 75 15 176Kisenyi 19 3 20 1 43Makanga 27 7 25 13 72Kinyarushengye 26 23 37 8 94Nyakabungo 26 8 19 6 59Mirambo 14 8 21 1 44Karengyere 23 22 41 7 93Rwamahano 40 44 74 17 175Kaara 7 3 8 - 18TOTAL 245 141 320 68 774
According to table 5.3 Kabale has 245 children, 141 youth, 320 Adults and68 old both males and females. This implies that the population has about461 labour forces which can be productive this represents 59.6% of the totalpopulation of Batwa in kabale district. In addition table 5.3 shows that thereare 68 old Batwa in the 9 Batwa communities of Kabale district. Therefore the table 5.3 indicate that Kabale Batwa is reliable in all circlessince all age brackets are represented.
5.4 Percent of the age brackets
Particulars PercentageChildren 31.7Youth 18.2Adult 41.3Old 8.8
36
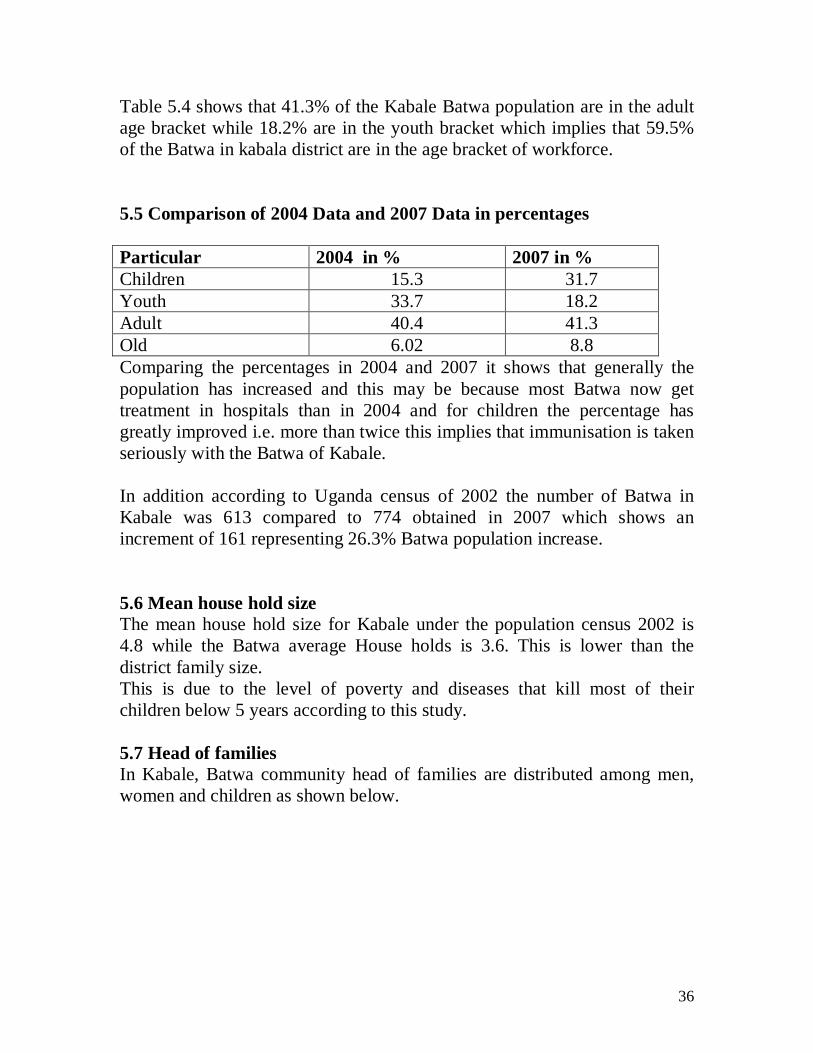
Table 5.4 shows that 41.3% of the Kabale Batwa population are in the adultage bracket while 18.2% are in the youth bracket which implies that 59.5%of the Batwa in kabala district are in the age bracket of workforce.
5.5 Comparison of 2004 Data and 2007 Data in percentages
Particular 2004 in % 2007 in %Children 15.3 31.7Youth 33.7 18.2Adult 40.4 41.3Old 6.02 8.8Comparing the percentages in 2004 and 2007 it shows that generally thepopulation has increased and this may be because most Batwa now gettreatment in hospitals than in 2004 and for children the percentage hasgreatly improved i.e. more than twice this implies that immunisation is takenseriously with the Batwa of Kabale.
In addition according to Uganda census of 2002 the number of Batwa inKabale was 613 compared to 774 obtained in 2007 which shows anincrement of 161 representing 26.3% Batwa population increase.
5.6 Mean house hold sizeThe mean house hold size for Kabale under the population census 2002 is4.8 while the Batwa average House holds is 3.6. This is lower than thedistrict family size.This is due to the level of poverty and diseases that kill most of theirchildren below 5 years according to this study.
5.7 Head of familiesIn Kabale, Batwa community head of families are distributed among men,women and children as shown below.

37
Table 5.7 shows head of family in different communities
Community Man Woman childMurubindi 39 9 2Kisenyi 9 2Makanga 17 3Kinyarushengye 20 1Nyakabungo 11 2Mirambo 9 4Karengyere 20 1Rwamahano 36 11Kaara 3 1TOTAL 164 34 2
Table 5.7 shows that 179 families are headed by men who represent 83.2%,while 34 families are headed by women that represent 15.8% of the households and 2 families are headed by children that represent 0.9% of the totalhouse holds. Also this table shows that Kabale Batwa have about 15 households that are polygamists since table 5.7 shows 200 the number of familieswhile table 5.1 shows 215. The difference is the house holds that share thehead or men that have more than one wife.
6.0 LandLand as one of the important factor of production has remained scare to theBatwa since their eviction. In this data the interviewer asked the Batwaabout land and its ownership plus the organisation that purchased such land.6.1 Land ownership
Table 6.1 shows land and land ownership among Batwa communities.
Community Land Landless ownership Total house holdMurubindi 26 25 23 51Kisenyi 4 7 3 11Makanga - 22 - 22Kinyarushengye 7 14 - 21Nyakabungo 7 7 4 14Mirambo 7 7 - 14Karengyere 5 20 - 25Rwamahano 23 30 19 53

38
Kaara 4 - - 4TOTAL 83 132 49 215
In table 6.1, 83 Batwa households have land compared to 215 house holdsin Kabale district. This represents about 38.6% of the total house hold.This leaves 132 house holds in Kabale Batwa communities with no land andthis represents 61.4%. This explains why most Batwa are still poor sincethey don’t have access to the main factor of production in rural areas.Further more the interviewer contained ask whether the 83 families haveownership of the land they posses. It was ascertained that only 49 households posses agreements which represents 59% of those house holds thathave land.This fact affects most Batwa and leads to low production on such land sincethey do not know when they will be chased away.Also during the interviews the Batwa explained that those with personal landthe possession are too small for agriculture.
6.2 Organisations that purchased land for the Batwa
Table 6.2 shows owners that purchased land for Batwa in Kabale.
Community TRUST AICM INHERTEDMurubindi 22 10 1Kisenyi - 1 3Makanga - - -Kinyarushengye - 9 -Nyakabungo - 2 5Mirambo - - -Karengyere 5 - -Rwamahano 19 4 -Kaara - 4 -TOTAL 46 30 9
Table 6.2 shows that TRUST resettled 46 households while AICM resettled30 households, however, all the Batwa house holds leaving on AICM landdo not have agreements for the land they are staying on. Also they do nothave boundaries they leave on it as communal land this hampers productionin such communities.

39
7.0 Education.
Education being one of the priorities of UOBDU strategic plan the datacollection team looks at it in details.Batwa are still lagging behind on education yet it’s important for societaldevelopment. The table below shows classes and different children bothmales and females in different classes
7.1 Primary level.In this level Kabale Batwa are being shown as in the table below.
Table 7.1 shows pupils and their classes
Community P.1 P.2 P.3 P.4 P.5 P.6 P.7Sex M F M F M F M F M F M F M FMurubindi 20 15 4 8 - 1 - - - - - - - -Kisenyi 2 - - - - 1 - - - 1 - - - -Makanga 7 3 1 2 1 - - - 1 - - 1 - -Kinyarushengye 2 5 3 2 1 1 1 - - - - - 2 -Nyakabungo 2 1 - - - - - - - - - - - -Mirambo 4 - - 3 - 1 - - - - 1 - - -Karengyere 6 5 2 - 1 - - - - - - - - -Rwamahano 14 14 10 2 5 - - - - - - - - -Kaara 2 - - - - - - 1 - - - - - -TOTAL 59 43 20 17 8 4 1 1 1 1 1 1 2 -
According to table 7.1, 159 children are in primary schools compared to 386children in Kabale. This represents 41.2% of the total children in Kabale.Furthermore, from P.3 to P.7 there are only 20 pupils (13 males and 7females) which represent 12.6% of the total pupils in schools. This impliesthat the rest 87.4% are in either P.1 or P.2 which signifies that the rate ofdrop out is high.
7.2 Secondary level.
After tallying the results showed that there is only one boy in senior one andhe heals from Kinyarushengye Batwa communities.
40
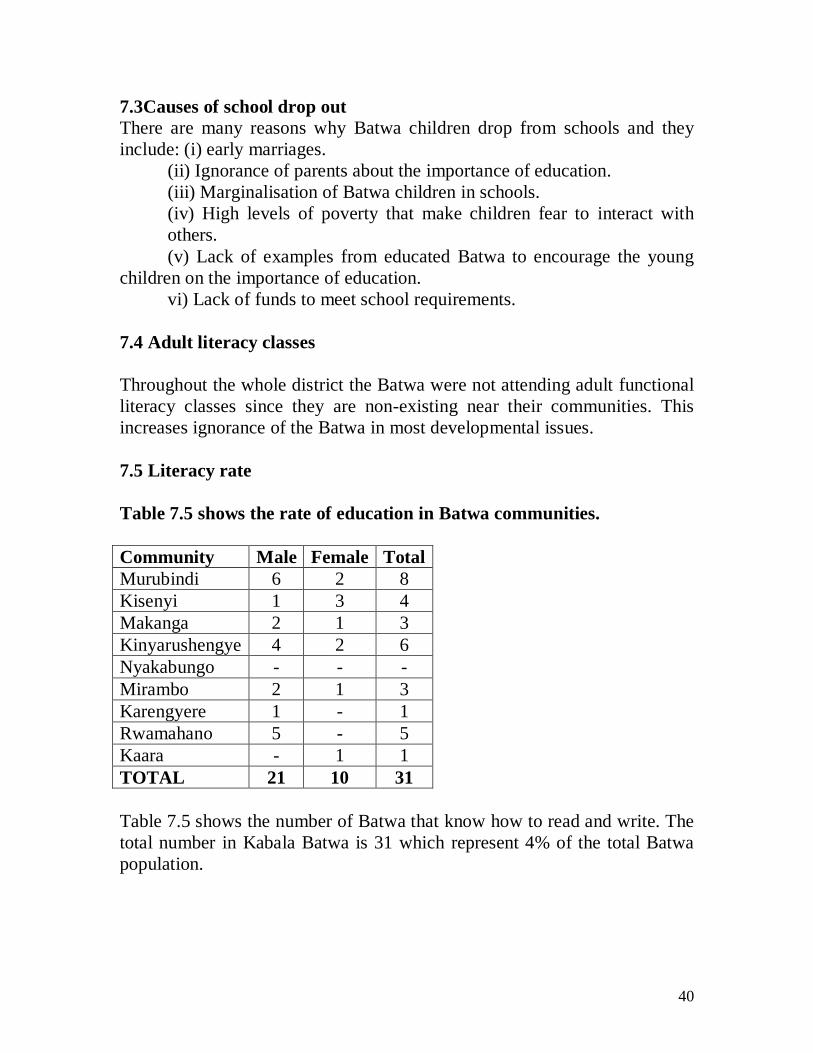
7.3Causes of school drop outThere are many reasons why Batwa children drop from schools and theyinclude: (i) early marriages. (ii) Ignorance of parents about the importance of education. (iii) Marginalisation of Batwa children in schools.
(iv) High levels of poverty that make children fear to interact withothers.(v) Lack of examples from educated Batwa to encourage the young
children on the importance of education.vi) Lack of funds to meet school requirements.
7.4 Adult literacy classes
Throughout the whole district the Batwa were not attending adult functionalliteracy classes since they are non-existing near their communities. Thisincreases ignorance of the Batwa in most developmental issues.
7.5 Literacy rate
Table 7.5 shows the rate of education in Batwa communities.
Community Male Female TotalMurubindi 6 2 8Kisenyi 1 3 4Makanga 2 1 3Kinyarushengye 4 2 6Nyakabungo - - -Mirambo 2 1 3Karengyere 1 - 1Rwamahano 5 - 5Kaara - 1 1TOTAL 21 10 31
Table 7.5 shows the number of Batwa that know how to read and write. Thetotal number in Kabala Batwa is 31 which represent 4% of the total Batwapopulation.

41
8.0 HealthFor any community to develop there is need for healthy citizens, thisincreases the ability of the work force to accomplish their duties.
8.1DeathThe table below shows the number of house holds that has lost children.
Table 8.1 shows House holds that lost children.
Community H/H lost a child Total house holdMurubindi 27 51Kisenyi 9 11Makanga 11 22Kinyarushengye 10 21Nyakabungo 4 14Mirambo 4 14Karengyere 12 25Rwamahano 25 53Kaara 2 4TOTAL 104 215
In the table 8.1, 104 households have ever lost at least a child. Thisrepresents 48.4% of the total house holds and most of these families have atleast lost more than two children.According to the table Murubindi ranks highest with about 27 house holdsloosing children while Kaara has lost 2 children.
8.2 Causes of deathDuring the data collection the team realised that most diseases arepreventable therefore there is need for health sensitisation.Table 8.2 shows various causes of death to children
Community Malaria Pneumonia Kwashakwor Diarhorea kafura poison MesealesMurubindi 16 4 3 1 3 - 1Kisenyi 6 1 1 - 1 - -Makanga 8 - - - - 1 -Kinyarushengye 8 1 1 - - - 1Nyakabungo 2 1 2 - - - -Mirambo 2 1 - 1 - - -

42
Karengyere 11 - - - 6 - -Rwamahano 13 5 1 - 6 1 2Kaara 2 - - - - - -TOTAL 68 13 8 2 16 2 4
According to table 8.2 there are 68 deaths that were caused by malaria. Thismakes malaria the most killer disease to the Batwa children in Kabaledistrict. This represents 60% of the death identified.Another common disease identified is Kafura. This is common to variousBatwa communities. It has claimed 16 deaths which represent 14.2 % of thetotal death identified. In the table all the diseases that kill Batwa arepreventable therefore much sensitization is required to prevent the death ofinnocent Ugandan Batwa children.In addition there is hygiene problem where about 8 deaths are claimed bykwashakwor, this is the sign of poor feeding habits which calls for feedingof children with balanced diet.
8.3 HousingSince eviction the Batwa housing conditions have been poor and this datacollection looked at how many Batwa house holds have iron roofed housesand below is the table that shows number of house holds that have ironroofed houses.
Table 8.3 shows households with iron roofed houses.Community Iron roofed
House holdsTotal Households
%of iron roofedHouse holds
Murubindi 2 51 3.9Kisenyi - 11 -Makanga 7 22 31.8Kinyarushengye - 21 -Nyakabungo 1 14 7.1Mirambo - 14 -Karengyere - 25 -Rwamahano 2 53 3.8Kaara - 4 -Total 12 215 5.6
According to table 8.3 shows only 5.6% of all the house holds have ironroofed houses in Kabale Batwa communities.

43
This implies that 94.4% of the house holds have grass thatched houses orhuts. In all the communities Makanga has 31.8% of its households with ironroofs while Murubindi has the least households with iron roofed houses.Kabale has only 12 Batwa houses with iron roofs while the rest are poorglass thatched huts (Obutindi). Many Batwa communities in Kabale have noiron roofed houses which include among others Kaara, Kisenyi,Kinyarushengye, Mirambo and Karengyere.
8.4 SanitationSanitation is still low among Batwa communities and this is shown in thetable below.
Table 8.4 shows house holds that have pit-latrine.
Community H/H with Latrine Public latrine Total house holdMurubindi 18 - 51Kisenyi 2 - 11Makanga 1 19 22Kinyarushengye 3 6 21Nyakabungo 2 - 14Mirambo - 8 14Karengyere 2 - 25Rwamahano 9 - 53Kaara - - 4TOTAL 37 33 215
Table 8.4 shows that 37 house holds have latrines while 33 house holds usethe public latrines, therefore 70 house holds have access to latrine facilitiesthis represents 32.6% of the total households in Kabale district.This percentage is still low since it leaves 67.4% of the households withoutlatrine. This situation puts the community at a risk of suffering from choleraand dysentery which may affect both children and Adults plus other societyaround their communities.

44
8.5 Water.Water is a source of life to human beings, animals and plants.There are different sources of water in both Batwa communities and nonBatwa communities below is a table showing different sources of waterin Batwa communities.
Table 8.5 shows different source of water
Community Wells Spring Rain harvest River lakeMurubindi - 49 2 - -Kisenyi - 9 1 1 -Makanga 21 - 1 - -Kinyarushengye 4 17 - - -Nyakabungo - 14 - - -Mirambo - 2 - - 12Karengyere 23 - 2 - -Rwamahano 34 17 2 - -Kaara - - - 4 -TOTAL 82 108 8 5 12
According to table 8.5 most Batwa communities’ access spring water andthis is represented by 108 households followed by wells that have 82households.However through the discussion with Batwa it was discovered that Batwadon’t boil water for drinking which put them at a risk of acquiring waterborne diseases that may be a cause of some of he deaths of children.From table 8.5 about 99 households use dirty water which may put theirlives in danger.
8.6 HIV/AIDS.Through the data collection period all the Batwa were asked whether theyknew about AIDS causes, treatment and also if they had ever tested forHIV/AIDS. These are their responses represented in the table.

45
Table 8.6 shows knowledge about ARVs and test of HIV/AIDS.
Community Tested AID/HIVsex Male female
Knowledge on ARV’s
Murubindi 1 - 1Kisenyi 1 1 2Makanga - - -Kinyarushengye - - 1Nyakabungo - - -Mirambo - - -Karengyere - - -Rwamahano 2 3 1Kaara - - -TOTAL 4 4 5
Table 8.6 shows that only 8 people have ever tasted for HIV or knowtheir status on HIV/AIDS. This represents 1.03% of the total populationof the Batwa in Kabale district.However still there are only 5 people who know about ARVs whichrepresents 0.65% of the total Batwa population.This implies that the Batwa of Kabale do not have knowledge andinformation about HIV/AIDS which puts them at a risk of acquiringAIDS and other sexual transmitted diseases therefore there is need tosensitise them about the diseases through video shows or drama andmusic. During the data collection it was realised that most Batwa don’tknow the prevention methods against AIDS especially the use ofcondoms and ABC approach. Therefore there is great need to make theBatwa society aware of such approach or strategy.
8.7Attendance for health services.The following table shows number of households that immunise andattend antenatal services from health centres near their communities.

46
Table 8.7 shows attendance for immunisation and antenatal.
Community MaternityService
Immunisation Total house hold
Murubindi 26 32 51Kisenyi 6 6 11Makanga 11 13 22Kinyarushengye 12 13 21Nyakabungo 3 8 14Mirambo 7 7 14Karengyere 17 17 25Rwamahano 18 20 53Kaara 4 4 4TOTAL 104 120 215
Table 8.7shows that 120 households immunise their children whichrepresents 55.8% while 104 women utilise antenatal services in healthcentres which represents 48.3% of the total households.However it should be noted that all pregnant mothers should attendantenatal clinics while all children below 5 years be immunised to maketheir body have immunity against immunise able diseases thus reducingthe number of deaths for children.It was observed that Kaara has 100% in both utilising immunisation andantenatal services since all households access these services.
8.8 Radio Accessibility.Since this is information age there is need for every household to haveaccess to information by using any means where radio is one of them. Thetable below shows the number of households that have radios in KabaleBatwa communities.Table 8.8 shows possession of radio.
Community H/H with radios Total house hold % of H/H& radiosMurubindi 8 51 15.7Kisenyi 1 11 9Makanga 2 22 9Kinyarushengye 5 21 23.8Nyakabungo 2 14 14.2Mirambo - 14 -

47
Karengyere - 25 -Rwamahano 5 53 9.4Kaara - 4 -TOTAL 23 215 10.7
According to table 8.8 only 23 houses holds posses radios which represents10.7% of the total households. According to table 8.8 Kinyarushengye hasthe highest number of households that posses’ radios of 23.8%while Kisenyiand Makanga has the least with 9%. It should also be noted that Kaara,Karengyere and Mirambo households have no radios. This further explainsthe high levels of poverty in Batwa communities.

48
9.0 MBARARA DISTRICT
Mbarara Batwa of Nyamiyaga/Nyakayojo community.
Mbarara District is one of the districts where UOBDU located Batwa inthree separate communities. During the data collection in 2007 UOBDU alsoreached these communities and interviewed them here are their results intabular form.
9.1Data of the population by Sex/ Gender.
Table 9.1 shows population by Gender.
Community Male Female Household TotalKatete 2 5 3 7Biharwe 5 8 3 13Nyamiyaga/Nyakayojo
32 21 21 53
TOTAL 39 34 27 73
Table 9.1 shows the three Batwa Communities which lie within theMbarara municipal.According to the table Nyamiyaga/Nyakayojo Batwa Community whichis near Katatumbwa Academy has the highest number of householdswhich totals to 21families with a total population of 53 Batwa i.e. 34female and 39 male. Also during the data collection it was realized thatmost household are single or not married. This was as a result of highlevel of poverty in such households.

49
9.2 Population Composition by Age:According to this data population was classified in different age bracket andbelow is a table showing difficult age groups.
Table 9.2 shows different age brackets
Community 0 -8 9 - 18 18 - 45 Above 45 TotalKatete 3 - 4 - 7Bihame 6 2 4 1 13Nyamiyaga 9 22 19 3 53TOTAL 18 24 27 4 73
Table 9.2 shows that Nyamiyaga has many youth and adults who add up to41 Batwa.
During the interview it was observed that most youth in these Batwacommunities are independent and not married. This is because theirlandlords prefer single and energetic youth who can provide free labourwhenever it’s required.Also in table 9.2 it can be seen that Katete has no youth while only 4 Batwaare above 45 years of age.Further more all the three Batwa communities have 18 children 24 youth, 27Adults 4 old people. This gives the number of the labourforce being 51(24youth and 27 adults) which represent 69.9% of the total population.
9.3 Head of family.Table 9.3 shows head of the houses.
Community Man as head ofH/H
Woman as headof H/H
Children asH/H
Katete 2 1 -Biharwe 1 2 -Nyamiyaga 8 6 7Total 11 9 7
Table 9.3 shows that 11 household are headed by men, 9 house hold headedby women and seven headed by children.The 7 children head household because their parents can not be with them inrented houses thus forced to also rent by themselves.

50
9.4 Problems identified in Mbarara Batwa communities.During the study these Batwa were asked the main challenges they werefacing and below are their responses.
(i) Lack of land: It was observed that no Mutwa own land andtherefore some Batwa were scoters while majority rent houseswithin the municipal around Nyakayojo. The most serious problemidentified was that when they lost their dear ones they can’t getwhere to burry them, therefore this make them produce fewchildren.
(ii) School fees: As the Batwa communities stay in the town theyidentified lack of school fees for their children as the biggestproblem since they are just potters who don’t have a lot of moneyto cater for their family needs and school needs.
(iii) Rental fees: Since most Batwa families rent in town, rental feeswere sited as very expensive for most Batwa families. This is oneof the issues that make youth and children leave their homes whenthey are still young to look for jobs like house girls, fetching water,carrying rubbishes and many other things thus making themvulnelible to many health hazards.
(iv) Lack of cultivation: Because of lack of land the Batwa are notcultivating thus facing lack of enough food to feed their children.This make the Batwa do any job in order to sustain their families.
(v) Lack of burial site for their beloved ones. The Batwa interviewedtold the team that their land lords fear to provide burial site for thedeceased because they fear the Batwa later may claim such sites astheir own land. This creates one of the biggest problems for theBatwa thus limiting their capacity to produce or marry.
9.5 Land.Land as one of the important resource for production was found lacking inthese Batwa communities. As scatters the Batwa in Mbarara have no land.All Batwa households depend on other peoples land for survival.
Table 9.5 shows land and land ownership.Community Land No Land OwnershipKatete - 3 -Biharwe - 3 -Nyamiyaga - 21 -TOTAL - 27 -

51
Table 9.5 shows that no Batwa household in Mbarara that own land. Thisimplies that the level of poverty in such community in high since the mainfactor of production is absent in such community thus living the Batwa towork for cheap labour in order to survive.
9.6 Education.Education is still low in most Batwa communities even in Mbarara, Batwacommunities were not exceptional the details is shown in the table below.
Table 9.6 shows primary level classes distribution.
Table 9.6 shows that there is only one female in primary seven. This is theone on the highest Level of education in Mbarara Batwa community.In addition there is another boy in Primary four plus three children inprimary three. Again in katete there is no school going children.Education is still one of the most challenging areas in all Batwacommunities.More still there is no one in either vocational training or secondary level ofeducation in Mbarara Batwa communities.
9.7 Literacy Levels.Table 9.7 shows literacy rate in Mbarara Batwa community.
Community Males Females TotalBiharwe 1 2 3Nyamiyaga 15 3 18Total 16 5 21Table 9.7shows that there are only 21 Batwa who know how to write andlead in Mbarara Batwa which represented 28.8% of the total Population ofthe Batwa in Mbarara municipal. It was found that katete Batwa communityhas no one who knows how to read or write.
Community P.1 P.2 P.3 P.4 P.5 P.6 P.7Sex M F M F M F M F M F M F M FBiharwe 1Nyamiyaga 2 1 2 1 1 1Total 2 2 - - 2 1 1 - - - - - - 1

52
9.8 Communication.Households were asked whether they had radios and below are theirresponses.Table 9.8 shows households with radios.
Community H/H possesradio
Total H/H % of population
Katete - 3 %Biharwe 1 3 33.3%Nyamiyaga 1 21 4.8%Total 2 27 7.4%
From table 9.8 it is clear that there are only two households with radios whorepresents 7.4% of their total number of households in Mbarara Batwacommunities.This implies that the rate of information transmissions to such community isvery low, thus less development.
9.9 Health.
Since the Batwa community leave on cheap labour a health body is verynecessary for their survival. Therefore the findings below explain theirhealth status.
9.9.1 Sanitation and water:Table 9.9.1 shows various source of water in Batwa communities.
community well tap boreholes Springs riverKatete 3Biharwe 3Nyamiyaga 11 10Total 17 10 - - -
Table 9.9.1 shows that most household in Mbarara Batwa community fetchtheir water from wells, this represents 63% of the total households howeverthe rest 37% get their water from taps this necessitates money to buy water.This increase the level of poverty since most necessities must be bought.This implies that sometimes these 10 families fetch their water from othercheap sources which may be dirty.

53
9.9.2Latrine & Iron roofed houses.
Tables 9.9.2 shows latrine use.
community Iron roofed houses LatrineKatete - 1Biharwe - 3Nyamiyaga - 18Total - 22
Table 9.9.2 shows that there are only 22 households that have latrines to use.Also during the data collection process it was established that all householdswere renting and sleeping in hired iron roofed houses although Batwa don’town them.
9.10 Death of children in different households:
Table 9.10 shows number of household that lost a child.community H/H lost childKatete -Biharwe 3Nyamuyaga 3Total 6
According to table 9.10 six households have every lost at least a child withinthe last ten years this represents 22.2 % of total households in Mbararamunicipality Batwa community.
9.11 Causes of death.There are various causes of death especially to children and below are thecauses identified in Mbarara Batwa communities.Table 9.11 shows various causes of death.
Community Malaria MesealesKatete - -Biharwe 3 -Nyamiyaga 1 2TOTAL 4 2

54
Table 9.11 shows that malaria is the most killer for Batwa children inMbarara followed by meseales.As already observed in other Batwa settlement Malaria is one single highestkiller for Batwa children. There is need for sensitization to thesecommunities especially on the prevention and use of mosquito nets.
9.12 Maternity and Immunization.
Table 9.12 shows number of household that attend antenatal andImmunization.
Community Maternityservices
Immunization
Katete 1 1Biharwe 3 3Nyamiyaga 12 10Total 16 14
Table 9.12 shows that all Batwa households in Biharwe attend antenatal andalso immunize their children while 12 households out 21 go for antenatalservices in Nyamiyaga compared to one household in Katete BatwaCommunity.Out of 27 Batwa households in Mbarara only 16 houses got for antenatalservices while 14 household get immunization services. These numbers arestill low since these services are free and the communities are in town butwe have to put in mind that most household are singles.
9.13 HIV & AIDS testing and ARV’s awareness or knowledge.
Community Testing ARV’s AwarenessM F
Katete - - 2Biharwe - - 2Nyamiyaga - - 7Total 11
55
Table 9.13 shows that there is no Mutwa in Mbarara who has ever tested forAIDS / HIV however 11 Batwa know about ARVs this represents about15.1% of the total Batwa population in Mbarara. As a town communitythere is need for awareness about AIDS and knowledge about the preventionmethod/strategies like Abstinence Be faithful or use Condom. (ABCstrategy)

56
10.0: NTUNGAMO DISTRICT.
Batwa of kitwe with UOBDU Co-ordinator & CBO after data collection.
Ntungamo district is one of the places where the Ugandan census of 2002showed that there are Batwa. UOBDU visited the district and identified aBatwa community in the village called Kibale Kitwe town centre a fewkilometers to Rwanda board of Mirama hills.
10.1 Population distribution by Gender.Table 10.1 shows population distribution by gender.
Community Male Female H/hold TotalKabale Kitwe 24 16 12 40
According the table the settlement has 40 Batwa i.e. 24 males and 16females all of which rent out small pieces of land where they can constructhuts to stay in. This population /settlement have 12 households.The ratio of males to females is 1:07 meaning that for every one male thereis 0.7 females.10.2 Population composition by age.Table 10.2 shows population by age
Community 0-8 9-18 18-45 above 45Kabale Kitwe 12 7 17 4
Table 10.2 shows that there are 12 children 7 youth, 17 adults and 4 oldBatwa in Kibale Kitwe settlement.In addition the average per house hold is 3.3, which implies that averagelyeach family is expected to have 3.3 family members.

57
10.3 Head of family.It was realized that there are 12 households where 9 households are headedby men while 3 are headed by women. This implies that 75% of householdare headed by men while 25% are headed by women.
10.4 Problems identified during data collection.The Batwa of Ntungamo District explained to the researchers about theirchallenges which included among others:
(i) Land:Like those of Mbarara also the Batwa of Ntungamo lack land and for thenthey rent the pieces of land where they put up their huts: Here there isneither compound nor any space to put up a toilet/latrine. This makes theirlives hard thus increasing the level of poverty among the community.
Family’s only rented plot of land
(ii) School fees:Since Kitwe is a remote village or area in Ntungamo the Batwa childrendon’t go to school also this is fluked with the fact that as squatter, they workfor their food and anything else therefore children look for jobs like lookingafter people’s goats, working as house keepers and many others thusabandoning school at an early age and class.
(iii) Lack of projects to facilitate them.The groups informed the data collectors that they have never received anyproject to facilitate them in anything and therefore were very grateful toreceive UOBDU and requested for any project that can improve theirlivelihood.

58
10.5 Land.All the 12 households had no land on their own they were all renting whereto put up their houses this implies that they are all landless. This society liveon working for their survival in other people’s gardens and homes.
10.6 Education.Primary level.Kibale – Kitwe community had only one boy who is in primary one. This isstill a very high challenge to this community since education seems not to bevalued. This calls for a lot of sensitization on the importance of education.In addition all the members in Kitwe community don’t know how to readand write.
10.7 Communication.During the data collection process, it was found out that 5 families hadradios out of 12 households which represent 41.7% of the households. Sincethese households are close to each other it means that information can easilycirculate in such a community through radio.
10.8 Health.10.8.1 Death of children.Kibale – Kitwe Batwa community informed the data collectors that at least 3households had ever lost children and confirmed that malaria is responsiblefor 2 deaths (Households) while measles claimed death in one household.This confirms that malaria is still the major killer of Batwa children inKanungu Kisoro Kabale Mbarara and Ntungamo.
10.8.2 Latrine.The entire Batwa community of 12 households in Kitwe don’t own latrinesand this is mainly attributed to lack of ownership of land.
10.8.3 Water.The 12 Batwa households obtain their water from a borehole which is nearthe town centre. Therefore they relatively have clean water for home use.
10.8.4 Immunization antenatal and HIV/AIDS awareness.It was identified that only 3 households are immunizing their children andalso the same families are getting antenatal services. This represents about25% of the total household.

59
On the other hand there is no Mutwa who have ever tested HIV/AID andalso they don’t have any information about ARVs. This is a serious problemat this time and Kitwe being near the border, the community is at a higherrisk of acquiring the disease.

60
11.0 KATOVU BATWA
The Batwa were also found in katovu town in Buganda region.11.1 PopulationBelow is a table that shows the number of house holds and sex of the Batwain katovu town.
Table 11.1.1 shows population by sex
Community male female household Totalkatovu town 18 17 12 35
Table 11.1.1 shows that there are twelve households or mizigo (small rentedrooms) where thirty five Batwa men and women live. These Batwa throughthe talk with the team disclosed that they were never assisted by anyorganization. Also it was discovered that just a few children were going toschool. The coordinator advised them to embrace different governmentpolicies which would improve their livelihood.
11.2: Population by age.In order for the organization to plan better for its members there were a needto know population by age, and the result from katovu are as follows.
Table 11.2 shows population by age
Community 0-8 9-18 19-45 above 45 Totalkatovu town 11 8 15 1 35
Table 11.2 shows that there are twenty three Batwa youth and adults whomake the workforce. This implies that the workforce represent 65.7% of thetotal population in katovu town.Also the Batwa in katovu survive at providing cheap labor like carryingrubbish and fetching water in the town.
11.3 Head of familyAll the Batwa in katovu rent where to stay and nearly most household habitmore than one person. However it should be noted that some youth staytogether in one room. The table below shows head of families.

61
Table 11.3 shows, different heads of households
Community man woman childrenKatovu town 6 5 1
Table 12.3 shows that there are six households that are headed by men, fivehouseholds headed by women and one household headed by a child.Although 50% of the house holds are headed by men still poverty levels insuch houses are still high but not like those headed by children.This data clearly puts it that 50% of the total household is headed by eitherfemale or children; this implies that the level of poverty in Batwacommunity in katovu is extremely high. `11.4 LandLand in all the Batwa settlements has been a lacking factor and katovu is nodifferent. The entire households in katovu don’t have their own pieces ofland although they are not scoters still they rent small rooms at a fee. TheseBatwa told the team that it is very hard always to get house rent per month.They confessed that such expenses have deterred them from producing.Also the Batwa expressed another big concerned where they said they don’thave land to burry their loved ones after death, this has forced the Batwa todivorce or not to marry thus reducing the population of the Batwa in thearea.11.5 EducationIt was identified that there are only four children in school as shown in thetable.
Table 11.5 shows different education levels
Community P.1 P.2 P.3 P.4 P.5 P.6 P.7M F M F M F M F M F M F M F
Katovu - 2 1 - - - 1 - - - - - - -
The table shows that there is only one male in primary four while the restthree pupils are below primary three. Yet the school going children are about11 children.All this is attributed to lack of school fees and food to feed the children asthey go back to school.

62
11.5.1 Literacy rateDuring the data collection process it was observed that only five peopleknow how to read and write and all these were males. This put the level ofliteracy at about 14.3%. This is too low especially remembering that this isonly to males since that of females is 0%.
11.6 HousingThere is no Mutwa who own a house they all rent rooms. All the householdsin katovu live in iron roofed houses.At the same time these households also posse’s pit-latrines.
11.7 CommunicationThe organization also wanted to establish the best means of communicationto its members and a question to establish radio ownership was imposed.The results were that only two house holds had radios. This represents16.7% of the total population.
11.8 HealthAs a whole the health conditions of the Batwa of katovu were very poorsince it was found that eleven households fetch their water from wells andout of eight married households about four families have ever lost children.More so all the death was caused by malaria. This still emphasizes malariaas the most killer of Batwa children in Uganda.Concerning AIDS it was realized that there was no Mutwa who have evertested AIDS although about 9 males know about ARv’s. This is so worryingsince these Batwa living in urban areas. There is a need to sensitize thiscommunity about AIDS.
63
12.0 KANUNGU DISTRICT
Kitariro Batwa waiting to be counted.
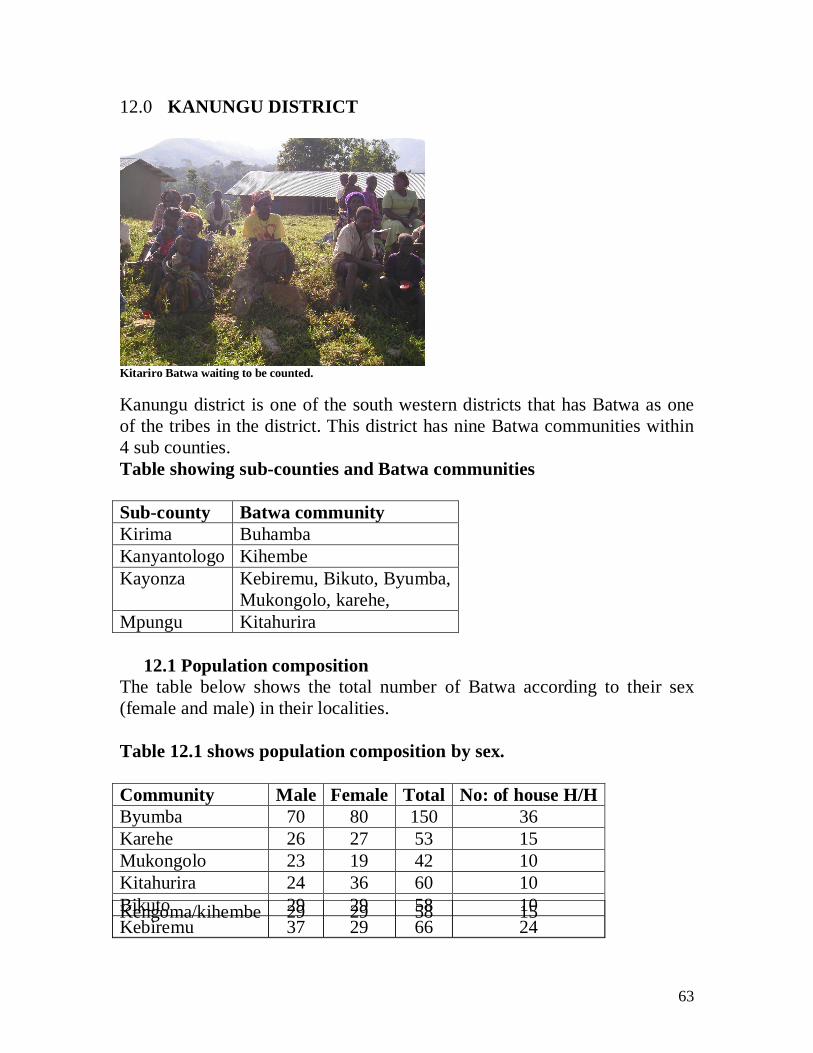
Kanungu district is one of the south western districts that has Batwa as oneof the tribes in the district. This district has nine Batwa communities within4 sub counties.Table showing sub-counties and Batwa communities
Sub-county Batwa communityKirima BuhambaKanyantologo KihembeKayonza Kebiremu, Bikuto, Byumba,
Mukongolo, karehe,Mpungu Kitahurira
12.1 Population compositionThe table below shows the total number of Batwa according to their sex(female and male) in their localities.
Table 12.1 shows population composition by sex.
Community Male Female Total No: of house H/HByumba 70 80 150 36Karehe 26 27 53 15Mukongolo 23 19 42 10Kitahurira 24 36 60 10Bikuto 29 29 58 10Kebiremu 37 29 66 24Kengoma/kihembe 29 29 58 15

64
According to table 12.1 there are 646 Batwa in Kanungu district within the 9Batwa communities. These include 315 males and 331 females and they arein 158 house holds. The ratio of males to females is 1:1.1 which implies thatfor every one male or man there are 1.1 women or females.Furthermore according to table 12.1 Byumba has a highest number of theBatwa which totals to 150 Batwa living in 36 house holds while thecommunity with the least number of the Batwa is Buhoma with 19 Batwaliving in the 5 house holds. The other communities have at least 10households on average.
12.2 Mean populationAccording to Uganda population census 2002 Kanungu had an averagepopulation per house hold of 4.7 peoples while in this data of 2007 it hasbeen found that the Batwa have an average population per house hold of 4.1persons. This implies that Batwa settlements are less populated that othertribes in Kanungu district.
12.3 Composition by age bracket.During the data collection process the population were bracketedaccording to their ages i.e. 1-8 children, 9-18 youth, 19-45 adults andabove 45 old. The findings are tabled as below.
Table 12.3 shows population by age.
Community 0-8 9-18 19-45 above 45 TotalByumba 40 37 51 22 150Karehe 22 6 20 5 53Mukongolo 17 6 17 2 42Kitahurira 22 20 17 1 60Bikuto 21 17 17 3 58Kebiremu 20 7 34 5 66Kengoma/kihembe 15 14 28 1 58Buhamba 47 25 53 15 140Buhoma 2 4 10 3 19Total 206 136 247 57 646
Buhamba 69 71 140 33
Buhoma 8 11 19 5Total 315 331 646 158

65
In the table 12.3, 206 are children, 136 are youth, 247 are adults and 57 areold. This implies that 31.9% are children, 21.1% are youth, 38.2% are adultsand 8.8% are old Batwa.Further more the table shows that 59.3% of the population in Kanungu areeither youth or adults which imply that the workforce of kanungu Batwa ismore than half of its population. This clearly shows that kanungu Batwahave more riches that other districts.
12.4 Head of the family:Table 12.4 shows different head of families in Batwa communities
Community Man Woman ChildByumba 26 10 -Karehe 9 4 -Mukongolo 10 - -Kitahurira 9 - -Bikuto 9 0 -Kebiremu 21 3 -Kengoma/kihembe 12 2 -Buhamba 26 6 -Buhoma 5 - -Total 127 25 -
Table 12.4 shows different heads of house holds in kanungu district withinthe Batwa communities.The table further show that 127 families are headed by men which represents83.6% of the total households while 25 households are headed by womenthat represents 16.4% of the total house holds.Earlier table 12.1 showed that kanungu Batwa have 158 house holds yet 12.4shows that they are 152 households this means that the difference of 6households represents the polygamist families.Further more table 12.4 shows that there is no family headed by a child allfamilies are headed by mature people which reduces poverty at the familylevel.

66
12.5 Land Since the eviction of the Batwa from the forests many have been resettledespecially in kanungu district by different organisation and churches.The table following shows different house holds that have land.
Table 12.5 shows and ownership in kanungu
Community Land ownership landless Total No: of house H/HByumba 31 29 5 36Karehe 11 7 4 15Mukongolo 9 9 1 10Kitahurira 7 - 3 10Bikuto 7 - 3 10Kebiremu 21 1 3 24Kengoma/kihembe 9 6 6 15Buhamba 26 16 7 33Buhoma 4 - 1 5Total 125 68 33 158
According to table 12.5 out of 158 house hold that kanungu has about 125house holds have land which represents 79.1% of the total house holds.Although 79.1% of the total house hold posses land it is not true that they allhave ownership to such plots of land they are resettled on only 68 household which represents 43.0% have ownership in form of land agreements.This implies that the donors who bought/resettled these Batwa have notgiven them ownership and this represents 57% of the total house hold thathave land.Through out this data collection it was observed that lack of land ownershipaffect production since the Batwa resettling on such land are not sure thatthey will be there even the following year.In addition it should be noted that kanungu still has landless Batwa who totalto 33 house holds.

67
12.5.1 Organisations that purchased/resettled Batwa in kanungudistrict.
Table 12.5.1 shows various organisations that resettled the Batwa ofKanungu
Community TRUST DR.SCOTT INHERITED STATTON&DIOCESE
BUSINGYE
Byumba 25 2 - 11 -Karehe 8 3 - - -Mukongolo 9 - - - -Kitahurira 7 - 1 - -Bikuto 7 - - - -Kebiremu 6 - 2 - 13Kengoma/kihembe 7 2 - - -Buhamba 4 - - 23 -Buhoma - 4 - - -Total 73 11 3 34 13
Table 12.5.1 shows that TRUST resettled 73 Batwa house holds, statton anddiocese resettled 34 house holds, Busingye resettled 13 house holds, Dr.Scott resettled 11 house holds and those who inherited land are 3 households.Also it was observed that there are some house holds that benefited fromdifferent organisation several piece of land and this total to 9 house holds.From the table TRUST resettled about 58.4% of the 125 house holds thathave land in kanungu Batwa communities.
12.6 EDUCATIONBatwa of Kanungu have got many school sponsors therefore a number ofchildren are going to school as will be seen in the following tables.

68
12.6.1 Primary levelThis is shown as below in the table
Table 12.6.1 shows pupils and their classes.
Community P.1 P.2 P.3 P.4 P.5 P.6 P.7Sex M F M F M F M F M F M F M FByumba 3 10 4 4 3 6 3 4 5 3 - - - -Karehe 3 1 1 1 1 - - - - - 1 - - -Mukongolo 2 5 2 1 1 - - - - - - - -Kitahurira 3 4 - 3 1 1 - - - - 2 - - -Bikuto 1 2 1 - - 5 4 1 - - 1 - - -Kebiremu 5 3 3 - - - - - - - - - - -Kengoma/kihembe 2 - 3 - 1 1 1 - - - - - - -Buhamba 2 1 4 4 1 1 4 2 - - - - - -Buhoma - - - 1 - - - - - - - - - -TOTAL 21 26 18 14 7 15 12 7 5 3 4 - - -
Table 12.6.1 shows that there are 132 pupils (67males and 65 females) whoare in primary school. This number represents 38.6% of the children andBatwa youth in Kanungu district of school going age.Out of 132 pupils, 79 are in primary one and two and this represent 59.8% ofthe total pupils in school in Kanungu district.In addition 53 pupils from primary three to primary seven only 25 are femalewho represent 47.2% of the proportion in these classes. This table shows thatmost Batwa drop out from primary five this call for more emphasis andencouragement to the youth.

69
12.6.2 Secondary level.In this level there are five students and they are represented in the table asbelow.
Table 12.6.2 shows students and their classes.
Community S.1 S.2 S.3 S.4 S.5 S.6Sex M F M F M F M F M F M FBikuto 1 - - - - - - - - - - -Kebiremu - - - - - - - 1 - - - -Kengoma/kihembe - 1 - - - - 1 - - - - -Buhamba - 1 - - - - - - - - - -TOTAL 1 2 - - - - 1 1 - - - -
From table 12.6.2 there are 5 students out of which 3 are in senior one whiletwo are in senior four.Out of the 3 in senior one, two are females and this represents 40% of thetotal students in Kanungu district while one is a male from Bikuto village.Although the numbers at secondary level are still low the pupils haveexamples they can enumerate so as they concentrate on their studies.
12.6.3 Literacy rate or levelsTable 12.6.3 shows number of people who know how to read and write.
Community Male Female TotalByumba 14 14 28Karehe 3 1 4Mukongolo 1 1 2Kitahurira 5 1 6Bikuto 7 5 12Kebiremu - 1 1Kengoma/kihembe 3 2 5Buhamba 9 7 16Buhoma - 1 1Total 42 33 75

70
According to table 12.6.3, 42 males and 33 females know how to read andwrite in Kanungu Batwa. This total to 75 people that represents 11.6% of thetotal population thus literacy rate of Kanungu Batwa.In summary the literacy rate among female is 9.7% while in males is 13.3%.
12.7Health12.7.1 SanitationIn Batwa communities there are many sources of water and below is a tableshowing various sources of water that the Batwa use in Kanungu district.
Table 12.7.1 shows various sources of waterCommunity well spring rainwater Rivers TapByumba 20 13 1 2Karehe 7 8Mukongolo 10Kitahurira 10Bikuto 10Kebiremu 21 3Kengoma/kihembe 13 2Buhamba 6 9 18Buhoma 5Total 66 58 1 15 18
Table 12.7.1 shows that 66 households obtain their water from wells, 58households go to spring, 18 households obtain water from taps and 15households get from rivers.This shows that the majority of the households from Kanungu get their waterfrom wells.However wells are not a clean source of water especially for drinking thus amain cause of water born diseases in Batwa communities.The Batwa who fetch water from wells is 41.7% which is a high percentagein a poor society like that of the Batwa..12.8 LatrineTable 12.8 shows number of household with pit latrine.
Community Latrine Public latrine Total H/h in kanunguByumba 13 - 36Karehe 9 - 15

71
Mukongolo 9 - 10Kitahurira 8 - 10Bikuto 6 - 10Kebiremu 5 10 15Kengoma/kihembe 6 - 23Buhamba 22 - 5Buhoma 5 - 24Total 83 10 158
Table 12.8 shows that 83 households have pit latrine while 10 householdsuse public latrine in kebiremu Batwa community.These 83 households represent 52.5% of the total households of kanungudistrict. Kanungu has improved in sanitation since many donors support them inputting up latrines and also some have put up public latrine to help Batwasociety improve their livelihood. It should be noted that each house holdshould have its own pit latrine.Also according to table 12.8 about 65 families don’t have pit latrines thisrepresents 41.1% of the total families in kanungu district.
12.9 Iron roofed houseTable 12.9 shows number of households with iron roofed houses.
Community Iron roofed house Total H/H %Byumba 6 36 16.7Karehe 4 15 26.7Mukongolo 2 10 20Kitahurira 8 10 80Bikuto - 10 -Kebiremu 1 24 4.2Kengoma/kihembe - 15 -Buhamba 23 33 69.7Buhoma 1 5 20Total 45 158 28.5
Table 12.9 shows that there are 45 households with iron roofed housescompared to 158 house holds in Kanungu district.

72
This represents 28.5% of the total households, although the percentage isbigger than any other district its still low since its less than half of the totalhouseholds in the district.From table 12.9 Kitahurira has 80% of its households with iron roofedhouses while Buhamba has about 70%. These two communities are beingsupported by donors to put up such houses.However Kebiremu and Buhoma are the least each with one house roofedwith iron sheets.In addition Bikuto and Kengoma have no house roofed with iron sheet.Therefore there is need for donors to rationalise their donations to all theBatwa communities.
12.10 Communication:Since information is important for societal development its thereforenecessary to know how the Batwa get information so as to understand whichmedia can be used to disseminate information among Batwa communities.
Table 12.10.1 shows households with radios
Community Radio possession Total H/H %Byumba 11 36 30.6Karehe 4 15 26.7Mukongolo 2 10 20Kitahurira 6 10 60Bikuto 4 10 40Kebiremu 13 24 54.2Kengoma/kihembe 2 15 13.3Buhamba 14 33 42.4Buhoma 2 5 40Total 58 158 36.7
Table 12.10.1 shows that Buhamba has more families with radios inKanungu Batwa communities where 14 households have radios however inreal terms kitahurira has a higher percentage of 60 that possess radios whichimplies that nearly every household can get information through the radiosdue to the fact that their homes are near each other.In general Kanungu communities can easily receive any information throughradios since at least each community has a radio.
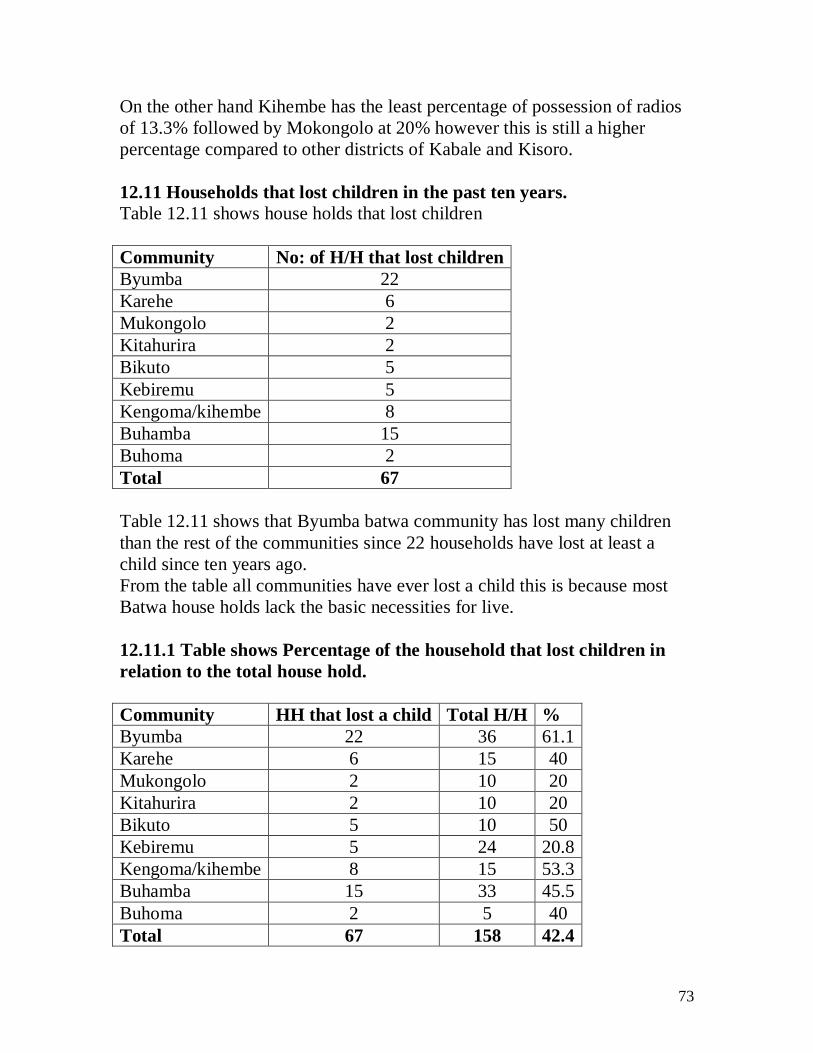
73
On the other hand Kihembe has the least percentage of possession of radiosof 13.3% followed by Mokongolo at 20% however this is still a higherpercentage compared to other districts of Kabale and Kisoro.
12.11 Households that lost children in the past ten years.Table 12.11 shows house holds that lost children
Community No: of H/H that lost childrenByumba 22Karehe 6Mukongolo 2Kitahurira 2Bikuto 5Kebiremu 5Kengoma/kihembe 8Buhamba 15Buhoma 2Total 67
Table 12.11 shows that Byumba batwa community has lost many childrenthan the rest of the communities since 22 households have lost at least achild since ten years ago.From the table all communities have ever lost a child this is because mostBatwa house holds lack the basic necessities for live.
12.11.1 Table shows Percentage of the household that lost children inrelation to the total house hold.
Community HH that lost a child Total H/H %Byumba 22 36 61.1Karehe 6 15 40Mukongolo 2 10 20Kitahurira 2 10 20Bikuto 5 10 50Kebiremu 5 24 20.8Kengoma/kihembe 8 15 53.3Buhamba 15 33 45.5Buhoma 2 5 40Total 67 158 42.4

74
Table 12.11.1 shows that at least every household have ever lost a childwhich explains few children in the Kanungu Batwa communities of about31.9% of the total population in the district.The rate of death is more in Byumba at 61.1% of its total households whilethe least is in both Mukongolo and kitahurira Batwa communities at 20%each community.
12.12 Cause of death of children in the Batwa communitiesThere are many causes of children death in Kanungu Batwa communitiesand these are shown as below.
Table 12.12 shows various causes of death
Community Malaria Pneumonia Badspirit
Miseales Dysentery
Byumba 17 2 2 1Karehe 2 4Mukongolo 2Kitahurira 2Bikuto 5Kebiremu 2 3Kengoma/kihembe 8Buhamba 12 1 1 1Buhoma 1 1TOTAL 51 3 8 3 2
According to table 12.12, malaria is the highest cause of death in Batwachildren followed by Bad spirits. Kanungu Batwa communities have badspirits as one of the causes of death and this is attributed to lack of religionto the society.Observing all causes of children death we realise that they are preventablediseases which call for more sensitisation and if possible mobile clinics tosupply tablets and mosquito nets so as to reduce the high rate of death forchildren.

75
12.13 Immunisation and antenatalThe team examined the respondents about their attendance to antenatal andimmunisation services which are all free to either kids or mothers. Theirresponses are represented in the following table
Table 12.13 shows households that immunise and attend antenatalservices
Community Antenatal ImmunisationByumba 25 25Karehe 10 5Mukongolo 8 8Kitahurira 7 7Bikuto 6 6Kebiremu 12 13Kengoma/kihembe 10 11Buhamba 23 23Buhoma 3 2TOTAL 104 100
Table 12.13 shows that 100 house holds take their children for immunisationthis represent 63.3% of the total house hold in Kanungu district.Also from the same table (table 12.13) about 104 house hold attend antenatalcare services which represent 65.8% of the total household in KanunguBatwa communities.These high percentages are attributed to the presence of a health centrewhich treat Batwa freely in Kanungu (Buhoma health centre).This is alsoassign that if Batwa are given such services and are sensitised they can usetablets like any other tribe.
12.14 HIV/AIDS testing and ARV awareness:The team asked the Batwa about how much they knew about AIDS andwhether they have tested, the following are their responses.

76
Table 12.14 shows the number of Batwa who tested for AIDS and theirknowledge about ARV’s.Community Tested Knowledge about ARV’s
M FByumba 16 21 1Karehe 7 12 1Mukongolo 7 7 2Kitahurira 6 4 4Bikuto 5 7 2Kebiremu 14 19 9Kengoma/kihembe 7 11 4Buhamba 16 29 27Buhoma 1 5 2TOTAL 79 115 52
According to table 12.14,79 males have ever tested AIDS/HIV statuscompared to 315 males in Kanungu, this represent 25.1% while 115 femaleshave also tested HIV/AIDS compared to 331females in Kanungu thisrepresents 34.7%. These percentages for both males and females are higherthan any other district this is attributed to village visit counsellors and testingservices offered by Buhoma health centres under Dr Scott.In another development table 12.14 shows that only 52 people out of 194who tested have knowledge about ARV’s.The people have knowledge about ARVS in Kanungu represent 7.9% of itspopulation or 26.3% of the population that tested HIV/AIDS.During this data collection process the Batwa expressed their worry thatafter testing them they are not given their results.This also shows that they are not properly counselled thus lack of knowledgeabout ARV’s and prevention of HIV.All in all there is no Mutwa on ARV although that does not mean there areno Batwa who are infected with HIV/AIDS.


![Batwa cultural values report, Final[2] - IAPADIn partnership with the Uganda Wildlife Authority (UWA), and the United Organisation for Batwa Development in Uganda (UOBDU), the Institute](https://img.pdfslide.us/doc/110x75/5fda7923bf57ad1004382dd8/batwa-cultural-values-report-final2-in-partnership-with-the-uganda-wildlife.jpg)


![Batwa cultural values report, Final[2] - Fauna and Flora](https://img.pdfslide.us/doc/110x75/61a0ef17870f8551307ab09c/batwa-cultural-values-report-final2-fauna-and-flora-.jpg)


