Embed Size (px)
Citation preview

BATPAC MODEL DEVELOPMENT
drhgfdjhngngfmhgmghmghjmghfmf
SHABBIR AHMED, KEVIN G. GALLAGHER, PAUL A. NELSON, NARESH SUSARLA, DENNIS W. DEESChemical Sciences and Engineering DivisionProject Title: Core BatPaC Development and Implementation, Project ID: ES228
2016 DOE Vehicle Technologies Office Annual Merit Review and Peer Evaluation MeetingWashington DC, June 6-10, 2016
HTTP://WWW.CSE.ANL.GOV/BATPAC/
This presentation does not contain any proprietary, confidential, or otherwise restricted information
Budget FY14: 575K FY15: 575K FY16: 575K
Collaborations / Interactions U.S. Environmental Protection Agency,
Volpe-USDOT B&W MEGTEC, GM, LGChem, PPG,
PEC-NA, Maccor, Paraclete, Miltec, Lambda Technologies, Navitas, Cummins, Ricardo, Rio Tinto, ORNL, NREL
OVERVIEW
Timeline Start: 2012 End: 2017
BarriersTo the development of PHEV and EV batteries that meet or exceed DOE/USABC goals Cost Performance
2

RELEVANCE
This modeling effort supports projects through the development and utilization of efficient simulation, analysis, and design tools for advanced lithium ion battery technologies– Enables assessment of technology developments at the pack level
The EPA uses BatPaC to predict the cost of battery technologies for their 2017-2025 rule making– Argonne updates BatPaC with cost inputs, modification of
constraints, studies* of variable factory utilization, etc.
BatPaC is the only peer-reviewed LIB design and cost model available in the public domain
*Nelson, P.A., et al., “Cost savings for manufacturing lithium batteries in a flexible plant,” Journal of Power Sources,Volume 283, 1 June 2015, Pages 506–516
3

OBJECTIVES AND IMPACT
Objective: Develop and utilize efficient simulation and design tools for Li-ion batteries to predict– Battery pack metrics (size, weight, etc.) from laboratory data– Cost of battery packs when manufactured in large volume
Benefit to DOE– Support assessments of ongoing and proposed technologies through
projections of cost and performance at the pack level– Project material and energy demands– Identify opportunities for cost reduction in manufacturing process
4
APPROACH
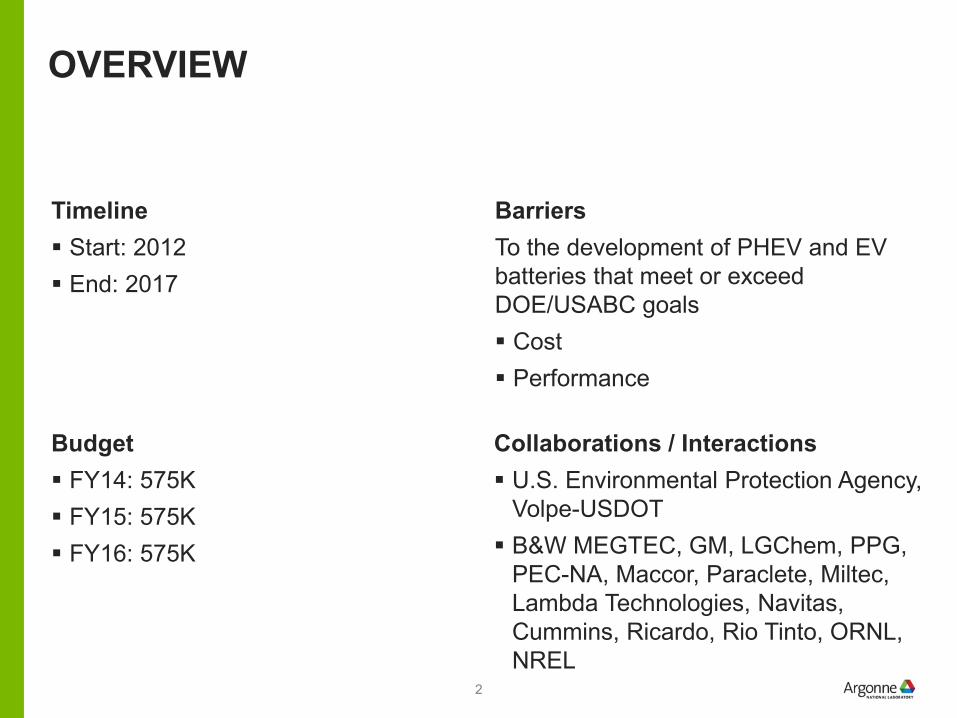
Design a battery based on the power and energy specifications for a given cell chemistry– Sizes the battery components to meet the specifications– Tracks all the materials used in the pack– Cost based on a described manufacturing process
Reduce uncertainty in model predictions– Update the default chemistries, their properties, and material and
processing costs– Develop higher fidelity models of the physical and electrochemical
phenomenon, and manufacturing flow path (quantify energy needs)– Validate results with OEMS, manufacturers, component developers
5
PROGRESS
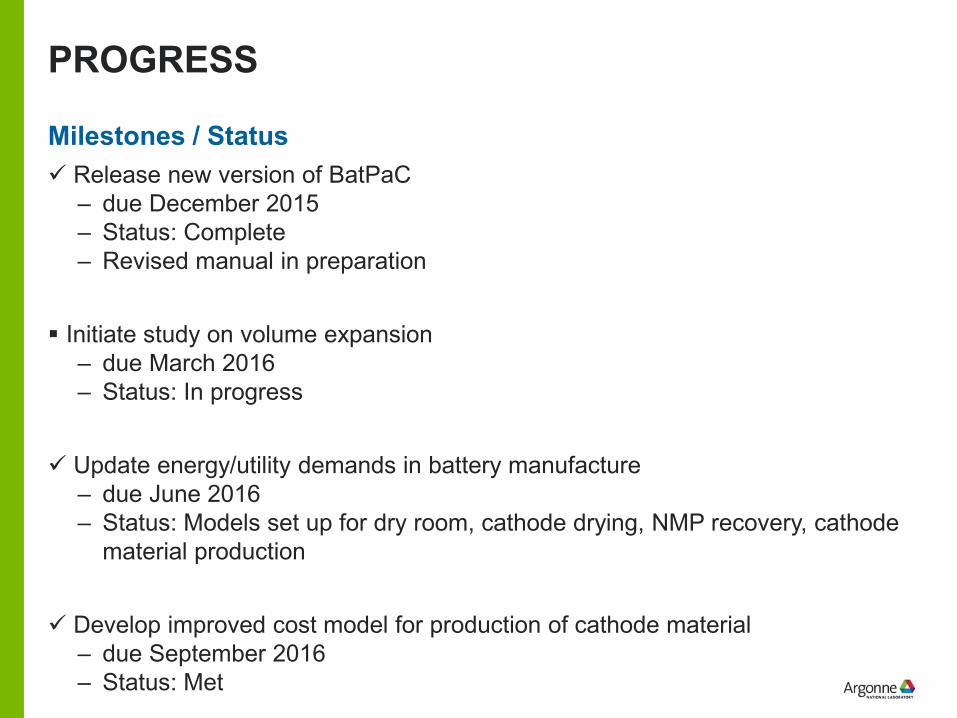
Release new version of BatPaC– due December 2015– Status: Complete– Revised manual in preparation
Initiate study on volume expansion– due March 2016– Status: In progress
Update energy/utility demands in battery manufacture– due June 2016– Status: Models set up for dry room, cathode drying, NMP recovery, cathode
material production
Develop improved cost model for production of cathode material – due September 2016– Status: Met
Milestones / Status

OUTLINE OF TECHNICAL ACCOMPLISHMENTS
1. Optimum electrode loading – calculated from an analytical expression derived from experimental data and transport modeling
2. NMC cathode production – Energy & cost estimates with process model
3. Cathode drying, NMP recovery – Energy & cost estimates with process model
4. Dry Room – Energy & cost estimates with process model
5. Formation cycling – Energy & cost estimates using process model
6. Included table reporting the inventory of materials in the battery pack
7. BatPaC Version 3.0 Released1) Calculates time required for fast charging of EV batteries2) Material costs updated3) Revised electrode thickness calculations4) Added option to use a blend of LMO-NMC cathode5) Material and processing costs updated with calculations from 1, 2, 3
Higher fidelity spreadsheet models have been set up to review and update input data in BatPaC
7

Analytical expression for limitations on both discharge & charge
TECHNICAL ACCOMPLISHMENTOPTIMUM ELECTRODE THICKNESS
4 mA/cm2 is a critical current density to be avoided during charge
( )o
dv
A t
DcFtQQ
+−
=1τεγNMC622/Gr 14 cm2 pouch cells
C/3 discharge rate; charge varied
Gallagher et al, J. Electrochem. Soc. 163(2) A138 (2016) 8

Calculates time required to add 60-80% to SOC
Identifies limiting charging restriction– Li deposition– Power of charger– Insufficient cooling
Batt-1 positive electrode thickness limited by sustained discharge
Batt-2 positive electrode thickness reduced to 70 µm to improve charging time
Batt-3 positive electrode thickness further reduced but at higher cost
TECHNICAL ACCOMPLISHMENTINCLUDED CALCULATIONS FOR FAST CHARGING EV BATTERY
Batt-1 Batt-2 Batt-3
Energy storage, kWh 79.4 79.4 79.4
Capacity at C/3, Ah 301 299 300
Battery Power at 80% OCV, kW 302 393 419
Positive Electrode thickness, µm 94 70 65
Max. current density to avoid lithium deposition, mA/cm2 4 4 4
Initial battery temperature, °C 15 15 15
Max. allowed battery temperature, °C 40 40 40
Fast charge limiting condition Li dep. Li dep. Temp.
Time to add 60% of SOC (15-75%) 37 27 25
Time to add 80% of SOC (15-95%) 45 33 31
Battery cost to OEM, $ 10,090 10,660 10,840
9

Estimated production cost of NMC333 is ~$20 per kg
MSO4 + Na2CO3 = MCO3↓+ Na2SO4– The energy demand is ~ 2 kWh/kg• Thermal/Electrical = 3
– Raw materials contribute 50+% to cost offinal product
– NMC622 cost estimated at $18/kg
MSO4 + 2NaOH = M(OH)2↓ + Na2SO4– Requires more water, costs 40 ¢/kg more
TECHNICAL ACCOMPLISHMENTMODELED NMC PRODUCTION PROCESS
Assumptions 4000 kg/day plant capacity Assumed prices, $/kg of M (commodity price)
• Cost of 58.7 kg of Ni = Cost of 139 kg of NiSO4• Ni=$9.9, Mn=$1.8, Co=$27.8 (Oct.2015)
Feb.2016 prices: Ni=$8.7, Mn=$1.5, Co=$22.5,cost of NMC333=$18 per kg
10

Cathode drying and recovery contributes ~$10 / kWh (3%) to the cost of a PHEV battery pack The process requires ~420 kWh per kWh battery pack*
– 5800 kW, 580 kW/kWh Energy demand is 45 times the energy needed for
NMP vaporization Large energy demand is constrained by safety
– Large excess air is needed to limit NMPconcentration in hot air
The air heater for the coating line ovens (dryer) is thelargest contributor with 60+% of total demand
TECHNICAL ACCOMPLISHMENTMODELED CATHODE DRYING AND NMP RECOVERY
Process for evaporation and recovery of 4M kg/yr of NMP
*Plant producing 100K packs/yr of 60 kW, 10 kWh PHEV batteries
Cost of energy is ~10% ofprocess, with opportunitiesto reduce energy demand(CO2-equivalent emissions)
Effect of resizing heat exchanger
Ahmed et.al., Journal of Power Sources 322 (2016) 169-17811
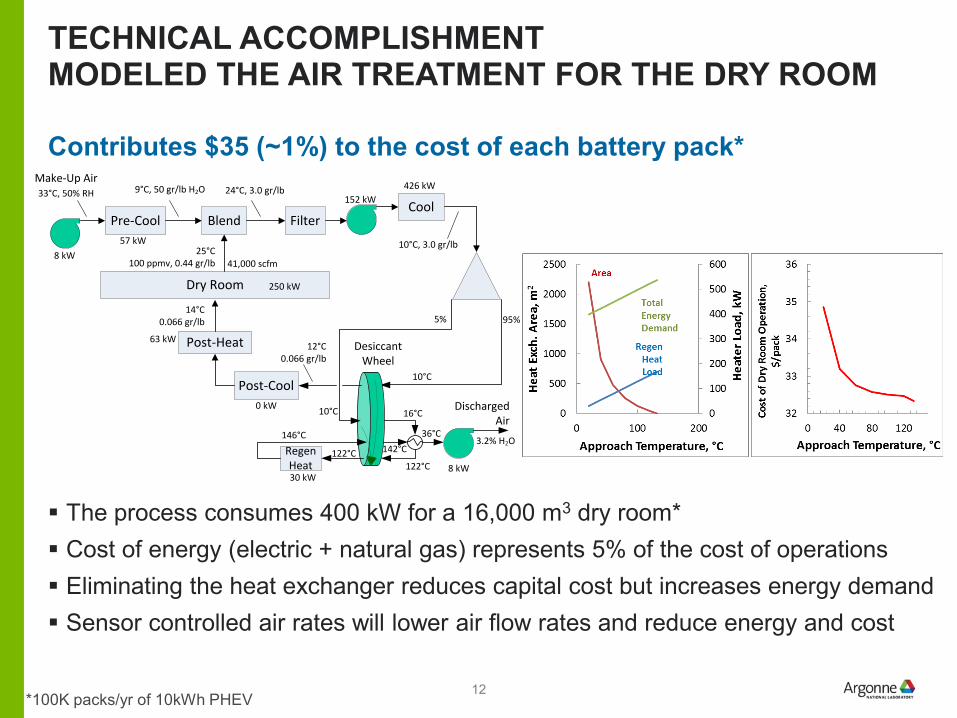
Contributes $35 (~1%) to the cost of each battery pack*
The process consumes 400 kW for a 16,000 m3 dry room* Cost of energy (electric + natural gas) represents 5% of the cost of operations Eliminating the heat exchanger reduces capital cost but increases energy demand Sensor controlled air rates will lower air flow rates and reduce energy and cost
TECHNICAL ACCOMPLISHMENTMODELED THE AIR TREATMENT FOR THE DRY ROOM
*100K packs/yr of 10kWh PHEV
Pre-Cool FilterCool
Post-Cool
Post-Heat
Blend
DesiccantWheel
Discharged Air
Dry Room
12°C0.066 gr/lb
95%5%
10°C, 3.0 gr/lb
14°C0.066 gr/lb
25°C 100 ppmv, 0.44 gr/lb
3.2% H2O
Make-Up Air33°C, 50% RH 9°C, 50 gr/lb H2O 24°C, 3.0 gr/lb
8 kW57 kW
152 kW426 kW
30 kW
0 kW
250 kW
41,000 scfm
8 kW
Regen Heat
16°C
122°C
36°C
122°C
146°C
10°C
10°C
142°C
63 kW
12

Contributes $90 (3%) to the cost of the battery pack
Basis: 100K pks/year, 10.1 M cell/yr– 10 kWh PHEV, 29 Ah
Energy demand– Electrical energy (charging)• 3600 MWh/year, 500 kW, 50 kW/kWh
Heat generated during charge/discharge• 240 MWh/year, 33 kW
Heat generated if discharged energy dumped to load• 1900 MWh/year, 265 kW
Preliminary Estimates Floor Space: 900 m2
Cost Contribution: $9 per kWh– Cost of electricity ~ 1% of annual cost– Large number of cyclers and racks represent a
large fraction of the capital equipment cost– Eliminating one full charge/discharge step can
reduce cost by 35%
TECHNICAL ACCOMPLISHMENTMODELED THE FORMATION CYCLING PROCESS
*100K packs/yr of 10kWh PHEV13

Variation in material content is small on a per kWh basis The fraction of active material
content is higher in larger batteries
Will be included in next BatPaCupdate
MATERIAL INVENTORY:VARIATION IN MATERIALS CONTENT IS SMALL WHEN NORMALIZED TO BATTERY CAPACITY
TECHNICAL ACCOMPLISHMENTMATERIAL INVENTORY REPORT
HEV PHEV EV
Energy, kWh 4 12 62
Power, kW 120 60 180
Chemistry LMO-G LMO-G NMC622-G
Material kg/kWh
Lithium 0.11 0.11 0.13
Nickel 0.61
Cobalt 0.19
Manganese 1.6 1.6 0.20
Aluminum 1.7 1.5 0.95
Copper 1.9 0.92 0.55
Graphite 1.0 1.0 1.1
14
COLLABORATION
Incorporated suggestions from USEPA feedback to beta version Supported USDOT with cost projections
Incorporated feedback from private companies
Joint publication on drying with ORNL, B&W MEGTEC
Provided calculations and support– PPG, Paraclete, Miltec, Ricardo, Rio Tinto, Northwestern U.
Continuing discussions to extend and validate model– GM, LGChem, PEC-NA, Maccor, Lambda Technologies, Navitas, Cummins,
Ricardo
Supported two agencies and several commercial organizations with BatPaC studies
15

PROPOSED FUTURE WORK
Develop higher fidelity models of steps in the manufacturing and supply chain– Coaters, alternative drying, charge retention– Production of electrolytes (LiPF6, etc.), costly active materials– Validate results generated from BatPaC and supporting models
Include volume expansion mitigation designs (foam or springs, etc.)
Study impact of developing technologies – Coat electrodes without use of binder solvent– Plant automations for large plants (e.g., 500K EV per year)
Support USEPA and USDOT

SUMMARY
Projects impact of technology developments at component level to pack-level performance and cost BatPaC calculations and data reporting has been extended
– Electrode thickness, materials inventory, etc. BatPaC input data is being refined with more detailed models and collaboration
with experts– Supporting models calculate energy demands of the manufacturing process– The cathode drying and NMP recovery process is the most energy intensive– Identifies opportunities for cost reduction
The BatPaC spreadsheet tool is a resource for sponsors, technology assessors, and developers
Process (100K/year, 10 kWh PHEV)
Energy Demand
Drying and NMP Recovery 5800 kWProduction of NMC333 550 kWFormation Cycling 500 kWDry Room Air Management 400 kW
http://www.cse.anl.gov/batpac/

RESPONSES TO PREVIOUS YEAR REVIEWERS’ COMMENTS
A reviewer asked for more details on how the fast charging work will be included in BatPaC.– New worksheet added, which calculates the time needed to add to the SOC
and identifies the constraint that limits faster charging. A reviewer recommended looking more at sulfur
– Sulfur batteries will be included as the technology acceptance for automotive use. It is currently being reviewed[1] and developed in other projects.
A reviewer noted that high-volume battery producers were conspicuously absent– We are trying to reach more producers to review our methodology and
calculations. A reviewer commented that the cathode work is heavily weighted in this model
and other components such as the anode and separator needs attention.– The technologies being addressed are typically selected on the basis of
performance or cost impact
[1] Eroglu, D., et.al., Journal of the Electrochemical Society, 2015, 162 (6), A982-A990, doi: 10.1149/2.0611506jes18

ACKNOWLEDGMENTS
David Howell, Peter Faguy, DOE/VTO
Joseph McDonald, Mike Safoutin, USEPA
David Wood, ORNL
David Ventola, Jeffrey Quass, B&W MEGTEC
Ben Bell, David Parkman, SCS Ltd.
Peter Ulrix, Daron Stein, PEC NA
Mark Hulse, Maccor
Ragunathan Kuppuswamy, GM
Mohamed Alamgir, LG Chem
BASF, BMW
Young HoShin, Gregory Krumdick, Jennifer Dunn, Linda Gaines, Dan Santini, Andy Jansen, Bryant Polzin, Ira Bloom, Prezas Panagiotis, ANL
The authors are grateful for the sponsorship, guidance and technical support
19

www.anl.gov
TECHNICAL BACK-UP SLIDES

PUBLICATIONS
Gallagher, K.G., et al, “Optimizing Areal Capacities Through Understanding The Limitations Of Lithium-ion Electrodes,” Journal of the Electrochem. Soc. 163(2) A138 (2016)
Ahmed, S., Nelson, P.A., Dees, D.W., “Study of a Dry Room in a Battery Manufacturing Plant using a Process Model,” submitted to the Journal of Power Sources, Nov. 2015.
Ahmed, S., Nelson, P.A., Gallagher, K.G., Dees, D.W., “Energy Impact of Cathode Drying and Solvent Recovery during Lithium-ion Battery Manufacturing,” Journal of Power Sources 322 (2016) 169-178.

MATERIALS COST UPDATE
Version 2May 2015
Version 3Dec 2015
NMC333, $/kg 31 20NMC441, $/kg 26 -NMC622 - 18NCA, $/kg 33 24Negative Active Material 19 15
V 3B March 2015 V 3.0 December 2015NCA 33 24NMC441 26NMC622 18NMC333 31 20LMO 10 10xLMO+(1-x)NMC CalculatedNegative Active (Graphite) 19 15

BATPAC DESIGNS THE BATTERY AND CALCULATES ITS MASS, VOLUME, MATERIALS, HEAT TRANSFER NEEDS, AND COST
Governing Equations
Shipping
Cell and Scrap
Recycling
Receiving
Control Laboratory
Assembly Route
Battery Pack Assembly
and TestingModule
Assembly Formation Cycling
Current Collector Welding
Enclosing Cell in
Container
Electrolyte Fillingand Cell Closing
Cell Stacking
Solvent Evaporation
Positive
Negative
Electrode CoatingPositive
Negative
Electrode Slitting
Vacuum Drying
Electrode Materials Preparation
Positive
Negative Calendering
Solvent Recovery
Air Locks
Charge-Retention Testing
Final Cell
Sealing
Dry Room
Materials Handling
Outdoor dry-room air processing equipment
Total Cost to OEM• Materials & purchased items• Individual process steps• Overhead, depreciation, etc.• Warranty
• Pack specifications- Power and energy (range)
- Number of cells
• Cell Chemistry- Area-specific impedance (ASI)
- Reversible capacity C/3
- OCV as function of SOC
- Physical properties
⋅⋅
=
UVUNA
PIP
−⋅⋅=
AASICUCNE E
E 3
( )
−
⋅
⋅=
UV
UVUN
PASIA
P
P
12
AQCL
⋅⋅⋅=
ερ
( ) βα+
+=
LIfASI
Battery PackComponents
• Volume
• Mass
• Materials
• Heat generation
Iterate Over Governing Eqs.& Key Design Constraints
• Cell, module, & pack format
• Maximum electrode thickness
• Fraction of OCV at rated power
𝑃𝑃𝑃𝑃𝑃𝑃𝑃𝑃𝑃𝑃𝑃𝑃𝑃𝑃 𝑃𝑃𝑃𝑃𝑃𝑃𝑐𝑐 = 𝐵𝐵𝐵𝐵𝑃𝑃𝑃𝑃𝐵𝐵𝐵𝐵𝐵𝐵𝑃𝑃 𝑃𝑃𝑃𝑃𝑃𝑃𝑐𝑐 �𝑃𝑃𝑃𝑃𝑃𝑃𝑃𝑃𝑃𝑃𝑃𝑃𝑃𝑃𝐵𝐵𝐵𝐵𝑃𝑃 𝑃𝑃𝐵𝐵𝑐𝑐𝑃𝑃
𝐵𝐵𝐵𝐵𝑃𝑃𝑃𝑃𝐵𝐵𝐵𝐵𝐵𝐵𝑃𝑃 𝑝𝑝𝑃𝑃𝑃𝑃𝑃𝑃𝑃𝑃𝑃𝑃𝑃𝑃𝐵𝐵𝐵𝐵𝑃𝑃 𝑃𝑃𝐵𝐵𝑐𝑐𝑃𝑃
𝑝𝑝
http://www.cse.anl.gov/batpac/P.A. Nelson, K.G. Gallagher, I. Bloom, D.W. Dees, Modeling the Performance and Cost of Lithium-ion Batteries for Electric Vehicles, second ed., Chemical Sciences and Engineering Division, Argonne National Laboratory, Argonne, IL USA, 2011. ANL-12/55.23
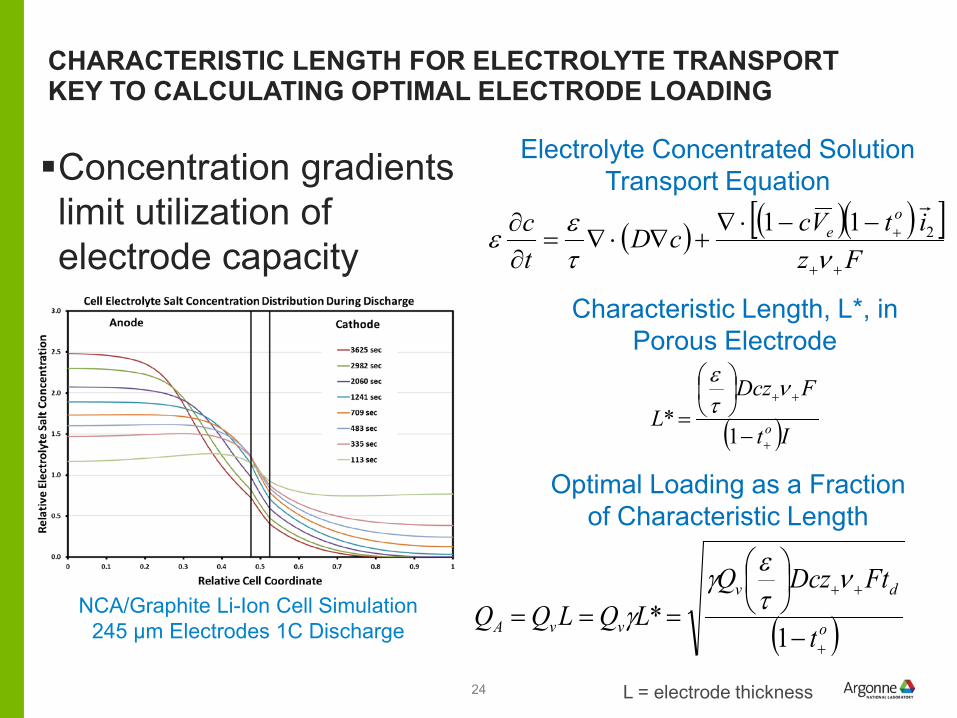
CHARACTERISTIC LENGTH FOR ELECTROLYTE TRANSPORT KEY TO CALCULATING OPTIMAL ELECTRODE LOADING
Concentration gradients limit utilization of electrode capacity ( ) ( )( )[ ]
FzitVccD
tc o
e
++
+−−⋅∇+∇⋅∇=
∂∂
ντεε 211
( )It
FDczL o
+
++
−
=1
*ν
τε
Electrolyte Concentrated SolutionTransport Equation
Optimal Loading as a Fraction of Characteristic Length
Characteristic Length, L*, in Porous Electrode
( )o
dv
vvA t
FtDczQLQLQQ
+
++
−
===1
*ν
τεγ
γNCA/Graphite Li-Ion Cell Simulation245 µm Electrodes 1C Discharge
L = electrode thickness24

DESIGNING MAXIMUM ELECTRODE LOADING BY RATE REQUIRED FOR CONSTANT DISCHARGE
Continuous C-rate
Design capacity, mAh/cm2
C/5 4.8
C/3 3.8
C/2 3.1
1C 2.1
2C 1.5
3C 1.25
For these tested electrodesNMC622/Graphite (closed symbols)
Lines of γ = 0.3, 0.6 & 0.9
Designs should target electrode thicknesses of ~0.3L* or less at required C-rateOpen symbols transformed from: Zheng et al Electrochim. Acta 71
(2012) 258 [blue LFP/Gr & red NMC333/Gr]
25