Embed Size (px)
Citation preview
Bass Coast Shire Council
Annual Report 2018/19

2
Bass Coast Shire Council acknowledges Aboriginal and Torres
Strait Islanders as the first Australians and recognises that they have a unique relationship
with the land and water.
Council also recognises that we are situated on the traditional lands of the Bunurong/Boonwurrung,
members of the Kulin Nation who have lived here for thousands of years. We offer our respect to their elders past and present and through
them, all Aboriginal and Torres Strait Islander people.
3
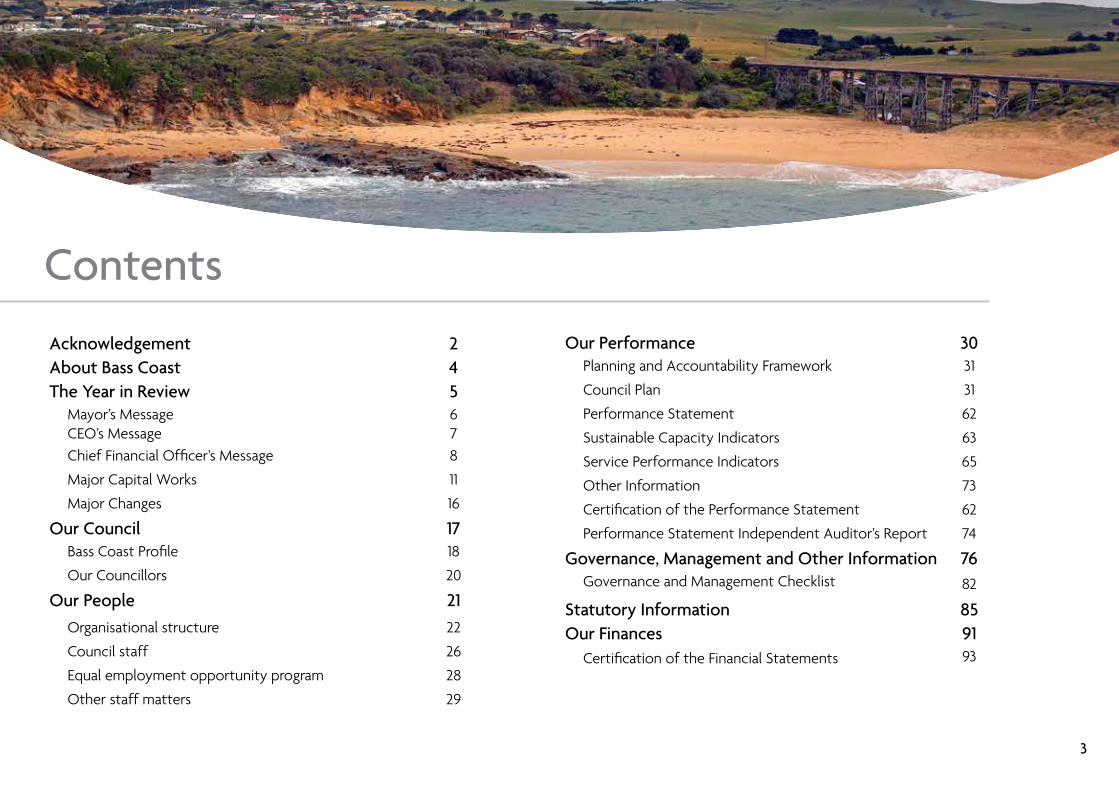
ContentsAcknowledgement 2About Bass Coast 4The Year in Review 5
Mayor’s MessageCEO’s Message
67
Chief Financial Officer’s Message 8
Major Capital Works 11
Major Changes 16
Our Council 17Bass Coast Profile 18
Our Councillors 20
Our People 21Organisational structure 22
Council staff 26
Equal employment opportunity program 28
Other staff matters 29
Our Performance 30Planning and Accountability Framework 31
Council Plan 31
Performance Statement 62
Sustainable Capacity Indicators 63
Service Performance Indicators 65
Other Information 73
Certification of the Performance Statement 62
Performance Statement Independent Auditor’s Report 74
Governance, Management and Other Information 76Governance and Management Checklist 82
Statutory Information 85Our Finances 91
Certification of the Financial Statements 93

4
Snapshot of CouncilVisionBass Coast Shire will be recognised as a unique place of environmental significance where our quality of life and sense of community is balanced by sustainable and sensitive development, population and economic growth.
MissionTo take a leading role in partnership with other levels of government, businesses, community groups and individuals to make our community’s vision a reality.
ValuesCustomer FocusWe will continue to develop effective relationships with customers.
Continuous ImprovementWe are committed to improving our processes and service delivery.
PrideWe take pride in and promote our achievements, our staff and our organisation.
IntegrityWe act and make decisions that are fair, honest, open and accountable.
RespectWe treat people with dignity and respect.
CommitmentWe value and recognise contributions towards achieving the Bass Coast Vision. We listen, understand, consult and respond to our community and staff. We provide accurate, timely and relevant information.
Welcome to the Report of Operations 2018/19Council is committed to transparent reporting and accountability to the community and the Report of Operations 2018/19 is the primary means of advising the Bass Coast community about Council’s operations and performance during the financial year.
About Bass Coast
The Year in Review
Bass Coast Shire Council Annual Report 2018/19 The Year in Review 6
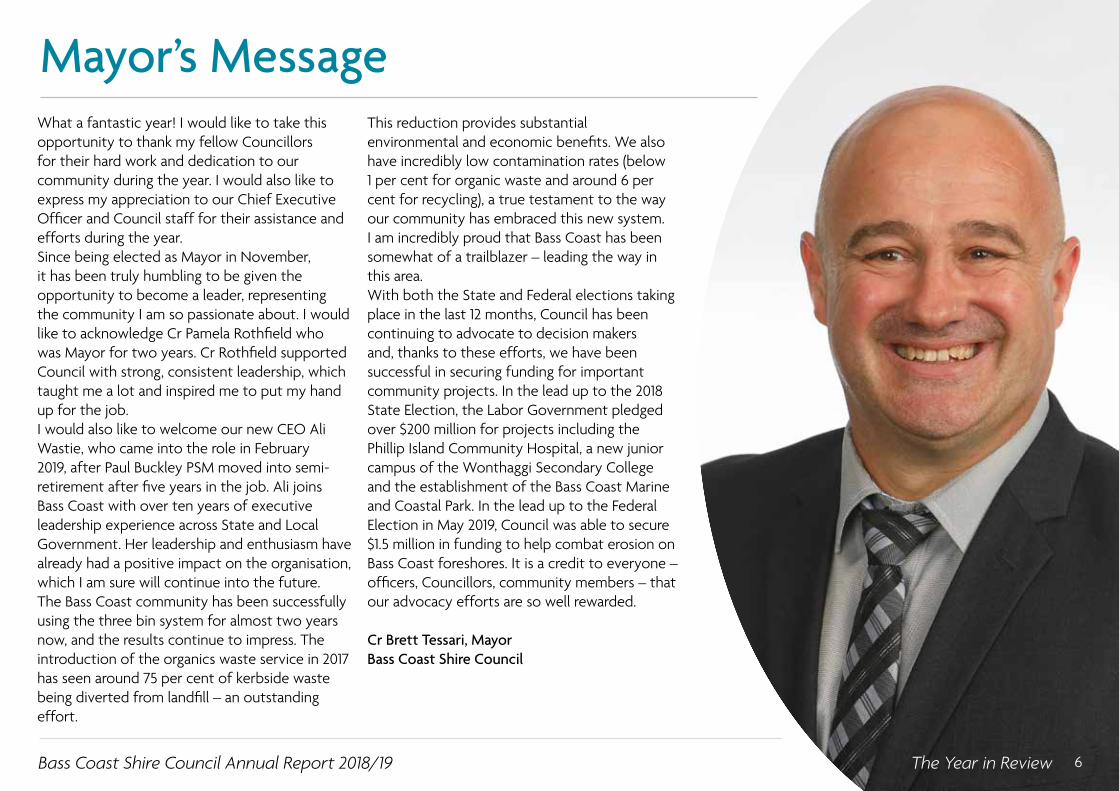
Mayor’s MessageWhat a fantastic year! I would like to take this opportunity to thank my fellow Councillors for their hard work and dedication to our community during the year. I would also like to express my appreciation to our Chief Executive Officer and Council staff for their assistance and efforts during the year.Since being elected as Mayor in November, it has been truly humbling to be given the opportunity to become a leader, representing the community I am so passionate about. I would like to acknowledge Cr Pamela Rothfield who was Mayor for two years. Cr Rothfield supported Council with strong, consistent leadership, which taught me a lot and inspired me to put my hand up for the job.I would also like to welcome our new CEO Ali Wastie, who came into the role in February 2019, after Paul Buckley PSM moved into semi-retirement after five years in the job. Ali joins Bass Coast with over ten years of executive leadership experience across State and Local Government. Her leadership and enthusiasm have already had a positive impact on the organisation, which I am sure will continue into the future. The Bass Coast community has been successfully using the three bin system for almost two years now, and the results continue to impress. The introduction of the organics waste service in 2017 has seen around 75 per cent of kerbside waste being diverted from landfill – an outstanding effort.
This reduction provides substantial environmental and economic benefits. We also have incredibly low contamination rates (below 1 per cent for organic waste and around 6 per cent for recycling), a true testament to the way our community has embraced this new system. I am incredibly proud that Bass Coast has been somewhat of a trailblazer – leading the way in this area. With both the State and Federal elections taking place in the last 12 months, Council has been continuing to advocate to decision makers and, thanks to these efforts, we have been successful in securing funding for important community projects. In the lead up to the 2018 State Election, the Labor Government pledged over $200 million for projects including the Phillip Island Community Hospital, a new junior campus of the Wonthaggi Secondary College and the establishment of the Bass Coast Marine and Coastal Park. In the lead up to the Federal Election in May 2019, Council was able to secure $1.5 million in funding to help combat erosion on Bass Coast foreshores. It is a credit to everyone – officers, Councillors, community members – that our advocacy efforts are so well rewarded.
Cr Brett Tessari, MayorBass Coast Shire Council
Bass Coast Shire Council Annual Report 2018/19 The Year in Review 7
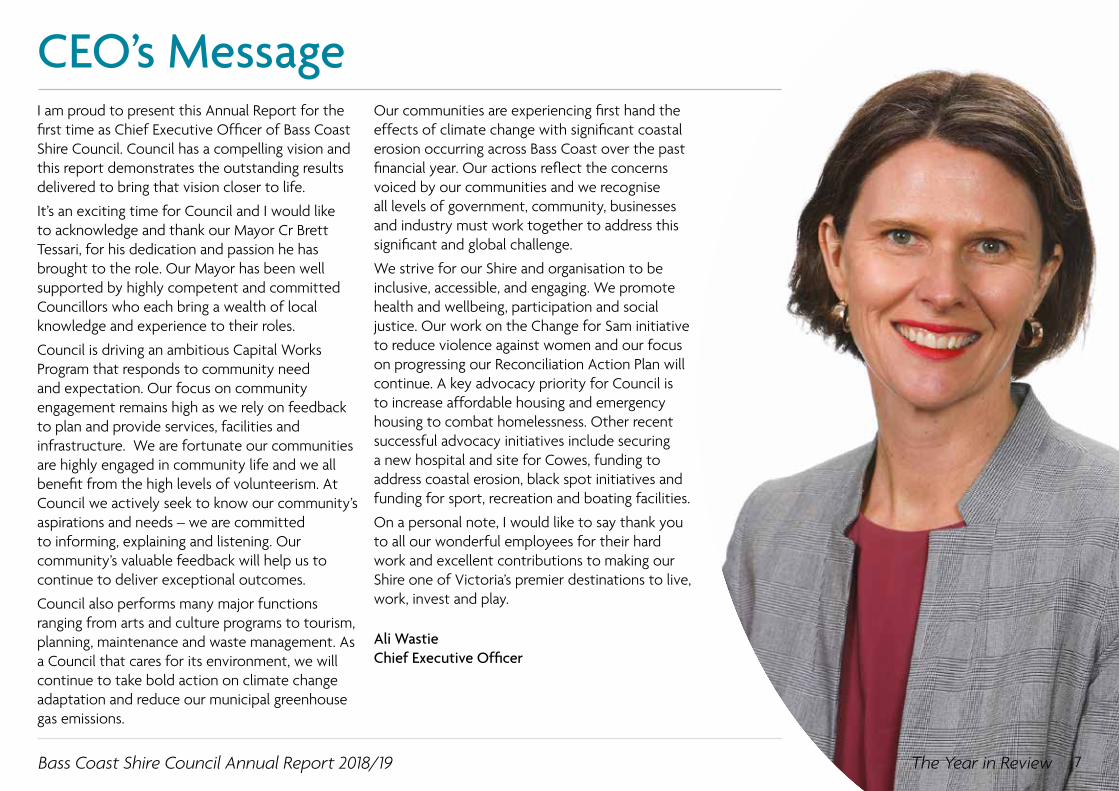
CEO’s MessageI am proud to present this Annual Report for the first time as Chief Executive Officer of Bass Coast Shire Council. Council has a compelling vision and this report demonstrates the outstanding results delivered to bring that vision closer to life.
It’s an exciting time for Council and I would like to acknowledge and thank our Mayor Cr Brett Tessari, for his dedication and passion he has brought to the role. Our Mayor has been well supported by highly competent and committed Councillors who each bring a wealth of local knowledge and experience to their roles.
Council is driving an ambitious Capital Works Program that responds to community need and expectation. Our focus on community engagement remains high as we rely on feedback to plan and provide services, facilities and infrastructure. We are fortunate our communities are highly engaged in community life and we all benefit from the high levels of volunteerism. At Council we actively seek to know our community’s aspirations and needs – we are committed to informing, explaining and listening. Our community’s valuable feedback will help us to continue to deliver exceptional outcomes.
Council also performs many major functions ranging from arts and culture programs to tourism, planning, maintenance and waste management. As a Council that cares for its environment, we will continue to take bold action on climate change adaptation and reduce our municipal greenhouse gas emissions.
Our communities are experiencing first hand the effects of climate change with significant coastal erosion occurring across Bass Coast over the past financial year. Our actions reflect the concerns voiced by our communities and we recognise all levels of government, community, businesses and industry must work together to address this significant and global challenge.
We strive for our Shire and organisation to be inclusive, accessible, and engaging. We promote health and wellbeing, participation and social justice. Our work on the Change for Sam initiative to reduce violence against women and our focus on progressing our Reconciliation Action Plan will continue. A key advocacy priority for Council is to increase affordable housing and emergency housing to combat homelessness. Other recent successful advocacy initiatives include securing a new hospital and site for Cowes, funding to address coastal erosion, black spot initiatives and funding for sport, recreation and boating facilities.
On a personal note, I would like to say thank you to all our wonderful employees for their hard work and excellent contributions to making our Shire one of Victoria’s premier destinations to live, work, invest and play.
Ali WastieChief Executive Officer
Bass Coast Shire Council Annual Report 2018/19 The Year in Review 8
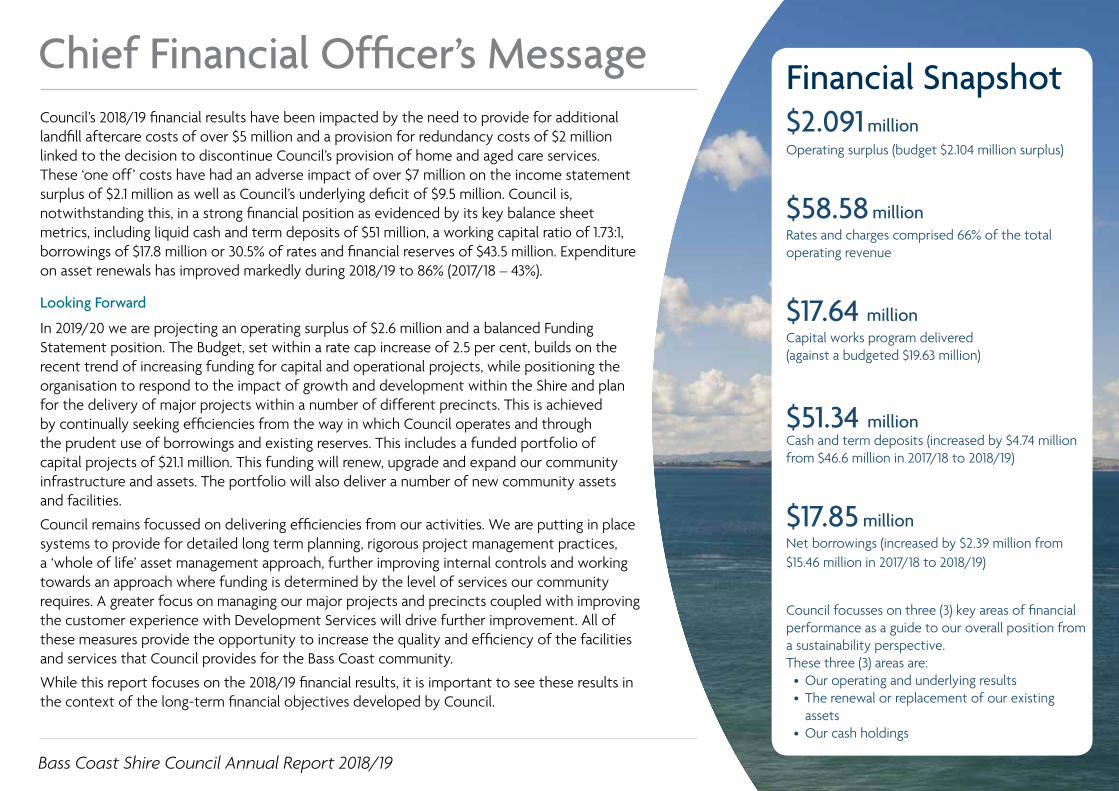
Chief Financial Officer’s MessageCouncil’s 2018/19 financial results have been impacted by the need to provide for additional landfill aftercare costs of over $5 million and a provision for redundancy costs of $2 million linked to the decision to discontinue Council’s provision of home and aged care services. These ‘one off’ costs have had an adverse impact of over $7 million on the income statement surplus of $2.1 million as well as Council’s underlying deficit of $9.5 million. Council is, notwithstanding this, in a strong financial position as evidenced by its key balance sheet metrics, including liquid cash and term deposits of $51 million, a working capital ratio of 1.73:1, borrowings of $17.8 million or 30.5% of rates and financial reserves of $43.5 million. Expenditure on asset renewals has improved markedly during 2018/19 to 86% (2017/18 – 43%).
In 2019/20 we are projecting an operating surplus of $2.6 million and a balanced Funding Statement position. The Budget, set within a rate cap increase of 2.5 per cent, builds on the recent trend of increasing funding for capital and operational projects, while positioning the organisation to respond to the impact of growth and development within the Shire and plan for the delivery of major projects within a number of different precincts. This is achieved by continually seeking efficiencies from the way in which Council operates and through the prudent use of borrowings and existing reserves. This includes a funded portfolio of capital projects of $21.1 million. This funding will renew, upgrade and expand our community infrastructure and assets. The portfolio will also deliver a number of new community assets and facilities.
Council remains focussed on delivering efficiencies from our activities. We are putting in place systems to provide for detailed long term planning, rigorous project management practices, a ‘whole of life’ asset management approach, further improving internal controls and working towards an approach where funding is determined by the level of services our community requires. A greater focus on managing our major projects and precincts coupled with improving the customer experience with Development Services will drive further improvement. All of these measures provide the opportunity to increase the quality and efficiency of the facilities and services that Council provides for the Bass Coast community.
While this report focuses on the 2018/19 financial results, it is important to see these results in the context of the long-term financial objectives developed by Council.
$2.091 millionOperating surplus (budget $2.104 million surplus)
$58.58 millionRates and charges comprised 66% of the total operating revenue
$17.64 millionCapital works program delivered (against a budgeted $19.63 million)
$51.34 million Cash and term deposits (increased by $4.74 million from $46.6 million in 2017/18 to 2018/19)
$17.85 millionNet borrowings (increased by $2.39 million from $15.46 million in 2017/18 to 2018/19)
Council focusses on three (3) key areas of financial performance as a guide to our overall position from a sustainability perspective.These three (3) areas are:
• Our operating and underlying results• The renewal or replacement of our existing
assets• Our cash holdings
Financial Snapshot
Looking Forward

Bass Coast Shire Council Annual Report 2018/19 The Year in Review 9
Chief Financial Officer’s Message
The result for the 2018/19 year was a $2.09 million surplus against a budgeted surplus of $2.10 million.
A key measure of the financial sustainability is the trend in the Underlying Result. This identifies whether we are generating sufficient revenue to cover operating expenses, including asset replacement.The underlying result for 2018/19 was a deficit of $9.55 million. The result was impacted by large one off expenses for landfill amortisation ($5 million) and aged care staff redundancies ($2 million).
Investment in our asset base is an indicator of long term sustainability.
A key strategic indicator is the rate of replacement of our assets as they age and deteriorate.During 2018/19, we capitalised a total of $17.64 million of works and asset purchases (capital expenditure/investment) across the Shire. This included a total of $12.25 million (70%) on renewal works/activities and $3.36 million (19%) on new and upgrade works/activities.
Another key capital indicator is whether the expenditure on renewal matches the rate that our assets are deteriorating or depreciating. Council invested a record amount of $12.2 million in asset renewal in 2018/19 and with upgrades expenditure of $2.3 million it is fully funding asset renewal.
For more information please refer to the annual financial report.
Operating result Underlying result
Replacing our assets
The 2018/19 result:Budget
$ millionActual
$ millionRenewal 11.6 12.2
Upgrade 4.8 2.3
Expansion 0.9 2.0
New 2.3 1.1
Total Capital Works 19.6 17.6
The 2018/19 result:2018/19
$’ million2017/18
$’ millionIncome statement surplus/(deficit)
2.09 9.99
Underlying result (9.55) 1.54
Cash and term deposits
51.34 46.65
Net assets 715.67 636.58
Asset renewal ratio 86% 46%

Bass Coast Shire Council Annual Report 2018/19
Chief Financial Officer’s Message
Cash holdings are about our ability to pay for Council’s activities and obligations as and when they come due and is balanced by restricted items such as trust deposits and reserves or funds held for specific purposes. For example, Local Government Funding Vehicle (LGFV) sinking fund, future landfill rehabilitation etc.
During 2018/19 cash holdings decreased to $35.50 million from $46.65 million in 2017/18. This decrease is due to having invested over $15 million of cash in interest-bearing deposits over 91 days. The level of cash is not an indication of surplus cash but more a reflection of the need to balance the day to day financing of Council with the need to increase capacity or resilience of Council to respond to future opportunities or to future financial risks.
Increasing threats to funding, such as rate capping and growing community expectations, highlight the need for strong financial management, efficient long and short term planning and the targeted allocation of resources.
Our response is to identify and analyse significant trends to provide for sound financial planning and decision making. This is reflected in our annual budget process, Strategic Resource Plan (SRP) and Long Term Financial Plan.
Our Long Term Financial Plan established the strategic financial direction for Council to meet the funding and investment challenges that lie ahead in the next 10 years and beyond. It is prepared in conjunction with the SRP and Council Plan to ensure the affordability of major initiatives are included in the Council Plan.
For further financial performance information refer to the annual financial report.
David Filmalter CAExecutive Manager Finance
Cash holdings Financial sustainability

Bass Coast Shire Council Annual Report 2018/19 The Year in Review 11
The Year in ReviewRedevelopment of the Jetty Triangle precinct, Cowes ($2.2 million) As a multi-year project, intensive planning for the redevelopment of the Jetty Triangle precinct commenced in 2016. The construction phase of this transformative project commenced in February 2018 with completion achieved at the end of October 2018. The redevelopment meets the broader vision of the Cowes Activity Centre Plan and included the creation of an interconnected and free-flowing public space with new lawn areas, pathways, seating, lighting, cenotaph stairway, landscaping, artwork and creation of a new piazza area at the intersection between Thompson Avenue and The Esplanade. A time-lapse video for this project has been captured, and is available online, providing a fascinating insight into the transformation of this key public space within the Cowes Township.
Major Capital WorksIn 2018/19 Council allocated just over $31.2 million towards the renewal, upgrade or construction of new public facilities throughout the municipality. This significant investment is reflective of Council’s continued commitment towards the maintenance and improvement of its important public assets including roads, drainage, pathways, buildings, sports grounds, parks and playgrounds.
Council’s annual Capital Works Program (CWP) traditionally includes a significant number of projects, which span across multiple asset classes. Some of the remarkable projects achieved as part of the 2018/19 CWP include:

12
The Year in ReviewRecreation Reserve pavilion and change rooms, Dalyston ($1.7 million)Substantial improvements have been achieved at the Dalyston Recreation Reserve through construction of new social rooms, commercial kitchen and canteen areas as well as new home and away player and umpire change facilities, catering for male and female participants. These new facilities have enhanced the user group and broader community experience, by providing contemporary and well-appointed rooms and areas for them to enjoy. This project was made possible through collaboration and joint funding between Council and the Reserve Committee of Management, combined with significant volunteer efforts. This renewal and improvement project is yet another example of Council’s commitment towards its major recreation reserves within Bass Coast Shire.
Unsealed and sealed road renewal programs ($1.3 million)Whilst works are often dispersed throughout the municipality, delivery of the annual gravel road re-sheeting and urban and rural resealing programs represents a critical investment in ensuring that Council’s road network remains functional and safe. During 2018/19, Council invested over $1.3 million towards the maintenance and renewal of local gravel and sealed roads through the municipality. Such works are aimed at both protecting and enhancing the lifespan of the existing sealed road network, through periodic bitumen or asphalt resurfacing, as well as ensuring that both urban and rural gravel roads can be safely trafficked during most weather conditions.
Bass Coast Shire Council Annual Report 2018/19 The Year in Review 13
The Year in Review
Football club change rooms and netball court renewal, Cowes ($1.2 million)The renovation and expansion of the home football change room facilities and renewal of the outdoor netball courts at the Cowes Recreation Reserve was a major focus of the 2018/19 Capital Works Program. Challenges were experienced early on, unfortunately resulting in some project delays. Having overcome these challenges, works on the change rooms were completed in June 2019, resulting in a much-improved facility incorporating new showers, toilets, first aid and meeting rooms and a well-appointed area for player changing. Renewal of the netball courts is well underway with the new concrete playing surface, fencing and lighting installed. The final acrylic surface treatment is scheduled for completion later in 2019. These works complement a project carried out in 2018, which provided a new pavilion, housing home and away netball change rooms, football umpire change rooms, away football change room and an accessible toilet.
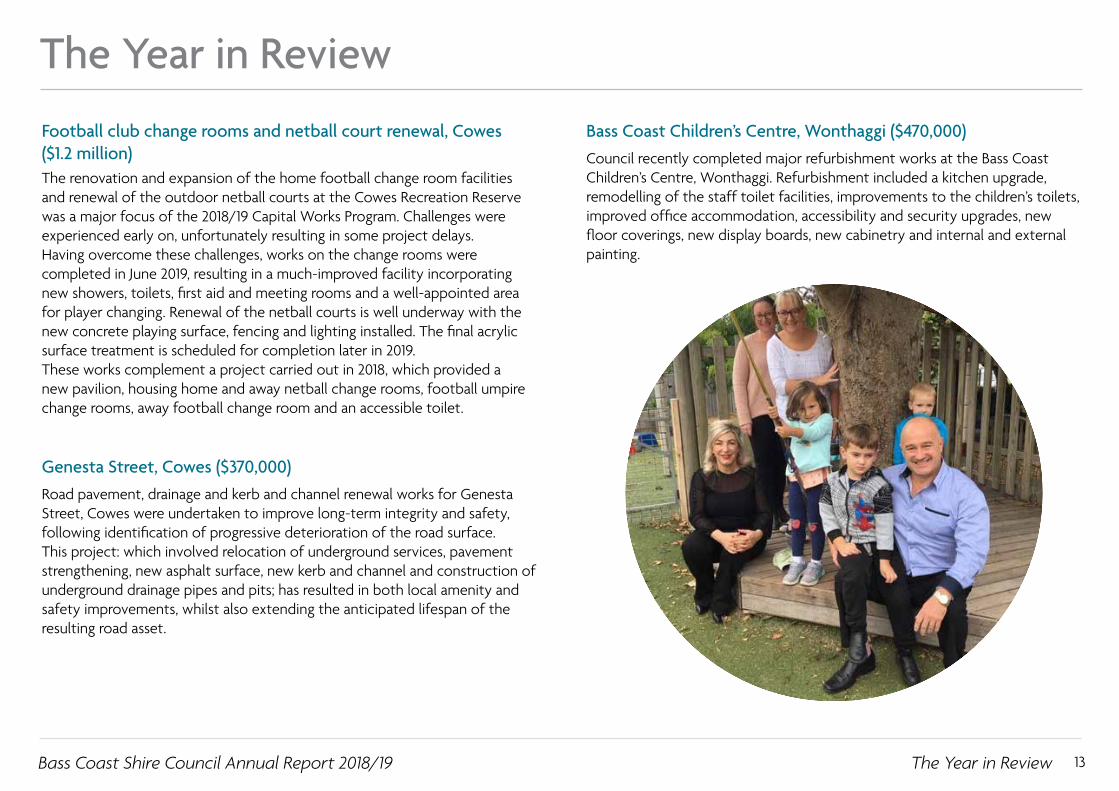
Bass Coast Children’s Centre, Wonthaggi ($470,000)Council recently completed major refurbishment works at the Bass Coast Children’s Centre, Wonthaggi. Refurbishment included a kitchen upgrade, remodelling of the staff toilet facilities, improvements to the children’s toilets, improved office accommodation, accessibility and security upgrades, new floor coverings, new display boards, new cabinetry and internal and external painting.
Genesta Street, Cowes ($370,000)Road pavement, drainage and kerb and channel renewal works for Genesta Street, Cowes were undertaken to improve long-term integrity and safety, following identification of progressive deterioration of the road surface. This project: which involved relocation of underground services, pavement strengthening, new asphalt surface, new kerb and channel and construction of underground drainage pipes and pits; has resulted in both local amenity and safety improvements, whilst also extending the anticipated lifespan of the resulting road asset.
Bass Coast Shire Council Annual Report 2018/19 The Year in Review 14
The Year in Review
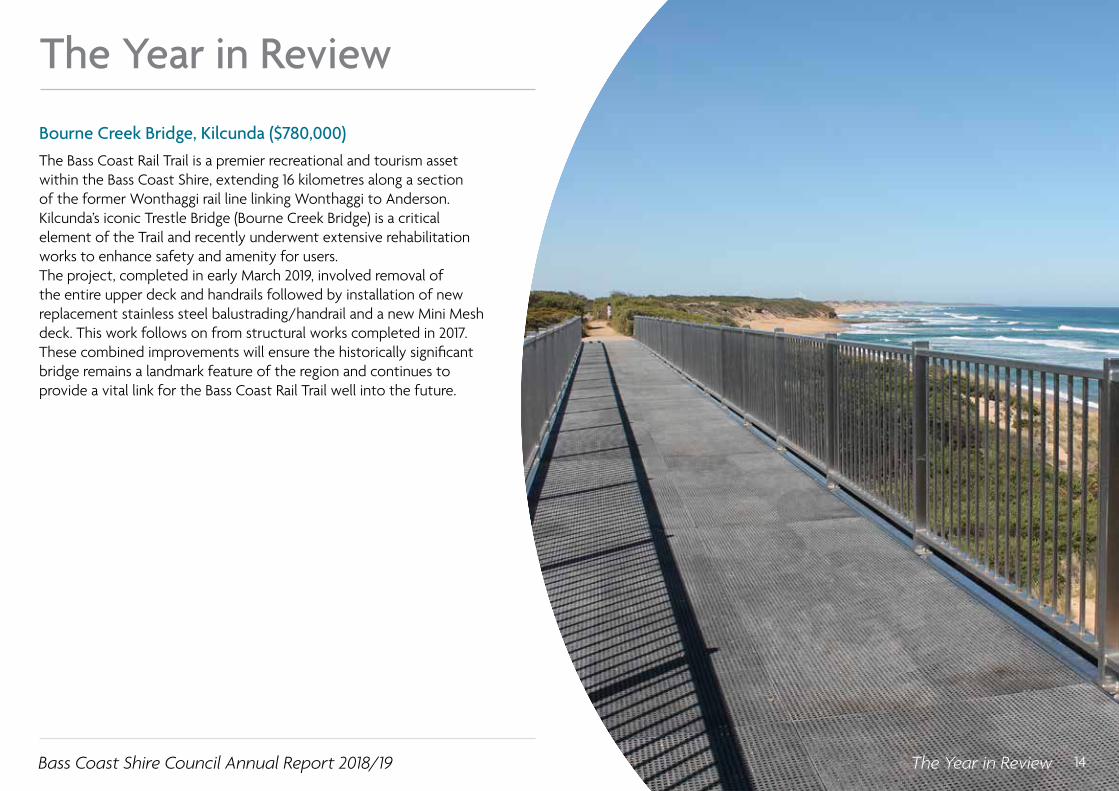
Bourne Creek Bridge, Kilcunda ($780,000)The Bass Coast Rail Trail is a premier recreational and tourism asset within the Bass Coast Shire, extending 16 kilometres along a section of the former Wonthaggi rail line linking Wonthaggi to Anderson. Kilcunda’s iconic Trestle Bridge (Bourne Creek Bridge) is a critical element of the Trail and recently underwent extensive rehabilitation works to enhance safety and amenity for users. The project, completed in early March 2019, involved removal of the entire upper deck and handrails followed by installation of new replacement stainless steel balustrading/handrail and a new Mini Mesh deck. This work follows on from structural works completed in 2017. These combined improvements will ensure the historically significant bridge remains a landmark feature of the region and continues to provide a vital link for the Bass Coast Rail Trail well into the future.
Bass Coast Shire Council Annual Report 2018/19 The Year in Review 15
The Year in ReviewDuring the course of the financial year, Council approved a number of amendments to the Capital Works Program (CWP) and inclusion of new projects. As at the End of Financial Year (EOFY), the revised CWP comprised 122 projects with a budget of $31.2 million.
An analysis of the program status at EOFY has identified an overall aggregate completion rate of 95 per cent, against set targets. This is an excellent result and considered to be reflective of Council’s ongoing commitment and focus on achieving individual project completion or advancement in accordance with set timelines.
Of the 122 active projects, 95 were scheduled to be completed by the end of the financial year. Of these 81 were fully completed, with the vast majority of the remainder significantly advanced. For various reasons the remaining 14 projects could not be fully completed. These projects along with their associated residual budgets totaling $1.5 million, will be carried over into the 2019/20 CWP for completion.
Due to their scale, complexity or required timeframe to implement, 20 projects were identified for delivery over multiple financial years. The vast majority of the interim
completion targets for these multi-year projects have been met during 2018/19, with a number on track for full completion in 2019/20. Residual budgets for these multi-year projects totaling approximately $11 million, will also be carried over into the 2019/20 CWP for progression.
Further to some of the high profile new or upgrade initiatives identified above, another important factor is the fact that as part of the 2018/19 CWP, Council funded 100 per cent of its projected renewal demand, in line with its Asset Management Strategy. The ongoing investment towards renewal of Council’s existing assets is critical in ensuring that they remain available and viable into the future.
As seen above Council’s CWP encompasses a variety of infrastructure and asset works including buildings, roads, drainage, plant replacement and acquisition of land. All works are undertaken to achieve and align with Council’s strategic objectives of Liveability, Health and Wellbeing, and Environment. Council is committed to maintaining and renewing its infrastructure assets, to enable residents and visitors alike to enjoy quality, functional and aesthetically pleasing facilities.
Bass Coast Shire Council Annual Report 2018/19 The Year in Review 16
The Year in ReviewMajor Changes This year saw an increased focus on advocacy to other levels of government with both a state and federal election occurring during 2018/19. Council lobbied candidates and incumbent governments for policy improvements and funding for a range of projects linked to transport, pathways, education, health, homelessness and emergency housing, telecommunications, environment and arts, culture and leisure. At a state level we were successful in our advocacy for a public junior secondary college campus for the Phillip Island and Waterline communities, improved healthcare for Phillip Island with the state government committing to a community hospital, improvements for Cowes jetty and the transfer of the former site of Wonthaggi Secondary College McBride Avenue Campus to Council. At a federal level the government committed up to $1.5 million for erosion mitigation projects in Bass Coast.
Major Achievements This year we celebrated the first anniversary of the beginning of our three-bin system and the introduction of an Organics bin, and what a successful year it was. Our community has embraced the new system and we’re consistently diverting around 75 per cent of kerbside waste from landfill. Before the introduction of this system just 29.8 per cent of Bass Coast’s kerbside waste was diverted from landfill. We’re keeping the contamination rates down to less than 1 per cent for Organics bins and less than 6 per cent for Recycling bins. In August 2018 we hosted a sold-out ‘War on Waste’ breakfast event where the ABC’s Craig Reucassel inspired our community with his stories and praised their efforts in reducing waste. In early 2018 we completed energy audits for the five highest energy consuming sites managed by Council, these identified energy efficiency measures such as reconfiguration of cooling and heating systems and replacement of low efficiency lighting. As a result of the audit, three rooftop solar programs were identified, including the largest solar project at the Civic Centre in Wonthaggi with 100kW solar power system installed and operational in May 2019.

Our Council

Bass Coast Shire Council Annual Report 2018/19 18
Our CouncilBass Coast ProfileBass Coast Shire Council is a local government authority incorporated under the Local Government Act 1989 (Vic). It is located approximately 130km south-east of Melbourne and is bounded by Western Port in the north and west, Cardinia Shire in the north-west, South Gippsland Shire in the east and Bass Strait in the south.The name Bass Coast was adopted as the official name of the Shire when the local governments of Phillip Island, Bass and Wonthaggi were amalgamated in 1994, along with the incorporation of a small section of Woorayl.Bass Coast’s main centres are Wonthaggi, Cowes (Phillip Island), Inverloch, San Remo and Grantville. In addition, Bass Coast comprises a further 28 towns.Bass Coast is home to over 30,000 permanent residents. However, its proximity to Melbourne makes it very attractive to visitors and to people wanting to make a sea change. During peak visitor periods, our population swells to over 80,000.Bass Coast boasts many beautiful beaches, unique nature reserves and many major events that attract more than 3.5 million visitors each year, such as the Australian Motorcycle Grand Prix at the Phillip Island Circuit.
Economy and Employment Bass Coast Shire’s major industries are health care and social assistance, retail trade, accommodation and food services, construction, education and training, and agriculture.
Construction was the biggest contributor to Bass Coast’s gross revenue with $557m (19.05 per cent of gross revenue) and the fourth largest employment sector with 1,223 (11.28 per cent of total jobs) of the workforce in Bass Coast. The biggest employment sector was Health Care and Social Assistance employing 1,557 (14.36 per cent) staff followed by Tourism employing 1,426 (13.15 per cent) staff.
According to REMPLAN, tourism is estimated to generate approximately $259.7m in direct visitor expenditure. Agriculture contributes over $187.2m to the local economy through a combination of traditional farming, such as dairy and meat production and processing, as well as many agricultural boutique enterprises, including venison, free range eggs, olives, wine and cheese.
Unemployment in Bass Coast is approximately 4.83 per cent (quarter ending March 2019).
Key Gross Revenue and Employment Sectors **
Sector Gross Revenue % Total employment %Construction $556.9m 19.05% 1,223 11.28%Tourism $259.7m 8.88% 1,426 13.15%Health Care and Social Assistance
$194.3m 6.65% 1,557 14.36%
Agriculture $187.2m 6.40% 636 5.87%Retail $156.8m 5.36% 1,372 12.65%Education and Training $95.1m 3.25% 761 7.02%
** REMPLAN data - employment data is place of work data and represents total numbers of employees without any conversions to full-time equivalence.
Bass Coast Shire Council Annual Report 2018/19 19
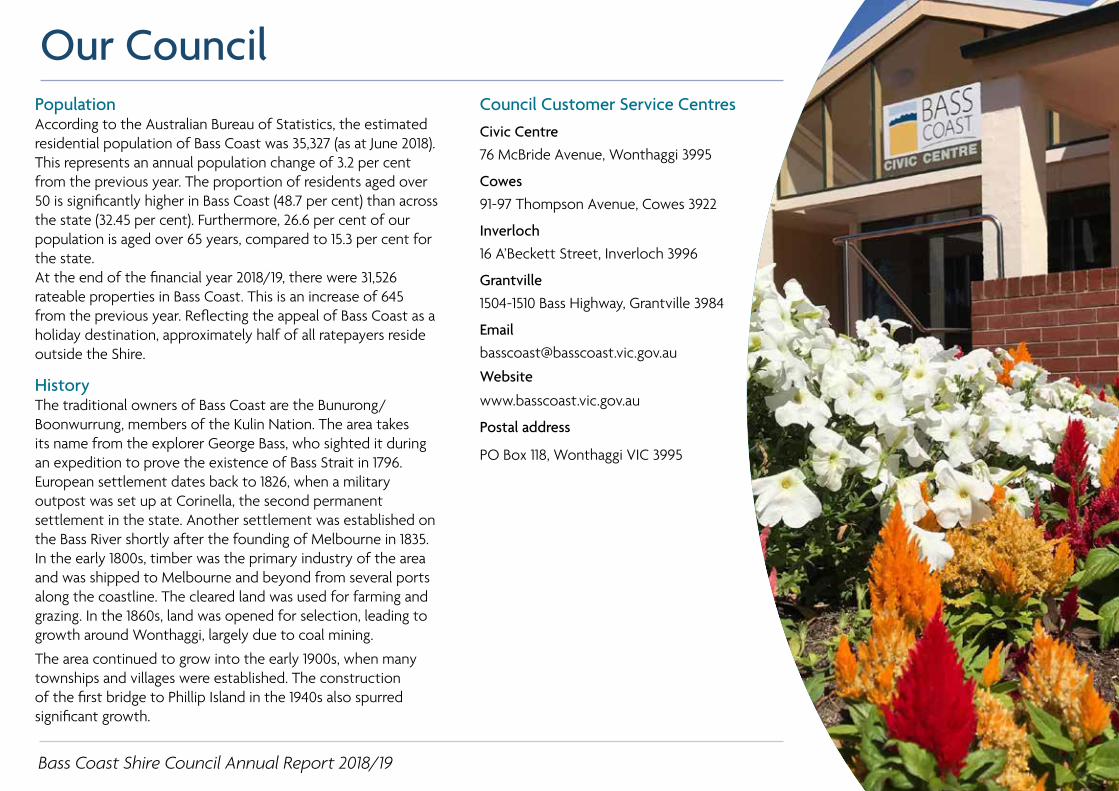
Our CouncilPopulation According to the Australian Bureau of Statistics, the estimated residential population of Bass Coast was 35,327 (as at June 2018). This represents an annual population change of 3.2 per cent from the previous year. The proportion of residents aged over 50 is significantly higher in Bass Coast (48.7 per cent) than across the state (32.45 per cent). Furthermore, 26.6 per cent of our population is aged over 65 years, compared to 15.3 per cent for the state.At the end of the financial year 2018/19, there were 31,526 rateable properties in Bass Coast. This is an increase of 645 from the previous year. Reflecting the appeal of Bass Coast as a holiday destination, approximately half of all ratepayers reside outside the Shire.
History The traditional owners of Bass Coast are the Bunurong/ Boonwurrung, members of the Kulin Nation. The area takes its name from the explorer George Bass, who sighted it during an expedition to prove the existence of Bass Strait in 1796. European settlement dates back to 1826, when a military outpost was set up at Corinella, the second permanent settlement in the state. Another settlement was established on the Bass River shortly after the founding of Melbourne in 1835.In the early 1800s, timber was the primary industry of the area and was shipped to Melbourne and beyond from several ports along the coastline. The cleared land was used for farming and grazing. In the 1860s, land was opened for selection, leading to growth around Wonthaggi, largely due to coal mining.
The area continued to grow into the early 1900s, when many townships and villages were established. The construction of the first bridge to Phillip Island in the 1940s also spurred significant growth.
Council Customer Service CentresCivic Centre76 McBride Avenue, Wonthaggi 3995
Cowes91-97 Thompson Avenue, Cowes 3922
Inverloch16 A’Beckett Street, Inverloch 3996
Grantville1504-1510 Bass Highway, Grantville 3984
Email [email protected]
Website
www.basscoast.vic.gov.au
Postal address
PO Box 118, Wonthaggi VIC 3995

Bass Coast Shire Council Annual Report 2018/19 20
Our Councillors
Cr Stephen Fullarton (03) 5956 6379 0429 099 118 [email protected]
Cr Pamela Rothfield (Mayor 1 July 2018 - 13 November 2018)
(03) 5956 6393 0428 936 025 [email protected]
Cr Michael Whelan (03) 5956 6394 0429 129 811 [email protected]
Cr Julian Brown(03) 5671 21230429 130 [email protected]
Cr Les Larke(03) 5671 2121 0428 747 [email protected]
Cr Brett Tessari (Mayor 14 November 2018 to 30 June 2019,
Deputy Mayor 1 July 2018 - 13 November 2018)
(03) 5671 2122 0428 857 845 [email protected]
Cr Geoff Ellis (03) 5671 2157 0428 840 868 [email protected]
Cr Bruce Kent (03) 5671 2156 0428 741 843 [email protected]
Cr Clare Le Serve (03) 5671 2155 0448 083 286 [email protected]
Bunurong Ward Island Ward Western Port Ward
On 22 October 2016 the Bass Coast community elected the current Council for a four year term. Council has been elected to provide leadership for the good governance of the municipal district and the local community. The municipality is divided into three wards, represented by three Councillors in each ward. The nine Councillors are the elected representatives of all residents and ratepayers across Bass Coast. They have responsibility for setting the strategic direction for the municipality, policy development, identifying service standards and monitoring performance across the organisation.

Our People

Bass Coast Shire Council Annual Report 2018/19 22
Our PeopleOrganisational structureCouncil is the governing body that appoints a Chief Executive Officer (CEO). The CEO has responsibility for the day-to-day management of operations in accordance with the strategic directions of the Council Plan. In 2018/19, three General Managers, the Executive Finance Manager and the CEO formed the Executive Team and lead the organisation.
Chief Executive OfficerAli Wastie – February 2019 to current
With degrees in Arts, Education and holding a Masters of Diplomacy and Trade, Ali has held executive positions within the Victorian Public Service and Local Government. She is also an accomplished Board Director across the not-for-profit, community, tourism and health sectors. She is an accredited executive coach, mediator and alumnus of the Australian Institute of Company Directors. An authentic leader and outstanding communicator, Ali has achieved great outcomes for the boards, communities and organisations she has served. Ali is passionate about developing high performing teams and creating a workplace culture that is innovative, empowered, strategic, trusting and fun.Before joining Bass Coast Shire Council, Ali’s roles within the Local Government sector included Director City Communities at Melbourne City Council and Director of Social and Economic Development at Yarra Ranges Council.
Former Chief Executive OfficerPaul Buckley PSM, February 2014 to February 2019
Paul holds a Graduate Diploma of Business Management from Monash University and has completed the Senior Executives in State and Local Government Program at Harvard University. He has also completed the Colloquium through the Cranlana Programme and is a graduate and member of the Australian Institute of Company Directors.A proven manager, leader and motivator, Paul is a member of Local Government Managers Australia and the International City and County Managers Association. In addition, Paul holds positions on a variety of community committees. In the 2012 Queen’s Birthday Honours, Paul was awarded the Public Service Medal for his outstanding public service and sustained leadership to the local community.

Bass Coast Shire Council Annual Report 2018/19 23
Our PeopleSenior Officers Reporting Directly to the Chief Executive Officer
Former General Manager Corporate and CommunityMark Brady – December 2014 to April 2019
Mark has over 30 years of experience in local government including 15 at the executive level. Prior to joining Bass Coast, he spent five years at the City of Port Phillip, initially as General Manager Corporate Services and then as Executive Manager Governance and Culture.Mark played a leading role in developing stronger financial management and sustainability at Bass Coast whilst also building a high performing organisational culture.Mark brought a diverse portfolio of skills to the role with demonstrated leadership across a diverse range of local government services including Planning, Human Resources and Organisation Development, Finance, Information Services, Governance, Environment, Libraries and Local Laws all under his leadership previously. He holds a Bachelor of Business, a Graduate Diploma of Business, is a Graduate of the Australian Institute of Company Directors, and is an accredited executive coach, MBTI and Human Synergistics practitioner.
Acting General Manager Corporate and CommunityJodi Kennedy – Appointed May 2019
Jodi has over 20 years’ experience in the planning and development industry, with eight of these being at senior management level, a Bachelor of Arts in Urban Studies, a Masters in Public Policy and Management and has completed the Australian Institute of Company Directors Course. Jodi has worked in State and Local Government and as a consultant. Jodi was a Development Director at the Urban and Regional Land Corporation (VicUrban) and a sessional Panel Member with Planning Panels Victoria.Jodi has an extensive network of professional relationships, is passionate about accountability, genuine community engagement, instils a strong customer service culture and is highly respected by her peers. Jodi is a Board member of the Victorian Planning and Environmental Law Association, a member of the Planning Institute of Australia and in her current role is on the Board of the West Gippsland Regional Library Corporation.

Bass Coast Shire Council Annual Report 2018/19 24
Our PeopleGeneral Manager Infrastructure and EnvironmentFelicity Sist
Felicity has 23 years local government experience at Bass Coast Shire Council and has qualifications in Civil Engineering and Business Administration. Prior to this, Felicity worked in the construction industry and state and federal government agencies. The Infrastructure and Environment Division ensures our environment is managed in a sustainable manner and that infrastructure is managed appropriately through its lifecycle. This is achieved for the benefit of the current and future generations through the development of long term asset management plans and implementation of the natural environment strategy.
General Manager Advocacy, Economy and LiveabilityAllison JonesAllison has over two decades of experience working for local and state governments, including 11 years at the executive level. Prior to joining Bass Coast Shire Council in March 2015, Allison spent nine years at Latrobe City Council, initially as Manager Economic Development and then as General Manager Economic Sustainability. She has also worked for the Victorian Government in both economic policy and regional policy roles and the City of Casey. Allison is passionate about sustainable development, customer service and advocacy for regional communities. She is a leader who lives continuous improvement, a team player with drive, persuasive skills and an underlying dedication to creating a culture of excellence. Allison holds a Bachelor of Commerce.
Executive Manager FinanceDavid Filmalter – Appointed May 2019David is head of the Finance department. David is a Chartered Accountant (CA), holds a Masters Degree in Business Leadership and has over 20 years’ experience as Chief Financial Officer at two large Melbourne metro Councils (Port Phillip and Boroondara) prior to joining Bass Coast. David held an Interim General Manager, Finance and Corporate Services role at Wesley Mission Victoria and provided finance and governance consultancy support following the merger of 18 different charities under the Uniting VicTas banner. David has represented the Sector as an Executive member of FINPRO in addition to representing FINPRO on the working group that developed the Local Government Performance Reporting Framework and the Model Budget taskforce. Passionate about staff development, David was responsible for the review and enhancement of the FINPRO financial management leadership program. David has also worked closely with an MAV taskforce that was set up to support local government with the implementation of the goods and services tax.

Bass Coast Shire Council Annual Report 2018/19 25
Our PeopleCouncil Plan and Municipal Public Health and Wellbeing Plan 2017-21
AdvocacyRepresenting the community
Economic Development Expanding, attracting and retaining business and investment
Environment Maintain and protect the natural environment
GovernanceWe are responsive, open, transparent and financially sustainable
Health and WellbeingWe are a healthy and active community
LiveabilityEnjoying the place we live
Our Character Celebrating the uniqueness of our townships
Strategic Principles
Organisation Chart as at 30 June 2019
Performance ManagementDeliver what you promise, when you promise it
Financial ManagementDeliver within the financial parameters that have been set, ie budget and long term financial plan
Relationship Development and ManagementEngaging and building relationships with key stakeholders

Bass Coast Shire Council Annual Report 2018/19 26
Our PeopleCouncil staffA summary of the number of full time equivalent (FTE) Council staff by organisational structure, employment type and gender is set out below. These figures are based on actuals and therefore do not include vacancies.
Employment type/Gender Executive Office FTE
Corporate and Community
FTE
Infrastructure and Environment
FTE
Advocacy, Economy and
LiveabilityFTE
Finance FTE
Total FTE
Permanent Full Time - F 1 29 9 25 10 74
Permanent Full Time - M 0 10 77 19 1 107
Permanent Full Time - X 0 0 0 0 0 0Permanent Part Time - F 0.6 31.3 1.93 11.13 3.86 48.82Permanent Part Time - M 0 2.67 3.57 2.46 1.4 10.1Permanent Part Time - X 0 0 0 0 0 0Temporary Full Time - F 1 6 4 5 4 20Temporary Full Time - M 0 4 8 3 0 15Temporary Full Time - X 0 0 0 0 0 0Temporary Part Time - F 0.37 15.76 0 1.2 0.28 17.61Temporary Part Time - M 0 0.6 0.52 0 0 1.12Temporary Part Time - X 0 0 0 0 0 0Casual - F 0 0 0 0 0 0Casual - M 0 0 0 0 0 0Casual - X 0 0 0 0 0 0Grand Total 2.97 99.33 104.02 66.79 20.54 293.65
Gender categories F - FemaleM - MaleX - Indeterminate /Intersex /Unspecified

Bass Coast Shire Council Annual Report 2018/19 27
Our People
Employment Classification Female FTE Male FTE Other FTE Grand Total (not including vacancies)Band 1 4.96 0.26 0 5.22Band 2 22.96 5.67 0 28.63Band 3 5.23 43.50 0 48.73Band 4 26.48 9.80 0 36.28Band 5 40.01 13.60 0 53.61Band 6 26.08 24.79 0 50.87Band 7 19.71 13.80 0 33.51Band 8 6 13 0 19Other 9 8.80 0 17.80Grand total 160.43 133.22 0 293.65
A summary of the number of full time equivalent (FTE) staff categorised by employment classification and gender is set out below. These figures are based on actuals and therefore do not include vacancies.
Band ‘other’ is anyone who is not a banded employee (Senior Executive Officers, Trainees/Apprentices etc.).

Bass Coast Shire Council Annual Report 2018/19 28
Our People
A Council with 40 or more members of staff must have developed and implemented an equal employment opportunity program (EEO). Council’s Working Together Policy and training program is designed to eliminate discrimination and promote equal opportunity in relation to employment matters.
A key objective of Council’s Working Together Policy and training program is to ensure there is no discrimination relating to the characteristics listed under the Equal Opportunity Act 2010 such as race, colour, sex, marital status, parenthood, physical or mental impairment, age, religious or political affiliation, gender identity and sexual orientation.
Additional objectives include ensuring the workplace is free from bullying and harassment. Council has a formal Grievance Procedure readily available to all supervisors and staff in the rare circumstance where an EEO/Working Together breach is detected.
Awareness of the Working Together Policy is mandatory for all employees and Councillors and is reviewed every four years (post Councillor elections). All new staff are provided with a hard copy of the Working Together Policy and an introduction to EEO principles at the mandatory Corporate Induction Day. Working Together training is provided to all staff with regular workshops timetabled throughout the year to capture all new staff and existing staff requiring refresher training.
Equal employment opportunity program

Bass Coast Shire Council Annual Report 2018/19 29
Our People
We updated our OHS Policy, which now establishes our commitment to achieving Zero Harm, with all employees attending safety workshops to ensure all understand they have a role to play in safety and the importance of providing safe workplaces for all.
Working together, our leaders and our Staff and OHS Consultative Committee (SOCC) have continued:• Fostering a culture of OHS accountability through the sharing of safety
information• Promoting awareness on how to identify and eliminate OHS Hazards• Promoting a healthy and active lifestyle through our Health and Wellbeing
Program• Encouraging all employees to report workplace hazard and injuries • Intervening early when there are signs of illness or injury• Planning and supporting employees to return to work from injury or illness
Other staff matters
Professional development
Council has a strong commitment to high performance across the organisation and has a number of staff performance and professional development programs in place. Performance development is an ongoing process and regular discussions are typically held between employees and their supervisors. This is developed in alignment with strategic priorities as well as in response to needs identified through performance and development plans.
White Ribbon Australia
The prevention of violence against women works primarily through promoting gender equity and building respectful and safe relationships and breaking down stereotypes of women. Council is one of the first workplaces to become accredited in this area, and is leading the way to help improve some confronting statistics. This is a prevention approach consistent with Council’s health and wellbeing planning and aims to increase both the confidence and safety of staff members and those in the community.
Health and safety
2018/19 has been a big year for Health and Safety. We continued our work with the Municipal Association of Victoria (MAV) WorkCare project, which requires a complete review of our Occupational Health and Safety (OHS) Management Systems. While expanding our OHS Management System and embedding safety into our business as usual, MAV WorkCare gives us access to workers compensation insurance through an industry based self-insurance scheme.

Our Performance

Bass Coast Shire Council Annual Report 2018/19
Our Performance
31
The Planning and Accountability Framework is found in Part 6 of the Local Government Act 1989. The Act requires Councils to prepare the following planning and reporting documents:• a Council Plan within the six months after each general election, or by 30
June, whichever is later• a Strategic Resource Plan for a period of at least four years and include this
in the Council Plan• a Budget for each financial year• an Annual Report in respect of each financial yearThe diagram on the right shows the relationships between the key planning and reporting documents that make up the planning and accountability framework for local government. It also shows that there are opportunities for community and stakeholder input and feedback at each stage of the planning and reporting cycle.
1. Advocacy Representing the community
2. Economic Development Expanding, attracting and retaining business and investment
3. Environment Maintain and protect the natural environment
4. Governance We are responsive, open, transparent and financially sustainable
5. Health and Wellbeing We are a healthy and active community
6. Liveability Enjoying the place we live
7. Our Character Celebrating the uniqueness of our townships
The Council Plan 2017-21 includes strategic objectives, strategies for achieving these for the four year period, strategic indicators for monitoring achievement of the strategic objectives and a Strategic Resource Plan. The following are the seven strategic objectives as detailed in the Council Plan.
Planning and Accountability Framework
Council Plan
Time horizon Planning
Medium Term
Short Term
Reporting Timing
Council Plan• Strategic Objectives• Strategies• Strategic Indicators
Strategic Resource Plan• Financial Statements• Statementsofnon-financial
resources
Budget• Services and initiatives• Service outcome indicators• Major initiatives• Financial statements
Stakeholder and
community engagement
Annual Report•Report of operations•Financial statements•Performance statement
Jan–June
Feb-June
Mar-June
Jul – Sep

Bass Coast Shire Council Annual Report 2018/19
Our Performance
32
Council’s performance against each strategic objective for 2018/19 has been reported to demonstrate how Council is performing in achieving the 2017-21 Council Plan.
Performance has been measured as follows:• results achieved in relation to the strategic indicators in the Council Plan• progress in relation to the major initiatives identified in the Budget• services funded in the budget and the persons or sections of the
community who are provided those services• results against the prescribed service performance indicators and
measures
The following sections review the performance of Council against the Council Plan and the services, initiatives, major initiatives and service performance indicators for each business area.
Performance
Bass Coast Shire Council Annual Report 2018/19
Our Performance
33
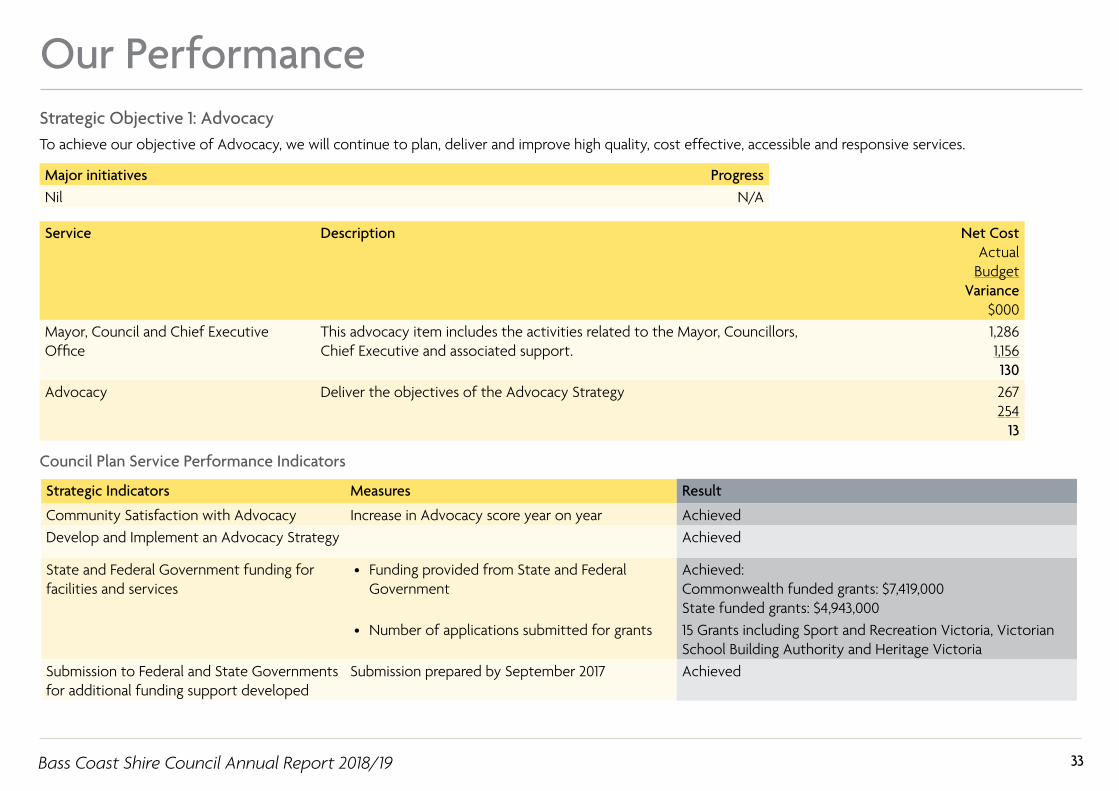
Strategic Objective 1: Advocacy
Major initiatives ProgressNil N/A
Service Description Net CostActual
BudgetVariance
$000Mayor, Council and Chief Executive Office
This advocacy item includes the activities related to the Mayor, Councillors, Chief Executive and associated support.
1,2861,156130
Advocacy Deliver the objectives of the Advocacy Strategy 267254
13
To achieve our objective of Advocacy, we will continue to plan, deliver and improve high quality, cost effective, accessible and responsive services.
Strategic Indicators Measures Result
Community Satisfaction with Advocacy Increase in Advocacy score year on year AchievedDevelop and Implement an Advocacy Strategy Achieved
State and Federal Government funding for facilities and services
• Funding provided from State and Federal Government
Achieved: Commonwealth funded grants: $7,419,000State funded grants: $4,943,000
• Number of applications submitted for grants 15 Grants including Sport and Recreation Victoria, Victorian School Building Authority and Heritage Victoria
Submission to Federal and State Governments for additional funding support developed
Submission prepared by September 2017 Achieved
Council Plan Service Performance Indicators

Bass Coast Shire Council Annual Report 2018/19
Our Performance
34
Strategic Objective 2: Economic Development
Major initiatives ProgressImplement relevant Year 2-5 actions in the Phillip Island and San Remo Visitor Economy Strategy 2035. 100%
Service Description Net CostActual
BudgetVariance
$000Economic Development Management This service is responsible for managing the activities to deliver the economic development
strategic objective.173164
9Economic Development This service supports local business operators to build their skills and run more efficient business
operations leading to increased investment and employment opportunities.234397
(163)Events and Tourism This service assists with tourism development for the region, provides visitor services through the
operation of Visitor Information Centres, provides management of the Inverloch Community Hub and coordinates Council involvement in event activities in the Shire.
1,9591,868
91
To achieve our objective of Economic Development, we will continue to plan, deliver and improve high quality, cost effective, accessible and responsive service.
Bass Coast Shire Council Annual Report 2018/19
Our Performance
35
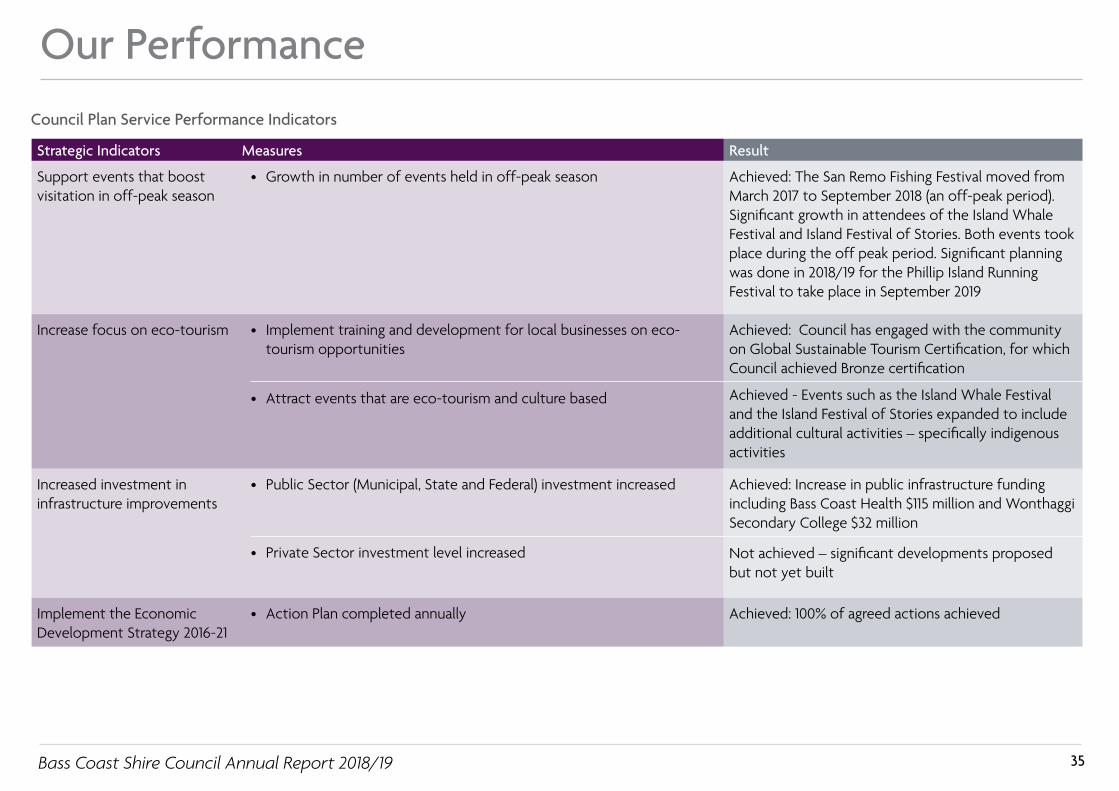
Council Plan Service Performance Indicators
Strategic Indicators Measures Result
Support events that boost visitation in off-peak season
• Growth in number of events held in off-peak season Achieved: The San Remo Fishing Festival moved from March 2017 to September 2018 (an off-peak period). Significant growth in attendees of the Island Whale Festival and Island Festival of Stories. Both events took place during the off peak period. Significant planning was done in 2018/19 for the Phillip Island Running Festival to take place in September 2019
Increase focus on eco-tourism • Implement training and development for local businesses on eco-tourism opportunities
• Attract events that are eco-tourism and culture based
Achieved: Council has engaged with the community on Global Sustainable Tourism Certification, for which Council achieved Bronze certification
Achieved - Events such as the Island Whale Festival and the Island Festival of Stories expanded to include additional cultural activities – specifically indigenous activities
Increased investment in infrastructure improvements
• Public Sector (Municipal, State and Federal) investment increased
• Private Sector investment level increased
Achieved: Increase in public infrastructure funding including Bass Coast Health $115 million and Wonthaggi Secondary College $32 million
Not achieved – significant developments proposed but not yet built
Implement the Economic Development Strategy 2016-21
• Action Plan completed annually Achieved: 100% of agreed actions achieved

Bass Coast Shire Council Annual Report 2018/19
Our Performance
36
Strategic Indicators Measures Result
Implement the Phillip Island and San Remo Visitor Economy Strategy 2035 - Growing Tourism
• Action Plan completed annually
• Gain international certification as a sustainable tourism destination under Global Sustainable Tourism Council by 2021
• Monitor the reporting to Council of the marketing opportunities undertaken through Destination Phillip Island and Destination Gippsland Limited
• Investment opportunities document developed encouraging commercial interest in new accommodation development by 2021
• Locations identified for temporary surfing event infrastructure to support surfing events by 2021
• Complete upgrade to Cowes Jetty Triangle
• Delivery of identified budgeted path projects to improve visitor experience
100% of agreed actions achieved
Not yet due
Achieved – off peak campaigns were reported via the annual report to Council of progress of the Phillip Island and San Remo Visitor Economy Strategy 2035 Not yet due
Not yet due
Achieved
Not yet due
Investigate the feasibility of the Car Ferry from Mornington Peninsula to Phillip Island
• Undertake project feasibility study by 2018
• Achieve business case on time and on budget
• Achieve a reach of 13,000 people through our community engagement process via all mediums
Achieved
Achieved
Achieved
Support farm-gate and agri-tourism development
• Planning Scheme updated by 2020 Achieved
Council Plan Service Performance Indicators (continued)
Bass Coast Shire Council Annual Report 2018/19
Our Performance
37
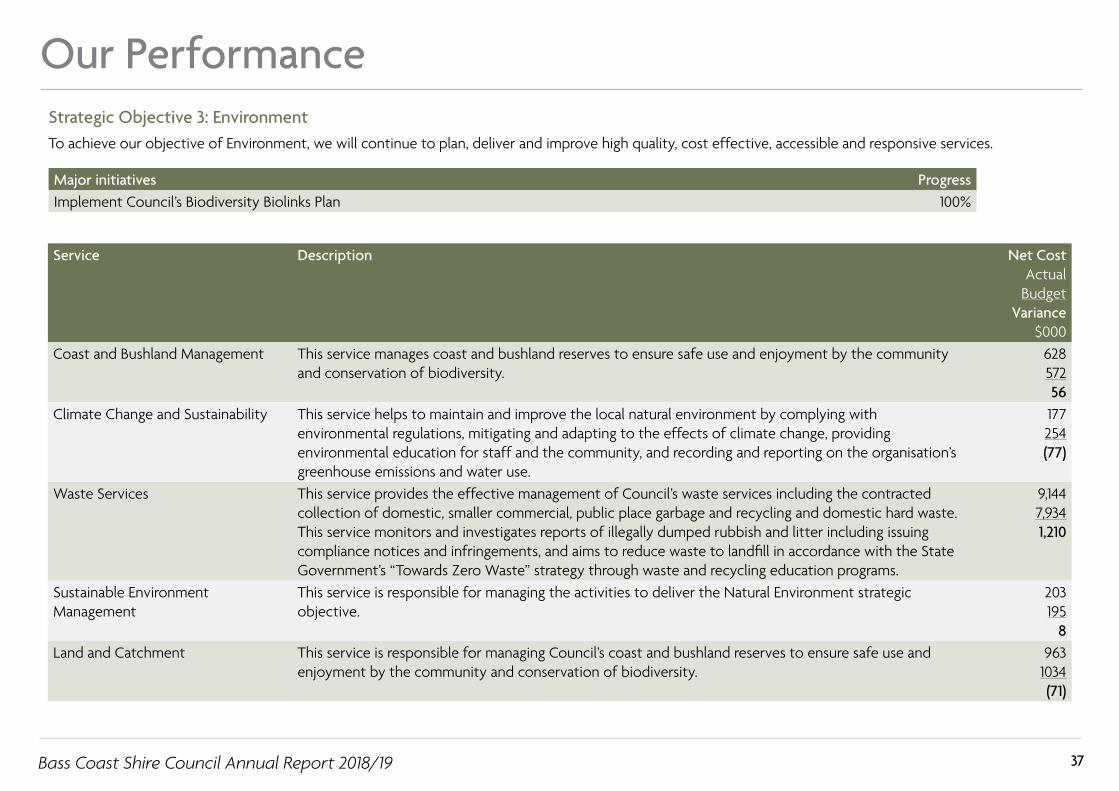
Strategic Objective 3: Environment
Major initiatives ProgressImplement Council’s Biodiversity Biolinks Plan 100%
Service Description Net CostActual
BudgetVariance
$000Coast and Bushland Management This service manages coast and bushland reserves to ensure safe use and enjoyment by the community
and conservation of biodiversity.62857256
Climate Change and Sustainability This service helps to maintain and improve the local natural environment by complying with environmental regulations, mitigating and adapting to the effects of climate change, providing environmental education for staff and the community, and recording and reporting on the organisation’s greenhouse emissions and water use.
177254(77)
Waste Services This service provides the effective management of Council’s waste services including the contracted collection of domestic, smaller commercial, public place garbage and recycling and domestic hard waste. This service monitors and investigates reports of illegally dumped rubbish and litter including issuing compliance notices and infringements, and aims to reduce waste to landfill in accordance with the State Government’s “Towards Zero Waste” strategy through waste and recycling education programs.
9,1447,9341,210
Sustainable Environment Management
This service is responsible for managing the activities to deliver the Natural Environment strategic objective.
203195
8Land and Catchment This service is responsible for managing Council’s coast and bushland reserves to ensure safe use and
enjoyment by the community and conservation of biodiversity.963
1034(71)
To achieve our objective of Environment, we will continue to plan, deliver and improve high quality, cost effective, accessible and responsive services.

Bass Coast Shire Council Annual Report 2018/19
Our Performance
38
Strategic Indicators Measures Results
Emission Reduction • By 2025 achieve a 50% reduction in greenhouse gas levels per Bass Coast resident compared to 2009/10
Not yet due
Restore coastal and inland vegetation corridors in partnership with land owners, land managers and land care groups
• Complete Biolinks Plan and commence implementation by June 2018
Achieved
Increase coverage of native vegetation in the Shire
• Increase native vegetation cover by minimum of 1.5% each year
Achieved
Implement the Waste Management Strategy 2015-25
• Increase diversion of kerbside waste from landfill to 70% by 2021 to extend the life of our landfill
Achieved
Implement the Natural Environment Strategy 2016-26
• Action Plan completed annually 100% of agreed actions achieved
Council Plan Service Performance Indicators

Bass Coast Shire Council Annual Report 2018/19
Our Performance
39
Performance Indicators Result 2017/18
Result 2018/19
Material Variations and Comments
Waste Management
SatisfactionKerbside bin collection requests[Number of kerbside garbage and recycling bin collection requests / Number of kerbside bin collection households] x1000
42.69 46.70 Council serviced 26,510 kerbside collection properties and received 1,238 Customer Requests for 2018/19 compared to 1,107 Customer Requests for 2017/18. The increase in requests can be attributed to the introduction of a three-bin system incorporating Kerbside Food and Garden Organics collection in September 2017.
Service StandardKerbside collection bins missed[Number of kerbside garbage and recycling collection bins missed / Number of scheduled kerbside garbage and recycling collection bin lifts] x10,000
0.92 1.49 The increased number of missed bins compared to number of bins collected is due to improved reporting to now include requests received directly to the Waste Services Contractor as well as those received by Council. Camera systems on the collection trucks have also assisted in verifying whether reports of missed bins are accurate.
Service CostCost of kerbside garbage bin collection service[Direct cost of the kerbside garbage bin collection service / Number of kerbside garbage collection bins]
$70.67 $67.33 This result reflects the direct cost of the kerbside landfill bin collection. It includes the cost of bin collection, landfill operational costs associated with the kerbside service, incorporating the cost of the EPA Landfill Levy for the disposal of waste. The decrease in cost also reflects the reduction of kerbside landfill bin collection from weekly to fortnightly as of September 2017.
Service CostCost of kerbside recyclables collection service[Direct cost of the kerbside recyclables bin collection service / Number of kerbside recyclables collection bins]
$53.37 $69.06 The increase in cost of kerbside recycling is primarily due to the resetting of processing costs imposed on collectors as a result of the Chinese National Sword Policy being applied for a full 12 month period.
Waste DiversionKerbside collection waste diverted from landfill[Weight of recyclables and green organics collected from kerbside bins / Weight of garbage, recyclables and green organics collected from kerbside bins] x100
70.22% 74.77% The significant increase in Bass Coast Shire Council’s diversion rate can be attributed to the introduction of a three-bin system incorporating Kerbside Food and Garden Organics collection in September 2017. The organics collection is weekly and the landfill bin is collected fortnightly to promote diversion of waste from landfill.
Local Government Performance Reporting Framework
Bass Coast Shire Council Annual Report 2018/19
Our Performance
40
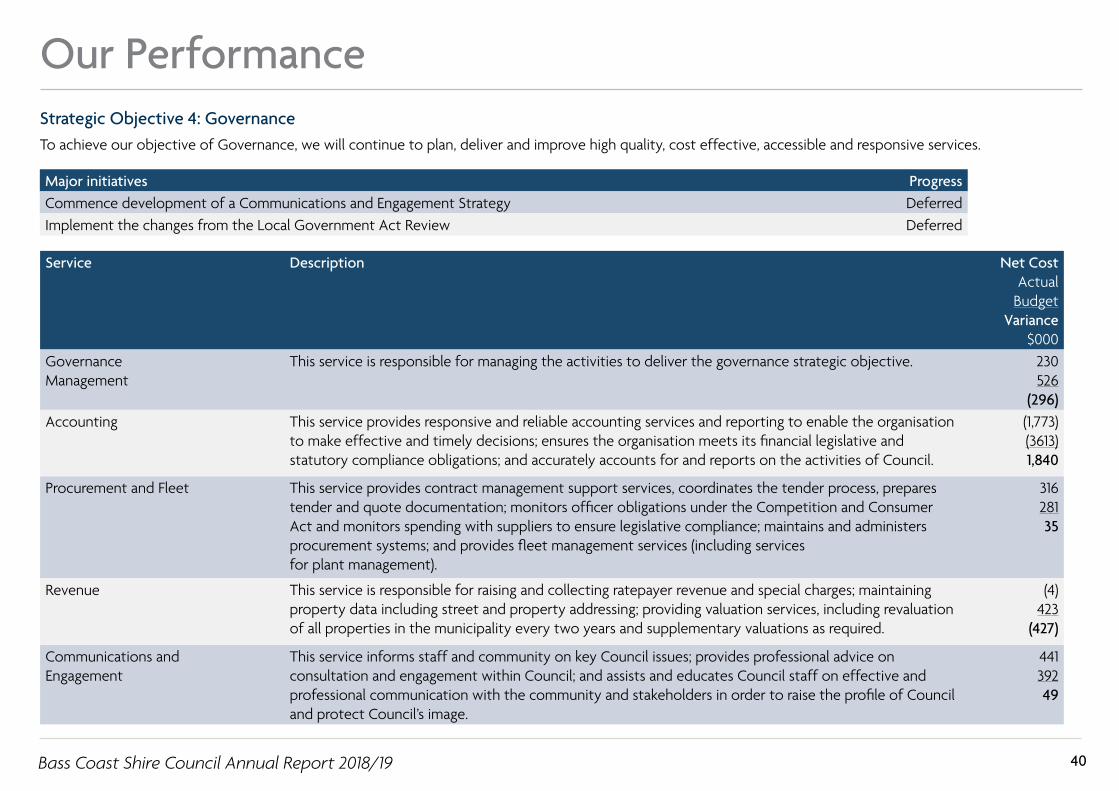
Strategic Objective 4: Governance
Major initiatives ProgressCommence development of a Communications and Engagement Strategy DeferredImplement the changes from the Local Government Act Review Deferred
Service Description Net CostActual
BudgetVariance
$000GovernanceManagement
This service is responsible for managing the activities to deliver the governance strategic objective. 230526
(296)Accounting This service provides responsive and reliable accounting services and reporting to enable the organisation
to make effective and timely decisions; ensures the organisation meets its financial legislative and statutory compliance obligations; and accurately accounts for and reports on the activities of Council.
(1,773)(3613)1,840
Procurement and Fleet This service provides contract management support services, coordinates the tender process, prepares tender and quote documentation; monitors officer obligations under the Competition and Consumer Act and monitors spending with suppliers to ensure legislative compliance; maintains and administers procurement systems; and provides fleet management services (including servicesfor plant management).
31628135
Revenue This service is responsible for raising and collecting ratepayer revenue and special charges; maintaining property data including street and property addressing; providing valuation services, including revaluation of all properties in the municipality every two years and supplementary valuations as required.
(4)423
(427)
Communications andEngagement
This service informs staff and community on key Council issues; provides professional advice on consultation and engagement within Council; and assists and educates Council staff on effective and professional communication with the community and stakeholders in order to raise the profile of Council and protect Council’s image.
44139249
To achieve our objective of Governance, we will continue to plan, deliver and improve high quality, cost effective, accessible and responsive services.

Bass Coast Shire Council Annual Report 2018/19
Our Performance
41
Service Description Net CostActual
BudgetVariance
$000Corporate Planning,Performance and Reporting
This services provides an oversight to Council’s Corporate Planning and Business Planning and improvement processes that integrate with risk management and insurance; ensures Council has the appropriate processes, authorisations and delegations in order to make transparent and accountable decisions; provides support and compliance to Committees of Management and the Wonthaggi and San Remo Cemetery Trusts; manages Council’s property portfolio including Crown Land where Council is the appointed Committee of Management; and oversees Council’s Service Review Program.
8361,800(964)
Customer Service and Facility Management
This service provides frontline customer service to our customers and ratepayers to provide services and to enable contact with Council staff about services provided by Council. This service also provides a coordinated approach for the Civic Centre in Wonthaggi for the amenity of staff and the community.
1,2751,430(155)
Corporate Information This service assists the organisation to ensure records are captured efficiently and accurately; accurately digitises physical records into a compliant electronic format; and conducts staff training and inductions in Information Management Awareness, Information Privacy, Freedom of Information and Confidentiality.
478578
(100)
Information Technology This service provides, supports and maintains reliable and cost effective communications and computing systems, facilities and infrastructure to Council staff enabling them to deliver services in a smart, productive and efficient way.
2,7222,721
1
Human Resources This service delivers workforce planning and recruitment, employee relations, human resources information and reporting, and payment of salaries and wages to Council employees.
569624(55)

Bass Coast Shire Council Annual Report 2018/19
Our Performance
42
Service Description Net CostActual
BudgetVariance
$000Organisation Development This service provides leadership, advice, programs and support to the whole organisation in the areas of Occupational
Health and Safety, WorkCover, health and wellbeing, payroll, leadership and organisation culture, and learning and development.
1,280937343
Asset ManagementSystems
This service protects the value of Council’s assets through effective asset management systems and processes to deliver the best outcome for the community.
437501
(64)Geographic InformationSystems (GIS)
This service provides Geographic Information Systems for Council including the management of software architecture and tools to enable strategic planning across the organisation.
279305(26)

Bass Coast Shire Council Annual Report 2018/19
Our Performance
43
Strategic Indicators Measures Result
Community Satisfaction with Council Decisions • Achieve the top quartile of Large Rural Councils Achieved
Transparency of Council decisions • Achieve the top quartile of Large Rural Councils Not yet due
Community Satisfaction with Consultation and Engagement
• Achieve the top quartile of Large Rural Councils Not Achieved (one point decrease)
Community satisfaction with customer contact • Achieve the top quartile of Large Rural Councils Achieved
Local Government Performance Reporting Framework (LGPRF) – Financial Performance
• Measures that are reported are within the top quartile for Large Rural Councils as identified in the LGPRF
6 of 12 indicators improved year on year
Victorian Auditor General Office (VAGO) Financial Sustainability indicators
• The Strategic Resource Plan and the Long Term Financial Plan to meet or better VAGO low risk indicators
Not achieved. 6 of the 8 indicators have low risk results for 2019/2020 while 2 of the indicators reflect a medium risk outcome.
Other financial and non-financial performance indicators
• Adjusted underlying operation result aims to achieve an operating surplus
• Implementation of monthly and year to date financial reporting, with plain English version for our Community
• Implementation of monthly and year to date non-financial performance reporting, with plain English version for our Community
• Increased efficiencies as a result of information technology improvements
Not Achieved. While Council achieved an operating surplus, the adjusted operating result reflects a deficit due to the large one off adjustments for landfill aftercare amortisation and an accrual for aged care redundancies.
Achieved (Quarterly)
Achieved
Achieved
Council Plan Service Performance Indicators

Bass Coast Shire Council Annual Report 2018/19
Our Performance
44
Strategic Indicators Measures Result
Communications and Engagement Strategy 2015-18 actions implemented
• Complete Strategy implementation by June 2018 Achieved
Develop and implement a Revenue Strategy • Strategy developed and actions implemented Achieved
Council Plan Service Performance Indicators (continued)

Bass Coast Shire Council Annual Report 2018/19
Our Performance
45
Performance Indicators Result 2017/18
Result 2018/19
Material Variations and Comments
Governance
TransparencyCouncil decisions made at meetings closed to the public [Number of Council resolutions made at ordinary or special meetings of Council, or at meetings of a special committee consisting only of Councillors, closed to the public / Number of Council resolutions made at ordinary or special meetings of Council or at meetings of a special committee consisting only of Councillors ] x100
4.08% 7.14% During 2018/19, 16 of 224 decisions were considered in a closed meeting of Council. Closed decisions include personnel and contractual matters. In comparison, 10 of 245 decisions were considered at closed meetings in 2017/18.
Consultation and EngagementSatisfaction with community consultation and engagement[Community satisfaction rating out of 100 with how Council has performed on community consultation and engagement]
52.00 51.00 A consistent result in satisfaction levels is indicative of the implementation of Council’s Communications and Engagement Strategy that is focussed on improved consultation and engagement with the community.
AttendanceCouncillor attendance at council meetings[The sum of the number of Councillors who attended each ordinary and special Council meeting / (Number of ordinary and special Council meetings) × (Number of Councillors elected at the last Council general election)] x100
94.87% 92.06% Bass Coast Shire Councillors' commitment to actively serve the community is reflected in a 92.06% attendance rate at 11 ordinary Council meetings and 3 special Council meetings held during in 2018/19.
Local Government Performance Reporting Framework

Bass Coast Shire Council Annual Report 2018/19
Our Performance
46
Performance Indicators Result 2017/18
Result 2018/19
Material Variations and Comments
Governance
Service CostCost of governance[Direct cost of the governance service / Number of Councillors elected at the last Council general election]
$43,364.11 $54,224.81 The increase on last year’s result is mainly due to the inclusion of recruitment costs for a new Chief Executive. There has also been inflation applied to Councillor Allowances, which has contributed to the increase.
SatisfactionSatisfaction with council decisions[Community satisfaction rating out of 100 with how Council has performed in making decisions in the interest of the community]
49.00 51.00 A continued increase in community satisfaction is indicative of Council's implementation of its Communications and Engagement Strategy that is focussed on improving engagement with the community and explaining the reasons behind Council decisions.

Bass Coast Shire Council Annual Report 2018/19
Our Performance
47
Strategic Objective 5: Health and Wellbeing
Major initiatives ProgressDevelop a Reconciliation Action Plan Deferred
Service Description Net CostActual
BudgetVariance
$000Environmental Health This service provides Environmental Health services such as immunisation programs and monitoring
compliance with health regulations to the community and businesses to promote health and wellbeing.198350
(152)
Aged Disability Services This service provides a range of home and community care services for the aged and disabled including home delivered meals, personal care, and home maintenance.
2,2231,167
1,056Community Strengthening This service provides support services to enable our diverse community to be strong and healthy,
including senior citizens’ support, maternal and child health, kindergartens and housing support.125168(43)
To achieve our objective of Health and Wellbeing, we will continue to plan, deliver and improve high quality, cost effective, accessible and responsive services.

Bass Coast Shire Council Annual Report 2018/19
Our Performance
48
Strategic Indicators Measures Results
Participation in health promotion activities Health promotion activities from Health and Wellbeing Plan Actions undertaken annually
Achieved
Compliance with Municipal Emergency Management Plan 2014
100% compliance 100% compliance
Implement the Youth Action Plan 2016-20 Action Plan completed annually 100% of agreed actions achieved
Implement annual Municipal Public Health and Wellbeing Action Plan
Action Plan completed annually 100% of agreed actions achieved
Implement the Disability Action Plan 2016-20 Action Plan completed annually 100% of agreed actions achieved
Implement Municipal Early Years Plan 2016-20 Action Plan completed annually 100% of agreed actions achieved
Council Plan Service Performance Indicators

Bass Coast Shire Council Annual Report 2018/19
Our Performance
49
Performance Indicators Result 2017/18
Result 2018/19
Material Variations and Comments
Food Safety
TimelinessTime taken to action food complaints[Number of days between receipt and first response action for all food complaints / Number of food complaints]
1.73 days 1.71 days In 2018, Council received 49 food complaints. Food related requests are prioritised for completion, with the majority actioned on the day they are reported to Council.
Service StandardFood safety assessments[Number of registered class 1 food premises and class 2 food premises that receive an annual food safety assessment in accordance with the Food Act 1984 / Number of registered class 1 food premises and class 2 food premises that require an annual food safety assessment in accordance with the Food Act 1984] x100
99.45% 99.20% In 2018, there were 372 out of 375 food premises assessments completed. This result is consistent with our previous year result where 360 out of 362 food premises assessments were completed.
Service CostCost of food safety service[Direct cost of the food safety service / Number of food premises registered or notified in accordance with the Food Act 1984]
$344.93 $335.44 There has been an increase in the number of food premises from 491 in 2017/18 to 510 in 2018/19 which has been managed with no significant increase in service delivery costs and resourcing.
Local Government Performance Reporting Framework

Bass Coast Shire Council Annual Report 2018/19
Our Performance
50
Performance Indicators Result 2017/18
Result 2018/19
Material Variations and Comments
Food Safety
Health and SafetyCritical and major non-compliance outcome notifications[Number of critical non-compliance outcome notifications and major non-compliance notifications about a food premises followed up / Number of critical non-compliance outcome notifications and major non-compliance notifications about a food premises] x100
98.11% 96.88% Council places high importance on ensuring critical and major non-compliances are satisfactorily followed up. Enhanced internal processes and reporting has enabled more accurate tracking of these notifications, which has led to an improved response to identified non-compliances. There was a slight decrease in response rate during 2019 due to a temporary reduction in staff resources.
Reporting on Home and Community Care (HACC) LGPRF Performance Indicators ceased on 1 July 2016 due to the introduction of the Commonwealth Government’s NDIS and CHSP programs.

Bass Coast Shire Council Annual Report 2018/19
Our Performance
51
Strategic Objective 6: Liveability
Major initiatives ProgressComplete the review of the Road Services Asset Management Plan including the Urban Roads and Drainage Improvement Policy
100%
Service Description Net CostActual
BudgetVariance
$000Infrastructure Management This service is responsible for managing the infrastructure activities to deliver the sustainable
development and growth strategic objective.1,4981,938(440)
Asset Management This service plans for the preservation, protection and expansion of existing and future infrastructure assets for their maximum possible design life and minimum ongoing life-cycle cost, while responding to the community’s changing needs and expectations. This service also provides advice to Planning Approvals and Strategic Planning on new developments across Bass Coast.
1,8601,884
(24)
Civil Construction and Design This service undertakes design, tendering, contract management and supervision of various works within Council’s capital works program to ensure delivery to a quality standard, to scope, on time and on budget.
538803
(265)Building Maintenance This service maintains Council buildings in accordance with the building asset management plan. 1,336
1,789(453)
To achieve our objective of Liveability, we will continue to plan, deliver and improve high quality, cost effective, accessible and responsive services.

Bass Coast Shire Council Annual Report 2018/19
Our Performance
52
Service Description Net CostActual
BudgetVariance
$000Plant This service provides plant and vehicle management services to the infrastructure maintenance
department.1,0651,250(185)
Roads This service maintains Council’s roads and road related infrastructure. 2,4912,748(257)
Local Laws andEmergency Management
This service assists the organisation to ensure Council and the municipality is in a state of preparedness to fulfil its responsibilities in Emergency Management. The service also implements Council’s responsibilities under legislation including the Domestic Animals Act 1994 and Council’s Local Laws, to promote community safety and harmonious community relationships.
83174586
Recreation and Culture This service supports, encourages and develops leisure projects, programs and services, along with a range of recreational facilities including an aquatic centre, fully equipped gymnasiums, and an extensive range of recreational programs, and a library service that caters for the needs of residents.
6,6804,7171,963

Bass Coast Shire Council Annual Report 2018/19
Our Performance
53
Strategic Indicators Measures Results
Community grants program supporting events • Funding contributed to community events as identified in Annual Budget
Achieved
Develop Municipal Recreation Plan • Developed by June 2018 Achieved (Active Bass Coast Plan)
Implement annual Health and Wellbeing Action Plan • Action Plan completed annually 100% of agreed actions achieved
Build community infrastructure that improves quality of life
• 90% of the projects included in the Capital Works program to be completed
Achieved
Implement Asset Management Policy and Strategy Improvements
• Action Plan completed annually Achieved
Implementation of annual maintenance programs • Annual program implemented Achieved
Implement priorities identified in the Pathways Network Plan 2016
• Delivery of identified budgeted path projects• Grant opportunities identified and applied for
Achieved
Develop and implement Domestic Animal Management Plan 2017-20
• Action Plan completed annually 100% of agreed actions achieved
Implement Arts and Culture Plan 2015-19 • Action Plan completed annually
• New plan revised and adopted by 2019
Achieved
Achieved
Implement Youth Action Plan 2016-20 • Action Plan completed annually
• New plan revised and adopted by 2020
100% of agreed actions achieved
New Plan not yet due
Bass Valley Children’s Centre construction • Construction completed and facility opened by February 2018 Achieved
Council Plan Service Performance Indicators

Bass Coast Shire Council Annual Report 2018/19
Our Performance
54
Performance Indicators Result 2017/18
Result 2018/19
Material Variations and Comments
Roads
Satisfaction of UseSealed local road requests[Number of sealed local road requests / Kilometres of sealed local roads ] x100
9.44 10.32 Council maintains 562 kilometres of sealed local roads. We received a total of 58 sealed local road requests in 2018/19 compared to 52 requests in 2017/18.
ConditionSealed local roads below the intervention level[Number of kilometres of sealed local roads below the renewal intervention level set by Council / Kilometres of sealed local roads] x100
99.90% 98.34% Council recently undertook a network wide condition survey (which occurs every 4-5 years) and as such more segments of road which have reached intervention were identified.
Service CostCost of sealed local road reconstruction[Direct cost of sealed local road reconstruction / Square metres of sealed local roads reconstructed]
$53.46 $87.87 Council's pavement reconstruction costs are significantly higher than the previous financial year. The proportion of urban road reconstruction increased since the previous year, thus increasing the cost per square metre. Due to higher traffic volumes, urban road projects typically need to be constructed with more material and as a result are more expensive. Higher costs are also realised as there are more adjustments required to surrounding infrastructure such as drainage, services, vehicle crossings and more traffic management is required. Additionally one of the major rural road projects, as expected, required significant earthworks to improve road alignment. These works were beyond a standard pavement reconstruction.
Service CostCost of sealed local road resealing[Direct cost of sealed local road resealing / Square metres of sealed local roads resealed]
$9.78 $8.85 The cost per square metre of sealing reduced this year in comparison to last year. This was due to the sealing program being designed to treat fewer, but longer sections of road in the rural areas which leads to efficiency of delivery. Furthermore, the volume of road reseals required in the urban areas were not as significant as previous years.
Local Government Performance Reporting Framework

Our Performance
Performance Indicators Result 2017/18
Result 2018/19
Material Variations and Comments
Roads
SatisfactionSatisfaction with sealed local roads[Community satisfaction rating out of 100 with how Council has performed on the condition of sealed local roads]
47.00 53.00 A six point increase in community satisfaction from the previous year is indicative of Council's commitment and focus in improving its road network. It is important to note that the survey results are also a reflection of the state controlled roads within the municipality.

Bass Coast Shire Council Annual Report 2018/19
Our Performance
56
Performance Indicators Result 2017/18
Result 2018/19
Material Variations and Comments
Libraries
UtilisationLibrary collection usage[Number of library collection item loans / Number of library collection items]
6.46 5.82 There were 47,853 printed items, audio-visual, digital materials, and games available in Bass Coast public libraries during the year with 287,372 loans made during the year.
Resource StandardStandard of library collection[Number of library collection items purchased in the last 5 years / Number of library collection items] x100
79.84% 72.86% Bass Coast libraries have continued to have a high collection renewal rate with 72.86 percent of the collection being renewed in the last five years.
Service CostCost of library service[Direct cost of the library service / Number of visits]
$6.62 $6.78 During the year, 266,099 visits were made to Bass Coast public libraries, resulting in a cost of $6.78 per visit to deliver the service.
ParticipationActive library members[Number of active library members / Municipal population] x100
23.70% 23.02% Active library members for the year were 8,134 which is a slight increase on the previous year. However the population growth for Bass Coast Shire has increased faster than the rate of active library members therefore resulting in an overall decrease in the indicator result compared to the previous year. This indicator does not include the increasing members who use the library service for accessing Wi-Fi and computers or those who don't borrow an item.

Bass Coast Shire Council Annual Report 2018/19
Our Performance
57
Performance Indicators Result 2017/18
Result 2018/19
Material Variations and Comments
Aquatic Facilities
Service StandardHealth inspections of aquatic facilities[Number of authorised officer inspections of Council aquatic facilities / Number of Council aquatic facilities]
1 2 Bass Coast Shire has one aquatic facility. Two health inspections were completed in July 2018 and May 2019
Health and SafetyReportable safety incidents at aquatic facilities[Number of WorkSafe reportable aquatic facility safety incidents]
0 2 Two Worksafe reportable incidents occurred in the 2018/19 year.
Service CostCost of indoor aquatic facilities[Direct cost of indoor aquatic facilities less income received / Number of visits to indoor aquatic facilities]
$2.60 $2.91 The increase in costs relates to the agreed payment schedule as outlined in the five year term of the contract between Bass Coast Shire Council and the YMCA.
UtilisationUtilisation of aquatic facilities[Number of visits to aquatic facilities / Municipal population]
4.53 4.33 A reduction in this indicator between 2017 and 2019 is attributable to both a 1% decrease in the number of visits to aquatics facilities, coupled with continuous growth in the municipal population. A large increase seen between 2016 and 2017 is a result of updated processes in relation to the recording of aquatic centre visits in 2017.

Bass Coast Shire Council Annual Report 2018/19
Our Performance
58
Performance Indicators Result 2017/18
Result 2018/19
Material Variations and Comments
Animal Management
TimelinessTime taken to action animal management requests[Number of days between receipt and first response action for all animal management requests / Number of animal management requests]
2.56 days 2.05 days Animal management requests are triaged by Council staff. There has been an increased focus on reducing Council's timeframes when dealing with public risk and animal welfare requests such as stock at large, dog attack/dog rushes and dog and cat pickups. Other animal management requests not considered a public risk/animal welfare issue are dealt with when resources are available.
Service StandardAnimals reclaimed[Number of animals reclaimed / Number of animals collected] x100
56.41% 67.95% Council promotes responsible pet ownership at every opportunity. All animals that come in to our pound are checked for registration tags and a microchip. We promote unidentifiable found animals through our website and through our Facebook page. Council works closely with the community in returning animals to their owners.
Service CostCost of animal management service[Direct cost of the animal management service / Number of registered animals]
$37.36 $41.14 Council promotes responsible pet ownership at every opportunity. Council Officers have been working to cleanse our animal data in preparation to move to a new animal management system. This has resulted in some deactivation of animals recorded which has slightly reduced our registration figures.
Health and SafetyAnimal management prosecutions[Number of successful animal management prosecutions]
11 12 The number is reflective of the successful animal management prosecutions during 2018/19 (excluding unpaid fines). We continue to see an increase in the number of serious dog attack cases reported to Council.

Bass Coast Shire Council Annual Report 2018/19
Our Performance
59
Strategic Objective 7: Our Character
Major initiatives ProgressImplement the Bass Coast Planning Scheme Review recommendations via a Planning Scheme Amendment 100%Continue implementation of Wonthaggi North East Precinct Structure Plan and Developer Contributions Plan into the Bass Coast Planning Scheme 100%
Service Description Net CostActual
BudgetVariance
$000Parks This service maintains open spaces including parks, gardens, reserves, foreshores and sporting ovals. 3,521
3,624(103)
Planning and Character Management
This service is responsible for managing the sustainable development and growth activities that develop the character of the municipality. In addition this service enforces the Bass Coast Planning Scheme including the management and investigation of complaints, liaison and negotiation to achieve positive outcomes after breaches have occurred and the legal activities associated with Planning Enforcement.
75773027
Building Services This service is responsible for the assessment and determination of building applications, conducting building inspections, advising residents on building-related matters and implementing pool safety and essential safety audits.
187305(118)
Statutory Planning This service provides assessment of planning permit applications against the various requirements of the Bass Coast Planning Scheme and the Planning and Environment Act to ensure that development across the Shire is appropriately planned and controlled.
511645
(134)
Strategic Planning This service maintains the Bass Coast Planning Scheme by development and delivery of key Strategic Planning projects and policies, and the assessment of planning scheme amendments. This service also plans for recreation facilities and services to meet the current and future needs of the community.
746519227
Social and CommunityPlanning
This service has the responsibility to frame and respond to the challenges of social inclusion that present to Council. This service provides and gives support to community development, community planning, community grants, youth and social planning, rural access and Inter Council Aboriginal Consultative Committee.
8201,037(217)
To achieve our objective of Our Character, we will continue to plan, deliver and improve high quality, cost effective, accessible and responsive services.
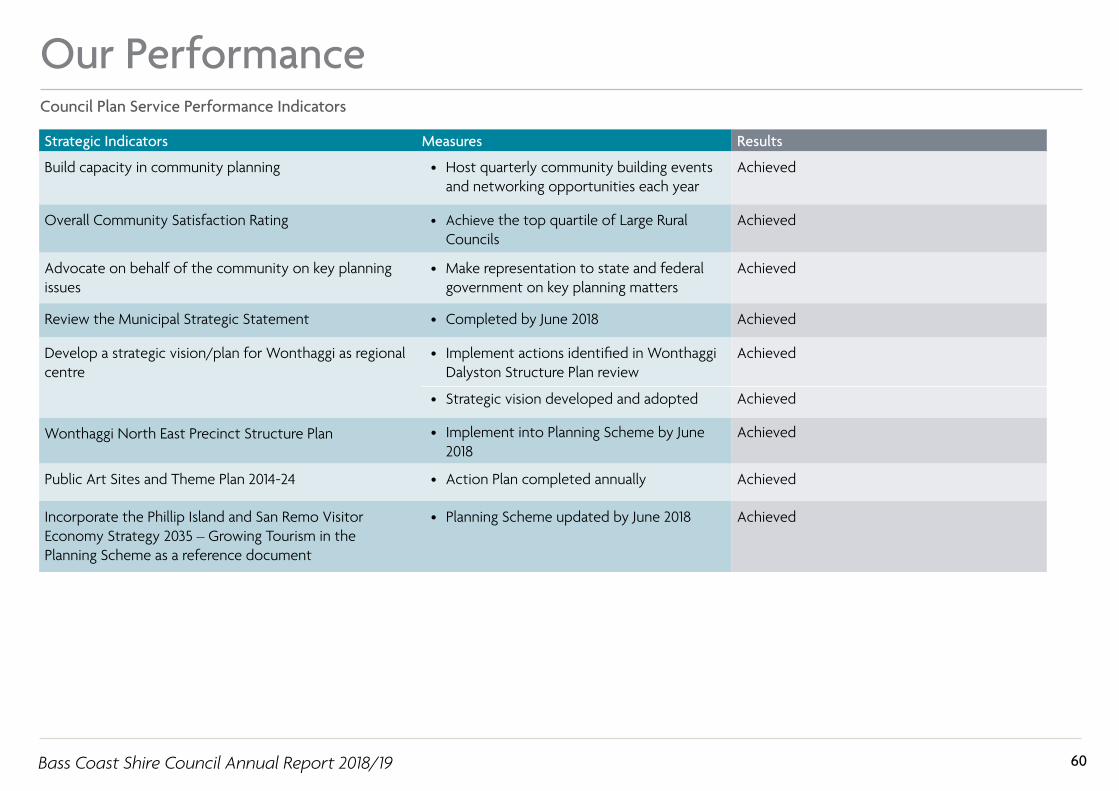
Bass Coast Shire Council Annual Report 2018/19
Our Performance
60
Strategic Indicators Measures Results
Build capacity in community planning • Host quarterly community building events and networking opportunities each year
Achieved
Overall Community Satisfaction Rating • Achieve the top quartile of Large Rural Councils
Achieved
Advocate on behalf of the community on key planning issues
• Make representation to state and federal government on key planning matters
Achieved
Review the Municipal Strategic Statement • Completed by June 2018 Achieved
Develop a strategic vision/plan for Wonthaggi as regional centre
• Implement actions identified in Wonthaggi Dalyston Structure Plan review
• Strategic vision developed and adopted
Achieved
Achieved
Wonthaggi North East Precinct Structure Plan • Implement into Planning Scheme by June 2018
Achieved
Public Art Sites and Theme Plan 2014-24 • Action Plan completed annually Achieved
Incorporate the Phillip Island and San Remo Visitor Economy Strategy 2035 – Growing Tourism in the Planning Scheme as a reference document
• Planning Scheme updated by June 2018 Achieved
Council Plan Service Performance Indicators

Bass Coast Shire Council Annual Report 2018/19
Our Performance
61
Performance Indicators Result 2017/18
Result 2018/19
Material Variations and Comments
Statutory Planning
TimelinessTime taken to decide planning applications[The median number of days between receipt of a planning application and a decision on the application]
78 days 81 days This result is a minor variation to the 2017/18 result of 78 days.
Service standardPlanning applications decided within required time frames[(Number of regular planning application decisions made within 60 days) + (Number of VicSmart planning application decisions made within 10 days) / Number of planning application decisions made] x100
82.49% 78.45% A small decrease in the overall percentage can be attributed to an increase in total planning applications received whilst maintaining similar staffing resources to the previous year.
Service CostCost of statutory planning service[Direct cost of the statutory planning service / Number of planning applications received]
$1,908.51 $2,201.09 The increase in the cost this year can be attributed to legal fees for a number of complex planning matters including a number of VCAT matters that required legal services.
Decision MakingCouncil planning decisions upheld at VCAT[Number of VCAT decisions that did not set aside Council’s decision in relation to a planning application / Number of VCAT decisions in relation to planning applications] x100
75% 80% In 2018/19 four of five Council planning decisions were affirmed by VCAT with one decision set aside.
Local Government Performance Reporting Framework

Bass Coast Shire Council Annual Report 2018/19
Our Performance
62
Performance StatementDescription of municipality Bass Coast Shire Council is a local government authority incorporated under the Local Government Act 1989 (Vic). It is located about 130km south east of Melbourne and is bounded by Western Port in the north and west, Cardinia Shire in the north east, South Gippsland Shire in the east and Bass Strait in the south. Bass Coast’s main centres are Wonthaggi, Cowes (Phillip Island), Inverloch, San Remo and Grantville. In addition, the Shire comprises a further 28 towns.
Bass Coast is home to over 30,000 permanent residents. However, its proximity to Melbourne makes it very attractive to visitors and to people wanting to make a sea change. During peak periods, our population swells to over 80,000. The Shire boasts many beautiful beaches, unique nature reserves and many major events that attract more than 3.4 million visitors each year, such as the Australian Motorcycle Grand Prix at the Phillip Island Circuit.

Bass Coast Shire Council Annual Report 2018/19
Our Performance
63
Indicator/measure Results2016
Results 2017
Results 2018
Results 2019
Material Variations
Population
Expenses per head of municipal population[Total expenses/Municipal population]
$2,223.99 $2,156.74 $2,164.68 $2,460.84 There has been a continuous increase in the municipal population over the four years. A $5.3 million increase in amortisation expense due to the recognition of heightened aftercare costs attributable to the landfill airspace asset and a $2.4 million contribution made toward the Wonthaggi Highball Stadium have increased expenses during 2018/19, therefore increasing this ratio.
Infrastructure per head of municipal population[Value of infrastructure/Municipal population]
$13,736.93 $13,531.68 $13,232.71 $14,825.74 A revaluation on roads during the 2018/19 year has resulted in a $61 million increase in the value of infrastructure.
Population density per length of road[Municipal population/Kilometres of local roads]
34.52 35.82 36.76 37.78 A continuous increase in population has resulted in higher density per length of road.
Own-source revenue
Own-source revenue per head of municipal population[Own-source revenue/Municipal population]
$1,800.77 $1,823.33 $1,866.88 $1,921.91
Recurrent grantsRecurrent grants per head of municipal population[Recurrent grants/Municipal population]
$240.13 $406.76 $298.97 $244.21 Recurrent grants were elevated in 2016/17 due to the early receipt of half of the annual Commonwealth Financial Assistance Grant in that year.
Disadvantage
Relative socio-economic disadvantage[Index of Relative Socio-economic Disadvantage by decile]
4.00 4.00 3.00 3.00
Sustainable Capacity IndicatorsFor the year ended 30 June 2019

Bass Coast Shire Council Annual Report 2018/19
Our Performance
64
Definitions“adjusted underlying revenue” means total income other than:
(a) non-recurrent grants used to fund capital expenditure; and
(b) non-monetary asset contributions; and
(c) contributions to fund capital expenditure from sources other than those referred to above
“infrastructure” means non-current property, plant and equipment excluding land
“local road” means a sealed or unsealed road for which Council is the responsible road authority under the Road Management Act 2004
“population” means the resident population estimated by Council
“own-source revenue” means adjusted underlying revenue other than revenue that is not under the control of Council (including government grants)
“relative socio-economic disadvantage”, in relation to a municipality, means the relative socio-economic disadvantage, expressed as a decile for the relevant financial year, of the area in which the municipality is located according to the Index of Relative Socio-Economic Disadvantage (Catalogue Number 2033.0.55.001) of SEIFA
“SEIFA” means the Socio-Economic Indexes for Areas published from time to time by the Australian Bureau of Statistics on its Internet website
“unrestricted cash” means all cash and cash equivalents other than restricted cash.
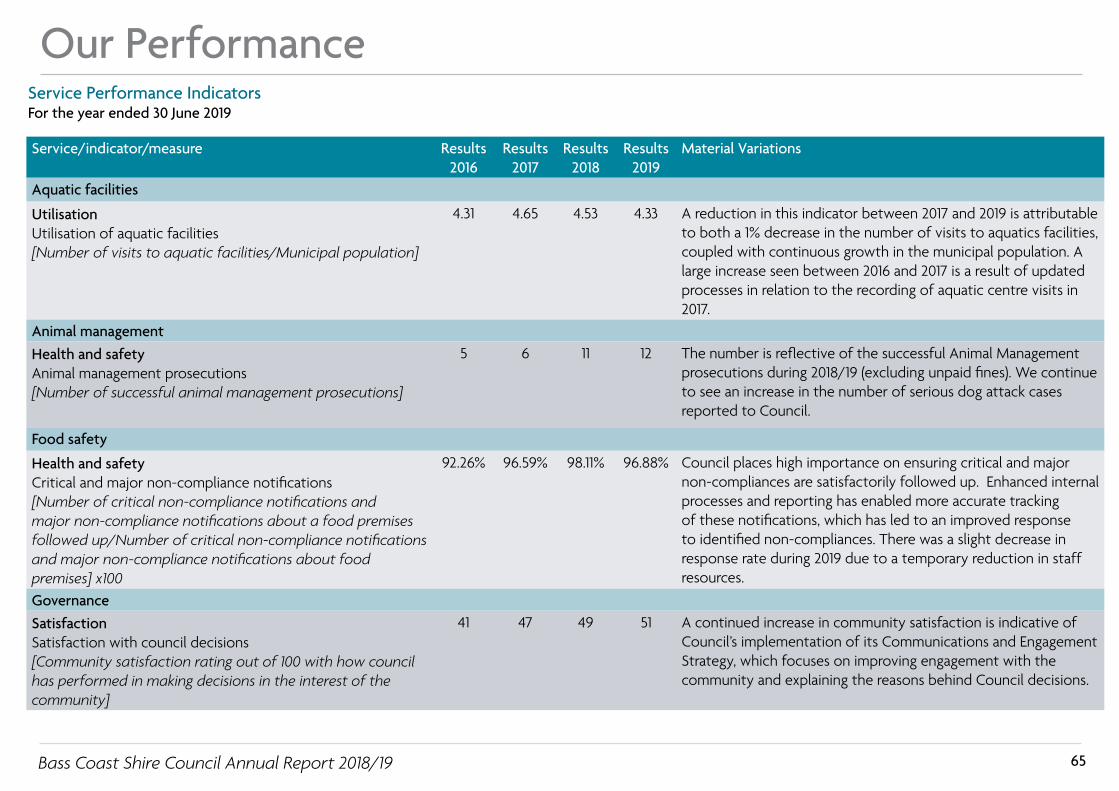
Bass Coast Shire Council Annual Report 2018/19
Our Performance
65
Service/indicator/measure Results2016
Results 2017
Results 2018
Results 2019
Material Variations
Aquatic facilities
UtilisationUtilisation of aquatic facilities[Number of visits to aquatic facilities/Municipal population]
4.31 4.65 4.53 4.33 A reduction in this indicator between 2017 and 2019 is attributable to both a 1% decrease in the number of visits to aquatics facilities, coupled with continuous growth in the municipal population. A large increase seen between 2016 and 2017 is a result of updated processes in relation to the recording of aquatic centre visits in 2017.
Animal managementHealth and safetyAnimal management prosecutions[Number of successful animal management prosecutions]
5 6 11 12 The number is reflective of the successful Animal Management prosecutions during 2018/19 (excluding unpaid fines). We continue to see an increase in the number of serious dog attack cases reported to Council.
Food safety
Health and safetyCritical and major non-compliance notifications[Number of critical non-compliance notifications and major non-compliance notifications about a food premises followed up/Number of critical non-compliance notifications and major non-compliance notifications about food premises] x100
92.26% 96.59% 98.11% 96.88% Council places high importance on ensuring critical and major non-compliances are satisfactorily followed up. Enhanced internal processes and reporting has enabled more accurate tracking of these notifications, which has led to an improved response to identified non-compliances. There was a slight decrease in response rate during 2019 due to a temporary reduction in staff resources.
GovernanceSatisfaction Satisfaction with council decisions[Community satisfaction rating out of 100 with how council has performed in making decisions in the interest of the community]
41 47 49 51 A continued increase in community satisfaction is indicative of Council’s implementation of its Communications and Engagement Strategy, which focuses on improving engagement with the community and explaining the reasons behind Council decisions.
Service Performance IndicatorsFor the year ended 30 June 2019

Bass Coast Shire Council Annual Report 2018/19
Our Performance
66
Service/indicator/measure Results2016
Results 2017
Results 2018
Results 2019
Material Variations
Home and Community Care (HACC)
ParticipationParticipation in HACC service[Number of people that received a HACC service/Municipal target population for HACC services] x100
45.38% N/A N/A N/A Reporting on HACC ceased on 1 July 2016 due to the introduction of the Commonwealth Government’s National Disability Insurance Scheme (NDIS) and Commonwealth Home Support Programme (CHSP) programs
ParticipationParticipation in HACC service by Culturally and Linguistically Diverse (CALD) people[Number of CALD people who receive a HACC service/Municipal target population in relation to CALD people for HACC services] x100
39.95% N/A N/A N/A Reporting on HACC ceased on 1 July 2016 due to the introduction of the Commonwealth Government’s NDIS and CHSP programs
Libraries
Participation Active library members[Number of active library members/Municipal population] x100
32.58% 24.04% 23.70% 23.02% Active library members for the year were 8,134, which is a slight increase on the previous year. However, the population growth for Bass Coast Shire has increased faster than the rate of active library members therefore resulting in an overall decrease in the indicator result compared to the previous year. This indicator does not include the increase in members who use the library service for accessing Wi-Fi and computers or those who do not borrow an item.
Maternal and Child Health (MCH)
ParticipationParticipation in the MCH service[Number of children who attend the MCH service at least once (in the year)/Number of children enrolled in the MCH service] x100
N/A N/A N/A N/A Council does not have operational control of MCH service.
ParticipationParticipation in the MCH service by Aboriginal children[Number of Aboriginal children who attend the MCH service at least once (in the year) / Number of Aboriginal children enrolled in the MCH service] x100
N/A N/A N/A N/A Council does not have operational control of MCH service.

Bass Coast Shire Council Annual Report 2018/19
Our Performance
67
Service/indicator/measure Results2015
Results 2016
Results 2017
Results 2018
Material Variations
Roads
Satisfaction Satisfaction with sealed local roads[Community satisfaction rating out of 100 with how council has performed on the condition of sealed local roads]
41 48 47 53 A six point increase in community satisfaction from the previous year is indicative of Council’s commitment and focus in improving its road network. It is important to note that the survey results are also a reflection of the State controlled roads within the municipality.
Statutory Planning
Council planning decisions upheld at VCAT[Number of VCAT decisions that did not set aside council’s decision in relation to a planning application / Number of VCAT decisions in relation to planning applications] x100
85.71% 40% 75% 80% In 2018/19 four of five Council planning decisions were affirmed by VCAT with one decision set aside.
Waste CollectionWaste diversionKerbside collection waste diverted from landfill[Weight of recyclables and green organics collected from kerbside bins/Weight of garbage, recyclables and green organics collected from kerbside bins] x100
29.89% 32.40% 70.22% 74.77% The significant increase in Bass Coast Shire Council’s diversion rate can be attributed to the introduction of a three bin system incorporating Kerbside Food and Garden Organics collection in September 2017. The organics collection is weekly and the landfill bin is collected fortnightly to promote diversion of waste from landfill.

Bass Coast Shire Council Annual Report 2018/19
Our Performance
68
Definitions“Aboriginal child” means a child who is an Aboriginal person
“Aboriginal person” has the same meaning as in the Aboriginal Heritage Act 2006
“active library member” means a member of a library who has borrowed a book from the library
“annual report” means an annual report prepared by a council under sections 131, 132 and 133 of the Act
“CALD” means culturally and linguistically diverse and refers to persons born outside Australia in a country whose national language is not English
“class 1 food premises” means food premises, within the meaning of the Food Act 1984, that have been declared as class 1 food premises under section 19C of that Act
“class 2 food premises” means food premises, within the meaning of the Food Act 1984, that have been declared as class 2 food premises under section 19C of that Act
“Community Care Common Standards” means the Community Care Common Standards for the delivery of HACC services, published from time to time by the Commonwealth
“critical non-compliance outcome notification” means a notification received by council under section 19N(3) or (4) of the Food Act 1984, or advice given to council by an authorized officer under that Act, of a deficiency that poses an immediate serious threat to public health
“food premises” has the same meaning as in the Food Act 1984
“HACC program” means the Home and Community Care program established under the Agreement entered into for the purpose of the Home and Community Care Act 1985 of the Commonwealth
“HACC service” means home help, personal care or community respite provided under the HACC program
“local road” means a sealed or unsealed road for which the council is the responsible road authority under the Road Management Act 2004
“major non-compliance outcome notification” means a notification received by a council under section 19N(3) or (4) of the Food Act 1984, or advice given to council by an authorized officer under that Act, of a deficiency that does not pose an immediate serious threat to public health but may do so if no remedial action is taken
“MCH” means the Maternal and Child Health Service provided by a council to support the health and development of children within the municipality from birth until school age
“population” means the resident population estimated by council
“target population” has the same meaning as in the Agreement entered into for the purposes of the Home and Community Care Act 1985 of the Commonwealth
“WorkSafe reportable aquatic facility safety incident” means an incident relating to a council aquatic facility that is required to be notified to the Victorian WorkCover Authority under Part 5 of the Occupational Health and Safety Act 2004.

Bass Coast Shire Council Annual Report 2018/19
Our Performance
69
Financial Performance IndicatorsResults Forecasts
Dimension/indicator/measure 2016 2017 2018 2019 2020 2021 2022 2023 Material Variations
Efficiency
Revenue level Average residential rate per residential property assessment[Residential rate revenue/Number of residential property assessments]
$1,601.84 $1,601.31 $1,694.02 $1,771.19 $1,838.63 $1,857.14 $1,875.96 $1,895.12 Following the introduction of 3-bin waste collection in 2017/18, Council increased the garbage charge by 14%. This has resulted in revenue from rates and charges increasing year on year by 6%.
Expenditure levelExpenses per property assessment[Total expenses/Number of property assessments]
$2,394.66 $2,384.73 $2,399.03 $2,756.83 $2,454.71 $2,385.06 $2,405.17 $2,461.17 This indicator has been affected in 2018/19 by a one off $5.3 million increase in amortisation expense due to the recognition of gas management aftercare costs attributable to the landfill airspace asset and a $2.4 million contribution made toward the Wonthaggi Highball Stadium.
Workforce turnoverResignations and terminations compared to average staff[Number of permanent staff resignations and terminations / Average number of permanent staff for the financial year] x100
12.71% 6.49% 11.27% 13.93% 9.75% 9.84% 10.13% 10.13% An increase in workforce turnover for 2018/19 is due to a reduction in the average number of permanent staff during the year coupled with higher resignation and terminations. Council resolution to cease the Aged and Disability service during 2019/20 results in a reduction of this indicator in future years.
Liquidity
Working capital Current assets compared to current liabilities[Current assets/Current liabilities] x100
232.51% 279.37% 251.58% 171.98% 198.87% 216.27% 235.35% 255.40% Higher current liabilities with thereview of the $4.8 million LGFV due in late 2018 causing it to shift from non-current borrowings. This is partly offset by a higher cash balance due to high capital works budgeted costs being been carried over to next year to complete multi year renewal projects and for the payment of pre-ordered plant and fleet.

Bass Coast Shire Council Annual Report 2018/19
Our Performance
70
Results Forecasts
Dimension/indicator/measure 2016 2017 2018 2019 2020 2021 2022 2023 Material Variations
Unrestricted cash
Unrestricted cash compared to current liabilities[Unrestricted cash / Current liabilities] x100
108.84% 176.71% 133.42% 47.64% 123.22% 138.85% 152.03% 179.21% A low result in 2019 is due to higher current liabilities with an additional $8.6m in LGFV loans payable within 12 months. This is partly offset by lower unrestricted cash due to $15.8m in term deposits invested for over 90 days falling into other current assets rather than cash.
Obligations
Asset renewal Asset renewal compared to depreciation[Asset renewal expenses/Asset depreciation] x100
54.43% 55.19% 46.43% 86.39% 81.96% 86.14% 86.37% 81.96% The 2018/19 asset renewal indicator is significantly higher than previous years due to completion of renewal projects carried over from prior years.
Loans and borrowings Loans and borrowings compared to rates[Interest bearing loans and borrowings/Rate revenue] x100
25.05% 26.68% 27.99% 30.49% 25.09% 35.58% 48.87% 59.66% An increase in this indicator is due to an additional $3.3 million of borrowings being drawn down during the year.
Loans and borrowings Loans and borrowings repayments compared to rates[Interest and principal repayments on interest bearing loans and borrowings / Rate revenue] x100
7.37% 3.46% 7.02% 2.71% 11.01% 2.03% 1.93% 2.38% The 2018/19 result reflects a more normal pattern of loan repayments, whilst the forecast year for 2020 includes a repayment of a Local Government Bond.

Bass Coast Shire Council Annual Report 2018/19
Our Performance
71
Results ForecastsDimension/indicator/measure 2016 2017 2018 2019 2020 2021 2022 2023 Material Variations
ObligationsIndebtedness Non-current liabilities compared to own source revenue[Non-current liabilities/Own source revenue] x100
26.94% 27.04% 22.01% 18.88% 29.34% 38.35% 49.97% 59.43% A decrease in this indicator is due to a 5.3 million LGFV loan becoming current, as it is due to be repaid in November 2019, therefore decreasing non-current liabilities.
Operating Position
Adjusted underlying resultAdjusted underlying surplus (or deficit)[Adjusted underlying surplus (deficit)/Adjusted underlying revenue] x100
-8.06% 3.36% 2.04% -12.34% 0.03% 4.62% 6.02% 6.04% A large reduction in the underlying surplus is a result of a one off $5.3 million increase in amortisation expense due to the recognition of gas management aftercare costs attributable to the landfill airspace asset. In addition, a $2.4 million contribution was made toward the Wonthaggi Highball Stadium and redundancy costs for Aged and Disability staff were recognised, therefore increasing expenditure for 2018/19.
Stability
Rates concentration Rates compared to adjusted underlying revenue[Rate revenue/Adjusted underlying revenue] x100
76.19% 70.01% 73.06% 75.66% 77.70% 78.50% 78.89% 79.28% Rates concentration increase on last year was 2.6% this is in line with the rate cap of 2.5% for the 2018/19 financial year.
Rates effortRates compared to property values[Rate revenue/Capital improved value of rateable properties in the municipality] x100
0.44% 0.45% 0.41% 0.38% 0.39% 0.40% 0.42% 0.43%
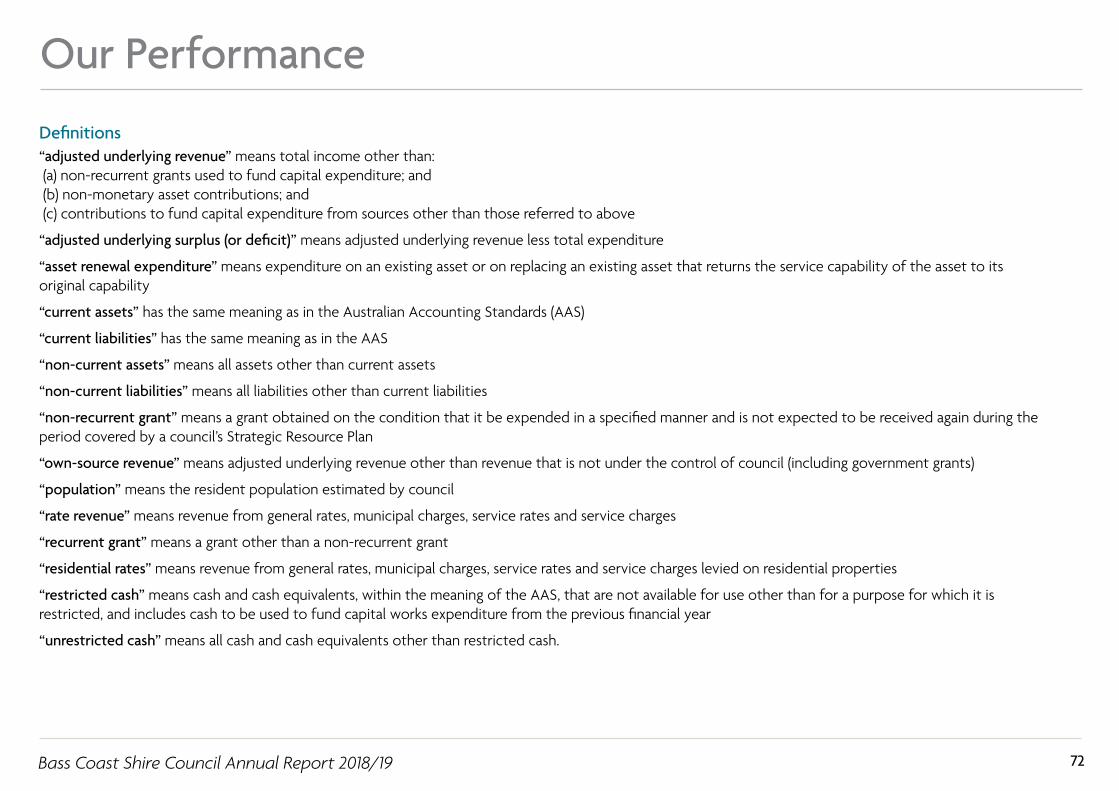
Bass Coast Shire Council Annual Report 2018/19
Our Performance
72
Definitions“adjusted underlying revenue” means total income other than: (a) non-recurrent grants used to fund capital expenditure; and (b) non-monetary asset contributions; and (c) contributions to fund capital expenditure from sources other than those referred to above
“adjusted underlying surplus (or deficit)” means adjusted underlying revenue less total expenditure
“asset renewal expenditure” means expenditure on an existing asset or on replacing an existing asset that returns the service capability of the asset to its original capability
“current assets” has the same meaning as in the Australian Accounting Standards (AAS)
“current liabilities” has the same meaning as in the AAS
“non-current assets” means all assets other than current assets
“non-current liabilities” means all liabilities other than current liabilities
“non-recurrent grant” means a grant obtained on the condition that it be expended in a specified manner and is not expected to be received again during the period covered by a council’s Strategic Resource Plan
“own-source revenue” means adjusted underlying revenue other than revenue that is not under the control of council (including government grants)
“population” means the resident population estimated by council
“rate revenue” means revenue from general rates, municipal charges, service rates and service charges
“recurrent grant” means a grant other than a non-recurrent grant
“residential rates” means revenue from general rates, municipal charges, service rates and service charges levied on residential properties
“restricted cash” means cash and cash equivalents, within the meaning of the AAS, that are not available for use other than for a purpose for which it is restricted, and includes cash to be used to fund capital works expenditure from the previous financial year
“unrestricted cash” means all cash and cash equivalents other than restricted cash.
Bass Coast Shire Council Annual Report 2018/19
Our Performance
73
Basis of preparationCouncil is required to prepare and include a performance statement within its Annual Report. The performance statement includes the results of the prescribed sustainable capacity, service performance and financial performance indicators and measures together with a description of the municipal district and an explanation of material variations in the results. This statement has been prepared to meet the requirements of the Local Government Act 1989 and Local Government (Planning and Reporting) Regulations 2014.
Where applicable the results in the performance statement have been prepared on accounting bases consistent with those reported in the Financial Statements. The other results are based on information drawn from Council information systems or from third parties (eg Australian Bureau of Statistics).
The performance statement presents the actual results for the current year and for the prescribed financial performance indicators and measures, the results forecast by Council’s Strategic Resource Plan. The Local Government (Planning and Reporting) Regulations 2014 requires explanation of any material variations in the results contained in the performance statement. Council has adopted materiality thresholds relevant to each indicator and measure and explanations have not been provided for variations below the materiality thresholds unless the variance is considered to be material because of its nature.
The forecast figures included in the performance statement are those adopted by Council in its Strategic Resource Plan on 28 June 2017 and which forms part of the Council Plan. The Strategic Resource Plan includes estimates based on key assumptions about the future that were relevant at the time of adoption and aimed at achieving sustainability over the long term. Detailed information on the actual financial results is contained in the General Purpose Financial Statements. The Strategic Resource Plan can be obtained by contacting Council.
Other Information

Bass Coast Shire Council Annual Report 2018/19
74
Our Perform
ance
Our Perform
ance

Bass Coast Shire Council Annual Report 2018/19
Our Performance
75
Independent Auditor’s Report To the Councillors of Bass Coast Shire Council
Opinion I have audited the accompanying performance statement of Bass Coast Shire Council (the council) which comprises the:
• description of municipality for the year ended 30 June 2019 • sustainable capacity indicators for the year ended 30 June 2019 • service performance indicators for the year ended 30 June 2019 • financial performance indicators for the year ended 30 June 2019 • other information for the year ended 30 June 2019 (basis of
preparation) • certification of the performance statement.
In my opinion, the performance statement presents fairly, in all material respects, the performance of the council for the year ended 30 June 2019, in accordance with the performance reporting requirements of Part 6 of the Local Government Act 1989.
Basis for Opinion I have conducted my audit in accordance with the Audit Act 1994 which incorporates the Australian Standards on Assurance Engagements. I further describe my responsibilities under that Act and those standards in the Auditor’s Responsibilities for the Audit of the Performance Statement section of my report.
My independence is established by the Constitution Act 1975. My staff and I are independent of the council in accordance with the ethical requirements of the Accounting Professional and Ethical Standards Board’s APES 110 Code of Ethics for Professional Accountants (the Code) that are relevant to my audit of the performance statement in Victoria. My staff and I have also fulfilled our other ethical responsibilities in accordance with the Code.
I believe that the audit evidence I have obtained is sufficient and appropriate to provide a basis for my opinion.
Councillors' responsibilities for the performance statement
The Councillors of the council are responsible for the preparation and fair presentation of the performance statement in accordance with the performance reporting requirements of the Local Government Act 1989, and for such internal control as the Councillors determine is necessary to enable the preparation and fair presentation of the statement of performance that is free from material misstatement, whether due to fraud or error.
Auditor’s responsibilities for the audit of the performance statement
As required by the Audit Act 1994, my responsibility is to express an opinion on the performance statement based on the audit. My objectives for the audit are to obtain reasonable assurance about whether the performance statement as a whole is free from material misstatement, whether due to fraud or error, and to issue an auditor’s report that includes my opinion. Reasonable assurance is a high level of assurance, but is not a guarantee that an audit conducted in accordance with the Australian Standards on Assurance
2
Engagements will always detect a material misstatement when it exists. Misstatements can arise from fraud or error and are considered material if, individually or in the aggregate, they could reasonably be expected to influence the decisions of users taken on the basis of this performance statement.
As part of an audit in accordance with the Australian Standards on Assurance Engagements, I exercise professional judgement and maintain professional scepticism throughout the audit. I also:
• identify and assess the risks of material misstatement of the performance statement, whether due to fraud or error, design and perform audit procedures responsive to those risks, and obtain audit evidence that is sufficient and appropriate to provide a basis for my opinion. The risk of not detecting a material misstatement resulting from fraud is higher than for one resulting from error, as fraud may involve collusion, forgery, intentional omissions, misrepresentations, or the override of internal control.
• obtain an understanding of internal control relevant to the audit in order to design audit procedures that are appropriate in the circumstances, but not for the purpose of expressing an opinion on the effectiveness of the council’s internal control
• evaluate the overall presentation, structure and content of the performance statement, including the disclosures, and whether the performance statement represents the underlying events and results in a manner that achieves fair presentation.
I communicate with the Councillors regarding, among other matters, the planned scope and timing of the audit and significant audit findings, including any significant deficiencies in internal control that I identify during my audit.
MELBOURNE 23 September 2019
Jonathan Kyvelidis as delegate for the Auditor-General of Victoria

Governance, Management
and Other Information

Bass Coast Shire Council Annual Report 2018/19 Governance, Management and Other Information 77
Governance, Management and Other InformationGovernanceBass Coast Shire Council is constituted under the Local Government Act 1989 to provide leadership for the good governance of the municipal district and the local community. Council has a number of roles including:
• taking into account the diverse needs of the local community in decision-making
• providing leadership by establishing strategic objectives and monitoring achievements
• ensuring that resources are managed in a responsible and accountable manner
• advocating the interests of the local community to other communities and governments
• fostering community cohesion and encouraging active participation in civic life
Council is committed to effective and sustainable forms of democratic and corporate governance as the key to ensuring that Council and its administration meet the community’s priorities. The community has many opportunities to provide input into Council’s decision-making processes including community consultation, public forums and the ability to make submissions to Special Committees of Council.Council’s formal decision-making processes are conducted through Council Ordinary Meetings and Special Committees of Council. Council delegates the majority of its decision-making to Council staff. These delegations are exercised in accordance with adopted Council policies.
Meetings of CouncilCouncil conducts open public meetings on the third Wednesday of each month, with some exceptions made and no meeting held in January.Members of the community are welcome to attend these meetings and observe from the gallery. Council meetings also provide the opportunity for community members to submit a question to Council.For the 2018/19 year Council held the following meetings:
• 11 Ordinary Council Meetings
• 3 Special Council Meetings
The following table provides a summary of Councillors’ attendance at Ordinary Council Meetings and Special Council meetings for the 2018/19 financial year.
July 2018 – June 2019
Councillors Council MeetingSpecial Council
Meeting TotalCr Pamela Rothfield (Mayor 1 July 18 - 13 Nov 18)
10 3 13
Cr Brett Tessari (Mayor 14 Nov 18 to 30 June 19,Deputy Mayor 1 July 18 - 13 Nov 18)
9 3 12
Cr Bruce Kent(Deputy Mayor 14 Nov 18 to 30 June 19)
10 3 13
Cr Julian Brown 10 2 12Cr Geoff Ellis 11 3 14Cr Stephen Fullarton 10 3 13Cr Les Larke 11 2 13Cr Clare Le Serve 10 2 12Cr Michael Whelan 11 3 14

Bass Coast Shire Council Annual Report 2018/19 Governance, Management and Other Information 78
Governance, Management and Other InformationCommitteesCouncil has a variety of working groups, advisory and planning committees that Councillors are delegated to.Special Committees have also been established under Section 86 of the Local Government Act 1989.Council adopted the Appointment of Section 86 Special Committees Policy at the Ordinary meeting of 20 March 2019.
The objectives of the Policy are to:• provide Council with a clear framework for appointing Committees.
• ensure that Special Committees are appointed only when necessary and with clear roles and responsibilities.
The following list contains the names of committees that Councillors are delegated to as well as the Special Committees established by Council:
• Access and Inclusion Advisory Committee
• Audit Committee
• Arts and Culture Advisory Committee
• Bass Coast Community Road Safety Committee
• Bass Coast Events Advisory Committee
• Bass Coast Municipal Emergency Management Planning Committee
• Bass Coast Municipal Fire Management Committee
• Bass Coast Natural Environment Advisory Working Group
• Bass Coast Place Names Committee
• Cape Barren Geese Working Group – new Committee established 19 June 2019
• Cape Paterson Hall Committee of Management
• Cape Paterson Sports Facility Committee of Management
• Car Ferry Project Steering Committee
• Community Tourism Reference Group
• Corinella Community Hall Committee of Management
• Coronet Bay Reserve Committee of Management
• Dalyston Hall Committee of Management
• Dalyston Recreation Reserve Committee of Management
• Glen Alvie Recreation Reserve Committee of Management
• Glen Forbes Community Recreation Reserve Committee of Management
• Kernot Hall and Reserve Committee of Management
• Krowera Hall Committee of Management
• Newhaven Hall Committee of Management
• Phillip Island Aquatics Working Group
• Phillip Island Integrated Transport Study Reference Group
• Pioneer Bay Reserve Committee of Management
• Pound Creek Recreation Reserve Committee of Management
• Rhyll Hall and Reserve Committee of Management
• Rural Engagement Group
• Surf Beach Community Park Committee of Management
• The Chief Executive Officer Employment Matters Committee

Bass Coast Shire Council Annual Report 2018/19 Governance, Management and Other Information 79
Governance, Management and Other InformationCouncillor Code of Conduct The Local Government Act 1989 requires Councils to develop and approve a Councillor Code of Conduct within 12 months after each general election. On 15 February 2017, Council adopted a revised Councillor Code of Conduct which is designed to:• assist Councillors to maintain the highest standards of conduct and behaviour as
well as provide a means to deal with problems they may encounter• attract the highest level of confidence from Council’s stakeholders• assist the Mayor and Councillors to discharge the responsibilities of their public
office appropriatelyIn addition to setting out the Councillor Conduct Principles, the Code also outlines:• other conduct definitions under the Act, such as those relating to misuse of
position, improper direction, breach of confidentiality and conflict of interest• roles and relationships• dispute resolution procedures
Conflict of Interest Councillors are elected by the residents and ratepayers to act in the best interests of the community. This is a position of trust that requires Councillors to act in the public interest. When a Council delegates its powers to a Council officer or a committee, the committee or officer also needs to act in the public interest.A conflict of interest occurs when a personal or private interest might compromise the ability to act in the public interest. A conflict of interest exists even if no improper act results from it. Council has a comprehensive procedure in place to accommodate the disclosure of a conflict of interest.Declaration of a conflict of interest is a standard agenda item for all Council and Committee meetings. While the procedures vary depending on the particular role and circumstances, in general they involve disclosing the relevant interests in a specific way and then stepping aside from the relevant decision-making process or from the exercise of the public duty. A register is maintained to record all disclosed conflicts of interests.
Councillor Allowances In accordance with Section 74 of the Local Government Act 1989, Councillors are entitled to receive an allowance while performing their duty as a Councillor. The Mayor is also entitled to receive a higher allowance. The State Government sets the upper and lower limits for all allowances paid to Councillors and Mayors. Councils are divided into three categories based on the income and population of each Council. In this instance Bass Coast Shire Council is recognised as a category two Council.For the period 1 July 2018 to 31 November 2018, the Councillor annual allowance for a category two Council (as defined by the Local Government Act 1989) was fixed at $25,225 and the allowance for the Mayor at $78,051. The annual allowances were adjusted for the period 1 December 2018 to 30 June 2019 at $25,730 per annum for the Councillor allowance and $79,612 per annum for the Mayoral allowance. The following table contains a summary of the allowances paid to each Councillor during the 2018/19 year:
Councillors Allowance
Cr Pamela Rothfield (Mayor 1 July 2018 to 13 Nov 2018) $47,857
Cr Brett Tessari (Mayor 14 Nov 2018 – 30 June 2019) $56,523Cr Julian Brown $25,424Cr Geoff Ellis $25,424Cr Stephen Fullarton $25,424Cr Bruce Kent $25,424Cr Les Larke $25,424Cr Clare Le Serve $25,424Cr Michael Whelan $25,424
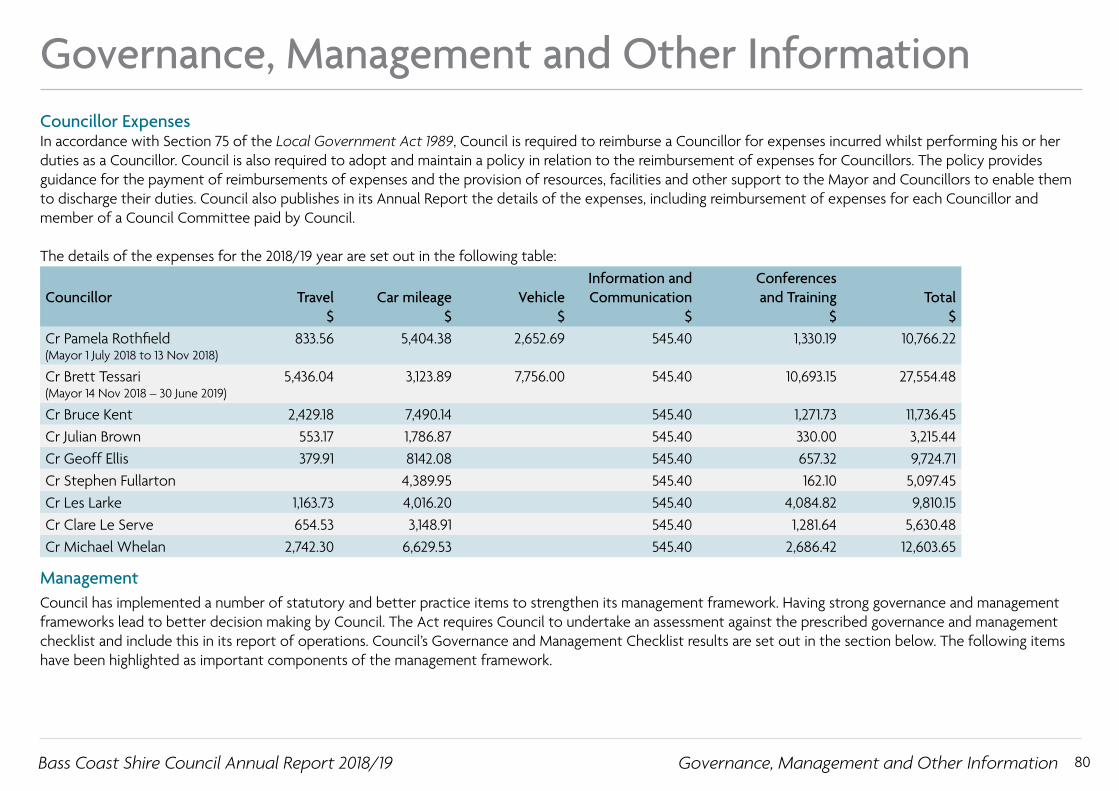
Bass Coast Shire Council Annual Report 2018/19 Governance, Management and Other Information 80
Governance, Management and Other InformationCouncillor ExpensesIn accordance with Section 75 of the Local Government Act 1989, Council is required to reimburse a Councillor for expenses incurred whilst performing his or her duties as a Councillor. Council is also required to adopt and maintain a policy in relation to the reimbursement of expenses for Councillors. The policy provides guidance for the payment of reimbursements of expenses and the provision of resources, facilities and other support to the Mayor and Councillors to enable them to discharge their duties. Council also publishes in its Annual Report the details of the expenses, including reimbursement of expenses for each Councillor and member of a Council Committee paid by Council.
The details of the expenses for the 2018/19 year are set out in the following table:
Councillor Travel $
Car mileage
$Vehicle
$
Information and Communication
$
Conferences and Training
$
Total
$Cr Pamela Rothfield (Mayor 1 July 2018 to 13 Nov 2018)
833.56 5,404.38 2,652.69 545.40 1,330.19 10,766.22
Cr Brett Tessari (Mayor 14 Nov 2018 – 30 June 2019)
5,436.04 3,123.89 7,756.00 545.40 10,693.15 27,554.48
Cr Bruce Kent 2,429.18 7,490.14 545.40 1,271.73 11,736.45Cr Julian Brown 553.17 1,786.87 545.40 330.00 3,215.44Cr Geoff Ellis 379.91 8142.08 545.40 657.32 9,724.71Cr Stephen Fullarton 4,389.95 545.40 162.10 5,097.45Cr Les Larke 1,163.73 4,016.20 545.40 4,084.82 9,810.15Cr Clare Le Serve 654.53 3,148.91 545.40 1,281.64 5,630.48Cr Michael Whelan 2,742.30 6,629.53 545.40 2,686.42 12,603.65
Management Council has implemented a number of statutory and better practice items to strengthen its management framework. Having strong governance and management frameworks lead to better decision making by Council. The Act requires Council to undertake an assessment against the prescribed governance and management checklist and include this in its report of operations. Council’s Governance and Management Checklist results are set out in the section below. The following items have been highlighted as important components of the management framework.
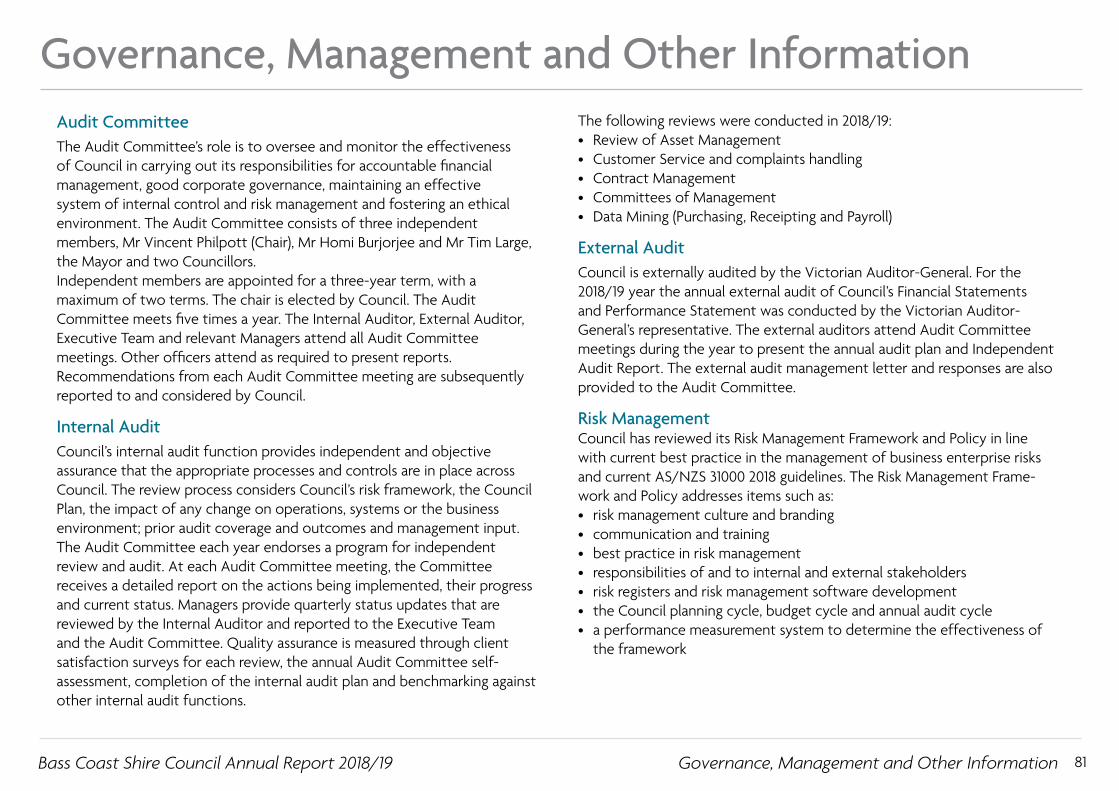
Bass Coast Shire Council Annual Report 2018/19 Governance, Management and Other Information 81
Governance, Management and Other InformationAudit CommitteeThe Audit Committee’s role is to oversee and monitor the effectiveness of Council in carrying out its responsibilities for accountable financial management, good corporate governance, maintaining an effective system of internal control and risk management and fostering an ethical environment. The Audit Committee consists of three independent members, Mr Vincent Philpott (Chair), Mr Homi Burjorjee and Mr Tim Large, the Mayor and two Councillors.Independent members are appointed for a three-year term, with a maximum of two terms. The chair is elected by Council. The Audit Committee meets five times a year. The Internal Auditor, External Auditor, Executive Team and relevant Managers attend all Audit Committee meetings. Other officers attend as required to present reports.Recommendations from each Audit Committee meeting are subsequently reported to and considered by Council.
Internal Audit Council’s internal audit function provides independent and objective assurance that the appropriate processes and controls are in place across Council. The review process considers Council’s risk framework, the Council Plan, the impact of any change on operations, systems or the business environment; prior audit coverage and outcomes and management input.The Audit Committee each year endorses a program for independent review and audit. At each Audit Committee meeting, the Committee receives a detailed report on the actions being implemented, their progress and current status. Managers provide quarterly status updates that are reviewed by the Internal Auditor and reported to the Executive Team and the Audit Committee. Quality assurance is measured through client satisfaction surveys for each review, the annual Audit Committee self-assessment, completion of the internal audit plan and benchmarking against other internal audit functions.
The following reviews were conducted in 2018/19:• Review of Asset Management • Customer Service and complaints handling• Contract Management • Committees of Management• Data Mining (Purchasing, Receipting and Payroll)
External Audit Council is externally audited by the Victorian Auditor-General. For the 2018/19 year the annual external audit of Council’s Financial Statements and Performance Statement was conducted by the Victorian Auditor-General’s representative. The external auditors attend Audit Committee meetings during the year to present the annual audit plan and Independent Audit Report. The external audit management letter and responses are also provided to the Audit Committee.
Risk Management Council has reviewed its Risk Management Framework and Policy in line with current best practice in the management of business enterprise risks and current AS/NZS 31000 2018 guidelines. The Risk Management Frame-work and Policy addresses items such as:• risk management culture and branding• communication and training• best practice in risk management• responsibilities of and to internal and external stakeholders• risk registers and risk management software development• the Council planning cycle, budget cycle and annual audit cycle• a performance measurement system to determine the effectiveness of
the framework

Bass Coast Shire Council Annual Report 2018/19 Governance, Management and Other Information 82
Governance, Management and Other InformationGovernance and Management ChecklistThe following are the results in the prescribed form of Council’s assessment against the prescribed governance and management checklist.
Governance and Management Items Assessment1 Community Engagement Policy (policy outlining Council’s commitment to engaging with the
community on matters of public interest)Communication and Engagement Policy adopted 16 September 2015
2 Community Engagement Guidelines (guidelines to assist staff to determine when and how to engage with the community)
Communication and Engagement Strategy adopted September 2015; revised version adopted March 2018
3 Strategic Resource Plan (plan under section 126 of the Act outlining the financial and non-financial resources required for at least the next four financial years)
Adopted in accordance with section 126 of the Act. Date of adoption: 19 June 2019
4 Annual Budget (plan under section 130 of the Act setting out the services to be provided and initiatives to be undertaken over the next 12 months and the funding and other resources required)
Adopted in accordance with section 130 of the Act. Date of adoption: 19 June 2019
5 Asset Management Plans (plans that set out the asset maintenance and renewal needs for key infrastructure asset classes for at least the next 10 years)
Date of operation of current plans: Roads 20 March 2019; Drainage 24 June 2015: Building 18 May 2016
6 Rating Strategy (strategy setting out the rating structure of Council to levy rates and charges) Incorporated in 2018/19 Budget. Adopted 19 June 2019
7 Risk Policy (policy outlining Council’s commitment and approach to minimising the risks to Council’s operations)
Date of operation of current policy: 15 April 2015, revised version presented to Audit Committee 22 May 2019
8 Fraud Policy (policy outlining Council’s commitment and approach to minimising the risk of fraud) Date of operation of current policy: 16 July 2014
9 Municipal Emergency Management Plan (plan under section 20 of the Emergency Management Act 1986 for emergency prevention, response and recovery)
Prepared and maintained in accordance with section 20 of the Emergency Management Act 1986: 18 April 2018
10 Procurement Policy (policy under section 186A of the Local Government Act 1989 outlining the matters, practices and procedures that will apply to all purchases of goods, services and works)
Prepared and approved in accordance with section 186A of the Local Government Act 1989: 19 June 2019

Bass Coast Shire Council Annual Report 2018/19 Governance, Management and Other Information 83
Governance, Management and Other Information
Governance and Management Items Assessment11 Business Continuity Plan (plan setting out the actions that will be undertaken to ensure that
key services continue to operate in the event of a disaster)Date of operation of current plan: 25 November 2014, reviewed 8 November 2018
12 Disaster Recovery Plan (plan setting out the actions that will be undertaken to recover and restore business capability in the event of a disaster)
Date of operation of current plan: 31 October 2014, reviewed 8 November 2018
13 Risk Management Framework (framework outlining Council’s approach to managing risks to the Council’s operations)
Date of operation of current framework: 15 April 2015, revised version presented to Audit Committee 22 May 2019
14 Audit Committee (advisory committee of Council under Section 139 of the Act whose role is to oversee the integrity of a Council’s financial reporting, processes to manage risks to the Council’s operations and for compliance with applicable legal, ethical, and regulatory requirements)
Established in accordance with section 139 of the Act Date of establishment: 1 January 1997
15 Internal audit (independent accounting professionals engaged by the Council to provide analyses and recommendations aimed at improving Council’s governance, risk and management controls)
Date of engagement of current provider: 19 July 2017
16 Performance Reporting Framework (a set of indicators measuring financial and non-financial performance, including the performance indicators referred to in section 131 of the Act)
Date of operation of current framework: 1 July 2014
17 Council Plan reporting (report reviewing the performance of the Council against the Council Plan, including the results in relation to the strategic indicators, for the first six months of the financial year)
Date of reports: Major Initiatives, Finance and Capital Works Progress Report 19 December 2018, 20 February 2019, 15 May 2019
18 Financial reporting (quarterly statements to Council under section 138 of the Act comparing budgeted revenue and expenditure with actual revenue and expenditure)
Statements presented to Council in accordance with section 138(1) of the ActQuarterly reports to Council presented:Annual Report 17 October 2018, Major Initiatives, Finance and Capital Works Progress Reports 19 December 2018, 20 February 2019, 15 May 2019
19 Risk reporting (six-monthly reports of strategic risks to Council’s operations, their likelihood and consequences of occurring and risk minimisation strategies)
Quarterly reports to Audit Committee: 22 August 2018, 28 November 2018, 25 March 2019, 22 May 2019
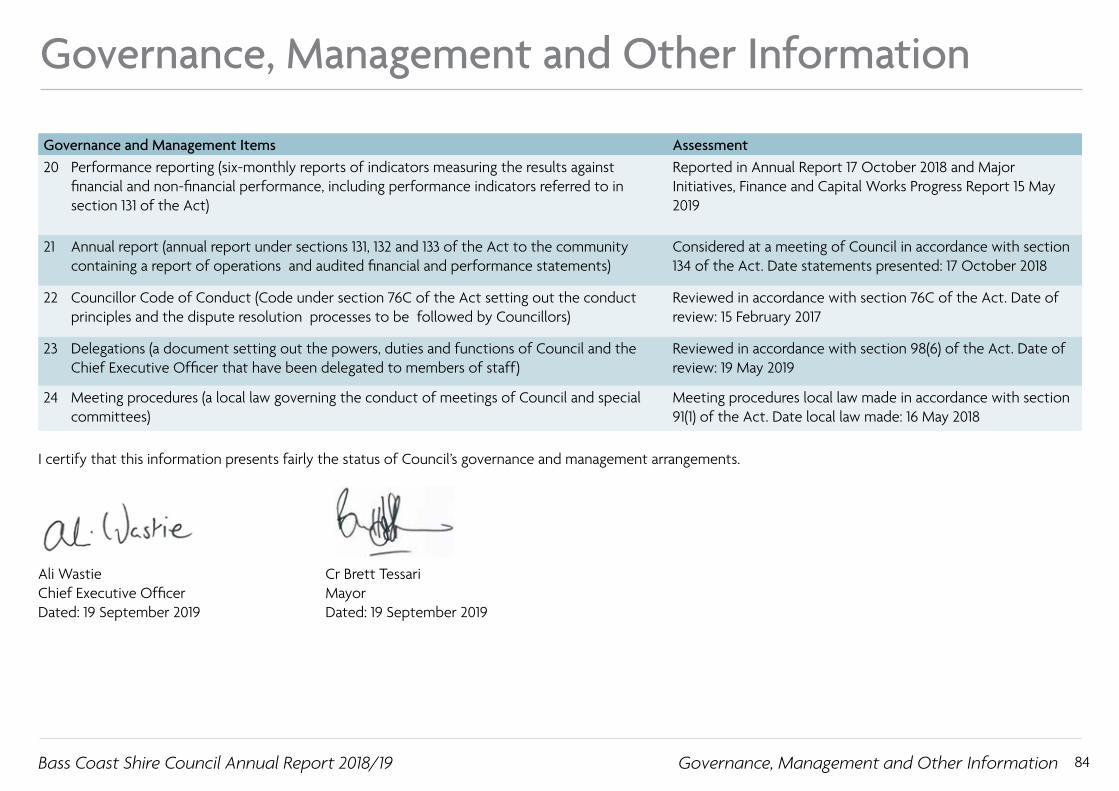
Bass Coast Shire Council Annual Report 2018/19 Governance, Management and Other Information 84
Governance, Management and Other Information
Governance and Management Items Assessment20 Performance reporting (six-monthly reports of indicators measuring the results against
financial and non-financial performance, including performance indicators referred to in section 131 of the Act)
Reported in Annual Report 17 October 2018 and Major Initiatives, Finance and Capital Works Progress Report 15 May 2019
21 Annual report (annual report under sections 131, 132 and 133 of the Act to the community containing a report of operations and audited financial and performance statements)
Considered at a meeting of Council in accordance with section 134 of the Act. Date statements presented: 17 October 2018
22 Councillor Code of Conduct (Code under section 76C of the Act setting out the conduct principles and the dispute resolution processes to be followed by Councillors)
Reviewed in accordance with section 76C of the Act. Date of review: 15 February 2017
23 Delegations (a document setting out the powers, duties and functions of Council and the Chief Executive Officer that have been delegated to members of staff)
Reviewed in accordance with section 98(6) of the Act. Date of review: 19 May 2019
24 Meeting procedures (a local law governing the conduct of meetings of Council and special committees)
Meeting procedures local law made in accordance with section 91(1) of the Act. Date local law made: 16 May 2018
I certify that this information presents fairly the status of Council’s governance and management arrangements.
Ali Wastie Cr Brett TessariChief Executive Officer MayorDated: 19 September 2019 Dated: 19 September 2019

Statutory Information

Bass Coast Shire Council Annual Report 2018/19 86
Statutory Information
Statutory Information
The following information is provided in accordance with legislative and other requirements applying to Council.
Documents Available for Public Inspection In accordance with Part 12 of the Local Government (General) Regulations 2015, the following is a list of the prescribed documents that are available.Inspection or copies of documents can be obtained for the purposes of section 222 of the Local Government Act 1989 (the Act) at 76 McBride Ave, Wonthaggi:
a) a document containing details of overseas or interstate travel (other than interstate travel by land for less than three days) undertaken in an official capacity by any Councillor or member of Council staff in the previous 12 months, including:
i. the name of the Councillor or member of Council staff
ii. the dates on which the travel began and ended
iii. the destination of the travel
iv. the purpose of the travel
v. the total cost to the Council of the travel, including accommodation cost
b) the agendas for, and minutes of, Ordinary and Special Meetings held in the previous 12 months which are kept under section 93 of the Act, other than those agendas and minutes relating to a part of a meeting which was closed to members of the public under section 89 of the Act and are confidential information within the meaning of section 77(2) of the Act;
c) the minutes of meetings of Special Committees established under section 86 of the Act and held in the previous 12 months, other than those minutes relating to a part of a meeting which was closed to members of the public under section 89 of the Act and are confidential information within the meaning of section 77(2) of the Act;
d) a register of delegations kept under sections 87(1) and 98(4) of the Act, including the date on which the last review took place under sections 86(6) and 98(6), respectively, of the Act;
e) a document containing details of all leases involving land which were entered into by the Council as lessor, including the lessee and the terms and the value of the lease;
f) a register maintained under section 224(1A) of the Act of authorised officers appointed under that section;
g) a list of donations and grants made by the Council in the previous 12 months, including the names of persons who, or bodies which, have received a donation or grant and the amount of each donation or grant.

Bass Coast Shire Council Annual Report 2018/19 87
Statutory Information
Statutory Information
Best Value In accordance with section 208B(f) of the Local Government Act 1989, at least once every year a Council must report to its community on what it has done to ensure that it has given effect to the Best Value Principles.Council incorporates Best Value Principles through regular business planning and performance monitoring processes and through a commitment to continuous improvement and innovation which is supported by our Sustainable Excellence Program. To further reflect Council’s commitment to Best Value, Council has a Service Review Program. This program reviews six service areas per year to find opportunities and efficiencies, and to make sure that the model we use to deliver services provides maximum benefit to our community. The purpose of the service reviews: • are designed to find operational efficiencies and innovations to deliver
services to the community in accordance with the Council Plan and Long Term Financial Plan
• represent our commitment to continuous improvement in what we do• are not about performance. In general, service reviews are designed to
determine the level of service we will provide and the most appropriate strategic model to provide that service
The service reviews that are currently being undertaken include: Gippsland Shared Services Initiative
A funding application to the Rural Transformation Fund has been submitted by Wellington Shire Council, South Gippsland Shire Council, East Gippsland Shire Council and Bass Coast Shire Council. The application is to procure an Enterprise Resource System to standardise our software systems across the four councils and to implement a Records Management Module.
Environmental Health Services
Consultant appointed, commencing research.
The following Service Reviews are being implemented:• Revenue Strategy• Strategic Planning, Statutory Planning, Building Approvals and Planning
Administration • Mobile Library Services• Aged Care Reform
The following Service Reviews are completed, including implementation:• Event Management and Tourism• Strategic Planning• Customer Service• Facilities Management• Roads, Building and Plant Maintenance• Parks and Gardens• Social and Community Planning• Arts and Culture• Statutory Planning, Building Approvals and Planning Administration• Emergency Management and Fire Prevention• Governance and Councillor Support• Visitor Services• Local Laws• Valuations• Building Approvals • Caravan Parks• Waste Management• Revenue Services• Funding to other Organisations• Infrastructure Delivery• Recreation Services• Cemetery Management• Fleet Management• Phillip Island Nature Park and Council’s asset management and
response on Crown Land

Bass Coast Shire Council Annual Report 2018/19 88
Statutory Information
Statutory Information
Carers Recognition In accordance with the Carers Recognition Act 2012 (CRA), Council is required to report annually on its care measurement obligations under Section 11 of that Act. Council has taken all practicable measures to comply with its responsibilities outlined in the Carers Recognition Act 2012.During 2018/2019 Council undertook significant effort to promote the CRA to Council staff and the community. Council has promoted the principles of the CRA to people in care relationships who receive Council services, to people in care relationships, and to the wider community by:
• a report in the Bass Coast Shire Council Annual Report • a report in the Carers Support annual report to
Department of Health and Human Services• CRA material in the client information book• CRA material in the Aged and Disability client newsletter• promotion of the CRA poster through council
community services and facilities• promotion on Council website for the CRA with links to
the official CRA website Council has taken all practicable measures to ensure staff, Council agents and volunteers working for Council are informed about the principles and obligations of the Act by including information on the care relationship in:
• Shire Crier (Council’s staff newsletter)• CRA information placed in the Community Care
Workers staff manual• distribute CRA via email to Aged and Disability office
based staff• Council induction for staff working in Aged and
Disability Services supporting carers
Council has taken all practicable measures to review and modify policies, procedures and supports to include recognition of the carer relationship. Council meets regularly with carers to develop a plan of what support is offered throughout the year as part of the Carers Support Program.During 2018/2019 Council ran the following support for carers:
• Movie and lunch to celebrate Carers Week• Respite services• Regular Carer Support Group Coffee Catch ups• Carer retreats• Workshops for carers • Series of social events for carers
Contracts During the year Council did not enter into any contracts valued at $150,000 or more for any goods and services, or works (ie construction/building) that will exceed $200,000 or more, without first engaging in a competitive process. These figures are GST inclusive and are for the value of the life of the goods, services and works.

Bass Coast Shire Council Annual Report 2018/19 89
Statutory Information
Statutory Information
Disability Action Plan In accordance with section 38 of the Disability Act 2006, as Council has prepared a Disability Action Plan it must report on its implementation in its Annual Report. Disability Action Plan key outcomes and achievements in 2018/19 are highlighted below:
Community capacity building has formed a key element in service delivery during 2018/19, including:
• The delivery of Enabling Women in Leadership training facilitated in Bass Coast by women living with a disability, for women living with a disability
• Community advocacy for improved access in Wonthaggi Town Centre
• Enhancing the role of the Access and Inclusion Advisory Committee to provide strategic advice for Council – focusing on infrastructure delivery
• Community event delivery to celebrate Social Inclusion Week and International Day of People with a Disability – ‘Celebration of Inclusion and Creativity’ held at Wonthaggi Union Community Arts Centre
• Communication Access symbol accreditation for all Customer Service and Visitor Information Centres
• Universal access for the development and renewal of infrastructure such as enhanced accessibility for the Bass Coast Children’s Centre
• Advocacy to secure extended funding for Rural Access service delivery (via Building Inclusive Communities funding)
• Delivery of a Changing Places facility as part of the Cowes Transit Precinct project
• Delivery of Council’s website to include Level ‘AA’ of the Web Content Accessibility Guidelines 2.0
• Delivery of Disability Awareness Training to Council staff and Access and Inclusion Advisory Committee members
Domestic Animal Management Plan Council’s Domestic Animal Management Plan 2017-21 was adopted by Council on 20 September 2017 and submitted to the Secretary of the Department of Economic Development, Jobs, Transport and Resources. The Plan sets the action plan for the four year period. The Plan looks at how we live with cats and dogs and gives Council a direction for management of these domestic animals until 2021. One of the main objectives of the Plan is to assist the community with responsible pet ownership. It also helps Council deliver a professional, consistent and proactive approach to domestic animal management practices. The themes the Plan is required to address are: training of authorised officers, registration and identification of cats and dogs, nuisance cats and dogs, dog attacks, dangerous, menacing and restricted breed dogs, overpopulation and high euthanasia and domestic animal businesses. A range of objectives have been developed to address these themes along with an annual action plan.
Bass Coast Shire Council Annual Report 2018/19 90
Statutory Information
Statutory Information
Food Act Ministerial Directions In accordance with section 7E of the Food Act 1984, Council is required to publish a summary of any ministerial directions received during the financial year in its Annual Report. No such ministerial directions were received by Council during the 2018/19 financial year.
Freedom of Information (FOI) In accordance with section 7(4AA)(a) and 7(4AA)(b) of the Freedom of Information Act 1982, Council is required to publish certain statements in their annual report or separately such as on its website, concerning its functions and information available. Council has chosen to publish the statements separately however provides the following summary of the application and operation of the Freedom of Information Act 1982.Access to documents may be obtained through written request to the Freedom of Information Officer, as detailed in section 17 of the Freedom of Information Act 1982 and in summary as follows:• it should be in writing• it should identify as clearly as possible which document is being
requested• it should be accompanied by the appropriate application fee (the fee
may be waived in certain circumstances)Requests for documents in the possession of Council should be addressed to the Freedom of Information Officer. Requests can be lodged by post or email.Access charges may also apply once documents have been processed and a decision on access is made (eg photocopying and search and retrieval charges). The timeframes for processing an FOI Application can vary depending on the relevant access charges and third party appeal rights.Further information regarding FOI can be found at www.foi.vic.gov.au and on Council’s website www.basscoast.vic.gov.au/foi
Protected Disclosure Procedures In accordance with section 69 of the Protected Disclosure Act 2012 a Council must include in their annual report information about how to access the procedures established by Council under Part 9 of that Act. It is also required to provide certain information about the number and types of protected disclosures complaints investigated during the financial year.The Protected Disclosure Act 2012 aims to ensure openness and accountability in government by encouraging people to disclose improper conduct within the public sector and provide protection for people who make disclosures. Procedures on how to make a disclosure are publicly available on Council’s website at: www.basscoast.vic.gov.au/protecteddisclosuresDuring the 2018/19 year no disclosures were notified to Council officers appointed to receive disclosures, or to the Independent Broad-based Anti-corruption Commission (IBAC).
Road Management Act Ministerial DirectionIn accordance with section 22 of the Road Management Act 2004, Council must publish a copy or summary of any Ministerial direction in its Annual Report. No such Ministerial Directions were received by Council during the financial year.

Our Finances

Bass Coast Shire Council Annual Report 2018/19 92Our Finances
Financial Report ContentsCertification of the Financial Statements 93
Victorian Auditor-General's Office Report 94
Financial StatementsComprehensive Income StatementBalance Sheet
104105
Statement of Changes in Equity 106
Statement of Cash Flows 107
Statement of Capital Works 108
Overview 109Notes to Financial Statements 110Note 1 Performance against budget 110
1.1. Income and expenditure 110
1.2. Capital works 112
Note 2.1 Analysis of Council results by program 114Note 3 Funding for the delivery of our services 116
3.1. Rates and charges 1163.2. Statutory fees and fines 1163.3. User fees 1163.4. Funding from other levels of government 1163.5. Contributions 1173.6. Net gain/(loss) on disposal of property, infrastructure, plant and equipment
118
3.7. Other income 118Note 4 The cost of delivering services 118
4.1. Employee costs 118
4.2. Materials and services 1194.3. Depreciation and amortisation 119
4.4. Bad and doubtful debts 119
4.5. Borrowing costs 1194.6. Other expenses 120
Note 5 Our financial position 1205.1. Financial assets 1205.2. Non-financial assets 1225.3. Payables 1225.4. Interest bearing liabilities 1235.5. Provisions 1235.6 Financing arrangements 1255.7 Commitments 125
Note 6 Assets we manage 1266.1. Property infrastructure plant and equipment 1266.2. Non-current assets held for sale 1336.3 Investments in associates 134
Note 7 People and relationships 1357.1. Council and key management remuneration 1357.2. Related party disclosure 136
Note 8 Managing uncertainties 1378.1. Contingent assets and liabilities 1378.2. Change in accounting standards 1388.3. Financial instruments 1388.4. Fair value measurement 1408.5. Events occurring after balance date 140
Note 9 Other matters 1419.1 Reserves 1419.2 Reconciliation of cash flows from operating activities to surplus/(deficit)
144
9.3 Superannuation 144

Bass Coast Shire Council Annual Report 2018/19
93
Our Finances
Our Finances
Bass Coast Shire Council Annual Report 2018/19 94
Our Finances
Our Finances
Independent Auditor’s Report To the Councillors of Bass Coast Shire Council
Opinion I have audited the financial report of Bass Coast Shire Council (the council) which comprises the:
• balance sheet as at 30 June 2019 • comprehensive income statement for the year then ended • statement of changes in equity for the year then ended • statement of cash flows for the year then ended • statement of capital works for the year then ended • notes to the financial statements, including significant accounting policies • certification of the financial statements.
In my opinion the financial report presents fairly, in all material respects, the financial position of the council as at 30 June 2019 and its financial performance and cash flows for the year then ended in accordance with the financial reporting requirements of Part 6 of the Local Government Act 1989 and applicable Australian Accounting Standards.
Basis for Opinion
I have conducted my audit in accordance with the Audit Act 1994 which incorporates the Australian Auditing Standards. I further describe my responsibilities under that Act and those standards in the Auditor’s Responsibilities for the Audit of the Financial Report section of my report.
My independence is established by the Constitution Act 1975. My staff and I are independent of the council in accordance with the ethical requirements of the Accounting Professional and Ethical Standards Board’s APES 110 Code of Ethics for Professional Accountants (the Code) that are relevant to my audit of the financial report in Victoria. My staff and I have also fulfilled our other ethical responsibilities in accordance with the Code.
I believe that the audit evidence I have obtained is sufficient and appropriate to provide a basis for my opinion.
Councillors’ responsibilities for the financial report
The Councillors of the council are responsible for the preparation and fair presentation of the financial report in accordance with Australian Accounting Standards and the Local Government Act 1989, and for such internal control as the Councillors determine is necessary to enable the preparation and fair presentation of a financial report that is free from material misstatement, whether due to fraud or error.
In preparing the financial report, the Councillors are responsible for assessing the council’s ability to continue as a going concern, disclosing, as applicable, matters related to going concern and using the going concern basis of accounting unless it is inappropriate to do so.
2
Auditor’s responsibilities for the audit of the financial report
As required by the Audit Act 1994, my responsibility is to express an opinion on the financial report based on the audit. My objectives for the audit are to obtain reasonable assurance about whether the financial report as a whole is free from material misstatement, whether due to fraud or error, and to issue an auditor’s report that includes my opinion. Reasonable assurance is a high level of assurance, but is not a guarantee that an audit conducted in accordance with the Australian Auditing Standards will always detect a material misstatement when it exists. Misstatements can arise from fraud or error and are considered material if, individually or in the aggregate, they could reasonably be expected to influence the economic decisions of users taken on the basis of this financial report.
As part of an audit in accordance with the Australian Auditing Standards, I exercise professional judgement and maintain professional scepticism throughout the audit. I also:
• identify and assess the risks of material misstatement of the financial report, whether due to fraud or error, design and perform audit procedures responsive to those risks, and obtain audit evidence that is sufficient and appropriate to provide a basis for my opinion. The risk of not detecting a material misstatement resulting from fraud is higher than for one resulting from error, as fraud may involve collusion, forgery, intentional omissions, misrepresentations, or the override of internal control.
• obtain an understanding of internal control relevant to the audit in order to design audit procedures that are appropriate in the circumstances, but not for the purpose of expressing an opinion on the effectiveness of the council’s internal control
• evaluate the appropriateness of accounting policies used and the reasonableness of accounting estimates and related disclosures made by the Councillors
• conclude on the appropriateness of the Councillors’ use of the going concern basis of accounting and, based on the audit evidence obtained, whether a material uncertainty exists related to events or conditions that may cast significant doubt on the council’s ability to continue as a going concern. If I conclude that a material uncertainty exists, I am required to draw attention in my auditor’s report to the related disclosures in the financial report or, if such disclosures are inadequate, to modify my opinion. My conclusions are based on the audit evidence obtained up to the date of my auditor’s report. However, future events or conditions may cause the council to cease to continue as a going concern.
• evaluate the overall presentation, structure and content of the financial report, including the disclosures, and whether the financial report represents the underlying transactions and events in a manner that achieves fair presentation.
I communicate with the Councillors regarding, among other matters, the planned scope and timing of the audit and significant audit findings, including any significant deficiencies in internal control that I identify during my audit.
MELBOURNE 23 September 2019
Jonathan Kyvelidis as delegate for the Auditor-General of Victoria
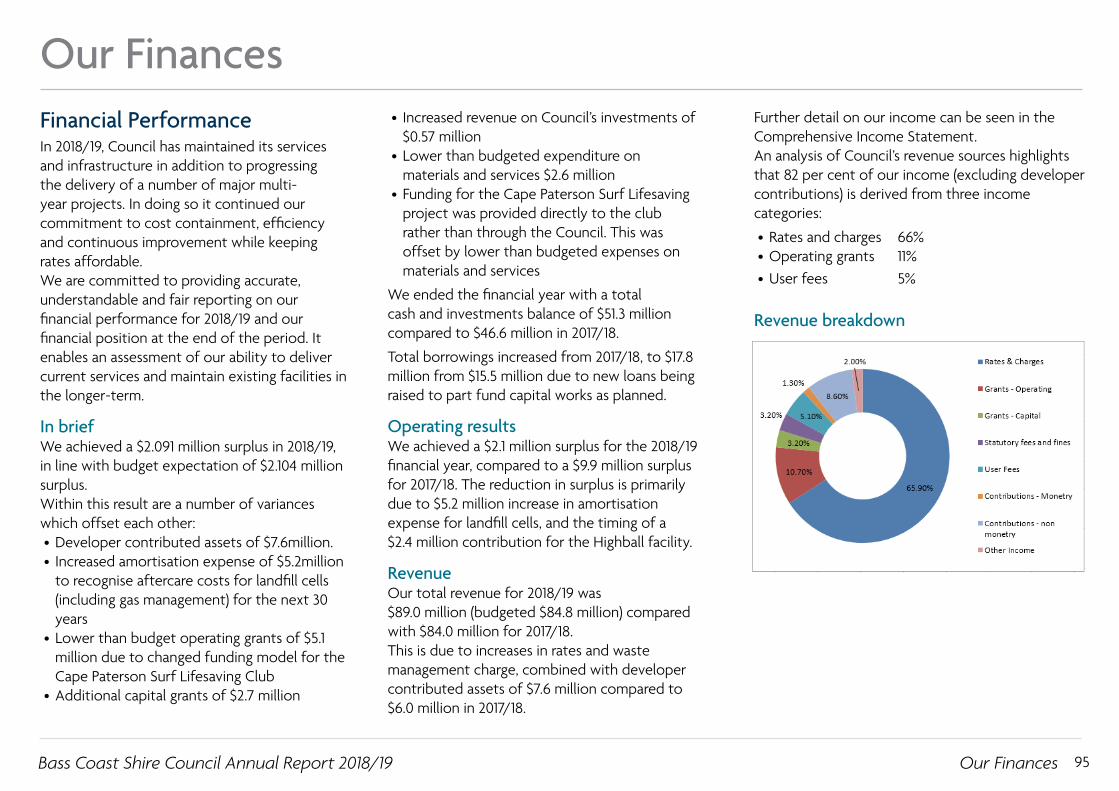
Bass Coast Shire Council Annual Report 2018/19 95
Our Finances
Our Finances
Financial PerformanceIn 2018/19, Council has maintained its services and infrastructure in addition to progressing the delivery of a number of major multi-year projects. In doing so it continued our commitment to cost containment, efficiency and continuous improvement while keeping rates affordable. We are committed to providing accurate, understandable and fair reporting on our financial performance for 2018/19 and our financial position at the end of the period. It enables an assessment of our ability to deliver current services and maintain existing facilities in the longer-term.
In briefWe achieved a $2.091 million surplus in 2018/19, in line with budget expectation of $2.104 million surplus.Within this result are a number of variances which offset each other:• Developer contributed assets of $7.6million.• Increased amortisation expense of $5.2million
to recognise aftercare costs for landfill cells (including gas management) for the next 30 years
• Lower than budget operating grants of $5.1 million due to changed funding model for the Cape Paterson Surf Lifesaving Club
• Additional capital grants of $2.7 million
Further detail on our income can be seen in the Comprehensive Income Statement.An analysis of Council’s revenue sources highlights that 82 per cent of our income (excluding developer contributions) is derived from three income categories:
• Rates and charges 66%• Operating grants 11%• User fees 5%
Revenue breakdown
• Increased revenue on Council’s investments of $0.57 million
• Lower than budgeted expenditure on materials and services $2.6 million
• Funding for the Cape Paterson Surf Lifesaving project was provided directly to the club rather than through the Council. This was offset by lower than budgeted expenses on materials and services
We ended the financial year with a total cash and investments balance of $51.3 million compared to $46.6 million in 2017/18.
Total borrowings increased from 2017/18, to $17.8 million from $15.5 million due to new loans being raised to part fund capital works as planned.
Operating resultsWe achieved a $2.1 million surplus for the 2018/19 financial year, compared to a $9.9 million surplus for 2017/18. The reduction in surplus is primarily due to $5.2 million increase in amortisation expense for landfill cells, and the timing of a $2.4 million contribution for the Highball facility.
RevenueOur total revenue for 2018/19 was$89.0 million (budgeted $84.8 million) compared with $84.0 million for 2017/18. This is due to increases in rates and waste management charge, combined with developer contributed assets of $7.6 million compared to $6.0 million in 2017/18.

Bass Coast Shire Council Annual Report 2018/19 96
Our Finances
Our Finances
ExpenditureOur total expenses for 2018/19 were $86.9 million; $12.8 million more than the $74.1 million spent in 2017/18 (detailed in the Comprehensive Income Statement).An analysis of expenses indicates that 91% were in the following three categories:
• Employee benefits 35%• Materials and services 34%• Depreciation and amortisation 23%
Aside from employee related costs the other major expenditure type is materials and services. Materials and services covers a wide range of activities, such as payments to contractors for services, waste collection activities, maintenance, repairs, legal fees, bank fees and insurance, amongst many others. Each of the types of payments made in this area is broken out into more detail within Note 4.2 of the Annual Financial Report.
Expenditure Breakdown
Capital Works2018/19 Capital Works expenditure of $17.6 million is $5.3 million greater than the prior year expenditure of $12.3 million. This is due to a number of large multi-year and carry forward projects in construction phase in 2018/19. These include Cowes Jetty Triangle, Grantville Cell 7 Construction, and Cowes Transit Centre. Renewal and upgrade of our existing assets accounted for $14.5 million and we spent $3.1 million on new and expansion works. The investment in capital works is a strategic approach to maintaining or renewing the community’s existing assets as they age.
Capital Works Trends
Activities included:• $3.7 million on road works.• $2.3 million on recreational leisure and community facilities.• $1.4 million on Cowes Jetty Triangle and Piazza • $1.4 million on Cowes Transit Centre
Although Council capitalised works for $17.4 million, the total value of project costs for those activities was $17.9 million. Total project costs include activities that support the delivery of capital works. These support costs do not form part of the asset’s value and do not then appear in the Statement of Capital Works within the financial statements. To better understand the cost of a project against the budget the following Statement of Project Works is prepared.

Bass Coast Shire Council Annual Report 2018/19 97
Our Finances
Our Finances
Statement of Project Works The 2019 Forecast includes variations that occur to the program throughout the year and projects carried forward from the 2017/18 financial year.The more significant variations include:• $1.4 million for the Cowes Jetty Triangle carried
forward from 2017/18• $1.02 million for the Grantville Cell 7
Construction carried forward from 2017/18• $4.2 million for the Pioneer Bay Roads &
Drainage carried forward to 2019/20• $2.0 million for the Strategic Land Acquisition
Phillip Island carried forward to 2019/20• $0.8 million for the Cowes Transit Centre carried
forward to 2019/20
AssetsOur total assets are valued at $764 million; 96% consisting of:• Property, plant, equipment and infrastructure
(land, buildings, roads, bridges etc.)• Cash assets (mainly short-term investments)
LiabilitiesOur total liabilities were $48.3 million as at 30 June 2019. Liabilities included loans, amounts owed to suppliers, provisions for landfill rehabilitation and amounts owed to employees for leave entitlements. Liabilities increased by $13.0 million, in comparison with 2017/18. This was largely due to an increase in provision for landfill cell aftercare of $6.1 million, and an increase in borrowings of $2.4 million.
Provisions for employee benefits decreased by $2.0 million. Council’s provision for landfill restoration increased by $6.1 million after a reassessment of works required and costings. Council’s borrowings increased from $15.4 million in 2017/18 to $17.8 million in 2018/19.
During 2018/19 Council made total loan repayments (principal and interest) of $6.3 million and borrowed an additional $8.2 million. This resulted in an overall net increase in debt of $2.5 million. Council’s current debt is within the prudential ratio limits used by the Victorian State Government.
Loan liabilityTotal Loan Liability
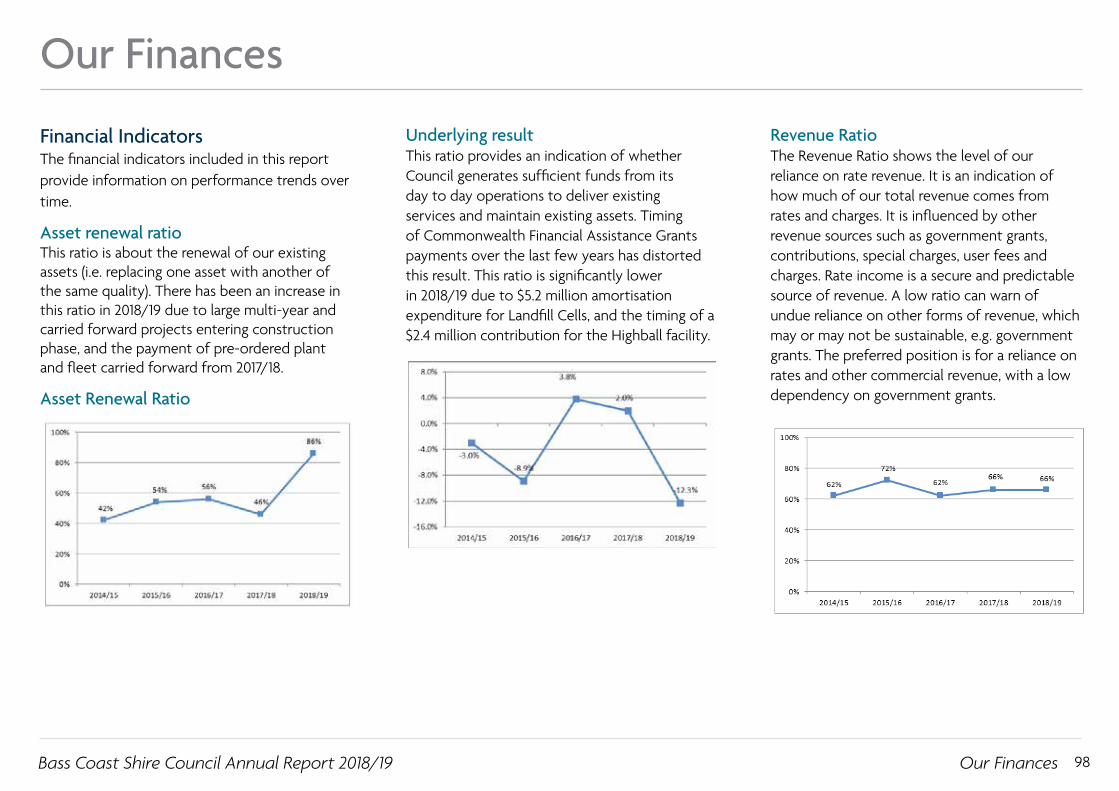
Bass Coast Shire Council Annual Report 2018/19 98
Our Finances
Our Finances
Financial IndicatorsThe financial indicators included in this report provide information on performance trends over time.
Asset renewal ratioThis ratio is about the renewal of our existing assets (i.e. replacing one asset with another of the same quality). There has been an increase in this ratio in 2018/19 due to large multi-year and carried forward projects entering construction phase, and the payment of pre-ordered plant and fleet carried forward from 2017/18.
Asset Renewal Ratio
Underlying resultThis ratio provides an indication of whether Council generates sufficient funds from its day to day operations to deliver existing services and maintain existing assets. Timing of Commonwealth Financial Assistance Grants payments over the last few years has distorted this result. This ratio is significantly lower in 2018/19 due to $5.2 million amortisation expenditure for Landfill Cells, and the timing of a $2.4 million contribution for the Highball facility.
Revenue RatioThe Revenue Ratio shows the level of our reliance on rate revenue. It is an indication of how much of our total revenue comes from rates and charges. It is influenced by other revenue sources such as government grants, contributions, special charges, user fees and charges. Rate income is a secure and predictable source of revenue. A low ratio can warn of undue reliance on other forms of revenue, which may or may not be sustainable, e.g. government grants. The preferred position is for a reliance on rates and other commercial revenue, with a low dependency on government grants.

Bass Coast Shire Council Annual Report 2018/19 99
Our Finances
Our Finances
Financial Sustainability Risk IndicatorsFinancial sustainability is defined in a number of different ways. A generally accepted definition is whether local governments have sufficient current and prospective financial capacity (inflows) to meet their current and prospective financial requirements (outflows).To be sustainable, councils need to have some excess capacity at any point in time to be able to manage future financial risks and shocks without having to radically adjust their current revenue or expenditure policies.The indicators used by the Victorian Auditor General to assess the financial viability of councils are:• Net Result – whether enough revenue is
generated to cover operating costs (including the cost of replacing assets, reflected in depreciation expense)
• Liquidity – whether sufficient working capital exists to meet short-term commitments
• Internal Financing – whether sufficient operating cash flows are generated to invest in asset renewal and to repay any debt incurred in the past
• Indebtedness – whether there is an over reliance on debt to fund the capital program
• Capital Replacement – whether assets have been replaced at a rate consistent with the rate of their consumption
• Renewal Gap – whether existing assets have been maintained at a consistent rate
The following graphs show the trend for each of the financial sustainability risk indicators.
Net Result RatioThis ratio includes capital grants that aid in generating an underlying surplus. This can be used for new assets or asset renewal. This result places Council within the ‘Low’ risk category for financial sustainability.
Net Result Ratio
Liquidity RatioThe Liquidity Ratio expresses the level of current assets, such as cash and investments, that Council has available to meet our current liabilities. This includes outstanding creditors and employee entitlements.To be considered at Low risk by the Auditor General the ratio must be greater than 1.0. This means that Council has the capacity to pay its immediately due debts. A result above 1.5 has
historically been recommended by the Municipal Association of Victoria (MAV) as the minimum level for this ratio.Our liquidity ratio of 1.73 is over the recommended target for low risk and reflects Council’s practice of putting aside funds to pay for future activities. This is a very positive result and it means that we have no immediate issue with repaying our liabilities when they fall due.
Liquidity ratio
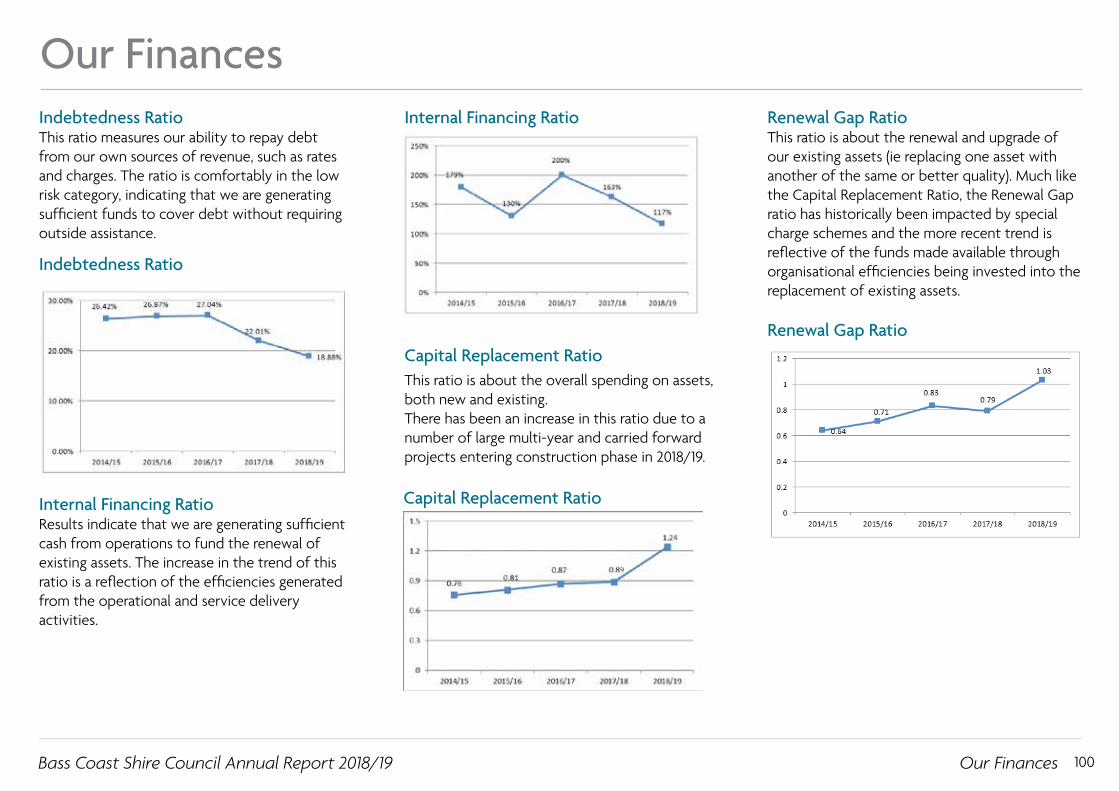
Bass Coast Shire Council Annual Report 2018/19 100
Our Finances
Our Finances
Indebtedness RatioThis ratio measures our ability to repay debt from our own sources of revenue, such as rates and charges. The ratio is comfortably in the low risk category, indicating that we are generating sufficient funds to cover debt without requiring outside assistance.
Indebtedness Ratio
Capital Replacement RatioThis ratio is about the overall spending on assets, both new and existing. There has been an increase in this ratio due to a number of large multi-year and carried forward projects entering construction phase in 2018/19.
Renewal Gap RatioThis ratio is about the renewal and upgrade of our existing assets (ie replacing one asset with another of the same or better quality). Much like the Capital Replacement Ratio, the Renewal Gap ratio has historically been impacted by special charge schemes and the more recent trend is reflective of the funds made available through organisational efficiencies being invested into the replacement of existing assets.
Internal Financing Ratio
Renewal Gap Ratio
Capital Replacement RatioInternal Financing RatioResults indicate that we are generating sufficient cash from operations to fund the renewal of existing assets. The increase in the trend of this ratio is a reflection of the efficiencies generated from the operational and service delivery activities.
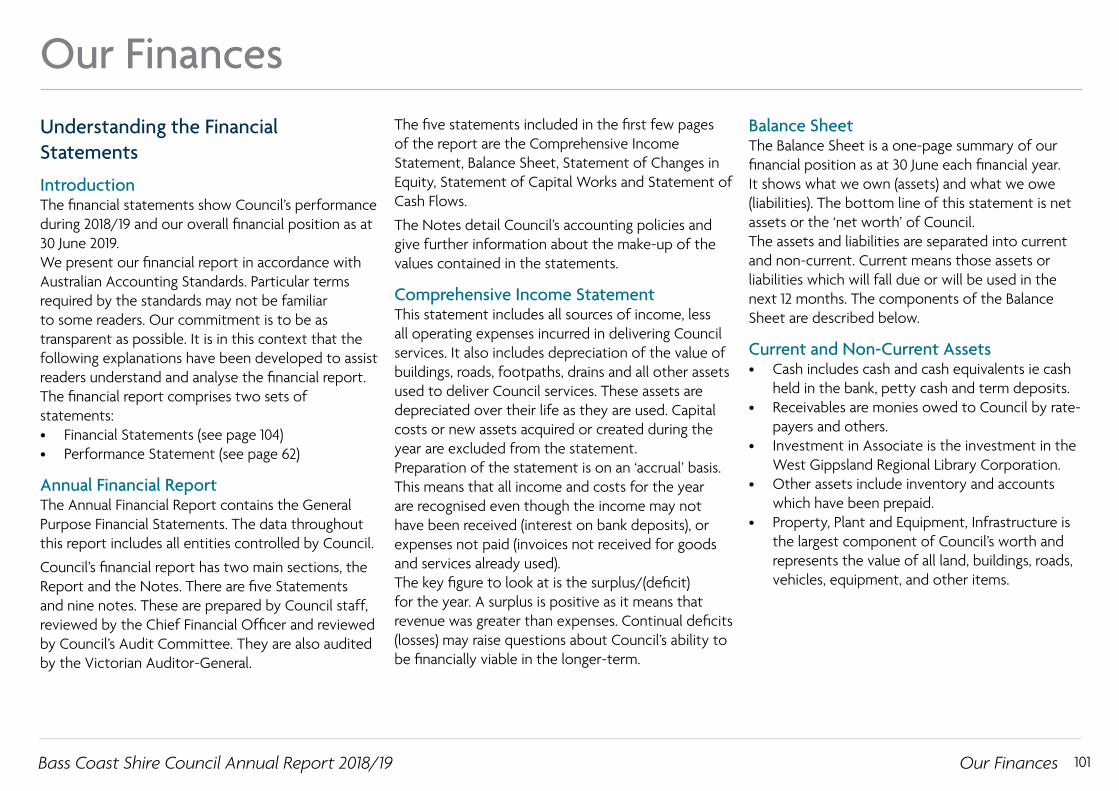
Bass Coast Shire Council Annual Report 2018/19 101
Our Finances
Our Finances
Understanding the Financial Statements
IntroductionThe financial statements show Council’s performance during 2018/19 and our overall financial position as at 30 June 2019.We present our financial report in accordance with Australian Accounting Standards. Particular terms required by the standards may not be familiar to some readers. Our commitment is to be as transparent as possible. It is in this context that the following explanations have been developed to assist readers understand and analyse the financial report.The financial report comprises two sets of statements:• Financial Statements (see page 104)• Performance Statement (see page 62)
Annual Financial ReportThe Annual Financial Report contains the General Purpose Financial Statements. The data throughout this report includes all entities controlled by Council.
Council’s financial report has two main sections, the Report and the Notes. There are five Statements and nine notes. These are prepared by Council staff, reviewed by the Chief Financial Officer and reviewed by Council’s Audit Committee. They are also audited by the Victorian Auditor-General.
The five statements included in the first few pages of the report are the Comprehensive Income Statement, Balance Sheet, Statement of Changes in Equity, Statement of Capital Works and Statement of Cash Flows.
The Notes detail Council’s accounting policies and give further information about the make-up of the values contained in the statements.
Comprehensive Income StatementThis statement includes all sources of income, less all operating expenses incurred in delivering Council services. It also includes depreciation of the value of buildings, roads, footpaths, drains and all other assets used to deliver Council services. These assets are depreciated over their life as they are used. Capital costs or new assets acquired or created during the year are excluded from the statement.Preparation of the statement is on an ‘accrual’ basis. This means that all income and costs for the year are recognised even though the income may not have been received (interest on bank deposits), or expenses not paid (invoices not received for goods and services already used).The key figure to look at is the surplus/(deficit) for the year. A surplus is positive as it means that revenue was greater than expenses. Continual deficits (losses) may raise questions about Council’s ability to be financially viable in the longer-term.
Balance SheetThe Balance Sheet is a one-page summary of our financial position as at 30 June each financial year. It shows what we own (assets) and what we owe (liabilities). The bottom line of this statement is net assets or the ‘net worth’ of Council.The assets and liabilities are separated into current and non-current. Current means those assets or liabilities which will fall due or will be used in the next 12 months. The components of the Balance Sheet are described below.
Current and Non-Current Assets• Cash includes cash and cash equivalents ie cash
held in the bank, petty cash and term deposits.• Receivables are monies owed to Council by rate-
payers and others.• Investment in Associate is the investment in the
West Gippsland Regional Library Corporation.• Other assets include inventory and accounts
which have been prepaid.• Property, Plant and Equipment, Infrastructure is
the largest component of Council’s worth and represents the value of all land, buildings, roads, vehicles, equipment, and other items.
Bass Coast Shire Council Annual Report 2018/19 102
Our Finances
Our Finances
Current and Non-Current Liabilities• Trade and other payables are monies owed by
Council as at 30 June each financial year.• Trust funds and deposits are monies received
and held by Council.• Provisions include landfill rehabilitation works
and employee benefits, such as accrued long service and annual leave.
• Interest bearing liabilities includes loans repaid over a set period of time. Lease liabilities are leases of assets where ownership of the asset is transferred to Council.
Net AssetsThis term is used to describe the difference between the value of total assets and the value of total liabilities. It represents the net worth of Council as at 30 June each financial year. The net value of Council is also synonymous with total equity.
Total Equity• Asset revaluation reserve is the difference
between the previously recorded value of property and infrastructure assets and their current valuations.
• Other reserves are allocations of the accumulated surplus to specific projects.
• Accumulated surplus is the value of all net assets accumulated over time.
Statement of Changes in EquityThe value of total equity, as set out in the balance sheet, changes during the year. The statement shows the values of each change along with how and why.The main reasons for changes in equity are:• The ‘profit and loss’ from operations, described
in the Comprehensive Income Statement as the surplus/(deficit)) for the year.
• The use of monies from Council’s reserves and transfers to Council’s reserves.
• Revaluation of assets occurs to ensure that assets are correctly valued at current replacement value.
Statement of Capital WorksThe Statement of Capital Works summarises Council spending on assets for the year. The Statement of Capital Works breaks all capital expenditure incurred by Council into three broad headings – Property, Plant and Equipment, and Infrastructure, with relevant sub groups below these.The Statement of Capital Works also shows asset spending by four (4) categories:• Asset renewal expenditure – spending on
renewing Council’s existing assets back to their original service provision capacity.
• Asset upgrade expenditure – spending on improving the service capacity of Council’s existing assets.
• Asset expansion expenditure – spending on new assets that expand the existing network.
• New asset expenditure – spending on assets that Council has not possessed previously.
Statement of Cash FlowsThe Statement of Cash Flows summarises Council’s cash payments and cash receipts for the year. This statement is presented according to a very specific Accounting Standard and needs some care in analysis. The values may differ from those shown in the Comprehensive Income Statement because this statement is prepared on an accrual accounting basis.The amounts disclosed in the Cash Flow Statement are our cash flows generated from, and used in, three main areas:
1. Cash Flow from Operating Activities• Receipts. All cash received into Council’s bank
account from ratepayers and other monies owed to Council. Receipts also include the interest assets from Council’s cash investments. It does not include the costs associated with the sale of assets.
• Payments. All cash paid from Council’s bank account to staff, creditors and other persons. It does not include the costs associated with the creation of assets.

Bass Coast Shire Council Annual Report 2018/19 103
Our Finances
Our Finances
2. Cash Flow from Investing ActivitiesThe accounting term Investing Activities relates to payments for the acquisition of assets, such as new plant, roads and other long-term revenue producing assets. It also includes the proceeds from the sale of assets, such as plant, and land.
3. Cash Flow from Financing ActivitiesThis is where the receipt and repayment of borrowed funds are recorded, as well as any movement in trust funds and deposits held by Council.The bottom line of the Statement of Cash Flows is our total cash at the end of the financial year.The Statement of Cash Flows is important as it shows the source of our funds and detail show they are spent.
Notes to the AccountsThe Notes are an important and informative section of the report. The Notes give details behind many of the summary figures contained in the statements. Note numbers are shown beside the relevant items in the Comprehensive Income Statement, Balance Sheet, Statement of Changes in Equity and the Statement of Cash Flows.The Australian Accounting Standards are not prescriptive on a lot of issues. To understand the basis on which the values shown in the statements are established, it is necessary to provide details of Council’s accounting policies. These are detailed within the relevant note on the specific revenue, expenditure, asset or liability item.
Note 1 provides for a comparison between end of year actual results and Council’s original budget, highlighting and providing explanations for major variances.Where Council wishes to disclose other information that cannot be incorporated in the statements, then this is shown in the Notes. Other Notes include:• The breakdown of expenses, revenues, reserves
and other assets.• Transactions with persons related to Council.• Financial performance indicators.
The Notes should be read in conjunction with the other parts of the Financial Statements to get a clear picture of the accounts.
What is the Performance Statement?The Performance Statement reports on Council’s progress for the financial year against the Local Government Performance Reporting Framework indicators adopted as part of the annual budget. They include financial and non-financial data.Our external auditors review the evidence and accuracy of the results.
Statements by Principal Accounting Officer and CouncillorsThe Certification of the Principal Accounting Officer is made by the person responsible for the financial management of Council. It assures that, in her/his opinion, the financial statements have met all the statutory and professional reporting requirements.
The Certification of Councillors is made by two Councillors on behalf of Council confirming that in their opinion the financial statements are fair and not misleading. The Chief Executive Officer also endorses and signs the certification.
Auditor General’s ReportThe Independent Auditor’s Report provides an external opinion on the financial statements. The opinion covers statutory and professional requirements as well as addressing the fairness aspects of the financial statements.
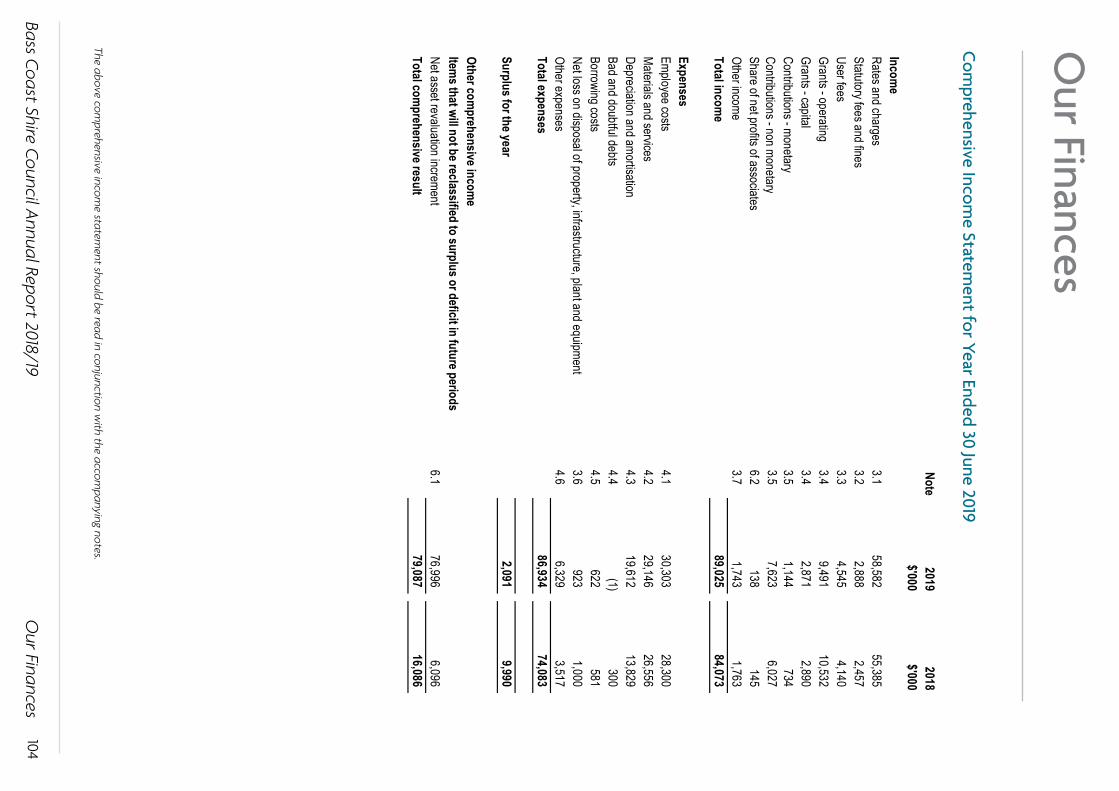
Bass Coast Shire Council Annual Report 2018/19
104
Our Finances
Our Finances
Bass Coast Shire Council2018/2019 Financial Report
Note2019
2018$'000
$'000Incom
eRates and charges
3.158,582
55,385
Statutory fees and fines
3.22,888
2,457
User fees
3.34,545
4,140
Grants - operating
3.49,491
10,532
Grants - capital
3.42,871
2,890
Contributions - monetary
3.51,144
734
Contributions - non monetary
3.57,623
6,027
Share of net profits of associates
6.2138
145
Other income
3.71,743
1,763
Total incom
e89,025
84,073
ExpensesEmployee costs
4.130,303
28,300
Materials and services
4.229,146
26,556
Depreciation and am
ortisation4.3
19,612
13,829
Bad and doubtful debts4.4
(1)
300
Borrowing costs4.5
622
581
Net loss on disposal of property, infrastructure, plant and equipment3.6
923
1,000
Other expenses4.6
6,329
3,517
Total expenses 86,934
74,083
Surplus for the year2,091
9,990
Other comprehensive incom
eItem
s that will not be reclassified to surplus or deficit in future periodsNet asset revaluation increment
6.176,996
6,096
Total com
prehensive result79,087
16,086
Comprehensive Incom
e Statement
For the Year Ended 30 June 2019
The above comprehensive income statement should be read in conjunction with the accompanying notes.Page 4
Com
prehensive Income Statem
ent for Year Ended 30 June 2019
The above comprehensive incom
e statement should be read in conjunction w
ith the accompanying notes.
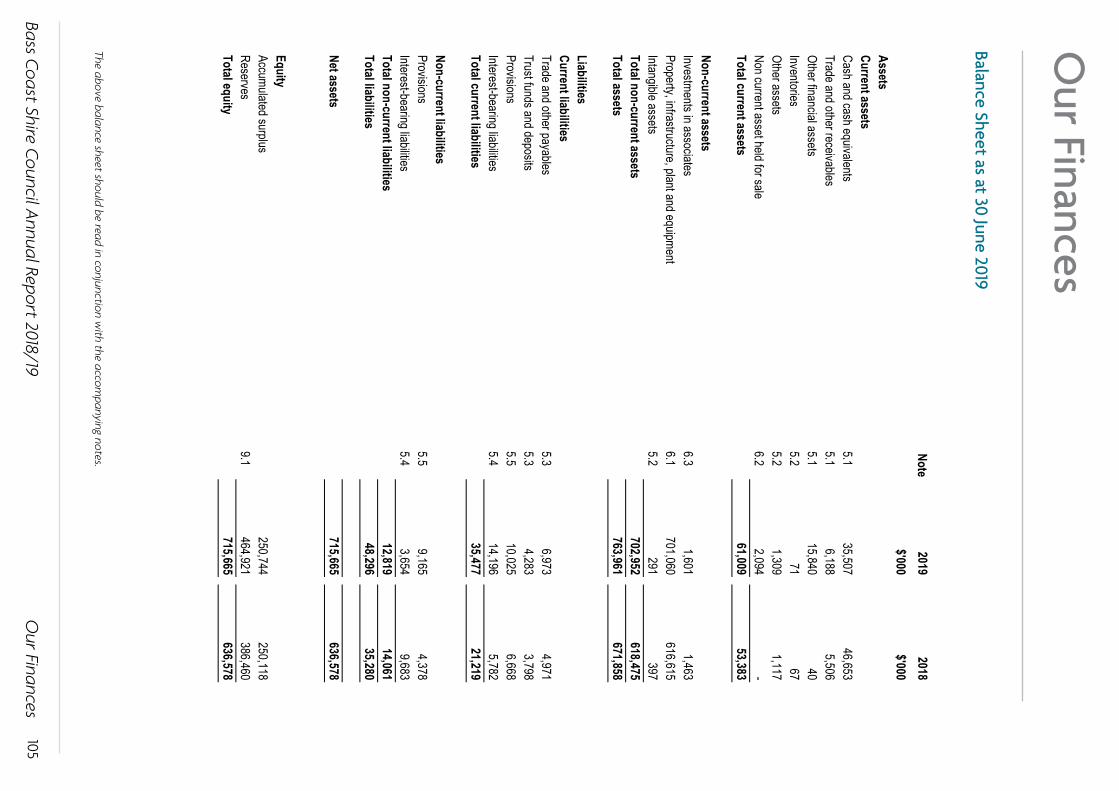
Bass Coast Shire Council Annual Report 2018/19
105
Our Finances
Our Finances
Bass Coast Shire Council2018/2019 Financial Report
Note2019
2018 $'000
$'000 AssetsCurrent assetsCash and cash equivalents
5.1 35,507
46,653 Trade and other receivables
5.1 6,188
5,506 Other financial assets
5.1 15,840
40 Inventories
5.2 71
67 Other assets
5.2 1,309
1,117 Non current asset held for sale
6.2 2,094
- Total current assets
61,009 53,383
Non-current assetsInvestments in associates
6.3 1,601
1,463 Property, infrastructure, plant and equipment
6.1 701,060
616,615 Intangible assets
5.2 291
397 Total non-current assets
702,952 618,475
Total assets 763,961
671,858
LiabilitiesCurrent liabilitiesTrade and other payables
5.3 6,973
4,971 Trust funds and deposits
5.3 4,283
3,798 Provisions
5.5 10,025
6,668 Interest-bearing liabilities
5.4 14,196
5,782 Total current liabilities
35,477 21,219
Non-current liabilitiesProvisions
5.5 9,165
4,378 Interest-bearing liabilities
5.4 3,654
9,683 Total non-current liabilities
12,819 14,061
Total liabilities 48,296
35,280
Net assets 715,665
636,578
EquityAccumulated surplus
250,744 250,118
Reserves9.1
464,921 386,460
Total equity 715,665
636,578
Balance SheetAs at 30 June 2019
The above balance sheet should be read in conjunction with the accompanying notes.Page 5
The above balance sheet should be read in conjunction with the accom
panying notes.
Balance Sheet as at 30 June 2019
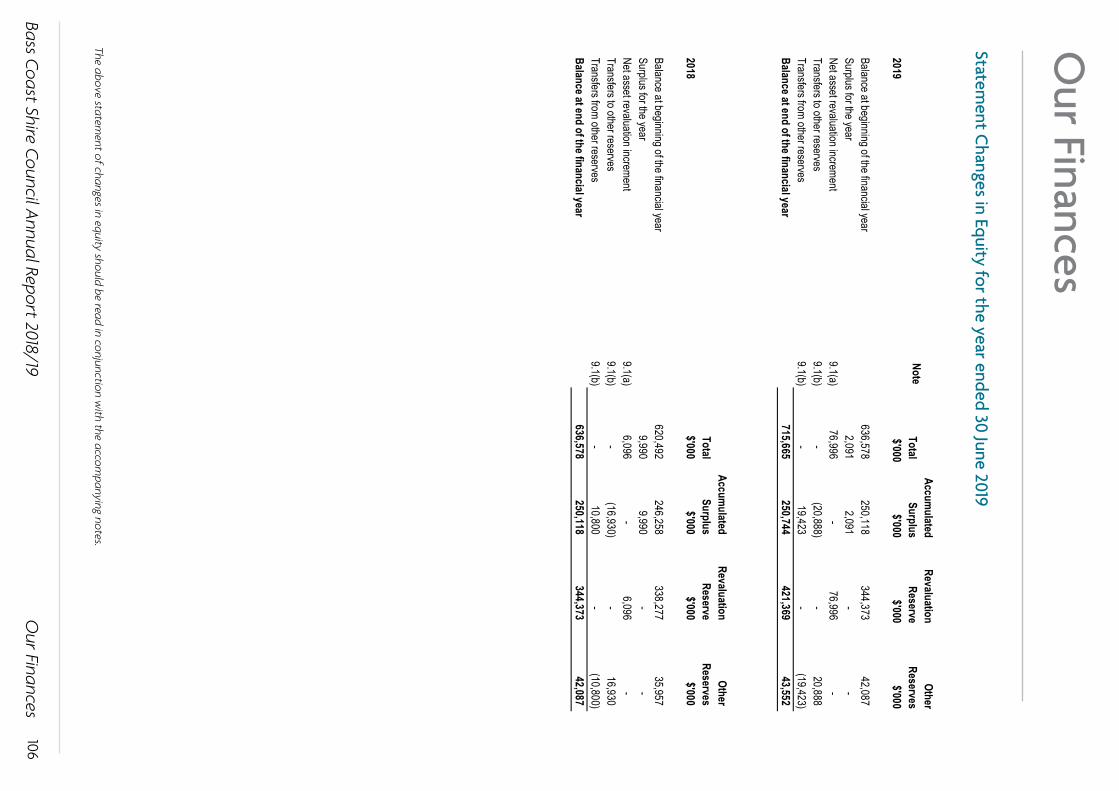
Bass Coast Shire Council Annual Report 2018/19
106
Our Finances
Our Finances
Bass Coast Shire Council
Accumulated
RevaluationOther
TotalSurplus
ReserveReserves
2019$'000
$'000$'000
$'000
Balance at beginning of the financial year636,578
250,118
344,373
42,087
Surplus for the year
2,091
2,091
-
-
Net asset revaluation increment9.1(a)
76,996
-
76,996
-
Transfers to other reserves 9.1(b)
-
(20,888)
-
20,888
Transfers from other reserves9.1(b)
-
19,423
-
(19,423)
Balance at end of the financial year715,665
250,744
421,369
43,552
Accumulated
RevaluationOther
TotalSurplus
ReserveReserves
2018$'000
$'000$'000
$'000
Balance at beginning of the financial year620,492
246,258
338,277
35,957
Surplus for the year
9,990
9,990
-
-
Net asset revaluation increment9.1(a)
6,096
-
6,096
-
Transfers to other reserves 9.1(b)
-
(16,930)
-
16,930
Transfers from other reserves9.1(b)
-
10,800
-
(10,800)
Balance at end of the financial year636,578
250,118
344,373
42,087
Page 6
2018/2019 Financial Report
Statement of Changes in Equity
For the Year Ended 30 June 2019
Note
The above statement of changes in equity should be read in conjunction with the accompanying notes.
The above statement of changes in equity should be read in conjunction w
ith the accompanying notes.
Statement C
hanges in Equity for the year ended 30 June 2019

Bass Coast Shire Council Annual Report 2018/19
107
Our Finances
Our Finances
Bass Coast Shire Council
20192018
Inflows /Inflows /
(Outflows)(Outflows)
Note$'000
$'000Cash flows from
operating activities
Rates and charges57,771
55,481
Statutory fees and fines
2,887
2,457
User fees5,288
2,925
Grants - operating
9,491
10,532
Grants - capital2,871
2,890
Contributions - monetary
1,144
734
Interest received1,114
954
Dividends received
2
19
Trust funds and deposits taken10,328
12,196
Other receipts
895
1,646
Net GST refund3,868
3,514
Employee costs
(28,403)
(28,276)
Materials and services(30,376)
(28,505)
Trust funds and deposits repaid
(9,845)
(12,054)
Other payments(7,116)
(4,926)
Net cash provided by operating activities
9.219,919
19,587
Cash flows from investing activities
Payments for property, infrastructure, plant and equipment6.1
(17,644)
(12,333)
Proceeds from sale of property, infrastructure, plant and equipment616
292
Payments for investments
(15,800)
-
Net cash used in investing activities(32,828)
(12,041)
Cash flows from financing activities
Finance costs(622)
(581)
Proceeds from borrowings
3,349
4,818
Repayment of finance leases(141)
(135)
Repayment of borrowings
(823)
(3,163)
Net cash provided by financing activities1,763
939
Net (decrease)/increase in cash and cash equivalents(11,146)
8,485
Cash and cash equivalents at the beginning of the financial year
46,653
38,168
Cash and cash equivalents at the end of the financial year 35,507
46,653
Financing arrangements5.6
Restrictions on cash assets5.1
2018/2019 Financial Report
Statement of Cash Flows
For the Year Ended 30 June 2019
The above statement of cash flow should be read in conjunction with the accompanying notes.Page 7
The above statement of cash flow
should be read in conjunction with the accom
panying notes.
Statement of C
ash Flow for the year ended 30 June 2019

Bass Coast Shire Council Annual Report 2018/19
108
Our Finances
Our Finances
Bass Coast Shire Council
20192018
$'000$'000
PropertyLand
654
248
Land improvements3,214
2,079
Total land
3,8682,327
Buildings
3,494
3,594
Total buildings3,494
3,594
Total property7,362
5,921
Plant and equipment
Plant, machinery and equipment2,627
590
Fixtures, fittings and furniture
-
4
Computers and telecommunications50
64
Art works
49
238
Total plant and equipment
2,726
896
InfrastructureRoads
5,377
3,482
Bridges880
118
Footpaths and cycleways
467
776
Drainage458
195
W
ater sensitive urban design-
100
W
aste management373
848
Total infrastructure
7,555
5,519
Total capital works expenditure17,643
12,336
Represented by:New asset expenditure
1,060
1,374
Asset renewal expenditure12,254
6,369
Asset expansion expenditure
2,032
55
Asset upgrade expenditure2,297
4,538
Total capital works expenditure
17,643
12,336
2018/2019 Financial Report
Statement of Capital W
orksFor the Year Ended 30 June 2019
The above statement of capital works should be read in conjunction with the accompanying notes.Page 8
The above statement of capital w
orks should be read in conjunction with the accom
panying notes.
Statement of C
apital Works for the year ended 30 June 2019
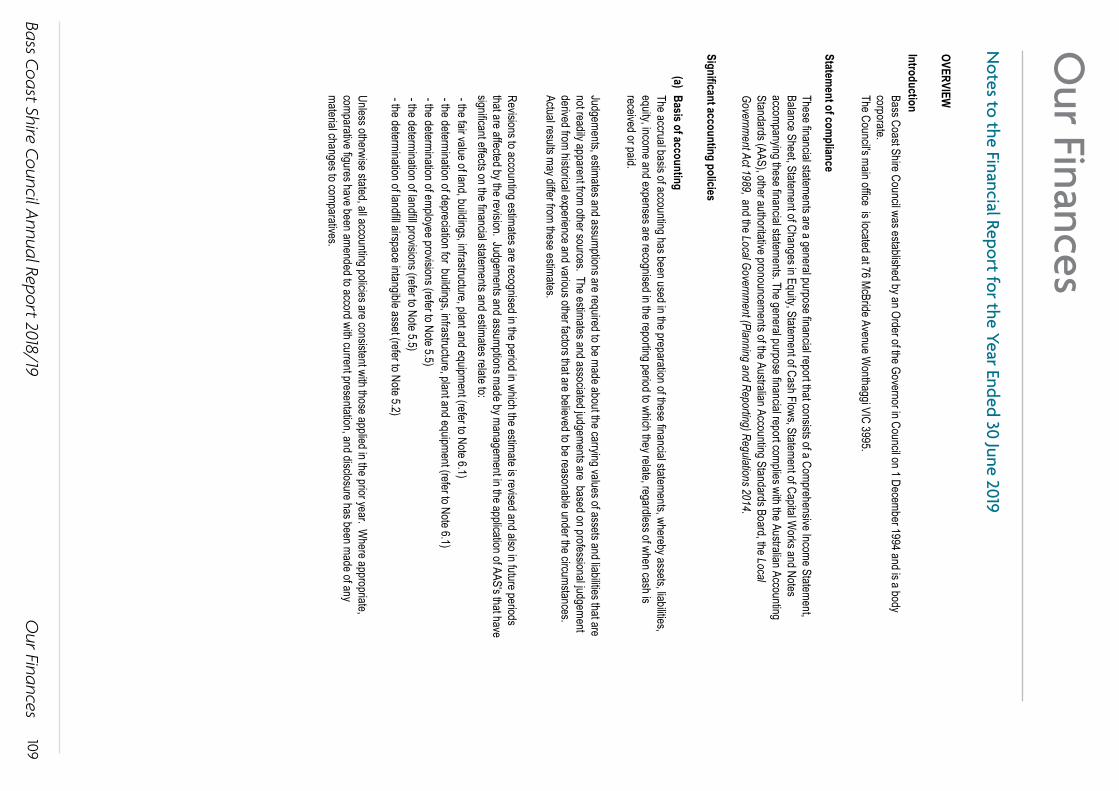
Bass Coast Shire Council Annual Report 2018/19
109
Our Finances
Our Finances
Bass Coast Shire CouncilNotes to the Financial Report
2018/2019 Financial ReportFor the Year Ended 30 June 2019
OVERVIEW Introduction
Bass Coast Shire Council was established by an Order of the Governor in Council on 1 December 1994 and is a body corporate. The Council's main office is located at 76 McBride Avenue W
onthaggi VIC 3995.
Statement of com
pliance
These financial statements are a general purpose financial report that consists of a Comprehensive Income Statement, Balance Sheet, Statement of Changes in Equity, Statement of Cash Flows, Statement of Capital W
orks and Notes accompanying these financial statements. The general purpose financial report complies with the Australian Accounting Standards (AAS), other authoritative pronouncements of the Australian Accounting Standards Board, the Local Governm
ent Act 1989, and the Local Government (Planning and Reporting) Regulations 2014.
Significant accounting policies
(a) Basis of accountingThe accrual basis of accounting has been used in the preparation of these financial statements, whereby assets, liabilities, equity, income and expenses are recognised in the reporting period to which they relate, regardless of when cash is received or paid.
Judgements, estimates and assumptions are required to be made about the carrying values of assets and liabilities that are not readily apparent from other sources. The estimates and associated judgements are based on professional judgem
ent derived from historical experience and various other factors that are believed to be reasonable under the circumstances. Actual results may differ from these estimates.
Revisions to accounting estimates are recognised in the period in which the estimate is revised and also in future periods that are affected by the revision. Judgements and assumptions made by management in the application of AAS's that have significant effects on the financial statements and estimates relate to: - the fair value of land, buildings, infrastructure, plant and equipment (refer to Note 6.1) - the determination of depreciation for buildings, infrastructure, plant and equipment (refer to Note 6.1) - the determination of employee provisions (refer to Note 5.5) - the determination of landfill provisions (refer to Note 5.5) - the determination of landfill airspace intangible asset (refer to Note 5.2)
Unless otherwise stated, all accounting policies are consistent with those applied in the prior year. Where appropriate,
comparative figures have been amended to accord with current presentation, and disclosure has been made of any material changes to comparatives.
Page 9
Notes to the Financial Report for the Year Ended 30 June 2019
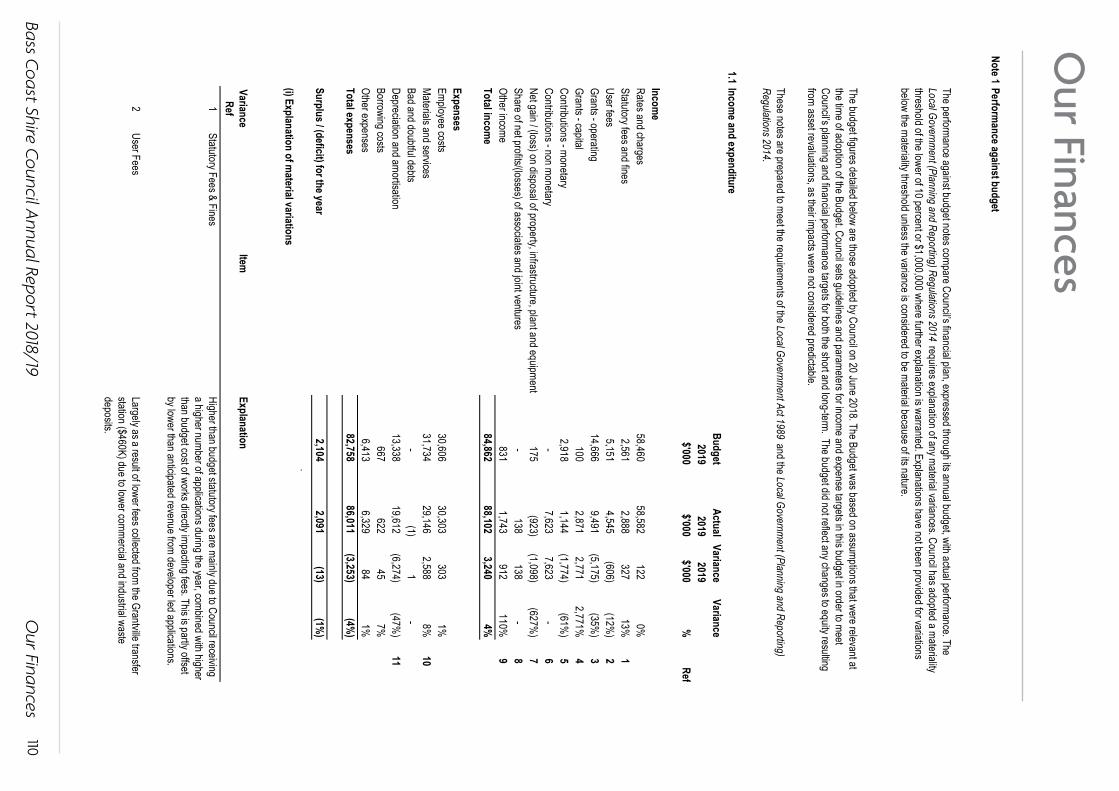
Bass Coast Shire Council Annual Report 2018/19
110
Our Finances
Our Finances
Bass Coast Shire Council2018/2019 Financial Report
Note 1Perform
ance against budget
1.1Incom
e and expenditureBudget
ActualVariance
Variance2019
20192019
$'000$'000
$'000%
Ref
Income
Rates and charges58,460
58,582
122
0%
Statutory fees and fines2,561
2,888
327
13%
1User fees
5,151
4,545
(606)
(12%)
2Grants - operating
14,666
9,491
(5,175)
(35%)
3Grants - capital
100
2,871
2,771
2,771%4
Contributions - monetary2,918
1,144
(1,774)
(61%
)5
Contributions - non monetary-
7,623
7,623
-
6
Net gain / (loss) on disposal of property, infrastructure, plant and equipment
175
(923)
(1,098)
(627%)
7Share of net profits/(losses) of associates and joint ventures
-
138
138
-
8Other income
831
1,743
912
110%9
Total income
84,862
88,102
3,240
4%
ExpensesEmployee costs
30,606
30,303
303
1%Materials and services
31,734
29,146
2,588
8%10
Bad and doubtful debts-
(1)
1
-
Depreciation and am
ortisation13,338
19,612
(6,274)
(47%
)11
Borrowing costs667
622
45
7%
Other expenses6,413
6,329
84
1%
Total expenses 82,758
86,011
(3,253)
(4%
)
Surplus / (deficit) for the year2,104
2,091
(13)
(1%
).
(i) Explanation of material variations
ItemExplanation
1Statutory Fees & Fines
2User Fees
Variance Ref
Higher than budget statutory fees are mainly due to Council receiving a higher number of applications during the year, combined with higher than budget cost of works directly impacting fees. This is partly offset by lower than anticipated revenue from developer led applications.
Largely as a result of lower fees collected from the Grantville transfer station ($460K) due to lower commercial and industrial waste deposits.
Page 10
Notes to the Financial ReportFor the Year Ended 30 June 2019
The performance against budget notes compare Council’s financial plan, expressed through its annual budget, with actual performance. The Local Governm
ent (Planning and Reporting) Regulations 2014 requires explanation of any material variances. Council has adopted a materiality threshold of the lower of 10 percent or $1,000,000 where further explanation is warranted. Explanations have not been provided for variations below the materiality threshold unless the variance is considered to be material because of its nature.
The budget figures detailed below are those adopted by Council on 20 June 2018. The Budget was based on assumptions that were relevant at the time of adoption of the Budget. Council sets guidelines and parameters for income and expense targets in this budget in order to meet Council’s planning and financial performance targets for both the short and long-term. The budget did not reflect any changes to equity resulting from asset revaluations, as their impacts were not considered predictable.
These notes are prepared to meet the requirements of the Local Government Act 1989 and the Local Governm
ent (Planning and Reporting) Regulations 2014.

Bass Coast Shire Council Annual Report 2018/19
111
Our Finances
Our Finances
Bass Coast Shire Council2018/2019 Financial Report
Notes to the Financial ReportFor the Year Ended 30 June 2019
3Grants - Operating
4Grants - Capital
5Contributions - monetary
6Contributions - non monetary
7Net gain / (loss) on disposal of property, infrastructure, plant and equipment
8Share of net profits/(losses) of associates and joint ventures
9Other Income
10Materials and services
11Depreciation and amortisation
Funding of $280k for the Cape Paterson Surf Lifesaving project was provided directly to the club rather than through Council. This obviated the need for Council to incur expenditure on this project. This is partly offset by unbudgeted legal fees incurred of $500K and a $500K landfill levy expense aligned in 'Other Expenses' rather than in 'Materials and Services' with budget.
Amortisation expense has increased by $5.2 million to recognise aftercare costs for Landfill Cells (including gas management), for which Council is responsible for the next 30 years. This initial expense recognition has created an estimated provision in the balance sheet that is expected to offset aftercare costs incurred over the next 30 years. This is coupled with higher than budget depreciation on roads recognised ($760K) as a result of a road revaluation performed during the year, updating the useful lives and unit rate values of our roads.
Page 11
Funding of $3.25 million for the Cape Paterson Surf Lifesaving project was provided directly to the club rather than through the Council. This is offset by lower than budgeted expenses on materials and services. In addition, the earlier than projected receipt of $900K in grants for the Highball project combined with lower grants overall contributed to this variance.
Higher than budgeted capital grants received for the following projects; Inverloch Cowes and Phillip Island Netball Courts ($555K), W
onthaggi and Grantville Tennis Courts($366K), San Remo skate park ($236K), Rural roads ($600K) and W
onthaggi Rail Trail Illumination ($108K). In addition, favourable timing of grants received for the following multi-year projects; Cowes Jetty Triangle and Piazza redevelopment ($425K) and Cowes Transit Centre and all-day parking ($405K).
Largely due to the delay in the project for Pioneer Bay roads and drainage scheme, for which monetary contributions of $2,100K were budgeted.
Non monetary developer contributed assets are received on completion of developments. These are not budgeted for due to uncertainty of timing. During the year Council received non monetary contributions of $7,623K from, but not limited to, the following estates; Cloverdale, W
hyteSands, Cape Eco Village, Heritage Bay Estate.
The additional loss on disposal of fixed assets relates to losses on disposal of assets that are replaced or partially replaced as part of the capital works program. The most significant losses on asset disposals were for Buildings $508K and Roads $345K.
Council's share of net profits is dependant upon the performance of W
est Gippsland Regional Library Corporation. This is not budgeted for due to timing of the preparation of Council's budget.
Higher than budgeted investment interest income due to higher funds being available for investment during the year ($570K). In addition, higher than budget reimbursements received in relation to W
orkCover claims ($228). These W
orkCover reimbursements are fully offset in employee expenses.

Bass Coast Shire Council Annual Report 2018/19
112
Our Finances
Our Finances
Bass Coast Shire Council2018/2019 Financial Report
Note 1 Performance against budget (cont'd)
1.2Capital works
BudgetActual
VarianceVariance
20192019
2019$'000
$'000$'000
%Ref
PropertyLand
2,000
654
(1,346)
(67%)
1Land improvements
-
3,214
3,214
100%2
Total Land2,000
3,868
1,868
93%
Buildings3,069
3,494
425
14%
3Total Buildings
3,069
3,494
425
14%Total Property
5,069
7,362
2,293
45%
Plant and Equipment
Plant, machinery and equipment1,532
2,627
1,095
71%
4Computers and telecommunications
361
50
(311)
(86%)
5Art works
-
49
49
-
Total Plant and Equipment
1,893
2,726
832
44%
InfrastructureRoads
7,355
5,377
(1,978)
(27%)
6Bridges
41
880
839
2046%7
Footpaths and cycleways424
467
43
10%
8Drainage
491
458
(33)
(7%)
Recreational, leisure and community facilities
2,800
-
(2,800)
(100%)
9Resort and recreation reseve projects
250
-
(250)
(100%)
10W
aste management-
373
373
-
11
Off street car parks848
-
(848)
(100%
)12
Other infrastructure458
-
(458)
(100%
)13
Total Infrastructure12,667
7,555
(5,112)
(40%
)
Total Capital Works Expenditure
19,629
17,643
(1,987)
(10%)
Represented by:New asset expenditure
2,250
1,060
(1,190)
(53%)
Asset renewal expenditure11,653
12,254
601
5%
Asset expansion expenditure947
2,032
1,085
115%
Asset upgrade expenditure4,779
2,297
(2,482)
(52%
)Total Capital W
orks Expenditure19,629
17,643
(1,986)
(10%
)
(i) Explanation of material variations
ItemExplanation
1Land
2Land Improvements
Notes to the Financial ReportFor the Year Ended 30 June 2019
Variance Ref
Page 12 Budget includes land acquistion for Phillip Island recreation facility, timing of acquisition subject to legislated process. Budget has been carried forward to 2019/20 Current year expenditure relates to the acquisition of W
onthaggi depot site
Expenditure exceeds current year budget due to completion of large Jetty Triangle project brought forward from 2017/18

Bass Coast Shire Council Annual Report 2018/19
113
Our Finances
Our Finances
Bass Coast Shire Council2018/2019 Financial Report
Notes to the Financial ReportFor the Year Ended 30 June 2019
3Buildings
4Plant & Equipment
5Com
puters and Telecommunications
6Roads
7Bridges
8Pathways
9Recreational, leisure and community facilities
10Resort and recreation reserve projects
11W
aste Management
12Off street car parks
13Other infrastucture
Relates to multi year project Cowes Transit Centre in progress budgeted under car parks, costs reported per roads financial asset class
Variance due to large multi year project Pioneer Bay Roads & Drainage Special Charge Scheme
Variance due to delay in receiving goods for IT renewals program
Current year expenditure design costs for multi year projects open space, and boat ramp renewals carried over to 2019/20
Page 13 Expenditure exceeds current year budget due to continuing works brought forward from 2017/18 for Grantville Cell 7, and smaller E W
aste Storage project required per audit of facilities
Relates to design phase of multi year recreation reserve projects currently in progress
Expenditure exceeds current year budget due to completion of projects brought forward from 2017/18 including Dalyston Recreation Reserve, Bass Valley Childrens Centre, Phillip Island Football Netball Club Amenities Upgrade
Expenditure exceeds current year budget due to delay in orders fullfilled from 2017/18 plant and fleet renewal program
Expenditure exceeds current year budget due to completion of pathways renewal program brought forward from 2017/18 this year, and Bilson Street project Relates to multi year projects currently in progress (netball court renewals, skate parks, open space renewals)
Variance due to multi year project Bass Coast Rail Trail Bourne Creek Pedestrian Bridge Renewal brought forward from 2017/18
Bass Coast Shire Council Annual Report 2018/19
114
Our Finances
Our Finances
Model CouncilNote 2.1 Analysis of Council results by program
2.1 (a) Advocacy
Economic Developm
ent
Environment
Governance
Health and Wellbeing
Liveability
Our Character
Plan and deliver responsive services including the delivery of the Advocacy Strategy objectives and activities related to the Mayor, Councillors, Chief Executive and support.
Notes to the Financial Report2018/2019 Financial Report
For the Year Ended 30 June 2019
Council delivers its functions and activities through the following programs.
Page 14
The Economic Development area supports local businesses to build skills and develop operations in the community. This service is also responsible for developing and promoting tourism in the region including the provision of visitor services and coordinating Council involvement in local festivals and events.
The Environment service manages Council's waste and collection services with the aim to reduce waste to landfill. This service helps to maintain and improve the local natural environment by complying with environmental regulations, mitigating and adapting to the effects of climate change and providing environmental education to the community. In addition, it includes the management of coast and bushland reserves to ensure safe use and conservation of biodiversity.
Governance provides effective oversight of the organisation through performance reporting, financial management, risk management, information technology, human resources, facility management and customer service. Governance is also responsible for internal engagement and external communications with the community.
The Health and Wellbeing service includes providing a range of home and community care services for the aged
and disabled as well as providing support towards maternal and childrens health, kindergartens and housing support. This service also provides immunisation programs and the monitoring of health compliance within the community.
Liveability is responsible for the management of infrastructure activities including design, tender, supervision, preservation, protection, expansion and maintenance of Council assets. In addition the service develops leisure projects, recreational facilities and provides support to library services. Liveability ensures the municipality is prepared for responsibilities surrounding emergency, domestic animal and local law management in order to promote community safety and harmonious community relationships.
Our Character is responsible for maintaining open spaces, including parks, gardens, reserves, foreshores and sporting ovals. In addition it holds the responsibility to frame and respond to the challenges of social inclusion and provides support to community development, community grants and youth planning. This service is also responsible for managing the sustainable development and growth activities that develop the character of the municipality. This includes the assessment of building and planning permit applications, planning scheme amendments and ensuring the development across the shire is appropriately planned and controlled.
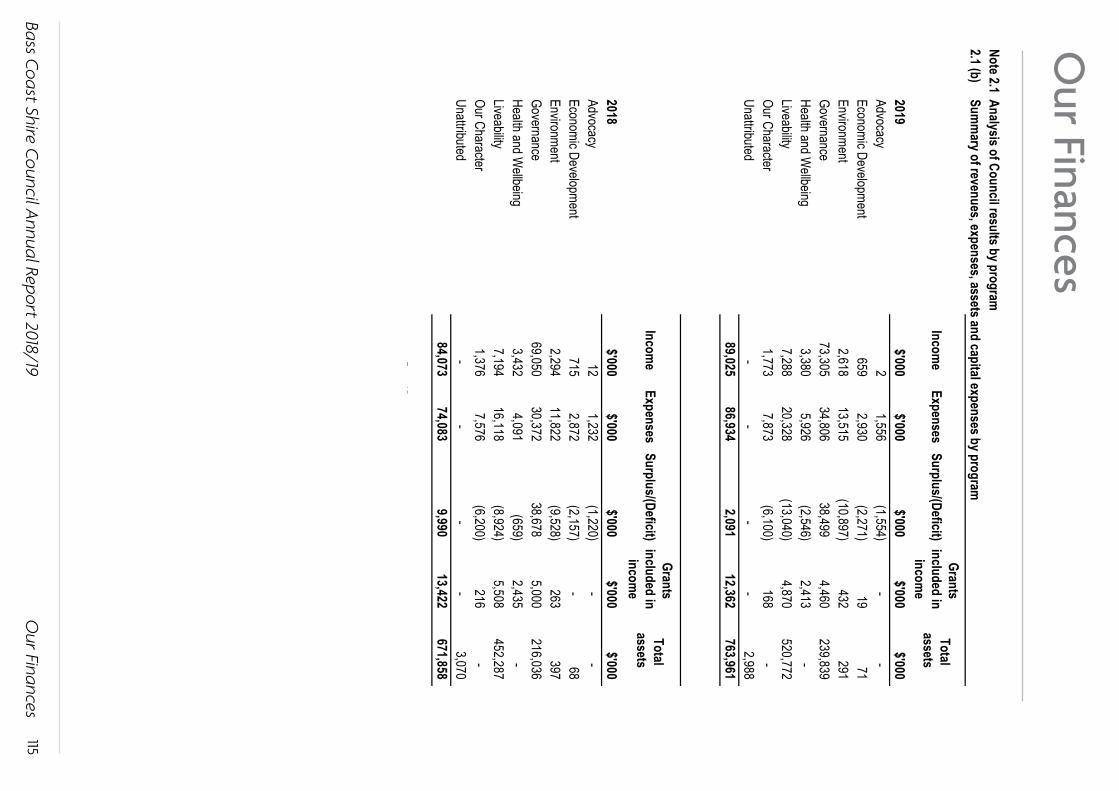
Bass Coast Shire Council Annual Report 2018/19
115
Our Finances
Our Finances
Model Council2018/2019 Financial Report
Note 2.1 Analysis of Council results by program
2.1 (b) Sum
mary of revenues, expenses, assets and capital expenses by program
Income
Expenses Surplus/(Deficit) Grants
included in incom
e
Total assets
2019$'000
$'000$'000
$'000$'000
Advocacy2
1,556
(1,554)
-
-
Economic Development
659
2,930
(2,271)
19
71
Environment2,618
13,515
(10,897)
432
291
Governance
73,305
34,806
38,499
4,460
239,839
Health and Wellbeing
3,380
5,926
(2,546)
2,413
-
Liveability7,288
20,328
(13,040)
4,870
520,772
Our Character
1,773
7,873
(6,100)
168
-
Unattributed-
-
-
-
2,988
89,025
86,934
2,091
12,362
763,961
Income
Expenses Surplus/(Deficit) Grants
included in incom
e
Total assets
2018$'000
$'000$'000
$'000$'000
Advocacy12
1,232
(1,220)
-
-
Economic Development
715
2,872
(2,157)
-
68
Environment2,294
11,822
(9,528)
263
397
Governance
69,050
30,372
38,678
5,000
216,036
Health and Wellbeing
3,432
4,091
(659)
2,435
-
Liveability7,194
16,118
(8,924)
5,508
452,287
Our Character
1,376
7,576
(6,200)
216
-
Unattributed-
-
-
-
3,070
84,073
74,083
9,990
13,422
671,858
Notes to the Financial ReportFor the Year Ended 30 June 2019
Page 15
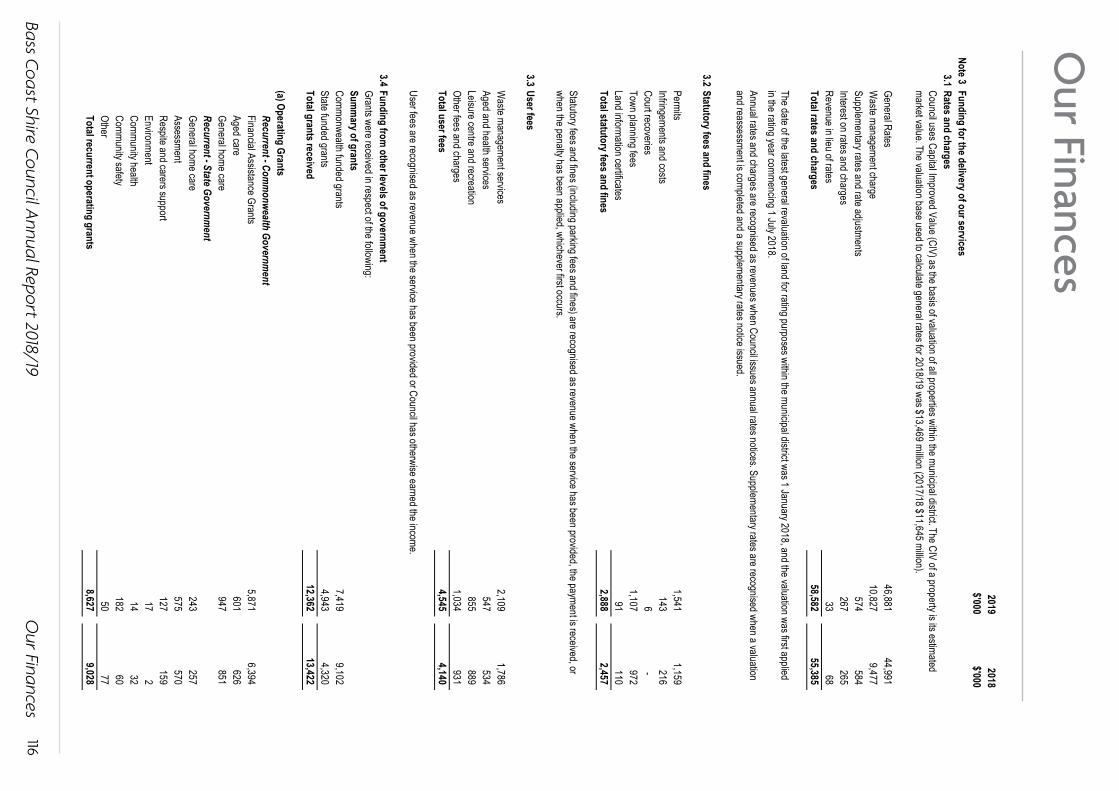
Bass Coast Shire Council Annual Report 2018/19
116
Our Finances
Our Finances
Bass Coast Shire CouncilNotes to the Financial Report
2018/2019 Financial ReportFor the Year Ended 30 June 2019
20192018
$'000$'000
Note 3 Funding for the delivery of our services3.1
Rates and charges
General Rates46,881
44,991
W
aste management charge10,827
9,477
Supplementary rates and rate adjustments
574
584
Interest on rates and charges267
265
Revenue in lieu of rates
33
68
Total rates and charges58,582
55,385
3.2Statutory fees and fines
Permits1,541
1,159
Infringements and costs
143
216
Court recoveries6
-
Town planning fees
1,107
972
Land information certificates91
110
Total statutory fees and fines
2,888
2,457
3.3User fees
Waste management services
2,109
1,786
Aged and health services547
534
Leisure centre and recreation
855
889
Other fees and charges1,034
931
Total user fees
4,545
4,140
3.4Funding from
other levels of government
Grants were received in respect of the following:Sum
mary of grants
Commonwealth funded grants7,419
9,102
State funded grants
4,943
4,320
Total grants received12,362
13,422
(a) Operating GrantsRecurrent - Com
monwealth Governm
entFinancial Assistance Grants
5,871
6,394
Aged care601
626
General home care
947
851
Recurrent - State Government
General home care243
257
Assessment
575
570
Respite and carers support127
159
Environment
17
2
Community health14
32
Community safety
182
60
Other50
77
Total recurrent operating grants
8,627
9,028
Council uses Capital Improved Value (CIV) as the basis of valuation of all properties within the municipal district. The CIV of a property is its estimated market value. The valuation base used to calculate general rates for 2018/19 was $13,469 million (2017/18 $11,645 million).
The date of the latest general revaluation of land for rating purposes within the municipal district was 1 January 2018, and the valuation was first applied in the rating year commencing 1 July 2018.Annual rates and charges are recognised as revenues when Council issues annual rates notices. Supplementary rates are recognised when a valuation and reassessment is completed and a supplementary rates notice issued.
Statutory fees and fines (including parking fees and fines) are recognised as revenue when the service has been provided, the payment is received, or when the penalty has been applied, whichever first occurs.
User fees are recognised as revenue when the service has been provided or Council has otherwise earned the income.
Page 16

Bass Coast Shire Council Annual Report 2018/19
117
Our Finances
Our Finances
Bass Coast Shire CouncilNotes to the Financial Report
2018/2019 Financial ReportFor the Year Ended 30 June 2019
20192018
$'000$'000
Non-recurrent - Comm
onwealth Government
Other-
17
Non-recurrent - State Governm
entEnvironment
267 300
Community safety
-
21
Drainage-
42
Footpaths and cycleways
-
34
Waste management
39
-
Family and children-
1
Recreation
453
989
Other105
100
Total non-recurrent operating grants
864
1,504
Total operating grants9,491
10,532
(b) Capital GrantsRecurrent - Com
monwealth Governm
entRoads to recovery
-
1,206
Total recurrent capital grants-
1,206
Non-recurrent - Com
monwealth Governm
entRecreation
-
8
Non-recurrent - State Government
Transport network1,061
695
Education
-
450
Recreation1,659
531
Other
151
-
Total non-recurrent capital grants2,871
1,684
Total capital grants
2,871
2,890
(c) Unspent grants received on condition that they be spent in a specific manner
Balance at start of year1,251
265
Received during the financial year and remained unspent at balance date
895
1,176
Received in prior years and spent during the financial year(1,126)
(190)
Balance at year end
1,020
1,251
3.5Contributions
Monetary1,144
734
Non-monetary
7,623
6,027
Total contributions8,767
6,761
Land Improvements71
77
Roads
4,294
3,154
Infrastructure3,258
2,796
Total non-m
onetary contributions7,623
6,027
Monetary and non monetary contributions are recognised as revenue when Council obtains control over the contributed asset.
Contributions of non monetary assets were received in relation to the following asset classes:
Page 17
Grant income is recognised when Council obtains control of the contribution. Control is normally obtained upon receipt (or acquittal).
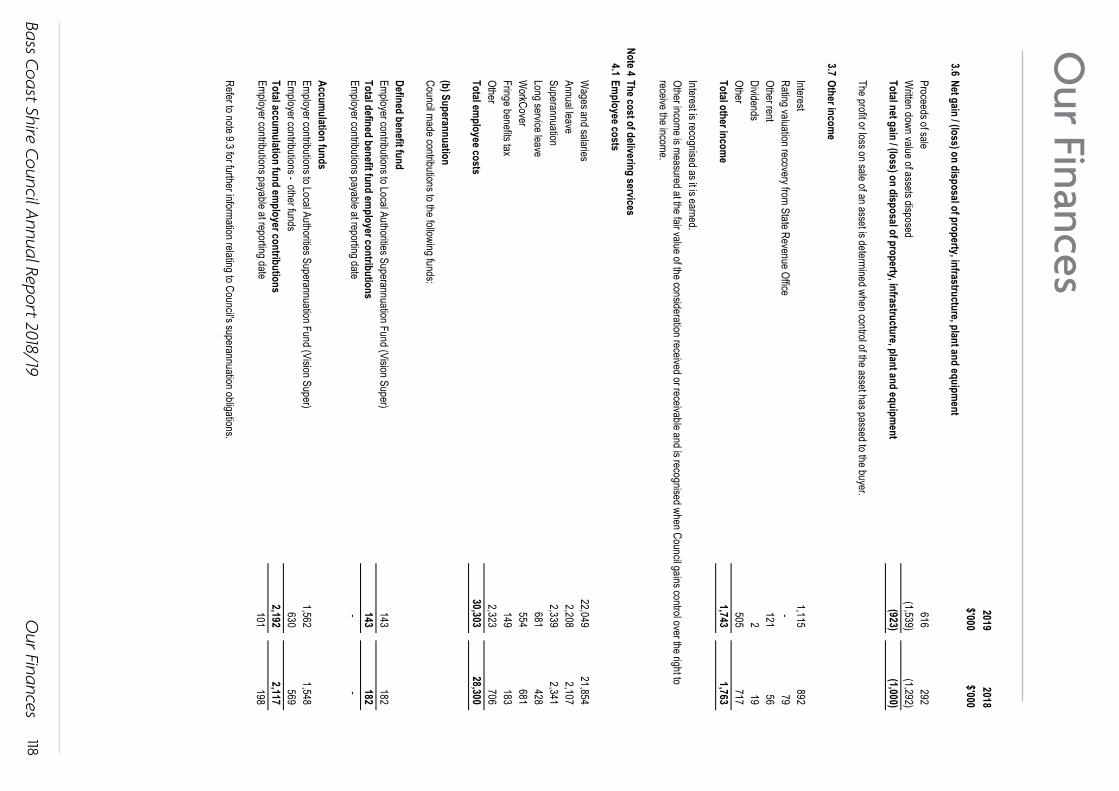
Bass Coast Shire Council Annual Report 2018/19
118
Our Finances
Our Finances
Bass Coast Shire CouncilNotes to the Financial Report
2018/2019 Financial ReportFor the Year Ended 30 June 2019
20192018
$'000$'000
3.6Net gain / (loss) on disposal of property, infrastructure, plant and equipm
ent
Proceeds of sale616
292
W
ritten down value of assets disposed(1,539)
(1,292)
Total net gain / (loss) on disposal of property, infrastructure, plant and equipm
ent(923)
(1,000)
3.7Other incom
e
Interest1,115
892
Rating valuation recovery from State Revenue Office
-
79
Other rent121
56
Dividends
2
19
Other505
717
Total other incom
e1,743
1,763
Note 4The cost of delivering services
4.1Em
ployee costs
Wages and salaries
22,049
21,854
Annual leave2,208
2,107
Superannuation
2,339
2,341
Long service leave681
428
W
orkCover554
681
Fringe benefits tax
149
183
Other2,323
706
Total em
ployee costs30,303
28,300
(b) SuperannuationCouncil made contributions to the following funds:
Defined benefit fundEmployer contributions to Local Authorities Superannuation Fund (Vision Super)
143
182
Total defined benefit fund employer contributions
143
182
Employer contributions payable at reporting date-
-
Accumulation funds
Employer contributions to Local Authorities Superannuation Fund (Vision Super)1,562
1,548
Employer contributions - other funds
630
569
Total accumulation fund em
ployer contributions2,192
2,117
Employer contributions payable at reporting date
101
198
Refer to note 9.3 for further information relating to Council's superannuation obligations.
Interest is recognised as it is earned.
Page 18
The profit or loss on sale of an asset is determined when control of the asset has passed to the buyer.
Other income is measured at the fair value of the consideration received or receivable and is recognised when Council gains control over the right to receive the income.

Bass Coast Shire Council Annual Report 2018/19
119
Our Finances
Our Finances
Bass Coast Shire CouncilNotes to the Financial Report
2018/2019 Financial ReportFor the Year Ended 30 June 2019
20192018
$'000$'000
4.2Materials and services
Contractor payments10,443
9,244
General maintenance
1,658
1,921
Utilities905
707
Information technology
1,502
1,719
Insurance559
574
Consultants
1,556
1,006
Banking and financing fees207
253
Subscriptions and memberships
192
222
Advertising172
256
Cost of goods sold
102
98
Legal and debt recovery977
573
Staff development and recruitment
749
699
Waste management
6,652
6,407
Library1,822
1,795
Property leases
275
347
Consumables1,224
713
Other
151
22
Total materials and services
29,146
26,556
4.3Depreciation and am
ortisation
Property2,683
2,675
Plant and equipment
1,124
1,138
Infrastructure10,377
9,905
Total depreciation
14,184
13,718
Intangible assets5,428
111
Total depreciation and am
ortisation19,612
13,829
Refer to note 5.2 (c) and 6.1 for a more detailed breakdown of depreciation and amortisation charges and accounting policy.
4.4Bad and doubtful debtsRates debtors
13
-
Other debtors(14)
300
Total bad and doubtful debts
(1)
300
Movement in provisions for doubtful debts
Balance at the beginning of the year342
42
New provisions recognised during the year
80
342
Amounts already provided for and written off as uncollectible(49)
-
Amounts provided for but recovered during the year
(99)
(42)
Balance at end of year274
342
4.5Borrowing costs
Interest - borrowings622
581
Total borrowing costs
622
581
Page 19
Provision for doubtful debt is recognised based on an expected credit loss model. This model considers both historic and forward looking information in determining the level of impairment.
Borrowing costs are recognised as an expense in the period in which they are incurred.

Bass Coast Shire Council Annual Report 2018/19
120
Our Finances
Our Finances
Bass Coast Shire CouncilNotes to the Financial Report
2018/2019 Financial ReportFor the Year Ended 30 June 2019
20192018
$'000$'000
4.6Other expenses
Landfill levy668
645
Land management rebate
611
612
Councillors' allowances309
301
Auditors' remuneration - VAGO - audit of the financial statements, performance statement and grant acquittals
57
118
Auditors' remuneration - Internal81
30
Fire services levy
78
75
Contributions to other organisations3,641
1,284
Operating lease rentals
7
20
Refund of unexpended grants-
3
Financing discount costs
847
429
Other30
-
Total other expenses
6,329
3,517
Note 5Our financial position
5.1Financial assets(a) Cash and cash equivalentsCash on hand
6
6
Cash at bank4,301
10,647
Term deposits
31,200
36,000
Total cash and cash equivalents35,507
46,653
(b) Other financial assetsTerm deposits - current
15,800
-
Shares in community bank40
40
Total other financial assets
15,840
40
Total financial assets51,347
46,693
- Trust funds and deposits (Note 5.3)4,283
3,798
- Statutory reserves (Note 9.1)
3,675
3,394
- Contractually restricted reserves (Note 9.1)1,068
1,422
Total restricted funds
9,026
8,614
Total unrestricted cash and cash equivalents 26,481
38,039
Intended allocations
- Cash held to fund carried forward capital works (Note 9.1)9,630
9,899
- Identified reserves (Note 9.1)
16,353
16,011
- Discretionary reserves (Note 9.1)12,826
11,361
Total funds subject to intended allocations
38,809
37,271
Page 20
Other financial assets are valued at fair value, at balance date. Term deposits are measured at original cost. Any unrealised gains and losses on holdings at balance date are recognised as either a revenue or expense.
Cash and cash equivalents include cash on hand, deposits at call, and other highly liquid investments with original maturities of 90 days or less, net of outstanding bank overdrafts.
Council's cash and cash equivalents are subject to external restrictions that limit amounts available for discretionary use. These include:
Although not externally restricted the following amounts have been allocated for specific future purposes by Council:

Bass Coast Shire Council Annual Report 2018/19
121
Our Finances
Our Finances
Bass Coast Shire CouncilNotes to the Financial Report
2018/2019 Financial ReportFor the Year Ended 30 June 2019
20192018
$'000$'000
(c) Trade and other receivables
CurrentStatutory receivables
Rates debtors2,977
2,106
Special rate assessment
549
609
Fire services levy debtors259
257
Net GST receivable
725
580
Non statutory receivablesOther debtors
1,952
2,246
Provision for doubtful debts - other debtors(274)
(292)
Total current trade and other receivables
6,188
5,506
Non-currentNon statutory receivables
Loans and advances to community organisations-
49
Provision for doubtful debts - other debtors
-
(49)
Total non-current trade and other receivables-
-
Total trade and other receivables
6,188
5,506
(d) Ageing of Receivables
Current (not yet due)1,219
1,761
Past due by up to 30 days
37
106
Past due between 31 and 180 days413
80
Past due between 181 and 365 days
62
7
Past due by more than 1 year221
-
Total trade & other receivables
1,952
1,954
(e) Ageing of individually impaired Receivables
Current (not yet due)-
49
Past due by up to 30 days
-
-
Past due between 31 and 180 days-
-
Past due between 181 and 365 days
79
116
Past due by more than 1 year195
176
Total trade & other receivables
274
341
Page 21
Short term receivables are carried at invoice amount. A provision for doubtful debts is recognised when there is objective evidence that an impairment has occurred. Long term receivables are carried at amortised cost using the effective interest rate method.
The ageing of the Council's trade & other receivables (excluding statutory receivables) that are not impaired was:
At balance date, non statutory receivables representing financial assets with a nominal value of $274K (2018: $341K) were impaired. The amount of the provision raised against these debtors was $274K (2018: $341K). They individually have been impaired as a result of their doubtful collection. Many of the long outstanding past due amounts have been lodged with Council's debt collectors or are on payment arrangements.
The ageing of receivables that have been individually determined as impaired at reporting date was:

Bass Coast Shire Council Annual Report 2018/19
122
Our Finances
Our Finances
Bass Coast Shire CouncilNotes to the Financial Report
2018/2019 Financial ReportFor the Year Ended 30 June 2019
20192018
5.2Non-financial assets
$'000$'000
(a) InventoriesInventories held for sale
71
67
Total inventories71
67
(b) Other assetsPrepayments
1,157
1,022
Accrued income152
95
Total other assets
1,309
1,117
(c) Intangible assetsLandfill air space
291
397
Total intangible assets291
397
Gross carrying amount
Balance at the beginning of the year1,213
1,213
Reestimation of gross carrying amount
5,322
-
Revaluation of asset due to change in cost estimates(3,787)
-
Balance at the end of the financial year
2,748
1,213
Accumulated am
ortisation and impairm
entBalance at the beginning of the year
816
705
Amortisation expense5,428
111
Revaluation of asset due to change in cost estimates
(3,787)
-
Balance at the end of the financial year2,457
816
Net book value at 30 June291
397
5.3Payables(a) Trade and other payablesTrade payables
5,958
4,188
Accrued expenses921
783
Prepaid income
94
-
Total trade and other payables6,973
4,971
(b) Trust funds and depositsRetention amounts
16
90
Monies held in trust646
626
Fire services levy
605
814
Refundable deposits3,016
2,268
Total trust funds and deposits
4,283
3,798
Inventories held for distribution are measured at cost, adjusted when applicable for any loss of service potential. All other inventories, including land held for sale, are measured at the lower of cost and net realisable value. W
here inventories are acquired for no cost or nominal consideration, they are measured at current replacement cost at the date of acquisition.
Intangible assets with finite lives are amortised as an expense on a systematic basis over the asset's useful life. Amortisation is generally calculated on a straight line basis, at a rate that allocates the asset value, less any estimated residual value over its estimated useful life. Estimates of the remaining useful lives and amortisation method are reviewed at least annually, and adjustments made where appropriate.
Amounts received as deposits and retention amounts controlled by Council are recognised as trust funds until they are returned, transferred in accordance with the purpose of the receipt, or forfeited. Trust funds that are forfeited, resulting in council gaining control of the funds, are to be recognised as revenue at the time of forfeit.
Refundable deposits - deposits are taken by council as a form of surety in a number of circumstances, including in relation to building works, tender deposits, contract deposits and the use of civic facilities.Fire Service Levy - Council is the collection agent for fire services levy on behalf of the State Government. Council remits amounts received on a quarterly basis. Amounts disclosed here will be remitted to the state government in line with that process.Retention Amounts - Council has a contractual right to retain certain am
ounts until a contractor has met certain requirements or a related warrant or defect period has elapsed. Subject to the satisfactory completion of the contractual obligations, or the elapsing of time, these amounts will be paid to the relevant contractor in line with Council's contractual obligations.
Page 22
Purpose and nature of items
Monies held in trust - this reflects funds held by Council on behalf of the San Remo and Wonthaggi cemetery trusts.

Bass Coast Shire Council Annual Report 2018/19
123
Our Finances
Our Finances
Bass Coast Shire CouncilNotes to the Financial Report
2018/2019 Financial ReportFor the Year Ended 30 June 2019
20192018
5.4Interest-bearing liabilities
$'000$'000
CurrentBorrowings - secured
14,196
5,641
Finance leases-
141
Total current interest-bearing liabilities
14,196
5,782
Non-currentBorrowings - secured
3,654
9,683
Total non-current interest-bearing liabilities3,654
9,683
Total interest-bearing liabilities
17,850
15,465
(a) The maturity profile for Council's borrowings is:
Not later than one year14,196
5,641
Later than one year and not later than five years
1,008
7,037
Later than five years2,646
2,646
Total borrowings
17,850
15,324
(b) The maturity profile for Council's finance lease liabilities is:
Not later than one year-
144
Total finance leases
-
144
Minimum future lease payments-
144
Less future finance charges
-
(3)
Present value of minim
um lease paym
ents-
141
5.5Provisions
Employee
Landfill restoration
Total2019
$ '000$ '000
$ '000Balance at beginning of the financial year
7,859
3,186
11,045
Additional provisions5,519
5,322
10,841
Amounts used
(3,553)
(67)
(3,620)
77
847
924
Balance at the end of the financial year9,902
9,288
19,190
2018Balance at beginning of the financial year
8,137
2,757
10,894
Additional provisions3,306
568
3,874
Amounts used
(3,561)
-
(3,561)
(23)
(139)
(162)
Balance at the end of the financial year7,859
3,186
11,045
IT hardware was leased on fixed lease payments for terms ranging from 4 to 5 years, ending in the 2018-19 financial year. Each lease had the option to purchase at the end of the lease term for $1.
Change in the discounted amount arising because of time and the effect of any change in the discount rate
Change in the discounted amount arising because of time and the effect of any change in the discount rate
Page 23
Borrowings are initially measured at fair value, being the cost of the interest bearing liabilities, net of transaction costs. The measurement basis subsequent to initial recognition depends on whether the Council has categorised its interest-bearing liabilities as either financial liabilities designated at fair value through the profit and loss, or financial liabilities at amortised cost. Any difference between the initial recognised amount and the redemption value is recognised in net result over the period of the borrowing using the effective interest method.The classification depends on the nature and purpose of the interest bearing liabilities. The Council determines the classification of its interest bearing liabilities at initial recognition.
Borrowings are secured against the rates and other income of Council.

Bass Coast Shire Council Annual Report 2018/19
124
Our Finances
Our Finances
Bass Coast Shire CouncilNotes to the Financial Report
2018/2019 Financial ReportFor the Year Ended 30 June 2019
20192018
(a) Employee provisions
$'000$'000
Current provisions expected to be wholly settled within 12 months
Annual leave1,891
1,915
Long service leave
1,440
825
Termination benefits2,014
212
Leave in lieu
251
185
Total current provisions expected to be wholly settled within 12 months
5,596
3,137
Current provisions expected to be wholly settled after 12 months
Annual leave540
598
Long service leave
2,618
2,866
Total current provisions expected to be wholly settled after 12 months
3,158
3,464
Total current employee provisions
8,754
6,601
Non-current Long service leave
1,148
1,258
Total non-current employee provisions
1,148
1,258
Aggregate carrying amount of em
ployee provisions:Current
8,754
6,601
Non-current1,148
1,258
Total aggregate carrying am
ount of employee provisions
9,902
7,859
Wages and salaries and annual leave
Key assumptions:2019
2018- discount rate (%
)0.95 - 1.32
1.91 - 2.63- index rate (%
)1.8 - 3.5
2.50 - 3.25- average settlement period
2.5 years2.4 years
(b) Landfill restorationCurrent
1,271
67
Non-current8,017
3,120
Total landfill restoration provision
9,288
3,187
Key assumptions:2019
2018- discount rate (%
)1.04 - 1.40
1.91 - 2.70- inflation rate (%
)2.00 - 2.50
2.25 - 2.50- estimated cost to rehabilitate ($'000)
7,713
2,752
- average settlement period14.1 years
11.7 years
Long service leave
The calculation of employee costs and benefits includes all relevant on-costs and are calculated as follows at reporting date.
Liabilities for wages and salaries, including non-monetary benefits, annual leave and accumulated sick leave expected to be wholly settled within
12 months of the reporting date are recognised in the provision for employee benefits in respect of employee services up to the reporting date, classified as current liabilities and measured at their nominal values.
Liabilities that are not expected to be wholly settled within 12 months of the reporting date are recognised in the provision for employee benefits as current liabilities, measured at the present value of the amounts expected to be paid when the liabilities are settled using the remuneration rate expected to apply at the time of settlement.
Council is obligated to restore Grantville landfill site to a particular standard. The forecast life of the site is based on current estimates of remaining capacity and the forecast rate of infill. The provision for landfill restoration has been calculated based on the present value of the expected cost of works to be undertaken. The expected cost of works has been estimated based on current understanding of work required to reinstate the site to a suitable standard. Accordingly, the estimation of the provision required is dependent on the accuracy of the forecast timing of the work, work required and related costs.
Page 24
Liability for long service leave (LSL) is recognised in the provision for employee benefits. LSL is measured at present value. Unconditional LSL is disclosed as a current liability. Conditional LSL that has been accrued, where an employee is yet to reach a qualifying term of employment, is discounted and disclosed as a non - current liability.
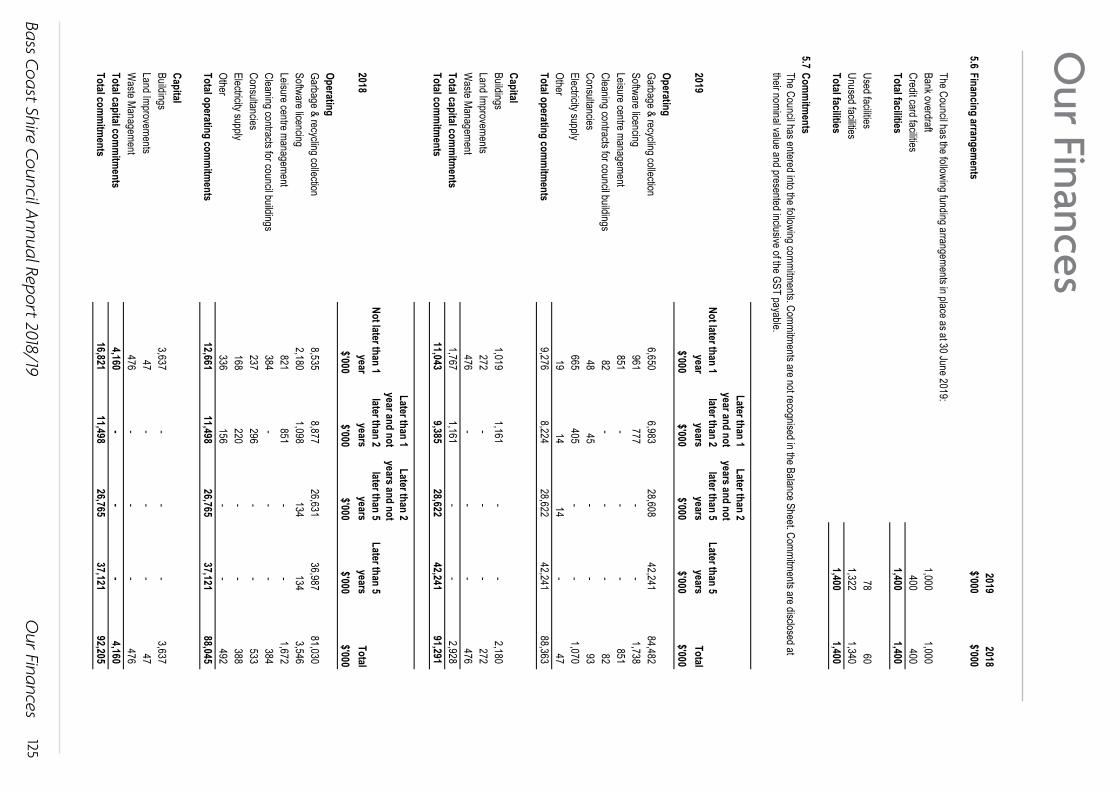
Bass Coast Shire Council Annual Report 2018/19
125
Our Finances
Our Finances
Bass Coast Shire CouncilNotes to the Financial Report
2018/2019 Financial ReportFor the Year Ended 30 June 2019
20192018
5.6Financing arrangem
ents$'000
$'000
The Council has the following funding arrangements in place as at 30 June 2019:Bank overdraft
1,000
1,000
Credit card facilities400
400
Total facilities
1,400
1,400
Used facilities78
60
Unused facilities
1,322
1,340
Total facilities1,400
1,400
5.7Com
mitm
ents
2019Not later than 1
year
Later than 1 year and not
later than 2 years
Later than 2 years and not
later than 5 years
Later than 5 years
Total$'000
$'000$'000
$'000$'000
OperatingGarbage & recycling collection
6,650
6,983
28,608
42,241
84,482
Software licencing961
777
-
-
1,738
Leisure centre management
851
-
-
-
851
Cleaning contracts for council buildings82
-
-
-
82
Consultancies
48
45
-
-
93
Electricity supply665
405
-
-
1,070
Other
19
14
14
-
47
Total operating comm
itments
9,276
8,224
28,622
42,241
88,363
CapitalBuildings
1,019
1,161
-
-
2,180
Land Improvements272
-
-
-
272
W
aste Management 476
-
-
-
476
Total capital com
mitm
ents1,767
1,161
-
-
2,928
Total com
mitm
ents11,043
9,385
28,622
42,241
91,291
2018Not later than 1
year
Later than 1 year and not
later than 2 years
Later than 2 years and not
later than 5 years
Later than 5 years
Total$'000
$'000$'000
$'000$'000
OperatingGarbage & recycling collection
8,535
8,877
26,631
36,987
81,030
Software licencing2,180
1,098
134
134
3,546
Leisure centre management
821
851
-
-
1,672
Cleaning contracts for council buildings384
-
-
-
384
Consultancies
237
296
-
-
533
Electricity supply168
220
-
-
388
Other
336
156
-
-
492
Total operating comm
itments
12,661
11,498
26,765
37,121
88,045
CapitalBuildings
3,637
-
-
-
3,637
Land Improvements47
-
-
-
47
W
aste Management 476
-
-
-
476
Total capital com
mitm
ents4,160
-
-
-
4,160
Total com
mitm
ents16,821
11,498
26,765
37,121
92,205
Page 25
The Council has entered into the following commitments. Commitments are not recognised in the Balance Sheet. Commitments are disclosed at their nominal value and presented inclusive of the GST payable.
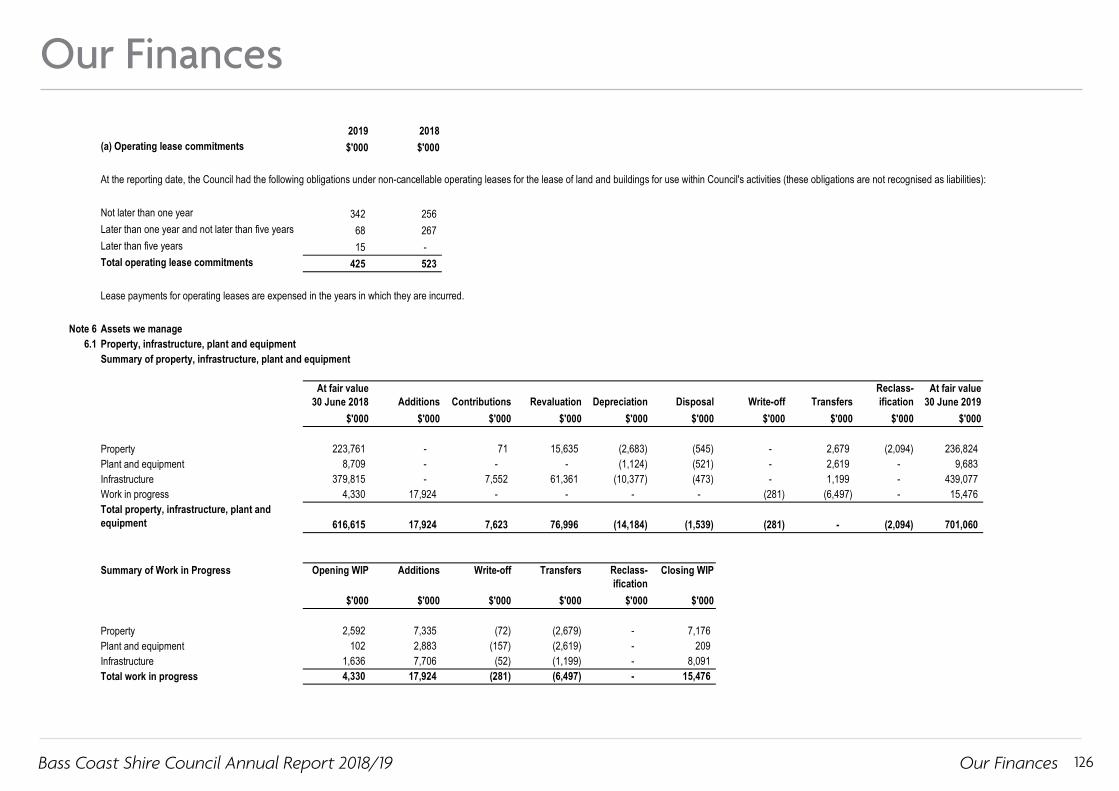
Bass Coast Shire Council Annual Report 2018/19 126
Our Finances
Our Finances
Bass Coast Shire Council Notes to the Financial Report2018/2019 Financial Report For the Year Ended 30 June 2019
2019 2018(a) Operating lease commitments $'000 $'000
Not later than one year 342 256 Later than one year and not later than five years 68 267 Later than five years 15 - Total operating lease commitments 425 523
Note 6 Assets we manage6.1 Property, infrastructure, plant and equipment
Summary of property, infrastructure, plant and equipment
At fair value 30 June 2018 Additions Contributions Revaluation Depreciation Disposal Write-off Transfers
Reclass-ification
At fair value 30 June 2019
$'000 $'000 $'000 $'000 $'000 $'000 $'000 $'000 $'000 $'000
Property 223,761 - 71 15,635 (2,683) (545) - 2,679 (2,094) 236,824 Plant and equipment 8,709 - - - (1,124) (521) - 2,619 - 9,683 Infrastructure 379,815 - 7,552 61,361 (10,377) (473) - 1,199 - 439,077 Work in progress 4,330 17,924 - - - - (281) (6,497) - 15,476 Total property, infrastructure, plant and equipment 616,615 17,924 7,623 76,996 (14,184) (1,539) (281) - (2,094) 701,060
Summary of Work in Progress Opening WIP Additions Write-off Transfers Reclass-ification
Closing WIP
$'000 $'000 $'000 $'000 $'000 $'000
Property 2,592 7,335 (72) (2,679) - 7,176 Plant and equipment 102 2,883 (157) (2,619) - 209 Infrastructure 1,636 7,706 (52) (1,199) - 8,091 Total work in progress 4,330 17,924 (281) (6,497) - 15,476
Lease payments for operating leases are expensed in the years in which they are incurred.
At the reporting date, the Council had the following obligations under non-cancellable operating leases for the lease of land and buildings for use within Council's activities (these obligations are not recognised as liabilities):
Page 26
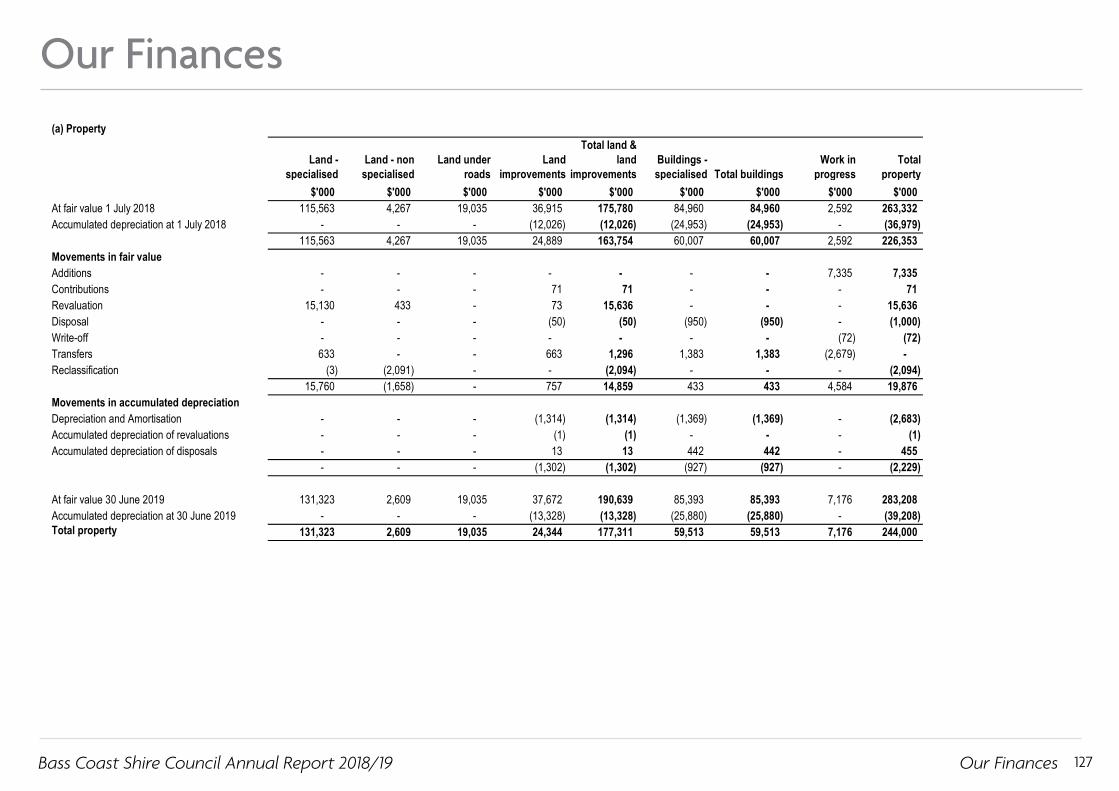
Bass Coast Shire Council Annual Report 2018/19 127
Our Finances
Our Finances
Bass Coast Shire Council Notes to the Financial Report2018/2019 Financial Report For the Year Ended 30 June 2019
(a) Property
Land - specialised
Land - non specialised
Land under roads
Land improvements
Total land & land
improvements Buildings - specialised Total buildings
Work in progress
Total property
$'000 $'000 $'000 $'000 $'000 $'000 $'000 $'000 $'000At fair value 1 July 2018 115,563 4,267 19,035 36,915 175,780 84,960 84,960 2,592 263,332 Accumulated depreciation at 1 July 2018 - - - (12,026) (12,026) (24,953) (24,953) - (36,979)
115,563 4,267 19,035 24,889 163,754 60,007 60,007 2,592 226,353 Movements in fair valueAdditions - - - - - - - 7,335 7,335 Contributions - - - 71 71 - - - 71 Revaluation 15,130 433 - 73 15,636 - - - 15,636 Disposal - - - (50) (50) (950) (950) - (1,000) Write-off - - - - - - - (72) (72) Transfers 633 - - 663 1,296 1,383 1,383 (2,679) - Reclassification (3) (2,091) - - (2,094) - - - (2,094)
15,760 (1,658) - 757 14,859 433 433 4,584 19,876 Movements in accumulated depreciationDepreciation and Amortisation - - - (1,314) (1,314) (1,369) (1,369) - (2,683) Accumulated depreciation of revaluations - - - (1) (1) - - - (1) Accumulated depreciation of disposals - - - 13 13 442 442 - 455
- - - (1,302) (1,302) (927) (927) - (2,229)
At fair value 30 June 2019 131,323 2,609 19,035 37,672 190,639 85,393 85,393 7,176 283,208 Accumulated depreciation at 30 June 2019 - - - (13,328) (13,328) (25,880) (25,880) - (39,208) Total property 131,323 2,609 19,035 24,344 177,311 59,513 59,513 7,176 244,000
Page 27

Bass Coast Shire Council Annual Report 2018/19 128
Our Finances
Our Finances
Bass Coast Shire Council Notes to the Financial Report2018/2019 Financial Report For the Year Ended 30 June 2019
(b) Plant and EquipmentPlant
machinery and
equipment
Fixtures fittings and
furnitureComputers and
telecomms Art worksWork in
progress
Total plant and
equipment$'000 $'000 $'000 $'000 $'000 $'000
At fair value 1 July 2018 10,589 1,470 1,369 3,788 102 17,318 Accumulated depreciation at 1 July 2018 (5,274) (1,312) (973) (948) - (8,507)
5,315 158 396 2,840 102 8,811 Movements in fair valueAdditions - - - - 2,883 2,883 Disposal (1,737) - - - - (1,737) Write-off - - - - (157) (157) Transfers 2,523 - - 96 (2,619) -
786 - - 96 107 989 Movements in accumulated depreciationDepreciation and Amortisation (917) (40) (122) (45) - (1,124) Accumulated depreciation of disposals 1,216 - - - - 1,216
299 (40) (122) (45) - 92
At fair value 30 June 2019 11,375 1,470 1,369 3,884 209 18,307 Accumulated depreciation at 30 June 2019 (4,975) (1,352) (1,095) (993) - (8,415) Total plant and equipment 6,400 118 274 2,891 209 9,892
Page 28

Bass Coast Shire Council Annual Report 2018/19 129
Our Finances
Our Finances
Bass Coast Shire Council Notes to the Financial Report2018/2019 Financial Report For the Year Ended 30 June 2019
(a) Property
Land - specialised
Land - non specialised
Land under roads
Land improvements
Total land & land
improvements Buildings - specialised Total buildings
Work in progress
Total property
$'000 $'000 $'000 $'000 $'000 $'000 $'000 $'000 $'000At fair value 1 July 2018 115,563 4,267 19,035 36,915 175,780 84,960 84,960 2,592 263,332 Accumulated depreciation at 1 July 2018 - - - (12,026) (12,026) (24,953) (24,953) - (36,979)
115,563 4,267 19,035 24,889 163,754 60,007 60,007 2,592 226,353 Movements in fair valueAdditions - - - - - - - 7,335 7,335 Contributions - - - 71 71 - - - 71 Revaluation 15,130 433 - 73 15,636 - - - 15,636 Disposal - - - (50) (50) (950) (950) - (1,000) Write-off - - - - - - - (72) (72) Transfers 633 - - 663 1,296 1,383 1,383 (2,679) - Reclassification (3) (2,091) - - (2,094) - - - (2,094)
15,760 (1,658) - 757 14,859 433 433 4,584 19,876 Movements in accumulated depreciationDepreciation and Amortisation - - - (1,314) (1,314) (1,369) (1,369) - (2,683) Accumulated depreciation of revaluations - - - (1) (1) - - - (1) Accumulated depreciation of disposals - - - 13 13 442 442 - 455
- - - (1,302) (1,302) (927) (927) - (2,229)
At fair value 30 June 2019 131,323 2,609 19,035 37,672 190,639 85,393 85,393 7,176 283,208 Accumulated depreciation at 30 June 2019 - - - (13,328) (13,328) (25,880) (25,880) - (39,208) Total property 131,323 2,609 19,035 24,344 177,311 59,513 59,513 7,176 244,000
Page 27

Bass Coast Shire Council Annual Report 2018/19 130
Our Finances
Our Finances
Bass Coast Shire Council Notes to the Financial Report2018/2019 Financial Report For the Year Ended 30 June 2019
(c) Infrastructure
Roads
Pathways, cycleways and
trails Bridges DrainageWaste
management
Water sensitive
urban designWork in
progressTotal
infrastructure$'000 $'000 $'000 $'000 $'000 $'000 $'000 $'000
At fair value 1 July 2018 357,267 34,578 41,882 94,124 4,523 7,485 1,636 541,495 Accumulated depreciation at 1 July 2018 (120,886) (7,832) (12,399) (15,669) (1,771) (1,487) - (160,044)
236,381 26,746 29,483 78,455 2,752 5,998 1,636 381,451 Movements in fair valueAdditions - - - - - - 7,706 7,706 Contributions 4,294 1,623 26 1,609 - - - 7,552 Revaluation (9,970) (50) 154 14 - 21 - (9,831) Disposal (439) (174) - (8) - - - (621) Write-off - - - - - - (52) (52) Transfers 450 281 208 227 - 33 (1,199) -
(5,665) 1,680 388 1,842 - 54 6,455 4,754 Movements in accumulated depreciationDepreciation and Amortisation (7,626) (688) (426) (981) (420) (236) - (10,377) Accumulated depreciation of revaluations 71,171 21 - - - - - 71,192 Accumulated depreciation of disposals 93 54 - 1 - - - 148
63,638 (613) (426) (980) (420) (236) - 60,963
At fair value 30 June 2019 351,602 36,258 42,270 95,966 4,523 7,539 8,091 546,249 Accumulated depreciation at 30 June 2019 (57,248) (8,445) (12,825) (16,649) (2,191) (1,723) - (99,081) Total infrastructure 294,354 27,813 29,445 79,317 2,332 5,816 8,091 447,168
Page 29

Bass Coast Shire Council Annual Report 2018/19
131
Our Finances
Our Finances
Bass Coast Shire CouncilNotes to the Financial Report
2018/2019 Financial ReportFor the Year Ended 30 June 2019
Acquisition
Asset recognition thresholds and depreciation periodsDepreciation
periodThreshold
limit
Years$'000
Land & land improvem
ents Land
-
-
Land under roads-
-
Land improvements
15 - 1805
Buildings Buildings (long and short life components)
10 - 20010
Plant and Equipm
ent Plant, machinery and equipment
5 - 1010
Fixtures, fittings and furniture
3 - 105
Computers and telecommunications
3 - 105
Art works
20 - 1005
Infrastructure Roads
12 - Indefinite10
Bridges and major culverts
50 - 10010
Pathways, cycleways and trails
15 - 601 - 3
Drainage25 - 100
1 - 5 W
aste management7 -15
10
Water sensitive urban design
25 - 20010
Intangible assets Landfill airspace
3 - 2010
Land under roadsCouncil recognises land under roads it controls at fair value.
Depreciation and amortisation
Finance leases
Repairs and maintenance
Road earthworks are not depreciated on the basis that they are assessed as not having a limited useful life.Straight line depreciation is charged based on the residual useful life as determined each year.Depreciation periods used are listed below and are consistent with the prior year unless otherwise stated.
Page 30
Leases of assets where substantially all the risks and rewards incidental to ownership of the asset are transferred to the Council are classified as finance leases. Finance leases are capitalised, recording an asset and a liability at the lower of the fair value of the asset and the present value of the minimum lease payments, including any guaranteed residual value. Lease payments are allocated between the reduction of the lease liability and the interest expense. Leased assets are depreciated on a straight line basis over their estimated useful lives to the Council where it is likely that the Council will obtain ownership of the asset or over the term of the lease, whichever is the shorter. Leased assets were fully amortised at 30 June 2019.
Routine maintenance, repair costs, and minor renewal costs are expensed as incurred. Where the repair relates to the replacement of a component of an
asset and the cost exceeds the capitalisation threshold the cost is capitalised and depreciated. The carrying value of the replaced asset is expensed.
The purchase method of accounting is used for all acquisitions of assets, being the fair value of assets provided as consideration at the date of acquisition plus any incidental costs attributable to the acquisition. Fair value is the price that would be received to sell an asset (or paid to transfer a liability) in an orderly transaction between market participants at the measurement date.
Where assets are constructed by Council, cost includes all materials used in construction, direct labour, and an appropriate share of directly attributable
variable overheads.In accordance with Council's policy, the threshold limits have applied when recognising assets within an applicable asset class and unless otherwise stated are consistent with the prior year.
Buildings, land improvements, plant and equipment, infrastructure, and other assets having limited useful lives are systematically depreciated over their useful lives to the Council in a manner which reflects consumption of the service potential embodied in those assets. Estimates of remaining useful lives and residual values are made on a regular basis with major asset classes reassessed annually. Depreciation rates and methods are reviewed annually.
Where assets have separate identifiable components that are subject to regular replacement, these components are assigned distinct useful lives and
residual values and a separate depreciation rate is determined for each component.

Bass Coast Shire Council Annual Report 2018/19
132
Our Finances
Our Finances
Bass Coast Shire CouncilNotes to the Financial Report
2018/2019 Financial ReportFor the Year Ended 30 June 2019
Valuation of land and buildings
Level 1Level 2
Level 3Date of Valuation
Land - specialised-
-
131,323
06/2019
Land - non specialised-
2,609
-
06/2019
Land under roads-
-
19,035
06/2013
Land improvements-
-
24,344
10/2017
Buildings - specialised-
-
59,513
06/2017
Total-
2,609
234,215
Valuation of plant and equipment
Level 1Level 2
Level 3Date of Valuation
Plant machinery and equipment-
-
6,400
-
Fixtures fittings and furniture
-
-
118
-
Computers and telecomms-
-
274
-
Art works
-
-
2,891
10/2017Total
-
-
9,683
Valuation of infrastructure
Level 1Level 2
Level 3Date of Valuation
Roads-
-
294,354
07/2018
Pathways, cycleways and trails-
-
27,813
07/2017
Bridges-
-
29,445
06/2015
Drainage-
-
79,317
06/2015
Waste management
-
-
2,332
06/2015W
ater sensitive urban design-
-
5,816
06/2015
Total-
-
439,077
The last valuation of land was undertaken by a qualified independent valuer, R. Anthony AAPI (valuer registration no. 1432) at 30 June 2013. An indexed based revaluation of land was conducted as at 30 June 2019. This valuation was based on the compounded impact of the movement in the land indices published by the Valuer-General Victoria since the last indexed revaluation undertaken in 2017. A review of land value indice movements over the last year has confirmed that the valuation as at 30 June 2019 materially reflects the fair value of this land.
The last valuation of buildings was undertaken by qualified independent valuers, L. Black AAPI (registered valuer no. 2913) and D. Griggs AAPI (registered valuer no. 3204) at 30 June 2017. The valuation was amended in October 2017 to reflect new buildings and updated condition assessments as at 30 June 2017 due to works conducted between the valuer's site visit and 30 June 2017. The valuation of buildings is at fair value, being the price that would be received to sell an asset in an orderly transaction between market participants.
Any significant movements in the unobservable inputs for land and land under roads will have a significant impact on the fair value of these assets.
Valuation of Land Improvements has been determined in accordance with an independent valuation undertaken by Assetic Pty Ltd at 31 October 2017.
The date of the current valuation is detailed in the following table. An indexed based revaluation was conducted in the current year, this valuation was based on land indices published by the Valuer-General-Victoria, a full revaluation of these assets will be conducted in 2019/20.
Details of the Council’s infrastructure and information about the fair value hierarchy as at 30 June 2019 are as follows:
Specialised land is valued at fair value using site values adjusted for englobo (undeveloped and/or unserviced) characteristics, access rights and private interests of other parties and entitlements of infrastructure assets and services. This adjustment is an unobservable input in the valuation. The adjustment has no impact on the comprehensive income statement.
The valuation of land is at fair value, being market value based on highest and best use permitted by relevant land planning provisions. Where land use is
restricted through existing planning provisions the valuation is reduced to reflect this limitation. This adjustment is an unobservable input in the valuation. The adjustment has no impact on the comprehensive income statement.
Valuation of pathways, cycleways and trails has been determined in accordance with an independent valuation undertaken by Assetic Pty Ltd at 1 July 2017.The date of the current valuation is detailed in the following table.
The valuation of infrastructure assets is at fair value based on replacement cost less accumulated depreciation as at the date of valuation.
Page 31
Details of the Council’s land and buildings and information about the fair value hierarchy as at 30 June 2019 are as follows:
The valuation of plant and equipment, except for art works, is at fair value based on cost less accumulated depreciation as at the balance sheet date.Valuation of artworks has been determined in accordance with an independent valuation undertaken by Assetic Pty Ltd at 31 October 2017.The date of the current valuation is detailed in the following table.
Details of the Council’s plant and equipment and information about the fair value hierarchy as at 30 June 2019 are as follows:

Bass Coast Shire Council Annual Report 2018/19
133
Our Finances
Our Finances
Bass Coast Shire CouncilNotes to the Financial Report
2018/2019 Financial ReportFor the Year Ended 30 June 2019
20192018
Reconciliation of specialised land$'000
$'000Land under roads
19,035
19,035
Parks and reserves80,942
71,952
Community facilities
18,462
16,609
Car parks13,775
12,133
Civic centres
9,736
8,364
Caravan parks6,625
5,459
Transfer stations and landfill sites
1,785
1,045
Total specialised land150,360
134,597
Reconciliation of non specialised landResidential zoned land
1,750
2,398
Commercial zoned land859
1,869
Total non specialised land
2,609
4,267
6.2Non current assets classified as held for sale
Land - specialised transferred from property (refer Note 6.1)3
-
Land - non specialised transferred from property (refer Note 6.1)
2,091
-
Total non current assets classified as held for sale2,094
-
Specialised buildings are valued using a depreciated replacement cost technique. Significant unobservable inputs include the current replacement cost and remaining useful lives of buildings. Current replacement cost is calculated on a square metre basis and ranges from $200 to $8,500 per square metre. The remaining useful lives of buildings are determined on the basis of the current condition of buildings and vary from 10 years to 200 years. Replacement cost is sensitive to changes in market conditions, with any increase or decrease in cost flowing through to the valuation. Useful lives of buildings are sensitive to changes in expectations or requirem
ents that could either shorten or extend the useful lives of buildings.
Page 32
Infrastructure assets are valued based on the depreciated replacement cost. Significant unobservable inputs include the current replacement cost and remaining useful lives of infrastructure. The remaining useful lives of infrastructure assets are determined on the basis of the current condition of the asset and vary from 7 years to an indefinite number of years. Replacement cost is sensitive to changes in market conditions, with any increase or decrease in cost flowing through to the valuation. Useful lives of infrastructure are sensitive to changes in use, expectations or requirements that could either shorten or extend the useful lives of infrastructure assets.
Description of significant unobservable inputs into level 3 valuationsSpecialised land and land under roads is valued using a market based direct comparison technique. Significant unobservable inputs include the extent and impact of restriction of use and the market cost of land per square metre. The extent and impact of restrictions on use varies and results in a reduction to surrounding land values between 5%
and 98%. The market value of land varies significantly depending on the location of the land and the current market
conditions. Currently land values range between $1 and $119 per square metre.
Non-current assets classified as held for sale (including disposal groups) are measured at the lower of its carrying amount and fair value less costs of
disposal, and are not subject to depreciation. Non-current assets, disposal groups and related liabilities and assets are treated as current and classified as held for sale if their carrying amount will be recovered through a sale transaction rather than through continuing use. This condition is regarded as met only when the sale is highly probable and the asset's sale (or disposal group sale) is expected to be completed within 12 months from the date of classification.

Bass Coast Shire Council Annual Report 2018/19
134
Our Finances
Our Finances
Bass Coast Shire CouncilNotes to the Financial Report
2018/2019 Financial ReportFor the Year Ended 30 June 2019
20192018
$'000$'000
6.3Investm
ents in associates
(a) Investments in associates
Investments in associates accounted for by the equity method are: - W
est Gippsland Regional Library Corporation1,601
1,463
West Gippsland Regional Library Corporation
Background
1,601
1,463
Council's share of accumulated surplus
Council's share of accumulated surplus at start of year1,127
984
Reported surplus for year
141
136
Change in proportion of equity (based on agreement)(76)
7
Council's share of accum
ulated surplus at end of year1,192
1,127
Council's share of reserves
Council's share of reserves at start of year336
334
Transfers to other reserves
181
-
Change in proportion of reserves (based on agreement)(108)
2
Council's share of reserves at end of year
409
336
Movement in carrying value of specific investm
entCarrying value of investment at start of year
1,463
1,318
Share of surplus for year141
136
Share of transfers to other reserves
181
-
Change in proportion of equity(184)
9
Carrying value of investm
ent at end of year1,601
1,463
Council's share of expenditure com
mitm
entsOperating commitments
9
14
Capital commitments-
-
Council's share of expenditure com
mitm
ents9
14
Comm
ittees of managem
ent
The Council has a 36.02% interest in the W
est Gippsland Regional Library Corporation, which operates a library service for a number of municipalities.
Fair value of Council's investment in W
est Gippsland Regional Library Corporation
All entities controlled by Council that have material revenues, expenses, assets or liabilities, such as committees of management, have been included in this financial report. Any transactions between these entities and Council have been eliminated in full.
Page 33
Associates are all entities over which Council has significant influence but not control or joint control. Investments in associates are accounted for using the equity method of accounting, after initially being recognised at cost.
At balance date, there were no contingent liabilities and contingent assets (2018:$nil).

Bass Coast Shire Council Annual Report 2018/19
135
Our Finances
Our Finances
Bass Coast Shire CouncilNotes to the Financial Report
2018/2019 Financial ReportFor the Year Ended 30 June 2019
20192018
Note 7People and relationships
No.No.
7.1Council and key m
anagement rem
uneration
(a) Related PartiesParent entityBass Coast Shire Council
AssociatesW
est Gippsland Regional Library Corporation
Interests in subsidiaries and associates are detailed in Note 6.3.
(b) Key Management Personnel
CouncillorsCouncillor Pamela Rothfield (Mayor 16 November 2016 - 14 November 2018) 16 November 2016 - 30 June 2018)Councillor Brett Tessari (Mayor 14 November 2018 - 30 June 2019)Councillor Bruce Kent (4 November 2016 - 30 June 2018)Councillor Clare Le Serve (4 November 2016 - 30 June 2018)Councillor Geoff Ellis (4 November 2016 - 30 June 2018)Councillor Julian Brown (4 November 2016 - 30 June 2018)Councillor Les Larke (4 November 2016 - 30 June 2018)Councillor Michael W
helan (4 November 2016 - 30 June 2018)Councillor Stephen Fullarton (4 November 2016 - 30 June 2018)Chief Executive OfficerGeneral Manager Corporate and CommunityGeneral Manager Advocacy, Economy and LiveabilityGeneral Manager Infrastructure and EnvironmentExecutive Manager, Finance
Total Number of Councillors
9
9
Chief Executive Officer and other Key Management Personnel
8
6
Total Key Management Personnel
17
15
20192018
(c) Remuneration of Key Managem
ent Personnel$'000
$'000Total remuneration of Key Management Personnel was as follows:Short-term benefits
1,815
1,684
Long-term benefits285
267
Termination benefits
244
212
Total2,344
2,163
20192018
No.No.
8
8
$50,000 - $59,9992
-
$60,000 - $69,999
1
-
$90,000 - $99,999-
1
$120,000 - $129,000
-
-
$130,000 - $139,9992
-
$140,000 - $149,999
-
1
$160,000 - $169,999-
1
$220,000 - $229,999
-
1
$230,000 - $239,999-
1
$240,000 - $249,999
-
1
$260,000 - $269,9991
-
$280,000 - $289,000
1
-
$290,000 - $299,0001
-
$310,000 - $319,000
1
-
$330,000 - $339,999-
1
17
15
Page 34
Details of persons holding the position of Councillor or other members of Key Management Personnel at any time during the year are:
The total Key Management Personnel above are not full time equivalent employees but are the number of people that have been in a key management position during the period. The full time equivalent (FTE) of the Chief Executive Officer and other Key Management Personnel at 30 June 2019 was 4.8 FTE (30 June 2018 5.5 FTE).
The numbers of Key Management Personnel whose total remuneration from Council and any related entities, fall within the following bands:$20,000 - $29,999

Bass Coast Shire Council Annual Report 2018/19
136
Our Finances
Our Finances
Bass Coast Shire CouncilNotes to the Financial Report
2018/2019 Financial ReportFor the Year Ended 30 June 2019
20192018
(d) Senior Officer Remuneration
No.No.
The number of Senior Officers are shown below in their relevant income bands:
-
1
2
6
1
3
2
1
2
-
1
-
8
11
20192018
$'000$'000
1,397
1,435
7.2Related party disclosure
Rent paidCouncillor Julian Brown
283
252
Library contributionsW
est Gippsland Regional Library Corporation1,822
1,795
Total transactions with related parties
2,105
2,047
The rent is for commercial property with a lease term of 7 years. The arrangement is on normal commercial terms.
258
481
Total comm
itments to related parties
258
481
The library contribution is made to the West Gippsland Regional Library Corporation to operate the library service for a number of municipalities.
Further details of this arrangement are provided in Note 6.3.
(a) Transactions with related parties During the period Council entered into the following related party transactions:
Total Remuneration for the reporting year for Senior Officers included above, amounted to:
$150,000 - $159,999$160,000 - $169,999$170,000 - $179,999
A Senior Officer is an officer of Council,other than Key Management Personnel, who: a) has management responsibilities and reports directly to the Chief Executive; orb) whose total annual remuneration exceeds $148,000
Income Range:$148,000 - $149,999
$180,000 - $189,999$190,000 - $199,999
Rent
Page 35
(c) Loans to/from related parties
(d) Comm
itments to/from
related parties
(b) Outstanding balances with related parties
No loans have been made, guaranteed or secured by Council to a responsible person of Council, or a related party of a responsible person during the reporting period (2018: $nil).
There were no outstanding balances payable from Council to related parties at the end of the reporting period in relation to transactions with related parties.
The aggregate amount of commitments in existence at balance date that have been made, guaranteed or secured by the council to a related party are as follows:
The senior officers above are not full time equivalent employees but are the number of people that have been in a senior officer position during the period. The full time equivalent (FTE) of senior officers at 30 June 2019 was 7.0 FTE (30 June 2018 11.0 FTE).

Bass Coast Shire Council Annual Report 2018/19
137
Our Finances
Our Finances
Bass Coast Shire CouncilNotes to the Financial Report
2018/2019 Financial ReportFor the Year Ended 30 June 2019
Note 8Managing uncertainties
8.1Contingent assets and liabilities
(a) Contingent assetsDeveloper contributions
(b) Contingent liabilitiesSuperannuation
Future superannuation contributions
Landfill
Legal matters
Public liability and professional indemnity
Liability Mutual Insurance
20192018
(c) Guarantees for loans to other entities$'000
$'000Department of Sustainability and Environment
5 5
Phillip Island Nature Parks 350
350 Environmental Protection Agency
811 811
Financial guarantee contracts are not recognised as a liability in the balance sheet unless the lender has exercised their right to call on the guarantee or Council has other reasons to believe that it is probable that the right will be exercised.
Page 36
The amount disclosed for financial guarantee in this note is the nominal amount of the underlying loan that is guaranteed by the Council, not the fair value of the financial guarantee.
Contingent assets and contingent liabilities are not recognised in the Balance Sheet, but are disclosed and if quantifiable, are measured at nominal value. Contingent assets and liabilities are presented inclusive of GST receivable or payable, respectively.
Council operates a landfill site, and has provided for the potential obligation to carry out site rehabilitation works in the future as outlined in Note 5.5.
Council has no recognised contingent liabilities relating to public liability or professional indemnity. In the event of a claim and a judgement against Council, it is anticipated that Council's insurer would cover the claim, with Council contributing the policy excess only.
The expected contributions to be paid to the Defined Benefit category of Vision Super for the year ending 30 June 2020 are $82K.
Estimated developer contributions to be received in respect of estates currently under development: $22,198K (2018 $21,699K).
Council is presently involved in confidential legal matters, currently being conducted through Council's solicitors. As this is yet to be finalised, and the financial outcome is unable to be reliably estimated, no allowance for any contingency has been made in the financial report.
In addition to the disclosed contributions, Bass Coast Shire Council has not paid any unfunded liability payments to Vision Super during the 2018/19 year (2017/18 $Nil). There were no contributions outstanding and no loans issued from or to the above schemes as at 30 June 2019.
Council has obligations under a defined benefit superannuation scheme that may result in the need to make additional contributions to the scheme, matters relating to this potential obligation are outlined below. As a result of the volatility in financial markets the likelihood of making such contributions in future periods exists.
Council also has a number of closed landfill sites and will have to carry out site rehabilitation works in the future. At balance date Council is unable to accurately assess the financial implications of such works for these closed sites.
Council is a participant of the MAV Liability Mutual Insurance (LMI) Scheme. The LMI scheme provides public liability and professional indemnity insurance cover. The LMI scheme states that each participant will remain liable to make further contributions to the scheme in respect of any insurance year in which it was a participant to the extent of its participant’s share of any shortfall in the provision set aside in respect of that insurance year, and such liability will continue whether or not the participant remains a participant in future insurance years.

Bass Coast Shire Council Annual Report 2018/19
138
Our Finances
Our Finances
Bass Coast Shire CouncilNotes to the Financial Report
2018/2019 Financial ReportFor the Year Ended 30 June 2019
8.2
Income of Not-for-Profit Entities (AASB 1058 ) (applies 2019/20)
8.3Financial instrum
ents(a) Objectives and policies
(b) Market risk
Interest rate risk
- diversification of investment product; - monitoring of return on investment; and - benchmarking of returns and comparison with budget.
Interest rate movements have not been sufficiently significant during the year to have an impact on the Council's year end result.
Council has elected to adopt the modified retrospective approach to the transition to the new lease standard. This will mean that only existing operating leases for non low value assets, with remaining terms greater than 12 months, will be recognised on transition (1 July 2019). Based on our current lease commitments and an assumption of a continuation of the current leasing arrangements Council expects that the transition to the new standard will see the initial recognition of $120,000 in lease related assets and an equivalent liability.
Leases (AASB 16) (applies 2019/20)
Change in accounting standardsThe following new AAS's have been issued that are not mandatory for the 30 June 2019 reporting period. Council has assessed these pending standards and has identified the following potential impacts will flow from the application of these standards in future reporting periods.Revenue from
contracts with customers (AASB 15) (applies 2019/20 for Local Governm
ent sector)The standard shifts the focus from the transaction-level to a contract-based approach. Recognition is determined based on what the customer expects to be entitled to (rights and obligations), while measurem
ent encompasses estimation by the entity of the amount expected to be entitled for performing under the contract. The full impact of this standard is not known, it is most likely to impact where contracts extend over time, where there are rights and obligations that may vary the timing or amount of the consideration, or where there are multiple performance elements. This has the potential to impact on the recognition of certain grant income. An estimation of the effect of this standard on next year's results is a reduction in income of $1,450,000 and a corresponding liability increase.
Amendm
ents to Australian Accounting Standards – Deferral of AASB 15 for Not-for-Profit Entities (AASB 2016-7) (applies 2019/20)This Standard defers the mandatory effective date of AASB 15 for not-for-profit entities from 1 January 2018 to 1 January 2019.
The classification of leases as either finance leases or operating leases is eliminated for lessees. Leases will be recognised in the Balance Sheet by capitalising the present value of the minimum lease payments and showing a ‘right-of-use’ asset, while future lease payments will be recognised as a financial liability. The nature of the expense recognised in the profit or loss will change. Rather than being shown as rent, or as leasing costs, it will be recognised as depreciation on the ‘right-of-use’ asset, and an interest charge on the lease liability. The interest charge will be calculated using the effective interest method, which will result in a gradual reduction of interest expense over the lease term.
This standard replaces AASB 1004 Contributions and establishes revenue recognition principles for transactions where the consideration to acquire an asset is significantly less than fair value to enable to not-for-profit entity to further its objectives. There is no expected impact on next year's financial position as a result of this standard change.
The Council's principal financial instruments comprise cash assets, term deposits, receivables (excluding statutory receivables), payables (excluding statutory payables) and bank borrowings. Details of the significant accounting policies and methods adopted, including the criteria for recognition, the basis of measurement and the basis on which income and expenses are recognised, in respect of each class of financial asset, financial liability and equity instrument is disclosed in the Notes of the financial statements. Risk management is carried out by senior management under policies approved by the Council. These policies include identification and analysis of the risk exposure to Council and appropriate procedures, controls and risk minimisation.
Market risk is the risk that the fair value or future cash flows of Council financial instruments will fluctuate because of changes in market prices. The Council's exposure to market risk is primarily through interest rate risk with only insignificant exposure to other price risks and no exposure to foreign currency risk.
Interest rate risk refers to the risk that the value of a financial instrument or cash flows associated with the instrument will fluctuate due to changes in market interest rates. Council's interest rate liability risk arises primarily from long term loans and borrowings at fixed rates which exposes Council to fair value interest rate risk. Cash flow interest rate risk is the risk that the future cash flows of a financial instrument will fluctuate because of changes in market interest rates. Council has minimal exposure to cash flow interest rate risk through its cash and deposits that are at floating rates.
Investment of surplus funds is made with approved financial institutions under the Local Government Act 1989. Council manages interest
rate risk by adopting an investment policy that ensures:
There has been no significant change in the Council's exposure, or its objectives, policies and processes for managing interest rate risk or the methods used to measure this risk from the previous reporting period.
Page 37
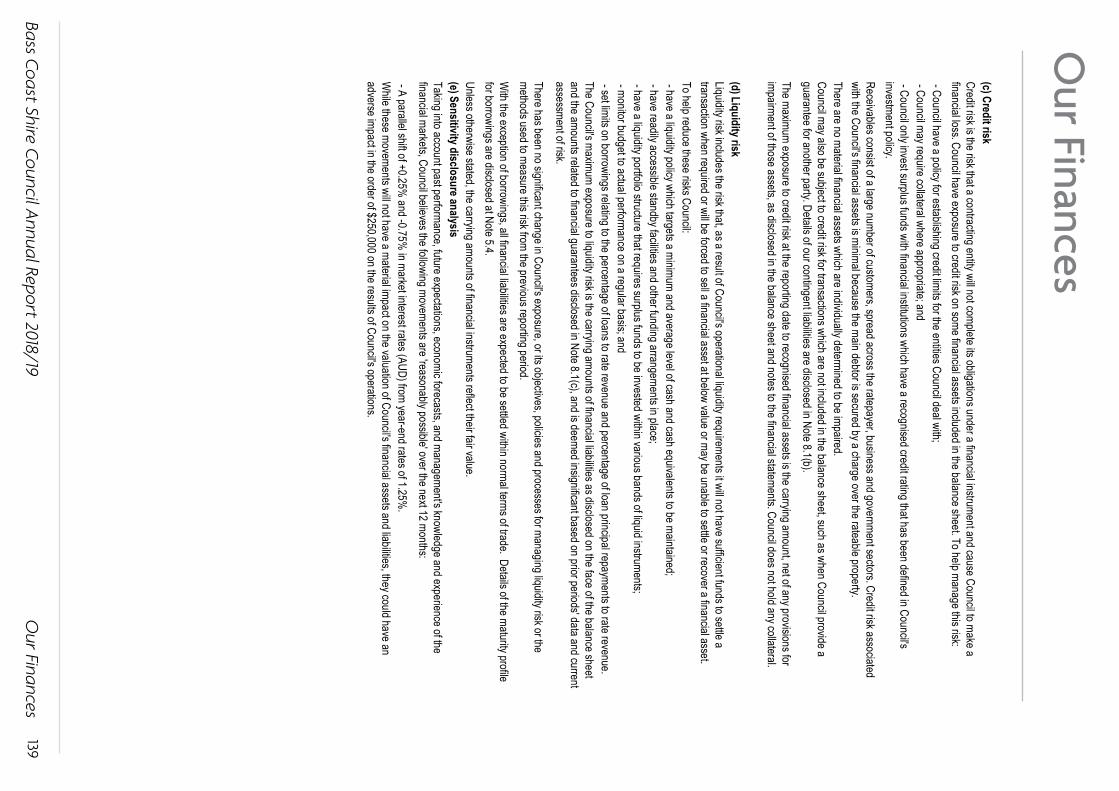
Bass Coast Shire Council Annual Report 2018/19
139
Our Finances
Our Finances
Bass Coast Shire CouncilNotes to the Financial Report
2018/2019 Financial ReportFor the Year Ended 30 June 2019
(c) Credit risk
- Council have a policy for establishing credit limits for the entities Council deal with; - Council may require collateral where appropriate; and
There are no material financial assets which are individually determined to be impaired.
(d) Liquidity risk
(e) Sensitivity disclosure analysis
Page 38
Council may also be subject to credit risk for transactions which are not included in the balance sheet, such as when Council provide a guarantee for another party. Details of our contingent liabilities are disclosed in Note 8.1(b).
Liquidity risk includes the risk that, as a result of Council's operational liquidity requirements it will not have sufficient funds to settle a transaction when required or will be forced to sell a financial asset at below value or may be unable to settle or recover a financial asset.To help reduce these risks Council: - have a liquidity policy which targets a minimum and average level of cash and cash equivalents to be maintained; - have readily accessible standby facilities and other funding arrangements in place; - have a liquidity portfolio structure that requires surplus funds to be invested within various bands of liquid instruments;
Unless otherwise stated, the carrying amounts of financial instruments reflect their fair value.
Credit risk is the risk that a contracting entity will not complete its obligations under a financial instrument and cause Council to make a financial loss. Council have exposure to credit risk on some financial assets included in the balance sheet. To help manage this risk:
- Council only invest surplus funds with financial institutions which have a recognised credit rating that has been defined in Council's investment policy.Receivables consist of a large number of customers, spread across the ratepayer, business and government sectors. Credit risk associated with the Council's financial assets is minimal because the main debtor is secured by a charge over the rateable property.
The maximum exposure to credit risk at the reporting date to recognised financial assets is the carrying amount, net of any provisions for impairment of those assets, as disclosed in the balance sheet and notes to the financial statements. Council does not hold any collateral.
Taking into account past performance, future expectations, economic forecasts, and management's knowledge and experience of the financial markets, Council believes the following movements are 'reasonably possible' over the next 12 months:
- A parallel shift of +0.25% and -0.75%
in market interest rates (AUD) from year-end rates of 1.25%.
While these movements will not have a material impact on the valuation of Council's financial assets and liabilities, they could have an
adverse impact in the order of $250,000 on the results of Council's operations.
- monitor budget to actual performance on a regular basis; and - set limits on borrowings relating to the percentage of loans to rate revenue and percentage of loan principal repayments to rate revenue.The Council's maximum exposure to liquidity risk is the carrying amounts of financial liabilities as disclosed on the face of the balance sheet and the amounts related to financial guarantees disclosed in Note 8.1(c), and is deemed insignificant based on prior periods' data and current assessment of risk.
There has been no significant change in Council's exposure, or its objectives, policies and processes for managing liquidity risk or the methods used to measure this risk from the previous reporting period.W
ith the exception of borrowings, all financial liabilities are expected to be settled within normal terms of trade. Details of the maturity profile for borrowings are disclosed at Note 5.4.
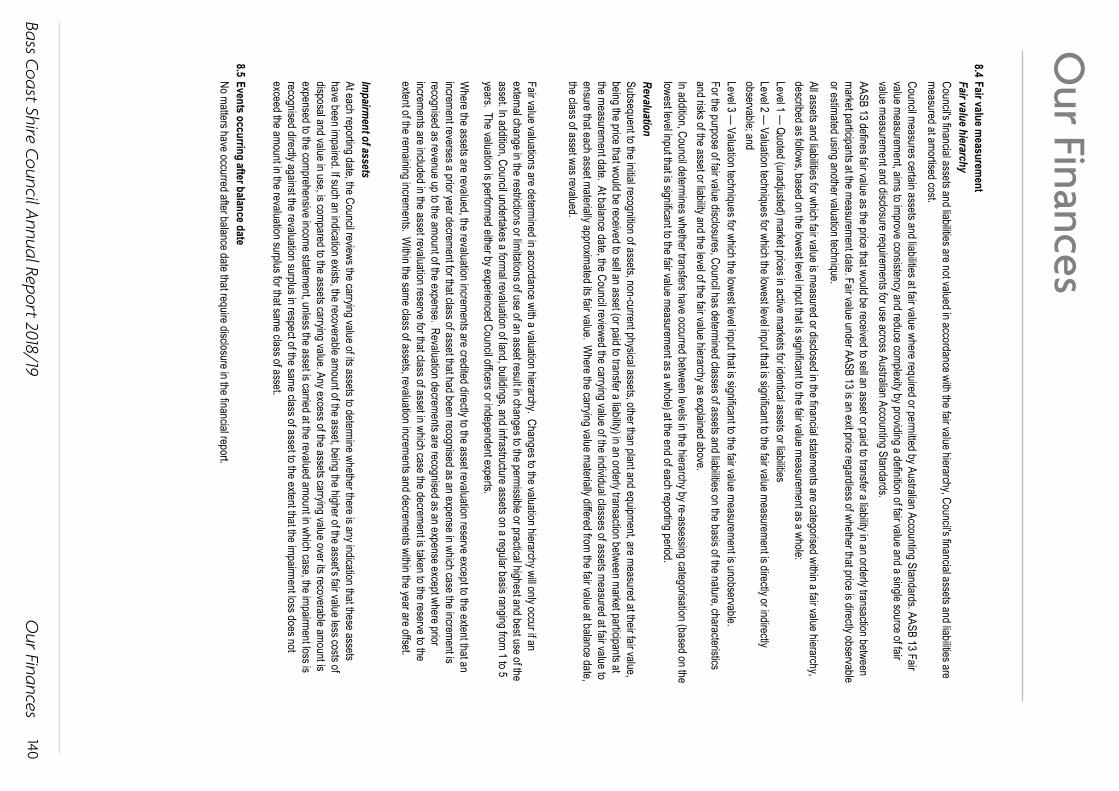
Bass Coast Shire Council Annual Report 2018/19
140
Our Finances
Our Finances
Bass Coast Shire CouncilNotes to the Financial Report
2018/2019 Financial ReportFor the Year Ended 30 June 2019
8.4Fair value m
easurement
Revaluation
Impairm
ent of assets
8.5Events occurring after balance date
Page 39
Level 3 — Valuation techniques for which the lowest level input that is significant to the fair value measurement is unobservable.
Fair value hierarchyCouncil's financial assets and liabilities are not valued in accordance with the fair value hierarchy, Council's financial assets and liabilities are measured at amortised cost. Council measures certain assets and liabilities at fair value where required or permitted by Australian Accounting Standards. AASB 13 Fair value measurement, aims to improve consistency and reduce complexity by providing a definition of fair value and a single source of fair value measurement and disclosure requirements for use across Australian Accounting Standards.AASB 13 defines fair value as the price that would be received to sell an asset or paid to transfer a liability in an orderly transaction between market participants at the measurement date. Fair value under AASB 13 is an exit price regardless of whether that price is directly observable or estimated using another valuation technique.
All assets and liabilities for which fair value is measured or disclosed in the financial statements are categorised within a fair value hierarchy, described as follows, based on the lowest level input that is significant to the fair value measurement as a whole:Level 1 —
Quoted (unadjusted) market prices in active markets for identical assets or liabilitiesLevel 2 —
Valuation techniques for which the lowest level input that is significant to the fair value measurement is directly or indirectly observable; and
For the purpose of fair value disclosures, Council has determined classes of assets and liabilities on the basis of the nature, characteristics and risks of the asset or liability and the level of the fair value hierarchy as explained above.In addition, Council determines whether transfers have occurred between levels in the hierarchy by re-assessing categorisation (based on the lowest level input that is significant to the fair value measurement as a whole) at the end of each reporting period.
Subsequent to the initial recognition of assets, non-current physical assets, other than plant and equipment, are measured at their fair value, being the price that would be received to sell an asset (or paid to transfer a liability) in an orderly transaction between market participants at the measurement date. At balance date, the Council reviewed the carrying value of the individual classes of assets measured at fair value to ensure that each asset materially approximated its fair value. W
here the carrying value materially differed from the fair value at balance date, the class of asset was revalued.
Fair value valuations are determined in accordance with a valuation hierarchy. Changes to the valuation hierarchy will only occur if an external change in the restrictions or limitations of use of an asset result in changes to the permissible or practical highest and best use of the asset. In addition, Council undertakes a formal revaluation of land, buildings, and infrastructure assets on a regular basis ranging from 1 to 5 years. The valuation is performed either by experienced Council officers or independent experts.
Where the assets are revalued, the revaluation increments are credited directly to the asset revaluation reserve except to the extent that an
increment reverses a prior year decrement for that class of asset that had been recognised as an expense in which case the increment is recognised as revenue up to the am
ount of the expense. Revaluation decrements are recognised as an expense except where prior increments are included in the asset revaluation reserve for that class of asset in which case the decrement is taken to the reserve to the extent of the remaining increments. W
ithin the same class of assets, revaluation increments and decrements within the year are offset.
At each reporting date, the Council reviews the carrying value of its assets to determine whether there is any indication that these assets have been impaired. If such an indication exists, the recoverable amount of the asset, being the higher of the asset's fair value less costs of disposal and value in use, is compared to the assets carrying value. Any excess of the assets carrying value over its recoverable amount is expensed to the comprehensive income statement, unless the asset is carried at the revalued amount in which case, the impairment loss is recognised directly against the revaluation surplus in respect of the sam
e class of asset to the extent that the impairment loss does not exceed the amount in the revaluation surplus for that same class of asset.
No matters have occurred after balance date that require disclosure in the financial report.
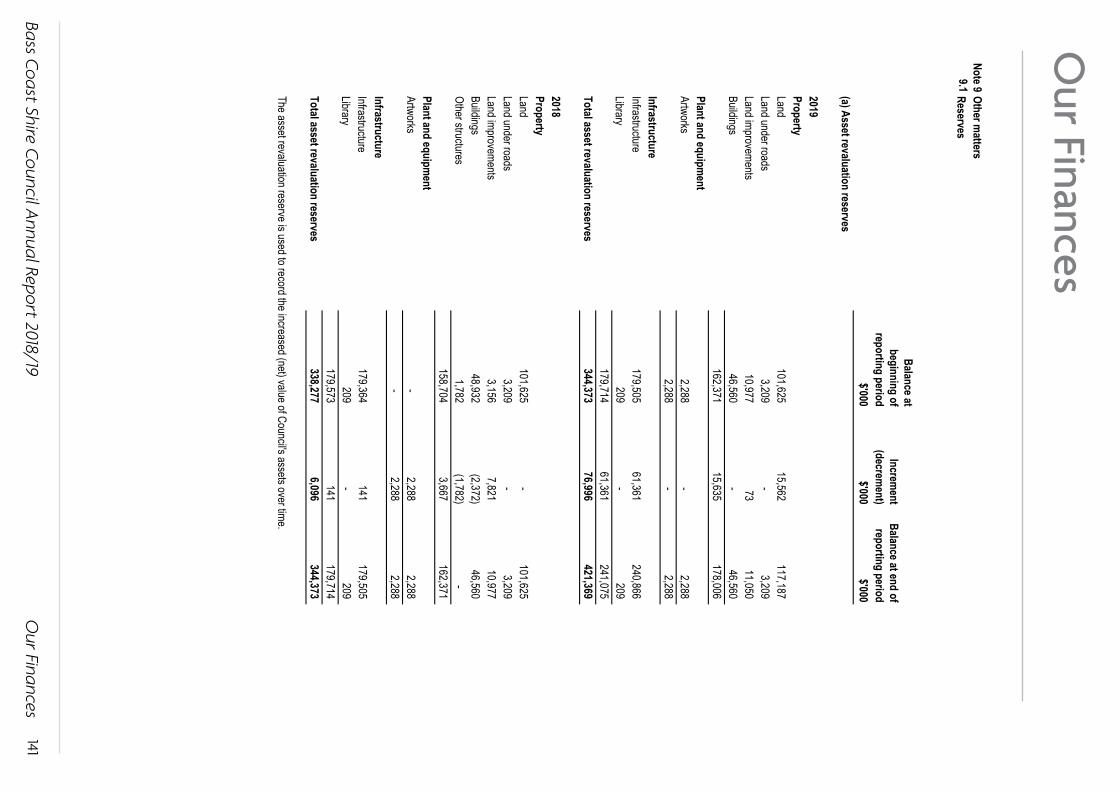
Bass Coast Shire Council Annual Report 2018/19
141
Our Finances
Our Finances
Bass Coast Shire CouncilNotes to the Financial Report
2018/2019 Financial ReportFor the Year Ended 30 June 2019
Note 9Other m
atters9.1
Reserves
Balance atbeginning of
reporting periodIncrem
ent (decrem
ent)Balance at end of reporting period
$'000$'000
$'000(a) Asset revaluation reserves
2019PropertyLand
101,625
15,562
117,187
Land under roads3,209
-
3,209
Land improvements
10,977
73
11,050
Buildings46,560
-
46,560
162,371
15,635
178,006
Plant and equipm
entArtworks
2,288
-
2,288
2,288
-
2,288
InfrastructureInfrastructure
179,505
61,361
240,866
Library209
-
209
179,714
61,361
241,075
Total asset revaluation reserves
344,373
76,996
421,369
2018PropertyLand
101,625
-
101,625
Land under roads3,209
-
3,209
Land improvements
3,156
7,821
10,977
Buildings48,932
(2,372)
46,560
Other structures
1,782
(1,782)
-
158,704
3,667
162,371
Plant and equipment
Artworks-
2,288
2,288
-
2,288
2,288
InfrastructureInfrastructure
179,364
141
179,505
Library209
-
209
179,573
141
179,714
Total asset revaluation reserves
338,277
6,096
344,373
The asset revaluation reserve is used to record the increased (net) value of Council's assets over time.
Page 40
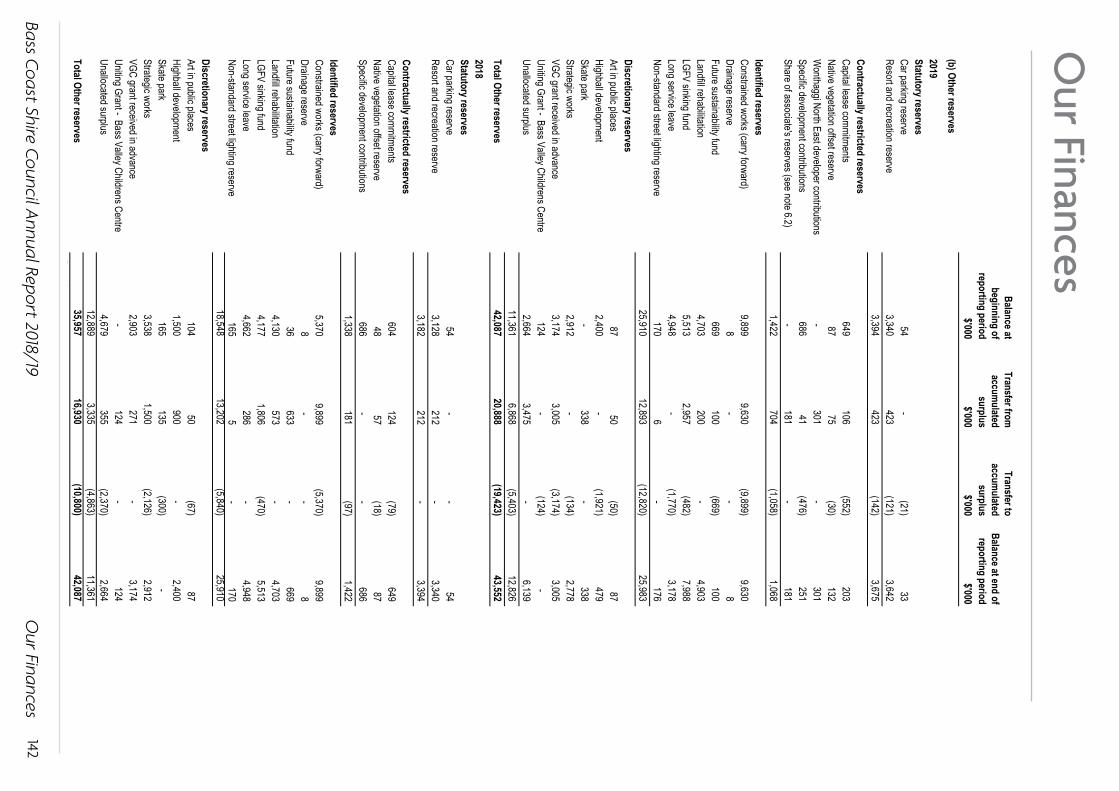
Bass Coast Shire Council Annual Report 2018/19
142
Our Finances
Our Finances
Bass Coast Shire CouncilNotes to the Financial Report
2018/2019 Financial ReportFor the Year Ended 30 June 2019
Balance atbeginning of
reporting period
Transfer from
accumulated
surplus
Transfer to accum
ulated surplus
Balance at end of reporting period
$'000$'000
$'000$'000
(b) Other reserves2019Statutory reservesCar parking reserve
54
-
(21)
33
Resort and recreation reserve3,340
423
(121)
3,642
3,394
423
(142)
3,675
Contractually restricted reservesCapital lease commitments
649
106
(552)
203
Native vegetation offset reserve87
75
(30)
132
W
onthaggi North East developer contributions-
301
-
301
Specific development contributions
686
41
(476)
251
Share of associate's reserves (see note 6.2)-
181
-
181
1,422
704
(1,058)
1,068
Identified reservesConstrained works (carry forward)
9,899
9,630
(9,899)
9,630
Drainage reserve8
-
-
8
Future sustainability fund
669
100
(669)
100
Landfill rehabilitation4,703
200
-
4,903
LGFV sinking fund
5,513
2,957
(482)
7,988
Long service leave4,948
-
(1,770)
3,178
Non-standard street lighting reserve
170
6
-
176
25,910
12,893
(12,820)
25,983
Discretionary reservesArt in public places
87
50
(50)
87
Highball development2,400
-
(1,921)
479
Skate park
-
338
-
338
Strategic works2,912
-
(134)
2,778
VGC grant received in advance
3,174
3,005
(3,174)
3,005
Uniting Grant - Bass Valley Childrens Centre124
-
(124)
-
Unallocated surplus
2,664
3,475
-
6,139
11,361
6,868
(5,403)
12,826
Total Other reserves 42,087
20,888
(19,423)
43,552
2018Statutory reservesCar parking reserve
54
-
-
54
Resort and recreation reserve3,128
212
-
3,340
3,182
212
-
3,394
Contractually restricted reservesCapital lease commitments
604
124
(79)
649
Native vegetation offset reserve48
57
(18)
87
Specific development contributions
686
-
-
686
1,338
181
(97)
1,422
Identified reservesConstrained works (carry forward)
5,370
9,899
(5,370)
9,899
Drainage reserve8
-
-
8
Future sustainability fund
36
633
-
669
Landfill rehabilitation4,130
573
-
4,703
LGFV sinking fund
4,177
1,806
(470)
5,513
Long service leave4,662
286
-
4,948
Non-standard street lighting reserve
165
5
-
170
18,548
13,202
(5,840)
25,910
Discretionary reservesArt in public places
104
50
(67)
87
Highball development1,500
900
-
2,400
Skate park
165
135
(300)
-
Strategic works3,538
1,500
(2,126)
2,912
VGC grant received in advance
2,903
271
-
3,174
Uniting Grant - Bass Valley Childrens Centre-
124
-
124
Unallocated surplus
4,679
355
(2,370)
2,664
12,889
3,335
(4,863)
11,361
Total Other reserves 35,957
16,930
(10,800)
42,087
Page 41
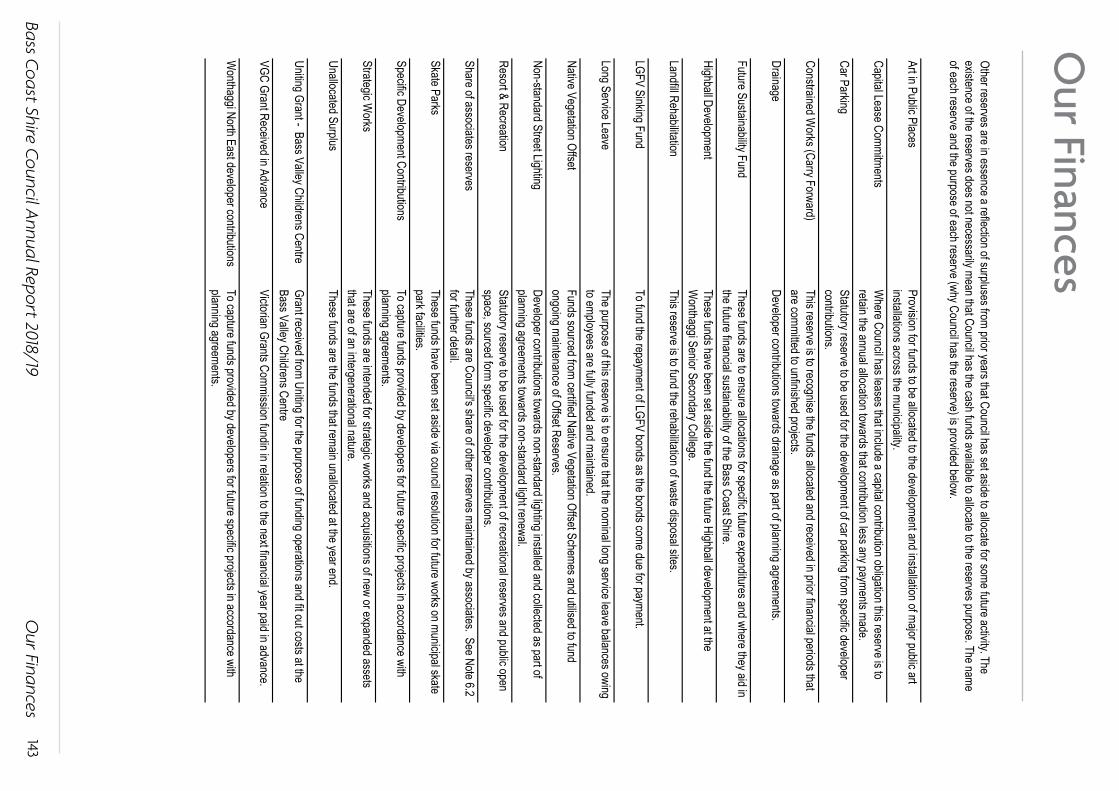
Bass Coast Shire Council Annual Report 2018/19
143
Our Finances
Our Finances
Bass Coast Shire CouncilNotes to the Financial Report
2018/2019 Financial ReportFor the Year Ended 30 June 2019
Art in Public Places
Capital Lease Commitments
Car Parking
Constrained Works (Carry Forward)
Drainage
Future Sustainability Fund
Highball Development
Landfill Rehabilitation
LGFV Sinking Fund
Long Service Leave
Native Vegetation Offset
Non-standard Street Lighting
Resort & Recreation
Share of associates reserves
Skate Parks
Specific Development Contributions
Strategic Works
Unallocated Surplus
Uniting Grant - Bass Valley Childrens Centre
VGC Grant Received in Advance
Wonthaggi North East developer contributions
Developer contributions towards drainage as part of planning agreements.
These funds are to ensure allocations for specific future expenditures and where they aid in the future financial sustainability of the Bass Coast Shire.
Grant received from Uniting for the purpose of funding operations and fit out costs at the Bass Valley Childrens Centre
These funds have been set aside the fund the future Highball development at the W
onthaggi Senior Secondary College.This reserve is to fund the rehabilitation of waste disposal sites.
Other reserves are in essence a reflection of surpluses from prior years that Council has set aside to allocate for some future activity. The existence of the reserves does not necessarily mean that Council has the cash funds available to allocate to the reserves purpose. The name of each reserve and the purpose of each reserve (why Council has the reserve) is provided below.
Provision for funds to be allocated to the development and installation of major public art installations across the municipality.W
here Council has leases that include a capital contribution obligation this reserve is to retain the annual allocation towards that contribution less any payments made.Statutory reserve to be used for the development of car parking from specific developer contributions.This reserve is to recognise the funds allocated and received in prior financial periods that are committed to unfinished projects.
To capture funds provided by developers for future specific projects in accordance with planning agreements.
These funds are Council's share of other reserves maintained by associates. See Note 6.2 for further detail.
Page 42
Victorian Grants Commission fundin in relation to the next financial year paid in advance.
These funds are the funds that remain unallocated at the year end.
To fund the repayment of LGFV bonds as the bonds come due for payment.
The purpose of this reserve is to ensure that the nominal long service leave balances owing to employees are fully funded and maintained.Funds sourced from certified Native Vegetation Offset Schemes and utilised to fund ongoing maintenance of Offset Reserves.Developer contributions towards non-standard lighting installed and collected as part of planning agreements towards non-standard light renewal.Statutory reserve to be used for the development of recreational reserves and public open space, sourced form specific developer contributions.
These funds have been set aside via council resolution for future works on municipal skate park facilities.To capture funds provided by developers for future specific projects in accordance with planning agreements.These funds are intended for strategic works and acquisitions of new or expanded assets that are of an intergenerational nature.
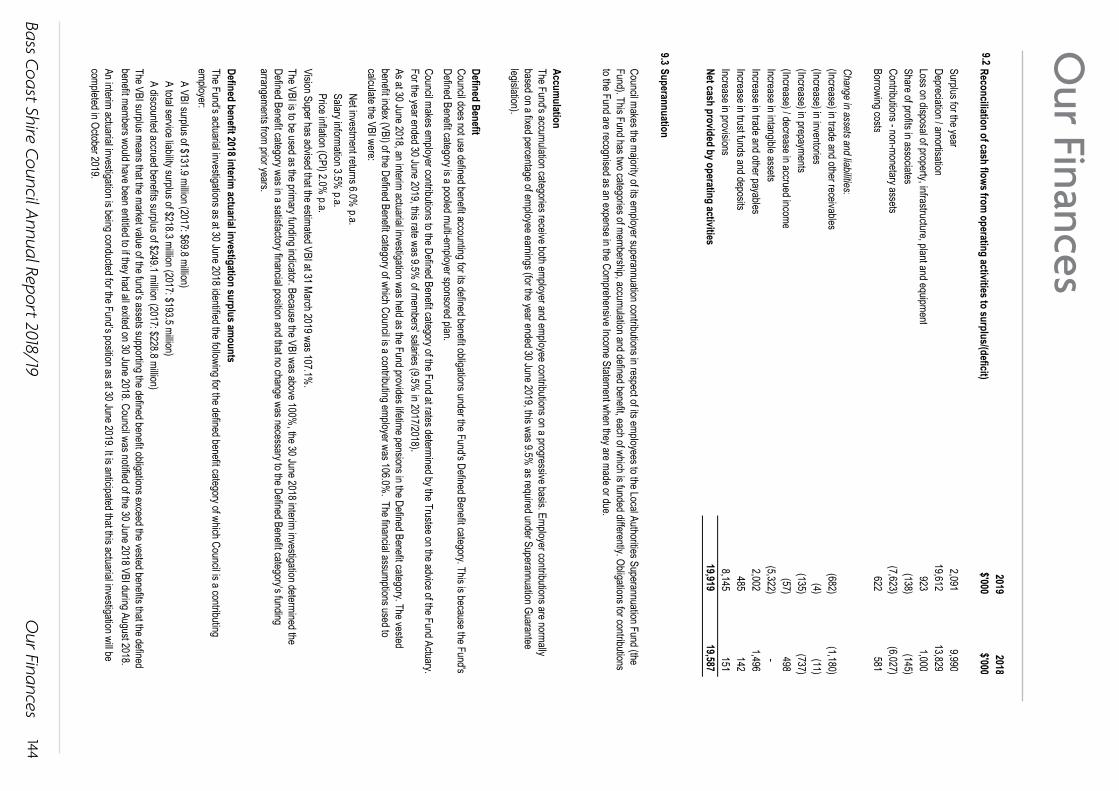
Bass Coast Shire Council Annual Report 2018/19
144
Our Finances
Our Finances
Bass Coast Shire CouncilNotes to the Financial Report
2018/2019 Financial ReportFor the Year Ended 30 June 2019
20192018
9.2Reconciliation of cash flows from
operating activities to surplus/(deficit)$'000
$'000
Surplus for the year2,091
9,990
Depreciation / amortisation
19,612
13,829
Loss on disposal of property, infrastructure, plant and equipment923
1,000
Share of profits in associates
(138)
(145)
Contributions - non-monetary assets(7,623)
(6,027)
Borrowing costs
622
581
Change in assets and liabilities:(Increase) in trade and other receivables
(682)
(1,180)
(Increase) in inventories(4)
(11)
(Increase) in prepayments
(135)
(737)
(Increase) / decrease in accrued income(57)
498
Increase in intangible assets
(5,322)
-
Increase in trade and other payables2,002
1,496
Increase in trust funds and deposits
485
142
Increase in provisions8,145
151
Net cash provided by operating activities
19,919
19,587
9.3Superannuation
Accumulation
Defined Benefit
Net investment returns 6.0% p.a.
Salary information 3.5% p.a.
Price inflation (CPI) 2.0% p.a.
Defined benefit 2018 interim actuarial investigation surplus am
ounts
A VBI surplus of $131.9 million (2017: $69.8 million)A total service liability surplus of $218.3 million (2017: $193.5 million)A discounted accrued benefits surplus of $249.1 million (2017: $228.8 million)
Council makes the majority of its employer superannuation contributions in respect of its employees to the Local Authorities Superannuation Fund (the Fund). This Fund has two categories of membership, accumulation and defined benefit, each of which is funded differently. Obligations for contributions to the Fund are recognised as an expense in the Comprehensive Income Statement when they are made or due.
The Fund's accumulation categories receive both employer and employee contributions on a progressive basis. Employer contributions are normally based on a fixed percentage of employee earnings (for the year ended 30 June 2019, this was 9.5%
as required under Superannuation Guarantee legislation).
Council does not use defined benefit accounting for its defined benefit obligations under the Fund's Defined Benefit category. This is because the Fund's Defined Benefit category is a pooled multi-employer sponsored plan. Council makes employer contributions to the Defined Benefit category of the Fund at rates determined by the Trustee on the advice of the Fund Actuary. For the year ended 30 June 2019, this rate was 9.5%
of members' salaries (9.5% in 2017/2018).
As at 30 June 2018, an interim actuarial investigation was held as the Fund provides lifetime pensions in the Defined Benefit category. The vested benefit index (VBI) of the Defined Benefit category of which Council is a contributing employer was 106.0%
. The financial assumptions used to calculate the VBI were:
Page 43
The Fund’s actuarial investigations as at 30 June 2018 identified the following for the defined benefit category of which Council is a contributing employer:
The VBI surplus means that the market value of the fund’s assets supporting the defined benefit obligations exceed the vested benefits that the defined benefit members would have been entitled to if they had all exited on 30 June 2018. Council was notified of the 30 June 2018 VBI during August 2018.An interim actuarial investigation is being conducted for the Fund’s position as at 30 June 2019. It is anticipated that this actuarial investigation will be completed in October 2019.
The VBI is to be used as the primary funding indicator. Because the VBI was above 100%, the 30 June 2018 interim investigation determined the
Defined Benefit category was in a satisfactory financial position and that no change was necessary to the Defined Benefit category’s funding arrangements from prior years.
Vision Super has advised that the estimated VBI at 31 March 2019 was 107.1%.