Embed Size (px)
Citation preview

17
The accompanying consolidated financial statements as of September 30, 2005 and 2004 and for the three and nine months then ended are unaudited and include the accounts of Deutsche Bank AG and its subsidiaries (collectively, the Deutsche Bank Group or the Company). In the opinion of management, all adjustments, consisting of normal recurring adjustments, necessary for a fair presentation of the results of opera-tions, financial position and cash flows have been reflected. Certain prior period amounts have been reclassified to conform to the current presentation. The results reported in these financial statements, which include supplementary information, should not be regarded as necessarily indicative of results that may be expected for the entire year. The financial statements included in this Interim Report should be read in conjunction with the consolidated financial statements and related notes included in the Company’s 2004 Financial Report and SEC Form 20-F. Certain financial statement information that is normally included in annual financial statements prepared in accor-dance with U.S. GAAP has been condensed or omitted. Following is supplementary information on the impact of changes in accounting principles, segment information, supplementary information on the income statement, the balance sheet and other financial information.
Basis of Presentation

18
EITF 05-5 In June 2005, the FASB ratified the consensus reached in EITF Issue No. 05-5, “Accounting for Early Retirement or Postemployment Programs with Specific Features (Such As Terms Specified in Altersteilzeit Early Retirement Arrangements)” (“EITF 05-5”). EITF 05-5 addresses the timing of recognition of salaries, bonuses and additional pension contributions associated with certain early retirement arrangements typical in Germany (as well as similar programs). The EITF also specifies the accounting for government subsidies related to these arrangements. EITF 05-5 is effective in fiscal years beginning after December 15, 2005. The adoption of EITF 05-5 is not expected to have a material impact on our consolidated financial statements.
SFAS 154 In May 2005, the FASB issued SFAS No. 154, “Accounting Changes and Error Correc-tions – A Replacement of APB Opinion No. 20 and FASB Statement No. 3” (“SFAS 154”). SFAS 154 replaces APB Opinion No. 20, “Accounting Changes” (“APB 20”) and FASB Statement No. 3, “Reporting Accounting Changes in Interim Financial Statements,” and changes the requirements for the accounting for and report-ing of a change in accounting principle. APB 20 previously required that most voluntary changes in accounting principle be recognized by including in net income of the period of the change the cumulative effect of changing to the new accounting principle. SFAS 154 requires retrospective application to prior periods’ financial statements for voluntary changes in accounting principle. SFAS 154 is effective for accounting changes and corrections of errors made in fiscal years beginning after December 15, 2005. The impact of SFAS 154 will depend on the accounting change, if any, in a future period.
EITF 03-1, FSP EITF 03-1-1 and FSP FAS 115-1 In March 2004, the FASB ratified the consensus reached in EITF Issue No. 03-1, “The Meaning of Other-Than-Temporary Impairment and Its Application to Certain Invest-ments” (“EITF 03-1”). The decisions established a common approach to evaluating other-than-temporary impairment for equity securities accounted for at cost, and debt and equity securities available for sale. In September 2004, the FASB issued a final FASB Staff Position, No. EITF 03-1-1 (“FSP EITF 03-1-1”), which delayed the effective date for the measurement and recognition guidance included in EITF 03-1. The disclo-sure requirements under EITF 03-1 were effective beginning December 31, 2004.
In June 2005, the FASB decided not to provide additional guidance on the meaning of other-than-temporary impairment, but directed its staff to issue a final FSP, to be titled FSP FAS 115-1. FSP FAS 115-1, “The Meaning of Other-Than-Temporary Im-pairment and Its Application to Certain Investments,” will replace guidance set forth in EITF 03-1 with references to existing other-than-temporary impairment guidance and will clarify that an investor should recognize an impairment loss no later than when the impairment is deemed other than temporary, even if a decision to sell has not been made. The delay of the effective date for the measurement and recognition guidance included in EITF 03-1 will be superseded with the final issuance of FSP FAS 115-1, which will be effective for other-than-temporary impairment analysis conducted in peri-ods beginning after December 15, 2005. The adoption of FSP FAS 115-1, once it is finalized by the FASB, is not expected to have a material impact on our consolidated financial statements.
Impact of Changes in Accounting Principles (unaudited)

19
FSP FAS 109-2 In December 2004, the FASB issued Staff Position No. FAS 109-2, “Accounting and Disclosure Guidance for the Foreign Earnings Repatriation Provision within the Ameri-can Jobs Creation Act of 2004” (“FSP FAS 109-2”). The Act, which was signed into law in the U.S. on October 22, 2004, provides for, among other things, a reduced rate of U.S. tax on dividends received from foreign subsidiaries of U.S. taxpayers. FSP FAS 109-2 provides additional time beyond the financial reporting period of the enactment to evaluate the effects of this provision of the Act for purposes of applying SFAS No. 109, “Accounting for Income Taxes.” We do not intend to repatriate any earnings from foreign subsidiaries in accordance with the provisions of the Act and thus FSP FAS 109-2 will not have an impact on our consolidated financial statements.
SFAS 123 (Revised 2004) In December 2004, the FASB issued SFAS No. 123 (revised 2004), “Share-Based Payment” (“SFAS 123(R)”). SFAS 123(R) replaces SFAS No. 123, “Accounting for Stock-Based Compensation” (“SFAS 123”), and supersedes APB Opinion No. 25, “Accounting for Stock Issued to Employees”. The new standard requires companies to recognize compensation cost relating to share-based payment transactions in their financial statements. That cost is to be measured based on the fair value of the equity or liability instruments issued. Starting January 1, 2003, we accounted for our share-based compensation awards under the fair value method prescribed under SFAS 123. The method was applied prospectively for all employee awards granted, modified or settled after January 1, 2003. Currently, we use a Black-Scholes option pricing model to estimate the fair value of stock options granted to employees and expect to continue to use this option valuation model upon the adoption of SFAS 123(R). SFAS 123(R) also includes some changes regarding the timing of expense recognition, the treatment of forfeitures and the re-measurement of liability classified awards at their current fair value. SFAS 123(R) indicates that it is effective for reporting periods beginning after June 15, 2005.
In March 2005, the SEC released Staff Accounting Bulletin No. 107, “Share-Based Payment “(“SAB 107”), which provides interpretive guidance related to the interaction between SFAS 123(R) and certain SEC rules and regulations. It also provides the SEC staff’s views regarding valuation of share-based payment arrangements. In April 2005, the SEC amended the compliance dates for SFAS 123(R), to allow companies to im-plement the standard at the beginning of their next fiscal year, instead of the next reporting period beginning after June 15, 2005.
Management is currently evaluating the transition method to be used and the impact SFAS 123(R) will have on our consolidated financial statements. Management intends to adopt SFAS 123(R) effective January 1, 2006, as permitted by the SEC, and is assessing the impact of SAB 107 on our implementation.

20
SOP 03-3 In December 2003, the American Institute of Certified Public Accountants issued Statement of Position 03-3, “Accounting for Certain Loans or Debt Securities Acquired in a Transfer” (“SOP 03-3”). SOP 03-3 addresses the accounting for differences between contractual and expected cash flows for loans or debt securities acquired in a transfer if those differences are attributable, at least in part, to credit quality. The SOP prohibits the creation of an allowance for loan losses in the initial accounting for all loans within its scope. The SOP also limits the income that can be recognized and specifies the accounting for future changes in expected cash flows on the acquired loans or securities. SOP 03-3 is effective for loans or debt securities acquired in fiscal years beginning after December 15, 2004. The adoption did not have a material impact on our consolidated financial statements.
IFRS EU and German regulations require the Group to adopt International Financial Report-ing Standards (IFRS) for purposes of preparing consolidated financial statements filed with EU and German regulatory authorities beginning no later than fiscal year 2007 (with 2006 comparative amounts presented). Financial statements prepared according to IFRS are accepted in SEC filings provided a reconciliation to certain U.S. GAAP financial statement amounts is disclosed.
The adoption of IFRS is not expected to result in any adjustment to U.S. GAAP amounts, however there are a number of differences between the two accounting regimes which will cause earnings and balance sheet amounts under IFRS and U.S. GAAP to differ, perhaps significantly. The special transition rules for this adoption require, with some exceptions, that the IFRS in effect at the reporting date be applied in the opening balance sheet. Because of this, future rule changes could have an im-pact on the opening IFRS balance sheet and thus the difference between U.S. GAAP and IFRS earnings or balance sheet amounts cannot be predicted at this time.

21
The Group’s segment reporting follows the organizational structure as reflected in its internal management reporting systems, which are the basis for assessing the financial performance of the business segments and for allocating resources to the business segments.
In the third quarter of 2005 there were no significant changes regarding the organ-izational structure, management responsibilities and the format of segment disclosure.
Prior periods have been restated to conform to the current year’s presentation. In September 2005, PBC sold its private banking unit in the Netherlands to
Theodoor Gilissen Bankiers N.V., a merchant bank owned by Belgium’s financial group KBC.
Effective September 30, 2005, AM completed the first tranche of the sale of its U.K.- and Philadelphia-based business to Aberdeen Asset Management PLC. Businesses included in the first tranche of the sale are the U.K.-based institutional Equity, Fixed Income, Global Equity and Multi-Asset businesses and the retail DWS business.
Segment Information (unaudited)

22
Segmental Results of Operations
Three months ended Sep 30, 2005
Corporate and Investment Bank Private Clients and Asset Management
in € m. (except percentages)
Corporate Banking & Securities
Global Trans-action
Banking
Total Asset and Wealth
Manage-ment
Private & Business
Clients
Total
Corporate Invest-ments
Total Manage-
ment Reporting
Net revenues 3,581 494 4,075 1,014 1,187 2,201 410 6,685Underlying revenues 3,581 494 4,075 962 1,179 2,141 1 6,217Provision for loan losses (1) 3 2 (1) 91 90 (4) 87Provision for off-balance sheet positions1 10 (7) 3 1 0 1 (0) 4Total provision for credit losses 8 (4) 5 0 91 91 (4) 91Operating cost base 2,390 358 2,747 742 835 1,577 39 4,363Minority interest 12 – 12 13 (0) 13 (1) 24Restructuring activities 46 8 54 71 29 100 1 156Goodwill impairment/impairment of intangibles – – – – – – – –Policyholder benefits and claims – – – 10 – 10 – 10Provision for off-balance sheet positions1 10 (7) 3 1 0 1 (0) 4Total noninterest expenses 2,458 359 2,817 837 864 1,701 39 4,557Income before income taxes 1,124 132 1,256 177 232 410 375 2,041Add (deduct): Net gains on securities available for sale/industrial holdings including hedging – – – – – – (342) (342)Significant equity pick-ups/ net gains from investments2 – – – – – – (51) (51)Net gains from businesses sold/ held for sale – – – (42) (8) (49) – (49)Net gains related to premises – – – – – – (16) (16)Restructuring activities 46 8 54 71 29 100 1 156Goodwill impairment/impairment of intangibles – – – – – – – –Underlying pre-tax profit (loss) 1,171 140 1,311 207 254 461 (33) 1,738Cost/income ratio in % 68 74 69 82 73 77 10 68Underlying cost/income ratio in % 67 72 67 77 71 74 N/M 70Assets3 848,628 19,243 860,504 34,201 82,897 117,057 16,474 963,636Risk-weighted positions (BIS risk positions) 157,196 12,971 170,167 13,288 58,476 71,764 9,345 251,276Average active equity 13,773 1,373 15,146 5,152 1,685 6,837 2,909 24,893Pre-tax return on average active equity in % 33 38 33 14 55 24 52 33Underlying pre-tax return on average active equity in % 34 41 35 16 60 27 (5) 28
N/M – Not meaningful 1 Provision for off-balance sheet positions is reclassified from “Noninterest expenses” to “Total provision for credit losses”. 2 Includes net gains/losses from significant equity method investments and other significant investments. 3 The sum of corporate divisions does not necessarily equal the total of the corresponding group division because of consolidation items between
corporate divisions, which are to be eliminated on the group division level. The same approach holds true for the sum of group divisions compared to Total Management Reporting, which include consolidation items between group divisions.

23
Three months ended Sep 30, 2004
Corporate and Investment Bank Private Clients and Asset Management
in € m. (except percentages)
Corporate Banking & Securities
Global Trans-action
Banking
Total Asset and Wealth
Manage-ment
Private & Business
Clients
Total
Corporate Invest-ments
Total Manage-
ment Reporting
Net revenues 2,427 466 2,893 854 1,126 1,980 119 4,992Underlying revenues 2,427 463 2,891 829 1,125 1,954 18 4,863Provision for loan losses 23 3 26 (1) 57 56 1 83Provision for off-balance sheet positions1 (10) (14) (24) (0) (0) (1) 0 (24)Total provision for credit losses 13 (11) 2 (2) 57 55 1 58Operating cost base 1,950 385 2,336 723 825 1,548 78 3,962Minority interest (2) – (2) 7 (0) 7 (0) 5Restructuring activities – – – – – – – –Goodwill impairment/impairment of intangibles – – – – – – – –Policyholder benefits and claims – – – 7 – 7 – 7Provision for off-balance sheet positions1 (10) (14) (24) (0) (0) (1) 0 (24)Total noninterest expenses 1,938 372 2,310 737 825 1,562 78 3,949Income before income taxes 466 91 557 118 244 362 40 960Add (deduct): Net gains on securities available for sale/industrial holdings including hedging – – – – – – (26) (26)Significant equity pick-ups/ net gains from investments2 – – – – – – (24) (24)Net gains from businesses sold/ held for sale – (2) (2) (18) (0) (19) – (21)Net gains related to premises – – – – – – (51) (51)Restructuring activities – – – – – – – –Goodwill impairment/impairment of intangibles – – – – – – – –Underlying pre-tax profit (loss) 466 89 555 100 243 344 (61) 838Cost/income ratio in % 80 83 81 86 73 79 65 80Underlying cost/income ratio in % 80 83 81 87 73 79 N/M 81Assets (as of Dec 31, 2004)3 720,557 16,636 729,872 34,945 78,930 113,818 16,442 832,933Risk-weighted positions (BIS risk positions) 128,453 11,670 140,123 11,673 53,466 65,139 10,533 215,795Average active equity 11,470 1,471 12,941 5,093 1,766 6,859 3,935 23,735Pre-tax return on average active equity in % 16 25 17 9 55 21 4 16Underlying pre-tax return on average active equity in % 16 24 17 8 55 20 (6) 14
N/M – Not meaningful 1 Provision for off-balance sheet positions is reclassified from “Noninterest expenses” to “Total provision for credit losses”. 2 Includes net gains/losses from significant equity method investments and other significant investments. 3 The sum of corporate divisions does not necessarily equal the total of the corresponding group division because of consolidation items between
corporate divisions, which are to be eliminated on the group division level. The same approach holds true for the sum of group divisions compared to Total Management Reporting, which include consolidation items between group divisions.

24
Nine months ended Sep 30, 2005
Corporate and Investment Bank Private Clients and Asset Management
in € m. (except percentages)
Corporate Banking & Securities
Global Trans-action
Banking
Total Asset and Wealth
Manage-ment
Private & Business
Clients
Total
Corporate Invest-ments
Total Manage-
ment Reporting
Net revenues 10,712 1,459 12,171 2,770 3,488 6,258 779 19,207Underlying revenues 10,712 1,459 12,171 2,698 3,481 6,179 200 18,549Provision for loan losses (10) 26 15 (1) 242 241 (0) 256Provision for off-balance sheet positions1 21 (24) (4) 0 (1) (0) (0) (4)Total provision for credit losses 10 1 12 (0) 241 241 (0) 252Operating cost base 7,317 1,045 8,362 2,197 2,494 4,691 134 13,187Minority interest 31 – 31 9 0 9 (0) 40Restructuring activities 192 32 224 159 56 215 1 440Goodwill impairment/impairment of intangibles – – – – – – – –Policyholder benefits and claims – – – 30 – 30 – 30Provision for off-balance sheet positions1 21 (24) (4) 0 (1) (0) (0) (4)Total noninterest expenses 7,561 1,053 8,613 2,395 2,549 4,944 134 13,691Income before income taxes 3,162 380 3,542 376 697 1,072 645 5,260Add (deduct): Net gains on securities available for sale/industrial holdings including hedging – – – – – – (429) (429)Significant equity pick-ups/ net gains from investments2 – – – – – – (95) (95)Net gains from businesses sold/ held for sale – – – (42) (8) (49) – (49)Net gains related to premises – – – – – – (55) (55)Restructuring activities 192 32 224 159 56 215 1 440Goodwill impairment/impairment of intangibles – – – – – – – –Underlying pre-tax profit 3,354 412 3,766 493 745 1,238 67 5,071Cost/income ratio in % 70 74 71 86 73 79 17 71Underlying cost/income ratio in % 68 72 69 81 72 76 67 71Assets3 848,628 19,243 860,504 34,201 82,897 117,057 16,474 963,636Risk-weighted positions (BIS risk positions) 157,196 12,971 170,167 13,288 58,476 71,764 9,345 251,276Average active equity 12,531 1,342 13,873 4,926 1,637 6,563 3,277 23,712Pre-tax return on average active equity in % 34 38 34 10 57 22 26 30Underlying pre-tax return on average active equity in % 36 41 36 13 61 25 3 29
1 Provision for off-balance sheet positions is reclassified from “Noninterest expenses” to “Total provision for credit losses”. 2 Includes net gains/losses from significant equity method investments and other significant investments. 3 The sum of corporate divisions does not necessarily equal the total of the corresponding group division because of consolidation items between
corporate divisions, which are to be eliminated on the group division level. The same approach holds true for the sum of group divisions compared to Total Management Reporting, which include consolidation items between group divisions.

25
Nine months ended Sep 30, 2004
Corporate and Investment Bank Private Clients and Asset Management
in € m. (except percentages)
Corporate Banking & Securities
Global Trans-action
Banking
Total Asset and Wealth
Manage-ment
Private & Business
Clients
Total
Corporate Invest-ments
Total Manage-
ment Reporting
Net revenues 8,743 1,447 10,190 2,612 3,350 5,962 553 16,705Underlying revenues 8,743 1,416 10,159 2,558 3,374 5,932 239 16,330Provision for loan losses 152 7 159 (7) 192 186 16 361Provision for off-balance sheet positions1 (58) (19) (77) (1) (1) (2) 0 (79)Total provision for credit losses 94 (12) 82 (7) 192 184 16 282Operating cost base 6,425 1,194 7,619 2,166 2,441 4,607 266 12,491Minority interest (2) – (2) 9 0 9 (2) 4Restructuring activities – – – – – – – –Goodwill impairment/impairment of intangibles – – – – – – – –Policyholder benefits and claims – – – 36 – 36 – 36Provision for off-balance sheet positions1 (58) (19) (77) (1) (1) (2) 0 (79)Total noninterest expenses 6,365 1,174 7,540 2,210 2,440 4,650 263 12,453Income before income taxes 2,226 266 2,492 409 718 1,127 273 3,891Add (deduct): Net gains on securities available for sale/industrial holdings including hedging – – – – – – (176) (176)Significant equity pick-ups/ net gains from investments2 – – – – – – (56) (56)Net (gains) losses from businesses sold/held for sale – (31) (31) (18) 24 6 (30) (56)Net gains related to premises – – – – – – (51) (51)Restructuring activities – – – – – – – –Goodwill impairment/impairment of intangibles – – – – – – – –Underlying pre-tax profit (loss) 2,226 235 2,460 391 742 1,133 (41) 3,552Cost/income ratio in % 73 82 75 85 73 78 48 75Underlying cost/income ratio in % 73 84 75 85 72 78 111 76Assets (as of Dec 31, 2004)3 720,557 16,636 729,872 34,945 78,930 113,818 16,442 832,933Risk-weighted positions (BIS risk positions) 128,453 11,670 140,123 11,673 53,466 65,139 10,533 215,795Average active equity 11,583 1,364 12,947 5,069 1,669 6,738 3,974 23,658Pre-tax return on average active equity in % 26 26 26 11 57 22 9 22Underlying pre-tax return on average active equity in % 26 23 25 10 59 22 (1) 20
1 Provision for off-balance sheet positions is reclassified from “Noninterest expenses” to “Total provision for credit losses”. 2 Includes net gains/losses from significant equity method investments and other significant investments. 3 The sum of corporate divisions does not necessarily equal the total of the corresponding group division because of consolidation items between
corporate divisions, which are to be eliminated on the group division level. The same approach holds true for the sum of group divisions compared to Total Management Reporting, which include consolidation items between group divisions.

26
The following tables present the revenue components of the Corporate and Investment Bank Group Division and the Private Clients and Asset Management Group Division for the three and nine months ended September 30, 2005 and 2004:
Revenue components of the Corporate and Investment Bank Group Division
Three months ended Nine months ended
in € m. Sep 30,
2005 Sep 30,
2004 Sep 30,
2005 Sep 30,
2004 Origination (equity) 156 73 443 321 Origination (debt) 268 270 779 735 Total Origination 424 344 1,223 1,056 Sales & Trading (equity) 1,021 401 2,446 1,730 Sales & Trading (debt and other products) 1,850 1,438 5,870 4,971 Total Sales & Trading 2,871 1,839 8,315 6,701 Advisory 148 115 407 327 Loan products 240 224 933 866 Transaction services 494 463 1,459 1,416 Other (102) (93) (166) (176)Total 4,075 2,893 12,171 10,190
Revenue components of the Private Clients and Asset Management Group Division
Three months ended Nine months ended
in € m. Sep 30,
2005 Sep 30,
2004 Sep 30,
2005 Sep 30,
2004 Portfolio/fund management 712 655 1,975 1,878 Brokerage 470 378 1,389 1,226 Loan/deposit 600 593 1,780 1,779 Payments, account & remaining financial services 220 229 623 641 Other 199 124 491 439 Total 2,201 1,980 6,258 5,962

27
Reconciliation of Segmental Results of Operations to Consolidated Results of Operations According to U.S. GAAP
Three months ended
Sep 30, 2005 Sep 30, 2004
in € m.
Total Manage-
ment Reporting
Consoli-dation &
Adjust-ments
TotalConsoli-
dated
TotalManage-
mentReporting
Consoli- dation &
Adjust- ments
TotalConsoli-
dated
Net revenues 6,685 (68) 6,617 4,992 65 5,056 Provision for loan losses 87 – 87 83 – 83 Noninterest expenses 4,557 95 4,652 3,949 18 3,967 Income (loss) before income taxes1 2,041 (163) 1,878 960 46 1,006 Total assets 963,636 8,195 971,831 832,9332 7,1352 840,0682
Risk-weighted positions (BIS risk positions) 251,276 1,498 252,774 215,795 1,737 217,533 Average active equity 24,893 794 25,687 23,735 831 24,566
1 Income before income tax expense and cumulative effect of accounting changes. 2 As of December 31, 2004.
Nine months ended
Sep 30, 2005 Sep 30, 2004
in € m.
Total Manage-
ment Reporting
Consoli-dation &
Adjust-ments
TotalConsoli-
dated
TotalManage-
mentReporting
Consoli- dation &
Adjust- ments
TotalConsoli-
dated
Net revenues 19,207 (106) 19,102 16,705 (100) 16,605 Provision for loan losses 256 – 256 361 – 361 Noninterest expenses 13,691 79 13,771 12,453 63 12,516 Income (loss) before income taxes1 5,260 (185) 5,075 3,891 (163) 3,728 Total assets 963,636 8,195 971,831 832,9332 7,1352 840,0682
Risk-weighted positions (BIS risk positions) 251,276 1,498 252,774 215,795 1,737 217,533 Average active equity 23,712 793 24,505 23,658 1,567 25,225
1 Income (loss) before income tax expense and cumulative effect of accounting changes. 2 As of December 31, 2004.
Consolidation & Adjustments includes adjustments for differences between accounting methods used for management reporting and U.S. GAAP, as well as adjustments re-lated to activities that are outside the responsibility of the business segments (“Corpo-rate Items”).
Consolidation & Adjustments recorded a loss before income taxes of € 163 million in the third quarter 2005 compared to income before income taxes of € 46 million in the third quarter last year. The result for the current quarter was negatively impacted by additions to provisions for legal exposures of € 108 million related to historical events. In the third quarter of 2004, Consolidation & Adjustments included interest income of € 110 million on tax refunds resulting of prior period tax returns.

28
Net Interest and Trading Revenues
Three months ended Nine months ended
in € m. Sep 30,
2005 Sep 30,
2004 Sep 30,
2005 Sep 30,
2004 Net interest revenues 1,216 1,158 4,272 4,011 Trading revenues, net 2,048 1,273 6,052 4,725 Total net interest and trading revenues 3,264 2,431 10,324 8,736
Breakdown by Group Division/CIB product:
Sales & Trading (equity) 782 239 1,837 1,053 Sales & Trading (debt and other products) 1,561 1,116 5,159 4,246
Total Sales & Trading 2,343 1,355 6,996 5,300 Loan products1 109 135 548 544 Transaction services 230 210 676 617 Remaining products2 (71) (46) (67) (89)Total Corporate and Investment Bank 2,611 1,653 8,153 6,373 Private Clients and Asset Management 675 691 2,119 2,251 Corporate Investments (33) (7) 83 134 Consolidation & Adjustments 11 94 (31) (21)Total net interest and trading revenues 3,264 2,431 10,324 8,736
1 Includes the net interest spread on loans as well as the results of credit default swaps used to hedge our loan exposure. 2 Includes net interest and trading revenues of origination, advisory and other products.
Pension and Other Postretirement Benefits
Pension benefits Postretirement benefits
Nine months ended Nine months ended
in € m. Sep 30,
2005 Sep 30,
2004 Sep 30,
2005 Sep 30,
2004 Service cost 191 192 5 6 Interest cost 289 292 6 8 Expected return on plan assets (292) (292) – – Actuarial loss recognized 32 48 – – Settlement/curtailment 2 (1) – – Amortization of unrecognized transition obligation (asset) in accordance with SFAS 87 0 13 – – Total defined benefit plans 222 252 11 14 Defined contribution plans 113 109 – – Net periodic benefit expense 335 361 11 14
A SFAS No. 88 charge of approximately € 2 million as a consequence of restructuring occurred in the United States and United Kingdom during the first nine months of the year. Furthermore, a reduction in the third quarter service costs of € 3 million has been booked in the U.K. to take account of a curtailment due to ongoing restructuring activi-ties.
In addition to the contributions expected for 2005 as disclosed in the Financial Re-port 2004 on page 95 and in the 2004 SEC Form 20-F on page F-54, special contribu-tions of approximately € 24 million were made in the first nine months of the year. An estimated reduction in service costs of approximately € 6 million in the U.K. will lead to an equal reduction in contributions. As a result, the Group expects to fund its pension schemes in 2005 for a total of approximately € 268 million.
Information on the Income Statement (unaudited)

29
SFAS 123 Pro forma Information
Three months ended Nine months ended
in € m. Sep 30,
2005 Sep 30,
2004 Sep 30,
2005 Sep 30,
2004 Net income, as reported 991 680 3,042 2,277 Add: Share-based compensation expense included in reported net income, net of related tax effects1 139 154 428 419 Deduct: Share-based compensation expense determined under fair value method for all awards, net of related tax effects1 (136) (154) (423) (423)Pro forma net income 994 680 3,047 2,273 Earnings per share
Basic – as reported € 2.12 € 1.42 € 6.52 € 4.55 Basic – pro forma € 2.13 € 1.42 € 6.53 € 4.54 Diluted – as reported2 € 1.89 € 1.28 € 5.95 € 4.13 Diluted – pro forma2 € 1.89 € 1.28 € 5.96 € 4.12
1 Amounts for the three and nine months ended September 30, 2005 and 2004 do not reflect any share-based awards related to the 2005 and 2004 performance year, respectively. The majority of our share-based awards are granted on a date shortly after the end of the performance year.
2 Including numerator effect of assumed conversions. The effect for the three and nine months ended September 30, 2005 was € (0.05) and € (0.06), respectively. The effect for the three and nine months ended September 30, 2004 was € (0.05) and € (0.09), respectively.

30
Securities Available for Sale
Sep 30, 2005 Dec 31, 2004 Gross unrealized
holding Gross unrealized
holding in € m.
Fair value
gains losses
Amortized cost
Fair value
gains losses
Amortized cost
Debt securities 17,722 291 (78) 17,509 13,696 286 (127) 13,537 Equity securities 6,385 2,544 (6) 3,847 6,639 1,631 (7) 5,015 Total 24,107 2,835 (84) 21,356 20,335 1,917 (134) 18,552
Problem Loans
Sep 30, 2005 Dec 31, 2004
in € m.
Impaired loans
Non-performing
homoge-neous loans
Total Impaired loans
Non-performing
homoge-neous loans
Total
Nonaccrual loans 2,891 1,138 4,029 3,401 1,098 4,499 Loans 90 days or more past due and still accruing 19 177 196 26 221 247 Troubled debt restructurings 102 – 102 89 – 89 Total problem loans 3,013 1,314 4,327 3,516 1,319 4,835
Allowances for Credit Losses
Nine months ended Allowance for on-balance sheet positions in € m. Sep 30, 2005 Sep 30, 2004 Balance, beginning of year 2,345 3,281 Provision for loan losses 256 361 Net charge-offs (542) (1,027)
Charge-offs (659) (1,138)Recoveries 117 111
Allowance related to acquisitions/divestitures – 3 Foreign currency translation 50 5 Balance, end of period 2,109 2,623
Nine months ended Allowance for off-balance sheet positions
in € m. Sep 30, 2005 Sep 30, 2004 Balance, beginning of year 345 416 Provision for credit losses on lending-related commitments (4) (79)Allowance related to acquisitions/divestitures – – Foreign currency translation 8 1 Balance, end of period 349 338
Information on the Balance Sheet (unaudited)

31
Other Assets and Other Liabilities The largest individual component of other assets at September 30, 2005 was loans held for sale totaling € 23,113 million and € 8,194 million at September 30, 2005 and December 31, 2004, respectively. These loans held for sale were acquired in the course of our securitization activities or originated in our loan business. Other assets also included pending securities transactions past settlement date of € 10,586 million and € 8,984 million at September 30, 2005 and December 31, 2004, respectively. Among other items included in other assets were other assets related to insurance business of € 1,086 million and € 6,733 million at September 30, 2005 and December 31, 2004, respectively, accrued interest receivable of € 4,626 million and € 3,854 million at September 30, 2005 and December 31, 2004, respectively, and due from customers on acceptances of € 95 million and € 74 million at September 30, 2005 and December 31, 2004, respectively.
Pending securities transactions past settlement date of € 9,026 million and € 9,562 million at September 30, 2005 and December 31, 2004, respectively, was the largest individual component of other liabilities. Among other items also included in other liabilities were insurance policy claims and reserves of € 1,836 million and € 7,935 million at September 30, 2005 and December 31, 2004, respectively, accrued interest payable of € 4,654 million and € 4,223 million at September 30, 2005 and De-cember 31, 2004, respectively, and acceptances outstanding of € 95 million and € 74 million at September 30, 2005 and December 31, 2004, respectively.
Long-term Debt in € m. Sep 30, 2005 Dec 31, 2004 Senior debt Bonds and notes
Fixed rate 60,139 53,834 Floating rate 46,846 39,463
Subordinated debt Bonds and notes
Fixed rate 10,715 9,505 Floating rate 6,152 4,068
Total 123,852 106,870
Liability for Restructuring Activities
BRP restructuring liability established in Total
in € m. 4th quarter
2004 1st quarter
2005 2nd quarter
2005 3rd quarter
2005 As of Dec 31, 2004 230 – – – 230 Additions – 168 146 184 498 Utilization 195 131 119 116 561 Releases 26 26 5 – 57 Increases due to exchange rate fluctuations 1 – – – 1 As of Sep 30, 2005 10 11 22 68 111

32
Variable Interest Entities (VIEs) The following table includes information on consolidated and significant non-consolidated VIEs under FIN 46(R). Sep 30, 2005 Consolidated VIEs Significant VIEs
in € m. Aggregatedtotal assets
Aggregated total assets
Maximum exposure to loss
Commercial paper programs 1,118 25,594 26,183 Guaranteed value mutual funds 529 9,394 9,394 Asset securitization 11,020 – – Structured finance and other 19,426 5,006 1,123 Commercial real estate leasing vehicles and closed-end funds 954 1,366 77
Substantially all of the consolidated assets of the variable interest entities act as col-lateral for related consolidated liabilities. The holders of these liabilities have no re-course to the Group, except to the extent the Group guarantees the value of the mu-tual fund units that investors purchase. The maximum exposure to loss related to the significant non-consolidated guaranteed value mutual funds results from the above mentioned guarantees. The Group’s maximum exposure to loss from the commercial paper programs that it has a significant interest in is equivalent to the contract amount of its liquidity facilities. The liquidity facilities create only limited credit exposure since the Group is not required to provide funding if the assets of the vehicle are in default.
Financial Instruments with Off-Balance Sheet Credit Risk in € m. Sep 30, 2005 Dec 31, 2004 Commitments to extend credit
Fixed rates1 32,714 27,897 Variable rates2 98,817 77,268
Financial guarantees, standby letters of credit and performance guarantees 29,619 26,870 Total 161,150 132,035
1 Includes commitments to extend commercial letters of credit and guarantees of € 2.5 billion and € 2.4 billion at September 30, 2005 and December 31, 2004, respectively.
2 Includes commitments to extend commercial letters of credit and guarantees of € 1.1 billion and € 902 million at September 30, 2005 and December 31, 2004, respectively.
In addition, the Group had loan commitments of € 19.2 billion at both September 30, 2005 and December 31, 2004, that were revocable at any time.
Other Financial Information (unaudited)

33
Capital According to BIS in € m. Sep 30, 2005 Dec 31, 2004 Tier I Common shares 1,416 1,392 Additional paid-in capital 11,498 11,147 Retained earnings, common shares in treasury, equity classified as obligation to purchase common shares, share awards, foreign currency translation 16,806 14,277 Minority interests 718 548 Noncumulative trust preferred securities 3,565 2,520 Other (equity contributed on silent partnership interests) 593 525 Items deducted (principally goodwill and tax effect of available for sale securities) (11,755) (11,682)Total core capital 22,841 18,727 Tier II Unrealized gains on listed securities (45% eligible) 1,272 788 Other inherent loss allowance 464 453 Cumulative preferred securities 1,161 762 Subordinated liabilities, if eligible according to BIS 9,395 7,882 Total supplementary capital 12,292 9,885 Total regulatory capital1 35,133 28,612
1 Currently we do not have Tier III capital components.
BIS Risk Position and Capital Adequacy Ratios in € m., unless stated otherwise Sep 30, 2005 Dec 31, 2004 BIS risk position1 252,774 216,787 BIS capital ratio (Tier I + II + III)2 13.9% 13.2% BIS core capital ratio (Tier I) 9.0% 8.6%
1 Primarily comprised of credit risk weighted assets. Also includes market-risk equivalent assets of € 10.5 billion and € 10.1 billion at September 30, 2005 and December 31, 2004, respectively.
2 Currently we do not have Tier III capital components.
Litigation Enron Litigation. Deutsche Bank AG and certain of its affiliates are collectively involved in more than 20 lawsuits arising out of their banking relationship with Enron Corp., its subsidiaries and certain Enron-related entities (“Enron”). These lawsuits include a se-ries of purported class actions brought on behalf of shareholders of Enron, including the lead action captioned Newby v. Enron Corp. The consolidated complaint filed in Newby named as defendants, among others, Deutsche Bank AG, several other invest-ment banking firms, a number of law firms, Enron’s former accountants and affiliated entities and individuals and other individual defendants, including present and former officers and directors of Enron, and it purported to allege claims against Deutsche Bank AG under federal securities laws. On December 20, 2002, the Court dismissed all of the claims alleged in the Newby action against Deutsche Bank AG. Plaintiffs in New-by filed a first amended consolidated complaint on May 14, 2003 and reasserted claims against Deutsche Bank AG under federal securities laws and also added similar claims against its subsidiaries DBSI and Deutsche Bank Trust Company Americas (“DBTCA”). On March 29, 2004, the Court dismissed in part the claims alleged in the Newby action against the Deutsche Bank entities. Specifically, the Court dismissed the fraud claims, but did not dismiss the non-fraud claims. On July 26, 2005, the Court granted plaintiffs' motion for reconsideration of the partial dismissal of claims against the Deutsche Bank entities, and reinstated the fraud claims against the Deutsche Bank entities that had been dismissed on March 29, 2004.

34
Also, an adversary proceeding has been brought by Enron in the bankruptcy court against, among others, Deutsche Bank AG and certain of its affiliates. In this adversary proceeding, Enron seeks damages from the Deutsche Bank entities, as well as the other defendants, for alleged aiding and abetting breaches of fiduciary duty by Enron insiders, aiding and abetting fraud and unlawful civil conspiracy, and also seeks return of alleged fraudulent conveyances and preferences and equitable subordination of their claims in the Enron bankruptcy. The Deutsche Bank entities’ motion to partially dismiss the adversary complaint is pending.
In addition to Newby and the adversary proceeding described above, there are third-party actions brought by Arthur Andersen in Enron-related cases asserting contri-bution claims against Deutsche Bank AG, DBSI and many other defendants, and indi-vidual and putative class actions brought in various courts by Enron investors and creditors alleging federal and state law claims against the same entities named by Ar-thur Andersen, as well as DBTCA.
WorldCom Litigation. Deutsche Bank AG and Deutsche Bank Securities Inc., the Group’s U.S. broker-dealer subsidiary (“DBSI”), are defendants in more than 40 ac-tions filed in federal and state courts arising out of alleged material misstatements and omissions in the financial statements of WorldCom Inc. DBSI was a member of the syndicate that underwrote WorldCom’s May 2000 and May 2001 bond offerings, which are among the bond offerings at issue in the actions. Deutsche Bank AG, London branch was a member of the syndicate that underwrote the Sterling and Euro tranches of the May 2001 bond offering. Plaintiffs are alleged purchasers of these and other WorldCom debt securities. The defendants in the various actions include certain WorldCom directors and officers, WorldCom’s auditor and members of the underwriting syndicates for the debt offerings. Plaintiffs allege that the offering documents contained material misstatements and/or omissions regarding WorldCom’s financial condition. The claims against DBSI and Deutsche Bank AG are made under federal and state statutes (including securities laws), and under various common law doctrines. The largest of the actions against Deutsche Bank AG and DBSI is a class action litigation in the U.S. District Court in the Southern District of New York, in which the class plaintiffs are the holders of a significant majority of the bonds at issue. On March 10, 2005, Deutsche Bank AG and DBSI reached a settlement agreement, subject to court ap-proval, resolving the class action claims asserted against them, for a payment of ap-proximately U.S.$ 325 million. The settlement of the class action claims does not re-solve the individual actions brought by investors who chose to opt out of the federal class action. The financial effects of the class action settlement are reflected in our 2004 consolidated financial statements.
Philipp Holzmann AG. Philipp Holzmann AG (“Holzmann”) is a major German con-struction firm which filed for insolvency in March 2002. The Group had been a major creditor bank and holder of an equity interest of Holzmann for many decades, and, from April 1997 until April 2000, a former member of Deutsche Bank AG’s Board of Managing Directors was the Chairman of its Supervisory Board. When Holzmann had become insolvent at the end of 1999, a consortium of banks led by Deutsche Bank participated in late 1999 and early 2000 in a restructuring of Holzmann that included the banks’ extension of a credit facility, participation in a capital increase and exchange of debt into convertible bonds. In March 2002, Holzmann and several of its subsidiar-ies, including in particular imbau Industrielles Bauen GmbH (“imbau”), filed for insol-vency. As a result of this insolvency, the administrators for Holzmann and for imbau and a group of bondholders have informed the Group they may assert claims against the Group because of its role as lender to the Holzmann group prior to and after the restructuring and as leader of the consortium of banks which supported the restructur-ing. The purported claims include claims that amounts repaid to the banks constituted voidable preferences that should be returned to the insolvent entities and claims of lender liability resulting from the banks’ support for an allegedly infeasible restructur-

35
ing. Although the Group is in ongoing discussions, the Group cannot exclude that some of the parties may file lawsuits against it. To date, the administrator for imbau filed a lawsuit against the Group in August 2004 alleging that payments received by the Group in respect of a loan made to imbau in 1997 and 1998 and in connection with a real estate transaction that was part of the restructuring constituted voidable prefer-ences that should be returned to the insolvent entity. Additionally, Gebema N.V. filed a lawsuit in 2000 seeking damages against the Group alleging deficiencies in the offer-ing documents based on which Gebema N.V. had invested in equity and convertible bonds of Holzmann in 1998.
Due to the nature of its business, the Group is involved in litigation, arbitration and regulatory proceedings in Germany and in a number of jurisdictions outside Germany, including the United States, arising in the ordinary course of business. Such matters are subject to many uncertainties, and the outcome of individual matters is not predict-able with assurance. Although the final resolution of any such matters could have a material effect on the Group’s consolidated operating results for a particular reporting period, the Group believes that it should not materially affect its consolidated financial position.
Other Information
Supervisory Board With effect from the end of the General Meeting on May 18, 2005, Dr. rer. oec. Karl-Hermann Baumann resigned from his mandate as member of the Supervisory Board of Deutsche Bank AG. He had been a member of the Supervisory Board since 1998.
Dr. jur. Dr.-Ing. E.h. Heinrich von Pierer was elected to the Supervisory Board for the remainder of the term of office, i.e. for the period until the end of the General Meet-ing which resolves the ratification of the acts of management for the 2007 financial year. Dr. von Pierer is chairman of the supervisory board of Siemens AG, Munich.
Effective May 18, 2005, Ulrich Hartmann resigned from his mandate as substitute member of the Risk Committee. Effective May 18, 2005, Dr. Karl-Gerhard Eick was elected new Chairman of the Audit Committee and Sir Peter Job member of the Audit Committee. Tilman Todenhoefer and Dr. jur. Dr.-Ing. E.h. Heinrich von Pierer were elected substitute members of the Risk Committee.
36
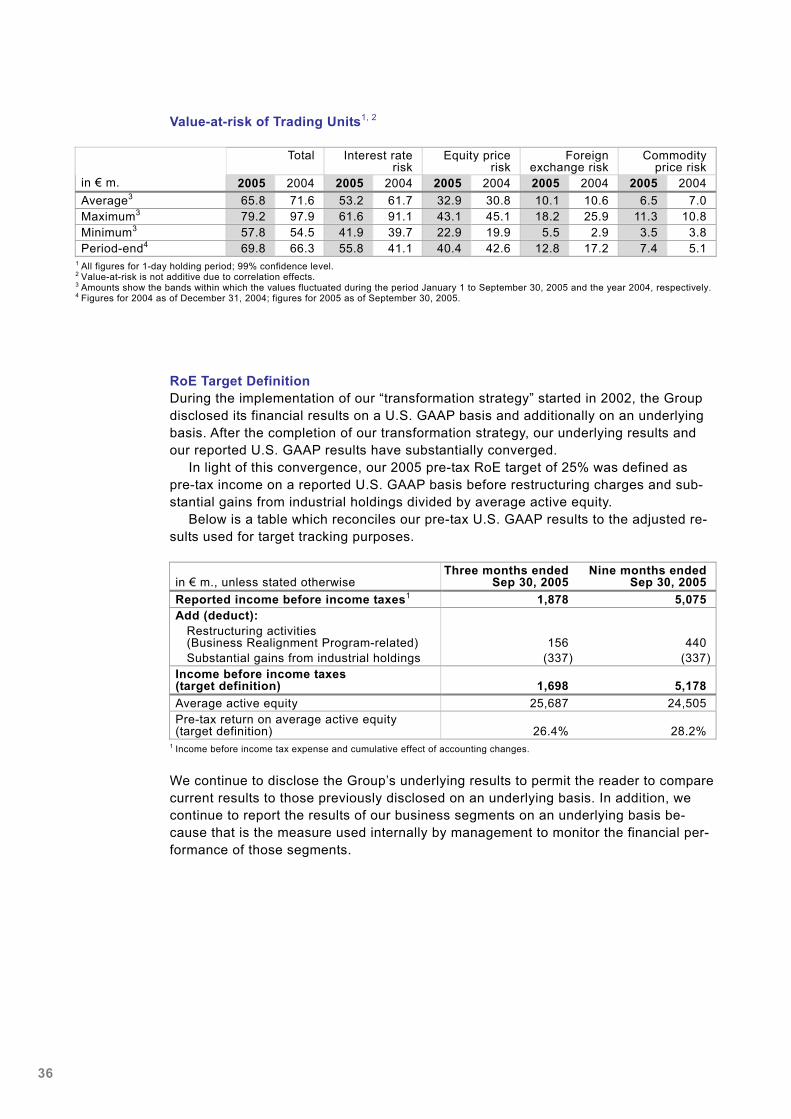
Value-at-risk of Trading Units1, 2
Total Interest rate risk
Equity price risk
Foreign exchange risk
Commodity price risk
in € m. 2005 2004 2005 2004 2005 2004 2005 2004 2005 2004 Average3 65.8 71.6 53.2 61.7 32.9 30.8 10.1 10.6 6.5 7.0 Maximum3 79.2 97.9 61.6 91.1 43.1 45.1 18.2 25.9 11.3 10.8 Minimum3 57.8 54.5 41.9 39.7 22.9 19.9 5.5 2.9 3.5 3.8 Period-end4 69.8 66.3 55.8 41.1 40.4 42.6 12.8 17.2 7.4 5.1
1 All figures for 1-day holding period; 99% confidence level. 2 Value-at-risk is not additive due to correlation effects. 3 Amounts show the bands within which the values fluctuated during the period January 1 to September 30, 2005 and the year 2004, respectively. 4 Figures for 2004 as of December 31, 2004; figures for 2005 as of September 30, 2005.
RoE Target Definition During the implementation of our “transformation strategy” started in 2002, the Group disclosed its financial results on a U.S. GAAP basis and additionally on an underlying basis. After the completion of our transformation strategy, our underlying results and our reported U.S. GAAP results have substantially converged.
In light of this convergence, our 2005 pre-tax RoE target of 25% was defined as pre-tax income on a reported U.S. GAAP basis before restructuring charges and sub-stantial gains from industrial holdings divided by average active equity.
Below is a table which reconciles our pre-tax U.S. GAAP results to the adjusted re-sults used for target tracking purposes.
in € m., unless stated otherwise Three months ended
Sep 30, 2005 Nine months ended
Sep 30, 2005 Reported income before income taxes1 1,878 5,075 Add (deduct):
Restructuring activities (Business Realignment Program-related) 156 440 Substantial gains from industrial holdings (337) (337)
Income before income taxes (target definition) 1,698 5,178 Average active equity 25,687 24,505 Pre-tax return on average active equity (target definition) 26.4% 28.2%
1 Income before income tax expense and cumulative effect of accounting changes.
We continue to disclose the Group’s underlying results to permit the reader to compare current results to those previously disclosed on an underlying basis. In addition, we continue to report the results of our business segments on an underlying basis be-cause that is the measure used internally by management to monitor the financial per-formance of those segments.
37
Reconciliation of Reported to Underlying Results This document contains non-U.S. GAAP financial measures, including underlying reve-nues, total provision for credit losses, operating cost base, underlying pre-tax profit, average active equity and related ratios. Set forth below are – definitions of such non-U.S. GAAP financial measures, – reconciliation of such measures to the most directly comparable U.S. GAAP finan-
cial measures.
Definitions of Financial Measures We use the following terms with the following meanings: – Underlying revenues: Net revenues less specific revenue items as referred to in the
respective tables net of policyholder benefits and claims (reclassified from noninter-est expenses).
– Total provision for credit losses: Provision for loan losses plus provision for off-balance sheet positions (reclassified from noninterest expenses).
– Operating cost base: Noninterest expenses less provision for off-balance sheet po-sitions (reclassified to provision for credit losses), policyholder benefits and claims (reclassified to underlying revenues), minority interest, restructuring activities and goodwill impairment/impairment of intangibles.
– Underlying pre-tax profit: Income before income taxes less restructuring activities, goodwill impairment/impairment of intangibles and specific revenue items as re-ferred to in the respective tables.
– Underlying cost/income ratio in %: Operating cost base as a percentage of underly-ing revenues. Cost/income ratio in %, which is defined as total noninterest ex-penses as a percentage of total net revenues, is also provided.
– Average active equity: The portion of adjusted average total shareholders’ equity that has been allocated to a segment pursuant to the Group’s capital allocation framework. The overriding objective of this framework is to allocate adjusted aver-age total shareholders’ equity based on the respective goodwill and other intangible assets with indefinite useful lives as well as the economic capital of each segment. In the second quarter of 2005, the measurement of operational risk has been further refined as part of the bank’s Basel II preparation for the Advanced Measurement Approach. This refinement resulted in no material change in the operational risk economic capital for the Group but a higher allocation of operational risk economic capital to Corporate Banking & Securities and reductions in other segments. In determining the total amount of average active equity to be allocated, average total shareholders’ equity is adjusted to exclude average unrealized net gains on securi-ties available for sale, net of applicable tax and other, and average dividends.
– Adjusted return on average active equity (after tax) in %: Net income (loss) less the reversal of 1999/2000 credits for tax rate changes and the cumulative effect of ac-counting changes, net of tax, (annualized) as a percentage of average active equity. Underlying pre-tax return on average active equity in %: Underlying pre-tax profit (annualized) as a percentage of average active equity. Pre-tax return on average active equity in %, which is defined as income before income taxes (annualized) as a percentage of average active equity, is also provided. These returns, which are based on average active equity, should not be compared to those of other compa-nies without considering the differences in the calculation of such ratios. Our capital allocation framework does not allocate all average active equity to the segments. As a result, the weighted average of the segment pre-tax return on average active eq-uity will be larger than the corresponding pre-tax return on average active equity of the Group.

38
– Underlying equity turnover (based on average active equity) in %: Underlying reve-nues (annualized) as a percentage of average active equity. Equity turnover (based on average active equity) in %: Net revenues (annualized) as a percentage of aver-age active equity. Equity turnover (based on average shareholders’ equity) in %: Net revenues (annualized) as a percentage of average shareholders’ equity.
– Underlying profit margin in %: Underlying pre-tax profit as a percentage of underly-ing revenues. Profit margin in %: Income before income taxes as a percentage of net revenue.
Management uses these measures as part of its internal reporting system because it believes that such measures provide it with a more useful indication of the financial performance of the business segments. The Group discloses such measures to pro-vide investors and analysts with further insight into how management operates our businesses and to enable them to better understand our results. The rationale for ex-cluding certain items in deriving the measures above are provided in our SEC Form 20-F of March 24, 2005 on pages F-62 and F-63 and in our Financial Report 2004 on pages 103 to 105.

39
Reconciliation of Reported to Underlying Results Set forth below are the reconciliations of non-U.S. GAAP financial measures to the most directly comparable U.S. GAAP financial measures.
Three months
ended Change
in % Nine months
ended Change
in %
in € m. Sep 30,
2005 Sep 30,
2004 Sep 30,
2005 Sep 30,
2004 Reported net revenues1 6,617 5,056 31 19,102 16,605 15 Add (deduct):
Net gains on securities available for sale/ industrial holdings including hedging (342) (26) N/M (429) (176) 143 Significant equity pick-ups/net gains from investments2 (51) (24) 117 (95) (56) 70 Net gains from businesses sold/held for sale (49) (21) 139 (49) (56) (11)Net gains related to premises (16) (51) (70) (55) (51) 8 Policyholder benefits and claims3 (11) (31) (65) (34) (109) (69)
Underlying revenues 6,149 4,904 25 18,439 16,157 14 Reported provision for loan losses 87 83 5 256 361 (29)
Provision for off-balance sheet positions4 4 (24) N/M (4) (79) (95)Total provision for credit losses 91 58 55 252 282 (11) Reported noninterest expenses 4,652 3,967 17 13,771 12,516 10 Add (deduct):
Restructuring activities (156) – N/M (440) – N/M Goodwill impairment/impairment of intangibles – – N/M – – N/M Minority interest (11) (4) 157 (32) (4) N/M Policyholder benefits and claims3 (11) (31) (65) (34) (109) (69)Provision for off-balance sheet positions4 (4) 24 N/M 4 79 (95)
Operating cost base 4,471 3,957 13 13,268 12,481 6 Reported income before income taxes5 1,878 1,006 87 5,075 3,728 36 Add (deduct):
Net gains on securities available for sale/ industrial holdings including hedging (342) (26) N/M (429) (176) 143 Significant equity pick ups/net gains from investments2 (51) (24) 117 (95) (56) 70 Net gains from businesses sold/held for sale (49) (21) 139 (49) (56) (11)Net gains related to premises (16) (51) (70) (55) (51) 8 Restructuring activities 156 – N/M 440 – N/M Goodwill impairment/impairment of intangibles – – N/M – – N/M
Underlying pre-tax profit 1,576 884 78 4,886 3,389 44 N/M – Not meaningful 1 Net interest revenues before provision for loan losses and total noninterest revenues. 2 Includes net gains/losses from significant equity method investments and other significant investments. 3 Policyholder benefits and claims are reclassified from “Noninterest expenses” to “Underlying revenues”. 4 Provision for off-balance sheet positions is reclassified from “Noninterest expenses” to “Total provision for credit losses”. 5 Income before income tax expense and cumulative effect of accounting changes.

40
Reconciliation of Group Reported and Underlying Ratios
Three months ended
Change Nine months ended
Change
in € m. Sep 30,
2005 Sep 30,
2004 Sep 30,
2005 Sep 30,
2004
Reconciliation of cost ratios Reported noninterest expenses 4,652 3,967 17% 13,771 12,516 10% Deduct:
Compensation and benefits 2,737 2,327 18% 8,375 7,632 10% Non-compensation noninterest expenses 1,915 1,640 17% 5,396 4,884 10% Add (deduct):
Restructuring activities (156) – N/M (440) – N/M Goodwill impairment/impairment of intangibles – – N/M – – N/M Minority interest (11) (4) 157% (32) (4) N/M Policyholder benefits and claims (11) (31) (65)% (34) (109) (69)% Provision for off-balance sheet positions (4) 24 N/M 4 79 (95)%
Non-compensation operating cost base 1,733 1,630 6% 4,894 4,850 1% Cost/income ratio 70.3% 78.5% (8.2)ppt 72.1% 75.4% (3.3)ppt Underlying cost/income ratio 72.7% 80.7% (8.0)ppt 72.0% 77.2% (5.2)ppt Compensation ratio 41.4% 46.0% (4.6)ppt 43.8% 46.0% (2.2)ppt Underlying compensation ratio 44.5% 47.5% (3.0)ppt 45.4% 47.2% (1.8)ppt Non-compensation ratio 28.9% 32.4% (3.5)ppt 28.2% 29.4% (1.2)ppt Underlying non-compensation ratio 28.2% 33.2% (5.0)ppt 26.5% 30.0% (3.5)ppt Reconciliation of profitability ratios Net income 991 680 46% 3,042 2,277 34% Add (deduct):
Reversal of 1999/2000 credits for tax rate changes 302 3 N/M 333 120 178% Cumulative effect of accounting changes, net of tax – – N/M – – N/M
Adjusted net income 1,293 683 89% 3,375 2,397 41% Average shareholders’ equity 28,610 26,557 8% 27,263 27,773 (2)% Add (deduct):
Average unrealized gains on securities available for sale, net of tax and average deferred taxes relating to 1999 and 2000 tax rate changes in Germany (2,155) (1,592) 35% (1,780) (1,697) 5% Average dividends (769) (400) 92% (978) (851) 15%
Average active equity 25,687 24,566 5% 24,505 25,225 (3)% Return on average shareholders’ equity (after tax) 13.9% 10.2% 3.7 ppt 14.9% 10.9% 4.0 ppt Adjusted return on average active equity (after tax) 20.1% 11.1% 9.0 ppt 18.4% 12.7% 5.7 ppt Pre-tax return on average shareholders’ equity 26.3% 15.2% 11.1 ppt 24.8% 17.9% 6.9 ppt Pre-tax return on average active equity 29.2% 16.4% 12.8 ppt 27.6% 19.7% 7.9 ppt Underlying pre-tax return on average active equity 24.5% 14.4% 10.1 ppt 26.6% 17.9% 8.7 ppt Equity turnover (based on average shareholders’ equity) 92.5% 76.2% 16.3 ppt 93.4% 79.7% 13.7 ppt Equity turnover (based on average active equity) 103.0% 82.3% 20.7 ppt 103.9% 87.8% 16.1 ppt Underlying equity turnover (based on average active equity) 95.7% 79.8% 15.9 ppt 100.3% 85.4% 14.9 ppt Profit margin 28.4% 19.9% 8.5 ppt 26.6% 22.5% 4.1 ppt Underlying profit margin 25.6% 18.0% 7.6 ppt 26.5% 21.0% 5.5 ppt
ppt – percentage points N/M – Not meaningful