Embed Size (px)
Citation preview

1. Introduction
As tundish represents the important link between thebatch steelmaking and the continuous casting process, it re-ceives liquid steel from the ladle and delivers the same intothe mold(s) after attaining a particular bath height in thepresence of a slag layer constantly and continuously. Fluidflow in a tundish is very complex in nature i.e. highly turbu-lent at the inlet and outlet region and very weak near thesolid walls. The flow is three dimensional with strong spa-tial variations and hence, it can not be characterized by asingle value of the residence time, e.g., there is a distribu-tion of the residence time meaning that different volumes ofthe fluid spend different times in the tundish. It may benoted that tundish is the last refractory lined reactor, whichhandles molten steel prior to solidification and thus offersan opportunity to perform certain metallurgical operations.As majority of metallurgical operations are governed byheat and mass transfer, consequently, the nature of the fluidflow (viz., spatial velocity distribution, turbulent kinetic en-ergy, etc.) influences tundish performance considerably.Therefore, a detailed knowledge of melt flow parametersand RTD in a steelmaking tundish is prerequisite in order toassess the suitability of any given metallurgical operations.
An important way to qualitatively assess fluid flow intundish is through the study of residence time distribution(RTD). Occasionally, RTD measurements are also appliedto directly assess the reliability of the hydrodynamic modeldeveloped. Consequently, numerous studies have been re-ported in the literature1) on fluid flow and RTD in steelmak-ing tundish. A vast majority of these studies were, however,restricted to a single or two-strand slab caster under isother-mal conditions. Thus, not much information on multi-strand tundish regarding fluid flow and RTD is available inthe literature. In physical model studies of multi-strandtundishes, experimental data on RTD were typically meas-ured and reported for individual strands only.2–6) From suchmeasurements the proportions of various flow volumes(e.g., dead, plug, well mixed, etc.) cannot be directly esti-mated, since many of concepts applied to evaluate concen-tration vs. time curves (C curves) for single strand tundishsystem cannot be extrapolated to multi-strand tundish sys-tems in a straight forward fashion. As a consequence ofthese considerations, modified procedures are required forevaluating the set of C curves and hence the RTD parame-ters, for a multi-strand tundish. Thus the objective of thepresent paper is decided to provide a basis for the system-atic hydrodynamic analysis of a multi-strand steelmaking
1618© 2007 ISIJ
ISIJ International, Vol. 47 (2007), No. 11, pp. 1618–1624
Basis for Systematic Hydrodynamic Analysis of a Multi-strandTundish
Anil KUMAR,1) Satish C. KORIA2) and Dipak MAZUMDAR2)
1) Steelmaking and Casting Research Group, Department of Research & Development, Tata Steel, Jamshedpur-831 001,India. E-mail: [email protected] 2) Department of Materials and Metallurgical Engg, IIT Kanpur–208 016,India. E-mail: [email protected], [email protected]
(Received on June 28, 2007; accepted on August 16, 2007 )
Despite significant work done till date on single/dual strand tundish (those applied to slab casting) notmuch information on an equivalent multi-strand tundish (which are of significance to billet casting) is avail-able regarding residence time distribution (RTD) measurements and its analysis. The proportions of variousflow volumes estimation (e.g., dead, plug, well mixed, etc.) on the basis of a single/dual strand tundish can-not be directly extrapolated to a multi-strand tundish from its individual strand data only. In the presentstudy, therefore, the principle and the methodology underlying the derivation for concentration vs. timecurves (C curves) of a multi-strand tundish is addressed to provide a basis for the evaluation of RTD parame-ters. To this end, several experiments in a four-strand water model tundish were carried out for RTD meas-urements and estimation of associated flow volumes. The tracer dispersion experiments were performedby injecting potassium chloride (20 mL solution) as a pulse into the submerged inlet stream and the variationof conductivity of water caused by the differential mixing of the injected tracer into the bath were recordedcontinuously at the exits of the water model tundish with a 75 L volume. These conductivity values of indi-vidual strands were converted into corresponding concentrations, and the dimensionless concentrationswere plotted against dimensionless time to derive the characteristic C curves. The individual C curves effectthe strand to strand variations whereas the overall C curve (average of individual C curves) is used to deter-mine the flow volumes in a multi-strand tundish system.
KEY WORDS: residence time distribution; RTD parameters; individual C curves; overall C curve; flow vol-umes; multi-strand tundish; water model; systematic hydrodynamic analysis.
tundish system.
2. Derivation of RTD Parameters for a Multi-strandTundish
Assuming the inlet volumetric flow rate (Q) dividedthrough all “N” strands is identical (q) under steady stateand total mass of the injected tracer at the inlet is M. Hencethe above statement can be represented mathematically asfollows:
.................................(1)
and
Q�N ·q ....................................(2)
The amount of injected tracer flowing out in a time periodD t through any of the N strands (say ith strand), Dmi isgiven by:
Dmi�ci(t)qD t ................................(3)
Assuming D t→0, and hence Dmi→0 the above equationcan be written in differential form as:
dmi�ci(t)qdt.................................(4)
where ci(t) is tracer concentration at a time t. Similarly, thecorresponding fraction of material that flows out throughthe exit “i” in the period of dt is represented by:
.............................(5)
Integrating the above expression between the limit t�0 tot�∞ and applying ∑ both side from i�1 to N, we get,
..................(6)
or,
........................(7)
or,
.......................(8)
or,
................................(9)
The left-hand side of the expression (9) is the overall RTDfunction for multi-strands, which is the average of individ-ual RTD functions as expressed via the bracketed quantityon the left-hand side of Eq. (8). The individual RTD func-tion is thus defined as the parameter ci(t)Q/M. Therefore, acharacteristic C curve can be readily derived for the giventundish from the individual strand data since E(t) is directlyproportional to the concentration, c (Q and M being con-stant) in the tundish system.
3. Experimental Set-up
Figure 1 shows a schematic of the complete experimen-
E t dt( ) �10
α
∫
E t dti ( )0
1α
∫
�
1
1N
i
N
�
∑
c t Qdt
M N
i ( )0 1
α
∫⋅
�i
N
�1∑
c t qdt
M
i ( )0
α
∫
m
Mi
i
N
i
N
∑ ∑� �
�1 1
dm
M
c t qdt
Mi i�
( )
M mi
N
�1
∑
ISIJ International, Vol. 47 (2007), No. 11
1619 © 2007 ISIJ
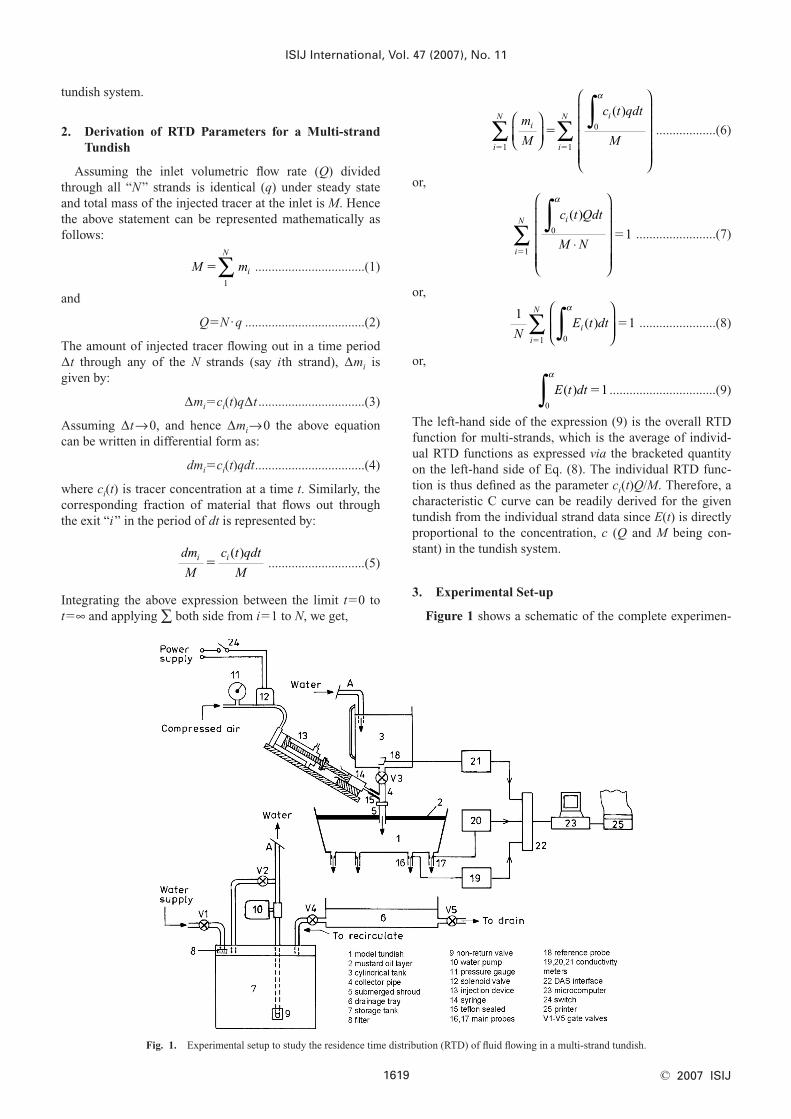
Fig. 1. Experimental setup to study the residence time distribution (RTD) of fluid flowing in a multi-strand tundish.

tal set-up for tracer dispersion measurement. It consists of amodel tundish, water supply system, tracer injection anddata acquisition devices.
3.1. Model Tundish
The present water model tundish is based on the Froudenumber similarity criteria and the characteristic parametersof industrial and model tundish have already been tabulatedin the previous publications.7,8) The geometry of the modeltundish is shown in Fig. 2. It is fabricated from a 10 mmthick Perspex glass sheet. The tundish has rectangularcross-section and having all sidewalls inclined by 10° withthe vertical. The base dimension is 1 000 mm�230 mm andheight is 365 mm. The maximum capacity is 0.116 m3. Fournozzles of diameter 7 mm each are provided at the centre ofthe base of the tundish. The tundish is provided withgrooves so that flow control devices (FCDs) such as dam,weir, and slotted dam can be inserted at any desired loca-tion as shown in the figure. The slotted dam was made by12 mm thick Perspex glass sheet. Figure 3 shows aschematic of the slotted dam. Thirty-two holes of 12.7 mmdiameter were drilled at an inclination of 27° (upward) withthe horizontal. The holes were arranged in six columns forinitially four rows from the base and eight columns for fur-
ther two rows as shown in the figure.
3.2. Water Supply
Water supply in all the experiments was obtained from a1 000 L-water storage tank. From the storage tank, waterwas transferred into a 500 L capacity of cylindrical vessel,which was placed 400 mm above the tundish. A 4 mm di-ameter of glass tube was mounted outside the vessel to in-dicate the water level in the cylindrical vessel. The waterlevel in the cylindrical vessel was maintained constant dur-ing the experiment. At the bottom of the vessel, a gatevalve (V3 in Fig. 1) with a 250 mm long pipe (hereaftertermed as collector pipe) was provided to control the waterflow rate into the tundish. The water from the tundish exitwas recirculated or drained via a tray placed below thetundish as shown in Fig. 1. The recirculation or drainage ofwater was achieved by gate valves (V4 and V5), whichwere provided near the base of the tray.
3.3. Tracer Injection
Potassium chloride (KCl) was used as a tracer in thepresent study. Tracer was injected into the inlet stream inthe form of a pulse and its distribution was measured withinand at the exits of the tundish. Tracer injection was done bya plastic syringe, which was placed in between the collectorpipe and a pneumatically operated cylinder-piston assem-bly, which was mounted on a steel plate as shown in Fig. 1.Air supply to the cylinder-piston was controlled by a sole-noid valve.
3.4. Data Acquisition System3.4.1. Probes Design and Preparation
Figure 4 shows the self-designed reference and mainprobes for online measurement of electrical conductivity ofwater. Two rectangular cross-section of equal and identicalplatinum foils (7 mm�7 mm and thickness 0.1 mm) werefixed to the inner surface of Perspex glass (rectangular sheet
ISIJ International, Vol. 47 (2007), No. 11
1620© 2007 ISIJ
Fig. 2. Configurations of a multi-strand water model tundish.
Fig. 3. Design of slotted dam for model tundish.Fig. 4. Schematic of self-designed online conductivity meter
probes (a) reference probe and (b) main probe.

for reference probe and cylindrical tube for main probes),which were opposite to each other. The outer surface of theplatinum foils was spot welded and extended firmly toavoid any tension in the copper wires as shown in the fig-ure. Thus the cell constant of these self-designed probeswas maintained within the range of 0.9 to 1.0, which wasdefined as the length between two platinum foils divided bythe effective area between them. One end of the main probewas externally threaded to install itself at the tundish baseholes (exits). Similarly, the reference probe was installed inthe cylindrical vessel just above the inlet stream region asshown in Fig. 1. Each platinum probe was fixed to a sepa-rate conductivity meter. In order to eliminate the polariza-tion effects caused by the alternating current, the platinumfoils were coated with a layer of finely divided platinumblack. This was carried out by electrolysis of a solutioncontaining 1% platinum chloride and 0.02% of lead ac-etate. The following procedure was adopted for platiniza-tion9):• The old coating was stripped off with the aqua regia solu-
tion and was rinsed with distilled water.• A solution containing 100 mg platinum chloride and
1 mg lead acetate in 30 mL of distilled water was pre-pared.
• The probe with platinum foils was immersed in theabove-prepared solution and D.C. current of density2�10�4 A mm�2 was passed for 10 min in one directionand then reversed for the same period.
• The foils were rinsed in distilled water and immersed in5% solution of H2SO4. The current of the same densityas mentioned above was passed for 10 min in one direc-tion and for another 10 min in reverse direction.
• The foils were rinsed in distilled water and thus the probewas ready for use.
• When the probes were not in use, these were kept im-mersed into distilled water.
3.4.2. Probes Calibration
The calibrations of the conductivity measuring probeswere performed by using a 0.1 N potassium chloride solu-tion. The probe was immersed into 0.1 N solution and thecell constant knob was adjusted to match the conductivityvalue given by conductivity meter with the known conduc-tivity value. The potassium chloride solutions of differentconcentrations, 1�10�2, 2�10�2, 3�10�2, 4�10�2, 5�10�2, and 6�10�2 g/L were prepared by using tap water.The conductivity of these solutions was measured with themain probes and that of tap water with reference probe. Itwas carried that temperature of solutions and tap water wasmaintained identical during conductivity measurements.The conductivity of solutions due to potassium chloride(i.e., obtained by subtracting conductivity of tap water fromthe conductivity of potassium chloride solutions) was plot-ted against the concentration of solution as shown in Fig. 5.The following relationship was obtained by least squareanalysis:
c�4.62�102W .............................(10)
In the above equation, c is in g/L and W is in ohm�1 cm�1.The variation of temperature of water within the experi-mental range of 22° to 27°C was found to have no effect on
the above correlation. Whenever the platinum foils ofprobes were recoated with platinum black, the calibrationwas repeated.
3.4.3. Analog–Digital Converter
The online millivolt signals thus generated by these con-ductivity meters were fed to the microcomputer through theindividual channel of an analog-digital converter, ADC(ADVANTECH-PCI-1711) interface card. There were 16input channels available on the ADC card. There was an in-built filter circuit for rejecting the input noise. The analoginput voltage range was 0 to �40 mV. The provision wasthere for amplifier gain selection of 1, 10 or 100. The sam-pling rate of the ADC was taken five samples per second inthe present study. Software was developed for data collec-tion and processing. Data were stored into arrays and trans-ferred into data files. These data were processed further toobtain a C curves.
4. Experimental Procedure
The filled syringe with the 20 mL solution of potassiumchloride (strength�200 g/L) was placed in between thecylinder-piston assembly and collector pipe, with its needleinserted into the brace tube of the collector pipe as shownin Fig. 1. The head of the piston of cylinder-piston assem-bly was moved forward to make it just touch the plunger ofthe syringe. In the storage tank, water was filled upto the re-quired level, wherefrom water was pumped into the over-head cylindrical. The water from cylindrical vessel was fur-ther supplied to the tundish and recirculated via the trayinto the storage tank. Water levels in the cylindrical vessel(800 mm) and in the tundish (260 mm) were maintainedwith the help of valves V2 and V3 respectively. The recir-culation of water was continued for 15 min to establish asteady state flow field in the tundish. Consequently, thepulse injection of tracer was performed by the switch pro-vided on the solenoid valve as shown in Fig. 1. After tracerinjection, the differential conductivity of water at the exitwas recorded continuously on the microcomputer for20 min duration (�2.5 times the theoretical residence time).On the completion of the experiment, the water flow intoand out of the tundish was stopped. The tundish water wasthen stirred thoroughly to mix the tracer uniformly and theaverage conductivity of water (tundish bath) was measured.This value of conductivity was later used to determine theamount of residual tracer left in the tundish after the com-
ISIJ International, Vol. 47 (2007), No. 11
1621 © 2007 ISIJ
Fig. 5. Calibration of self-designed conductivity meter probes.

pletion of experiment (Mr).
5. Results and Discussion
Several experiments were performed to understand thefluid flow and the variations of concentration of tracer dis-persing into water flowing in a four-strand tundish with andwithout flow control devices (FCDs) for single phase sys-tem. The experiments (run no. 1 and 2) were conducted forthe bare tundish whereas experiments (run no. 3) were per-formed in the presence of slotted dams which were sym-metrically placed 0.97 m both sides of the ladle shroud (i.e.,inlet stream of 0.02 m dia.). In all the experiments, the op-erating bath height was maintained 0.26 m with the volu-metric flow rate of 1.55�10�4 m3 s�1 and the submergencedepth 0.04 m.
All the conductivity vs. time data recorded by data acqui-sition system during experiments was used to calculatetracer concentration vs. time, net outflow of tracer and toobtain a normalized C curve. In all such cases, the conduc-tivity values were converted into concentration by Eq. (10).The mean residence times (t) and the variances (s2) werecalculated from experimental data according to followingexpressions and listed in Table 1 for three runs (it may benoted that suffix ‘i’ in the left side of the Eqs. (11), (13) and(15) represents individual strand parameter):
...................(11)
..............(12)
................(13)
..........(14)
In all the expressions “j” represents the number of instanta-neous data recorded with equal time interval, D t. The in-stantaneous individual dimensionless concentration (Ci),
and the overall dimensionless concentration (C ) were re-spectively calculated by:
...........................(15)
....................(16)
The generalized corresponding dimensionless times (q) andvariances (s2) were derived respectively with the help ofEqs. (11) to (14) in terms of theoretical residence time(t̄�V/Q; where V is the volume of the fluid in tundish) asfollows:
...(17)
.................................(18)
In any given experiments the entire amount of injectedtracer could not flow out of the tundish at the end of the ex-periments (i.e., some amount of tracer remained always inthe tundish). The mass balance of tracer was then given by:
M�Me�Mr�Derror ........................(19)
In the above equation, Me, the total amount of tracer leavingthe tundish via all strands and Mr, the tracer remaining inthe tundish were obtained respectively as:
.....................(20)
Mr�4.62�102Wbath ·V .......................(21)
The percentage of total amount of injected tracer recovered,MR(%), was calculated by expression (22) and tabulated inTable 2. It can be seen that 91–94% of the total amount ofthe tracer injected could be recovered. Small percentageloss of the tracer, Derror, (i.e., 6–9%) was considered to liewithin the range of acceptable error during experiments.
...................(22)MM M
MRe r(%)��
�100
M q c ti j
ji
N
e ���
,
0
6 000
1∑∑
∆
σ 22
2�
s
t
θ (min or peak or mean) (min or peak or mean)
�t
t
CN
c
MV
i j
j
i
N
��
�
1 0
6 000
1
,∑∑ ⋅
C
c
MVi
i j
j�
�
,
0
6 000
∑⋅
s
Q
Nc t t
Mt
i j i j
ji
N
2
2
0
6000
1� �
��
, ,⋅
⋅∑∑ ∆
mean2
s
q c t t
Mti
i j i j
ji
2
2
0
6 000
� ��
, ,
,
⋅ ⋅∑ ∆
mean2
t
Q
Nc t t
M
i j i j
ji
N
mean ���
, ,⋅
⋅∑∑
0
6 000
1
∆
t
q c t t
Mi
i j i j
j,
, ,
mean ��
⋅ ⋅∑ ∆0
6 000
ISIJ International, Vol. 47 (2007), No. 11
1622© 2007 ISIJ
Table 1. The values of residence time parameters and variances for a four-strand tundish system.

Figure 6(a) represents the individual C curves of one halfof the four-strand bare tundish (run no. 1) whereas the over-all C curves of both halves of the four-strand bare tundish(run no. 1 and 2) are presented in Fig. 6(b). As seen, theshort-circuiting phenomena appeared in the inner strand ofthe four-strand bare tundish. The overall C curve for onehalf (derived from two individual C curves lying on onehalf of the tundish) of the tundish is almost identical to theother (see Fig. 6(b)). This indicates that the flow is symmet-rical with respect to the inlet stream of the tundish. More-over, these shows that due to symmetry flow, the two identi-cal C curves of only one half can be taken as representativeC curves for overall tundish (since the other pair can be de-duced automatically). It is interesting to note that the over-all C curves (a combination of the individual C curves) also
show the short-circuiting in the system. Figure 7 shows theeffect of slotted dam on RTD parameters (run no. 3). In thiscase, the short-circuiting phenomenon is eliminated, whichis confirmed by the appearance of a single peak in “C”curve for each individual strand. It can be seen from theFig. 7 that the use of slotted dam is somewhat superior incomparison to bare tundish. The C curves for both thestrands are almost similar, which further confirm that thestrand to strand variations in a four-strand tundish is ex-pected to be very small strand variations (chemistry and ho-mogenization of the alloying elements in the cast product)during the continuous casting processes. Also the minimumbreakthrough time and mean residence time are signifi-cantly increased in case of slotted dam (viz., run no. 3 inTable 1).
In the present study two different shapes of C curveswere obtained. One of these curves is characterized by thepresence of two peaks (for example, in case of bare tundish,see Fig. 6) and the other characterized by a single peakvalue of concentration (i.e., in the presence of slotted dam,see Fig. 7). The corresponding flow characteristics of the Ccurves are shown in Figs. 8(a) and 8(b) respectively. Basedon preceding discussion on this therefore suggests that fourtypes of flow regions are associated with the tundish systemsuch as short circuited region, plug flow, mixed flow anddead flow region. Quantitatively the short-circuiting volume(Vsc) was determined from the area bounded by the first
ISIJ International, Vol. 47 (2007), No. 11
1623 © 2007 ISIJ
Table 2. Mass balance of the tracer injected into the tundish.
Fig. 6. Experimentally measured C curves for the four-strandbare tundish (a) C curves of individual strands in one halfof the tundish and (b) overall C curves of both halves ofthe tundish.
Fig. 7. Experimentally measured individual C curves of a four-strand tundish in the presence of slotted dam.
Fig. 8. Schematic of flow characterization of a multi-strandtundish (a) bare tundish and (b) with flow control de-vices.

peak value of concentration of C curve according to Singhand Koria.10) It was observed that qmin≠qpeak for all experi-ments due to the presence of a considerable axial or longi-tudinal diffusion in the tundish system. Also, it was ob-served that all the C curves have a long tail. Sahai andEmi11) demonstrated that appearing a long tail in the Ccurve beyond two times of the mean residence time (q) wassimply due to the effect of dead volume but recently Zonget al.12) suggested that the tail data is derived not only fromthe dead regions, but from the exponential edge caused byextensive mixing and they applied q�2.5 for the estimationof qmean throughout their experiments.
The performance of a multi-strand tundish can be char-acterized, (i) by the different associated flow volumes onthe basis of overall C curve and (ii) by strand similarity onthe basis of individual C curves. The RTD parameters,which were derived from the C curves, are used to establishthe associated volume fractions in the tundish. The plugvolume (Vp), the dead volume (Vd) and the well-mixed vol-ume (Vm) were derived, respectively, from the following re-lationship:
.......................(23)
.........................(24)
Vm�1�Vp�Vd�Vsc .........................(25)
The quantity Qa/Q was the fractional volumetric flow ratethrough the active region and was numerically equal to thearea under the curve between the bounds q�0 to q�2.5
(except bare tundish). All the associated volume fractionsderived from the average overall C curve (run no. 1 through3) for a multi-strand tundish are listed in Table 3. It may benoted that the insertion of slotted dam into the tundishmodifies the flow pattern and improves its performance(short circuited region is eliminated and dead volume issignificantly decreased).
6. Conclusions
The overall C curve of a multi-strand tundish is derivedby the average of all individual strand data as a function oftime. The performance of a multi-strand tundish can becharacterized by both, the different associated flow volumeson the basis of overall C curve and the strand similarity onthe basis of individual C curves. In the present study twodifferent shapes of C curves were obtained. One of thesecurves is characterized by the presence of two peaks andother by a single peak value of concentration. The first typeof C curve is due to short-circuiting of flow in the baretundish. Use of flow control devices such as slotted dameliminates the short-circuiting phenomena and improves theflow pattern in the multi-strand tundish.
REFERENCES
1) D. Mazumdar and R. I. L. Guthrie: ISIJ Int., 39 (1999), 524.2) K. M. Godiwalla, S. K. Sinha and C. S. Sivaramakrishnan: Steel
Res., 65 (1994), 267.3) S. K. Sinha, K. M. Godiwalla and C. S. Sivaramakrishnan: Ironmak-
ing Steelmaking, 20 (1993), 485.4) K. M. Godiwalla, S. K. Sinha and C. S. Sivaramakrishnan: Steel-
making Conf. Proc., TMS, Warrendale, PA, (1994), 703.5) K. M. Godiwalla, S. K. Sinha and C. S. Sivaramakrishnan: ISIJ Int.,
33 (1993), 519.6) P. K. Jha, S. K. Dash and S. Kumar: Ironmaking Steelmaking, 29
(2002), 36.7) A. Kumar, D. Mazumdar and S. C. Koria: Metall. Trans. B, 36B
(2005), 777.8) A. Kumar, S. C. Koria and D. Mazumdar: ISIJ Int., 44 (2004), 1334.9) Conductivity Meter User Guide, Systronics Ltd., India, (2000).
10) S. Singh and S. C. Koria: Ironmaking Steelmaking, 23 (1996), 255.11) Y. Sahai and T. Emi: ISIJ Int., 36 (1996), 661.12) J. H. Zong, K.-W. Yi and J.-K. Yoon: ISIJ Int., 39 (1999), 139.
VQ
Qda
mean� �1 ⋅θ
Vp min peak� �1
2( )θ θ
ISIJ International, Vol. 47 (2007), No. 11
1624© 2007 ISIJ
Table 3. Overall RTD parameters and the associated volumefractions in a four-strand tundish system.