Embed Size (px)
Citation preview

BASINWIDE ASSESSMENT REPORT
WATAUGA RIVER BASIN
NORTH CAROLINA DEPARTMENT OF ENVIRONMENT AND NATURAL RESOURCES Division of Water Quality Environmental Sciences Section April 2005

TABLE OF CONTENTS
Page LIST OF APPENDICES ..........................................................................................................................2 LIST OF TABLES....................................................................................................................................2 LIST OF FIGURES..................................................................................................................................2 WATAUGA RIVER SUBBASIN 01..........................................................................................................3 Description .................................................................................................................................3 Overview of Water Quality .........................................................................................................4 River and Stream Assessment ..................................................................................................5 REFERENCES......................................................................................................................................19 GLOSSARY ..........................................................................................................................................20
NCDENR, Division of Water Quality Basinwide Assessment Report – Watauga River Basin – April 2005
1

LIST OF APPENDICES
Appendix Page F-1 Habitat evaluations and stream and riparian habitats at fish community monitoring sites in the
Watauga River basin....................................................................................................................22 F-2 Fish community sampling methods and criteria...........................................................................24 F-3 Fish community data collected from the Watauga River basin, 2004..........................................29 F-4 Fish community metric values from 10 wadeable streams in the Watauga River Basinwide
monitoring program, 2004............................................................................................................30 F-5 Fish distributional records for the Watauga River basin ..............................................................31 F-6 Water quality at fish community sites in the Watauga River basin, 2004 ....................................31 B-1 Benthic macroinvertebrate data collected in the Watauga River basin, 1999-2004, summary, and
sampling methods and criteria .....................................................................................................33
LIST OF TABLES
Table Page 1 Waterbodies monitored in Subbasin 01 in the Watauga River basin for basinwide assessment, 1999 - 2004............................................................................................5
LIST OF FIGURES Figure Page
1 Sampling sites in Subbasin 01 of the Watauga River basin .........................................................3 2 Flows of the Watauga River, August 2003 – February 2005………………………………………...6
NCDENR, Division of Water Quality Basinwide Assessment Report – Watauga River Basin – April 2005
2
WATAUGA RIVER SUBBASIN 01
Description
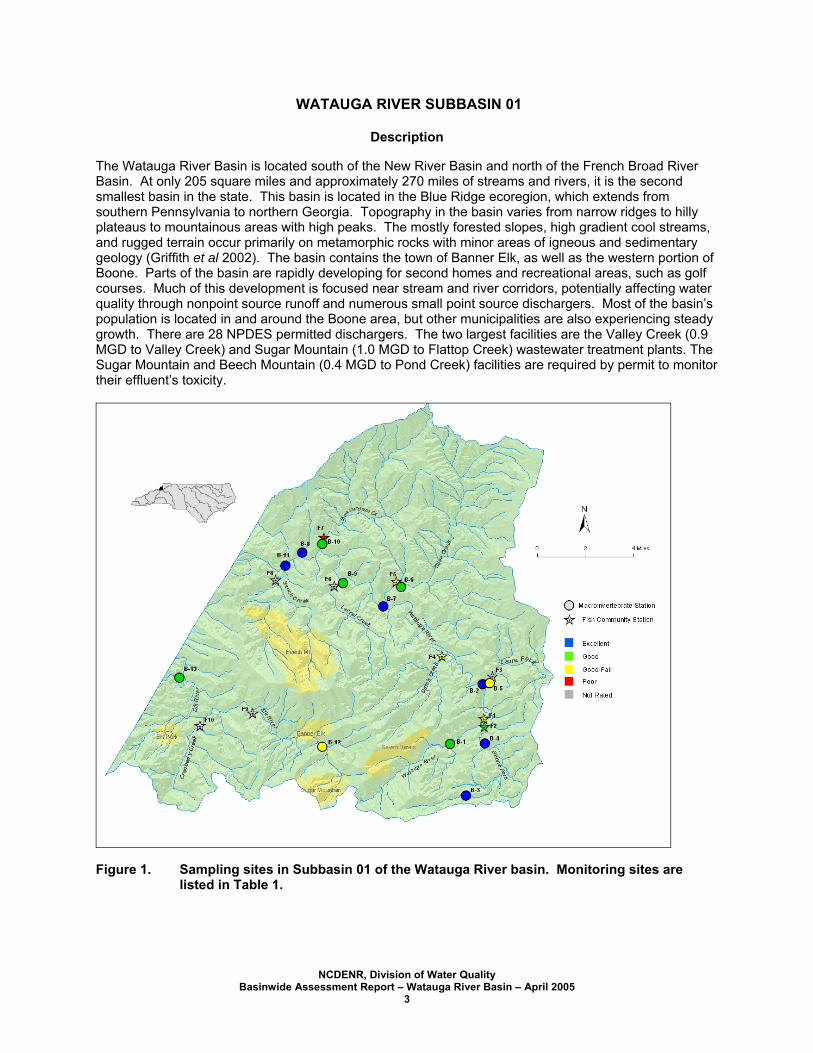
The Watauga River Basin is located south of the New River Basin and north of the French Broad River Basin. At only 205 square miles and approximately 270 miles of streams and rivers, it is the second smallest basin in the state. This basin is located in the Blue Ridge ecoregion, which extends from southern Pennsylvania to northern Georgia. Topography in the basin varies from narrow ridges to hilly plateaus to mountainous areas with high peaks. The mostly forested slopes, high gradient cool streams, and rugged terrain occur primarily on metamorphic rocks with minor areas of igneous and sedimentary geology (Griffith et al 2002). The basin contains the town of Banner Elk, as well as the western portion of Boone. Parts of the basin are rapidly developing for second homes and recreational areas, such as golf courses. Much of this development is focused near stream and river corridors, potentially affecting water quality through nonpoint source runoff and numerous small point source dischargers. Most of the basin’s population is located in and around the Boone area, but other municipalities are also experiencing steady growth. There are 28 NPDES permitted dischargers. The two largest facilities are the Valley Creek (0.9 MGD to Valley Creek) and Sugar Mountain (1.0 MGD to Flattop Creek) wastewater treatment plants. The Sugar Mountain and Beech Mountain (0.4 MGD to Pond Creek) facilities are required by permit to monitor their effluent’s toxicity.
Figure 1. Sampling sites in Subbasin 01 of the Watauga River basin. Monitoring sites are
listed in Table 1.
NCDENR, Division of Water Quality Basinwide Assessment Report – Watauga River Basin – April 2005
3

Overview of Water Quality The Watauga Basin includes the Watauga and Elk Rivers and their tributaries. Overall, water quality in this basin is very good, with the majority of sites having a bioclassification of Good or Excellent based on macroinvertebrate data. Three sites in the basin appear to have improved in 2004 from 1999 ratings. The upper segment of the Watauga River near Foscoe at SR 1594 improved from a Good-Fair rating in 1999 to a Good rating in 2004, the lower Boone Fork site improved from Good to Excellent, and the Watauga River at SR 1121 near Sugar Grove improved from Good to Excellent. It was noted in the previous Watauga Basin Assessment Report that EPT taxa richness values were declining for the Watauga River at NC 105 (Shulls Mill) and at SR 1121 (Sugar Grove). However, the EPT richness increased at both locations in 2004. In fact, the Watauga River at NC 105 had the highest EPT taxa richness (55) of any site in the basin. This was the highest EPT taxa richness ever recorded at NC 105 since summer sampling began in 1985. Sugar Grove’s bioclassification improved from Good to Excellent (EPT richness = 47 in 2004 and 38 in 1999). The two mainstem Elk River sites were the only portion of the Watauga basin that showed a decline in water quality. The Elk River off NC 184 above Banner Elk declined from a Good rating in 1999 to a Good-Fair rating in 2004. The Elk River at SR 1305 declined from Excellent to Good. Declining bioclassifications at both ElK River sites indicated water quality concerns in that watershed. The entire Watauga River was classified as High Quality Waters in 1990, and Boone Fork and its tributaries were classified as Outstanding Resource Waters in 1993. The benthos site on Boone Fork above Price Lake maintained its Excellent bioclassification and the lower site rated Excellent in 2004 after rating Good in 1999. The primary water quality problem in this basin is nonpoint source runoff, including inputs of sediment and nutrients. Many of the catchments in the Watauga River basin are intensively farmed, especially the Cove Creek, Beaverdam Creek and Laurel Creek watersheds. Based upon the macroinvertebrate data, nonpoint source runoff appeared to have some impacts (Good or Good-Fair ratings) on some segments of the Watauga River, Elk River, Cove Creek, Laurel Fork, Laurel Creek, and Beaverdam Creek. Many of the sites that were sampled in this basin have roads that run parallel to the stream, leading to narrow riparian zones with frequent breaks. In 2004, ten fish sites were sampled in the Watauga River basin in early May. No previous fish community assessments had been performed by DWQ in any of these streams. The most commonly collected species were the central stoneroller and the northern hog sucker, which were collected at all sites. The central stoneroller was the numerically dominant species, comprising about 30 percent of all of the individuals collected. Brown trout and blacknose dace were also very common species (collected at 9 out of 10 sites). Five of the 10 stream sites in the Watauga River basin were evaluated using the North Carolina Index of Biotic Integrity (NCIBI) (Appendices F-2 – F-5). Five of the sites were not rated with the NCIBI because “Trout stream” specific criteria and metrics have not yet been developed. For the five ratable streams, the NCIBI resulted in one Poor, three Good-Fair, and one Good rating, with scores ranging from 26 to 50. The most degraded stream with a bioclassification of Poor was Beaverdam Creek. Although the habitat quality was very good at this site (habitat score = 87 out of 100), instream sedimentation from the intense upstream agricultural land use is likely the cause for the low fish species diversity. The Watauga River, Dutch Creek, and Cove Creek also showed some degradation, with ratings of Good-Fair. Habitat characteristics and examples of high and low quality habitat sites in the basin are presented in Appendix F-1. The four fish communities in this basin that rated Good-Fair and Good were found with habitats of moderate to high quality, except Cove Creek (habitat score = 58). The one site that rated Poor (Beaverdam Creek) was sampled in an atypical, high gradient reach of the stream. The lack of correlation between the Poor rating and the high quality habitat at Beaverdam Creek may be related to the extensive degraded habitat found just upstream adjacent to agricultural land use. The Not Rated fish
NCDENR, Division of Water Quality Basinwide Assessment Report – Watauga River Basin – April 2005
4

community sites in the basin were all trout streams found with habitats of moderate to high quality (scores ranging from 70 to 88). There are four ambient water quality monitoring sites in the basin and all are located on the Watauga River. The ambient locations are: the Watauga River at SR 1557 near Shulls Mill, NC 105 at Shulls Mill, SR 1114 near Valle Crucis, and SR 1121 near Sugar Grove. Very few values at these sites surpassed the applicable water quality standards or action levels since 1999 (data for SR 1557 begins 7/13/2000). The Watauga River at SR 1557 had three measurements (two turbidity and one iron) exceeding water quality standards or action levels. The Watauga River at NC 105 and SR 1114 each had one copper measurement exceeding the action level. The Watauga River at SR 1121 had five measurements (two turbidity, one copper, one iron, and one zinc) exceeding water quality standards or action levels.
Table 1. Waterbodies monitored in Subbasin 01 in the Watauga River basin for basinwide assessment, 1999
and 2004.
Map # Waterbody County Location 1999 2004 B-1 Watauga R Watauga SR 1580 Good-Fair Good B-2 Watauga R Watauga NC 105 Excellent Excellent B-3 Boone Fk Watauga SR 1561 Excellent Excellent B-4 Boone Fk Watauga Off SR 1558 Good Excellent B-5 Laurel Fk Watauga SR 1111 Good-Fair Good-Fair B-6 Cove Cr Watauga SR 1149 Good Good B-7 Watauga R Watauga SR 1121 Good Excellent B-8 Watauga R Watauga SR 1200 Excellent Excellent B-9 Laurel Cr Watauga Off SR 1123 Good Good
B-10 Beaverdam Cr Watauga SR 1202 Good Good B-11 Beech Cr Watauga US 321 Excellent Excellent B-12 Elk R Avery off NC 184 Good Good-Fair B-13 Elk R Avery SR 1305 Excellent Good
F-1 Watauga River Watauga off SR 1557 --- Good-Fair F-2 Boone Fork Watauga off SR 1558 --- Good F-3 Laurel Fork Watauga SR 1111 --- Not Rated F-4 Dutch Creek Watauga SR 1112/NC 194 --- Good-Fair F-5 Cove Creek Watauga SR 1149 --- Good-Fair F-6 Laurel Creek Watauga SR 1123 --- Not Rated F-7 Beaverdam Creek Watauga SR 1202 --- Poor F-8 Beech Creek Avery off SR 1312 --- Not Rated F-9 Elk River Avery SR 1326 --- Not Rated
F-10 Cranberry Creek Avery NC 194 --- Not Rated
River and Stream Assessment Valley Creek at NC 105 was not sampled for macroinvertebrates in 2004 since it was determined that the drainage area is less than one square mile. However, there are several dischargers on Valley Creek and it may be advisable to collect a benthic sample as a special study during the next basinwide sampling to monitor the water quality of this small tributary to the Watauga River. All of the fish community sites in this subbasin were sampled by DWQ for the first time in 2004. The 2004 basinwide assessment will therefore serve as a baseline for the 2009 basinwide monitoring cycle. With the exception of Cove Creek, all of the fish community sites in this subbasin are supplementally classified as trout waters (Tr). The North Carolina Wildlife Resources Commission also manages portions of Dutch, Laurel, and Beech Creeks as Hatchery Supported Trout Waters. Wild, not stocked, trout were collected from all of the 2004 fish community sites.
NCDENR, Division of Water Quality Basinwide Assessment Report – Watauga River Basin – April 2005
5

Stream flow in the Watauga River basin for August 2004 was 53% of the long-term median flow for the Watauga River near Sugar Grove. For the previous month, July 2004, the stream flow was 97% of the long-term median flow. Figure 2. depicts flow conditions in the Watauga Basin for the period August 2003 (one year prior to basinwide sampling) through February 2005. Flow conditions during 1999 basinwide sampling were 66% and 106% respectively for June and July 1999 of the long term median flow but there was heavy rainfall just prior to benthos collections. Several sites in the basin declined in bioclassification in 1999, but improved in 2004. Some between year changes in the benthic communities may be due largely to flow. High flows magnify the potential effects of nonpoint source runoff, leading to scour, substrate instability, and reduced periphyton. Low flows may accentuate the effect of point source dischargers by providing less dilution of wastes. Sites that experienced improved bioclassifcations in 2004 should be monitored during the next basinwide sampling to determine if the bioclassification indicated an actual improvement in water quality or was instead natural variation affected by flow.
Figure 2. Flows of the Watauga River, August 2003 – February 2005
NCDENR, Division of Water Quality Basinwide Assessment Report – Watauga River Basin – April 2005
6
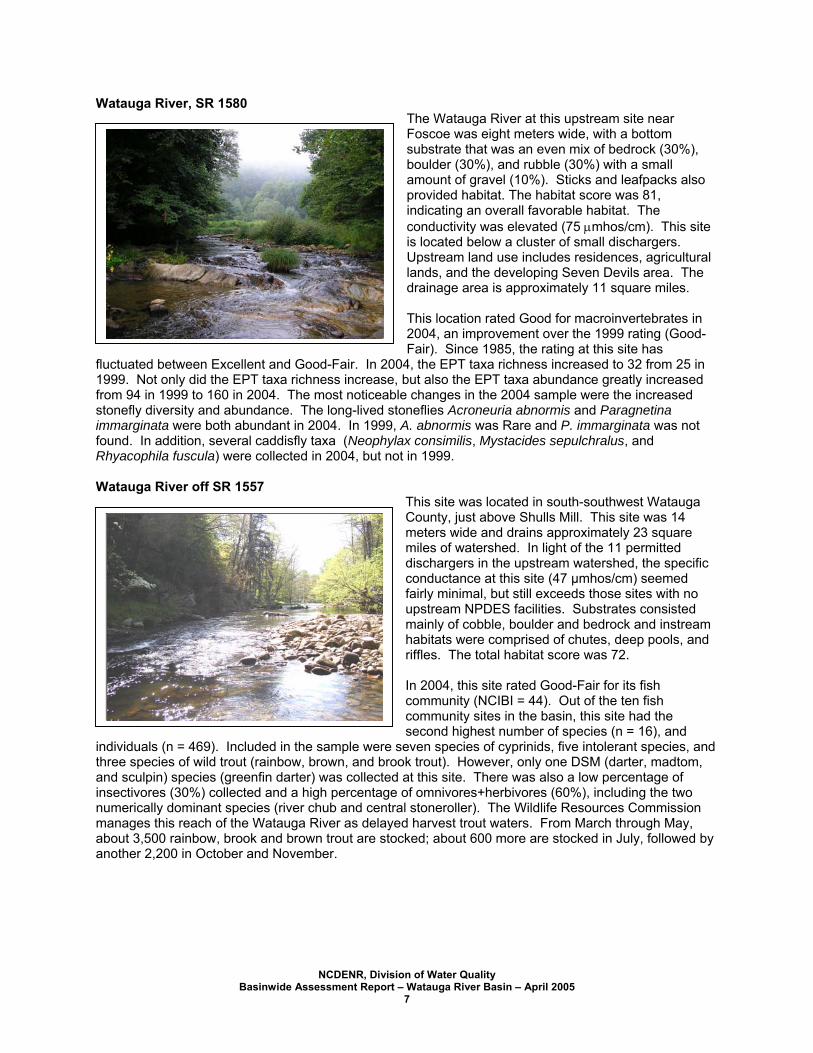
Watauga River, SR 1580 The Watauga River at this upstream site near Foscoe was eight meters wide, with a bottom
f1fsifR W
itainmaa
substrate that was an even mix of bedrock (30%), boulder (30%), and rubble (30%) with a small amount of gravel (10%). Sticks and leafpacks also provided habitat. The habitat score was 81, indicating an overall favorable habitat. The conductivity was elevated (75 µmhos/cm). This site is located below a cluster of small dischargers. Upstream land use includes residences, agricultural lands, and the developing Seven Devils area. The drainage area is approximately 11 square miles. This location rated Good for macroinvertebrates in 2004, an improvement over the 1999 rating (Good-Fair). Since 1985, the rating at this site has
luctuated between Excellent and Good-Fair. In 2004, the EPT taxa richness increased to 32 from 25 in 999. Not only did the EPT taxa richness increase, but also the EPT taxa abundance greatly increased rom 94 in 1999 to 160 in 2004. The most noticeable changes in the 2004 sample were the increased tonefly diversity and abundance. The long-lived stoneflies Acroneuria abnormis and Paragnetina mmarginata were both abundant in 2004. In 1999, A. abnormis was Rare and P. immarginata was not ound. In addition, several caddisfly taxa (Neophylax consimilis, Mystacides sepulchralus, and hyacophila fuscula) were collected in 2004, but not in 1999.
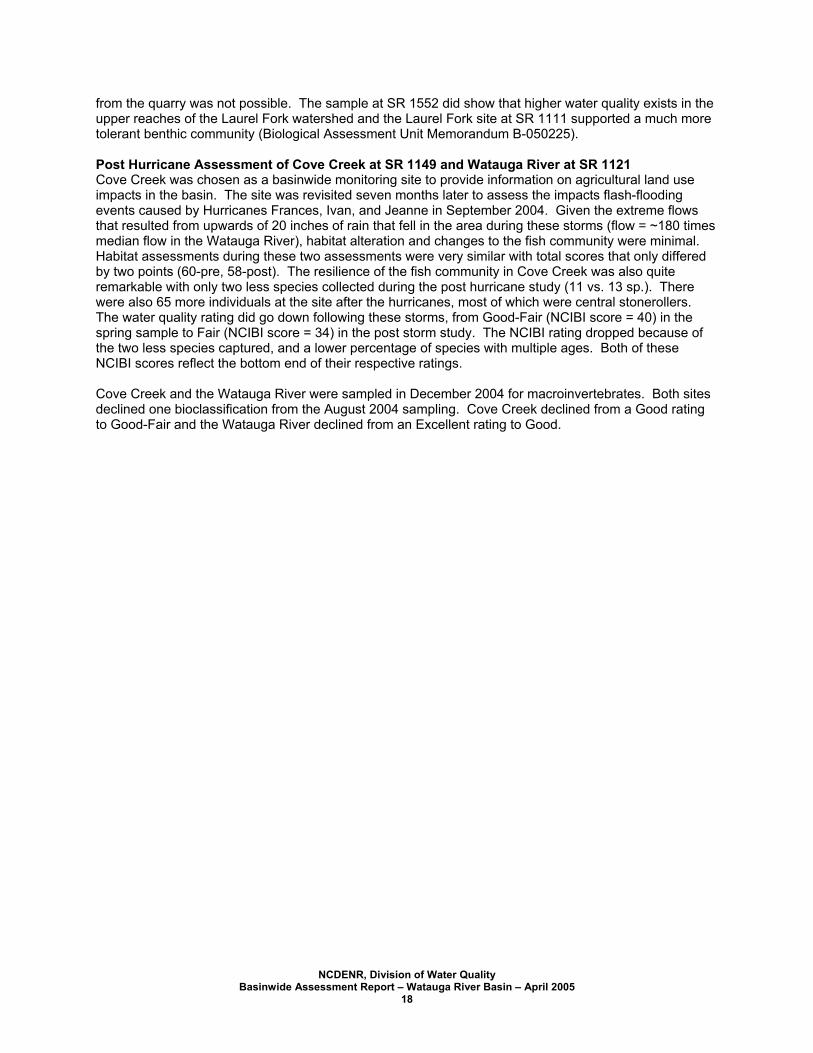
atauga River off SR 1557 This site was located in south-southwest Watauga County, just above Shulls Mill. This site was 14
meters wide and drains approximately 23 square miles of watershed. In light of the 11 permitted dischargers in the upstream watershed, the specific conductance at this site (47 µmhos/cm) seemed fairly minimal, but still exceeds those sites with no upstream NPDES facilities. Substrates consisted mainly of cobble, boulder and bedrock and instream habitats were comprised of chutes, deep pools, and riffles. The total habitat score was 72. In 2004, this site rated Good-Fair for its fish community (NCIBI = 44). Out of the ten fish community sites in the basin, this site had the second highest number of species (n = 16), andndividuals (n = 469). Included in the sample were seven species of cyprinids, five intolerant species, and hree species of wild trout (rainbow, brown, and brook trout). However, only one DSM (darter, madtom, nd sculpin) species (greenfin darter) was collected at this site. There was also a low percentage of
nsectivores (30%) collected and a high percentage of omnivores+herbivores (60%), including the two umerically dominant species (river chub and central stoneroller). The Wildlife Resources Commission anages this reach of the Watauga River as delayed harvest trout waters. From March through May, bout 3,500 rainbow, brook and brown trout are stocked; about 600 more are stocked in July, followed by nother 2,200 in October and November.
NCDENR, Division of Water Quality Basinwide Assessment Report – Watauga River Basin – April 2005
7

Watauga River, NC 105 At NC 105, the Watauga River was 12 meters wide. The drainage area is approximately 27 square miles. When sampled in August 2004 the conductivity was 48 µmhos/cm, which was lower than the upstream site at SR 1580 (75 µmhos/cm). The high habitat score (85) reflected the mixed rocky substrate, edge habitat, and stable banks. The main habitat concern at this location was the close proximity of NC 105 on the right bank. There have been seven summer macroinvertebrate collections at the NC 105 site since 1985, all resulting in Excellent bioclassifications. In terms of EPT taxa richness, the 2004 (55) sample was an improvement over the 1999 (42) and 1994 (40)
samples. The EPT taxa richness was the highest at this site in 2004 for the entire Watauga basin. Notable improvements in 2004 were the increased stonefly diversity from 1999. Stonefly taxa collected in 2004, but not in 1999, included Paragnetina ichusa, Pteronarcys, Suwallia, and Sweltsa. In addition, the number of caddisfly taxa increased to 23 in 2004 from 17 in 1999. The benthic fauna from the seven summer collections appears stable, indicating no decline in water quality at this location. Boone Fork, SR 1561
Boone Fork was a relatively small stream at this site. The width was five meters and the substrate was an
wb
even mix of boulder, rubble, and cobble. The habitat received a high score (92) and the conductivity was 18 µmhos/cm. The drainage area is approximately two square miles. Boone Fork received an Excellent bioclassification in 2004 and 1999 for macroinvertebrates. Over 60% of the total taxa (75) were comprised of EPT taxa (EPT richness = 46), which is typical for small high quality mountain streams. Many of the intolerant benthic organisms collected were indicative of small mountain streams (Epeorus pleuralis, Habrophlebria vibrans, Symphitopsyche macleodi). The BI in 2004
as 2.94, and the EPT BI was 1.76. The macroinvertebrates collected support the Excellent ioclassification, its ORW designation, overall excellent water quality, and favorable habitat.
NCDENR, Division of Water Quality Basinwide Assessment Report – Watauga River Basin – April 2005
8

Boone Fork, off SR 1558
This portion of Boone Fork, below Price Lake, was about 13 meters wide with a rocky substrate. It received the same high habitat score (92) as the upper site on Boone Fork. The drainage area is approximately ten square miles and the conductivity increased slightly to 26 µmhos/cm. This section was included in the ORW designation based on an Excellent rating for macroinvertebrates assigned in March 1990. Subsequent Good ratings were assigned to summer samples collected in 1994 and 1999. The 2004 benthos sample received an Excellent bioclassification. The EPT richness increased to 39 from 32 in 1999. Compared to the upper Boone Fork site, this location supports a more tolerant benthic community. Though both locations
received an Excellent rating in 2004, the EPT richness was much higher at SR 1561 (46) than at this site (39), and the EPT BI was lower at SR 1561 (1.76 versus 3.29). It is possible that Price Lake has some negative effects on the temperature (SR 1561 = 14.7° and off SR 1558 = 18°) and flow regime for the lower reaches of Boone Fork. A comparison of benthic samples indicates that stone-cased caddisflies and Plecoptera were less plentiful than expected in this part of Boone Fork. Interestingly, the intolerant Hydropsychid caddisfly, Symphitopsyche macleodi, was Abundant at SR 1561, but was Rare off SR 1558. Cheumatopsyche, a tolerant Hydropsychid caddisfly was Rare at the upper site, but increased in number to Abundant at the lower site. This further substantiates that the downstream Boone Fork site supports a more tolerant benthic community than the upper site. Boone Fork off SR 1558 (Hebron Colony)
This site was located due south of the Watauga River site, just upstream of the Boone Fork confluence with
(sas“
the Watauga River at Hebron Colony ministries. At this crossing, the instream, riparian, and watershed characteristics were of exceptionally high quality (habitat score = 89), and qualified the site as a new fish community regional reference site (Appendix F-2). The sample segment was eight meters wide and the drainage area is about ten square miles. There are no upstream NPDES permitted dischargers in this watershed. Substrates were primarily cobble, boulder and bedrock, and instream habitats were composed of riffles, chutes, runs and pools. In 2004, the fish community at this site rated Good
NCIBI = 50). Twelve species were collected from this reach of Boone Fork, including three intolerant pecies (rockbass, smallmouth bass, and greenside darter), a low percentage of omnivores+herbivores, nd a high percentage of insectivores. This stream reach is managed by a private fishing club for its tocked trophy trout. Seven very large stocked rainbow trout (300 – 540 mm in total length), a stocked golden trout”, and one wild young-of-year rainbow trout were also collected from this stream.
NCDENR, Division of Water Quality Basinwide Assessment Report – Watauga River Basin – April 2005
9

Laurel Fork, SR 1111 Laurel Fork is a medium sized stream, six meters in
sfhsdg Tr1cwTt Tnosttwh D
width, with a drainage area of 7.5 square miles. This site was located about one half mile above its confluence with the Watauga River. Laurel Fork drains a portion of Boone and there are two minor dischargers located upstream of this site (NC0061425, Qw = 0.03 MGD and NC0038041, Qw = 0.0145 MGD), which may account for the elevated conductivity at the time of benthos sampling (135 µmhos/cm) and fish sampling (109 µmhos/cm). The substrate was mostly bedrock (30%), boulder (20%), gravel (20%), and rubble (25%). There was a small amount of sand (5%) and moderate embeddedness was observed. Instream habitats were good, consisting of high gradient plunge pools, chutes and
lick rocks. Hemlock and Rhododendron line the riparian corridor in the upper section of the site. Flash looding in October and November of 2003 likely washed out most of the functional woody debris in this igh gradient section. The habitat received similar scores (78 and 77) during basinwide fish and benthos ampling. Anecdotal information about Laurel Fork running “milky”, points to the upstream rock quarry uring its operating hours. Although, there was no evidence of this during sampling, as water clarity was ood.
his site rated Good-Fair in 2004, 1999, 1994, and Good in 1990 for macroinvertebrates. The EPT taxa ichness was similar in 2004 (26) and 1999 (27), but the EPT abundance was higher in 2004 (128 versus 10). The EPT BI was slightly lower in 2004 (2.91 versus 3.28). The 2004 sample was the first sample ollected in Laurel Fork where any Plecoptera taxa (Paragnetina immarginata and Malirekus hastatus) ere abundant. However, Symphitopsyche sparna, a tolerant caddisfly dominated the benthic fauna. his was the only tributary of the Watauga River that received a Good-Fair bioclassification. The other
ributaries rated Good or Excellent.
his high gradient trout stream was Not Rated for its fish community in 2004. There was a very low umber of fish collected at this site (n = 108), many of which were tolerant species (26%) and or mnivores+herbivores (57%). Out of the ten species collected from this stream, the herbivorous central toneroller was numerically dominant (n = 31, 29% of total catch). Despite the elevated conductivity, hree species of wild trout were collected from this stream. Multiple age groups of the intermediately olerant brown trout were captured, indicating a reproducing population. All of the rainbow trout collected ere of the same age group, and the one brook trout collected likely migrated from the Watauga River eadwaters.
utch Creek at SR 1112 and NC 194 This site was located approximately one mile above
its confluence with the Watauga River at Valle Crucis, just above the Watauga County Board of Education’s WWTP (NC0067024). The stream segment at this site was eight meters wide and the drainage area is about 11 square miles. The substrate consisted mostly of cobble and gravel, and the instream habitat was good with riffles, runs, and snag/root pools. The total habitat score was 76. In 2004, the fish community rating for Dutch Creek was Good-Fair. The highest number of species (n = 19) and total fish (n = 775) in the basin were collectedNCDENR, Division of Water Quality Basinwide Assessment Report – Watauga River Basin – April 2005
10

here, including three species of suckers and nine cyprinid species. The herbivorous central stoneroller was the most abundant species at this site (~50% of catch), followed by the omnivorous river chub (18%). Mountain redbelly dace were collected for the first time at this site and represented a new species record for the basin. The Wildlife Resources Commission annually stocks Dutch Creek, beginning about one mile upstream of this site, with 800 brook, rainbow, and brown trout from March to June. Multiple age groups of wild brown trout (intermediately tolerant) including young-of-year indicated a natural reproducing population. Cove Creek, SR 1149
Cove Creek is a medium sized stream, seven meters
cIQtdµ(Tts T11fAm Ipaiwst
in width, which drains an agricultural and residential area. This site was located along the US 321 corridor about one mile above its confluence with the Watauga River. The watershed encompasses approximately 33 square miles at this location. Historically agricultural land use (pastures and extremely narrow riparian zones) have caused bank instability and nonpoint sedimentation in this watershed. The substrate was estimated to be 40% sand and silt with the remainder comprised of mostly boulder (30%) and smaller amounts of rubble (15%) and gravel (15%). Accordingly, instream habitats were poor, and consisted of sandy runs, riffles, and
hutes. The habitat received similar scores (58 and 65) during basinwide fish and benthos sampling. ncreasing development has been noted in the upper portion of the watershed and the NCSU Water uality Group completed a restoration project on about 0.1 mile of badly eroding streambank. In 2004,
he benthic sample was collected after a rainstorm and the water was extremely turbid, indicating isturbance in the watershed. In addition to turbidity, the conductivity was elevated (116 and 95 mhos/cm) during basinwide benthos and fish sampling. There is one minor NPDES discharger NC0067008, Qw = 0.01 MGD) in this watershed located approximately three miles upstream of the site. he high specific conductance values in the creek were probably a reflection of the land use rather than
his one small discharger. The site was moved in 2004 to SR 1149 from US 321 for easier access and afety. Future basinwide sampling should occur at SR 1149.
he 2004 macroinvertebrate sample received a bioclassification of Good, the same rating it received in 999 and 1994. EPT taxa richness (34-30) and the EPT BI (3.35-3.64) have been stable at this site since 994. The number of stonefly taxa decreased in 2004 to two (Leuctra and Paragnetina immarginata), rom four in 1999. Although none of the stoneflies collected in 1999 were Abundant, the 2004 taxa were bundant. In addition the number of stone-cased caddisflies increased in 2004 from 1999. The intolerant ayfly, Potamanthus distinctus, was abundant in 1999, but decreased to Rare in 2004.
n 2004, the fish community in Cove Creek was rated Good-Fair (NCIBI = 40). There was a high ercentage of omnivores+herbivores captured at this site, with the central stoneroller as the most bundant of the 13 species collected (45% of total catch). There were also a low percentage of
nsectivores, one benthic species (margined madtom), and no darters captured. Two intolerant species ere collected (rockbass and smallmouth bass) and only two percent of the fish captured were tolerant pecies (redbreast sunfish and creek chub). The only trout species collected was the intermediately olerant brown trout (n = 5, all wild). Multiple age groups of brown trout suggested a viable population.
NCDENR, Division of Water Quality Basinwide Assessment Report – Watauga River Basin – April 2005
11

Watauga River, SR 1121
This location near Sugar Grove was 17 meters wide and the substrate was boulder (20%), and rubble (25%), with sand and gravel comprising about 50%. Bedrock (10%) and a small amount of silt (5%) were also present. The drainage area is 92 square miles. Field notes from this site have frequently indicated heavy periphyton growth (especially at low flow) suggesting some enrichment. This section of the Watauga River has a lower velocity than most sections of the river, and finer sediments often settle out near the banks. The habitat scored 63 due to infrequent riffles, minimal shading, and narrow riparian zones. Habitat problems were indicated as concerns at this location in 2004 and in previous
sampling. The conductivity at this location on the Watauga River was 100 µmhos/cm, indicating an increase in watershed disturbances. This site has been sampled nine times during the summer months for macroinvertebrates. All samples have resulted in Good bioclassifications, except for 2004 and 1990, which resulted in Excellent ratings. The total taxa increased in 2004 to 100 from 81 in 1999 and the EPT taxa richness increased to 47 in 2004 from 38 in 1999. The EPT taxa richness value for 1999 was the lowest since invertebrate collections were initiated in 1983. The increase in total taxa in 2004 was mostly attributed to increases in caddisfly, beetle, and stonefly taxa. Five stonefly taxa were collected in 2004 as opposed to only two taxa in 1999. Watauga River, SR 1200
This location near Peoria was the most downstream of the Watauga River sites and encompasses a drainage area of 128 square miles. The stream width was 11 meters and the substrate was 50% boulder and the remainder was mostly rubble and gravel. The habitat scored high (88) reflecting stable banks and wide, intact riparian zones on both banks. The conductivity decreased slightly (78 µmhos/cm) from the SR 1121 location. This site received an Excellent rating in 2004, 1999, and 1994 for benthos. In 1999, this location was considered somewhat of a recovery site from the SR 1121 location, but 2004 sampling produced Excellent ratings at three of the four Watauga River
sites (with the exception of the most upstream site at SR 1580). At SR 1200 in 2004, the total taxa (110), EPT richness (45), BI (4.33), and EPT BI (3.18) were similar to past benthic collections (1999, 1994, and 1988) and continued to produce Excellent bioclassifications.
NCDENR, Division of Water Quality Basinwide Assessment Report – Watauga River Basin – April 2005
12

Laurel Creek, off SR 1123
This site was located in western Watauga County, just to the north of Beech Mountain, about one half mile upstream of the confluence with the Watauga River. Laurel Creek is a small stream (five meters wide) that drains an area of agricultural and residential land use. The drainage area is approximately seven square miles. The amount of sand in the substrate was fairly high (25%), and the remaining substrate was a mix of boulder (30%), rubble (25%), and gravel (20%). There are no permitted dischargers in the catchment. In 1999, the conductivity was elevated (85 µmhos/cm), but the conductivity was 42 µmhos/cm in 2004. In 2004, the overall habitat scored 86 during benthos sampling and 87 during fish sampling. The main habitat
concerns were the high amount of sand in the substrate, embeddedness, and the close proximity of SR 1123. Laurel Creek was sampled for the first time in 1999 for macroinvertebrates and received a Good bioclassification. It maintained its Good rating in 2004. EPT richness (35 versus 31) and EPT abundance (181 versus 153) were slightly higher in 2004, and the lower EPT BI in 2004 (2.33 versus 2.60) indicated a slightly more intolerant benthic community than in 1999. In both samples mostly intolerant EPT taxa were collected. Stone cased caddisflies were collected both years and the numbers of long-lived stoneflies (Acroneuria abnormis and Paragnetina immarginata) increased from 1999. Though this location maintained its Good bioclassification, field observation during 2004 sampling noted that residential development appeared to be increasing in this watershed. Future basinwide sampling is recommended In 2004, this stream was Not Rated for its fish community. This was the most natural of the high gradient trout streams sampled in the basin, with few species (n = 4), and a low number of fish collected (n = 103). Those species collected included the western blacknose dace (most abundant, n = 69), central stoneroller, northern hog sucker, and wild brown trout. The Wildlife Resources Commission manages this section of Laurel Creek as Hatchery Supported Trout Waters and annually stocks 900 brook, rainbow, and brown trout from March through June. Six wild brown trout of multiple age groups were collected from this stream, including one young-of-year, indicating a reproducing population.
Beaverdam Creek, SR 1202
This medium sized stream, eight meters in width,
o
has a watershed area of 21 square miles. This site was located about one half mile upstream of its confluence with the Watauga River in western Watauga County, below the Town of Bethel. Sand and embeddedness have been observed in the substrate since sampling commenced in 1994. The remaining substrate was a mix of boulder (60%), rubble (15%), and gravel (10%). Overall, the instream habitat was good and consisted primarily of riffles, and high gradient plunge pools. Habitat scores of 87 and 89 reflected the wide and intact riparian zones, stable banks, and adequate shading at the sampling location. However, habitats outside
f the sample reach were characteristic of agricultural and pasture lands. The conductivity values at this
NCDENR, Division of Water Quality Basinwide Assessment Report – Watauga River Basin – April 2005
13

site (54 and 69 µmhos/cm) were characteristic of the upstream land use. There is one small discharger (<1 MGD) located upstream about two miles above the site. Beaverdam Creek at SR 1202 adjacent upstream land use
Beaverdam Creek rated Good for macroinvertebrates in 2004, 1999, and 1994. The EPT richness (37 and 30) and abundance (156 and 122) decreased from 1999. The 2004 EPT BI (2.57) was lower than in 1999 (3.17). All three samples collected in Beaverdam Creek have been comprised of a mixture of intolerant and tolerant taxa. The fish community in Beaverdam Creek was rated Poor in 2004, due to an unbalanced trophic structure, a low number of species collected (n = 8), and a low number of fish collected (n = 308). Reflective of the land use in this watershed, this site had the lowest NCIBI score among the ratable sites
in the Watauga River basin (NCIBI = 26). No benthic insectivores were collected (darters, sculpin, and madtom), only five cyprinids were captured (central stoneroller, warpaint shiner, river chub, western blacknose dace, and creek chub), the percentage of omnivores+herbivores was high (69%), and the percentage of insectivores was low (30%). The numerically dominant species was the omnivorous river chub (n =148), comprising almost one half of the fish collected. Two wild rainbow trout of the same age group were also collected. Beech Creek, off SR 1312
This site was located about 1.5 miles above its confluence with the Watauga River in the northeast
ph IftcrRtrc
corner of Avery County. This segment of Beech Creek was about nine meters wide and drains approximately 18 square miles of forested and agricultural land. Approximately three miles upstream of this site, the Town of Beech Mountain discharges from two wastewater treatment facilities (NC0069761 and NC0022730, combined Qw = 0.44 MGD) into the Beech Creek watershed. Accordingly, the conductivity was slightly elevated at this site (46 µmhos/cm). Habitat quality in this high gradient reach of Beech Creek is very good, with substrates of primarily cobble and boulder, and instream habitats of riffles, fast chutes, fast runs, and plunge
ools. The effects of severe flash flooding were obvious on the banks and in the stream in the form of ousehold and automotive debris. The total habitat score was 88.
n 2004, the fish community in Beech Creek was not ratable with the NCIBI. Eight species were collected or a total of 368 fish. Those species collected included redbreast sunfish (numerically dominant, 48% of otal capture), four cyprinid species (central stoneroller, western blacknose dace, longnose dace, and reek chub), one sucker (northern hog sucker), and two wild trout species (rainbow and brown trout). The edbreast sunfish is an exotic species in this basin that likely came from the 6.5 acre Beech Mountain eservoir, located about three miles upstream of the site. The Wildlife Resources Commission manages
his section of Beech Creek as Hatchery Supported Trout Waters and annually stocks 600 brook, ainbow, and brown trout from March to May. Multiple age groups of both wild trout species were aptured, indicating viable populations.
NCDENR, Division of Water Quality Basinwide Assessment Report – Watauga River Basin – April 2005
14

Beech Creek, US 321 This site on Beech Creek was located approximately one half mile above the confluence with the Watauga River. The drainage area at this location is 20 square miles. There are no permitted dischargers on Beech Creek, although there are several small dischargers on tributaries to Beech Creek. The conductivity of Beech Creek was slightly elevated (79 µmhos/cm). The substrate was mostly boulder (40%) with the remainder comprised of rubble (30%), gravel (10%), and sand (20%). The habitat score was 81 due to the close proximity of houses on both sides of the stream, which greatly reduced the width and effectiveness of the riparian zones.
Beech Creek received an Excellent bioclassification for macroinvertebrates in 2004, 1999, and 1994. The EPT taxa richness (41 versus 38) and EPT abundance (175 versus 167) was slightly higher in 2004 than in 1999. This location does not seem to be affected by residential/recreational development in the headwaters. This part of Beech Creek is the only known North Carolina locality for the intolerant caddisfly, Ceratopsyche walkeri. This species was abundant in the high-current riffles. Beech Creek and Boone Fork were the only tributaries to the Watauga River that received Excellent Bioclassifications in 2004. Elk River, off NC 184
This site, upstream of Banner Elk, was six meters
TFvfma1tcf
wide. The drainage area is approximately seven square miles. There was a high amount of silt and sand in the substrate (45%) and the remainder was mostly rubble and gravel. Elodea canadensis, a common native aquatic plant, was observed at this location. Elodea tends to grow in lakes, ponds, and slow moving rivers. The habitat score was 67 due to high amount of embeddedness, and the lack of favorable substrate for benthic colonization. The riparian zone on the left bank was compromised by the presence of NC 184, which follows the stream. The conductivity was slightly higher in 2004 (82 µmhos/cm) than in 1999 (51 µmhos/cm).
his site received a Good rating in 1994 and 1999 for macroinvertebrates, but declined in 2004 to Good-air. The 2004 sample showed a definite decline in the total taxa (71 versus 102) and EPT richness (24 ersus 44) from 1999. The BI (4.38 versus 5.37) and EPT BI (3.58 versus 4.10) both increased in 2004 rom 1999. Observations from 1999 indicated that this site supported a very high diversity of benthic acroinvertebrates. The 2004 field observations stated that EPT diversity was low and there were bundant midges and small baetids. The most noticeable difference between the 2004 sample and the 999 sample was the decline in stonefly taxa. In 1999, there were six stonefly taxa and in 2004 only one
axon (Tallaperla) was collected. This decrease in stonefly taxa as well as declines in mayfly and addisfly taxa indicated a decline in water quality since 1999. This location should be monitored in the uture and additional investigations of the watershed are recommended.
NCDENR, Division of Water Quality Basinwide Assessment Report – Watauga River Basin – April 2005
15

Elk River, SR 1326
This site was located in north central Avery County,
v ItAfhresy E
1iDwiuw
just west of the Town of Banner Elk. The sample segment was nine meters wide and the drainage area is about 19 square miles. There are three permitted NPDES facilities in this watershed (NC0022900, Qw = 0.5 MGD, NC0032115, Qw = 0.6 MGD, ~2.5 miles above the site, and NC0058378, Qw = 0.08, ~1.5 miles above the site). Accordingly, the specific conductance was quite high for a mountain stream (75 µmhos/cm). Substrates consisted mainly of cobble with some boulder. Instream habitats were of good quality, and consisted primarily of runs and riffles, with some braiding at the upper end of the site. The riparian corridor was fairly open and primarily
egetated with grasses. The total habitat score was 84.
n 2004, this fish community site was not rated with the NCIBI. Although one third of the fish caught were rout, this is an example of a mountain stream that no longer exhibits natural trout stream characteristics. total of 11 species were collected, including no benthic dwelling fish (darters, sculpin, and madtoms),
ew cyprinid species, a high percentage of tolerant fish, and a low percentage of insectivores. The erbivorous central stoneroller was the most abundant species (36% of the total catch), probably in esponse to the high specific conductance and benthic periphyton. There were also an abundance of xotic species (~ 39% of total), including redbreast sunfish and bluegill. There were however, two pecies of wild trout captured (rainbow and brown trout), with multiple age groups, although no young-of-ear were collected.
lk River, SR 1305 This portion of the Elk River was eight meters wide and the drainage area at this location is 48 square miles. Sand comprised 30% of the substrate, but there was much less silt and the substrate was less embedded than at the upstream location. Boulder (20%) comprised a greater portion of the substrate here than at the upstream site. The canopy was open and provided very little shading. The conductivity (83 µmhos/cm) was the same as the upstream location. The rocks were slippery with periphyton growth indicating enrichment. This location rated Excellent for macroinvertebrates in 1994 and 1999, but declined to Good in 2004. The EPT total taxa was similar for 2004 (43) and
999 (44), but the EPT BI was slightly higher in 2004. The total taxa increased in 2004, mostly due to ncreased numbers of beetles, odonates, and diptera. Several intolerant taxa (Drunella allegheniensis, runella conestee) were collected in 2004 for the first time at his location, but other intolerant taxa that ere collected in the past (Hepagenia spp., Heptagenia marginalis) were not found in 2004. The biotic
ndex increased from 3.86 in 1999 to 4.33 in 2004, indicating a more tolerant benthic community. Like the pstream Elk River site, this location should be monitored in future basinwide assessments and additional atershed investigations are recommended.
NCDENR, Division of Water Quality Basinwide Assessment Report – Watauga River Basin – April 2005
16

Cranberry Creek, NC 194
This site was located approximately one half mile above its confluence with the Elk River, near the Town of Elk Park in northwestern Avery County. Although there are no permitted NPDES dischargers in this watershed, the specific conductance was rather high for a mountain stream (63 µmhos/cm), and was likely a reflection of landuse that may include some straight piping activity. This section of the stream is five meters wide and has a drainage area of about five square miles. The substrate consists of cobble, boulder, sand, and bedrock. Instream habitats are comprised mostly of cobble riffles, pools, and runs. Although the left bank is lined with Rhodedendron and hemlock, the poor riparian zone on the right bank provides little bank stability and instream
cover. Lawns are also mowed right up to the stream along the right bank, increasing nutrient loading via grass clippings. The overall habitat quality at this site was moderate, with a total habitat score of 70. In 2004, the fish community at this site was not rated with the NCIBI. This is another example of a high gradient trout stream with low fish diversity (species n = 6), and low numbers of individuals collected (n = 93). Of the six species captured, there were no benthic dwelling species (darter, sculpin, and madtom), two cyprinid species (central stoneroller and western blacknose dace), two sucker species (white sucker and northern hog sucker), and two wild trout species (rainbow and brown trout). Brown trout were the numerically dominant fish collected at this site (n = 35). Both species of trout had multiple age group representation, including young-of-year, indicating reproducing populations. SPECIAL STUDIES Watauga River, SR 1594 The Winston-Salem Regional Office (WSRO) requested this site on the Watauga River as an upstream control for development that is occurring in the Seven Devils area. SR 1594 received a bioclassification of Excellent, the same rating it received in 1985, the last time it was sampled. The basinwide site at SR 1580, located approximately two miles downstream, was sampled in summer 2004 and received a Good rating. The SR 1580 site served as a downstream comparison for SR 1594. EPT richness was higher at SR 1594 (43) than at SR 1580 (32), as was the EPT abundance (173 and 160) and EPT BI (2.53 and 3.33). The most noticeable differences in the SR 1594 and SR 1580 samples were the caddisfly and stonefly assemblages. The upper site had 18 Trichoptera taxa and the lower site had only eight. Eight Plecoptera taxa were collected at the upper site and five were collected at the lower site. Although sedimentation was evident at SR 1594, the upper site supported a more intolerant community than the basinwide site at SR 1580 (Biological Assessment Unit Memorandum B-050225). Laurel Fork, SR 1552 WSRO requested a benthic sample on Laurel Fork above Vulcan Quarry and Maymead Material, Incorporated. The Regional Office reported that a white substance with a greenish tint flowed down Laurel Fork and into the Watauga River after rain events. Due to the small drainage area (1.5 square miles), a Qual 4 sample was collected and a rating was not assigned. However, using the EPT guidelines for larger mountain streams, the rating of Laurel Fork at SR 1552 would have been Good, missing an Excellent rating by two taxa. The fact that 34 EPT taxa were collected in such a small stream, including many intolerant taxa, suggests that Laurel Fork at SR 1552 supported a minimally impacted benthic community at worst. BAU sampled Laurel Fork at SR 1111, which is approximately 1.5 miles downstream for basinwide surveys in 2004, 1999, 1994, and 1990. SR 1111 rated Good in 1990, but has consistently rated Good-Fair since then. Laurel Fork at SR 1111 was potentially impacted by various land uses including the quarry, a small portion of Boone, residential areas, and roads. Determining direct stress
NCDENR, Division of Water Quality Basinwide Assessment Report – Watauga River Basin – April 2005
17
from the quarry was not possible. The sample at SR 1552 did show that higher water quality exists in the upper reaches of the Laurel Fork watershed and the Laurel Fork site at SR 1111 supported a much more tolerant benthic community (Biological Assessment Unit Memorandum B-050225).
Post Hurricane Assessment of Cove Creek at SR 1149 and Watauga River at SR 1121 Cove Creek was chosen as a basinwide monitoring site to provide information on agricultural land use impacts in the basin. The site was revisited seven months later to assess the impacts flash-flooding events caused by Hurricanes Frances, Ivan, and Jeanne in September 2004. Given the extreme flows that resulted from upwards of 20 inches of rain that fell in the area during these storms (flow = ~180 times median flow in the Watauga River), habitat alteration and changes to the fish community were minimal. Habitat assessments during these two assessments were very similar with total scores that only differed by two points (60-pre, 58-post). The resilience of the fish community in Cove Creek was also quite remarkable with only two less species collected during the post hurricane study (11 vs. 13 sp.). There were also 65 more individuals at the site after the hurricanes, most of which were central stonerollers. The water quality rating did go down following these storms, from Good-Fair (NCIBI score = 40) in the spring sample to Fair (NCIBI score = 34) in the post storm study. The NCIBI rating dropped because of the two less species captured, and a lower percentage of species with multiple ages. Both of these NCIBI scores reflect the bottom end of their respective ratings. Cove Creek and the Watauga River were sampled in December 2004 for macroinvertebrates. Both sites declined one bioclassification from the August 2004 sampling. Cove Creek declined from a Good rating to Good-Fair and the Watauga River declined from an Excellent rating to Good.
NCDENR, Division of Water Quality Basinwide Assessment Report – Watauga River Basin – April 2005
18

REFERENCES
Griffith, G.E., Omernik, J.M., Comstock, J.A., Schafele, M.P., McNab, W.H., Lenat, D.R., MacPherson,
T.F., Glover, J.B., and Shelburne, N.B., 2002. Ecoregions of North Carolina and South Carolina, (color poster with map, descriptive text, summary tables, and photographs): Reston, Virginia, U. S. Geological Survey (map scale 1:1,500,000).
Karr, J. R. 1981. Assessment of biotic integrity using fish communities. Fisheries. 6: 21-27. _____, Fausch, K. D., Angermeier, P. L., Yant, P. R., and I. J. Schlosser. 1986. Assessing biological
integrity in running water: a method and its rational. III. Nat. Hist. Surv. Spec. Publ. 5. LeGrand, H. E., McRae, S. E., Hall, S. P., and J. T. Finnegan. 2004. Natural Heritage Program list of the
rare animal species of North Carolina. North Carolina Natural Heritage Program, Office of Conservation and Community Affairs. North Carolina Department of Environment and Natural Resources. Raliegh, NC.
Menhinick, E. F. 1991. The freshwater fishes of North Carolina. North Carolina Wildlife Resources
Commission. Raleigh, NC. NCDENR. 2000. Watauga River basin. Basinwide assessment report support document.
Environmental Sciences Branch. North Carolina Department of Environment, and Natural Resources. Division of Environmental Management. Water Quality Section. Raleigh, NC.
_____. 2001a. Standard operating procedure. Biological monitoring. Stream fish community
assessment and fish tissue. Biological Assessment Unit. North Carolina Department of Environment and Natural Resources. Division of Water Quality. Water Quality Section. Environmental Sciences Branch. Raleigh, NC.
_____. 2001b. Biological Assessment Unit Memorandum F-20020821. Fish community metric
recalibration and biocriteria development for the western and northern mountains (French Broad, Hiwassee, Little Tennessee, New, and Watauga River basins). Ibid.
_____. 2003. Standard Operating Procedures for Benthic Macroinvertebrates. Environmental Sciences
Branch. North Carolina Department of Environment and Natural Resources. Division of Environmental Management. Water Quality Section. Raleigh, NC.
Noga, E. J. 1996. Fish disease. Diagnostics and treatment. Mosby-Year Book, Inc. St Louis, MO. Sanders, R. E., Miltner, R. J., Yoder, C. O., and E. T. Rankin. 1999. The use of external deformities,
erosion, lesions, and tumors (DELT anomalies) in fish assemblages for characterizing aquatic resources: a case study of seven Ohio streams. pp. 25-246. In Simon, T. P. (ed.). Assessing the sustainability and biological integrity of water resources using fish communities. CRC Press. Boca Raton, FL.
Steedman, R. J. 1991. Occurrence and environmental correlates of blackspot disease in stream fishes
near Toronto, Ontario. Trans. American Fisheries Soc. 120: 494-499.
NCDENR, Division of Water Quality Basinwide Assessment Report – Watauga River Basin – April 2005
19

GLOSSARY
7Q10 A value which represents the lowest average flow for a seven day period that will
recur on a ten year frequency. This value is applicable at any point on a stream. 7Q10 flow (in cfs) is used to allocate the discharge of toxic substances to streams.
Bioclass Criteria have been developed to assign bioclassifications ranging from Poor to
Excellent to each benthic sample based on the number of taxa present in the intolerant groups (EPT) and the Biotic Index value.
cfs Cubic feet per second, generally the unit in which stream flow is measured. CHL a Chlorophyll a. Class C Waters Freshwaters protected for secondary recreation, fishing, aquatic life including
propagation and survival, and wildlife. All freshwaters shall be classified to protect these uses at a minimum.
Conductivity In this report, synonymous with specific conductance and reported in the units of
µmhos/cm at 25 oC. Conductivity is a measure of the resistance of a solution to electrical flow. Resistance is reduced with increasing content of ionized salts.
Division The North Carolina Division of Water Quality. D.O. Dissolved Oxygen. Ecoregion An area of relatively homogeneous environmental conditions, usually defined by
elevation, geology, and soil type. Examples include Southern Outer Piedmont, Carolina Flatwoods, Sandhills, and Slate Belt.
EPT The insect orders (Ephemeroptera, Plecoptera, Trichoptera); as a whole, the
most intolerant insects present in the benthic community. EPT N The abundance of Ephemeroptera, Plecoptera, Trichoptera insects present,
using values of 1 for Rare, 3 for Common and 10 for Abundant. EPT S Taxa richness of the insect orders Ephemeroptera, Plecoptera and Trichoptera.
Higher taxa richness values are associated with better water quality. HQW High Quality Waters. Waters which are rated as excellent based on biological
and physical/chemical characteristics through Division monitoring or special studies; primary nursery areas designated by the Marine Fisheries Commission; and all Class SA waters.
IWC Instream Waste Concentration. The percentage of a stream comprised of an
effluent calculated using permitted flow of the effluent and 7Q10 of the receiving stream.
Major Discharger Greater than or equal to one million gallons per day discharge (≥ 1 MGD). MGD Million Gallons per Day, generally the unit in which effluent discharge flow is
measured.
NCDENR, Division of Water Quality Basinwide Assessment Report – Watauga River Basin – April 2005
20

Minor Discharger Less than one million gallons per day discharge (< 1 MGD). NPDES National Pollutant Discharge Elimination System.
NCBI (EPT BI) North Carolina Biotic Index, EPT Biotic Index. A summary measure of the
tolerance values of organisms found in the sample, relative to their abundance. Sometimes noted as the NCBI or EPT BI.
NCIBI North Carolina Index of Biotic Integrity (NCIBI); a summary measure of the
effects of factors influencing the fish community. NSW Nutrient Sensitive Waters. Waters subject to growths of microscopic or
macroscopic vegetation requiring limitations on nutrient inputs. NTU Nephelometric Turbidity Unit. ORW Outstanding Resource Waters. Unique and special waters of exceptional state
or national recreational or ecological significance which require special protection to maintain existing uses.
Parametric Coverage A listing of parameters measured and reported. SOC A consent order between an NPDES permittee and the Environmental
Management Commission that specifically modifies compliance responsibility of the permittee, requiring that specified actions are taken to resolve non-compliance with permit limits.
Total S (or S) The number of different taxa present in a benthic macroinvertebrate sample. UT Unnamed tributary. WWTP Wastewater treatment plant.
NCDENR, Division of Water Quality Basinwide Assessment Report – Watauga River Basin – April 2005
21

Appendix F-1. Habitat evaluations and stream and riparian habitats at fish community monitoring sites in the Watauga River basin.
Habitat Assessments A method has been developed by the Biological Assessment Unit to evaluate the physical habitats of a stream (NCDENR 2001a). The habitat score, which ranges between 1 and 100, is based on the evaluation of channel modification, amount of instream habitat, bottom substrate type, pool variety, size and frequency of riffles, bank stability, light penetration, and riparian zone width. Higher numbers suggest better habitat quality, but criteria have not been developed to assign impairment ratings. Habitat metric scores for the ten fish community sites in the Watauga River basin, which were evaluated in 2004, are listed in Table 1. Habitat scores ranged from 58 (Cove Creek, Watauga County) to 89 (Boone Fork, Watauga County) (Table 2.). Nine streams had overall moderate to high quality habitats (score ≥ 65), whereas only one stream had an overall low to poor quality habitat (habitat score of < 65). Major differences between the two types were in the instream habitats, substrates, riffles and bank stabilities (Table 3.) Differences in habitat scores were not as pronounced in the abundance of pools, extent of canopy cover or width of riparian zone. The low habitat score for Cove Creek is attributable to the lack of functional riparian zones, and the subsequent erosion and nonpoint source sedimentation associated with the agricultural land use along the US 321 corridor.
Table 1. Rankings of 10 fish community sites in the Watauga River basin according to the total habitat scores, 2004
Stream Location County Score
Moderate to High Quality Habitats Boone Fork off SR 1558 Watauga 89
Beech Cr off SR 1312 Avery 88
Beaverdam Cr SR 1202 Watauga 87
Laurel Cr SR 1123 Watauga 87
Elk R SR 1326 Avery 84
Laurel Fk SR 1111 Watauga 77
Dutch Cr SR 1112/NC 194 Watauga 76
Watauga R off SR 1557 Watauga 72
Cranberry Cr NC 194 Avery 70 Low to Poor Quality Habitats
Cove Cr SR 1149 Watauga 58
Table 2. Mean habitat scores for 10 fish community sites in the Watauga River basin, 2004.
Habitat characteristics Low - Poor Quality Habitat Moderate - High Quality Habitat Max score
Instream Habitat 12 17.0 20
Substrate 6 12.8 15
Riffles 10 13.9 16
Bank stability (right and left) 6 10.8 14
NCDENR, Division of Water Quality Basinwide Assessment Report – Watauga River Basin – April 2005
22

Table 3. Habitat evaluations at 10 fish community sites in the Watauga River Basin, 2004.
Stream Location County
Stream Width
(m) Chan-
nel Instream Habitat
Sub-strate Pools Riffles
Bank Stability-
L
Bank Stability-
R Shade Riparian Zone-L
Riparian Zone-R
Total Score
Watauga R off SR 1557 Watauga 13 5 16 14 10 7 4 6 3 2 5 72
Boone Fk off SR 1558 Watauga 8 5 18 14 10 15 7 7 7 3 3 89
Laurel Fk SR 1111 Watauga 6 5 13 10 13 12 6 6 7 5 3 77
Dutch Cr SR 1112/ NC 194 Watauga 8 5 18 14 9 14 4 4 4 2 2 76
Cove Cr SR 1149 Watauga 10 5 12 6 8 10 3 3 4 2 5 58
Laurel Cr SR 1123 Watauga 6 5 18 12 9 16 6 6 9 3 3 87 Beaverdam Cr SR 1202 Watauga 7 5 18 12 10 14 6 6 8 3 5 87
Beech Cr off SR 1312 Avery 8 5 18 14 6 16 6 6 9 5 3 88
Elk R SR 1326 Avery 16 5 18 14 9 16 5 5 4 5 3 84 Cranberry Cr NC 194 Avery 5 5 16 11 6 15 5 3 4 4 1 70
Maximum possible scores 5 20 15 10 16 7 7 10 5 5 100 Characteristics of moderate to high quality habitat Mountain streams are (Figure 1):
instream habitats composed of rocks (often covered with Podostemum), sticks, leafpacks, snags, logs, undercut banks and root mats;
substrates of boulder, cobble and gravel with low embeddedness; frequent riffles, chutes, and pools of varying widths and depths; and stable banks with a good tree canopy and a medium to wide riparian zone with no or rare breaks.
A B
Figure 1. Instream habitats composed of boulder, cobble, gravel, sticks, leafpacks, snags, logs, root mats, and wide riparian zones with good tree canopy (A, B). A = Laurel Creek, SR 1123, Watauga County, B = Boone Fork, SR 1558, Watauga County.
Characteristics of low to poor quality habitat are (Figure 2):
substrates of primarily sand and silt with instream bar development; an absence of riffles; if present, they are usually caused by embedded, coarse woody debris;
NCDENR, Division of Water Quality Basinwide Assessment Report – Watauga River Basin – April 2005
23

narrow and sparsely vegetated riparian zones offering little or no stream shading; and deeply entrenched channel with unstable, vertical, and sparsely vegetated banks.
A B
Figure 2. Poor habitats with sandy substrates, few riffles, and few chutes (A), and unstable banks, and poorly vegetated riparian zones (A, B). A = looking above site on Beaverdam Creek, SR 1202, Watauga County, B = Cove Creek, SR 1149, Watauga County.
Habitat and NCIBI Relationships Boone Fork, the only site that rated Good, had high habitat quality (score = 89) (Table 4). The fish communities that rated Good-Fair (Watauga River, Dutch Creek, and Cove Creek) were found where habitats were of varying quality. The fish community that rated Poor (Beaverdam Creek) was found where habitats were moderate to high quality, but atypical of the lower quality habitats in the watershed. The Not Rated trout streams were found where habitats were moderate to high quality (habitat scores = 70 – 88). Table 4. NCIBI ratings and habitat quality for 10 streams in Watauga River basin, 2004.1
NCIBI Rating Waterbodies with Low to Poor Quality Habitat
(Score < 65) Waterbodies with Moderate to High Quality Habitat
(Score ≥ 65) Excellent
Good Boone Fk
Good-Fair Cove Cr Watauga R, Dutch Cr
Fair
Poor Beaverdam Cr
Not Rated Laurel Fk, Laurel Cr, Beech Cr, Elk R, Cranberry Cr
Appendix F- 2. Fish community sampling methods and criteria. In 2004, fish community assessments were performed at 10 sites in the basin. The drainage areas of the assessed watersheds ranged from 7 to 31.9 square miles. The Division hasn’t sampled any of these sites before. One site (Boone Fork) qualified as a future regional reference site. Sampling Methods At each sample site, a 600 ft. section of stream was selected and measured. The fish in the delineated stretch of stream were then collected using two backpack electrofishing units and two persons netting the stunned fish. After collection, all readily identifiable fish were examined for diseases, sores, lesions, fin damage, or skeletal anomalies, measured (total length to the nearest 1 mm), and then released. Those fish that were not readily identifiable were preserved and returned to the laboratory for identification, examination and total length measurement. Detailed descriptions of the sampling methods can be found
NCDENR, Division of Water Quality Basinwide Assessment Report – Watauga River Basin – April 2005
24

at: http://h2o.enr.state.nc.us/esb/BAU.html. Raw data for the fish community-monitoring program can be found at: http://www.esb.enr.state.nc.us/NCIBI.htm. NCIBI Analysis The NCIBI is a modification of the Index of Biotic Integrity initially proposed by Karr (1981) and Karr, et al. (1986). The IBI method was developed for assessing a stream's biological integrity by examining the structure and health of its fish community. The scores derived from this index are a measure of the ecological health of the waterbody and may not directly correlate to water quality. For example, a stream with excellent water quality, but with poor or fair fish habitat, may not be rated excellent with this index. However, in many instances, a stream, which rated excellent on the NCIBI, should be expected to have excellent water quality. The North Carolina Index of Biological Integrity incorporates information about species richness and composition, trophic composition, fish abundance, and fish condition. The NCIBI summarizes the effects of all classes of factors influencing aquatic faunal communities (water quality, energy source, habitat quality, flow regime, and biotic interactions). While any change in a fish community can be caused by many factors, certain aspects of the community are generally more responsive to specific influences. Species composition measurements reflect habitat quality effects. Information on trophic composition reflects the effect of biotic interactions and energy supply. Fish abundance and condition information indicates additional water quality effects. It should be noted, however, that these responses may overlap. For example, a change in fish abundance may be due to decreased energy supply or a decline in habitat quality, not necessarily a change in water quality. For the Watauga River basin, the assessment of biological integrity using the North Carolina Index of Biotic Integrity (NCIBI) is provided by the cumulative assessment of 10 parameters or metrics. The values provided by the metrics are converted into scores on a 1, 3, or 5 scale. A score of 5 represents conditions which would be expected for undisturbed reference streams in the specific river basin or ecoregion, while a score of 1 indicates that the conditions deviate greatly from those expected in undisturbed reference streams of the region. Each metric is designed to contribute unique information to the overall assessment. The scores for all metrics are then summed to obtain the overall NCIBI score. Finally, the score (an even number between 10 and 60 is then used to determine the ecological integrity class of the stream from which the sample was collected. The NCIBI has been revised (NCDENR 2001b). Currently, the focus of using and applying the NCIBI has been restricted to wadeable streams that can be sampled by a crew of four persons. The bioclassifications and criteria have also been recalibrated against regional reference site data (Tables F-1 –F- 3). However, no sites in the Watauga River basin were used in the calibration. To qualify as a reference site, the site had to satisfy all seven criteria in the order listed in Table 1. Reference sites represented the least impacted or the most minimally impacted streams and the overall biological conditions of the fish communities that could be attained.
NCDENR, Division of Water Quality Basinwide Assessment Report – Watauga River Basin – April 2005
25

Table 1. Reference site selection hierarchy. A watershed-based approach for mountain streams.
Criterion Qualification 1 -- Habitat Total habitat score ≥ 65 2 – NPDES dischargers No NPDES dischargers ≥ 0.01 MGD above the site or if there are small dischargers (~≤ 0.01
MGD), the dischargers are more than one mile upstream 3 – Percent urbanization < 10% of the watershed is urban or residential areas 4 – Percent forested ≥ 70% of the watershed is forested or in natural vegetation 5 – Channel incision At the site, the stream is not incised beyond natural conditions 6 – Riparian zone integrity No breaks in the riparian zones or, if there are breaks, the breaks are rare 7 – Riparian zone width Width of the riparian zone along both banks is ≥ 6m Exception 1 If the site satisfied Criteria 1 - 6, except one of the two riparian widths was less than 6 m, then the
site still qualified as a reference site Exception 2 If the site satisfied Criteria 1 - 3 and 5 - 7, but the percentage of the watershed in forest or natural
vegetations was ≥ 60% (rather than ≥ 70%), then the site still qualified as a reference site. [Note: in the New River Basin this last exception is ≥ 50%.]
Table 2. Revised scores and classes for evaluating the fish community of a wadeable stream using the North Carolina Index of Biotic Integrity in the French Broad, Hiwassee, Little Tennessee, New and Watauga River basins.
NCIBI Scores Integrity Class
58 or 60 Excellent 48, 50, 52, 54, or 56 Good
40, 42, 44, or 46 Good-Fair 34, 36, or 38 Fair
≤ 32 Poor
Criteria and ratings applicable only to wadeable streams in the Watauga River basin are the same as those for the Little Tennessee, French Broad, New, and Hiwassee River Basins. Metrics and ratings should not be applied to non-wadeable streams and trout streams in each of these basins. Blackspot and other diseases Blackspot and yellow grub diseases are naturally occurring, common infections of fish by an immature stage of flukes. The life cycle involves fish, snails, and piscivorous birds. Although heavy, acute infections can be fatal, especially to small fish, fish can carry amazingly high worm burdens without any apparent ill effects (Noga 1996). The infections may often be disfiguring and render the fish aesthetically unpleasing (Figure 1).
Heavy infestation of blackspot disease in
NCDENRBasinwide Assessment
A
creek chub (A) and yellow grub in bigeye chub (B
, Division of Water Quality Report – Watauga River Basin – April 2005
26
B
).

Although some researchers incorporate the incidence of black spot and yellow grub into indices of biotic integrity (e.g., Steedman 1991), others, because of a lack of a consistent, inverse relationship to environmental quality, do not (e.g., Sanders et al. 1999). These diseases are not considered in the NCIBI because they are widespread, affecting fish in all types of streams. Blackspot was noted in the Watauga and Elk Rivers, Boone Fork, Dutch Creek, Cove Creek, and Beech Creek. Species affected (although not at all sites) included central stoneroller, river chub, creek chub, and greenfin darter.
Other diseases observed in 2004 included:
Scoliosis in one blue head chub from Beaverdam Creek.
NCDENR, Division of Water Quality Basinwide Assessment Report – Watauga River Basin – April 2005
27

Table 3. Scoring criteria for the NCIBI for wadeable streams in the Western and Northern Mountains of the French Broad (including the Pigeon River), Hiwassee, Little Tennessee, New, and Watauga River basins with watersheds ranging between 3.1 and 161 mi2.
No. Metric Score 1 No. of species ≥ 16 species 5 12-15 species 3 < 12 species 1
2 No. of fish 320-1,000 fish 5 205-319 fish 3 < 205 fish 1 > 1,000 fish 3
3 No. of species of darters French Broad &
Little Tennessee River BasinsNew River, Pigeon River, Watauga1,
& Hiwassee River Basins ≥ 4 species ≥ 3 species 5 2 or 3 species 1 or 2 species 3 0 or 1 species 0 species 1 4 No. of species of rock bass, smallmouth bass, and trout ≥ 2 species 5 1 species 3 0 species 1
5 No. of species of cyprinids All basins, except Pigeon River Basin Pigeon River Basin ≥ 8 species ≥ 6 species 5 6 or 7 species 4 or 5 species 3 ≤ 5 species ≤ 3 1 6 No. of intolerant species All basins, except New River Basin New River Basin ≥ 3 species ≥ 5 species 5 2 species 3 or 4 species 3 0 or 1 species 0, 1, or 2 species 1 7 Percentage of tolerant individuals ≤ 2% 5 2-10% 3 > 10% 1
8 Percentage of omnivorous + herbivorous individuals 10-36% 5 37-50% 3 > 50% 1 < 10% 1
9 Percentage of insectivorous individuals 55-85% 5 40-54% 3 < 40% 1 > 85% 1
12 Percentage of species with multiple age groups ≥ 65% of all species have multiple age groups 5 45-64% all species have multiple age groups 3 < 45% all species have multiple age groups 1
1Tentative for the Watauga River basin; also includes Cottus bairdii (mottled sculpin) and Noturus insignis (margined madtom). The Watauga River basin is the only basin in North Carolina where these three benthic, insectivorous groups (darters, mottled sculpin, and margined madtom) are sympatric.
NCDENR, Division of Water Quality Basinwide Assessment Report – Watauga River Basin – April 2005
28

Table 4. Tolerance ratings and adult trophic guild assignments for fish in the Watauga
River basin. Species collected in 2004 are highlighted in blue.
Family/Species Common Name Tolerance Rating Trophic Guild of Adults Cyprinidae carps and minnows Campostoma anomalum stoneroller Intermediate Herbivore Clinostomus funduloides rosyside dace Intermediate Insectivore Cyprinella galactura whitetail shiner Intermediate Insectivore Cyprinus carpio common carp Tolerant Omnivore Luxilus coccogenis warpaint shiner Intermediate Insectivore Nocomis micropogon river chub Intermediate Omnivore Notemigonus crysoleucas golden shiner Tolerant Omnivore Notropis leuciodus Tennessee shiner Intermediate Insectivore N. photogenis silver shiner Intolerant Insectivore Phoxinus oreas mountain redbelly dace Intermediate Herbivore Pimephales notatus bluntnose minnow Tolerant Omnivore Rhinichthys obtusus western blacknose dace Intermediate Insectivore R. cataractae longnose dace Intermediate Insectivore Semotilus atromaculatus creek chub Tolerant Insectivore Catostomidae suckers Catostomus commersonii white sucker Tolerant Omnivore Hypentelium nigricans northern hog sucker Intermediate Insectivore Moxostoma duquesnei black redhorse Intermediate Insectivore Ictaluridae North American catfishes Noturus insignis margined madtom Intermediate Insectivore Salmonidae trouts and salmons Oncorhynchus mykiss rainbow trout Intolerant Insectivore Salmo trutta brown trout Intermediate Piscivore Salvelinus fontinalis brook trout Intolerant Insectivore Cottidae sculpins Cottus bairdii mottled sculpin Intermediate Insectivore Centrarchidae sunfishes Ambloplites rupestris rock bass Intolerant Piscivore Lepomis auritus redbreast sunfish Tolerant Insectivore L. macochirus bluegill Intermediate Insectivore Micropterus dolomieu smallmouth bass Intolerant Piscivore M. salmoides largemouth bass Intermediate Piscivore Percidae perches Etheostoma chlorobranchium greenfin darter Intolerant Insectivore Percina aurantiaca tangerine darter Intolerant Insectivore Appendix F- 3. Fish community data collected from the Watauga River basin, 2004.
Subbasin/Waterbody Location County Index No. Date NCIBI Score NCIBI Rating
040201 Watauga R off SR 1557 Watauga 8-(1) 05/06/04 44 Good-Fair
Boone Fk off SR 1558 Watauga 8-7 05/06/04 50 Good
Laurel Fk SR 1111 Watauga 8-10 05/05/04 --- Not Rated
Dutch Cr SR 1112/NC 194 Watauga 8-12-(1.5) 05/05/04 46 Good-Fair
Cove Cr SR 1149 Watauga 8-15 05/05/04 40 Good-Fair
12/02/04 34 Fair
Laurel Cr SR 1123 Watauga 8-17 05/04/04 --- Not Rated
Beaverdam Cr SR 1202 Watauga 8-19 05/04/04 26 Poor
Beech Cr off SR 1312 Avery 8-20 05/04/04 --- Not Rated
Elk R SR 1326 Avery 8-22-(14.5) 05/03/04 --- Not Rated
Cranberry Cr NC 194 Avery 8-22-16 05/03/04 --- Not Rated
NCDENR, Division of Water Quality Basinwide Assessment Report – Watauga River Basin – April 2005
29

Appendix F- 4. Fish community metric values from 10 wadeable streams in the Watauga River Basinwide monitoring program, 20041.
Subbasin Waterbody Location County d.a. Date
No. Species
No. Fish
No. DSM
No. RST
No. Sp. Cyprinids
No. Intol. Sp. % Tolerant
% Omni. +Herb.
% Insect
% MA
40201
Watauga R off SR 1557 Watauga 21.8 5/6/2004 16 463 1 5 7 5 5 61 29 69
Boone Fk off SR 1558 Watauga 9.3 5/6/2004 12 379 1 3 5 3 2 33 62 75
Laurel Fk SR 1111 Watauga 7.0 5/5/2004 10 108 0 3 4 2 26 57 24 50
Dutch Cr SR 1112/NC 194 Watauga 10.6 5/5/2004 19 775 2 4 9 4 2 73 22 63
Cove Cr SR 1149 Watauga 31.9 5/5/2004 13 334 1 3 6 2 2 55 37 77
Laurel Cr SR 1123 Watauga 7.0 5/4/2004 4 103 0 1 2 0 0 20 75 100
Beaverdam Cr SR 1202 Watauga 20.3 5/4/2004 8 308 0 2 5 2 5 69 30 63
Beech Cr off SR 1312 Avery 15.0 5/4/2004 8 368 0 2 4 1 49 4 88 88
Elk R SR 1326 Avery 18.7 5/3/2004 11 310 0 3 4 2 14 44 34 64
Cranberry Cr NC 194 Avery 9.8 5/3/2004 6 93 0 2 2 1 3 5 57 83 1Abbreviations are d.a. = drainage area, No. = number, DSM = darters, sculpin, and madtoms, RST = rockbass, smallmouth bass, and trout, Sp. = species, Intol. = intolerant, Omni. + Herb. = omnivores + herbivores, Insect. = insectivores and MA = species with multiple age groups.
NCDENR, Division of Water Quality Basinwide Assessment Report – Watauga River Basin – April 2005
30

Appendix F- 5. Fish distributional records for the Watauga River basin. Based on Menhinick (1991), NC DWQ’s data, and data from other researchers, 29 species have been collected from the Watauga River basin in North Carolina (Table 4 in Appendix F-2). The known species assemblage includes 14 species of carps and minnows, three species of suckers, one North American catfish species, three species of trout, one sculpin species, five species of sunfish, and two species of darters. At least five of the 29 species (about 17%) are exotics that were introduced either as sportfish, baitfish or for reasons unknown. All streams sampled in the 2004 basinwide assessment have at least one exotic species. In 2004, 23 of the 29 known species were collected during the NC DWQ’s fish community monitoring program. The most common species collected were the central stoneroller and the northern hog sucker, which were both collected at all sites. The most abundant fish species collected was the central stoneroller, which represented about 32% of all the fish collected in 2004. None of the 29 species found in the Watauga River basin have been given special protection status by the United States Department of the interior, the North Carolina Wildlife Resources Commission, or the North Carolina Natural Heritage Program under the North Carolina State Endangered Species Act (G.S. 113-311 to 113-337) (LeGrand, et al. 2004). New distributional records in 2004 from DWQ’s fish community monitoring efforts were:
• mountain redbelly dace – Dutch Creek (Watauga County). • creek chub – Watauga River (Watauga County).
Appendix F- 6. Water quality at fish community sites in the Watauga River basin, 2004. In 2004, water quality data were collected at every site during fish community assessments (Table 1). Conductivity (specific conductance) ranged from 23 to 109 µmhos/cm at Boone and Laurel Forks, respectively. The elevated conductivities of Laurel Fork and the Elk River are reflective of the upstream dischargers in those respective watersheds. Cove and Cranberry Creeks on the other hand, have elevated specific conductances that reflect upstream landuse practices, including agriculture in the Cove Creek watershed and possibly straight piping in the Cranberry Creek watershed. All of the dissolved oxygen concentrations at the 2004 fish community sites were greater than the water quality standard of 5 mg/L. Dissolved oxygen saturation ranged from 76% in the Watauga River shortly after sunrise to 88% in the Elk River during the late afternoon hours. Six of the ten streams sampled for fish communities in 2004 met the water quality standard for pH in non-swamp waters, with readings that ranged from 6.1 to 6.6 s.u. The other four sites had pH measurements that ranged from 5.7 to 5.9 s.u.
NCDENR, Division of Water Quality Basinwide Assessment Report – Watauga River Basin – April 2005
31

Table 1. Water quality measurements at 10 fish community sites in the Watauga River Basin, 2004.
Subbasin/ Waterbody Location County Date
Temperature (°C)
Specific conductance (µmhos/cm)
Dissolved oxygen (mg/L)
Saturation (%) pH
40201
Watauga R off SR 1557 Watauga 5/6/04 11.8 47 8.2 75.8 5.7
Boone Fork off SR 1558 Watauga 5/6/04 12.9 23 8.7 82.4 5.7
Laurel Fk SR 1111 Watauga 5/5/04 15.4 109 8.4 84.1 6.6
Dutch Cr SR 1112/NC 194 Watauga 5/5/04 11.3 45 9.5 86.8 6.5
Cove Cr SR 1149 Watauga 5/5/04 9.3 95 9.2 80.2 6.4
Laurel Cr SR 1123 Watauga 5/4/04 11.4 33 9.1 83.3 5.8
Beaverdam Cr SR 1202 Watauga 5/4/04 9.5 54 9.9 86.7 6.3
Beech Cr off SR 1312 Avery 5/4/04 7.5 46 9.6 80.1 6.1
Elk R SR 1326 Avery 5/3/04 10.2 74 9.9 88.2 6.3
Cranberry Cr NC 194 Avery 5/3/04 9.5 63 9.6 84.1 5.9
NCDENR, Division of Water Quality Basinwide Assessment Report – Watauga River Basin – April 2005
32

Appendix B-1. Benthic macroinvertebrate data collected in the Watauga River basin, 1999-2004. Current basinwide sites are in bold font.
Subbasin/ Waterbody Location County Index No. Date
Total S EPT BI
EPT BI BioClass
Watauga R SR 1594 Watauga 8-(1) 8/16/04 ----- 43 ----- 2.53 Excellent Watauga R SR1580 Watauga 8-(1) 8/18/04 ----- 32 ----- 3.33 Good 7/13/99 ----- 25 ----- 3.90 Good-Fair Watauga R NC 105 Watauga 8-(1) 8/18/04 106 55 4.01 3.27 Excellent 7/14/99 88 42 3.91 3.38 Excellent Boone Fk SR 1561 Watauga 8-7 8/18/04 75 46 2.95 1.76 Excellent 7/13/99 72 39 2.54 1.62 Excellent Boone Fk Off SR 1558 Watauga 8-7 8/18/04 ----- 39 ----- 3.30 Excellent 7/12/99 ----- 32 ----- 2.84 Good Laurel Fk SR 1552 Watauga 8-10 8/18/04 58 34 2.88 2.37 Not Impaired Laurel Fk SR 1111 Watauga 8-10 8/18/04 ----- 26 ----- 2.91 Good-Fair 7/13/99 ----- 27 ----- 3.28 Good-Fair Cove Cr SR 1149 Watauga 8-15 8/17/04 ----- 34 ----- 3.64 Good 7/13/99 ----- 32 ----- 3.35 Good Watauga R SR 1121 Watauga 8-(16) 8/17/04 100 47 4.46 3.67 Excellent 7/15/99 81 38 4.27 3.48 Good Watauga R SR 1200 Watauga 8-(16) 8/17/04 110 45 4.33 3.18 Excellent 7/15/99 94 50 3.89 3.22 Excellent Laurel Cr SR 1123 Watauga 8-17 8/17/04 ----- 35 ----- 2.33 Good 7/15/99 ----- 31 ----- 2.60 Good Beaverdam Cr SR 1202 Watauga 8-19 8/17/04 ----- 30 ----- 2.57 Good 7/13/99 ----- 37 ----- 3.17 Good Beech Cr US 321 Watauga 8-20 8/17/04 ----- 41 ----- 2.01 Excellent 7/15/99 ----- 38 ----- 2.51 Excellent Elk R Off NC 184 Avery 8-22-(3) 8/16/04 71 24 5.37 4.11 Good-Fair 7/14/99 102 44 4.38 3.58 Good Elk R SR 1305 Avery 8-22-(14.5) 8/16/04 103 43 4.33 3.17 Good 7/14/99 88 44 3.86 3.09 Excellent
Summary of Benthic Macroinvertebrate Data Based on benthic macroinvertebrate data, water quality in the Watauga River basin is generally Good to Excellent. Since 1999, 26 benthic macroinvertebrate basinwide samples have been collected with four (16%) receiving Good-Fair bioclassifications, 11 (42%) resulting in Good bioclassifications, and 11 (42%) receiving Excellent bioclassifications. Comparisons of benthos data from 1999 to 2004 between repeat sites show that one site (Watauga River at SR 1580) improved from Good-Fair to Good, while two other sites (Boone Fork off SR 1558 and Watauga River at SR 1121) improved from Good to Excellent. However, the Elk River (SR 1305) declined from Excellent to Good while the Elk River (off NC 184) declined in bioclassification from Good to Good-Fair. The reason for the deteriorating bioclassifications at the two Elk River sites are not known and more intensive monitoring in this watershed may be warranted. All remaining sites were either Excellent or Good in both 1999 and 2004. With the notable exception of the two Elk River sites, water quality in the Watauga River basin has improved since 1999. Several rare invertebrate taxa were collected in the Watauga River basin in 2004 including the mayflies Serratella spiculosa (Beech Creek), Epeorus pleuralis (Boone Fork), the caddisflies Ceraclea flava (Boone Fork), Ceratopsyche bifida (Watauga River) and Ceratopsyche walkeri (Beech Creek). Two noteworthy sites on the Watauga River (NC 105 and SR 1200) set the highest total taxa and EPT taxa diversities ever measured in the Watauga River basin. Benthic macroinvertebrate sampling methods and criteria.
NCDENR, Division of Water Quality Basinwide Assessment Report – Watauga River Basin – April 2005
33
Standard Qualitative (Full Scale) or EPT Methods Benthic macroinvertebrates can be collected from wadeable, freshwater, flowing waters using two sampling procedures. The Biological Assessment Unit's standard qualitative (Full Scale) sampling procedure includes 10 composite samples: two kick-net samples, three bank sweeps, two rock or log washes, one sand sample, one leafpack sample, and visual collections from large rocks and logs (NCDENR 2003). The samples are picked on-site. The purpose of these collections is to inventory the aquatic fauna and produce an indication of relative abundance for each taxon. Organisms are classified as Rare (1 - 2 specimens), Common (3 - 9 specimens), or Abundant (≥ 10 specimens). Benthic macroinvertebrates can also be collected using the EPT sampling procedure. Four rather than 10 composite qualitative samples are taken at each site: 1 kick, 1 sweep, 1 leafpack and visual collections. Only EPT taxa are collected and identified and only EPT criteria are used to assign a bioclassification. Habitat Evaluation An assessment form has been developed by the Biological Assessment Unit to better evaluate the physical habitat of a stream . The habitat score, which ranges between 1 and 100, is based on the evaluation of channel modification, amount of instream habitat, type of bottom substrate, pool variety, bank stability, light penetration, and riparian zone width. Higher numbers suggest better habitat quality, but no criteria have been developed to assign impairment ratings. Data Analysis Criteria for bioclassifications for standard qualitative samples in mountain ecoregions are given below and are based on EPT S and the NCBI. Tolerance values for individual species and biotic index values have a range of 0 - 10, with higher numbers indicating more tolerant species or more polluted conditions. Water quality scores (5 = Excellent, 4 = Good, 3 = Good-Fair, 2 = Fair and 1 = Poor) assigned with the biotic index numbers are averaged with EPT taxa richness scores to produce a final bioclassification. Criteria for mountain streams are used for the Watauga River basin. EPT abundance and Total taxa richness calculations also are used to help examine between-site differences in water quality.
Criteria for Standard Qualitative (Full Scale). BI Values EPT Values
Score Mountain Mountain 5 <4.00 > 43
4.6 4.00 – 4.04 42-43 4.4 4.05 – 4.09 40-41 4 4.10 – 4.83 34-39
3.6 4.84 – 4.88 32-33 3.4 4.89 – 4.93 30-31 3 4.94 – 5.69 24-29
2.6 5.70 – 5.74 22-23 2.4 5.75 – 5.79 20-21 2 5.80 – 6.95 14-19
1.6 6.96 – 7.00 12-13 1.4 7.01 – 7.05 10-11 1 > 7.05 0-9
EPT S and BI values can be affected by seasonal changes. DWQ criteria for assigning bioclassification are based on summer sampling: June - September. For samples collected outside summer, EPT S can be adjusted by subtracting out winter/spring Plecoptera or other adjustment based on resampling of summer site. The BI values also are seasonally adjusted for samples outside the summer season.
NCDENR, Division of Water Quality Basinwide Assessment Report – Watauga River Basin – April 2005
34

Criteria for bioclassifications for EPT samples in mountain ecoregions are given below and are based on EPT taxa richness.
Criteria for EPT Samples. EPT Values
Score Mountain Excellent >35
Good 28-35 Good-Fair 19-27
Fair 11-18 Poor 0-10
NCDENR, Division of Water Quality Basinwide Assessment Report – Watauga River Basin – April 2005
35

Watauga River Basin Ambient Monitoring System Report
September 1, 1999 through August 31, 2004
NCDENR, Division of Water Quality Ambient Monitoring System Report
Watauga River Basin – February 2005 AMS-1

TABLE OF CONTENTS
SUMMARY....................................................................................................................................................4
INTRODUCTION...........................................................................................................................................4
DATA ASSESSMENT AND INTERPRETATION..........................................................................................7 Analytical Considerations ..........................................................................................................................7 Providing Confidence in the Exceedances of Water Quality Standards ...................................................7 Methods Used to Summarize Results .....................................................................................................10 Use Support Assessment Considerations...............................................................................................10
PARAMETERS ...........................................................................................................................................10 Dissolved Oxygen....................................................................................................................................10 pH ............................................................................................................................................................10 Conductivity .............................................................................................................................................10 Turbidity ...................................................................................................................................................11 Metals ......................................................................................................................................................11 Nutrients ..................................................................................................................................................11 Fecal Coliform Bacteria ...........................................................................................................................11
WATER QUALITY PATTERNS IN THE WATAUGA RIVER BASIN ..........................................................12 Regional Patterns ....................................................................................................................................13 Trends over Time ....................................................................................................................................13
Evaluation Levels In order to assist the reader in developing a rapid understanding of the summary statistics provided throughout this data review, concentrations of water quality variables may be compared to an Evaluation Level (EL). Evaluation levels may be a water quality standard, an action level, an ecological threshold, or simply an arbitrary threshold that facilitates a rapid data review. Evaluation levels are further evaluated for frequency to determine if they have been exceeded in more than 10 percent of the observed samples. This summary approach facilitates a rapid and straightforward presentation of the data but may not be appropriate for making specific use support decisions necessary for constructing lists of impaired waters under the Clean Water Act's requirements for 303(d) listings. The reader is advised to review the states 303(d) listing methodology for this purpose. (see http://h2o.enr.state.nc.us/tmdl/General_303d.htm).
NCDENR, Division of Water Quality Ambient Monitoring System Report
Watauga River Basin - February 2004 AMS-2

TABLES
Table 1. Violations and Areas of Concern in the Watauga River Basin .......................................................4 Table 2. Parametric coverage for the Ambient Monitoring System ..............................................................5 Table 3. Selected water quality standards for parameters sampled.............................................................5 Table 4. Monitoring stations in the Watauga River Basin, 1999 - 2004........................................................7 Table 5. Changes in the Laboratory Section’s reporting levels for nutrients. ...............................................7 Table 6. Exceedance Confidence .................................................................................................................9 Table 7. Summary of Evaluation Level Exceedances ................................................................................12
FIGURES
Figure 1. DWQ’s Ambient Monitoring System within the Watauga River Basin. ..........................................6 Figure 2. Explanation of box plots...............................................................................................................12 Figure 3. Total Iron and Total Copper in the Watauga River Basin ............................................................14 Figure 4. Turbidity and Water Temperature in the Watauga River Basin..................................................15 Figure 5. Box Plots for Dissolved Oxygen, Specific Conductivity, Water Temperature, and Turbidity.......16 Figure 6. Box Plots for Total Ammonia, Total Nitrate/Nitrite, Total Kjeldahl Nitrogen ................................17 Figure 7. Box Plots for Total Copper, Total Iron, Total Zinc, and Fecal Coliform.......................................18 Figure 8. Trends of Interest in the Watauga River Basin............................................................................19
APPENDIXES
Appendix A. AMS Station Summary Sheets ...............................................................................................21
NCDENR, Division of Water Quality Ambient Monitoring System Report
Watauga River Basin - February 2004 AMS-3

SUMMARY A general understanding of human activities and natural forces that affect pollution loads and their potential impacts on water quality can be obtained through routine sampling from fixed water quality monitoring stations. During this assessment period (September 1, 1999 through August 31, 2004) chemical and physical measurements were obtained by DWQ from four stations, two discontinued (for safety and redundancy issues) and two active, located in the basin. In order to confidently evaluate acceptable water quality criteria at least 10 observations are desired. If at least 10 results were collected for a given site for a given parameter, the results are then compared to water quality evaluation levels. The water quality evaluation level may be an ecological evaluation level, a narrative or numeric standard, or an action level as specified in 15A NCAC 2B .0200 (Table 2). If less then 10 results were collected, then no comparison to evaluation levels was made. When more than 10 percent of the results exceeded the evaluation level, a binomial statistical test was employed to determine if there was sufficient statistical confidence (95% confidence) to conclude that the results statistically exceed the 10% criteria. When that is found to be true, it is termed a statistically significant exceedance (SSE). This criterion was applied to all parameters with an evaluation level. For fecal coliform, a 20% criteria was applied. The results of the data analysis are displayed in tables, box plots, scatter plots, and maps. For complete data on each station, reference the AMS Station Summary Sheets located in Appendix A. Station L4700000, the Watauga River at SR 1121 near Sugar Grove, had one SSE for Water Temperature. There were no additional 10 percent exceedances. The following table gives a summary of the problem areas located in the basin.
Table 1. Violations and Areas of Concern in the Watauga River Basin Subbasin/ Station ID Location Class Parameter/Evaluation Level % Exceedance % Confidence
1Watauga River at SR 1121
near Sugar Grove B Tr HQW Water Temperature (>20) 20.4% 99.4%
Watauga River
Blue entries indicate violations of standards. Black entries indicate violations of action levels or evaluation levels.
INTRODUCTION The DWQ’s Ambient Monitoring System is a network of stream, lake, and estuarine stations strategically located for the collection of physical and chemical water quality data. The stations are located at convenient access points (e.g. bridge crossings) that are sampled on a monthly basis. These locations were chosen to characterize the effects of point source dischargers and nonpoint sources such as agriculture, animal operations, and urbanization within watersheds. Currently the DWQ does not conduct probabilistic (random) monitoring. The data are used to identify long term trends within watersheds, to develop Total Maximum Daily Loads (TMDLs) and to compare measured values with water quality standards to identify possible areas of impairment. Parametric coverage is determined by waterbody classification and corresponding water quality standards. Under this arrangement, core parameters are based on Class C waters with additional parameters added when justified (Table 2). Within this document, an analysis of how monitoring results compare with water quality standards and action levels is presented. A conceptual overview of water quality standards is provided at: http://www.epa.gov/waterscience/standards. Specific information on North Carolina water quality standards is provided at: http://h2o.enr.state.nc.us/csu/swstdsfaq.html.
NCDENR, Division of Water Quality Ambient Monitoring System Report
Watauga River Basin - February 2004 AMS-4

Table 2. Parametric coverage for the Ambient Monitoring System.1
Parameter All Waters Water Supply Dissolved oxygen (s) a a pH (s) a a Specific conductance a a Temperature (s) a a Total phosphorus2
a a Ammonia as N2
a a Total Kjeldahl as N2
a a Nitrate+nitrite as N2 (s) a a Total suspended solids a a Turbidity (s) a a Fecal coliform bacteria (s) a a Aluminum a a Arsenic (s) a a Cadmium (s) a a Chromium, total (s) a a Copper, total (s) a a Iron (s) a a Lead (s) a a Mercury (s) a a Nickel (s) a a Zinc (s) a a Manganese (s) --- a Chlorophyll a2 (s) a a
1A check (a) indicates the parameter is collected and an 's' indicates the parameter has a standard or action level. 2Chlorophyll a is collected in Nutrient Sensitive Waters (NSW) and some coastal areas. Since 2001, nutrient sampling likewise is only done in areas of concern, such as NSW, estuaries, and areas with known enrichment issues.
Table 3. Selected freshwater quality standards for parameters sampled as part of the Ambient Monitoring System.1
Standards for All Freshwater Standards to Support Additional Uses
Parameter (µg/L, unless noted) Aquatic
Life Human Health
Water Supply Classifications
Trout Water
HQW
Swamp Waters
Arsenic 10 Cadmium 2.0 0.4 Chloride 2302 250 Chlorophyll a (corrected) 403 153 Chromium, total 50 Coliform, total (MFTCC/100 ml)4 503 (WS-I only) Coliform, fecal (MFFCC/100 ml)5 2003 Copper, total 72 Dissolved oxygen (mg/L) 5.06,7 6.0 3, 7
Hardness, total (mg/L) 100 Iron 1,0002 Lead 253 Manganese 200 Mercury 0.012 Nickel 88 25 Nitrate nitrogen 10,000 pH (units) 6.0 - 9.03, 7 3, 7
Solids, total suspended (mg/L) 10 Trout, 20 other8 Turbidity (NTU) 50, 253 103 Zinc 502
1Standards apply to all classifications. For the protection of water supply and supplemental classifications, standards listed under Standards to Support Additional Uses should be used unless standards for aquatic life or human health are listed and are more stringent. Standards are the same for all water supply classifications (Administrative Code 15A NCAC 2B 0200, eff. April 1, 2001). 2Action level. 3Refer to 2B.0211 for narrative description of limits. 4Membrane filter total coliform count per 100 ml of sample. 5Membrane filter fecal coliform count per 100 ml of sample. 6An instantaneous reading may be as low as 4.0 mg/L, but the daily average must be 5.0 mg/L or more. 7Designated swamp waters may have a dissolved oxygen less than 5.0 mg/L and a pH as low as 4.3, if due to natural conditions. 8For effluent limits only, refer to 2B.0224(1)(b)(ii).
NCDENR, Division of Water Quality Ambient Monitoring System Report
Watauga River Basin - February 2004 AMS-5

WAT01
Beech Mountain
Banner ElkSeven Devils
Sugar Mountain
Elk ParkA1
A2
A3
A4
NCDENR, Division of Water Quality Ambient Monitoring System Report
Watauga River Basin – February 2005 AMS-6
Figure 1. DWQ’s Ambient Monitoring System within the Watauga River Basin.

Table 4. Monitoring stations in the Watauga River Basin, 1999 - 2004. Subbasin/ Station ID Location Class
Lat.
Long. County
Map ID
01 Watauga River, Cullasaja River, and Cartoogechaye Creek L17000001 Watauga River at SR 1557 near Shull’s Mill B Tr HQW 36.1735 -81.7460 Watauga A1 L20000002 Watauga River at NC 105 Shull’s Mill B Tr HQW 36.1930 -81.7470 Watauga A2 L23500002 Watauga River at SR 1114 near Valle Crucis B Tr HQW 36.2080 -81.7690 Watauga A3 L4700000 Watauga River at SR 1121 near Sugar Grove B Tr HQW 36.2387 -81.8229 Watauga A4
1Station L1700000 began operation on July 13, 2000. 2Stations L2000000 and L2350000 ceased operations on June 20, 2000.
DATA ASSESSMENT AND INTERPRETATION Monitoring and sampling results considered in this report represent samples collected or measurements taken at less than one-meter depth. Percentile statistics were calculated for most of the data using JMP statistical software (version 5.01; SAS Institute, Cary, NC). Values less than the minimum reporting level (non-detects) were evaluated as equal to the reporting level. Box and whisker plots (constructed using SigmaPlot version 8.02) and maps are presented for most water quality parameters collected at each monitoring station. Significant trends in water quality parameters (constructed using Microsoft Excel) are illustrated as scatterplots. Significant trends are found by assessing the probability that the linear model explains the data no better then chance. If that chance is 5% or less (an observed significance probability of 0.05 or less) then that is considered evidence of a regression effect in this document. The strength of the regression effect is given as an r2 value, the portion of the data that is explained by the linear model. Analytical Considerations Two issues were noted by the DWQ Laboratory Section as part of the analytical processes during this assessment period:
1) Between February and April 2001, improved analytical techniques and protocols for nutrient samples were implemented. No nutrient samples were processed during the period when the techniques and protocols were being implemented.
2) In early 2001 the Laboratory Section reviewed their internal QA/QC programs and some of the analytical methods. This effort resulted in a temporary increase in reporting levels for certain parameters. New analytical equipment and methods were subsequently acquired to establish more accurate reporting levels and rigorous quality assurance. Because of the improvements, the reporting levels quickly declined back down to or near the previous reporting levels. Nutrients were especially affected by these changes (Table 5).
Table 5. Changes in the Laboratory Section’s reporting levels for nutrients.
Reporting Level By Date (mg/l) Parameter Pre-2001 3/13/2001 to 3/29/2001 3/30/2001 to 7/24/2001 7/25/2001 to present
NH3 0.01 0.5 0.2 0.01 TKN 0.1 1.0 0.6 0.20
NO2+NO3 0.01 0.5 0.15 0.01 TP 0.01 0.5 0.1 0.02
Providing Confidence in the Exceedances of Water Quality Standards NC DWQ uses guidance provided by the US EPA for determining when the number of results that exceed a water quality standard indicate potential water quality issues. Historically, the US EPA has suggested that management actions be implemented when 10 percent of the results exceeded a water quality standard. This interpretation is the same whether 1 out of 10, or 5 out of 50, or 25 out of 250 results
NCDENR, Division of Water Quality Ambient Monitoring System Report
Watauga River Basin – February 2005 AMS-7
exceed a standard. Evaluating exceedances in this manner is termed the “raw-score” approach. Although this “10 percent exceedance criterion” defines a point where potential water quality issues may be present, it does not consider uncertainty. Some results are subject to chance or other factors such as calibration errors or sample mishandling. Uncertainty levels change with sample size. The smaller the sample size, the greater the uncertainty. This document uses a nonparametric procedure (Lin et al. 2000) to identify when a sufficient number of exceedances have occurred that indicate a true exceedance probability of 10 percent. Calculating the minimum number of exceedances needed for a particular sample size was done using the BINOMDIST function in Microsoft Excel®. This statistical function suggests that at least three exceedances need to be observed in a sample of 10 in order to be [about] 95 percent confident that the results statistically exceed the water quality standard more than 10% of the time. For example, there is less statistical confidence associated with a 1 exceedance out of 10 (73 percent) than when there are 3 exceedances out of 10 (93 percent confidence (Table 6).
NCDENR, Division of Water Quality Ambient Monitoring System Report
Watauga River Basin – February 2005 AMS-8

Table 6. Exceedance Confidence
Number of Exceedances
1 2 3 4 5 6 7 8 9 10 11 12 13 14 15 16 17
10 74% 93% 99% 100% 100% 100% 100% 100% 100% 100%
12 66% 89% 97% 100% 100% 100% 100% 100% 100% 100% 100% 100%
14 58% 84% 96% 99% 100% 100% 100% 100% 100% 100% 100% 100% 100% 100%
16 51% 79% 93% 98% 100% 100% 100% 100% 100% 100% 100% 100% 100% 100% 100% 100%
18 45% 73% 90% 97% 99% 100% 100% 100% 100% 100% 100% 100% 100% 100% 100% 100% 100%
20 39% 68% 87% 96% 99% 100% 100% 100% 100% 100% 100% 100% 100% 100% 100% 100% 100%
22 34% 62% 83% 94% 98% 100% 100% 100% 100% 100% 100% 100% 100% 100% 100% 100% 100%
24 29% 56% 79% 91% 97% 99% 100% 100% 100% 100% 100% 100% 100% 100% 100% 100% 100%
26 25% 51% 74% 89% 96% 99% 100% 100% 100% 100% 100% 100% 100% 100% 100% 100% 100%
28 22% 46% 69% 86% 94% 98% 100% 100% 100% 100% 100% 100% 100% 100% 100% 100% 100%
30 18% 41% 65% 82% 93% 97% 99% 100% 100% 100% 100% 100% 100% 100% 100% 100% 100%
32 16% 37% 60% 79% 91% 96% 99% 100% 100% 100% 100% 100% 100% 100% 100% 100% 100%
34 13% 33% 55% 75% 88% 95% 98% 99% 100% 100% 100% 100% 100% 100% 100% 100% 100%
36 11% 29% 51% 71% 85% 94% 98% 99% 100% 100% 100% 100% 100% 100% 100% 100% 100%
38 10% 25% 46% 67% 83% 92% 97% 99% 100% 100% 100% 100% 100% 100% 100% 100% 100%
40 8% 22% 42% 63% 79% 90% 96% 98% 99% 100% 100% 100% 100% 100% 100% 100% 100%
42 7% 20% 38% 59% 76% 88% 95% 98% 99% 100% 100% 100% 100% 100% 100% 100% 100%
44 6% 17% 35% 55% 73% 85% 93% 97% 99% 100% 100% 100% 100% 100% 100% 100% 100%
46 5% 15% 31% 51% 69% 83% 92% 96% 99% 100% 100% 100% 100% 100% 100% 100% 100%
48 4% 13% 28% 47% 65% 80% 90% 95% 98% 99% 100% 100% 100% 100% 100% 100% 100%
50 3% 11% 25% 43% 62% 77% 88% 94% 98% 99% 100% 100% 100% 100% 100% 100% 100%
52 3% 10% 22% 40% 58% 74% 86% 93% 97% 99% 100% 100% 100% 100% 100% 100% 100%
54 2% 8% 20% 36% 54% 71% 83% 91% 96% 98% 99% 100% 100% 100% 100% 100% 100%
56 2% 7% 18% 33% 51% 67% 81% 90% 95% 98% 99% 100% 100% 100% 100% 100% 100%
58 2% 6% 16% 30% 47% 64% 78% 88% 94% 97% 99% 100% 100% 100% 100% 100% 100%
60 1% 5% 14% 27% 44% 61% 75% 86% 93% 97% 99% 99% 100% 100% 100% 100% 100%
62 1% 5% 12% 24% 40% 57% 72% 84% 91% 96% 98% 99% 100% 100% 100% 100% 100%
64 1% 4% 11% 22% 37% 54% 69% 81% 90% 95% 98% 99% 100% 100% 100% 100% 100%
66 1% 3% 9% 20% 34% 51% 66% 79% 88% 94% 97% 99% 99% 100% 100% 100% 100%
68 1% 3% 8% 18% 31% 47% 63% 76% 86% 93% 96% 98% 99% 100% 100% 100% 100%
70 1% 2% 7% 16% 29% 44% 60% 74% 84% 91% 96% 98% 99% 100% 100% 100% 100%
72 0% 2% 6% 14% 26% 41% 57% 71% 82% 90% 95% 97% 99% 100% 100% 100% 100%
74 0% 2% 5% 13% 24% 38% 54% 68% 80% 88% 94% 97% 99% 99% 100% 100% 100%
76 0% 1% 5% 11% 22% 35% 51% 65% 77% 86% 93% 96% 98% 99% 100% 100% 100%
78 0% 1% 4% 10% 20% 33% 48% 62% 75% 85% 91% 95% 98% 99% 100% 100% 100%
80 0% 1% 4% 9% 18% 30% 45% 59% 72% 83% 90% 95% 97% 99% 99% 100% 100%
Number of
Samples
Note: Bold entries indicate that there is at least 95% confidence that at least 10% of the possible samples exceed the standard/action level.
NCDENR, Division of Water Quality Ambient Monitoring System Report
Watauga River Basin – February 2005 AMS-9

Methods Used to Summarize Results Methods used to summarize the results in this report encompass both tabular and graphical formats. Individual summary sheets for each station provide details on station location, stream classification, along with specifics on what parameters were measured, the number of samples taken (i.e. sample size), the number of results below reporting levels, the number of results exceeding a water quality standard or action level, statistical confidence that 10% of results exceeded the evaluation level, and a general overview of the distribution of the results using percentiles. These station summary sheets provide the most details on a station-by-station basis. They are included as an appendix to this report. Use Support Assessment Considerations 1) The dissolved freshwater oxygen concentrations of 5.0 and 4.0 mg/L are presented as evaluation
levels. Instantaneous concentrations of 4.0 mg/L or less exceed the standard unless caused by natural (e.g. swampy) conditions. The 5.0 mg/L evaluation level is based upon a freshwater standard which specifies “not less than a daily average of 5.0” (15A NCAC 2B.0200).
2) Action levels (copper, iron, and zinc) are used primarily as evaluation guidelines because results include fractions that may have little effect on aquatic life. Where appropriate, follow-up toxicological work will need to be conducted before use support determination can be made for these parameters.
Specific information on water quality standards and action levels can be found in 15A NCAC 2B.0200 (August 1, 2004).
PARAMETERS Dissolved Oxygen Dissolved oxygen is one of the most important of all the chemical measurements. Dissolved oxygen provides valuable information about the ability of the water to support aquatic life and the capacity of water to assimilate point and nonpoint discharges. Water quality standards for dissolved oxygen vary depending on the classification of the body of water [see, for example: 15A NCAC 02B.0211(1)(b) and 15A NCAC 02B.0220 (1)(b)] but generally results less than 4.0 mg/L can be problematic. Consistent patterns of low concentrations of dissolved oxygen can be subject to intense management review and corrective actions, although patterns of low dissolved oxygen can occur naturally in and near swamp waters. pH The pH of natural waters can vary throughout the state. Low values (<< 7.0 s.u.) can be found in waters rich in dissolved organic matter, such as swamp lands, whereas high values (>> 7.0 s.u.) may be found during algal blooms. Point source dischargers can also influence the pH of a stream. The measurement of pH is relatively easy; however the accuracy of field measurements is limited by the abilities of the field equipment, which is accurate to within 0.2 S.U. This is due, in part, because the scale for measuring pH is logarithmic (i.e. a pH of 8 is ten times less concentrated in hydrogen ions than a pH of 7). The water quality standards for pH in freshwaters consider values less than 6.0 s.u. or greater than 9.0 s.u. to warrant attention. Conductivity In this report, conductivity is synonymous with specific conductance. It is reported in micromhos per centimeter (µmhos/cm) at 25°C. Conductivity is a measure of the ability of water to conduct an electric current. The presence of ions and temperature are major factors in the ability of water to conduct a current. Clean freshwater has a low conductivity, whereas high conductivities may indicate polluted water or saline conditions. Measurements reported are corrected for temperature, thus the range of values reported over a period of time indicate the relative presence of ions in water. Conductivities in US fresh
NCDENR, Division of Water Quality Ambient Monitoring System Report
Watauga River Basin – February 2005 AMS-10

waters commonly vary between 50 to 1,500 µmhos/cm (APHA 1998). According to a USGS study completed in 1992, North Carolina freshwater streams have a natural conductance range of 17-65 µmhos/cm (USGS 1992). Conductivity can be used to evaluate variations in dissolved mineral concentrations (ions) among sites with varying degrees of impact resulting from point source discharges. Generally, impacted sites show elevated and widely ranging values for conductivity. Turbidity Turbidity data may denote episodic high values on particular dates or within narrow time periods. These can often be the result of intense or sustained rainfall events; however elevated values can occur at other times. Metals A number of metals are essential micronutrients for the support of aquatic life. However, there are threshold concentrations over which metals can be toxic. Currently the DWQ monitors total (not dissolved) concentrations for aluminum, arsenic, cadmium, chromium, copper, iron, lead, mercury, manganese (Water Supply waters only), nickel, and zinc. Aluminum and iron are commonly found in soils. Nutrients Compounds of nitrogen and phosphorus are major components of living organisms and thus are essential to maintain life. These compounds are collectively referred to as “nutrients.” Nitrogen compounds include ammonia-nitrogen (NH3-N), total Kjeldahl nitrogen (TKN) and nitrite+nitrate nitrogen (NO2+NO3-N). Phosphorus is measured as total phosphorus. When nutrients are introduced to an aquatic ecosystem from municipal and industrial treatment processes, or runoff from urban or agricultural land, the growth of algae (algal blooms) and other plants may be accelerated. In addition to the possibility of causing algal blooms, ammonia-nitrogen may combine with high pH water to form NH4OH, a form toxic to fish and other aquatic organisms. Fecal Coliform Bacteria Concentrations of fecal coliform bacteria can vary greatly. The descriptive statistics used to evaluate fecal coliform bacteria data include the geometric mean and the median depending on the classification of the waterbody. For all sites in the Watauga River Basin, the standard specified in Administrative Code 15A NCAC 02B.0211 (3)(e) (August 1, 2004) is applicable: "Organisms of the coliform group: fecal coliforms shall not exceed a geometric mean of 200/100ml (MF count) based upon at least five consecutive samples examined during any 30 day period, nor exceed 400/100ml in more than 20 percent of the samples examined during such period; violations of the fecal coliform standard are expected during rainfall events and, in some cases, this violation is expected to be caused by uncontrollable nonpoint source pollution; all coliform concentrations are to be analyzed using the membrane filter technique unless high turbidity or other adverse conditions necessitate the tube dilution method; in case of controversy over results, the MPN 5-tube dilution technique shall be used as the reference method.” The strict application of the standard is often hindered because the monthly (circa 30 day) sampling frequency employed for water quality monitoring usually does not provide more than one sample per 30-day period. However, water quality problems can be discerned using monthly sampling.
NCDENR, Division of Water Quality Ambient Monitoring System Report
Watauga River Basin – February 2005 AMS-11
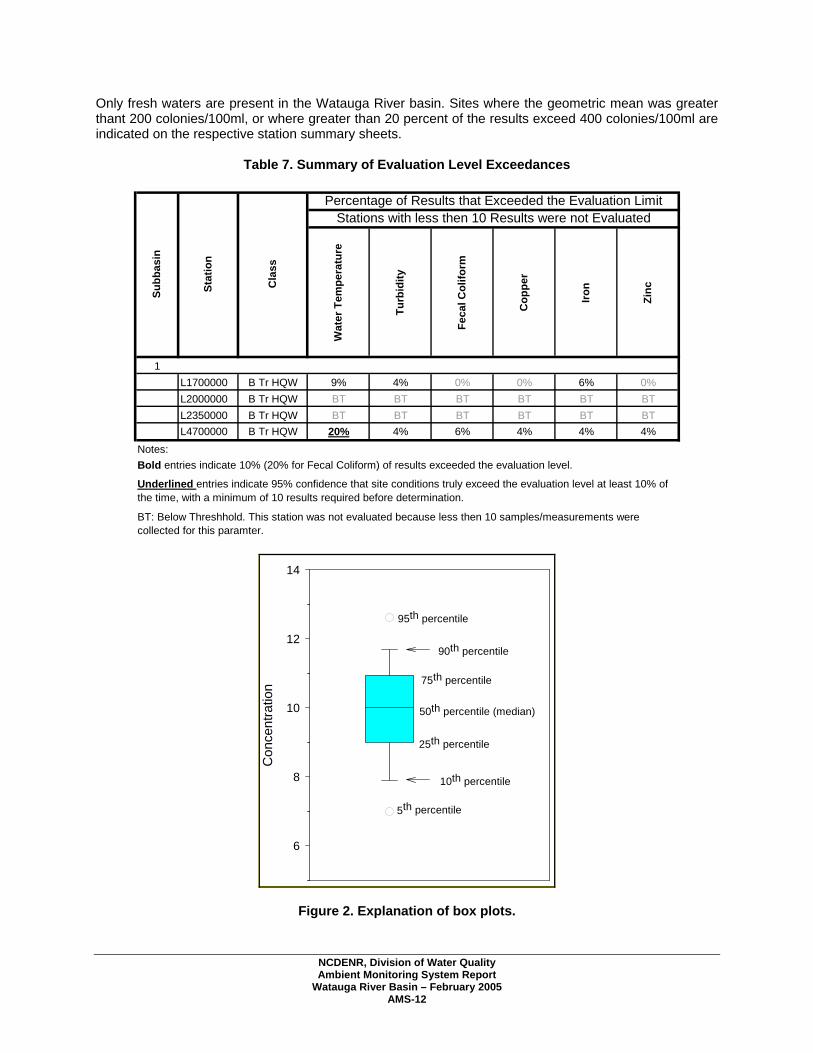
Only fresh waters are present in the Watauga River basin. Sites where the geometric mean was greater thant 200 colonies/100ml, or where greater than 20 percent of the results exceed 400 colonies/100ml are indicated on the respective station summary sheets.
Table 7. Summary of Evaluation Level Exceedances
Wat
er T
empe
ratu
re
Turb
idity
Feca
l Col
iform
Cop
per
Iron
Zinc
1L1700000 B Tr HQW 9% 4% 0% 0% 6% 0%L2000000 B Tr HQW BT BT BT BT BT BTL2350000 B Tr HQW BT BT BT BT BT BTL4700000 B Tr HQW 20% 4% 6% 4% 4% 4%
Notes:Bold entries indicate 10% (20% for Fecal Coliform) of results exceeded the evaluation level.
BT: Below Threshhold. This station was not evaluated because less then 10 samples/measurements were collected for this paramter.
Underlined entries indicate 95% confidence that site conditions truly exceed the evaluation level at least 10% of the time, with a minimum of 10 results required before determination.
Subb
asin
Stat
ion
Cla
ss
Percentage of Results that Exceeded the Evaluation LimitStations with less then 10 Results were not Evaluated
Con
cent
ratio
n
6
8
10
12
14
95th percentile
75th percentile
50th percentile (median)
25th percentile
10th percentile
5th percentile
90th percentile
Figure 2. Explanation of box plots.
NCDENR, Division of Water Quality Ambient Monitoring System Report
Watauga River Basin – February 2005 AMS-12

WATER QUALITY PATTERNS IN THE WATAUGA RIVER BASIN Box and whisker plots, scatterplots, and maps were used to depict differences in a variety of water quality parameters. While graphs portray information visually, specific and accurate details can only be conveyed in tables. Individual station summary sheets should be consulted when exact information is needed. For the box plots, stations with fewer then 10 data points for a given parameter were not included. Regional Patterns Box and whisker plots were generated for each station for each water quality parameter that has an evaluation level, plus specific conductance, total nitrate/nitrite, total kjeldahl nitrogen, total ammonia, and total phosphorus, excluding those that had less then 10 measurements. Station L4700000, the Watauga River at SR 1121 near Sugar Grove, had one SSE for Water Temperature. There were no additional 10 percent violations. This station is designated as Trout Waters, which are held to a stringent standard of 20°C. The exceedances all occurred in the summer months. Trends over Time Several trends of significance (p < 0.05) of interest were identified in the basin. At station L1700000 an increasing pH trend was identified. At this same station, a decreasing trend for total ammonia concentrations is present. Because a drop in ammonia concentrations would more likely be linked to a drop in pH, there does not appear to be a linkage between these trends. At station L4700000, increasing trends in specific conductance and total nitrate/nitrite were identified. No specific cause has been identifed in the site area. The site is near to several major ski and golf resort areas, which are potential sources.
NCDENR, Division of Water Quality Ambient Monitoring System Report
Watauga River Basin – February 2005 AMS-13

>20% Exceedances 10% to 20% Exceedances
0% to 10% Exceedances No Exceedances
Note: Stations with no circle have no Evaluation Level or less then 10 samples for the given parameter.
WAT01
Beech Mountain
Banner ElkSeven Devils
Sugar Mountain
Elk Park
WAT01
Beech Mountain
Banner ElkSeven Devils
Sugar Mountain
Elk Park
Total Iron
Total Copper
Figure 3. Total Iron and Total Copper in the Watauga River Basin
NCDENR, Division of Water Quality Ambient Monitoring System Report
Watauga River Basin – February 2005 AMS-14

>20% Exceedances 10% to 20% Exceedances
0% to 10% Exceedances No Exceedances
Note: Stations with no circle have no Evaluation Level or less then 10 samples for the given parameter.
WAT01
Beech Mountain
Banner ElkSeven Devils
Sugar Mountain
Elk Park
WAT01
Beech Mountain
Banner ElkSeven Devils
Sugar Mountain
Elk Park
Water Temperature
Turbidity
Figure 4. Turbidity and Water Temperature in the Watauga River Basin
NCDENR, Division of Water Quality Ambient Monitoring System Report
Watauga River Basin – February 2005 AMS-15

L170
0000
B T
r HQ
W
L470
0000
B T
r HQ
W
Dis
solv
ed O
xyge
n (m
g/l)
8
10
12
14
Wat
auga
Riv
erSh
ulls
Mill
Wat
auga
Riv
erSu
gar G
rove
L170
0000
B T
r HQ
W
L470
0000
B T
r HQ
W
pH (S
.U.)
6.0
6.5
7.0
7.5
8.0
8.5
Wat
auga
Riv
erSh
ulls
Mill
Wat
auga
Riv
erSu
gar G
rove
L170
0000
B T
r HQ
W
L470
0000
B T
r HQ
W
Wat
er T
empe
ratu
re (D
egre
es C
elsi
us)
0
5
10
15
20
25
Wat
auga
Riv
erSh
ulls
Mill
Wat
auga
Riv
erSu
gar G
rove
L170
0000
B T
r HQ
W
L470
0000
B T
r HQ
W
Spec
ific
Con
duct
ivity
(um
hos/
cm a
t 25
Deg
rees
Cel
sius
)
40
60
80
100
Wat
auga
Riv
erSh
ulls
Mill
Wat
auga
Riv
erSu
gar G
rove
L170
0000
B T
r HQ
W
L470
0000
B T
r HQ
W
Turb
idity
(NTU
)
0
2
4
6
8
10
12
14
Wat
auga
Riv
erSh
ulls
Mill
Wat
auga
Riv
erSu
gar G
rove
Figure 5. Box Plots for Dissolved Oxygen, Specific Conductivity, Water Temperature, and
Turbidity in the Watauga River Basin
NCDENR, Division of Water Quality Ambient Monitoring System Report
Watauga River Basin – February 2005 AMS-16

L170
0000
B T
r HQ
W
L470
0000
B T
r HQ
W
Tota
l Am
mon
ia (m
g/l)
0.0
0.1
0.2
0.3
0.4
0.5
0.6
Wat
auga
Riv
erSh
ulls
Mill
Wat
auga
Riv
erSu
gar G
rove
L170
0000
B T
r HQ
W
L470
0000
B T
r HQ
W
Tota
l Nitr
ate/
Nitr
ite (m
g/l)
0.0
0.2
0.4
0.6
0.8
Wat
auga
Riv
erSh
ulls
Mill
Wat
auga
Riv
erSu
gar G
rove
L170
0000
B T
r HQ
W
L470
0000
B T
r HQ
W
Tota
l Kje
ldah
l Nitr
ogen
(mg/
l)
0.0
0.2
0.4
0.6
0.8
1.0
Wat
auga
Riv
erSh
ulls
Mill
Wat
auga
Riv
erSu
gar G
rove
L170
0000
B T
r HQ
W
L470
0000
B T
r HQ
W
Tota
l Pho
spho
rus
(mg/
l)
0.0
0.1
0.2
0.3
0.4
Wat
auga
Riv
erSh
ulls
Mill
Wat
auga
Riv
erSu
gar G
rove
Figure 6. Box Plots for Total Ammonia, Total Nitrate/Nitrite, Total Kjeldahl Nitrogen, and Total
Phosphorus in the Watauga River Basin
NCDENR, Division of Water Quality Ambient Monitoring System Report
Watauga River Basin – February 2005 AMS-17

L170
0000
B T
r HQ
W
L470
0000
B T
r HQ
W
Tota
l Cop
per (µ g
/l)
1
10
100
Wat
auga
Riv
erSh
ulls
Mill
Wat
auga
Riv
erSu
gar G
rove
L170
0000
B T
r HQ
W
L470
0000
B T
r HQ
W
Tota
l Iro
n (µ
g/l)
0
200
400
600
800
1000
Wat
auga
Riv
erSh
ulls
Mill
Wat
auga
Riv
erSu
gar G
rove
L170
0000
B T
r HQ
W
L470
0000
B T
r HQ
W
Tota
l Zin
c (µ
g/l)
10
20
30
40
50
60
70
Wat
auga
Riv
erSh
ulls
Mill
Wat
auga
Riv
erSu
gar G
rove
L170
0000
B T
r HQ
W
L470
0000
B T
r HQ
W
Feca
l Col
iform
(# c
olon
ies/
100m
l)
1
10
100
1000
Wat
auga
Riv
erSh
ulls
Mill
Wat
auga
Riv
erSu
gar G
rove
Figure 7. Box Plots for Total Copper, Total Iron, Total Zinc, and Fecal Coliform in the Watauga
River Basin
NCDENR, Division of Water Quality Ambient Monitoring System Report
Watauga River Basin – February 2005 AMS-18

Station L1700000: Watauga River at SR 1557 near Shull's Mill
5.9
6.4
6.9
7.4
7.9
8.49/
1/19
99
12/1
/199
9
3/1/
2000
6/1/
2000
9/1/
2000
12/1
/200
0
3/1/
2001
6/1/
2001
9/1/
2001
12/1
/200
1
3/1/
2002
6/1/
2002
9/1/
2002
12/1
/200
2
3/1/
2003
6/1/
2003
9/1/
2003
12/1
/200
3
3/1/
2004
6/1/
2004
9/1/
2004
pH (S
.U.)
Maximum Evaluation Level: 9
Minimum Evaluation Level: 6
p = 0.0017r2 = 0.185
Station L1700000: Watauga River at SR 1557 near Shull's Mill
0
0.1
0.2
0.3
0.4
0.5
0.6
9/1/
1999
12/1
/199
9
3/1/
2000
6/1/
2000
9/1/
2000
12/1
/200
0
3/1/
2001
6/1/
2001
9/1/
2001
12/1
/200
1
3/1/
2002
6/1/
2002
9/1/
2002
12/1
/200
2
3/1/
2003
6/1/
2003
9/1/
2003
12/1
/200
3
3/1/
2004
6/1/
2004
9/1/
2004
Tota
l Am
mon
ia (m
g/l)
p = 0.0365r2 = 0.130
Figure 8. Trends of Interest in the Watauga River Basin
NCDENR, Division of Water Quality Ambient Monitoring System Report
Watauga River Basin – February 2005 AMS-19

Appendix A: AMS Station Summary Sheets
NCDENR, Division of Water Quality Ambient Monitoring System Report
Watauga River Basin – February 2005 AMS-20

NCDENR, Division of Water Quality Ambient Monitoring System Report
Watauga River Basin – February 2005 AMS-21
Ambient Monitoring System Station NCDENR, Division of Water Basinwide Assessment Location: WATAUGA RIV AT SR 1557 NR SHULLS MILL Station #: L1700000 Subbasin: WAT01 Latitude: 36.17352 Longitude: -81.74597 Stream class: B Tr HQW Agency: NCAMBNT NC stream index: 8-(1) Time period: 07/13/2000 to 08/25/2004 # # Results not meeting EL Percentile result ND EL # % 95% Min 10th 25th 50th 75th 90th Max Field D.O. (mg/L) 46 0 <6 0 0 7.4 7.9 8.3 9.4 11.4 13.6 15.5 pH (SU) 46 0 <6 0 0 6 6.2 6.4 7 7.4 7.5 8.2 46 0 >9 0 0 6 6.2 6.4 7 7.4 7.5 8.2 Spec. conductance 46 0 N/A 25 38 42 45 51 56 248 (umhos/cm at 25°C) Water Temperature (°C) 46 0 >20 4 8.7 1 3 5.7 13.7 17.8 20.1 22.1 Other TSS (mg/L) 16 6 N/A 1 2 2 4 4 6 8 Turbidity (NTU) 47 7 >10 2 4.3 1 1 1 2 4 7 25 Nutrients (mg/L) NH3 as N 27 20 N/A 0.01 0.01 0.02 0.02 0.05 0.2 0.5 NO2 + NO3 as N 27 1 N/A 0.07 0.17 0.2 0.27 0.36 0.43 0.5 TKN as N 26 17 N/A 0.1 0.2 0.2 0.2 0.2 0.46 1 Total Phosphorus 27 9 N/A 0.01 0.01 0.02 0.02 0.03 0.1 0.5 Metals (ug/L) Aluminum, total (Al) 16 1 N/A 50 50 56 120 165 458 990 Arsenic, total (As) 16 16 >10 0 0 10 10 10 10 10 10 10 Cadmium, total (Cd) 16 16 >0.4 0 0 2 2 2 2 2 2 2 Chromium, total (Cr) 16 16 >50 0 0 25 25 25 25 25 25 25 Copper, total (Cu) 16 12 >7 0 0 2 2 2 2 2 3 4 Iron, total (Fe) 16 0 >1000 1 6.2 140 140 265 350 430 1029 2100 Lead, total (Pb) 16 16 >25 0 0 10 10 10 10 10 10 10 Mercury, total (Hg) 16 16 >0.012 0 0 0.2 0.2 0.2 0.2 0.2 0.2 0.2 Nickel, total (Ni) 16 16 >88 0 0 10 10 10 10 10 10 10 Zinc, total (Zn) 16 13 >50 0 0 10 10 10 10 10 21 31 Fecal coliform (#/100mL) # results: Geomean # > 400: % > 400: 95%: 45 24 0 0
Key: # result: number of observations # ND: number of observations reported to be below detection level (non-detect) EL: Evaluation Level; applicable numeric or narrative water quality standard or action level Results not meeting EL: number and percentages of observations not meeting evaluation level 95% : States whether there is 95% statistical confidence that the actual percentage of exceedances is at least 10% (20% for Fecal Coliform) Stations with less than 10 results for a given parameter were not evaluated for statistical confidence

NCDENR, Division of Water Quality Ambient Monitoring System Report
Watauga River Basin – February 2005 AMS-22
Ambient Monitoring System Station NCDENR, Division of Water Basinwide Assessment Location: WATAUGA RIV AT NC 105 SHULLS MILL Station #: L2000000 Subbasin: WAT01 Latitude: 36.19300 Longitude: -81.74700 Stream class: B Tr HQW Agency: NCAMBNT NC stream index: 8-(1) Time period: 09/23/1999 to 06/20/2000 # # Results not meeting EL Percentile result ND EL # % 95% Min 10th 25th 50th 75th 90th Max Field D.O. (mg/L) 9 0 <6 0 0 8.1 8.1 9.9 10.2 11 11.5 11.5 pH (SU) 9 0 <6 0 0 6 6 6 6.1 6.6 7 7 9 0 >9 0 0 6 6 6 6.1 6.6 7 7 Spec. conductance 9 0 N/A 33 33 44 48 60 67 67 (umhos/cm at 25°C) Water Temperature (°C) 9 0 >20 0 0 5 5 8.5 12 14.5 20 20 Other TSS (mg/L) 9 1 N/A 1 1 1 3 8 16 16 Turbidity (NTU) 9 3 >10 0 0 1 1 1 2 3 3 3 Nutrients (mg/L) NH3 as N 9 5 N/A 0.01 0.01 0.01 0.01 0.19 0.34 0.34 NO2 + NO3 as N 9 0 N/A 0.14 0.14 0.33 0.4 0.44 0.67 0.67 TKN as N 9 0 N/A 0.2 0.2 0.2 0.3 0.35 0.7 0.7 Total Phosphorus 9 2 N/A 0.01 0.01 0.01 0.01 0.01 0.03 0.03 Metals (ug/L) Aluminum, total (Al) 9 3 N/A 50 50 50 130 175 250 250 Arsenic, total (As) 9 9 >10 0 0 10 10 10 10 10 10 10 Cadmium, total (Cd) 9 9 >0.4 0 0 2 2 2 2 2 2 2 Chromium, total (Cr) 9 9 >50 0 0 25 25 25 25 25 25 25 Copper, total (Cu) 9 8 >7 1 11.1 2 2 2 2 2 20 20 Iron, total (Fe) 9 0 >1000 0 0 110 110 230 300 385 600 600 Lead, total (Pb) 9 9 >25 0 0 10 10 10 10 10 10 10 Mercury, total (Hg) 9 9 >0.012 0 0 0.2 0.2 0.2 0.2 0.2 0.2 0.2 Nickel, total (Ni) 9 9 >88 0 0 10 10 10 10 10 10 10 Zinc, total (Zn) 9 8 >50 0 0 10 10 10 10 10 25 25 Fecal coliform (#/100mL) # results: Geomean # > 400: % > 400: 95%: 9 34 0 0
Key: # result: number of observations # ND: number of observations reported to be below detection level (non-detect) EL: Evaluation Level; applicable numeric or narrative water quality standard or action level Results not meeting EL: number and percentages of observations not meeting evaluation level 95% : States whether there is 95% statistical confidence that the actual percentage of exceedances is at least 10% (20% for Fecal Coliform) Stations with less than 10 results for a given parameter were not evaluated for statistical confidence

NCDENR, Division of Water Quality Ambient Monitoring System Report
Watauga River Basin – February 2005 AMS-23
Ambient Monitoring System Station NCDENR, Division of Water Basinwide Assessment Location: WATAUGA RIV AT SR 1114 NR VALLE CRUCIS Station #: L2350000 Subbasin: WAT01 Latitude: 36.20800 Longitude: -81.76900 Stream class: B Tr HQW Agency: NCAMBNT NC stream index: 8-(1) Time period: 09/23/1999 to 06/20/2000 # # Results not meeting EL Percentile result ND EL # % 95% Min 10th 25th 50th 75th 90th Max Field D.O. (mg/L) 9 0 <6 0 0 7.4 7.4 10.3 10.6 11.6 12 12 pH (SU) 9 0 <6 0 0 6.1 6.1 6.4 7 7.3 7.6 7.6 9 0 >9 0 0 6.1 6.1 6.4 7 7.3 7.6 7.6 Spec. conductance 9 0 N/A 27 27 46 51 58 63 63 (umhos/cm at 25°C) Water Temperature (°C) 9 0 >20 1 11.1 5 5 8.5 11 13.5 22 22 Other TSS (mg/L) 9 1 N/A 1 1 1 2 5 7 7 Turbidity (NTU) 9 3 >10 0 0 1 1 1 1 3 4 4 Nutrients (mg/L) NH3 as N 9 6 N/A 0.01 0.01 0.01 0.01 0.03 0.17 0.17 NO2 + NO3 as N 9 0 N/A 0.27 0.27 0.31 0.38 0.45 0.72 0.72 TKN as N 9 0 N/A 0.1 0.1 0.2 0.2 0.25 0.3 0.3 Total Phosphorus 9 2 N/A 0.01 0.01 0.01 0.01 0.01 0.02 0.02 Metals (ug/L) Aluminum, total (Al) 9 2 N/A 50 50 52 64 165 290 290 Arsenic, total (As) 9 9 >10 0 0 10 10 10 10 10 10 10 Cadmium, total (Cd) 9 9 >0.4 0 0 2 2 2 2 2 2 2 Chromium, total (Cr) 9 9 >50 0 0 25 25 25 25 25 25 25 Copper, total (Cu) 9 8 >7 1 11.1 2 2 2 2 2 9 9 Iron, total (Fe) 9 0 >1000 0 0 110 110 185 260 360 510 510 Lead, total (Pb) 9 9 >25 0 0 10 10 10 10 10 10 10 Mercury, total (Hg) 9 9 >0.012 0 0 0.2 0.2 0.2 0.2 0.2 0.2 0.2 Nickel, total (Ni) 9 9 >88 0 0 10 10 10 10 10 10 10 Zinc, total (Zn) 9 1 >50 0 0 10 10 14 21 26 32 32 Fecal coliform (#/100mL) # results: Geomean # > 400: % > 400: 95%: 9 31 0 0
Key: # result: number of observations # ND: number of observations reported to be below detection level (non-detect) EL: Evaluation Level; applicable numeric or narrative water quality standard or action level Results not meeting EL: number and percentages of observations not meeting evaluation level 95% : States whether there is 95% statistical confidence that the actual percentage of exceedances is at least 10% (20% for Fecal Coliform) Stations with less than 10 results for a given parameter were not evaluated for statistical confidence

NCDENR, Division of Water Quality Ambient Monitoring System Report
Watauga River Basin – February 2005 AMS-24
Ambient Monitoring System Station NCDENR, Division of Water Basinwide Assessment Location: WATAUGA RIV AT SR 1121 NR SUGAR GROVE Station #: L4700000 Subbasin: WAT01 Latitude: 36.23874 Longitude: -81.82290 Stream class: B Tr HQW Agency: NCAMBNT NC stream index: 8-(1) Time period: 09/23/1999 to 08/25/2004 # # Results not meeting EL Percentile result ND EL # % 95% Min 10th 25th 50th 75th 90th Max Field D.O. (mg/L) 55 0 <6 0 0 7.8 8.6 9.2 10.2 12 13.5 16.3 pH (SU) 55 0 <6 0 0 6.1 6.4 7 7.4 7.6 7.9 8.8 55 0 >9 0 0 6.1 6.4 7 7.4 7.6 7.9 8.8 Spec. conductance 55 0 N/A 34 46 58 69 85 91 115 (umhos/cm at 25°C) Water Temperature (°C) 54 0 >20 11 20.4 Yes 1 3.5 6 14.8 20 23.4 24.7 Other TSS (mg/L) 26 6 N/A 1 1 2 3 6 10 27 Turbidity (NTU) 56 7 >10 2 3.6 1 1 1 2 4 6 20 Nutrients (mg/L) NH3 as N 36 27 N/A 0.01 0.01 0.01 0.02 0.02 0.25 1.2 NO2 + NO3 as N 36 0 N/A 0.15 0.26 0.39 0.5 0.67 0.87 1 TKN as N 35 14 N/A 0.1 0.16 0.2 0.2 0.3 0.44 1 Total Phosphorus 36 9 N/A 0.01 0.01 0.02 0.02 0.04 0.08 0.5 Metals (ug/L) Aluminum, total (Al) 26 4 N/A 50 50 58 115 205 288 1000 Arsenic, total (As) 25 25 >10 0 0 10 10 10 10 10 10 10 Cadmium, total (Cd) 26 26 >0.4 0 0 2 2 2 2 2 2 2 Chromium, total (Cr) 26 26 >50 0 0 25 25 25 25 25 25 25 Copper, total (Cu) 26 20 >7 1 3.8 2 2 2 2 2 5 750 Iron, total (Fe) 26 0 >1000 1 3.8 96 124 210 300 492 529 1300 Lead, total (Pb) 26 26 >25 0 0 10 10 10 10 10 10 10 Mercury, total (Hg) 26 26 >0.012 0 0 0.2 0.2 0.2 0.2 0.2 0.2 0.2 Nickel, total (Ni) 26 26 >88 0 0 10 10 10 10 10 10 10 Zinc, total (Zn) 26 9 >50 1 3.8 10 10 10 12 29 49 72 Fecal coliform (#/100mL) # results: Geomean # > 400: % > 400: 95%: 54 43 3 6
Key: # result: number of observations # ND: number of observations reported to be below detection level (non-detect) EL: Evaluation Level; applicable numeric or narrative water quality standard or action level Results not meeting EL: number and percentages of observations not meeting evaluation level 95% : States whether there is 95% statistical confidence that the actual percentage of exceedances is at least 10% (20% for Fecal Coliform) Stations with less than 10 results for a given parameter were not evaluated for statistical confidence

Watauga River Basin Basinwide Assessment Report
Whole Effluent Toxicity Program
2000-2004

The Division of Water Quality’s Whole Effluent Toxicity Monitoring Program Acute and/or chronic toxicity tests are used to determine toxicity of discharges to sensitive aquatic species (usually fathead minnows or the water flea, Ceriodaphnia dubia). Results of these tests have been shown by researchers to be predictive of discharge effects to receiving stream populations. Many facilities are required to monitor whole effluent toxicity (WET) by their NPDES permit. Facilities without monitoring requirements may have their effluents evaluated for toxicity by DWQ’s Aquatic Toxicology Laboratory. If toxicity is detected, DWQ may include aquatic toxicity testing upon permit renewal. DWQ’s Aquatic Toxicology Unit maintains a compliance summary for all facilities required to perform tests and provides a monthly update of this information to regional offices and WQ administration. Ambient toxicity tests can be used to evaluate stream water quality relative to other stream sites and/or a point source discharge. WET Monitoring in the Watauga River Basin – 2000-2004 Two facility permits in the Watauga River basin currently require whole effluent toxicity (WET) monitoring (Figure 1 and Table 1). Both facility permits have a WET limit. Figure 1. Watauga River basin facilities required to conduct whole effluent toxicity testing
NCDENR, Division of Water Quality BASINWIDE ASSESSMENT REPORT – WATAUGA RIVER BASIN – APRIL 2005
1
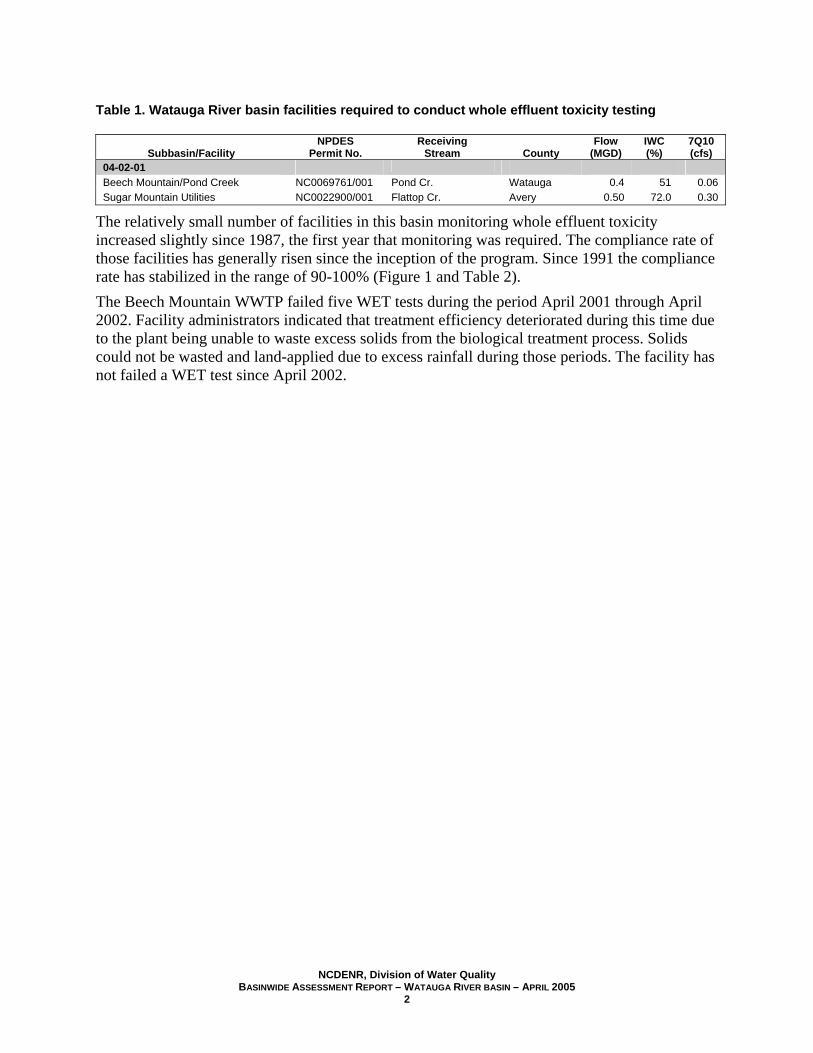
Table 1. Watauga River basin facilities required to conduct whole effluent toxicity testing
Subbasin/Facility
NPDES Permit No.
Receiving Stream
County
Flow (MGD)
IWC (%)
7Q10 (cfs)
04-02-01 Beech Mountain/Pond Creek NC0069761/001 Pond Cr. Watauga 0.4 51 0.06 Sugar Mountain Utilities NC0022900/001 Flattop Cr. Avery 0.50 72.0 0.30
The relatively small number of facilities in this basin monitoring whole effluent toxicity increased slightly since 1987, the first year that monitoring was required. The compliance rate of those facilities has generally risen since the inception of the program. Since 1991 the compliance rate has stabilized in the range of 90-100% (Figure 1 and Table 2). The Beech Mountain WWTP failed five WET tests during the period April 2001 through April 2002. Facility administrators indicated that treatment efficiency deteriorated during this time due to the plant being unable to waste excess solids from the biological treatment process. Solids could not be wasted and land-applied due to excess rainfall during those periods. The facility has not failed a WET test since April 2002.
NCDENR, Division of Water Quality BASINWIDE ASSESSMENT REPORT – WATAUGA RIVER BASIN – APRIL 2005
2

Figure 2. NPDES facility whole effluent toxicity compliance in the Watauga River basin, 1990-2004. The compliance values were calculated by determining whether facilities with WET limits were meeting their ultimate permit limits during the given time period, regardless of any SOCs in force.
0
1
2
3
4
1987
1988
1989
1990
1991
1992
1993
1994
1995
1996
1997
1998
1999
2000
2001
2002
2003
2004
Year
Faci
litie
s Mon
itori
ng
0
10
20
30
40
50
60
70
80
90
100
Com
plia
nce
(%)
No. Facilities % Meeting Permit Limit
Table 2. Recent compliance record of facilities performing whole effluent toxicity testing in the Watauga River basin
Subbasin/Facility
NPDES Permit No.
2000- 2003 Passes
2000- 2003 Fails
2004 Passes
2004 Fails
04-02-01 Beech Mountain/Pond Creek NC0069761/001 17 5 4 0 Sugar Mountain Utilities NC0022900/001 17 2 4 0 Note that “pass” denotes meeting a permit limit or, for those facilities with a monitoring requirement, meeting a target value. The actual test result may be a “pass” (from a pass/fail acute or chronic test), LC50, or chronic value. Conversely, “fail” means failing to meet a permit limit or target value.
NCDENR, Division of Water Quality BASINWIDE ASSESSMENT REPORT – WATAUGA RIVER BASIN – APRIL 2005
3


![Watauga Democrat (Boone, N.C.) 1933-11-02 [p PAGE EIGHT]](https://img.pdfslide.us/doc/110x75/626a9c39ca7d6540d043b746/watauga-democrat-boone-nc-1933-11-02-p-page-eight.jpg)