Embed Size (px)
Citation preview
Financial Results
March 2012

Agenda
Highlights
Financial overview
Operational overview
Prospects
Conclusion
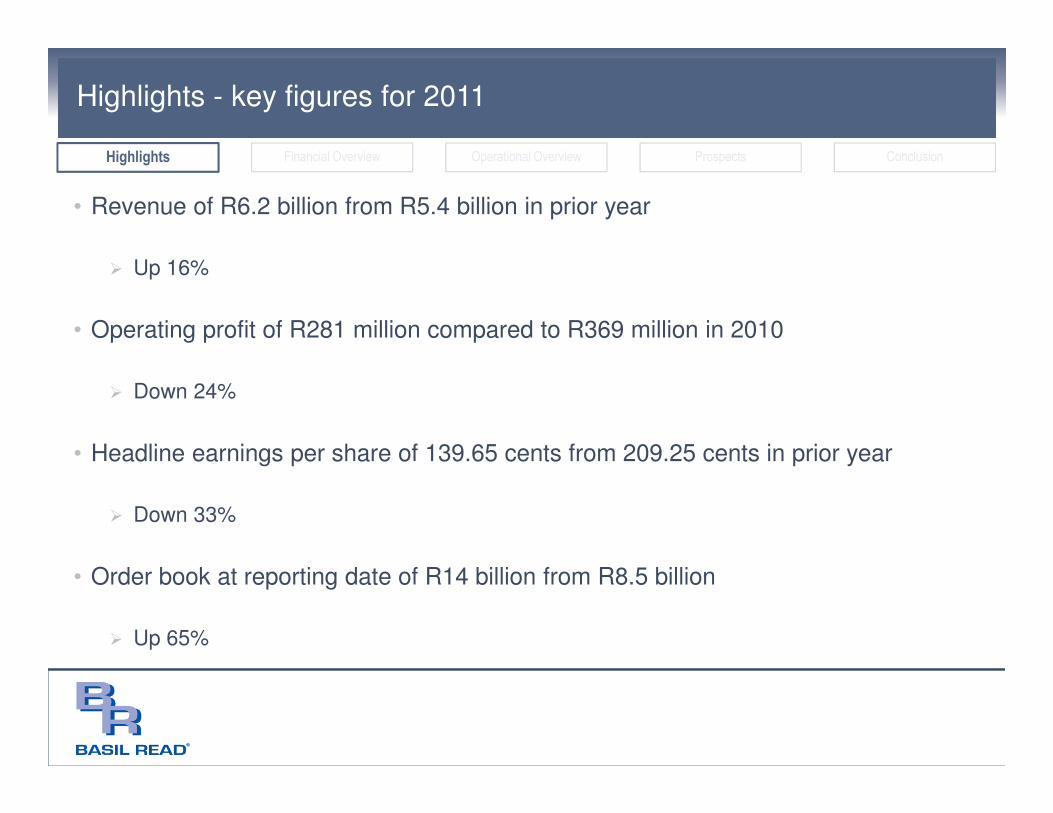
Highlights - key figures for 2011
• Revenue of R6.2 billion from R5.4 billion in prior year
� Up 16%
• Operating profit of R281 million compared to R369 million in 2010
� Down 24%
• Headline earnings per share of 139.65 cents from 209.25 cents in prior year
� Down 33%
• Order book at reporting date of R14 billion from R8.5 billion
� Up 65%
Highlights Financial Overview Operational Overview Prospects Conclusion
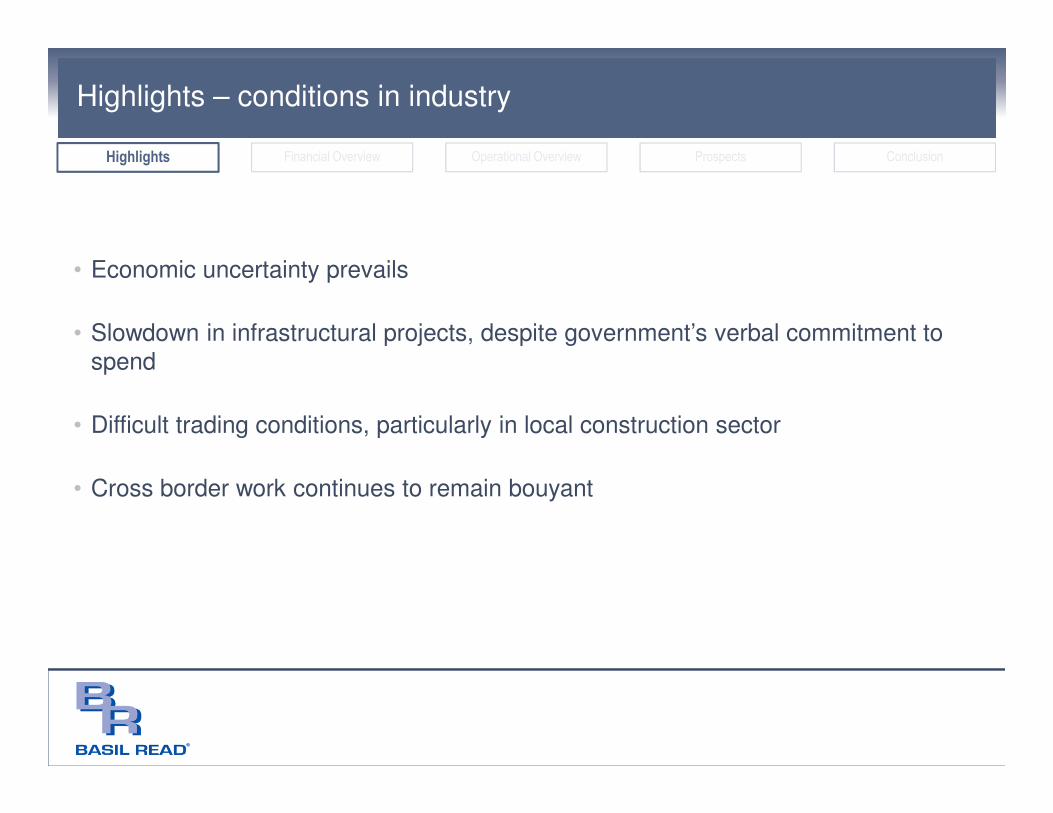
Highlights – conditions in industry
• Economic uncertainty prevails
• Slowdown in infrastructural projects, despite government’s verbal commitment to
spend
• Difficult trading conditions, particularly in local construction sector
• Cross border work continues to remain bouyant
Highlights Financial Overview Operational Overview Prospects Conclusion
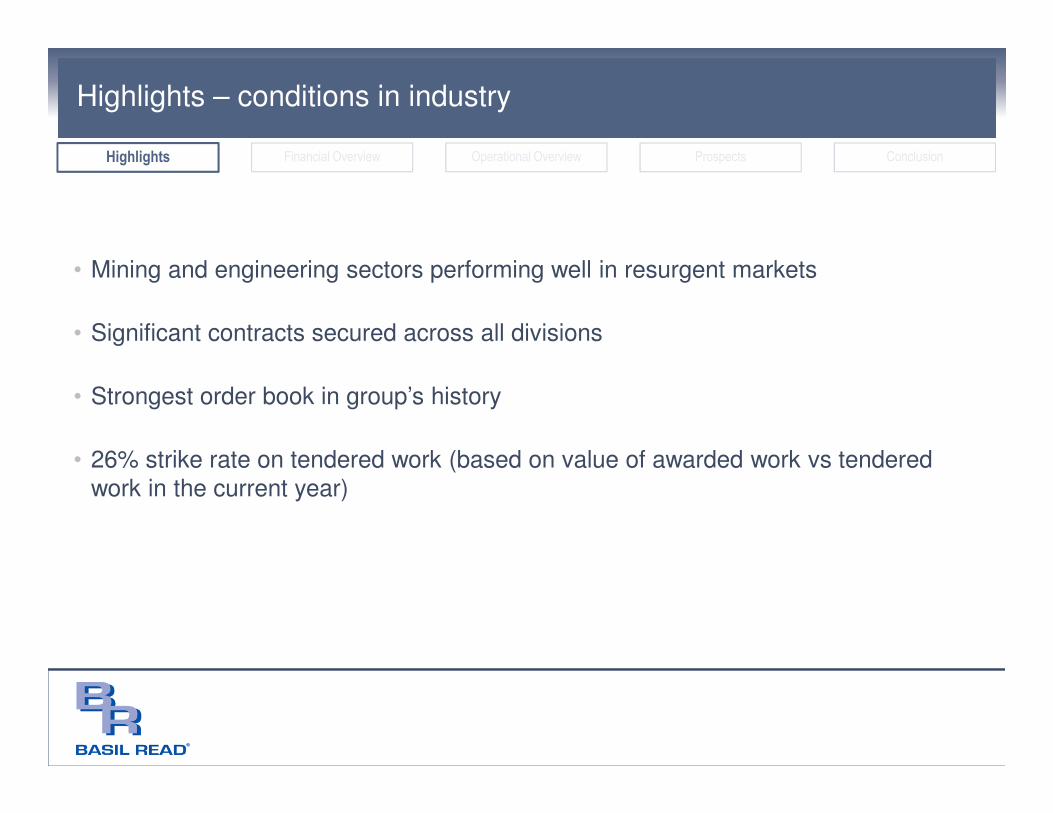
Highlights – conditions in industry
• Mining and engineering sectors performing well in resurgent markets
• Significant contracts secured across all divisions
• Strongest order book in group’s history
• 26% strike rate on tendered work (based on value of awarded work vs tendered
work in the current year)
Highlights Financial Overview Operational Overview Prospects Conclusion
Agenda
Highlights
Financial overview
Operational overview
Prospects
Conclusion
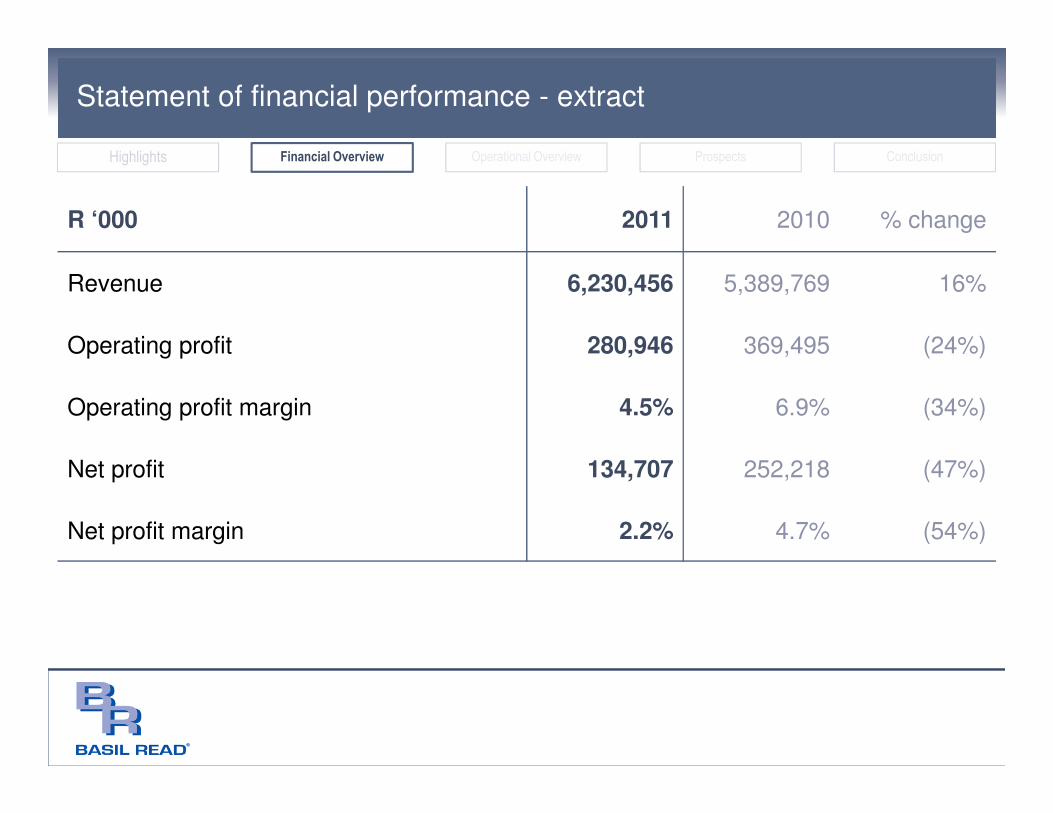
Statement of financial performance - extract
R ‘000 2011 2010 % change
Revenue 6,230,456 5,389,769 16%
Operating profit 280,946 369,495 (24%)
Operating profit margin 4.5% 6.9% (34%)
Net profit 134,707 252,218 (47%)
Net profit margin 2.2% 4.7% (54%)
Highlights Financial Overview Operational Overview Prospects Conclusion
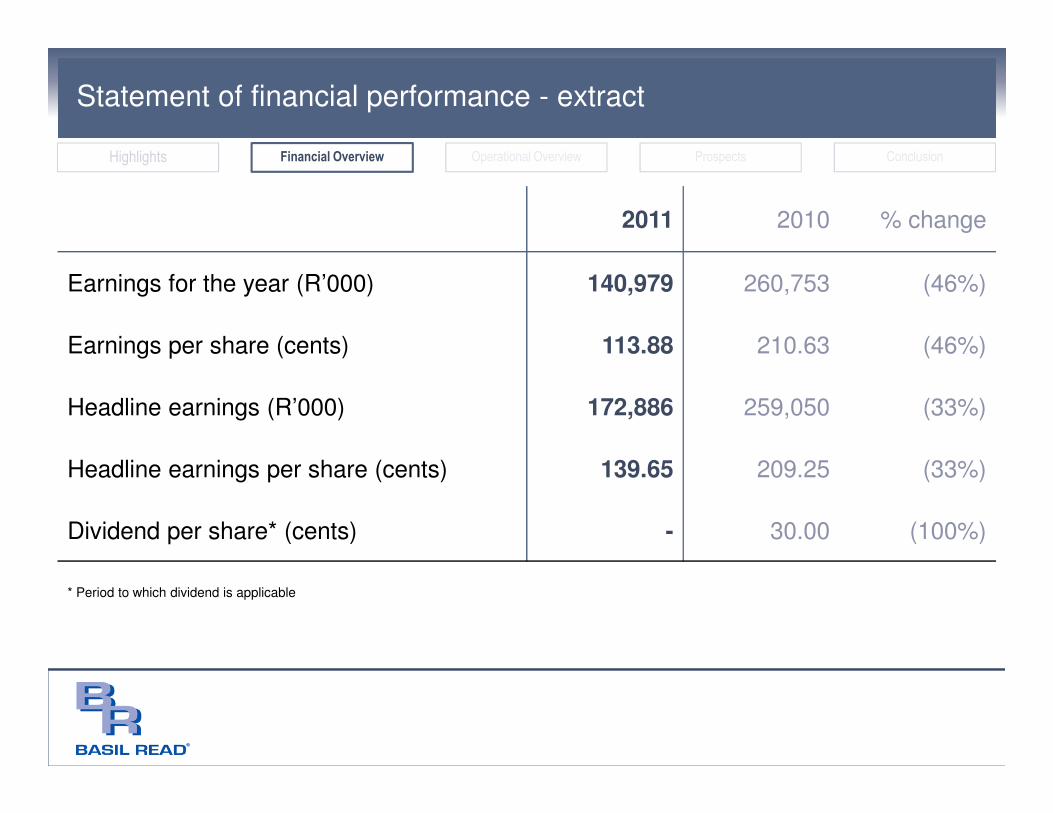
Statement of financial performance - extract
2011 2010 % change
Earnings for the year (R’000) 140,979 260,753 (46%)
Earnings per share (cents) 113.88 210.63 (46%)
Headline earnings (R’000) 172,886 259,050 (33%)
Headline earnings per share (cents) 139.65 209.25 (33%)
Dividend per share* (cents) - 30.00 (100%)
* Period to which dividend is applicable
Highlights Financial Overview Operational Overview Prospects Conclusion
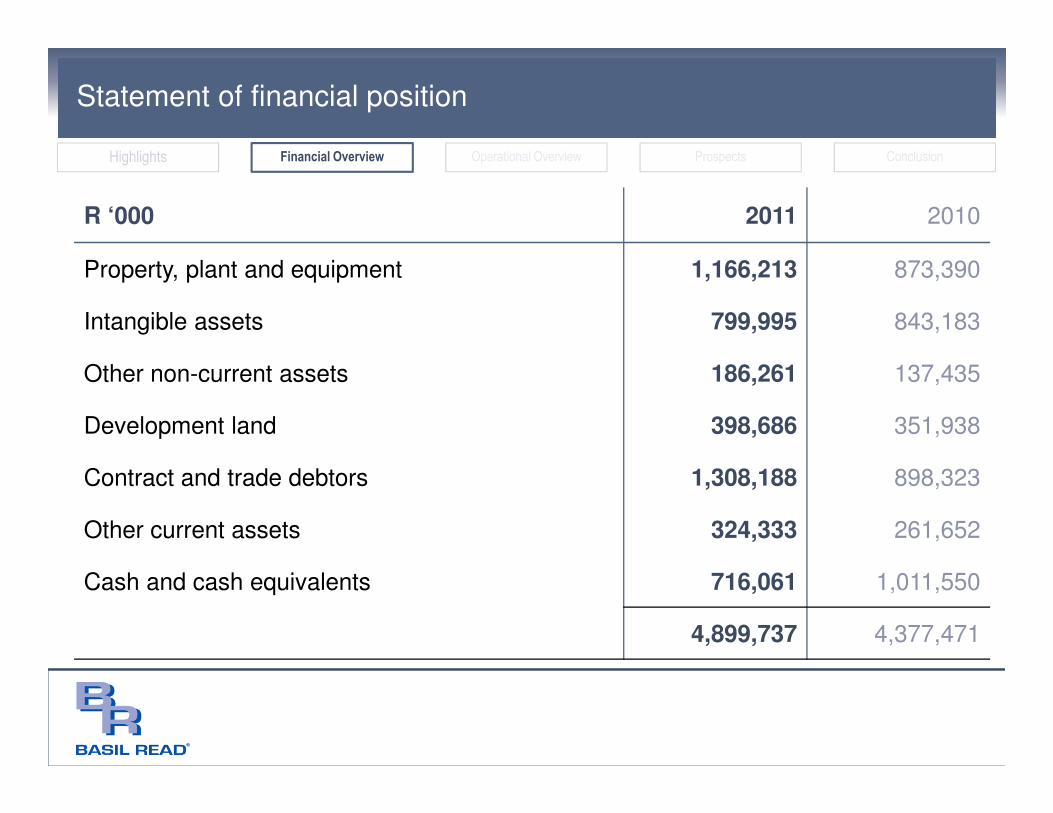
Statement of financial position
R ‘000 2011 2010
Property, plant and equipment 1,166,213 873,390
Intangible assets 799,995 843,183
Other non-current assets 186,261 137,435
Development land 398,686 351,938
Contract and trade debtors 1,308,188 898,323
Other current assets 324,333 261,652
Cash and cash equivalents 716,061 1,011,550
4,899,737 4,377,471
Highlights Financial Overview Operational Overview Prospects Conclusion
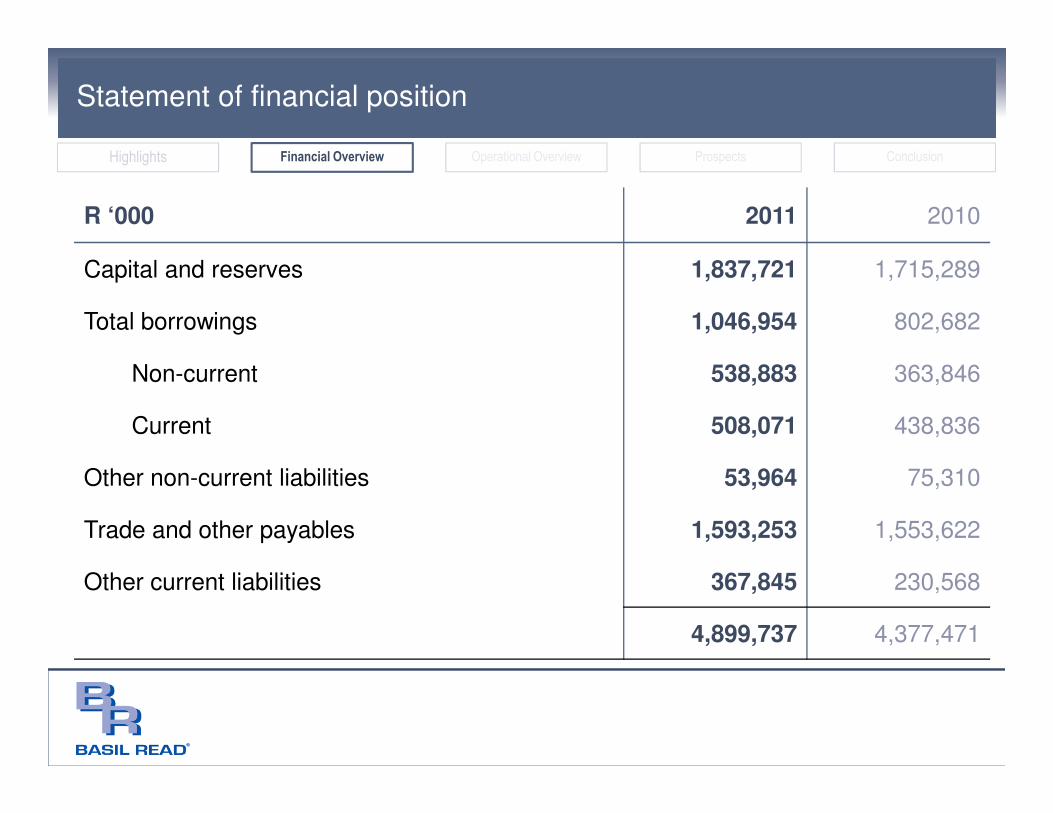
Statement of financial position
R ‘000 2011 2010
Capital and reserves 1,837,721 1,715,289
Total borrowings 1,046,954 802,682
Non-current 538,883 363,846
Current 508,071 438,836
Other non-current liabilities 53,964 75,310
Trade and other payables 1,593,253 1,553,622
Other current liabilities 367,845 230,568
4,899,737 4,377,471
Highlights Financial Overview Operational Overview Prospects Conclusion
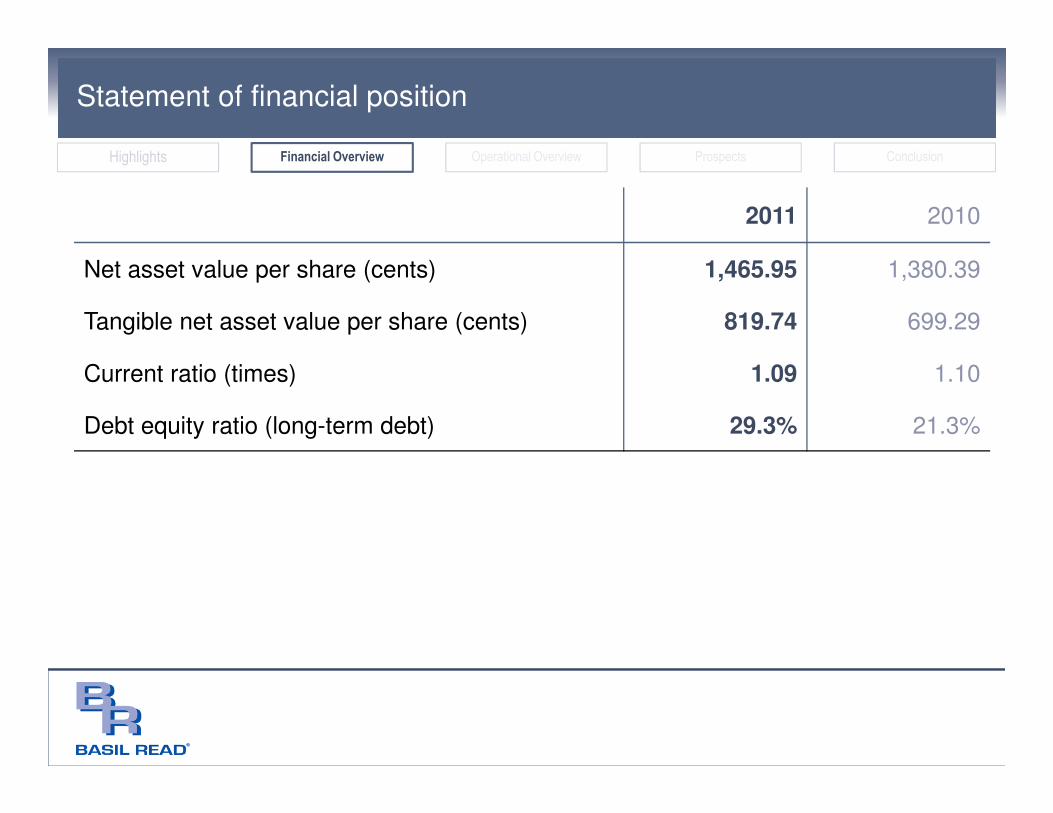
Statement of financial position
2011 2010
Net asset value per share (cents) 1,465.95 1,380.39
Tangible net asset value per share (cents) 819.74 699.29
Current ratio (times) 1.09 1.10
Debt equity ratio (long-term debt) 29.3% 21.3%
Highlights Financial Overview Operational Overview Prospects Conclusion
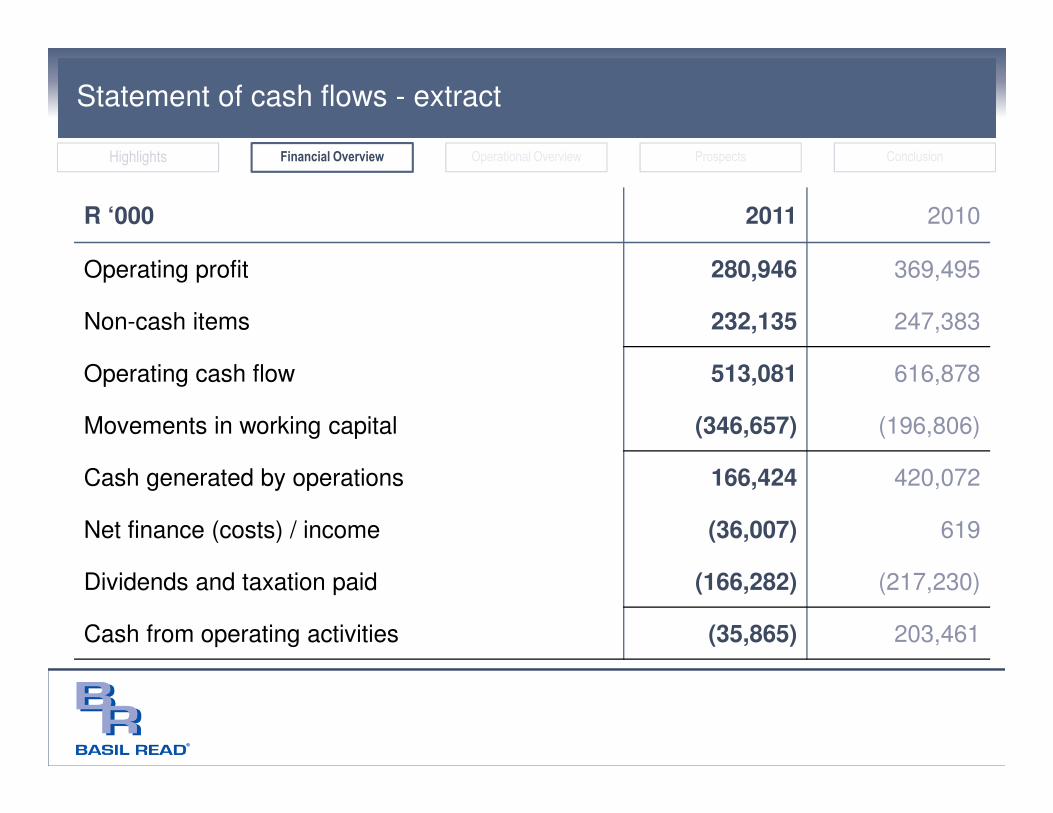
Statement of cash flows - extract
R ‘000 2011 2010
Operating profit 280,946 369,495
Non-cash items 232,135 247,383
Operating cash flow 513,081 616,878
Movements in working capital (346,657) (196,806)
Cash generated by operations 166,424 420,072
Net finance (costs) / income (36,007) 619
Dividends and taxation paid (166,282) (217,230)
Cash from operating activities (35,865) 203,461
Highlights Financial Overview Operational Overview Prospects Conclusion
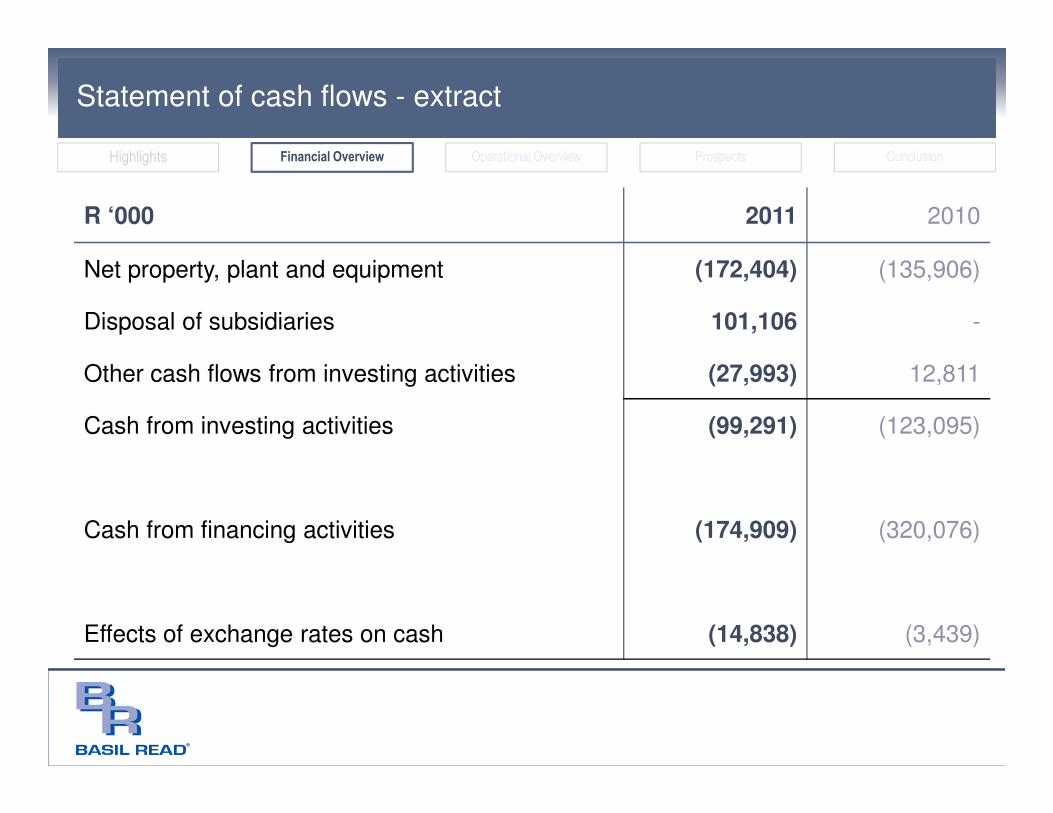
Statement of cash flows - extract
R ‘000 2011 2010
Net property, plant and equipment (172,404) (135,906)
Disposal of subsidiaries 101,106 -
Other cash flows from investing activities (27,993) 12,811
Cash from investing activities (99,291) (123,095)
Cash from financing activities (174,909) (320,076)
Effects of exchange rates on cash (14,838) (3,439)
Highlights Financial Overview Operational Overview Prospects Conclusion
Agenda
Highlights
Financial overview
Operational overview
Prospects
Conclusion
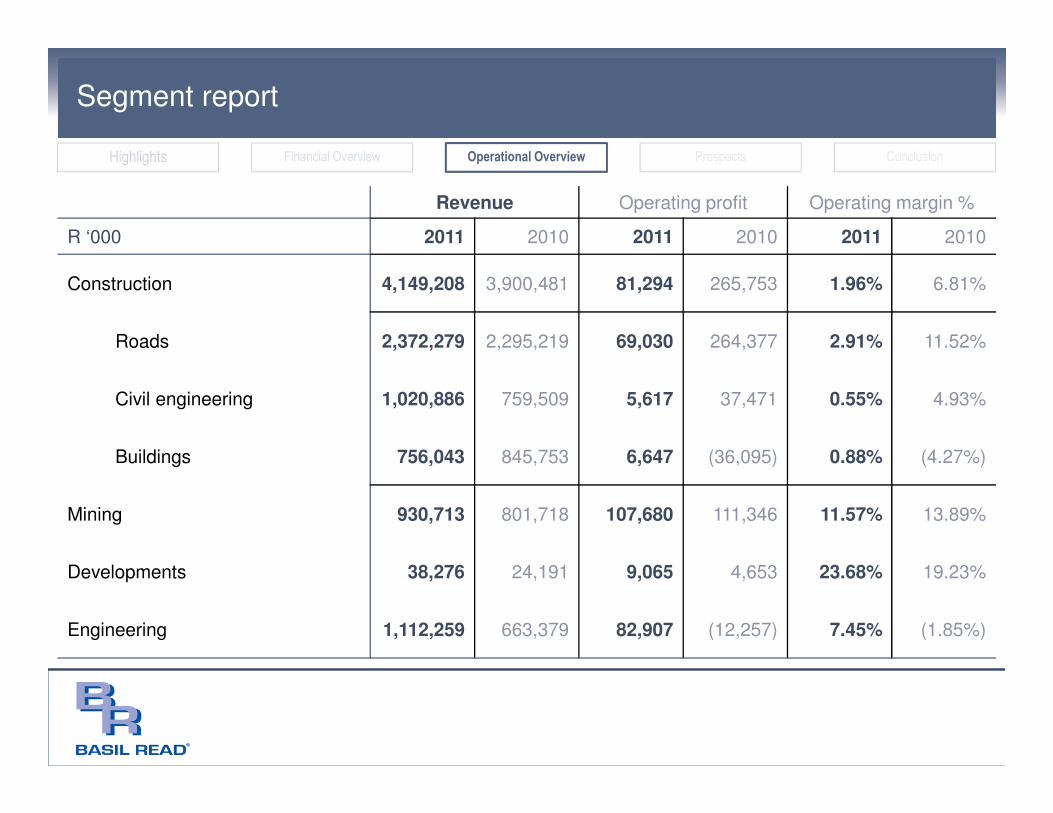
Segment report
Revenue Operating profit Operating margin %
R ‘000 2011 2010 2011 2010 2011 2010
Construction 4,149,208 3,900,481 81,294 265,753 1.96% 6.81%
Roads 2,372,279 2,295,219 69,030 264,377 2.91% 11.52%
Civil engineering 1,020,886 759,509 5,617 37,471 0.55% 4.93%
Buildings 756,043 845,753 6,647 (36,095) 0.88% (4.27%)
Mining 930,713 801,718 107,680 111,346 11.57% 13.89%
Developments 38,276 24,191 9,065 4,653 23.68% 19.23%
Engineering 1,112,259 663,379 82,907 (12,257) 7.45% (1.85%)
Highlights Financial Overview Operational Overview Prospects Conclusion
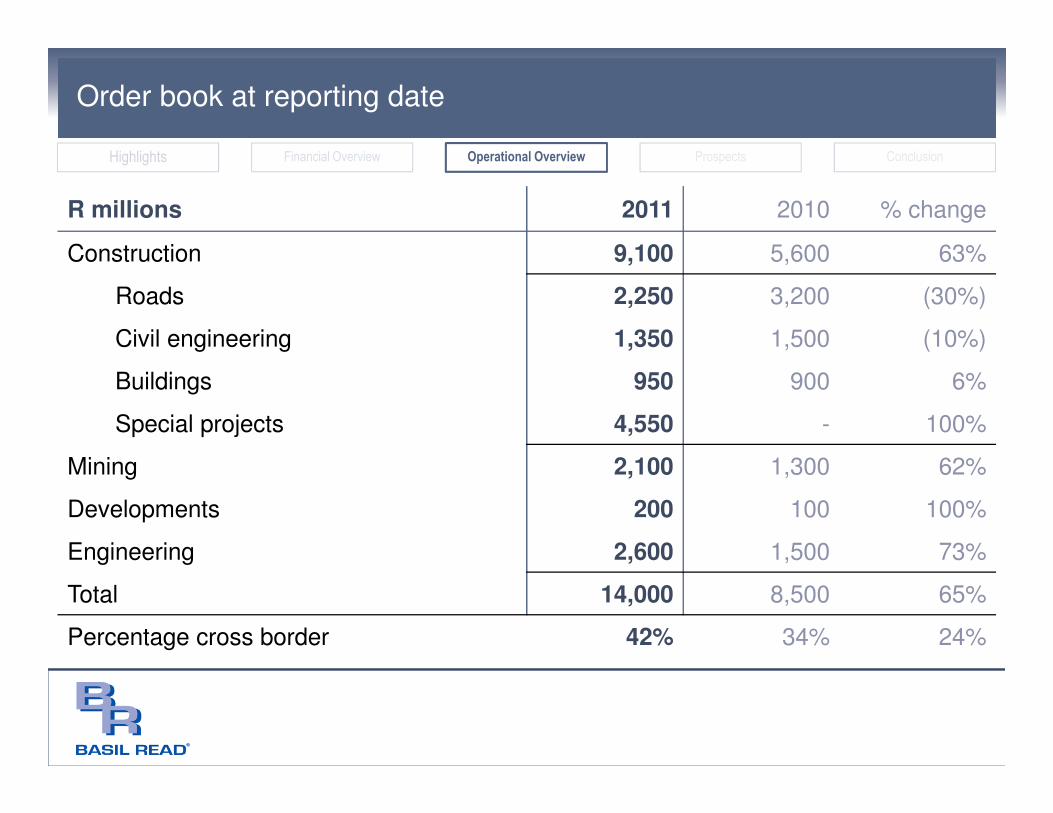
Order book at reporting date
R millions 2011 2010 % change
Construction 9,100 5,600 63%
Roads 2,250 3,200 (30%)
Civil engineering 1,350 1,500 (10%)
Buildings 950 900 6%
Special projects 4,550 - 100%
Mining 2,100 1,300 62%
Developments 200 100 100%
Engineering 2,600 1,500 73%
Total 14,000 8,500 65%
Percentage cross border 42% 34% 24%
Highlights Financial Overview Operational Overview Prospects Conclusion
Construction
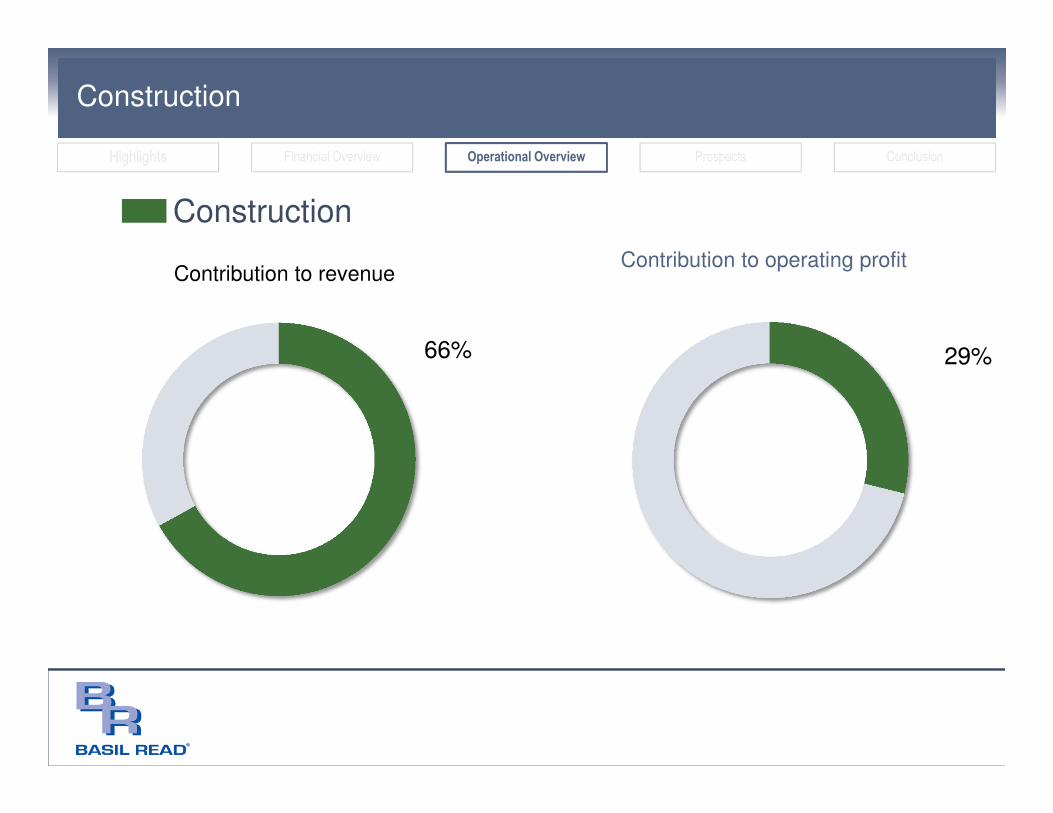
29%
Contribution to operating profit
66%
Contribution to revenue
Construction
Construction
Highlights Financial Overview Operational Overview Prospects Conclusion
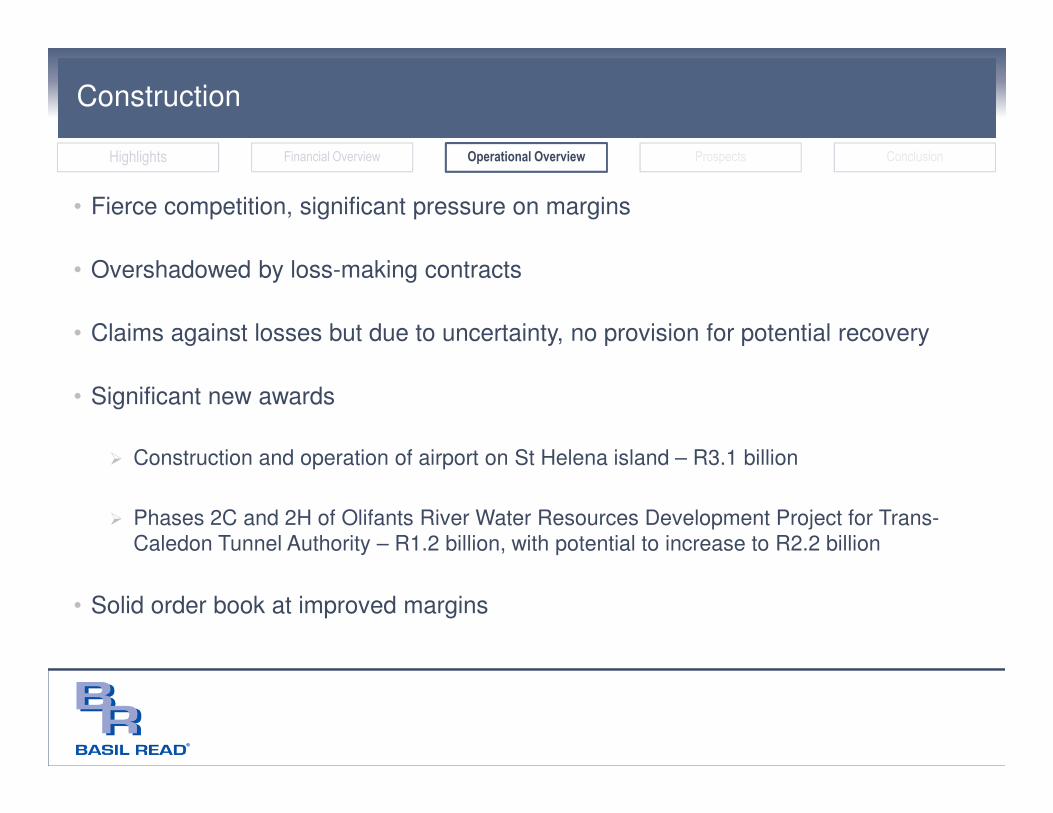
Construction
• Fierce competition, significant pressure on margins
• Overshadowed by loss-making contracts
• Claims against losses but due to uncertainty, no provision for potential recovery
• Significant new awards
� Construction and operation of airport on St Helena island – R3.1 billion
� Phases 2C and 2H of Olifants River Water Resources Development Project for Trans-
Caledon Tunnel Authority – R1.2 billion, with potential to increase to R2.2 billion
• Solid order book at improved margins
Highlights Financial Overview Operational Overview Prospects Conclusion
Mining
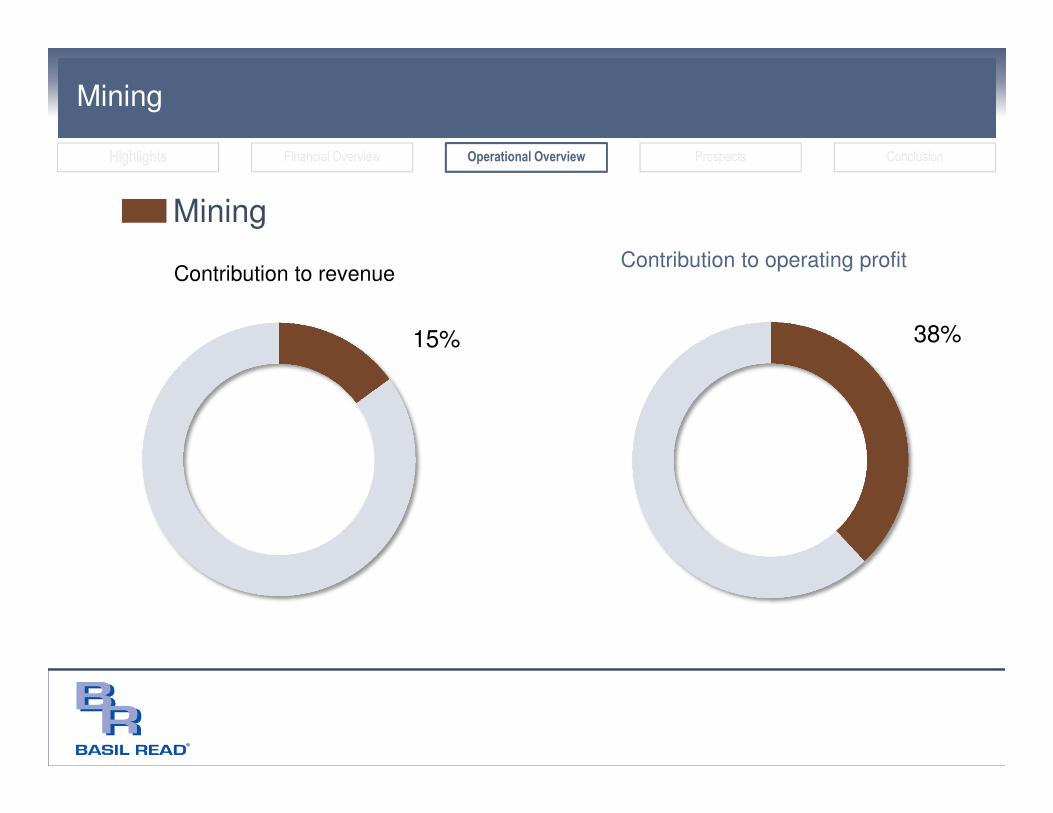
38%
Contribution to operating profit
15%
Contribution to revenue
Mining
Mining
Highlights Financial Overview Operational Overview Prospects Conclusion
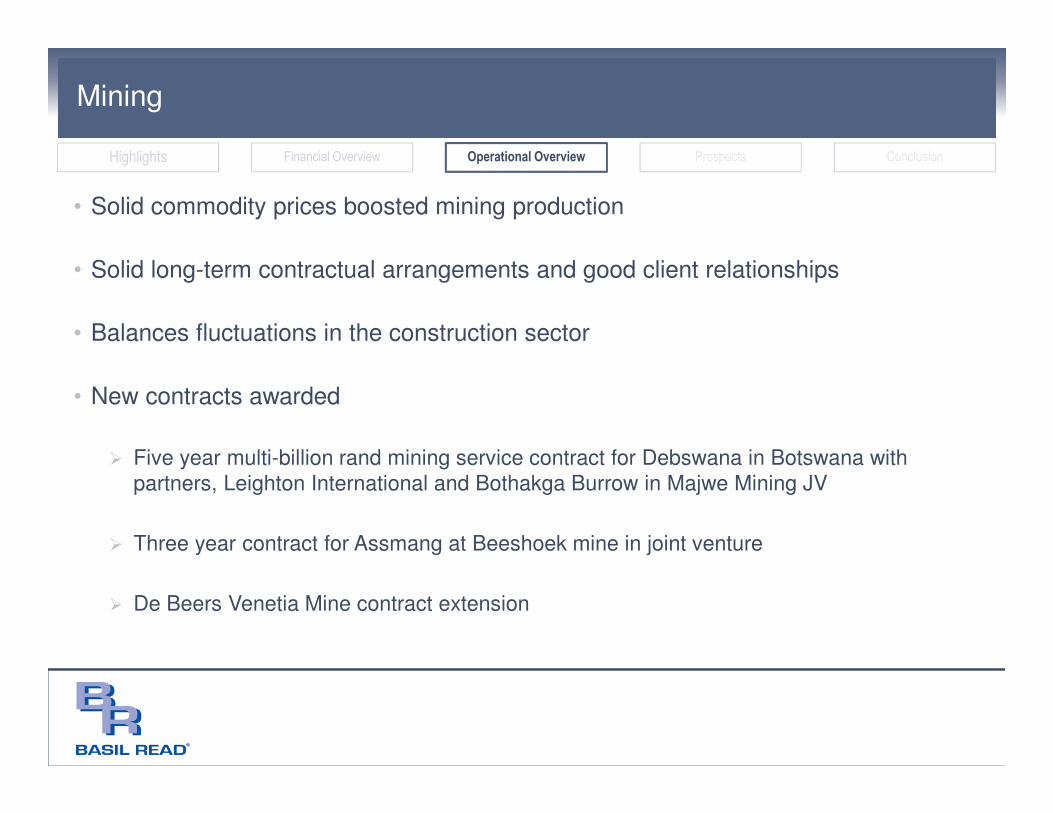
Mining
• Solid commodity prices boosted mining production
• Solid long-term contractual arrangements and good client relationships
• Balances fluctuations in the construction sector
• New contracts awarded
� Five year multi-billion rand mining service contract for Debswana in Botswana with
partners, Leighton International and Bothakga Burrow in Majwe Mining JV
� Three year contract for Assmang at Beeshoek mine in joint venture
� De Beers Venetia Mine contract extension
Highlights Financial Overview Operational Overview Prospects Conclusion
Developments
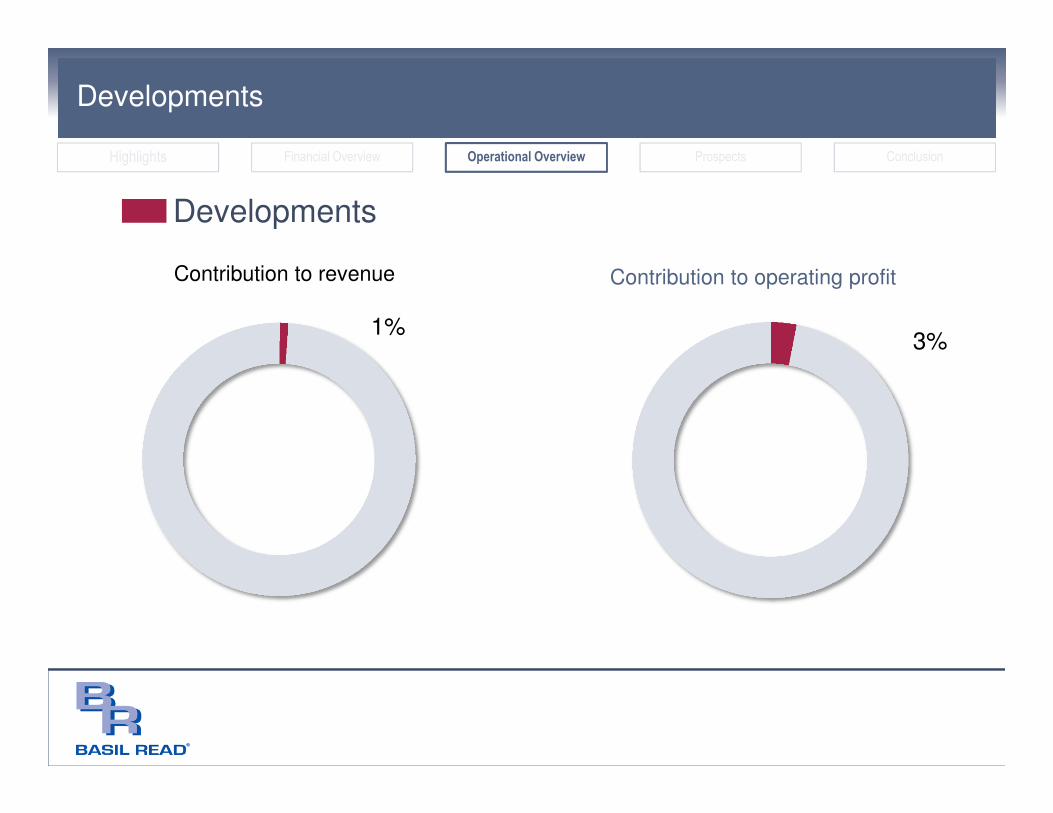
3%
Contribution to operating profit
1%
Contribution to revenue
Developments
Developments
Highlights Financial Overview Operational Overview Prospects Conclusion
Developments
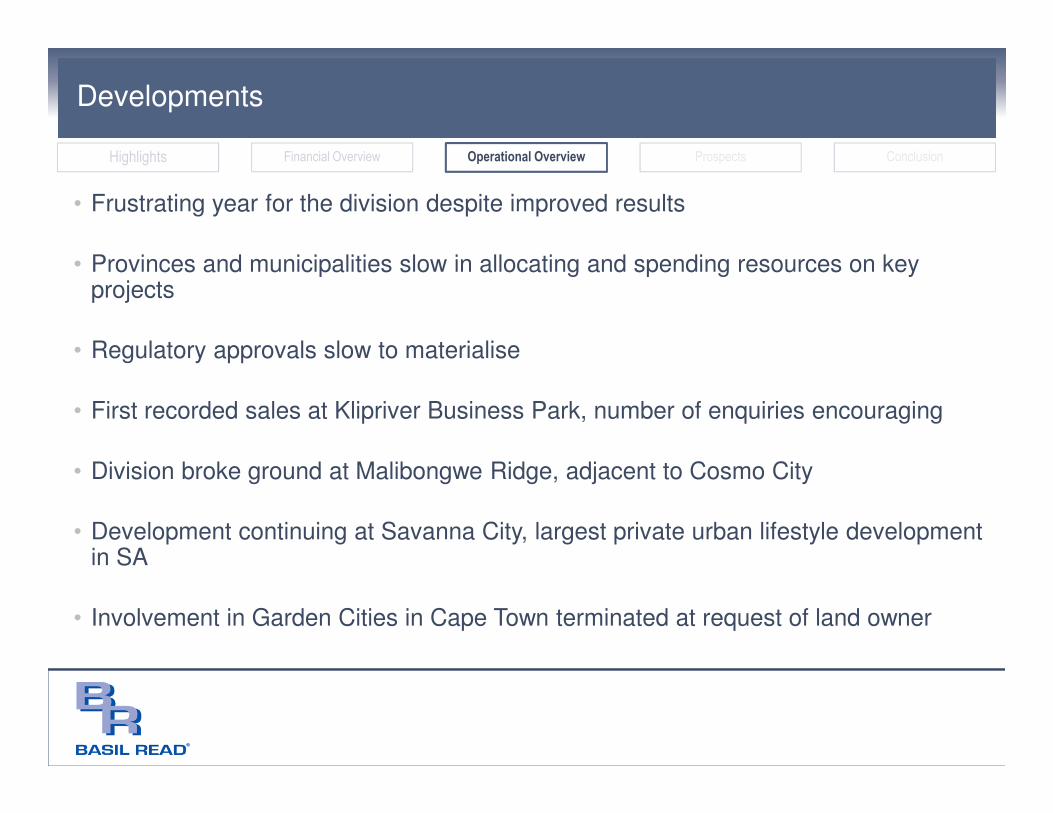
• Frustrating year for the division despite improved results
• Provinces and municipalities slow in allocating and spending resources on key projects
• Regulatory approvals slow to materialise
• First recorded sales at Klipriver Business Park, number of enquiries encouraging
• Division broke ground at Malibongwe Ridge, adjacent to Cosmo City
• Development continuing at Savanna City, largest private urban lifestyle development in SA
• Involvement in Garden Cities in Cape Town terminated at request of land owner
Highlights Financial Overview Operational Overview Prospects Conclusion
Engineering
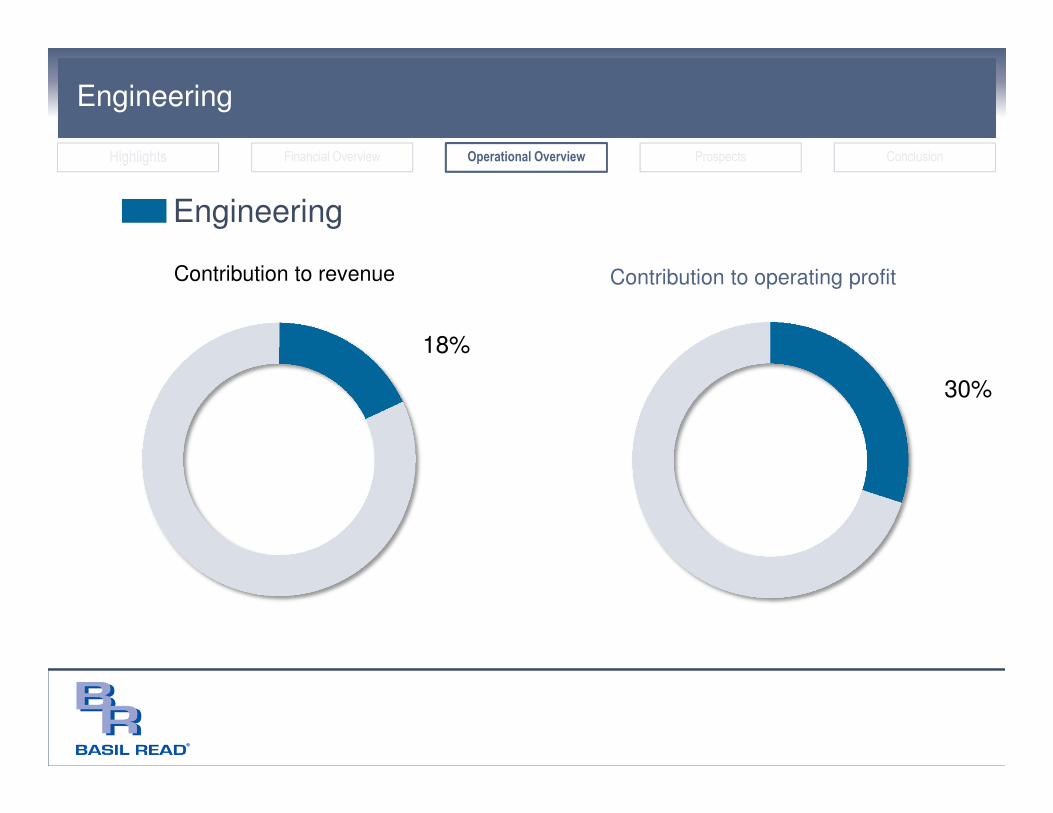
30%
Contribution to operating profit
18%
Contribution to revenue
Engineering
Engineering
Highlights Financial Overview Operational Overview Prospects Conclusion
Engineering
• After slow start, workload ramped up significantly in most TWP companies
• Performance for the year surpassed expectations
• Total staff complement exceeds 1,200 engineering professionals
• International operations performing well
� Peru office recorded a profit in first full year of operation
� 50% of TWP Australia sold to WSP (Pty) Limited, one of world’s largest design,
engineering, environment and energy consultancies; returns to profitability
• Further growth required as projects move from feasibility stage to project execution
Highlights Financial Overview Operational Overview Prospects Conclusion

Agenda
Highlights
Financial overview
Operational overview
Prospects
Conclusion
Prospects
• State of the Nation address affirms government’s commitment to infrastructural
spend
• Group remains cautious given delays in project roll out in recent years
• Operating performances likely to be affected by high cost increases and continued
competition
• Retention of skills and maintaining of capacity key
• Real recovery in construction sector expected from 2013 onwards
• Key projects anchor business
Highlights Financial Overview Operational Overview Prospects Conclusion
Prospects
• Mining industry should remain buoyant through 2012
• Demand outstripping supply in most commodities
• Many projects need to be executed to replace mining output, let alone increase it
• Chosen geographies of South America, Africa and Australasia expected to perform
well
• Infrastructure development related to mining activity expected to be significant
Highlights Financial Overview Operational Overview Prospects Conclusion
Prospects
• Group investing in energy sector
• Acquisition of 35% of Metrowind (Pty) Limited
� Provider of alternative energy sources
� Announced as preferred bidder for supply of alternate energy by Department of Energy
� Developing wind farm in Nelson Mandela Bay Metropolitan which should realise R450
million EPC contract for the group
• Bid submitted for solar project in Beaufort West in terms of Renewable Energy
Feed-in Tariff (Refit) phase two (26% equity investment); should realise a R1.5
billion EPC contract for the group
Highlights Financial Overview Operational Overview Prospects Conclusion
Prospects
• Investigating options to mitigate risk of holding specialised plant needed for mining
operations
• Expansion of Australian and South American mining and infrastructure markets
• Exploring other developing economies in Africa
Highlights Financial Overview Operational Overview Prospects Conclusion
Prospects
• R18 billion project pipeline for the group
� Includes rail, roads, toll roads and infrastructure projects
� Infrastructure / township planning projects
� Renewable energy projects
� Additional St Helena Island infrastructure work
� Iron ore, coal, manganese and diamond mining prospects
• Capital value of TWP projects from pre-feasibility to execution – R140 billion over 10
years
Highlights Financial Overview Operational Overview Prospects Conclusion
Agenda
Highlights
Financial overview
Operational overview
Prospects
Conclusion
Conclusion
• Satisfactory results in difficult trading conditions
• Strong order book of R14 billion at reporting date
• Key in current year is effective management of working capital
• Containment of costs a focus area
• Core skills have been retained and capacity maintained
• Poised for recovery in construction sector, expected from 2013
Highlights Financial Overview Operational Overview Prospects Conclusion

Questions