Embed Size (px)
Citation preview

BASICS: USING THE TI-83 CALCULATOR KENKEL NOTES: LINK FOR VARIOUS TI CALCULATOR HANDBOOKS: http://education.ti.com/educationportal/appsdelivery/download/ download_select_product.jsp?cid=us&displaymode=G&contentpaneid=17 TURN THE CALCULATOR ON1. Press ON TURN THE CALCULATOR OFF1. Press 2ND 2. Press OFF ((OFF is above the ON key) TO ADJUST THE CONTRAST When you turn on the calculator, you may get a blank screen. Probably, you need to adjust the screen contrast. Otherwise, get new batteries. 1. Press 2ND 2. Press up arrow to DARKEN, down arrow to BRIGHTEN HOW THE KEYS WORK1. Each key has an option on its face. To select this option, just press the key 2. Each key has a second option listed above the key on the left. To select this option, press 2ND, then press the key. 3. Each key has a third option listed above the key on the right. To select this option, press the ALPHA key, then press the key. MOVING AROUND ON A SCREEN Frequently, after pressing a key, a menu of numbered options will appear on the screen. You can move the cursor onto a desired choice by using the UP, DOWN, RIGHT, or LEFT arrows. SELECTING OPTIONS Frequently, after pressing a key, a menu of numbered options will appear on the screen. There are two ways to select your choice: 1. Type the number of your choice OR 2. Move the cursor onto the desired option and press ENTER TO CLEAR THE SCREEN Press CLEAR (You may need to press CLEAR several times.)
CHAPTER 4: DESCRIPTIVE STATISTICS HOW TO ENTER DATA INTO THE STAT EDITOR The STAT editor is BY FAR the most useful tool for saving time when solving statistics problems. First, we need to learn how to enter data into the STAT editor. Then, we can let the calculator do all the tedious calculations that are required in statistics. Suppose we want to enter the following five values of X into the STAT editor: X 25 10 20 15 5 1. Press the STAT key
The screen shows a list of options, and the cursor always highlights option1: Edit. (This is the default, so the cursor will always start here.) Whenever you want to see the data in the editor or put new data into the editor, select the 1: Edit option.
2. Press ENTER
Now the STAT editor appears showing three columns with headings L1, L2, and L3. There are actually six columns for data. By moving the cursor to the right, you can verify this.
We want to enter the values of variable X into column L1. (You can put the data into any of the six columns if you wish, but L1 is the default column.).
If your screen shows that you already have some values typed into column L1, you need to delete them. To do this, move the cursor onto the L1 symbol at the top of the column and press CLEAR. Then press ENTER. Now the L1 column should be blank.
Now we are ready to enter the five values listed above. The cursor will be in the first position in column L1.
3. Type 25 and press ENTER (The value 25 now appears in the first position and the cursor moves to the second position in column L1. Type each remaining value followed by ENTER. Thus, you should type the following
10 ENTER 20 ENTER 15 ENTER 5 ENTER
This completes the entry of the five values into column L1 TO EXIT THE STAT EDITOR
Suppose you want to exit the STAT editor and get back to the regular calculator.
1. Press 2ND 2. Press QUIT. (The option QUIT is located above the “MODE“ key.)
Whenever you exit the STAT editor, all the data will remain in the same column as when you exited, (even if you turn off the calculator).
TO CORRECT TYPING ERRORS IN THE STAT EDITOR 1. To REPLACE an incorrect value, move the cursor onto the incorrect value, retype the correct value, and press ENTER 2. To DELETE an unwanted number, move the cursor onto the unwanted number and press DEL 3. To INSERT an additional number into the middle of a list, move the cursor onto the desired place in the list Press 2ND Press INS
The value 0 will now appear in the desired location in the list. Type the number to be inserted and press ENTER
EASIEST METHOD OF DELETING DATA FROM ONE COLUMN IN THE STAT EDITOR There are several ways to clear data in the STAT editor. The following is the easiest and fastest method. Suppose you want to delete the data that are in any column, say column L2. 1. Press STAT
Cursor will highlight EDIT 2. Press ENTER 3. Move the cursor onto the name L2 at the top of column L2 4. Press CLEAR 5. Press ENTER
The data in column L2 are now deleted.
FASTEST WAY TO DELETE ALL DATA FROM THE STAT EDITOR 1. Press 2ND 2. Press MEM (The MEM key is above the “+” key.) The screen now shows a list of options. 2. Move the arrow onto option 4: ClrAllLists
OR. Alternatively, type the number 4 to select the desired option 3. Press ENTER The screen shows ClrAllLists 4. Press ENTER The screen now shows Done
All the data in all the columns in the STAT editor have been deleted. ALTERNATIVE METHOD OF DELETING DATA FROM ONE COLUMN (SAY, COLUMN L2) 1. Press STAT 2. Move cursor onto option 4: CLRLST 3. Press ENTER 4. Press 2ND L2 (L2 is above the “2” key) 5. Press ENTER
The data in column L2 are now deleted
CHAPTER 4: DESCRIPTIVE STATISTICS CALCULATE THE MEAN, STANDARD DEVIATION, MEDIAN, ETC. USING THE STAT EDITOR 1. Insert the values 25, 10, 20, 15, and 5 into column L1 in the STAT editor. After entering the data, the screen should look like this: L1 L2 L3 25 10 20 15 5 To calculate the mean and standard deviation of the X values, proceed as follows: 1. Press STAT 2. Move the cursor onto option CALC The screen shows a list of options 3. Move cursor onto option 1: 1-Var Stats 4. Press ENTER
Now the screen shows: 1-Var Stats 4. Press 2ND L1 (L1 is above the “1” key) 5. Press ENTER
This tells the calculator to calculate various descriptive statistics using the values located in column L1 (which is the default column).
SHORTCUT METHOD WHEN THE DATA ARE IN COLUMN L1 (Column L1 is the default column. Whenever your data are in L1, you can omit step 4 above and still get the same results. When calculating descriptive statistics, the calculator will always use the data in column L1 unless instructed otherwise. If the data you want to analyze are in, say, column L2, then replace step (4) by 4. Press 2ND L2 5. Press ENTER
Similarly, if the data values were in column L3, you’d press 2ND L3 and then press ENTER
Now, some of the results appear on the screen Xbar = 15; sumX = 75; sumX2 = 1375; Sx = 7.90569415; sigmaX = 7.071067812 To see more results, use the down arrow to observe minX = 5, Q1 = 7.5; med = 15; Q3 = 22.5; maxX=25
Note that the calculator found the median even though you did not sort the data into order. Also note that the calculator does not know if you have a sample or a population of data. Thus, the calculator provides both a population and a sample standard deviation. It is your job to determine which value is appropriate.
SORTING DATA INTO ASCENDING ORDER In order to calculate percentiles, the researcher needs to put the data into ascending order from lowest to highest. Here’s how to do this. 1. Insert your data into the STAT editor as described previously. Put your data into L1. After the data are in column L1, proceed as follows: 2. Press STAT A screen appears showing a list of options. 3. Move cursor onto option 2: SortA( 4. Press ENTER
Now the screen shows 2: SortA( 5. Press 2ND L1) (The closing parenthesis is optional and can be skipped)
This tells the calculator to sort the data that are in column L1. 6. Press ENTER Now the data in L1 are rearranged, lowest to highest. To see the data, press STAT and then press ENTER
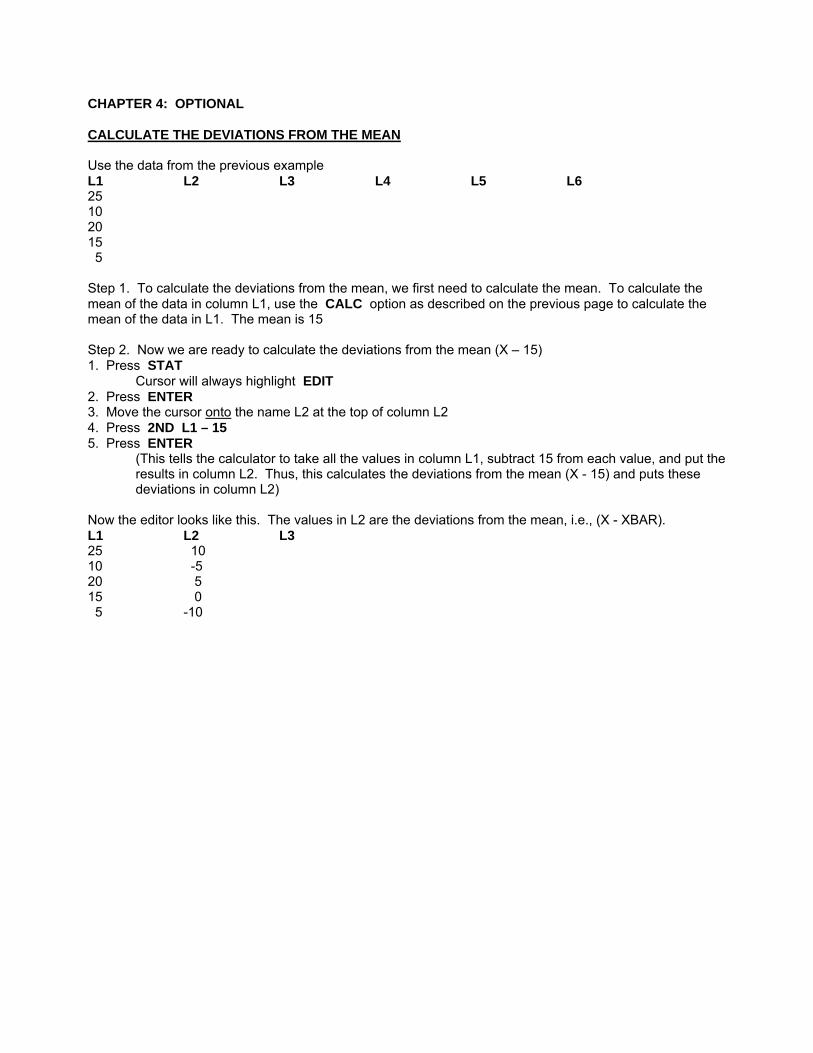
CHAPTER 4: OPTIONAL CALCULATE THE DEVIATIONS FROM THE MEAN Use the data from the previous example L1 L2 L3 L4 L5 L6 25 10 20 15 5 Step 1. To calculate the deviations from the mean, we first need to calculate the mean. To calculate the mean of the data in column L1, use the CALC option as described on the previous page to calculate the mean of the data in L1. The mean is 15 Step 2. Now we are ready to calculate the deviations from the mean (X – 15) 1. Press STAT
Cursor will always highlight EDIT 2. Press ENTER 3. Move the cursor onto the name L2 at the top of column L2 4. Press 2ND L1 – 15 5. Press ENTER
(This tells the calculator to take all the values in column L1, subtract 15 from each value, and put the results in column L2. Thus, this calculates the deviations from the mean (X - 15) and puts these deviations in column L2)
Now the editor looks like this. The values in L2 are the deviations from the mean, i.e., (X - XBAR). L1 L2 L3 25 10 10 -5 20 5 15 0 5 -10
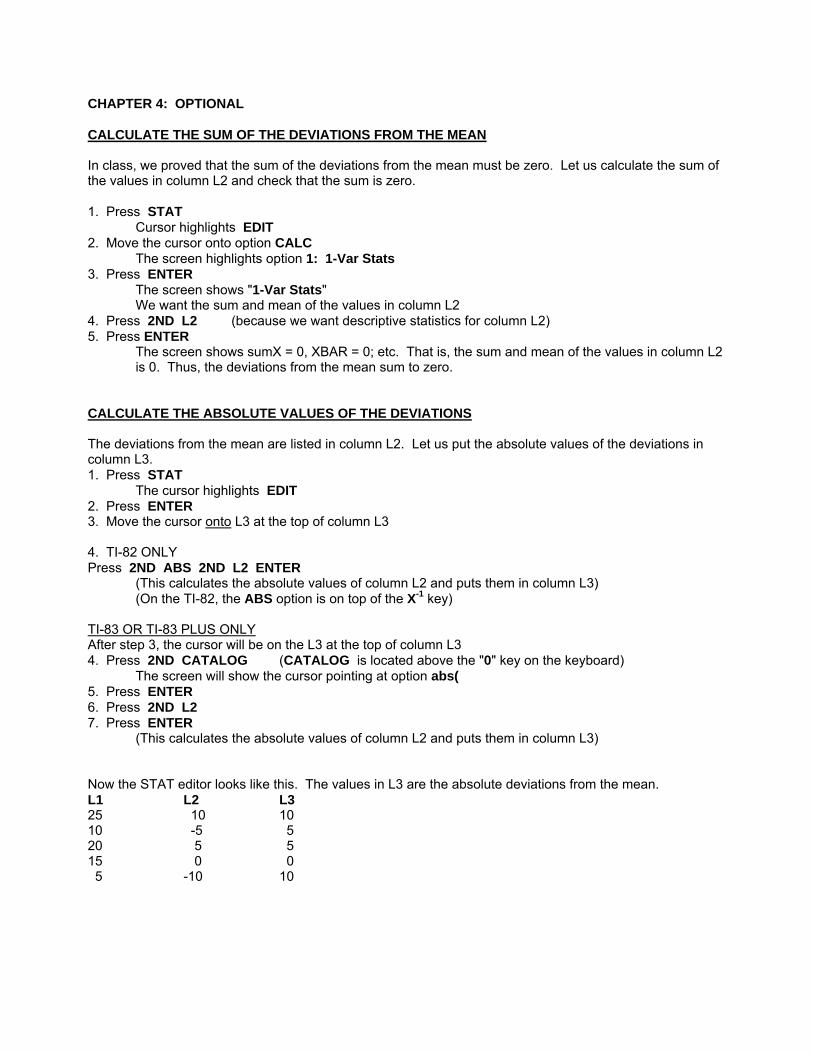
CHAPTER 4: OPTIONAL CALCULATE THE SUM OF THE DEVIATIONS FROM THE MEAN In class, we proved that the sum of the deviations from the mean must be zero. Let us calculate the sum of the values in column L2 and check that the sum is zero. 1. Press STAT
Cursor highlights EDIT 2. Move the cursor onto option CALC
The screen highlights option 1: 1-Var Stats 3. Press ENTER
The screen shows "1-Var Stats" We want the sum and mean of the values in column L2
4. Press 2ND L2 (because we want descriptive statistics for column L2) 5. Press ENTER
The screen shows sumX = 0, XBAR = 0; etc. That is, the sum and mean of the values in column L2 is 0. Thus, the deviations from the mean sum to zero.
CALCULATE THE ABSOLUTE VALUES OF THE DEVIATIONS The deviations from the mean are listed in column L2. Let us put the absolute values of the deviations in column L3. 1. Press STAT
The cursor highlights EDIT 2. Press ENTER 3. Move the cursor onto L3 at the top of column L3 4. TI-82 ONLY Press 2ND ABS 2ND L2 ENTER
(This calculates the absolute values of column L2 and puts them in column L3) (On the TI-82, the ABS option is on top of the X-1 key)
TI-83 OR TI-83 PLUS ONLY After step 3, the cursor will be on the L3 at the top of column L3 4. Press 2ND CATALOG (CATALOG is located above the "0" key on the keyboard)
The screen will show the cursor pointing at option abs( 5. Press ENTER 6. Press 2ND L2 7. Press ENTER
(This calculates the absolute values of column L2 and puts them in column L3) Now the STAT editor looks like this. The values in L3 are the absolute deviations from the mean. L1 L2 L3 25 10 10 10 -5 5 20 5 5 15 0 0 5 -10 10
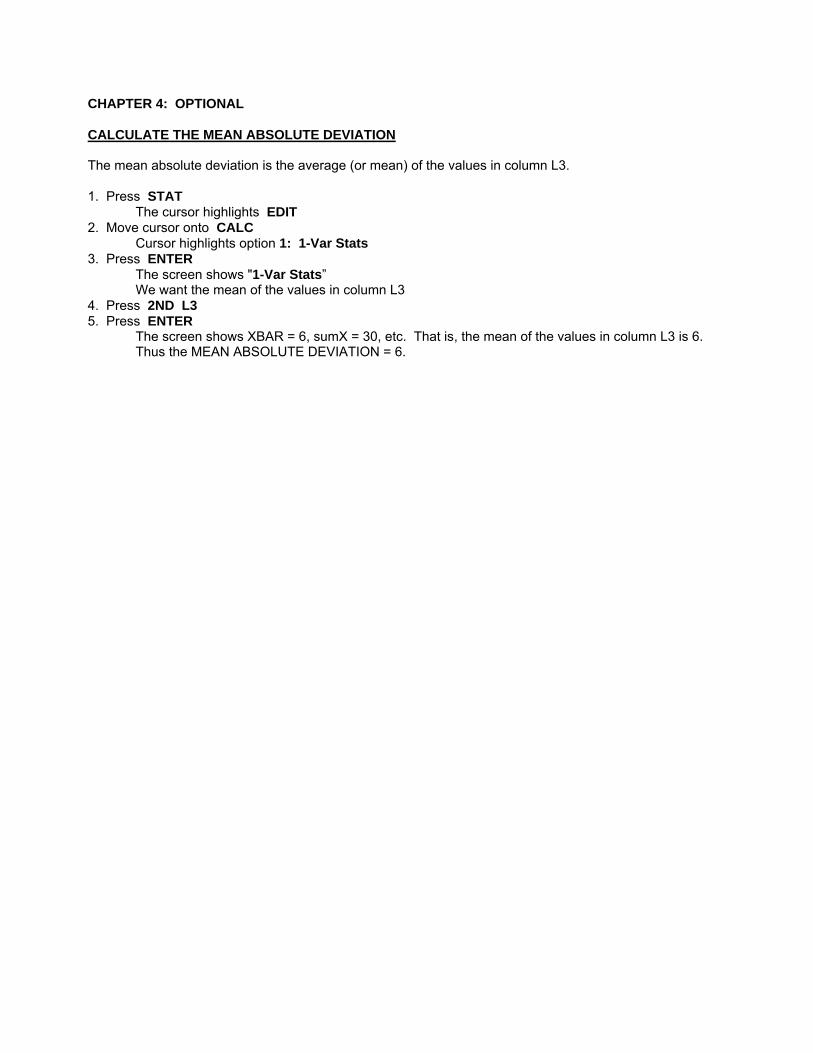
CHAPTER 4: OPTIONAL CALCULATE THE MEAN ABSOLUTE DEVIATION The mean absolute deviation is the average (or mean) of the values in column L3. 1. Press STAT
The cursor highlights EDIT 2. Move cursor onto CALC
Cursor highlights option 1: 1-Var Stats 3. Press ENTER
The screen shows "1-Var Stats” We want the mean of the values in column L3
4. Press 2ND L3 5. Press ENTER
The screen shows XBAR = 6, sumX = 30, etc. That is, the mean of the values in column L3 is 6. Thus the MEAN ABSOLUTE DEVIATION = 6.

CHAPTER 4: OPTIONAL CREATE A HISTOGRAM1. Enter a column of data in column L1 of the STAT editor. 2. Press WINDOW The screen now shows a list of values that need to be set 3. Xmin is the lower bound of your histogram Type a value and press ENTER 4. Xmax is the upper bound of your histogram Type a value qand press ENTER 5. Xscl is the desired width of each class interval Type a value and press ENTER 6. Ymin is the lower bound for a class frequency Type 0 and press ENTER 7. Ymax is the highest frequency that will be shown on the graph Type a value and press ENTER 8. Press 2ND STATPLOT STATPLOT is above the “Y=“ key The screen now shows a list of options that need to be chosen Put the cursor on Plot 1 and Press ENTER Put the cursor on option On and press ENTER Put the cursor onto the third figure which is the Histogram symbol and press ENTER Make sure Xlist is L1 and Freq is 1 8. Press GRAPH A histogram now appears on the screen.
If you do not like the appearance of the histogram, go back to the WINDOW option and change the values for Xscl and or Ymax. Then press GRAPH again to see the new histogram.
9. To determine the number of data values in each class, press the TRACE key. Move the cursor to the right or left with the arrow key to see the class frequency for any class. As you move the cursor, the screen will list the lower and upper bound for each class and the class frequency for each class.
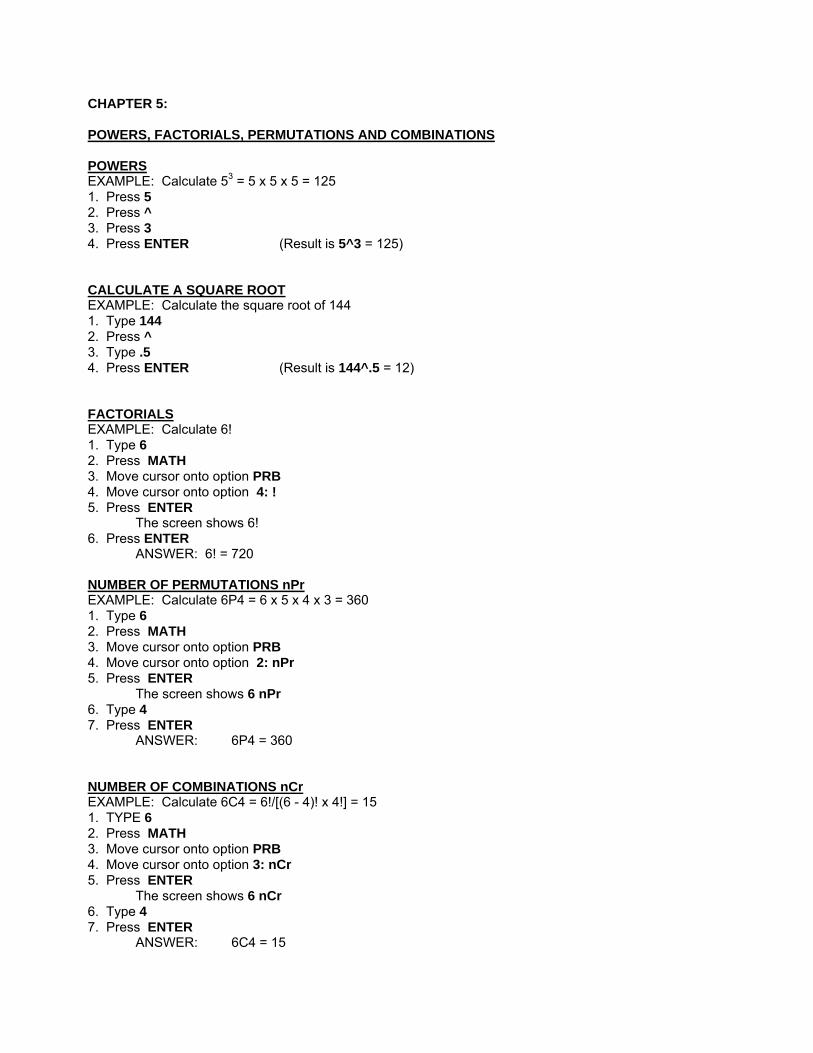
CHAPTER 5: POWERS, FACTORIALS, PERMUTATIONS AND COMBINATIONS POWERS EXAMPLE: Calculate 53 = 5 x 5 x 5 = 125 1. Press 5 2. Press ^ 3. Press 3 4. Press ENTER (Result is 5^3 = 125) CALCULATE A SQUARE ROOT EXAMPLE: Calculate the square root of 144 1. Type 144 2. Press ^ 3. Type .5 4. Press ENTER (Result is 144^.5 = 12) FACTORIALS EXAMPLE: Calculate 6! 1. Type 6 2. Press MATH 3. Move cursor onto option PRB 4. Move cursor onto option 4: ! 5. Press ENTER The screen shows 6! 6. Press ENTER ANSWER: 6! = 720 NUMBER OF PERMUTATIONS nPr EXAMPLE: Calculate 6P4 = 6 x 5 x 4 x 3 = 360 1. Type 6 2. Press MATH 3. Move cursor onto option PRB 4. Move cursor onto option 2: nPr 5. Press ENTER The screen shows 6 nPr 6. Type 4 7. Press ENTER ANSWER: 6P4 = 360 NUMBER OF COMBINATIONS nCr EXAMPLE: Calculate 6C4 = 6!/[(6 - 4)! x 4!] = 15 1. TYPE 6 2. Press MATH 3. Move cursor onto option PRB 4. Move cursor onto option 3: nCr 5. Press ENTER The screen shows 6 nCr 6. Type 4 7. Press ENTER ANSWER: 6C4 = 15
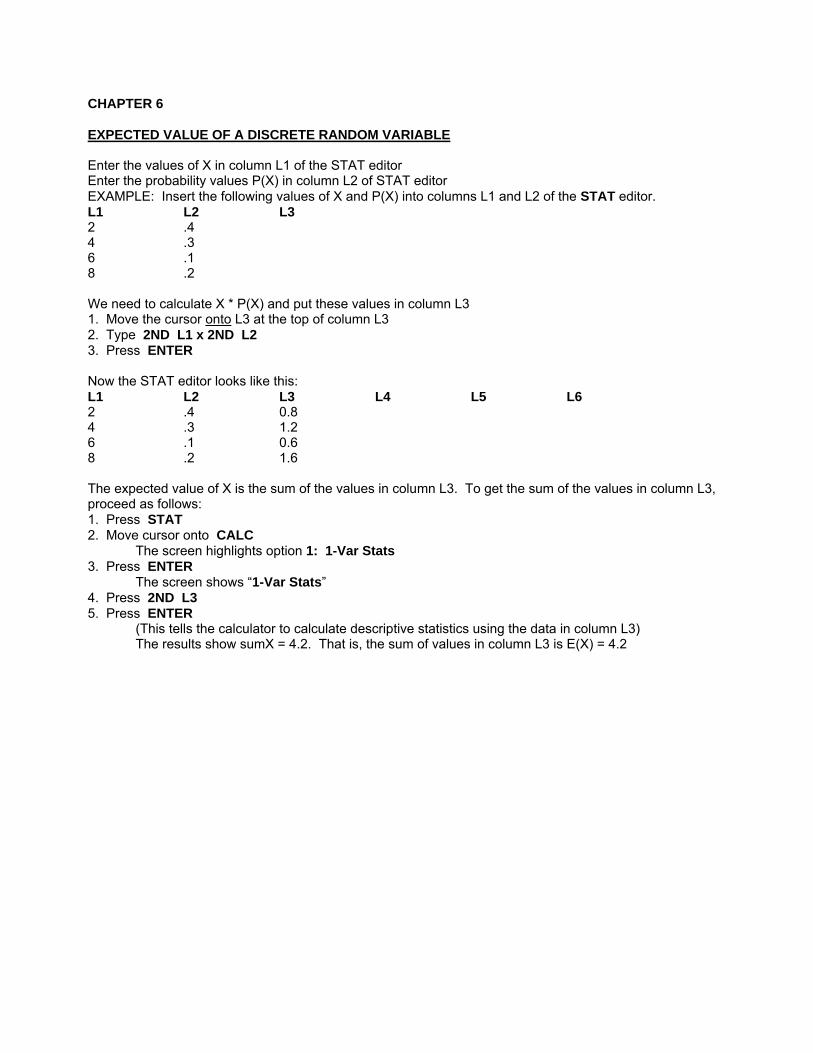
CHAPTER 6 EXPECTED VALUE OF A DISCRETE RANDOM VARIABLE Enter the values of X in column L1 of the STAT editor Enter the probability values P(X) in column L2 of STAT editor EXAMPLE: Insert the following values of X and P(X) into columns L1 and L2 of the STAT editor. L1 L2 L3 2 .4 4 .3 6 .1 8 .2 We need to calculate X * P(X) and put these values in column L3 1. Move the cursor onto L3 at the top of column L3 2. Type 2ND L1 x 2ND L2 3. Press ENTER Now the STAT editor looks like this: L1 L2 L3 L4 L5 L6 2 .4 0.8 4 .3 1.2 6 .1 0.6 8 .2 1.6 The expected value of X is the sum of the values in column L3. To get the sum of the values in column L3, proceed as follows: 1. Press STAT 2. Move cursor onto CALC
The screen highlights option 1: 1-Var Stats 3. Press ENTER
The screen shows “1-Var Stats” 4. Press 2ND L3 5. Press ENTER
(This tells the calculator to calculate descriptive statistics using the data in column L3) The results show sumX = 4.2. That is, the sum of values in column L3 is E(X) = 4.2
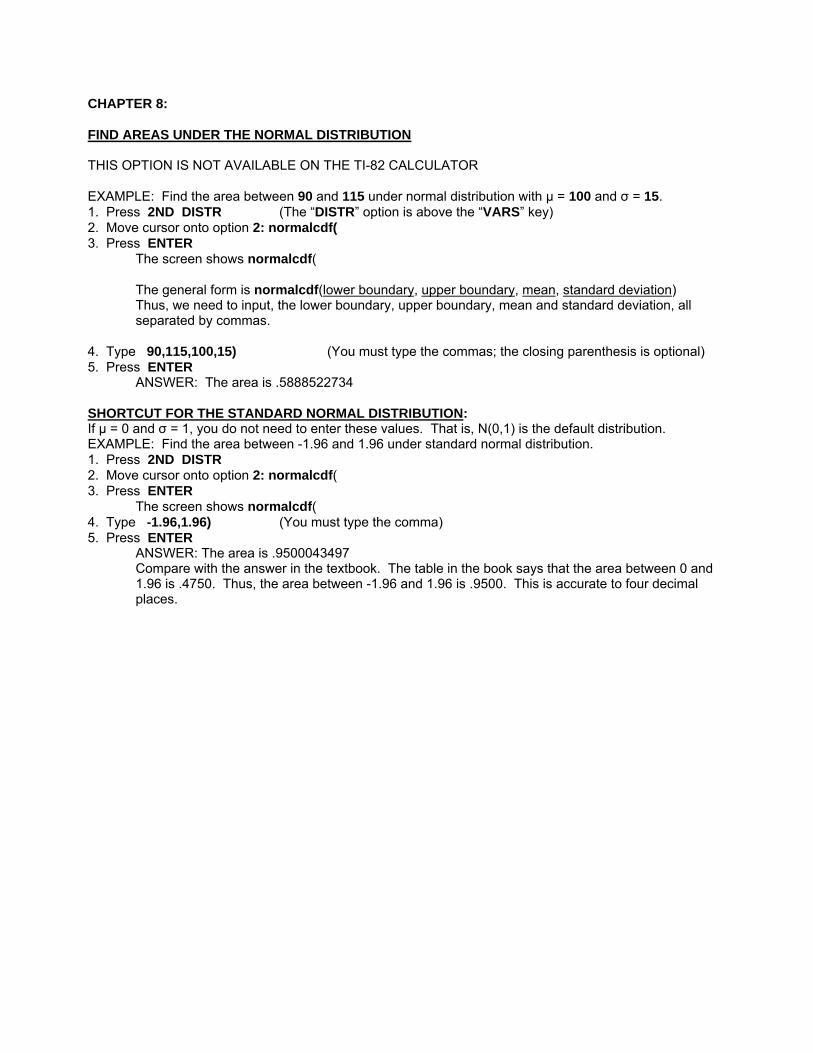
CHAPTER 8: FIND AREAS UNDER THE NORMAL DISTRIBUTION THIS OPTION IS NOT AVAILABLE ON THE TI-82 CALCULATOR EXAMPLE: Find the area between 90 and 115 under normal distribution with µ = 100 and σ = 15. 1. Press 2ND DISTR (The “DISTR” option is above the “VARS” key) 2. Move cursor onto option 2: normalcdf( 3. Press ENTER The screen shows normalcdf(
The general form is normalcdf(lower boundary, upper boundary, mean, standard deviation) Thus, we need to input, the lower boundary, upper boundary, mean and standard deviation, all separated by commas.
4. Type 90,115,100,15) (You must type the commas; the closing parenthesis is optional) 5. Press ENTER
ANSWER: The area is .5888522734 SHORTCUT FOR THE STANDARD NORMAL DISTRIBUTION: If µ = 0 and σ = 1, you do not need to enter these values. That is, N(0,1) is the default distribution. EXAMPLE: Find the area between -1.96 and 1.96 under standard normal distribution. 1. Press 2ND DISTR 2. Move cursor onto option 2: normalcdf( 3. Press ENTER The screen shows normalcdf( 4. Type -1.96,1.96) (You must type the comma) 5. Press ENTER
ANSWER: The area is .9500043497 Compare with the answer in the textbook. The table in the book says that the area between 0 and 1.96 is .4750. Thus, the area between -1.96 and 1.96 is .9500. This is accurate to four decimal places.
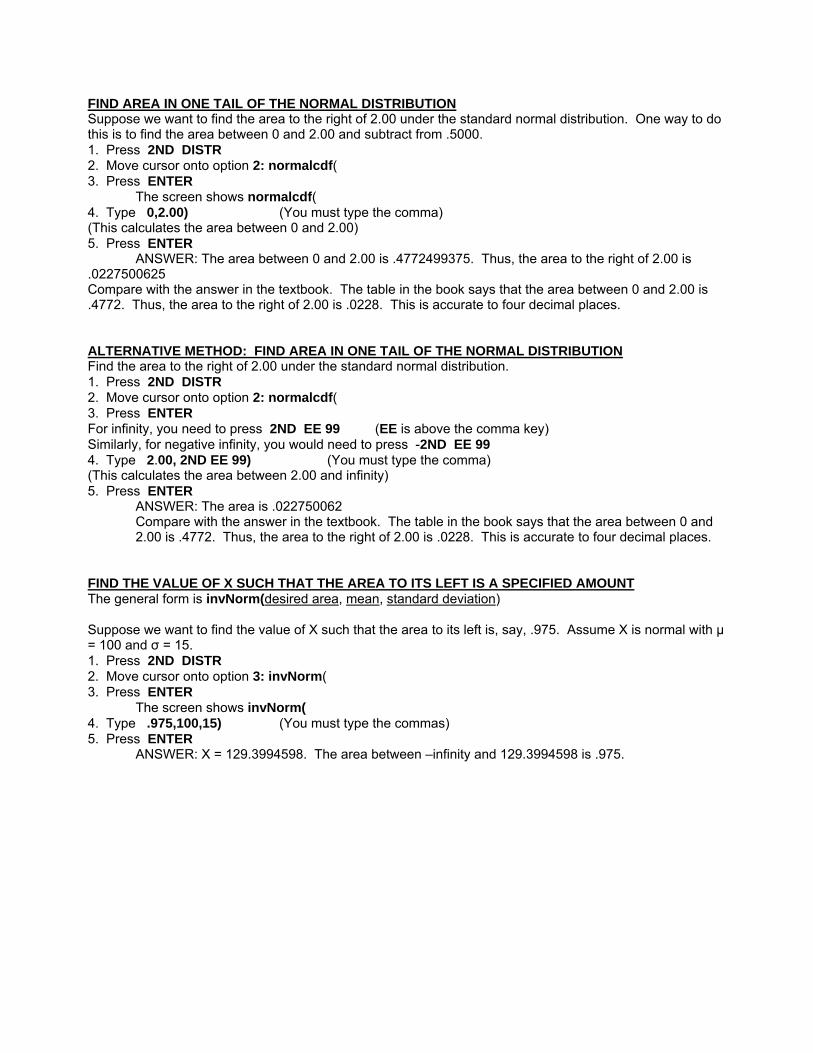
FIND AREA IN ONE TAIL OF THE NORMAL DISTRIBUTION Suppose we want to find the area to the right of 2.00 under the standard normal distribution. One way to do this is to find the area between 0 and 2.00 and subtract from .5000. 1. Press 2ND DISTR 2. Move cursor onto option 2: normalcdf( 3. Press ENTER The screen shows normalcdf( 4. Type 0,2.00) (You must type the comma) (This calculates the area between 0 and 2.00) 5. Press ENTER
ANSWER: The area between 0 and 2.00 is .4772499375. Thus, the area to the right of 2.00 is .0227500625 Compare with the answer in the textbook. The table in the book says that the area between 0 and 2.00 is .4772. Thus, the area to the right of 2.00 is .0228. This is accurate to four decimal places. ALTERNATIVE METHOD: FIND AREA IN ONE TAIL OF THE NORMAL DISTRIBUTION Find the area to the right of 2.00 under the standard normal distribution. 1. Press 2ND DISTR 2. Move cursor onto option 2: normalcdf( 3. Press ENTER For infinity, you need to press 2ND EE 99 (EE is above the comma key) Similarly, for negative infinity, you would need to press -2ND EE 99 4. Type 2.00, 2ND EE 99) (You must type the comma) (This calculates the area between 2.00 and infinity) 5. Press ENTER
ANSWER: The area is .022750062 Compare with the answer in the textbook. The table in the book says that the area between 0 and 2.00 is .4772. Thus, the area to the right of 2.00 is .0228. This is accurate to four decimal places.
FIND THE VALUE OF X SUCH THAT THE AREA TO ITS LEFT IS A SPECIFIED AMOUNT The general form is invNorm(desired area, mean, standard deviation) Suppose we want to find the value of X such that the area to its left is, say, .975. Assume X is normal with µ = 100 and σ = 15. 1. Press 2ND DISTR 2. Move cursor onto option 3: invNorm( 3. Press ENTER The screen shows invNorm( 4. Type .975,100,15) (You must type the commas) 5. Press ENTER
ANSWER: X = 129.3994598. The area between –infinity and 129.3994598 is .975.

CHAPTER 10 AREAS UNDER THE t-DISTRIBUTION TI-82 DOES NOT HAVE THIS OPTION EXAMPLE: Find the area between -1.23 and 1.833 under the t-distribution having 9 degrees of freedom. 1. Press 2ND DISTR 2. Move cursor onto option 5: tcdf( 3. Press ENTER The screen shows tcdf(
The general form is tcdf(lower boundary, upper boundary, degrees of freedom). Thus, we need to input, the lower boundary, upper boundary, and degrees of freedom, all separated by commas.
4. Type -1.23,1.833,9) (You must type the commas; the closing parenthesis is optional) 5. Press ENTER
ANSWER: The area is .8250518567 FIND AREA IN ONE TAIL OF THE t DISTRIBUTION Usually, we want the area in the right hand tail of the t distribution. EXAMPLE: Find the area to the right of 1.833 under the t-distribution having 9 degrees of freedom. To find the area to the right of 1.833, we can find the area between 0 and 1.833 and subtract from .5000. 1. Press 2ND DISTR 2. Move cursor onto option 5: tcdf( 3. Press ENTER The screen shows tcdf( 4. Type 0,1.833,9) (You must type the commas; the closing parenthesis is optional) 5. Press ENTER
ANSWER: The area is .4499910308. Thus the area to the right of 1.833 is .0500089692. Compare with the answer in the textbook. The table in the book says that, for 9 degrees of freedom, the area to the right of 1.833 = .05. This is accurate to four decimal places.
ALTERNATIVE METHOD: FIND AREA IN ONE TAIL OF THE t DISTRIBUTION EXAMPLE: Find the area to the right of 1.833 under the t-distribution having 9 degrees of freedom. 1. Press 2ND DISTR 2. Move cursor onto option 5: tcdf( 3. Press ENTER The screen shows tcdf(
(For infinity, you need to press 2ND EE 99 (EE is above the comma key) Similarly, for negative infinity, you would need to press -2ND EE 99
4. Type 1.833,2ND EE 99,9) (You must type the commas; the closing parenthesis is optional) (This calculates the area between 1.833 and infinity)
5. Press ENTER ANSWER: The area is .0500089692

CHAPTER 10 FINDING A Z CONFIDENCE INTERVAL FOR THE MEAN 1. Enter the data in the STAT editor Press STAT The screen highlights EDIT Press ENTER Enter the X values in column L1 2. Calculate the sample mean. (We assume the population standard deviation is known.) Press STAT Move the cursor onto CALC Press ENTER The screen shows 1-Var Stats Press ENTER
The screen shows the sample mean. Record the value of the sample mean for future use. 3. Press STAT 4. Move the cursor onto TESTS 5. Move the cursor onto option 7: ZInterval 6. Press ENTER 7. Move the cursor onto option Stats 8. Press ENTER 9. Move the cursor down to sigma and type the appropriate value of the standard deviation 10. Move the down to xbar and type the appropriate value 11. Move the cursor down to n: and type the sample size 12. Move the cursor down to C-Level and type the desired confidence level 13. Move the cursor down to Calculate and press ENTER EXAMPLE: Suppose xbar = 88; σ = 10; n = 50; level of confidence = 1 - α = .95 1. Press STAT 2. Move cursor onto TESTS 3. Move cursor onto 7: ZInterval 4. Press ENTER 5. Move cursor onto Stats 6. Press ENTER 7. Type the desired values for xbar, sigma, n, and C-Level 8. Move the cursor onto Calculate 9. Press ENTER
ANSWER: By hand calculation, the desired confidence interval is (85.22814142; 90.77185858). My TI-83 calculator shows the result (85.228; 90.772)

CHAPTER 10 FINDING A t CONFIDENCE INTERVAL FOR THE MEAN Follow the same procedure as that used for finding a z confidence interval for the mean except choose option 8: TInterval rather than option 7: ZInterval. You will need to insert a value for the sample mean and the sample standard deviation. CHAPTER 10 FINDING A CONFIDENCE INTERVAL FOR THE POPULATION PROPORTION Assume the sample size is 400. Assume the number of successes is X = 100. Calculate a 95% confidence interval for the population proportion. 1. Press STAT 2. Move cursor onto TESTS 3. Move cursor down onto A: 1-PropZInt 4. Press ENTER 5. Type in the appropriate values for X, n, and C-Level (confidence level) 6. Move the cursor onto Calculate 7. Press ENTER ANSWER: The screen shows (.20757; .29243); phat = .25; n = 400
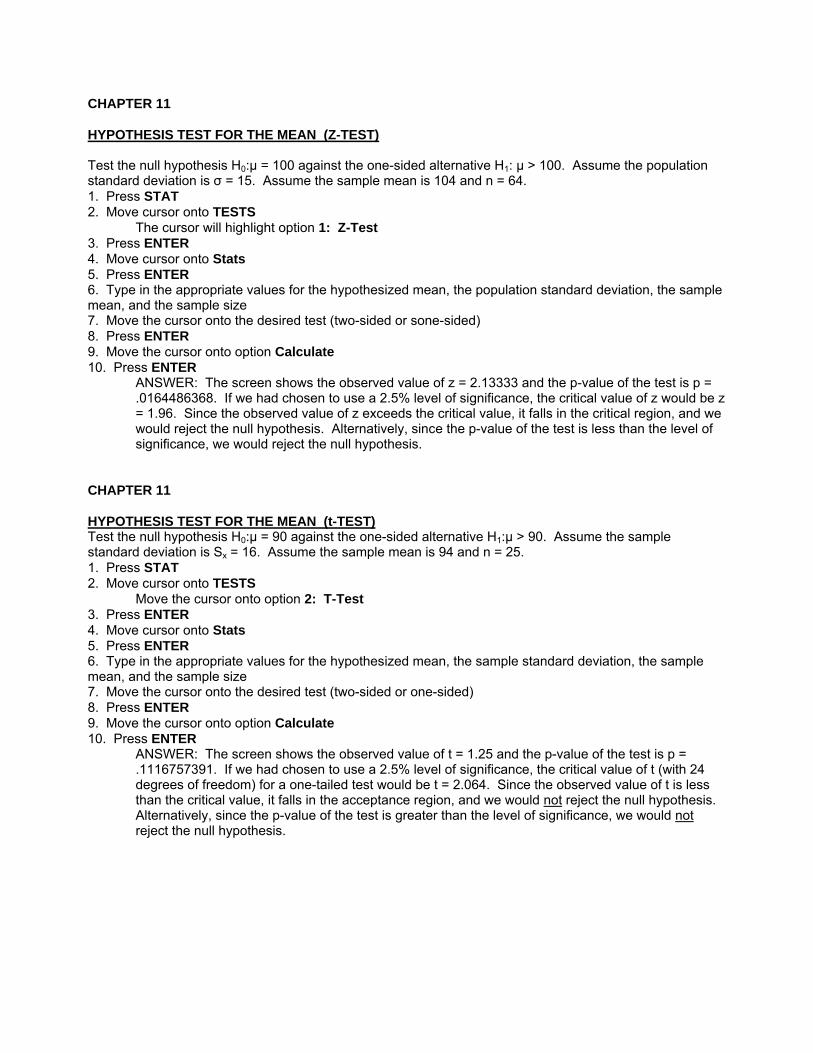
CHAPTER 11 HYPOTHESIS TEST FOR THE MEAN (Z-TEST) Test the null hypothesis H0:µ = 100 against the one-sided alternative H1: µ > 100. Assume the population standard deviation is σ = 15. Assume the sample mean is 104 and n = 64. 1. Press STAT 2. Move cursor onto TESTS The cursor will highlight option 1: Z-Test 3. Press ENTER 4. Move cursor onto Stats 5. Press ENTER 6. Type in the appropriate values for the hypothesized mean, the population standard deviation, the sample mean, and the sample size 7. Move the cursor onto the desired test (two-sided or sone-sided) 8. Press ENTER 9. Move the cursor onto option Calculate 10. Press ENTER
ANSWER: The screen shows the observed value of z = 2.13333 and the p-value of the test is p = .0164486368. If we had chosen to use a 2.5% level of significance, the critical value of z would be z = 1.96. Since the observed value of z exceeds the critical value, it falls in the critical region, and we would reject the null hypothesis. Alternatively, since the p-value of the test is less than the level of significance, we would reject the null hypothesis.
CHAPTER 11 HYPOTHESIS TEST FOR THE MEAN (t-TEST) Test the null hypothesis H0:µ = 90 against the one-sided alternative H1:µ > 90. Assume the sample standard deviation is Sx = 16. Assume the sample mean is 94 and n = 25. 1. Press STAT 2. Move cursor onto TESTS Move the cursor onto option 2: T-Test 3. Press ENTER 4. Move cursor onto Stats 5. Press ENTER 6. Type in the appropriate values for the hypothesized mean, the sample standard deviation, the sample mean, and the sample size 7. Move the cursor onto the desired test (two-sided or one-sided) 8. Press ENTER 9. Move the cursor onto option Calculate 10. Press ENTER
ANSWER: The screen shows the observed value of t = 1.25 and the p-value of the test is p = .1116757391. If we had chosen to use a 2.5% level of significance, the critical value of t (with 24 degrees of freedom) for a one-tailed test would be t = 2.064. Since the observed value of t is less than the critical value, it falls in the acceptance region, and we would not reject the null hypothesis. Alternatively, since the p-value of the test is greater than the level of significance, we would not reject the null hypothesis.
CHAPTER 11 HYPOTHESIS TEST FOR THE POPULATION PROPORTION Test the null hypothesis that H0:p = .60 against the one-sided alternative H1:p < .60. Assume the sample size is n = 400 and X = 220. Assume the desired level of significance is α = 1%. 1. Press STAT 2. Move cursor onto TESTS The cursor will highlight option 5: 1-PropZ-Test 3. Press ENTER 4. Move cursor onto Stats 5. Press ENTER 6. Type in the appropriate values for the hypothesized population proportion, X and n. 7. Move the cursor onto the desired test (two-sided or sone-sided) 8. Press ENTER 9. Move the cursor onto option Calculate 10. Press ENTER ANSWER: The screen shows the observed value of z = -2.041241452 and the p-value of the test is p = .0206133484. We chose a 1.0% level of significance, so the critical value of z would be z = -2.33. Since the observed value of z exceeds the critical value, it falls in the acceptance region, and we would not reject the null hypothesis. Alternatively, since the p-value of the test is greater than the level of significance, we would not reject the null hypothesis.
CHAPTER 15 LINEAR REGRESSION AND CORRELATION You need to know which variable is the dependent variable (Y) and which is the independent variable (X). The default option is to put X in column L1 and Y in column L2 in the STAT editor. Calculate the regression equation using the following data, where X is in L1 and Y is in L2: L1 L2 2 7 4 13 6 22 8 26 1. Press STAT 2. Move cursor onto CALC 3. Move cursor onto option 4: LinReg(ax+b) 4. Press ENTER
The screen shows LinReg(ax+b) (Because we have X in L1 and Y in L2, we do not need to specify the column locations for X and Y) NOTE: Alternatively, you can use option 8: LinReg(a+bx) You will get the exact same values, but now a is the intercept and b is the slope. 5. Press ENTER
ANSWER: The screen shows the following results: a = slope = 3.3 b = intercept = .5
r = correlation coefficient = .9904953716 r2 = .9810810811 Thus, the estimated regression equation is: Y = 3.3X + .5 FOOTNOTE: What if, say, X is in column L4 and Y is in column L3? 1. Press STAT 2. Move cursor onto CALC 3. Move cursor onto option 4: LinReg(ax+b) 4. Press ENTER
The screen shows LinReg(ax+b) (Because we have X in L4 and Y in L3, we do need to specify the column locations for X and Y) 5. Press 2ND L4, 2ND L3 (The first location is always the X variable; you must type the comma, the 2nd location is the Y variable.) 6. Press ENTER CORRELATION COEFFICIENT: TI-83 ONLY If your calculator does not show the correlation coefficient along with the regression results, proceed as follows. 1. Press 2ND CATALOG (Option “CATALOG” is above the "0" key) 2. Move the cursor down until it points at option DiagnosticOn 3. Press ENTER TWICE In the future, the calculator will always show the correlation coefficient along with the estimated slope and intercept.

CHAPTER 15 TESTING THE HYPOTHESIS THAT THE CORRELATION COEFFICENT IS ZERO 1. Press STAT 2. Move the cursor onto TESTS 3. Move the cursor onto E: LinRegTest 4. Press ENTER 5. Make sure Xlist shows L1 (for variable X) and Ylist shows L2 (for variable Y) 6. Move the cursor onto the appropriate alternative hypothesis 7. Press ENTER 8. Move the cursor onto Calculate and press ENTER
ANSWER: The screen shows the observed value of t = 10.1840211 with 2 degrees of freedom. You must choose an appropriate level of significance and find the critical value of t using the t-distribution table. Compare the observed value of t with the critical value of t and make the appropriate decision. Also, the screen shows that the p-value of the test is .0047523142. Reject the null hypothesis if the p-value is less than the level of significance.

CHAPTER 15 TO GRAPH A SCATTERPLOT 1. Enter the X values in column L1 and the Y values in column L2 2. Press WINDOW (The WINDOW key is at the top of the keyboard.) 3. Make sure the WINDOW values are appropriate for your X and Y data. Type an Xmin value which is slightly less than the smallest X value and an Xmax value which is slightly larger than the largest X value. Do the same for Ymin and Ymax. In general, the values Xscl, Yscl and Xres can be set equal to 1. 2. Press 2ND STAT PLOT (Option STAT PLOT is above the “Y=” key at the top left of the keyboard.) 3. Option 1: Plot 1 will be highlighted Press ENTER 4. A new screen appears Put the cursor on option “On” Press ENTER 5. Move the cursor down to Option Type Move the cursor over onto the first graph symbol (which looks like a scatterplot). . Press ENTER 6. Make sure Xlist shows L1 and Ylist shows L2 (provided X is in L1 and Y is in L2) For Mark, highlight the square symbol, the “+” symbol, or the period symbol, to mark your data points 6. Press GRAPH (The “GRAPH” key is located on the top right of the keyboard.) The scatterplot will now appear. If you do not like its appearance, change the WINDOW settings or the STAT PLOT choices.

CHAPTER 15 TO PLOT A REGRESSION LINE ON THE SCATTERPLOT 1. Use the STAT editor and calculate the equation of the sample regression line 2. Press Y= (The “Y=” key is located at the top left of the keyboard. 3. If necessary, press CLEAR to clear any previous equation listed at equation Y1 4. Press VARS 5. Move cursor onto option 5: Statistics 6. Press ENTER 7. Move cursor onto option EQ (Highlight option 1: RegEq) 8. Press ENTER (The screen shows the regression equation next to equation Y1.) 9. Press GRAPH (The screen should show the regression line superimposed onto the scatterplot.)
CHAPTER 15: (OPTIONAL) CALCULATE VALUES OF Y, THE PREDICTED VALUES OF Y In the last example, X and Y were in columns L1 and L2, and the estimated regression equation was Y = 3.3X + .5 Alternatively, this could be expressed as Y = .5 + 3.3X Let us calculate the predicted values of Y (Y = 3.3X + .5) and put these values in column L3. 1. Press STAT Cursor highlights EDIT 2. Press ENTER 3. Move the cursor onto L3 at the top of column L3 4. Type 3.3 x 2ND L1 + .5
This tells the calculator to multiply the values in L1 by 3.3 and then add .5
5. Press ENTER The predicted values appear in column L3. X Y Y L1 L2 L3 2 7 7.1 4 13 13.7 6 22 20.3 8 26 26.9
CHAPTER 15: (OPTIONAL) CALCULATE THE RESIDUALS The residuals are equal to ê = Y - Y The values of Y and Y are in columns L2 and L3. Let us put the residuals in column L4. 1. Press STAT Cursor highlights EDIT 2. Press ENTER 3. Move the cursor onto L4 at the top of column L4 4. Type 2ND L2 – 2ND L3 5. Press ENTER The residuals appear in column L4 X Y Y ê L1 L2 L3 L4 2 7 7.1 -.1 4 13 13.7 -.7 6 22 20.3 1.7 8 26 26.9 -.9 As a check, calculate the sum of the values in column L4. (Observe that the residuals sum to zero.)
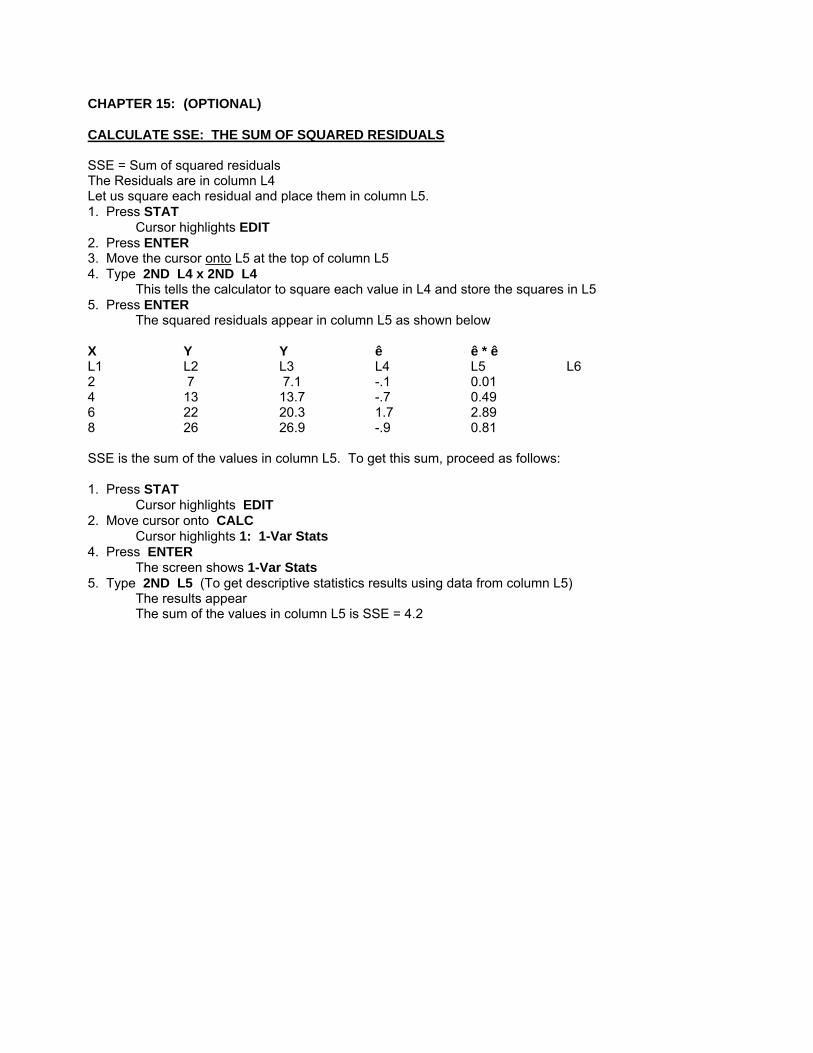
CHAPTER 15: (OPTIONAL) CALCULATE SSE: THE SUM OF SQUARED RESIDUALS SSE = Sum of squared residuals The Residuals are in column L4 Let us square each residual and place them in column L5. 1. Press STAT
Cursor highlights EDIT 2. Press ENTER 3. Move the cursor onto L5 at the top of column L5 4. Type 2ND L4 x 2ND L4 This tells the calculator to square each value in L4 and store the squares in L5 5. Press ENTER
The squared residuals appear in column L5 as shown below X Y Y ê ê * ê L1 L2 L3 L4 L5 L6 2 7 7.1 -.1 0.01 4 13 13.7 -.7 0.49 6 22 20.3 1.7 2.89 8 26 26.9 -.9 0.81 SSE is the sum of the values in column L5. To get this sum, proceed as follows: 1. Press STAT
Cursor highlights EDIT 2. Move cursor onto CALC
Cursor highlights 1: 1-Var Stats 4. Press ENTER The screen shows 1-Var Stats 5. Type 2ND L5 (To get descriptive statistics results using data from column L5) The results appear The sum of the values in column L5 is SSE = 4.2

FASTEST WAY TO CLEAR ALL DATA FROM STAT EDITOR 1. Press 2ND MEM 2. Move cursor onto option 4: ClrAllLists 3. Press ENTER

TO STORE A VALUE IN A MEMORY Often it is useful to store a value in a calculator memory, so it can be recalled later in a problem. EXAMPLE: Store the value 800 in memory Y. (For example, memory Y is above the "1" key, memory Z is above the "2" key, etc.) 1. Type the value 800 2. Press STO 3. Press ALPHA (This tells the calculator that you want to choose a memory indicated by a letter shown above a key) 4. Press Y (The “Y” is above the number “1” key) The value 800 is now stored in memory Y 5. Press ENTER In short, here's how to store the value 800 in memory Y. 1. Type 800 2. Press STO 3. Press ALPHA 4. Press Y 5. Press ENTER TO RECALL A VALUE FROM A MEMORY 1. Press 2ND RCL (RCL is above the STO key) 2. Press ALPHA Y This will recall the value 800 from memory Y 3. Press ENTER STORING VALUES IN MEMORY ON TI-82 PUT 10 IN MEMORY T, 15 IN MEMORY U, 20 IN MEMORY V 1. 10 STO ALPHA T ENTER 2. 15 STO ALPHA U ENTER 3. 20 STO ALPHA V ENTER USING VALUES STORED IN MEMORY ADD 10 + 15 + 20 1. ALPHA T + ALPHA U + ALPHA V ENTER (RESULT IS 45) DIVIDE 20 BY 10 2. ALPHA V / ALPHA T ENTER (RESULT IS 2)
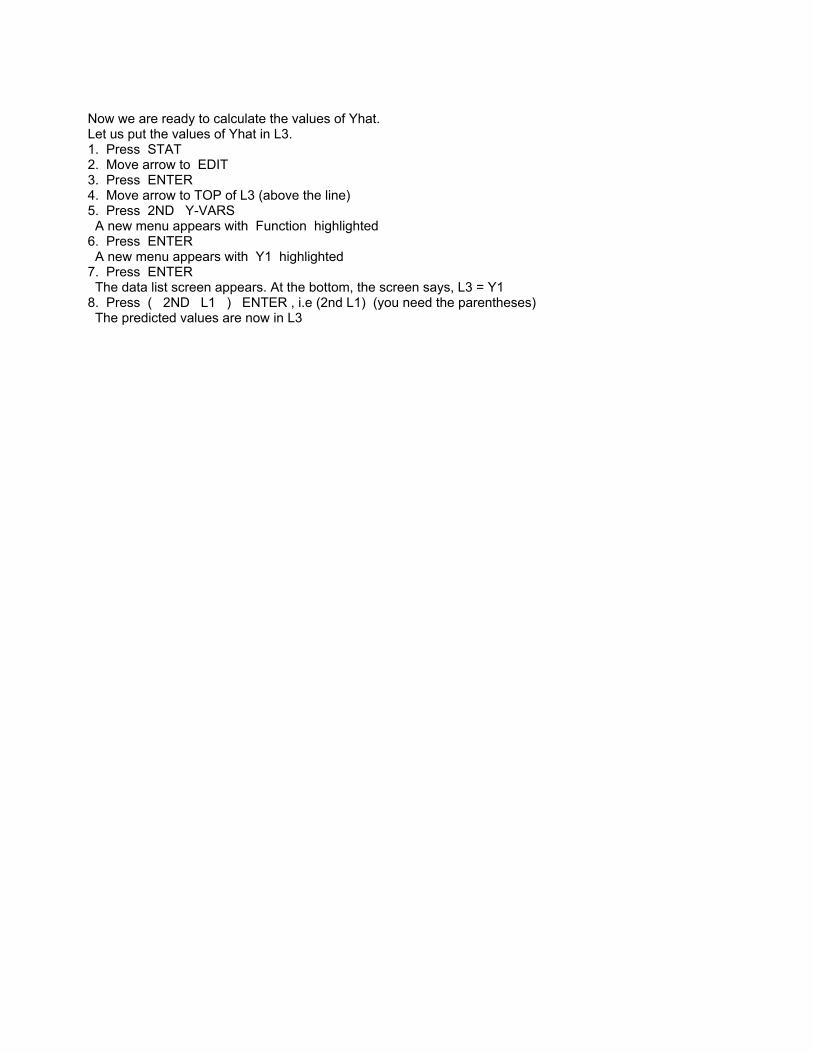
Now we are ready to calculate the values of Yhat. Let us put the values of Yhat in L3. 1. Press STAT 2. Move arrow to EDIT 3. Press ENTER 4. Move arrow to TOP of L3 (above the line) 5. Press 2ND Y-VARS A new menu appears with Function highlighted 6. Press ENTER A new menu appears with Y1 highlighted 7. Press ENTER The data list screen appears. At the bottom, the screen says, L3 = Y1 8. Press ( 2ND L1 ) ENTER , i.e (2nd L1) (you need the parentheses) The predicted values are now in L3
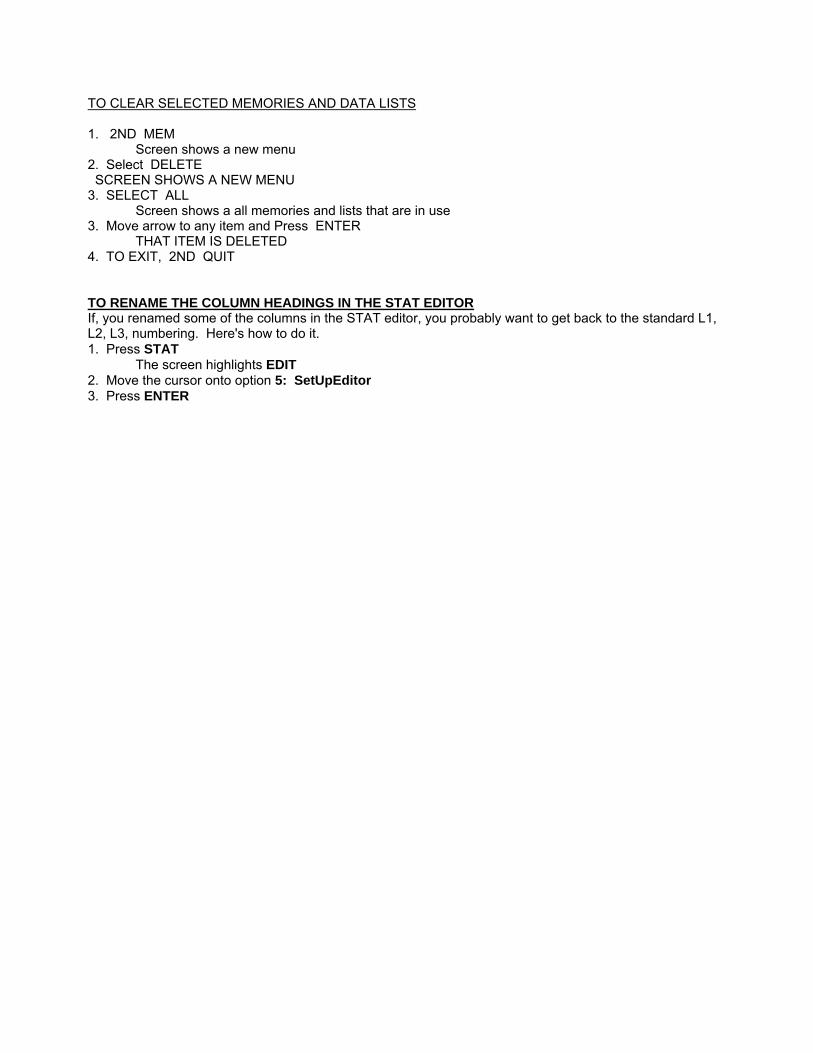
TO CLEAR SELECTED MEMORIES AND DATA LISTS 1. 2ND MEM Screen shows a new menu 2. Select DELETE SCREEN SHOWS A NEW MENU 3. SELECT ALL Screen shows a all memories and lists that are in use 3. Move arrow to any item and Press ENTER THAT ITEM IS DELETED 4. TO EXIT, 2ND QUIT TO RENAME THE COLUMN HEADINGS IN THE STAT EDITOR If, you renamed some of the columns in the STAT editor, you probably want to get back to the standard L1, L2, L3, numbering. Here's how to do it. 1. Press STAT The screen highlights EDIT 2. Move the cursor onto option 5: SetUpEditor 3. Press ENTER