Embed Size (px)
Citation preview
Basics of a Good Road - Concrete Pavements
Road Scholar Program
Part II
Mike Byers
Indiana Chapter – American Concrete
Pavement Association
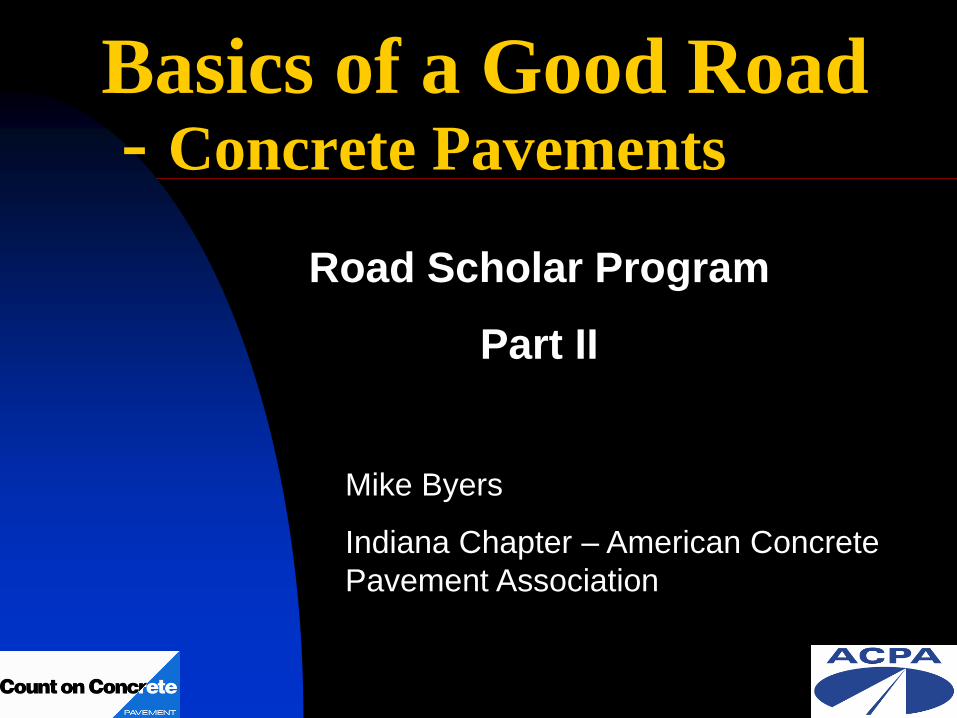
Streets & Local Roads
American Concrete Pavement Association
Chapter/States Associations of ACPA
Northeast
Southeast
Ohio
Michigan
Wisconsin
Minnesota
Indiana
Illinois
Iowa
Missouri-Kansas
Oklahoma-Arkansas
Colorado-
Wyoming
South
Dakota
Northwest
Utah
Louisiana
Western
States
North
Dakota
Kentucky
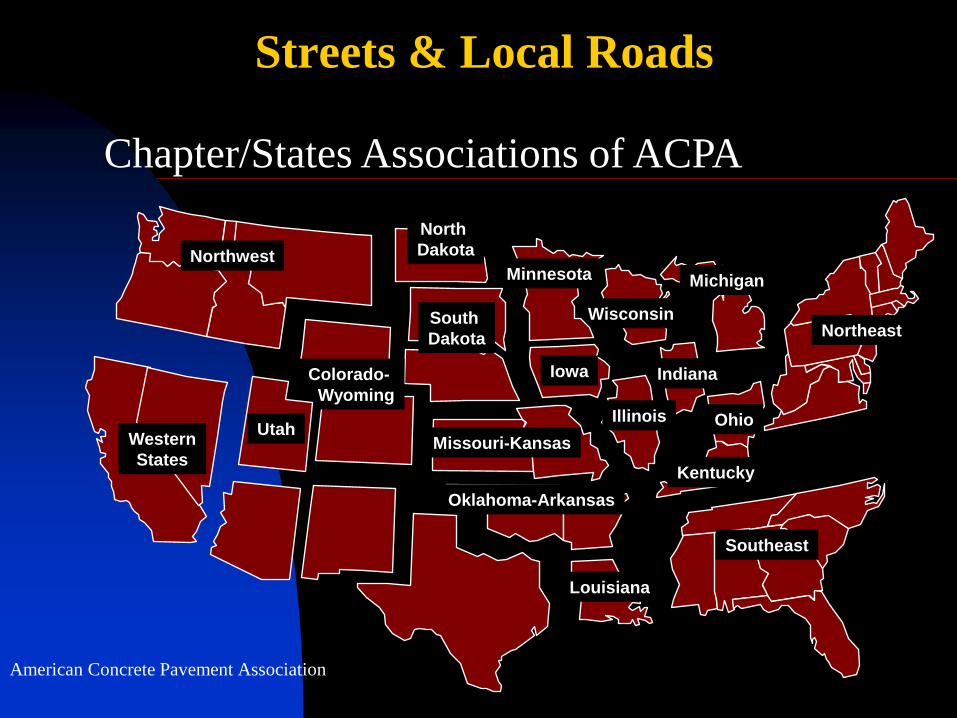
SLR Pavement Markets
New/Reconstruction of Concrete Pavements
Concrete Overlays Unbonded
Whitetopping
Ultra-Thin Whitetopping (UTW)
Concrete Inlays Intersections
Roundabouts
Bus Pads
Alleys
Concrete Pavement Restoration
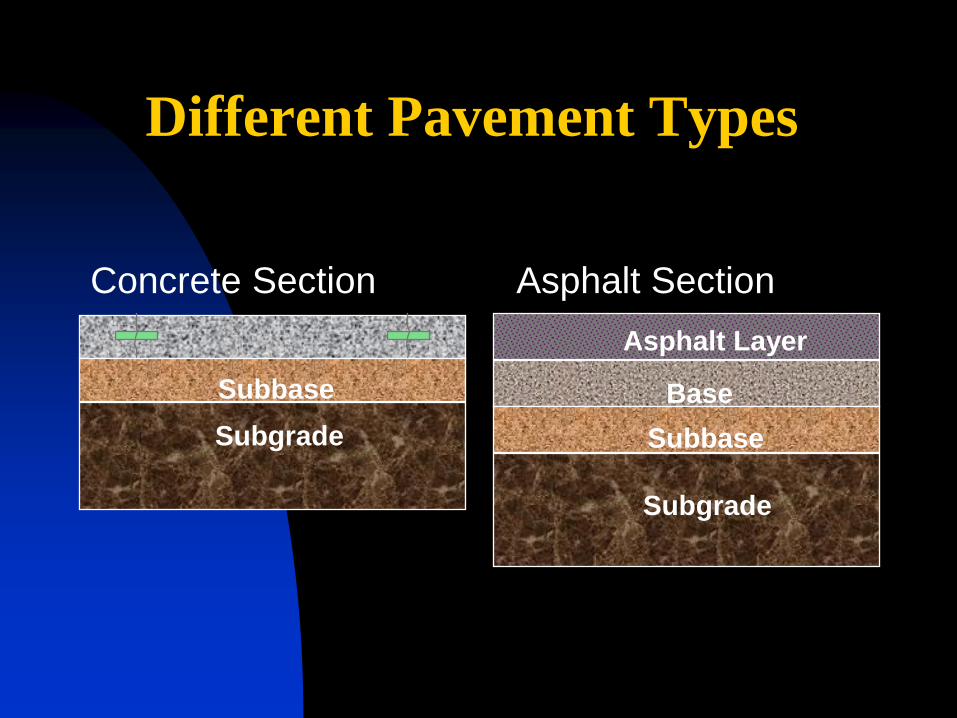
Different Pavement Types
Subbase
Subgrade Subbase
Subgrade
Base
Asphalt Layer
Concrete Section Asphalt Section
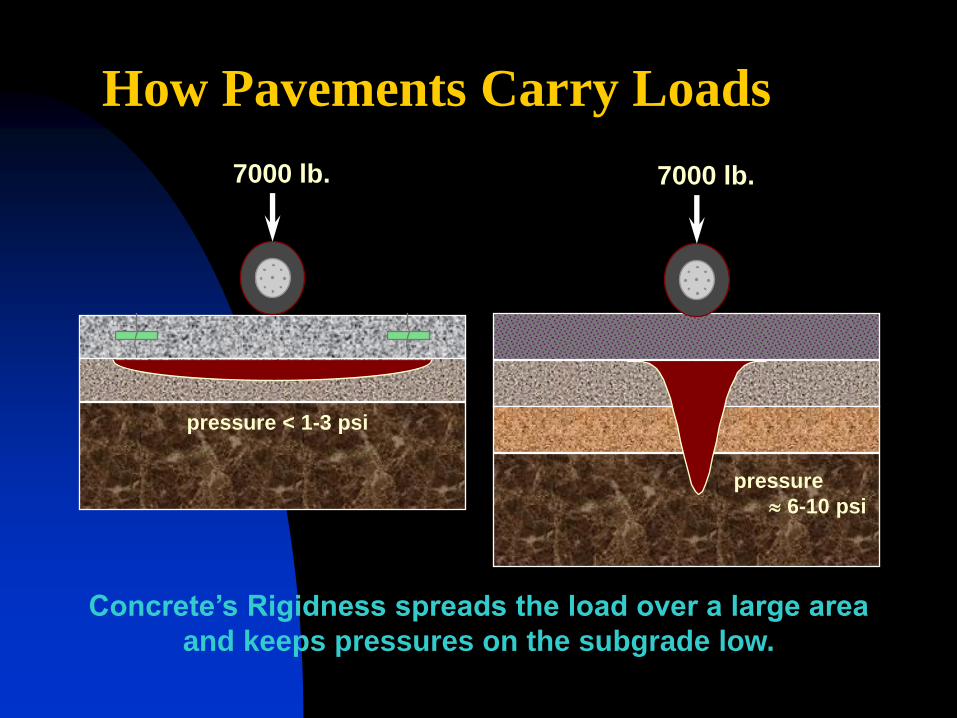
How Pavements Carry Loads
7000 lb. 7000 lb.
pressure < 1-3 psi
pressure
6-10 psi
Concrete’s Rigidness spreads the load over a large area
and keeps pressures on the subgrade low.
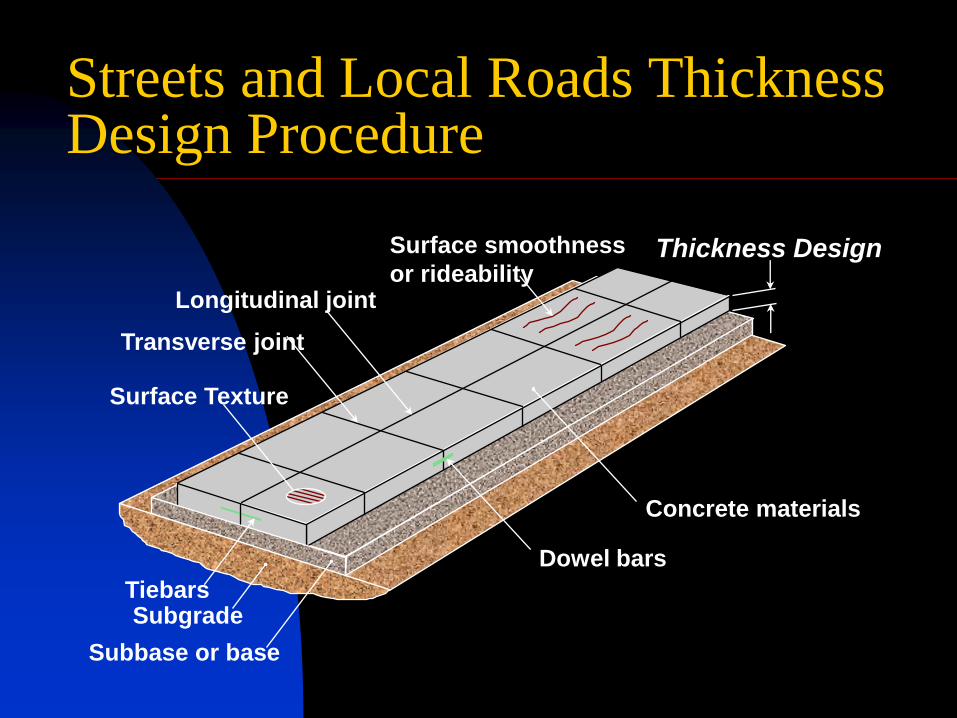
Streets and Local Roads Thickness Design Procedure
Longitudinal joint
Transverse joint
Subgrade
Subbase or base
Surface Texture
Surface smoothness
or rideability Thickness Design
Dowel bars
Concrete materials
Tiebars
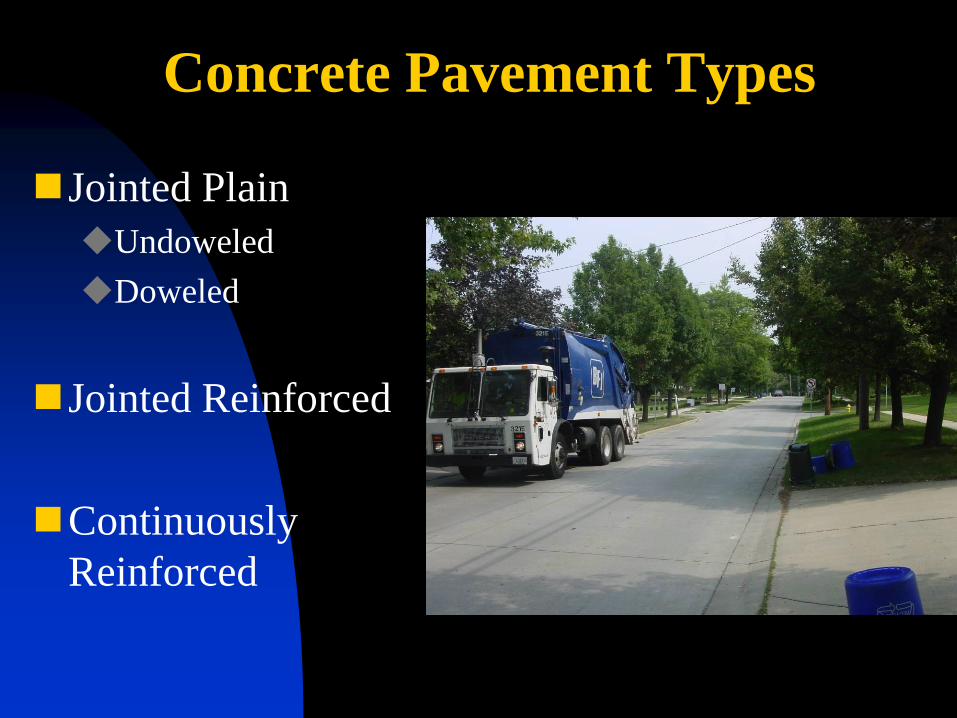
Concrete Pavement Types
Jointed Plain
Undoweled
Doweled
Jointed Reinforced
Continuously
Reinforced
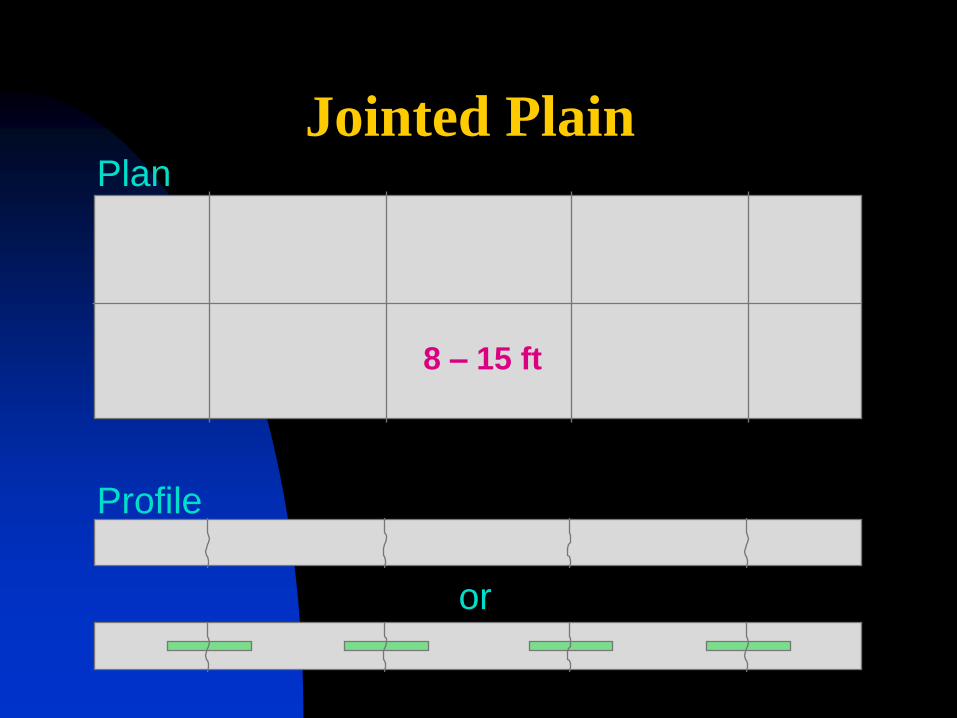
Jointed Plain
8 – 15 ft
Plan
Profile
or
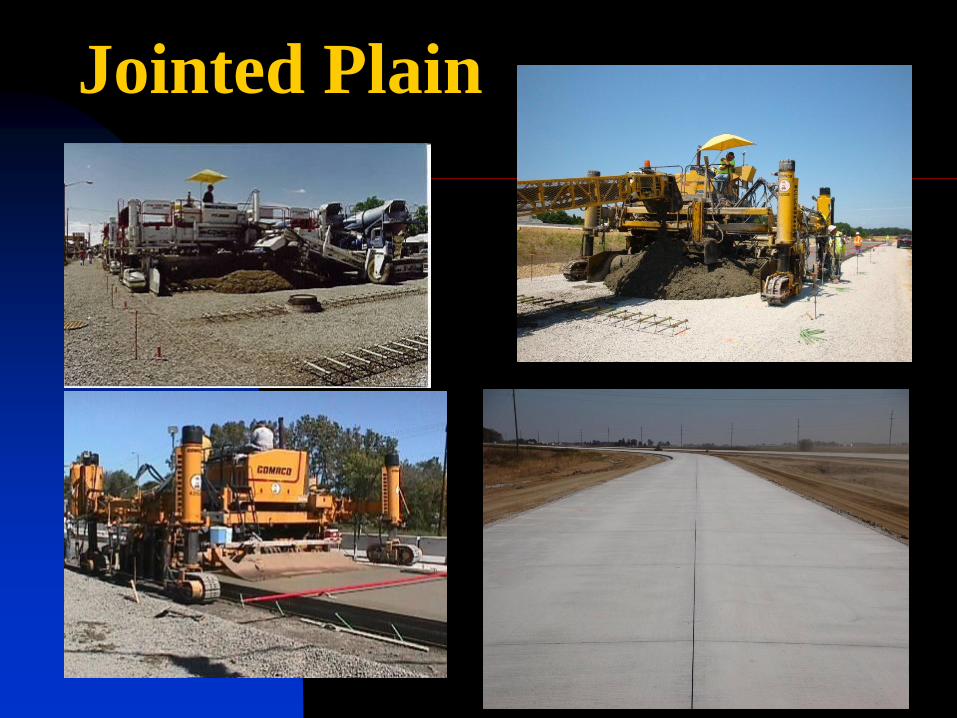
Jointed Plain
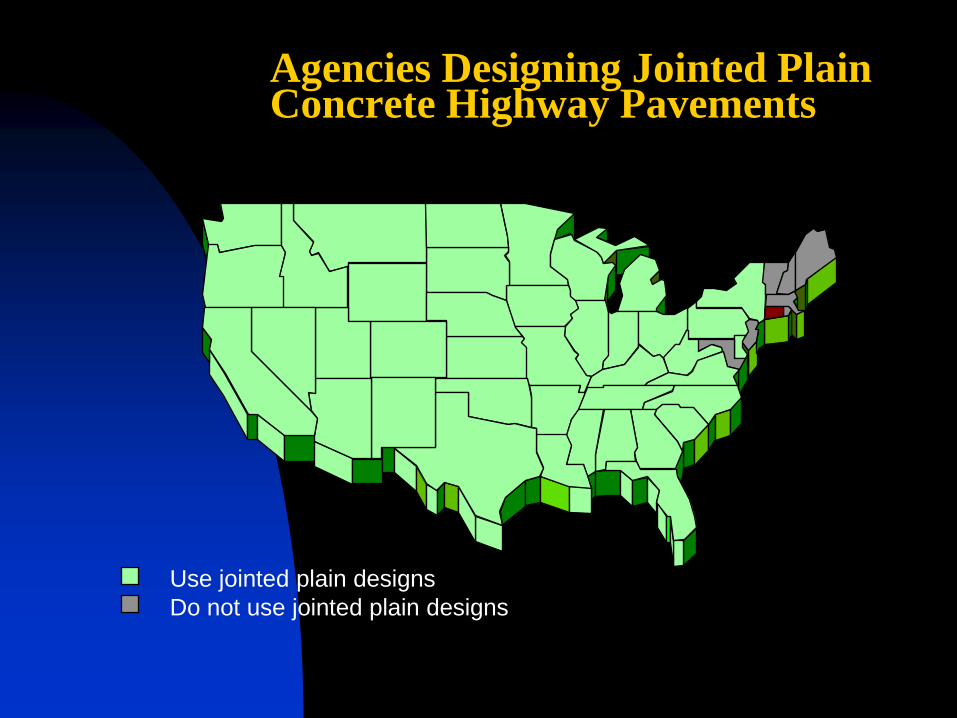
Agencies Designing Jointed Plain Concrete Highway Pavements
Use jointed plain designs
Do not use jointed plain designs
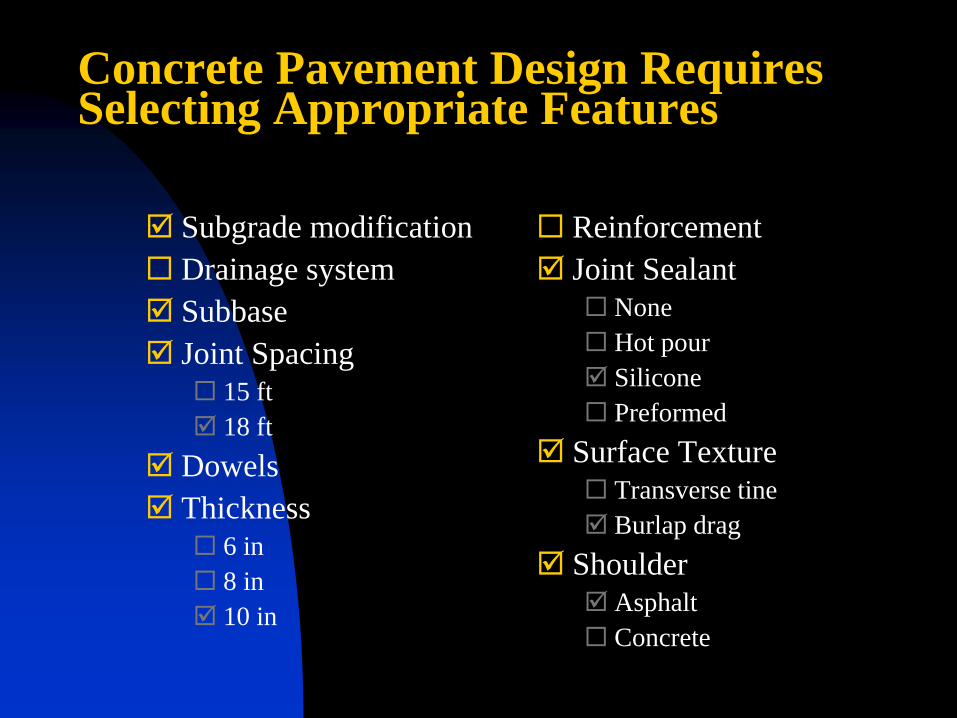
Concrete Pavement Design Requires Selecting Appropriate Features
Subgrade modification
Drainage system
Subbase
Joint Spacing
15 ft
18 ft
Dowels
Thickness
6 in
8 in
10 in
Reinforcement
Joint Sealant
None
Hot pour
Silicone
Preformed
Surface Texture
Transverse tine
Burlap drag
Shoulder
Asphalt
Concrete
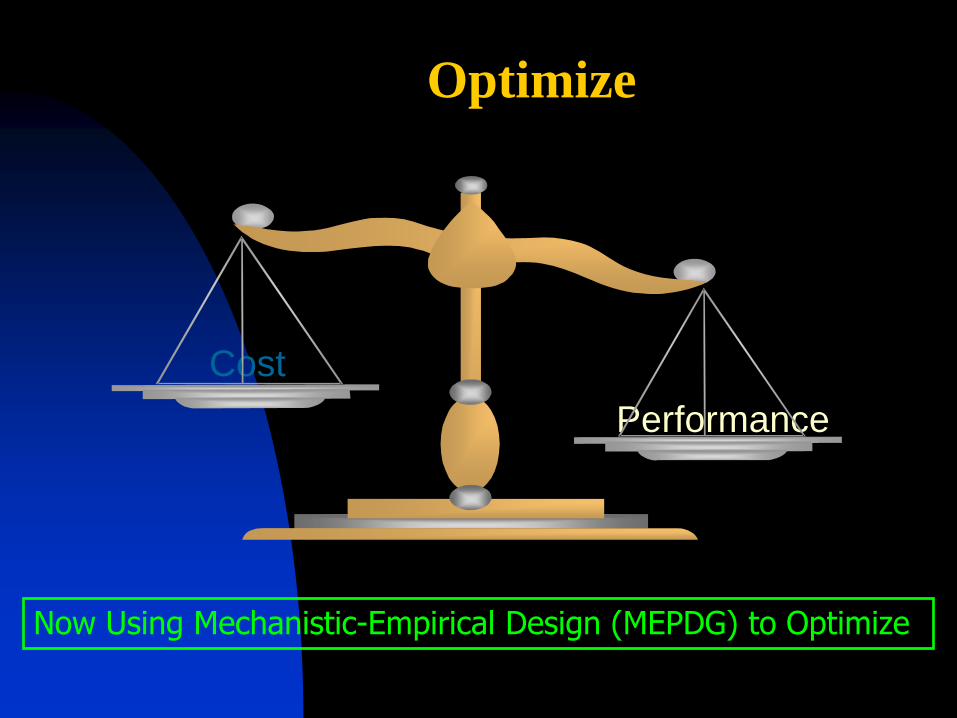
Optimize
Cost
Performance
Now Using Mechanistic-Empirical Design (MEPDG) to Optimize
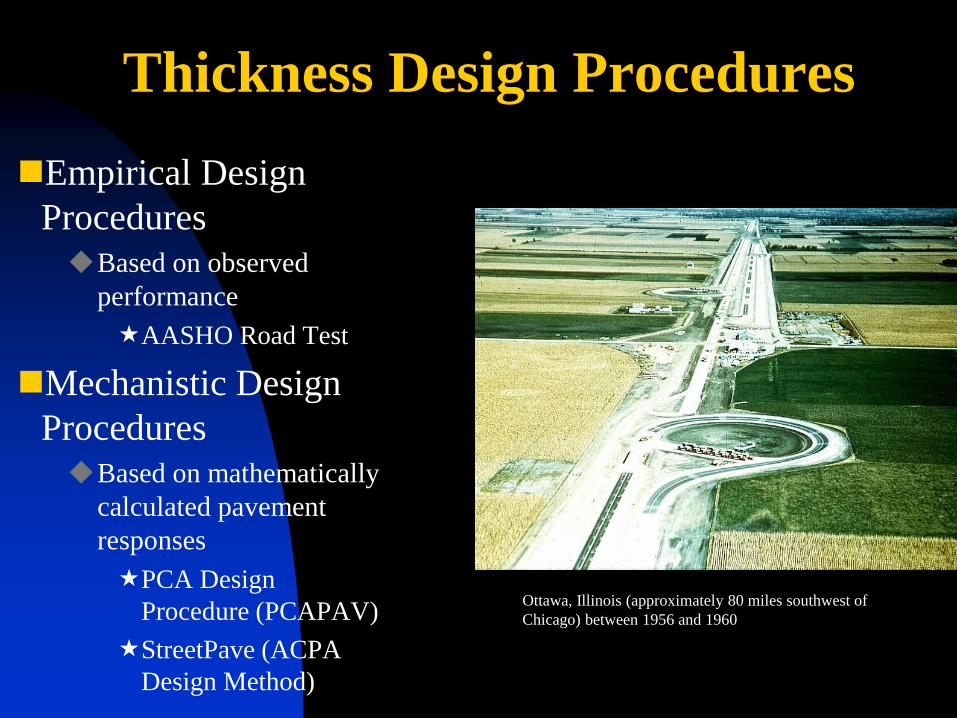
Thickness Design Procedures
Empirical Design
Procedures
Based on observed
performance
AASHO Road Test
Mechanistic Design
Procedures
Based on mathematically
calculated pavement
responses
PCA Design
Procedure (PCAPAV)
StreetPave (ACPA
Design Method)
Ottawa, Illinois (approximately 80 miles southwest of
Chicago) between 1956 and 1960

New Design Tools for SLR
MEPDG – Mechanistic-Emperical Design Guide
StreetPave Software
Concrete Thickness
Asphalt Institute Design Thickness
Life Cycle Cost Analysis
Information Sheet IS184
Thickness Design Manual for Concrete Streets and Local Roads EB109
Equivalent Pavement Design Charts
What’s Equivalent
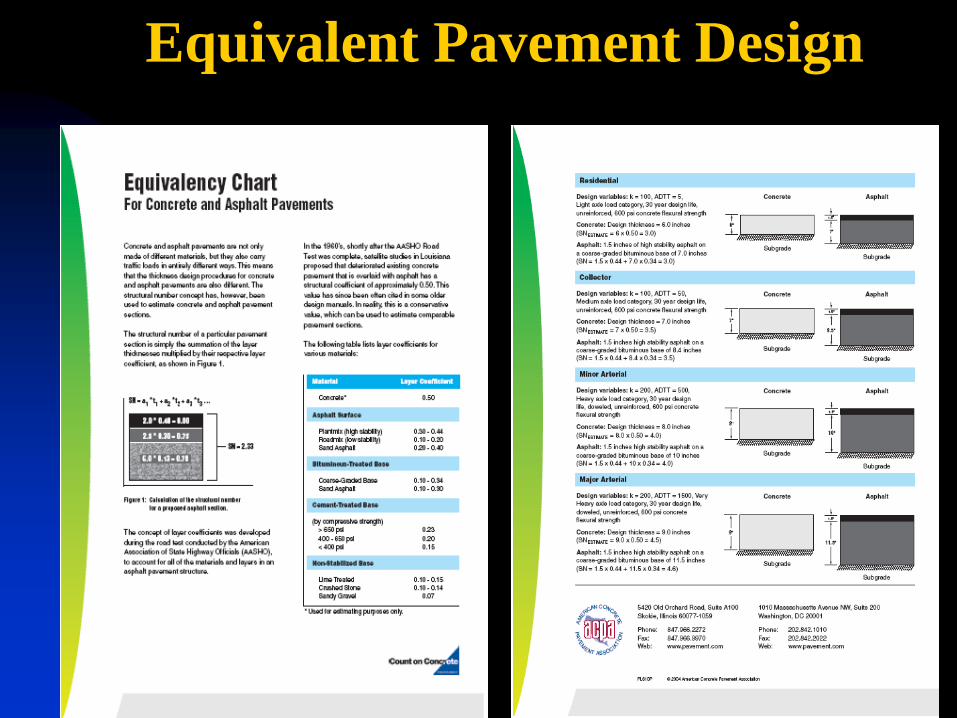
Equivalent Pavement Design
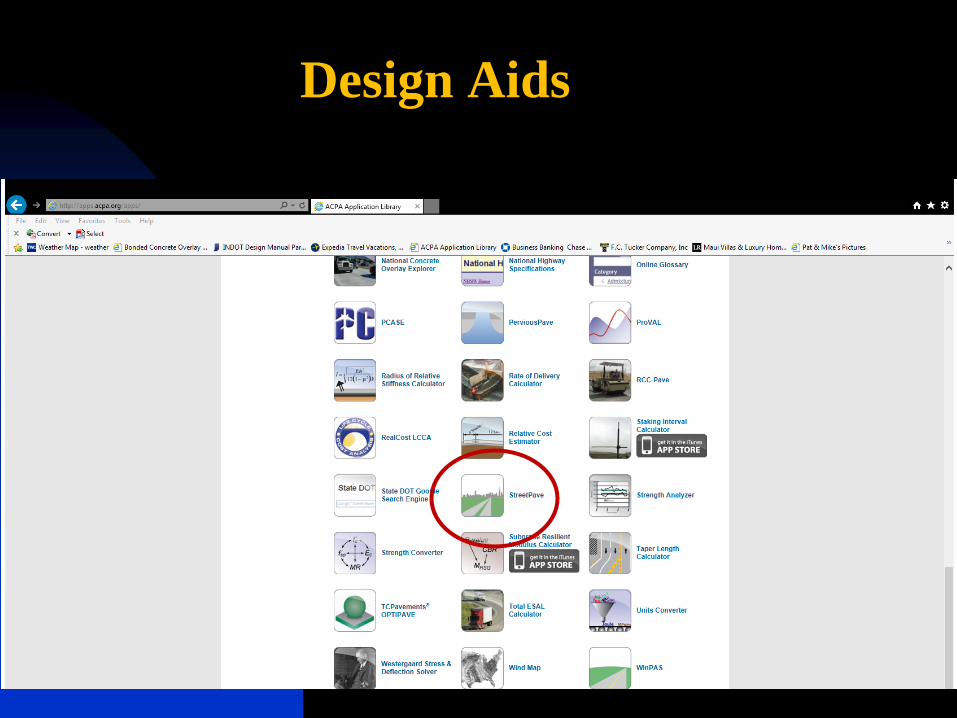
Design Aids
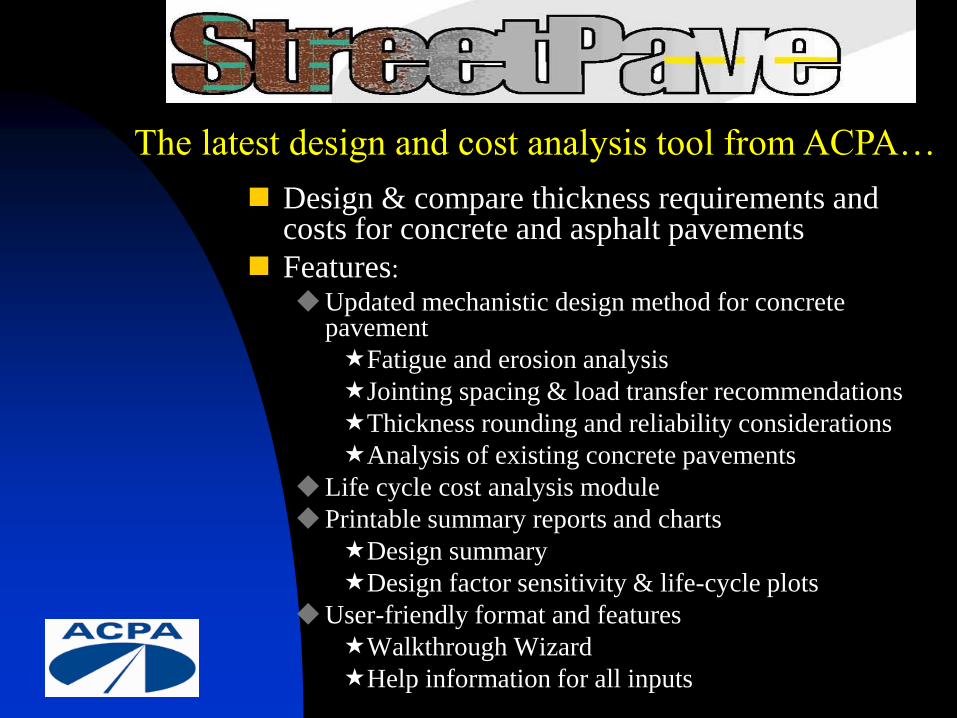
Design & compare thickness requirements and costs for concrete and asphalt pavements
Features:
Updated mechanistic design method for concrete pavement
Fatigue and erosion analysis
Jointing spacing & load transfer recommendations
Thickness rounding and reliability considerations
Analysis of existing concrete pavements
Life cycle cost analysis module
Printable summary reports and charts
Design summary
Design factor sensitivity & life-cycle plots
User-friendly format and features
Walkthrough Wizard
Help information for all inputs
The latest design and cost analysis tool from ACPA…
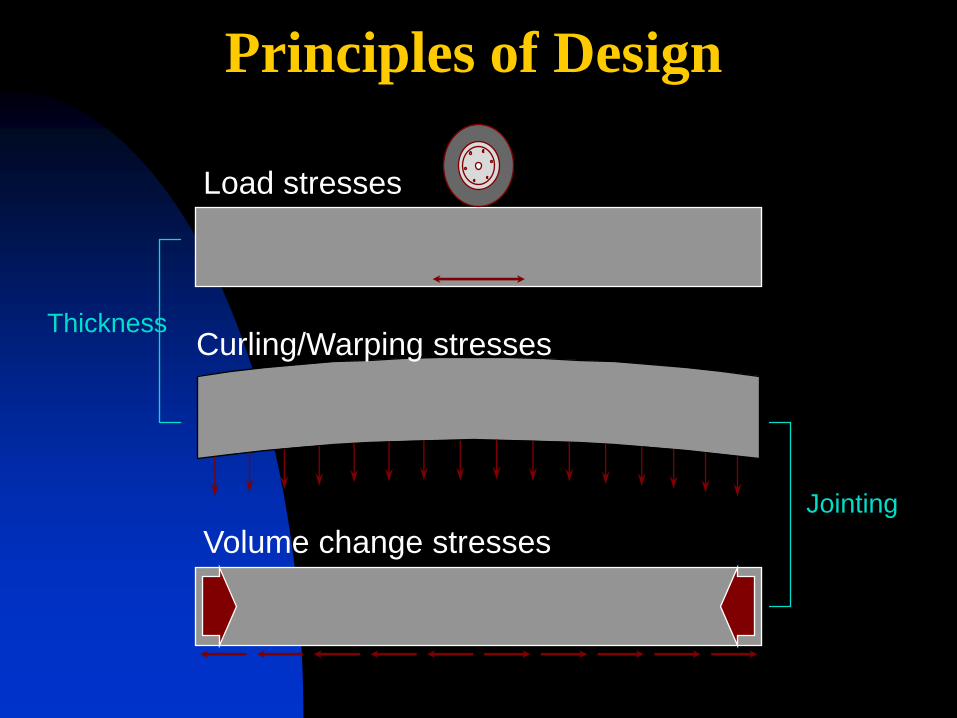
Principles of Design
Load stresses
Volume change stresses
Curling/Warping stresses
Jointing
Thickness
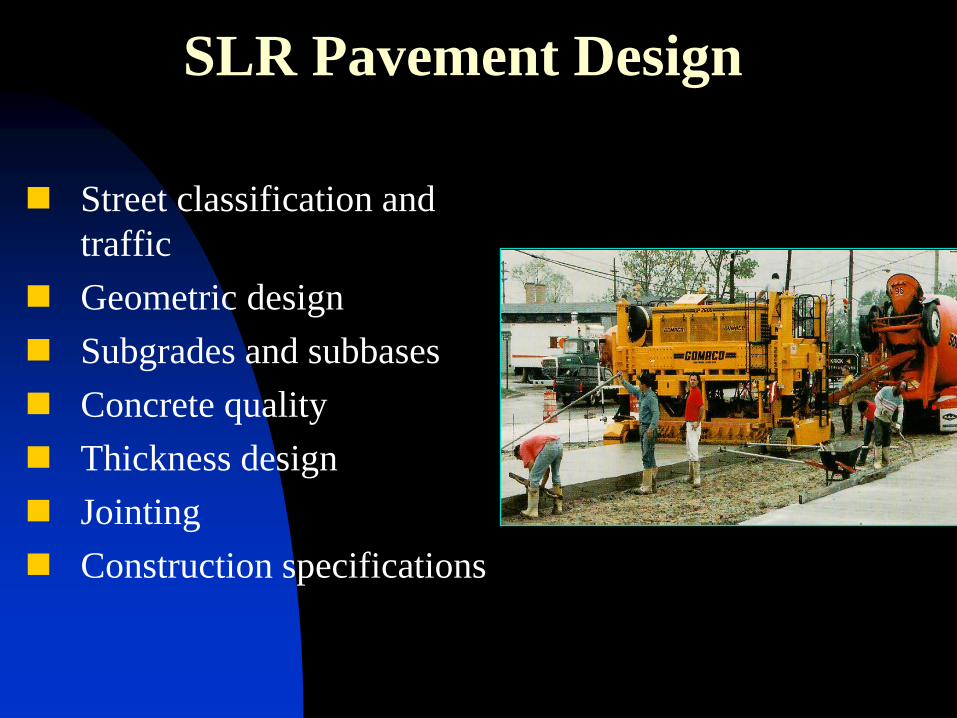
SLR Pavement Design
Street classification and
traffic
Geometric design
Subgrades and subbases
Concrete quality
Thickness design
Jointing
Construction specifications
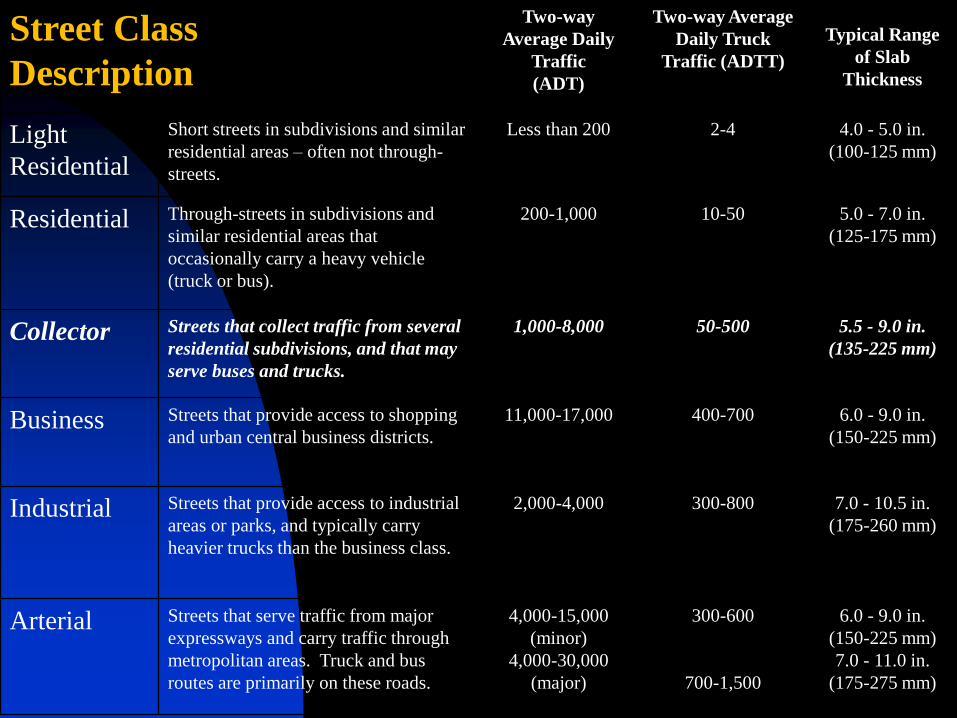
Street Class
Description
Two-way
Average Daily
Traffic
(ADT)
Two-way Average
Daily Truck
Traffic (ADTT)
Typical Range
of Slab
Thickness
Light
Residential
Short streets in subdivisions and similar
residential areas – often not through-
streets.
Less than 200 2-4 4.0 - 5.0 in.
(100-125 mm)
Residential Through-streets in subdivisions and
similar residential areas that
occasionally carry a heavy vehicle
(truck or bus).
200-1,000 10-50 5.0 - 7.0 in.
(125-175 mm)
Collector Streets that collect traffic from several
residential subdivisions, and that may
serve buses and trucks.
1,000-8,000 50-500 5.5 - 9.0 in.
(135-225 mm)
Business Streets that provide access to shopping
and urban central business districts.
11,000-17,000 400-700 6.0 - 9.0 in.
(150-225 mm)
Industrial Streets that provide access to industrial
areas or parks, and typically carry
heavier trucks than the business class.
2,000-4,000 300-800 7.0 - 10.5 in.
(175-260 mm)
Arterial Streets that serve traffic from major
expressways and carry traffic through
metropolitan areas. Truck and bus
routes are primarily on these roads.
4,000-15,000
(minor)
4,000-30,000
(major)
300-600
700-1,500
6.0 - 9.0 in.
(150-225 mm)
7.0 - 11.0 in.
(175-275 mm)
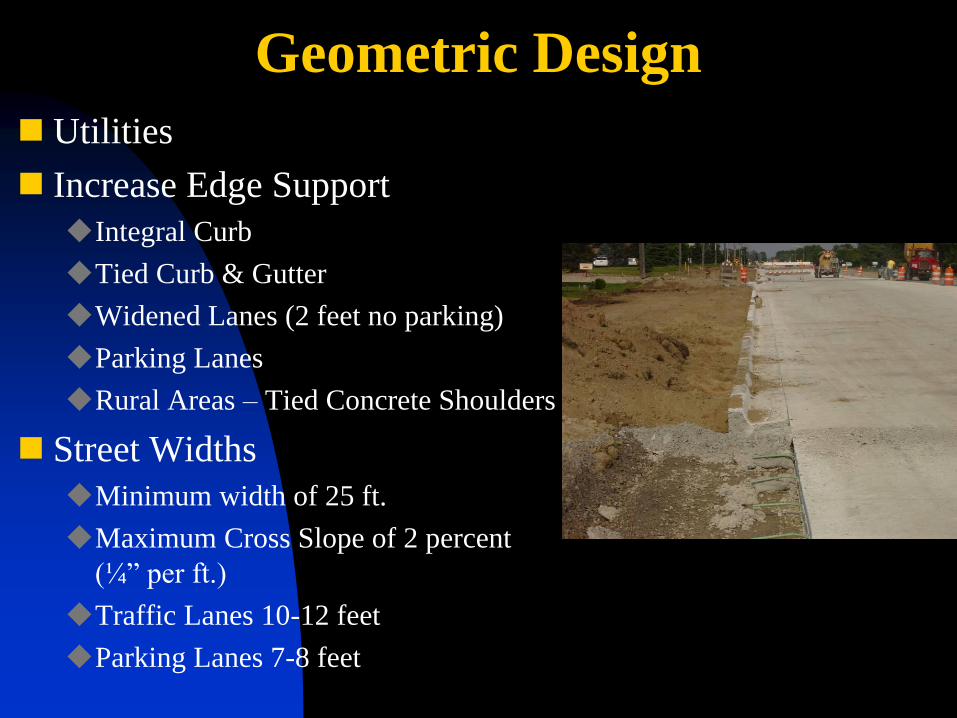
Geometric Design
Utilities
Increase Edge Support
Integral Curb
Tied Curb & Gutter
Widened Lanes (2 feet no parking)
Parking Lanes
Rural Areas – Tied Concrete Shoulders
Street Widths
Minimum width of 25 ft.
Maximum Cross Slope of 2 percent
(¼” per ft.)
Traffic Lanes 10-12 feet
Parking Lanes 7-8 feet
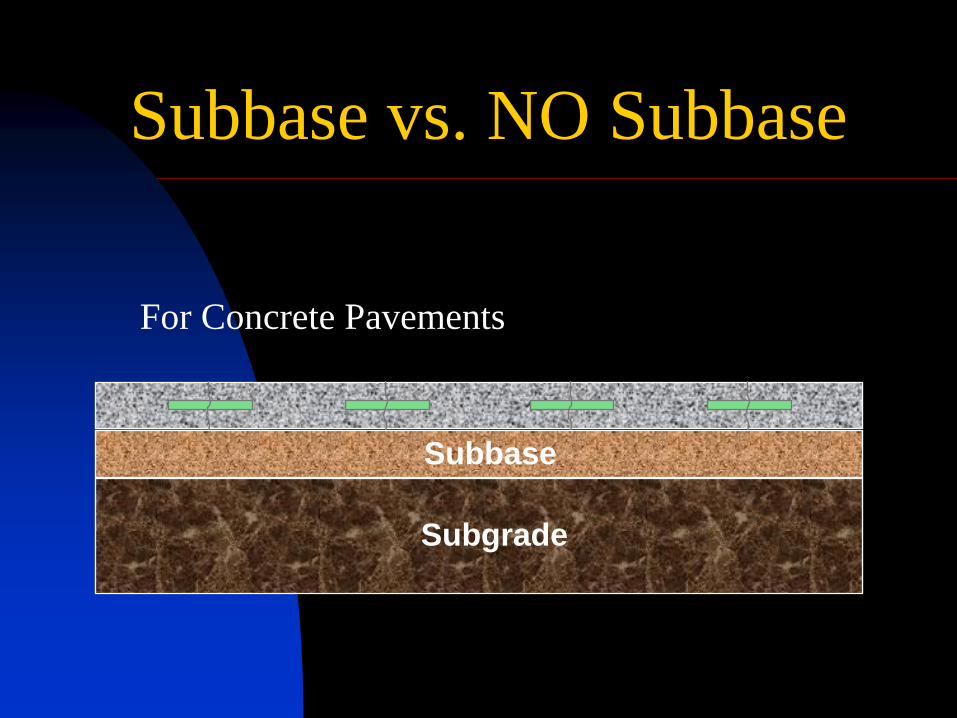
Subbase vs. NO Subbase
For Concrete Pavements
Subbase
Subgrade
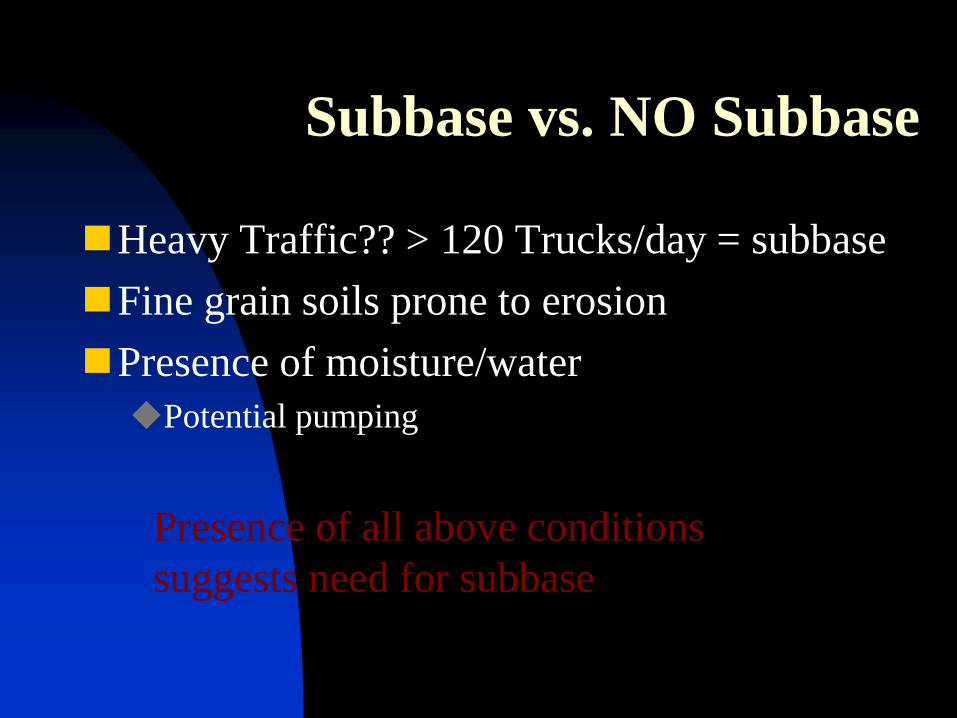
Subbase vs. NO Subbase
Heavy Traffic?? > 120 Trucks/day = subbase
Fine grain soils prone to erosion
Presence of moisture/water
Potential pumping
Presence of all above conditions
suggests need for subbase
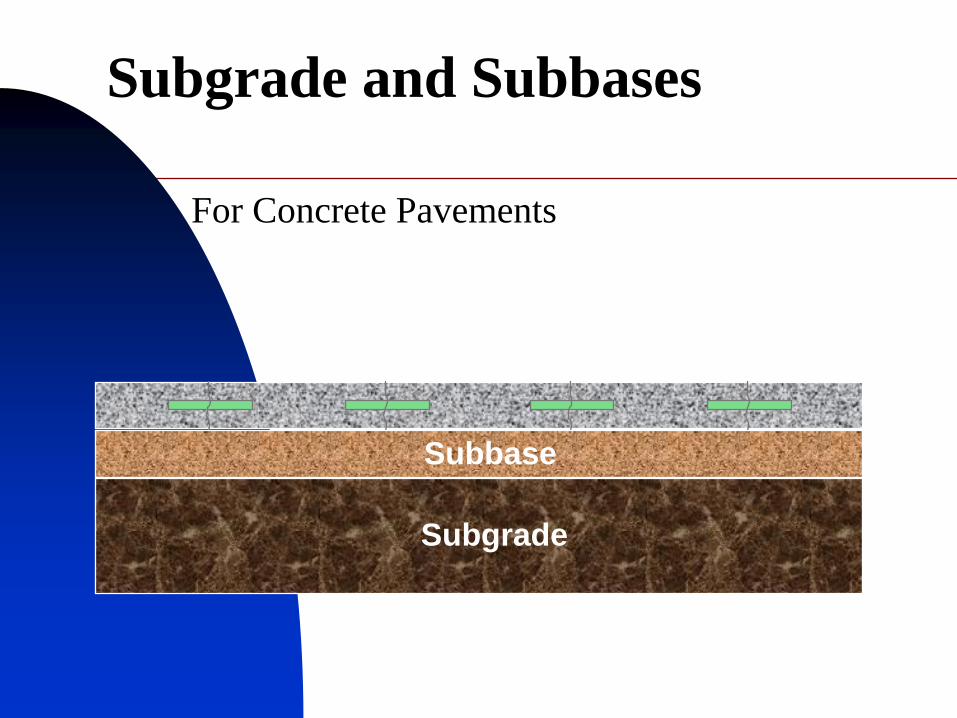
Subgrade and Subbases
For Concrete Pavements
Subbase
Subgrade
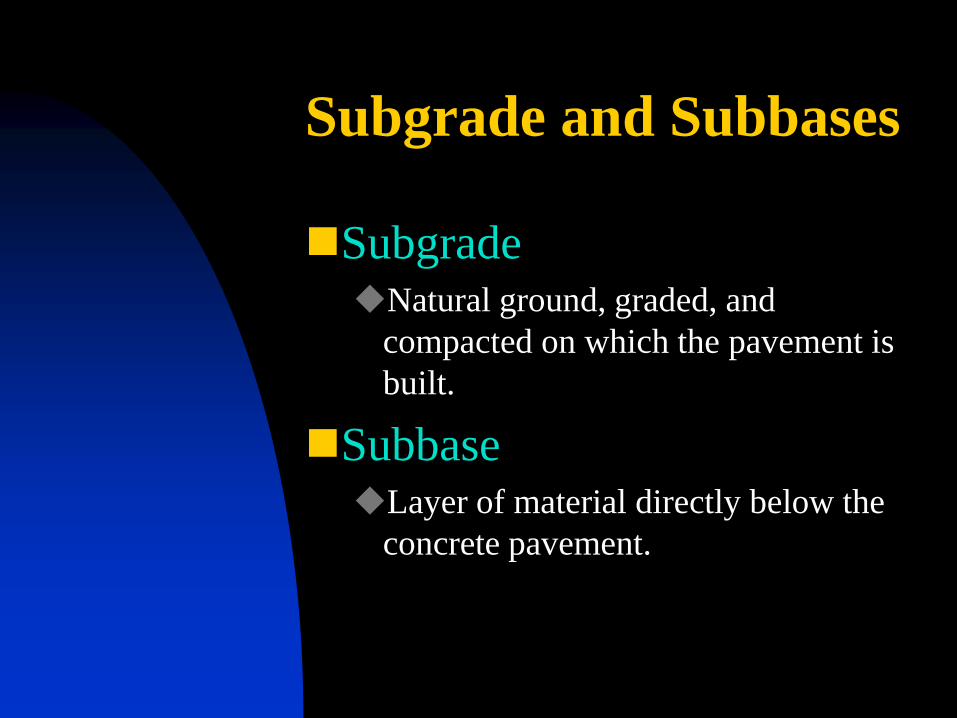
Subgrade and Subbases
Subgrade Natural ground, graded, and
compacted on which the pavement is
built.
Subbase Layer of material directly below the
concrete pavement.
UNIFORMITY:
The Key To
GOOD
PAVEMENT
PERFORMANCE
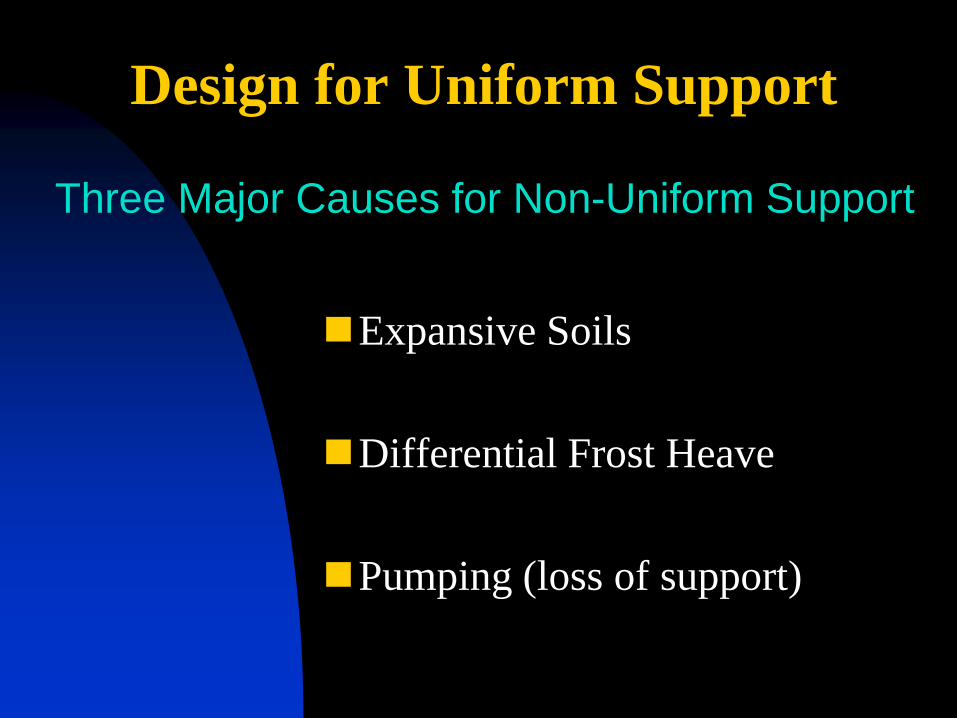
Design for Uniform Support
Expansive Soils
Differential Frost Heave
Pumping (loss of support)
Three Major Causes for Non-Uniform Support
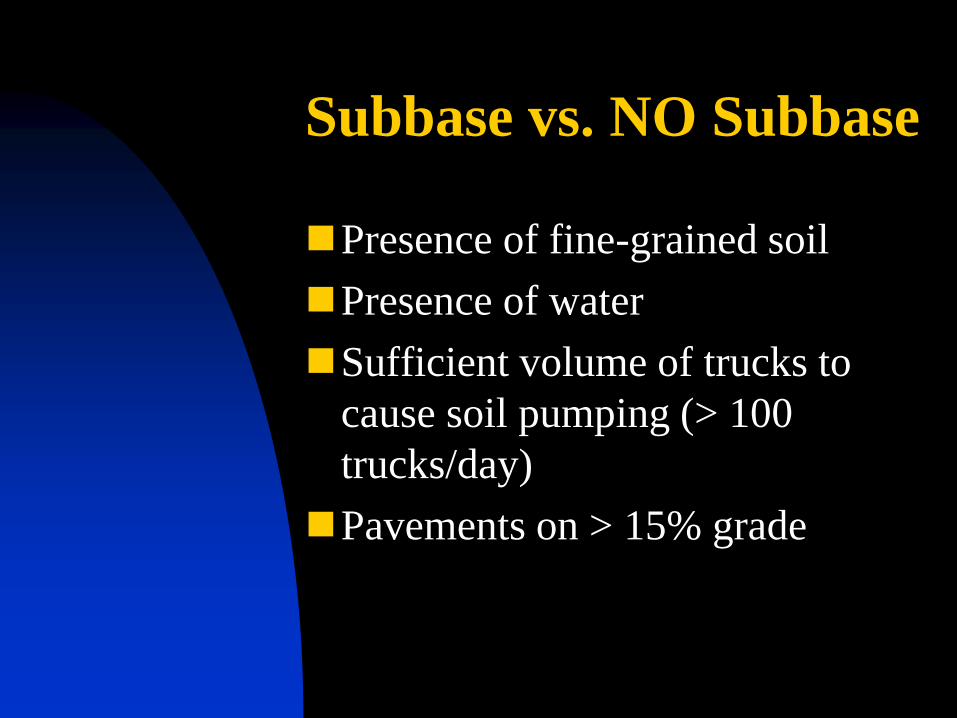
Subbase vs. NO Subbase
Presence of fine-grained soil
Presence of water
Sufficient volume of trucks to
cause soil pumping (> 100
trucks/day)
Pavements on > 15% grade
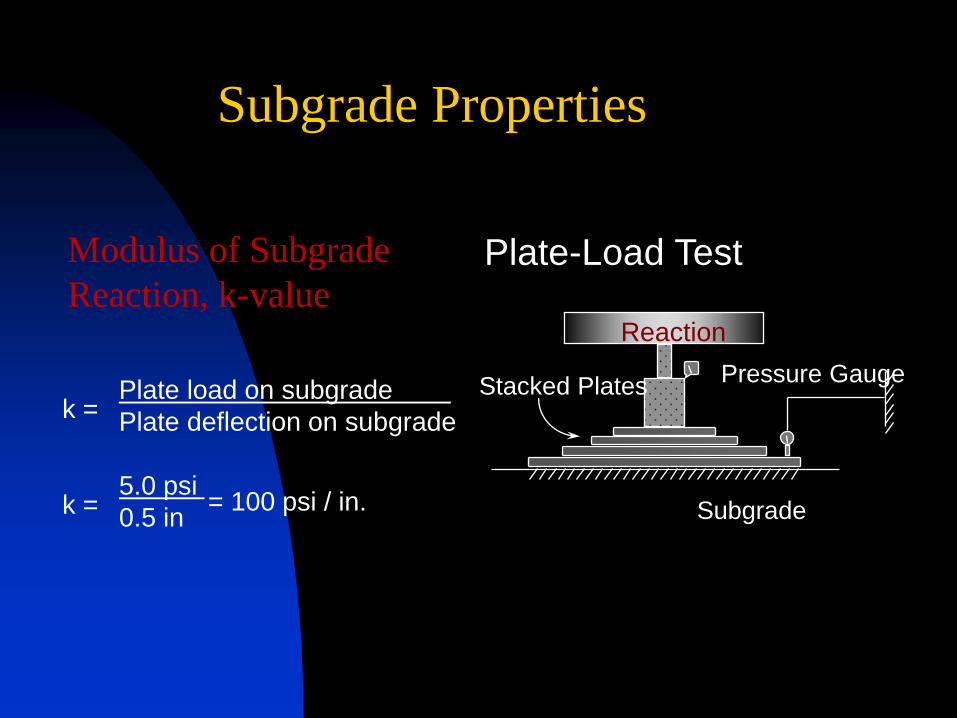
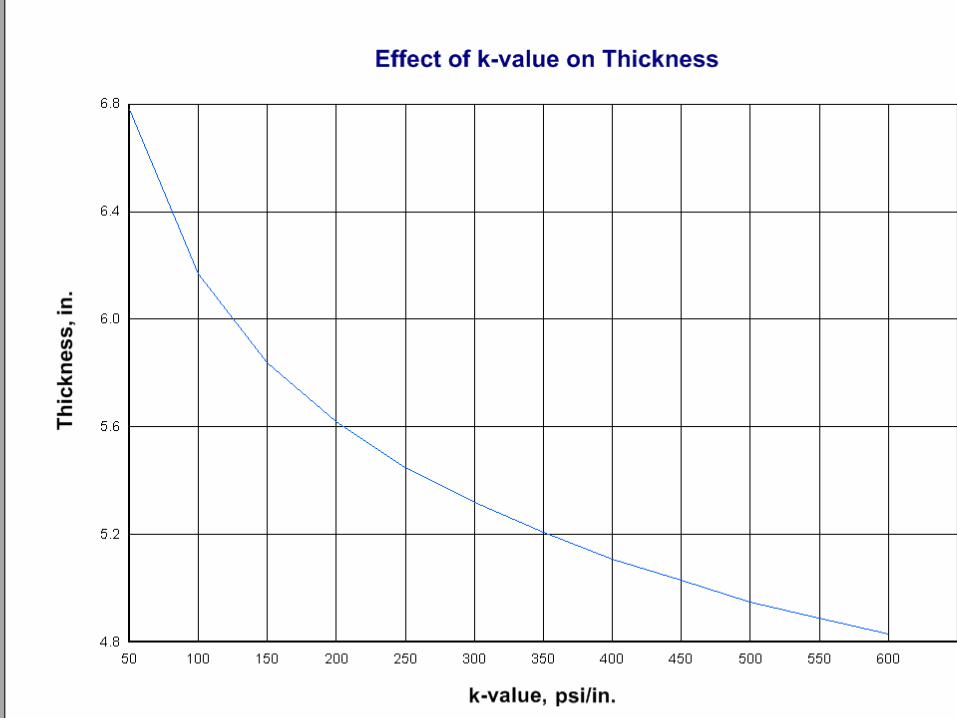
Subgrade Properties
Modulus of Subgrade
Reaction, k-value
Plate load on subgrade
Plate deflection on subgrade k =
5.0 psi
0.5 in k = = 100 psi / in.
Reaction
Stacked Plates Pressure Gauge
Subgrade
Plate-Load Test
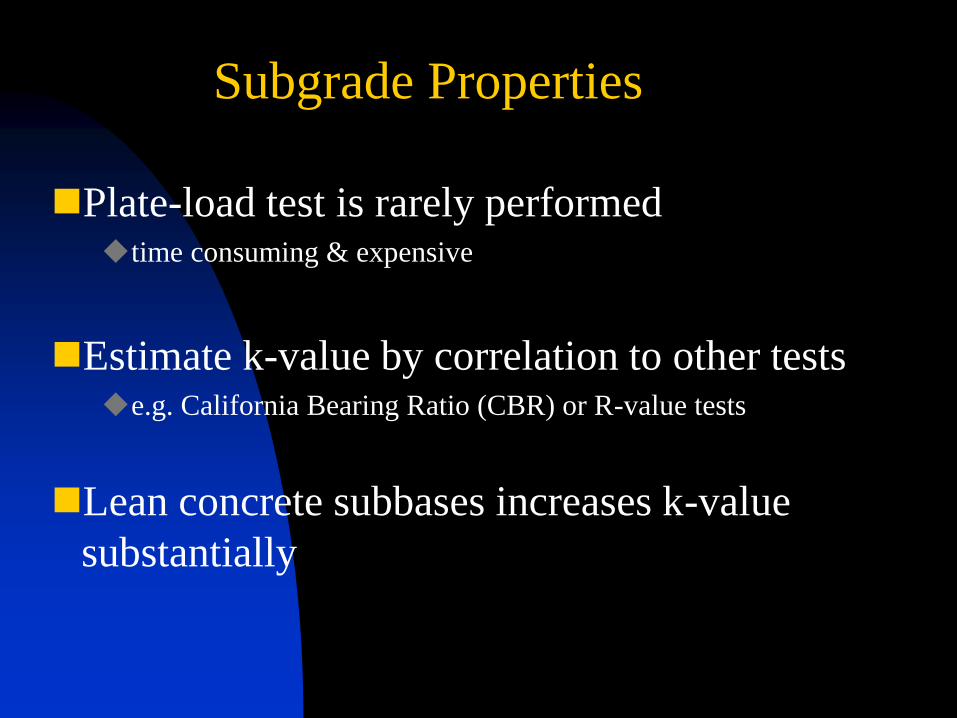
Subgrade Properties
Plate-load test is rarely performed time consuming & expensive
Estimate k-value by correlation to other tests e.g. California Bearing Ratio (CBR) or R-value tests
Lean concrete subbases increases k-value
substantially
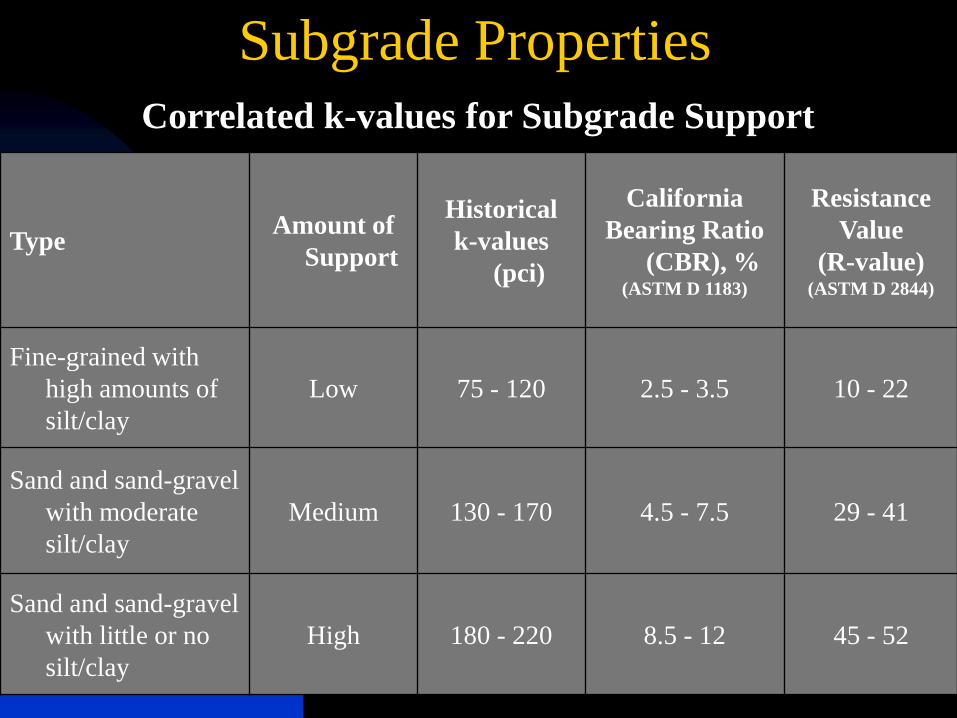
Subgrade Properties
Type Amount of
Support
Historical
k-values
(pci)
California
Bearing Ratio
(CBR), % (ASTM D 1183)
Resistance
Value
(R-value) (ASTM D 2844)
Fine-grained with
high amounts of
silt/clay
Low 75 - 120 2.5 - 3.5 10 - 22
Sand and sand-gravel
with moderate
silt/clay
Medium 130 - 170 4.5 - 7.5 29 - 41
Sand and sand-gravel
with little or no
silt/clay
High 180 - 220 8.5 - 12 45 - 52
Correlated k-values for Subgrade Support
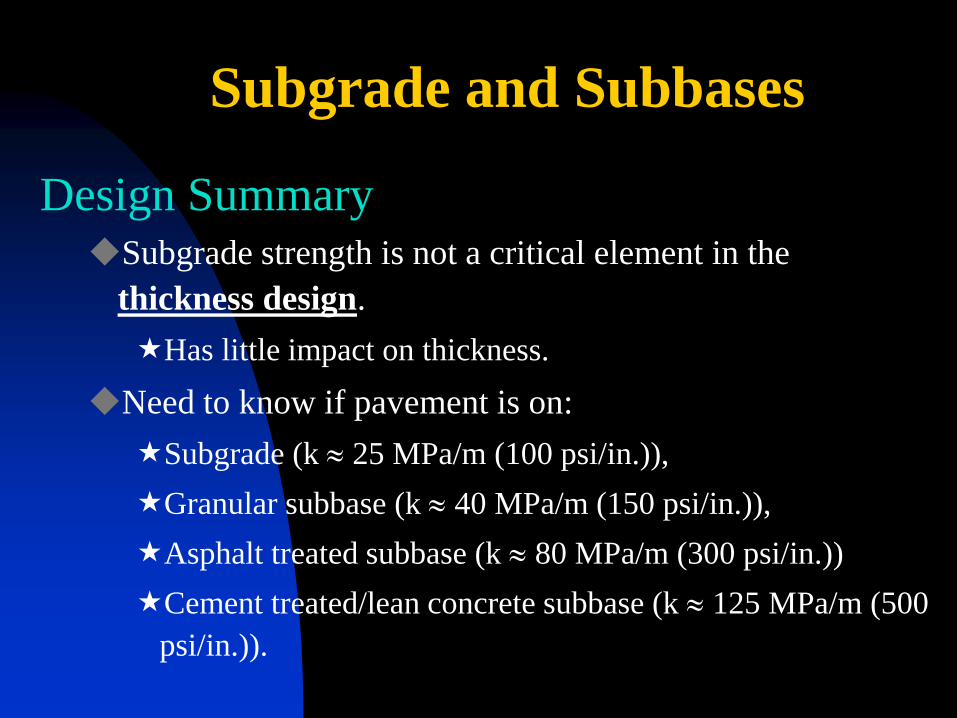
Subgrade and Subbases
Design Summary Subgrade strength is not a critical element in the
thickness design.
Has little impact on thickness.
Need to know if pavement is on:
Subgrade (k 25 MPa/m (100 psi/in.)),
Granular subbase (k 40 MPa/m (150 psi/in.)),
Asphalt treated subbase (k 80 MPa/m (300 psi/in.))
Cement treated/lean concrete subbase (k 125 MPa/m (500
psi/in.)).
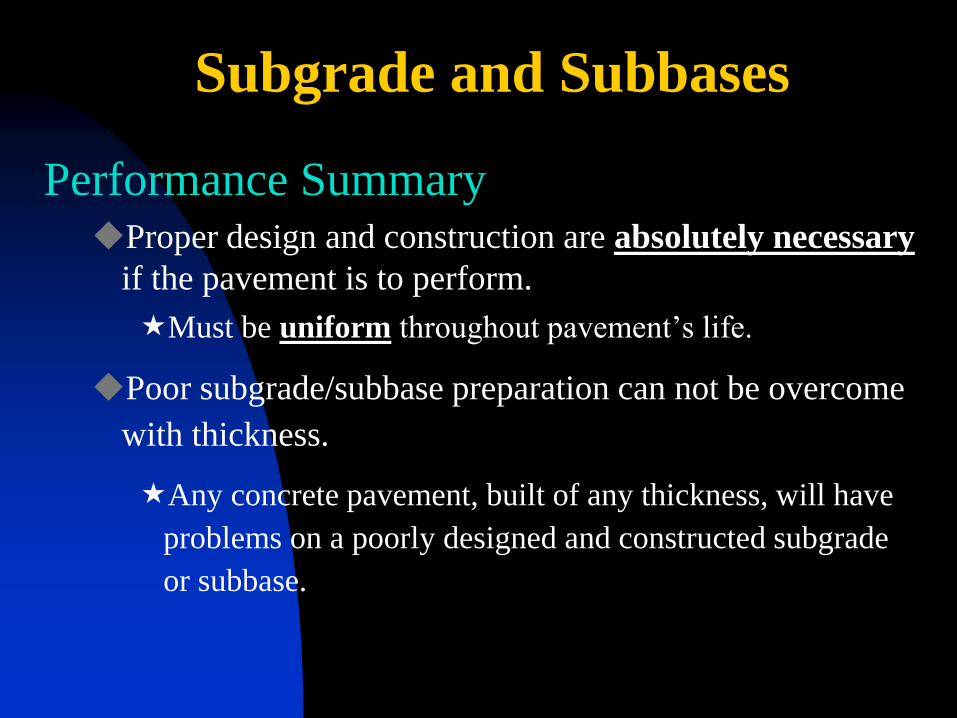
Subgrade and Subbases
Performance Summary Proper design and construction are absolutely necessary
if the pavement is to perform.
Must be uniform throughout pavement’s life.
Poor subgrade/subbase preparation can not be overcome
with thickness.
Any concrete pavement, built of any thickness, will have
problems on a poorly designed and constructed subgrade
or subbase.
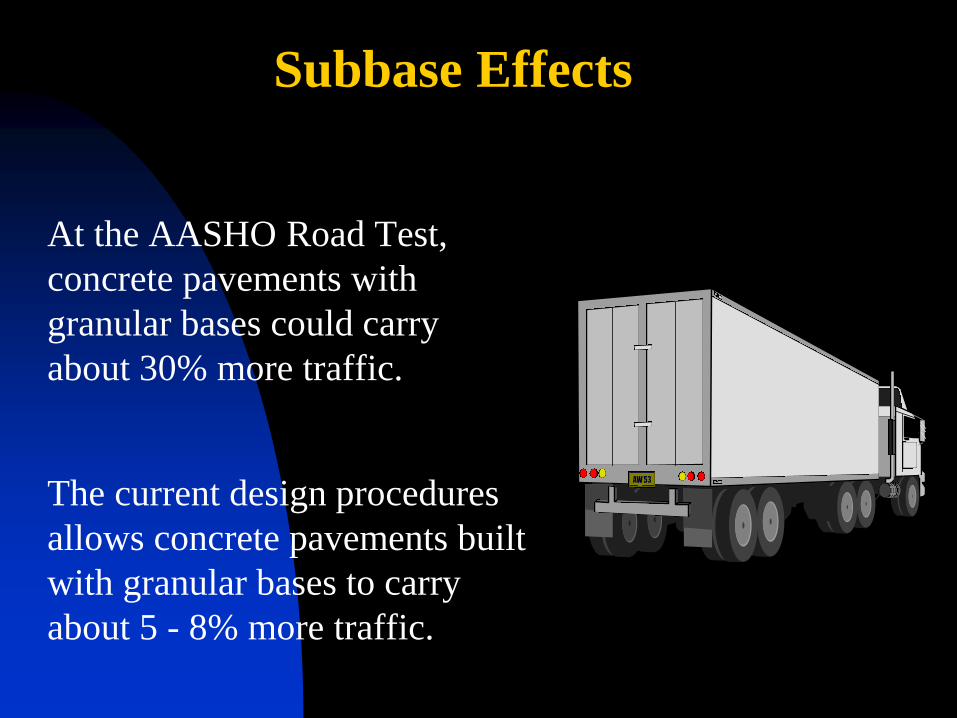
Subbase Effects
At the AASHO Road Test,
concrete pavements with
granular bases could carry
about 30% more traffic.
The current design procedures
allows concrete pavements built
with granular bases to carry
about 5 - 8% more traffic.
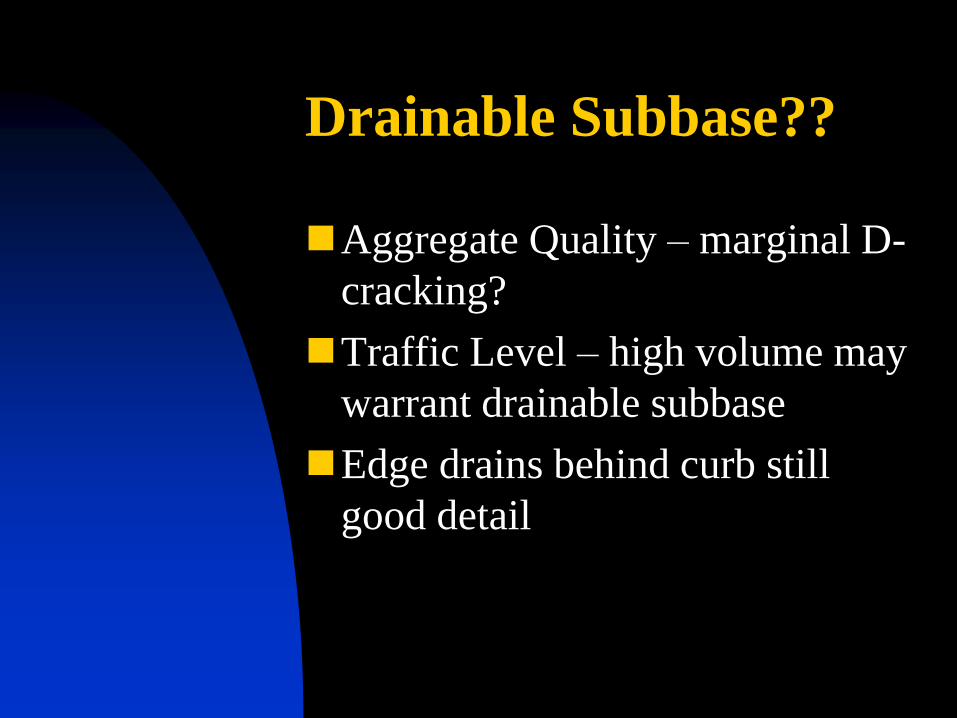
Drainable Subbase??
Aggregate Quality – marginal D-
cracking?
Traffic Level – high volume may
warrant drainable subbase
Edge drains behind curb still
good detail
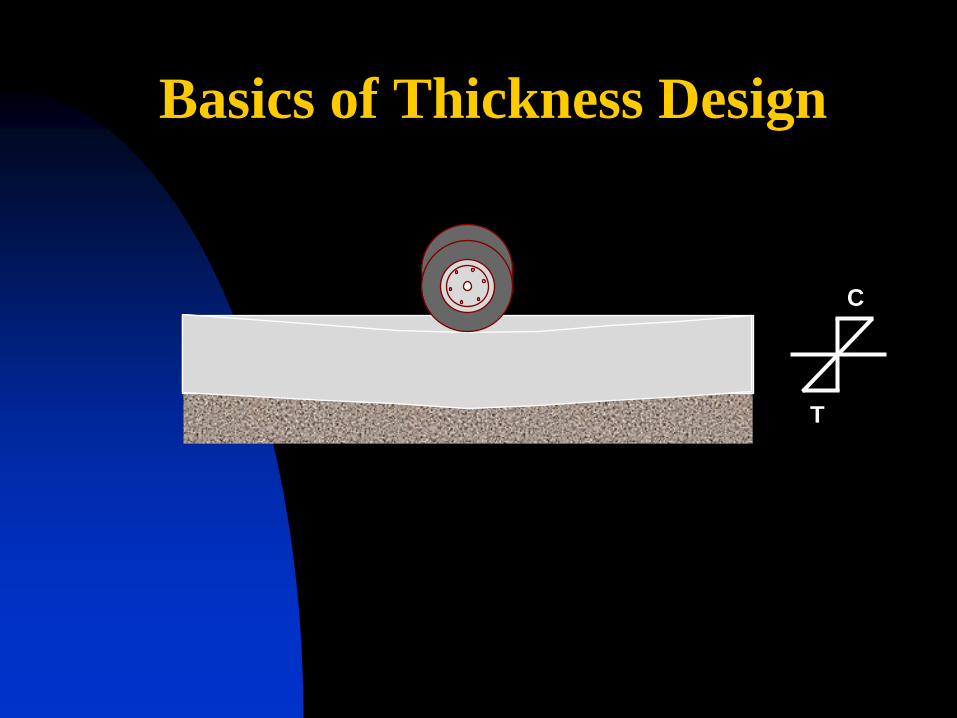
Basics of Thickness Design
T
C
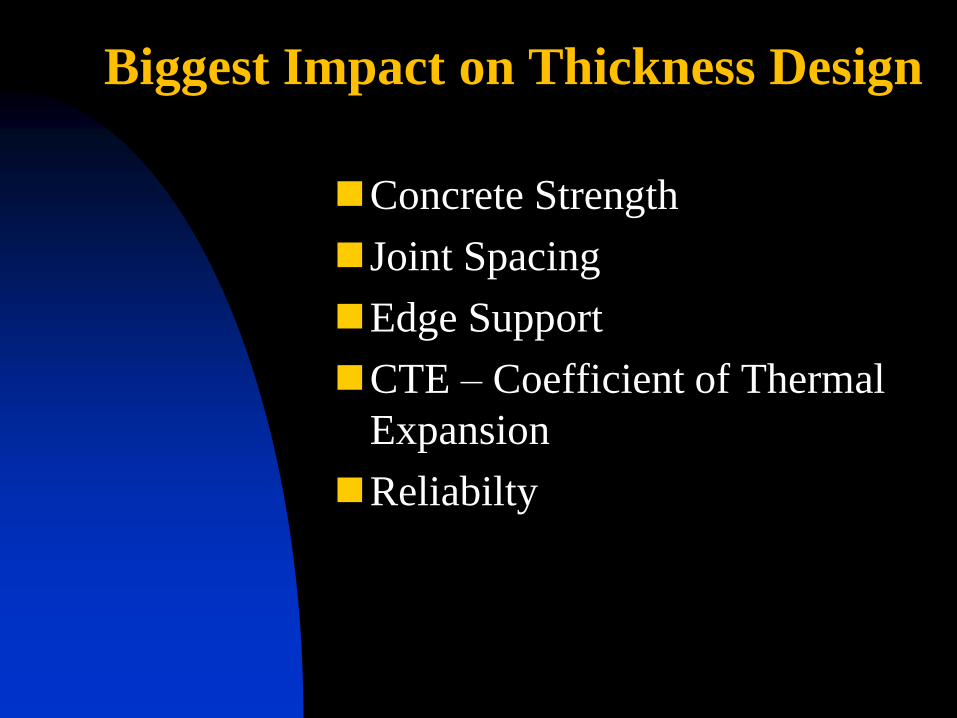
Biggest Impact on Thickness Design
Concrete Strength
Joint Spacing
Edge Support
CTE – Coefficient of Thermal
Expansion
Reliabilty

Design & compare thickness requirements and costs for concrete and asphalt pavements
Features:
Updated mechanistic design method for concrete pavement
Fatigue and erosion analysis
Jointing spacing & load transfer recommendations
Thickness rounding and reliability considerations
Analysis of existing concrete pavements
Life cycle cost analysis module
Printable summary reports and charts
Design summary
Design factor sensitivity & life-cycle plots
User-friendly format and features
Walkthrough Wizard
Help information for all inputs
The latest design and cost analysis tool from ACPA…
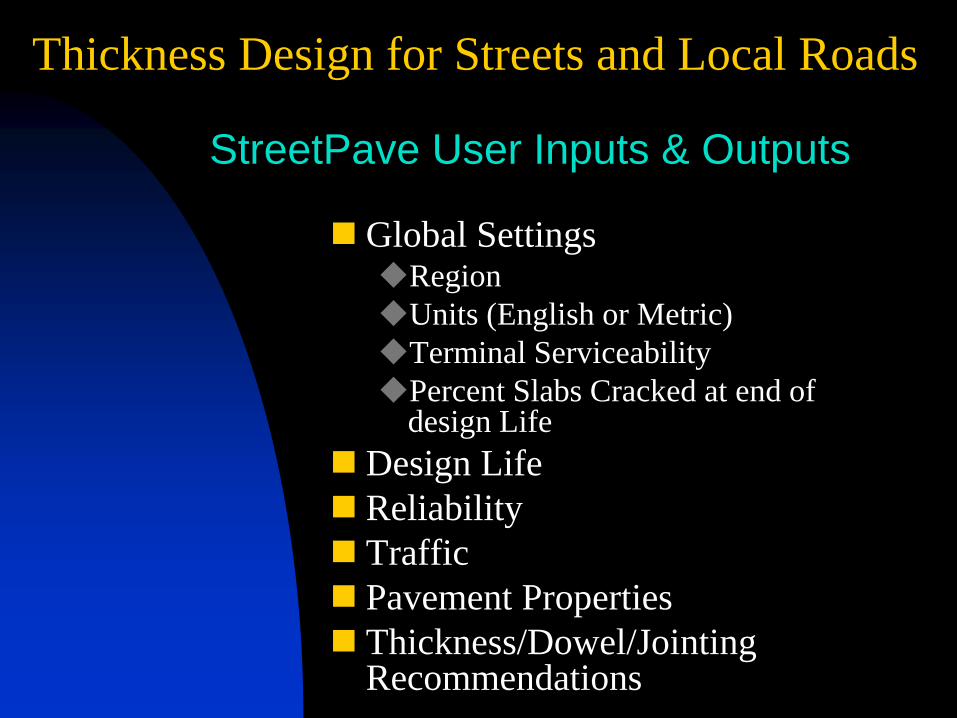
Thickness Design for Streets and Local Roads
Global Settings Region
Units (English or Metric)
Terminal Serviceability
Percent Slabs Cracked at end of design Life
Design Life
Reliability
Traffic
Pavement Properties
Thickness/Dowel/Jointing Recommendations
StreetPave User Inputs & Outputs
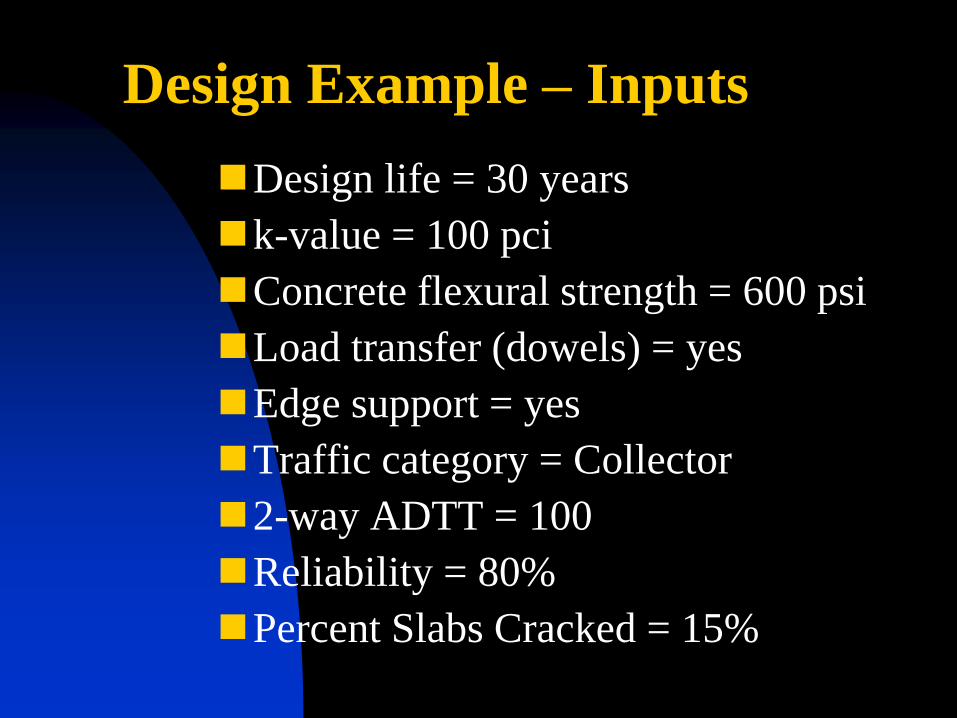
Design Example – Inputs
Design life = 30 years
k-value = 100 pci
Concrete flexural strength = 600 psi
Load transfer (dowels) = yes
Edge support = yes
Traffic category = Collector
2-way ADTT = 100
Reliability = 80%
Percent Slabs Cracked = 15%
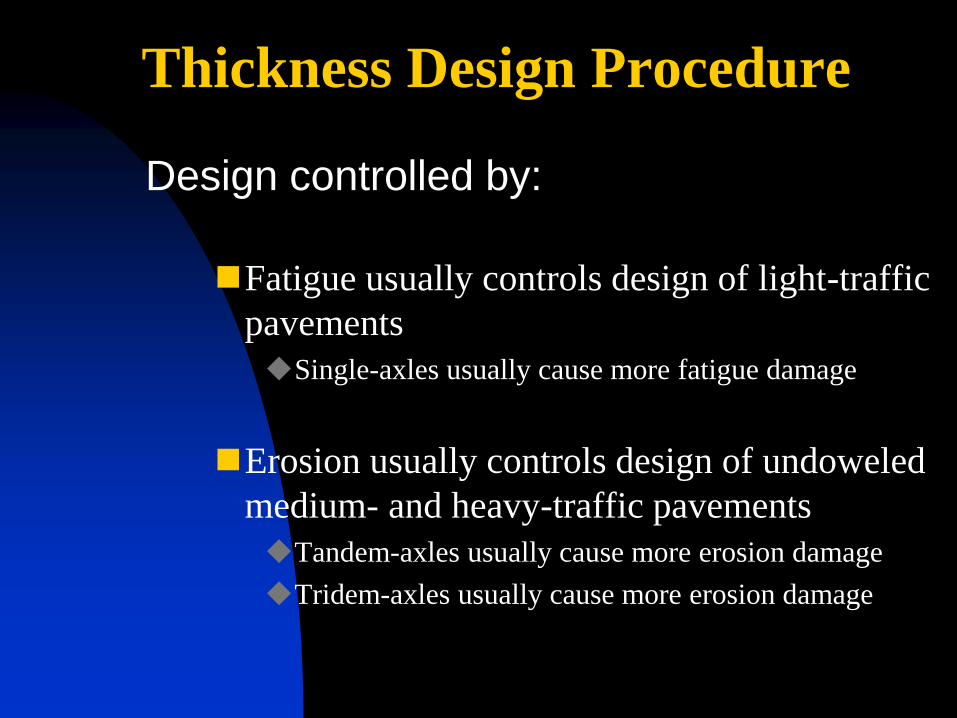
Thickness Design Procedure
Fatigue usually controls design of light-traffic
pavements
Single-axles usually cause more fatigue damage
Erosion usually controls design of undoweled
medium- and heavy-traffic pavements
Tandem-axles usually cause more erosion damage
Tridem-axles usually cause more erosion damage
Design controlled by:
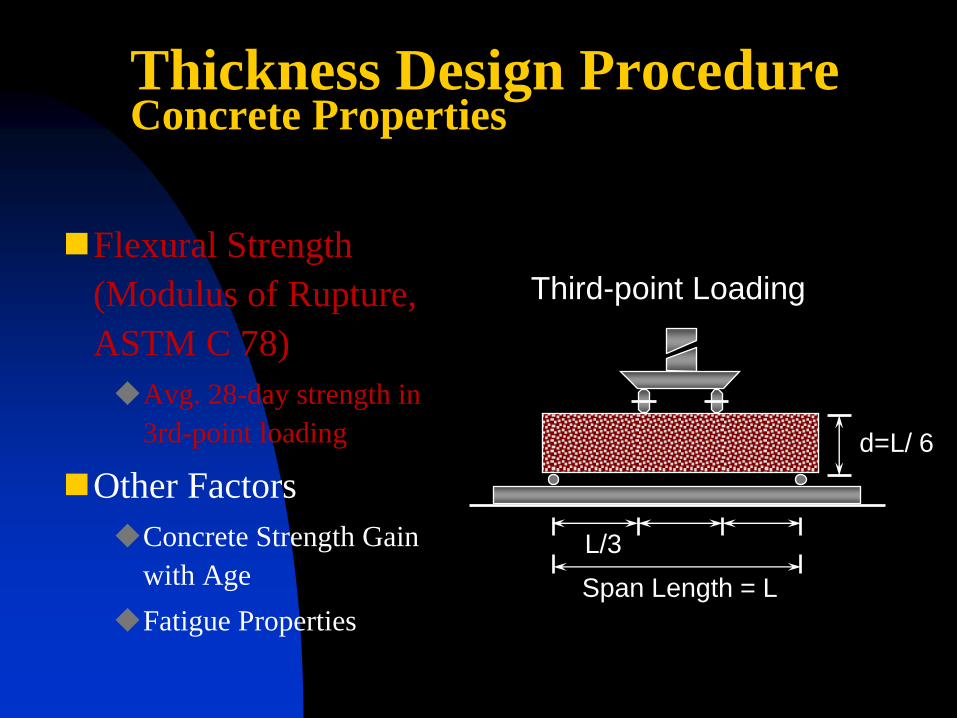
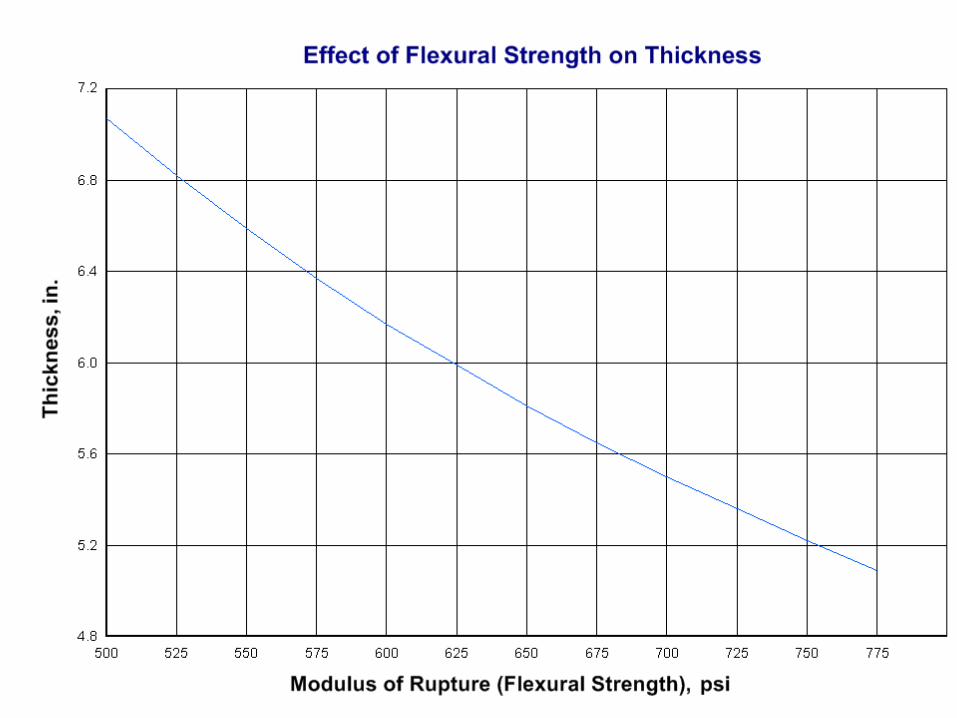
Thickness Design Procedure Concrete Properties
Flexural Strength
(Modulus of Rupture,
ASTM C 78)
Avg. 28-day strength in
3rd-point loading
Other Factors
Concrete Strength Gain
with Age
Fatigue Properties
L/3
Span Length = L
d=L/ 6
Third-point Loading
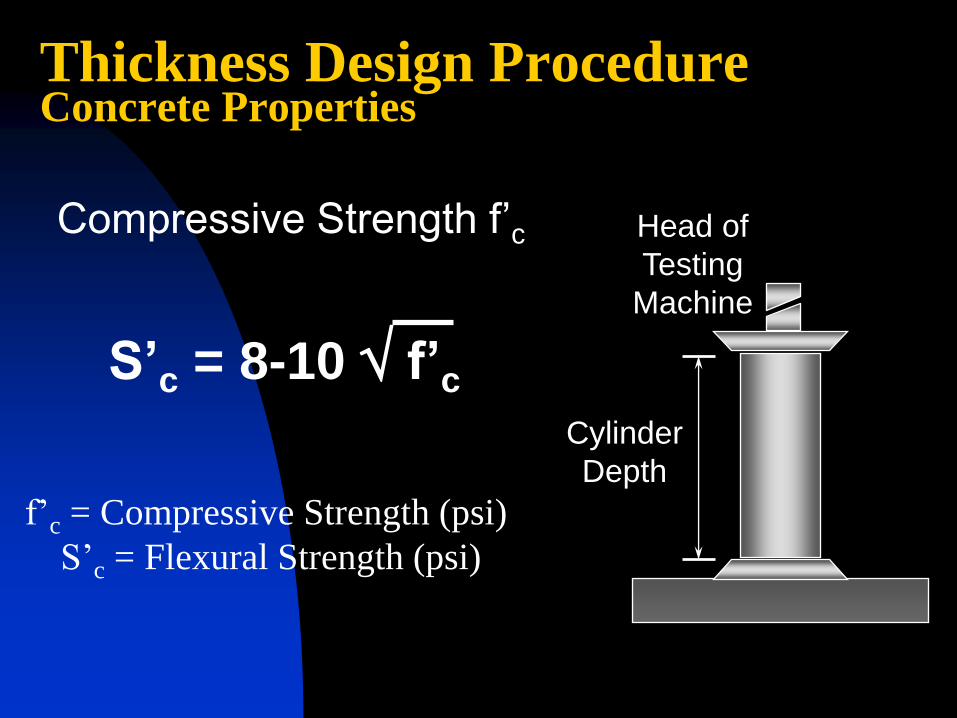
Thickness Design Procedure Concrete Properties
f’c = Compressive Strength (psi)
S’c = Flexural Strength (psi)
S’c = 8-10 f’c
Head of
Testing
Machine
Cylinder
Depth
Compressive Strength f’c
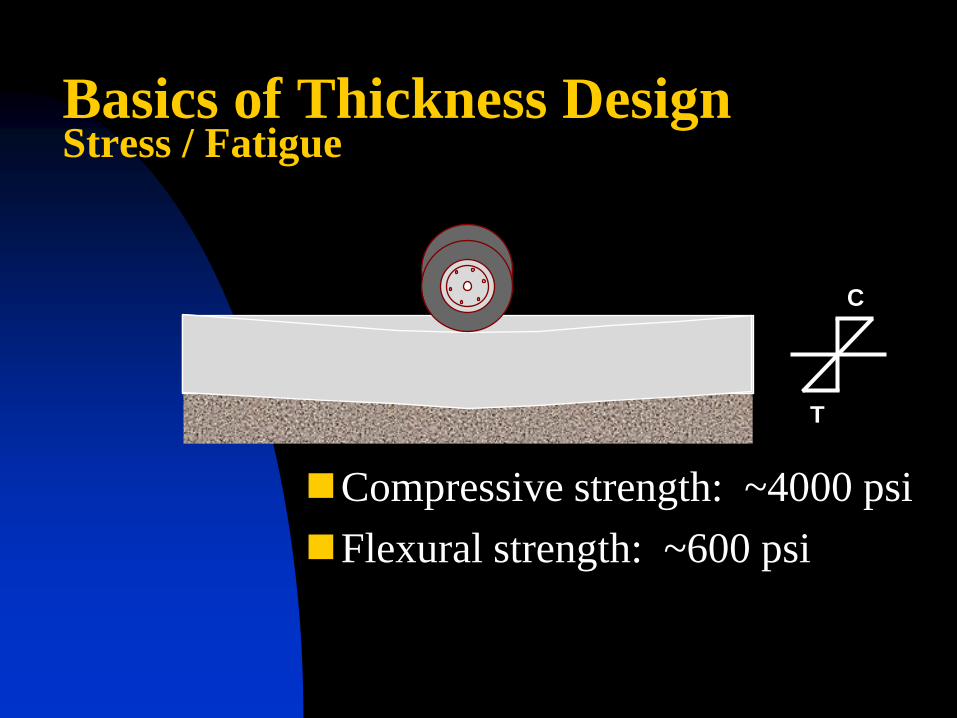
Basics of Thickness Design Stress / Fatigue
Compressive strength: ~4000 psi
Flexural strength: ~600 psi
T
C
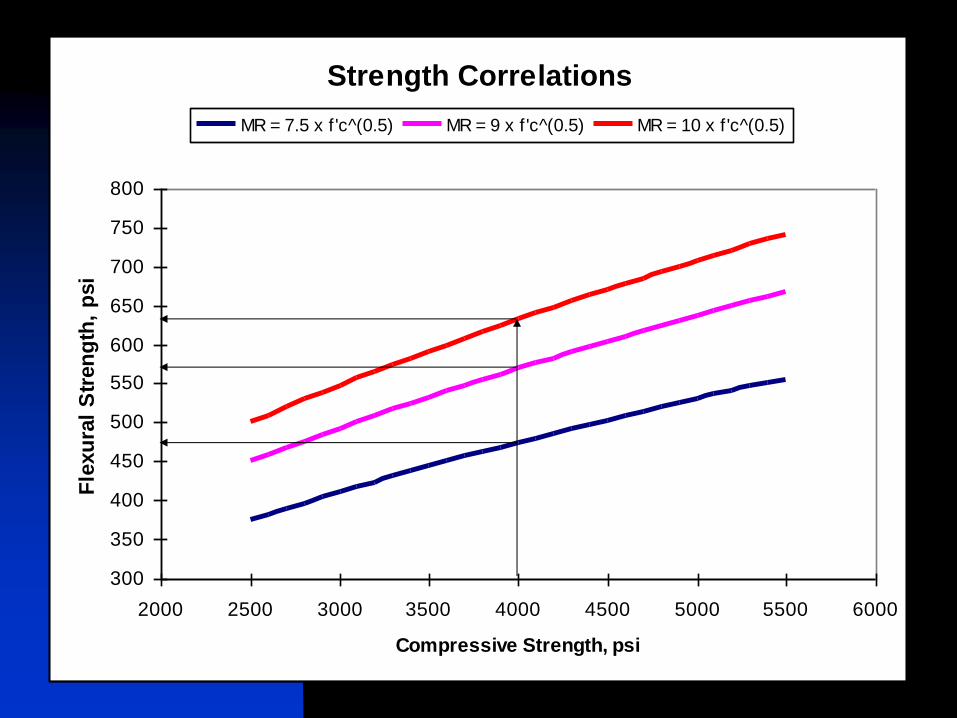
Strength Correlations
300
350
400
450
500
550
600
650
700
750
800
2000 2500 3000 3500 4000 4500 5000 5500 6000
Compressive Strength, psi
Fle
xu
ral
Str
en
gth
, p
si
MR = 7.5 x f 'c^(0.5) MR = 9 x f 'c^(0.5) MR = 10 x f 'c^(0.5)
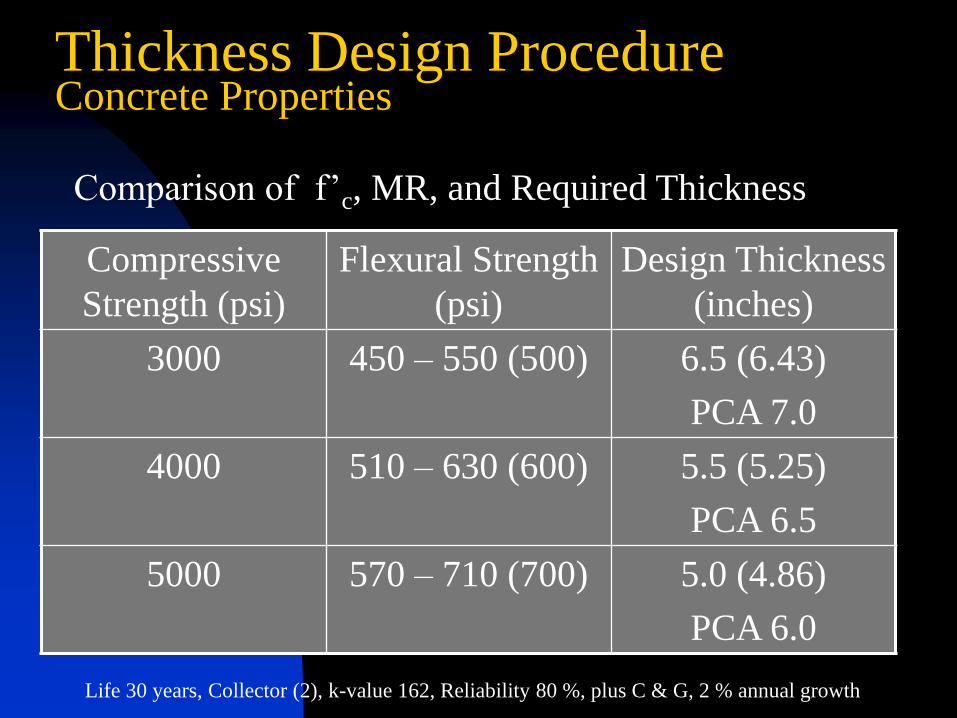
Thickness Design Procedure Concrete Properties
Comparison of f’c, MR, and Required Thickness
Compressive
Strength (psi)
Flexural Strength
(psi)
Design Thickness
(inches)
3000 450 – 550 (500) 6.5 (6.43)
PCA 7.0
4000 510 – 630 (600) 5.5 (5.25)
PCA 6.5
5000 570 – 710 (700) 5.0 (4.86)
PCA 6.0
Life 30 years, Collector (2), k-value 162, Reliability 80 %, plus C & G, 2 % annual growth
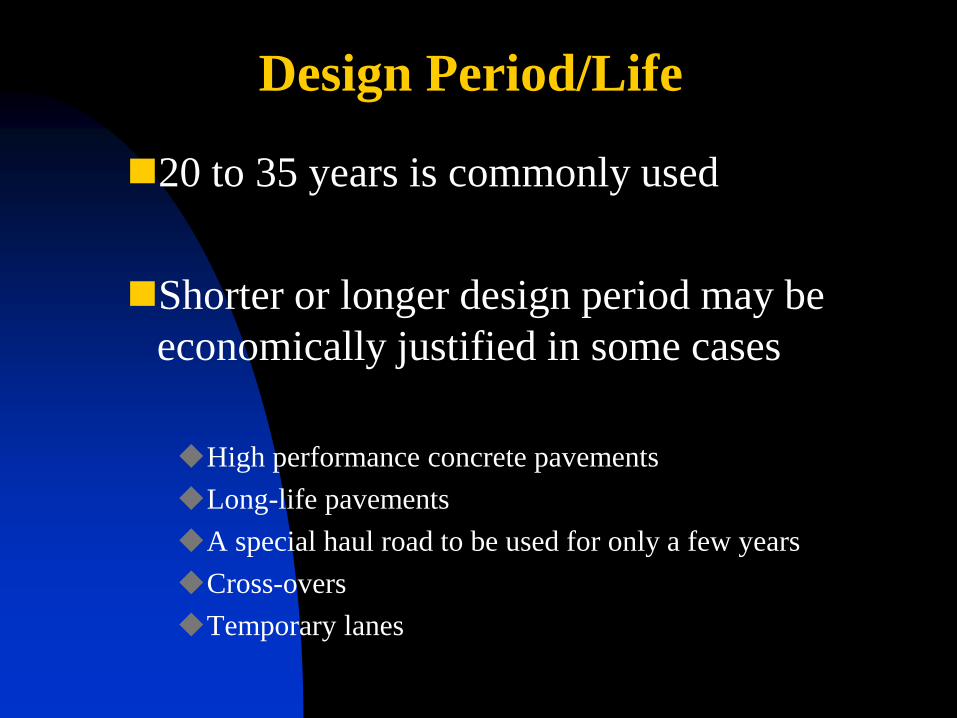
Design Period/Life
20 to 35 years is commonly used
Shorter or longer design period may be
economically justified in some cases
High performance concrete pavements
Long-life pavements
A special haul road to be used for only a few years
Cross-overs
Temporary lanes
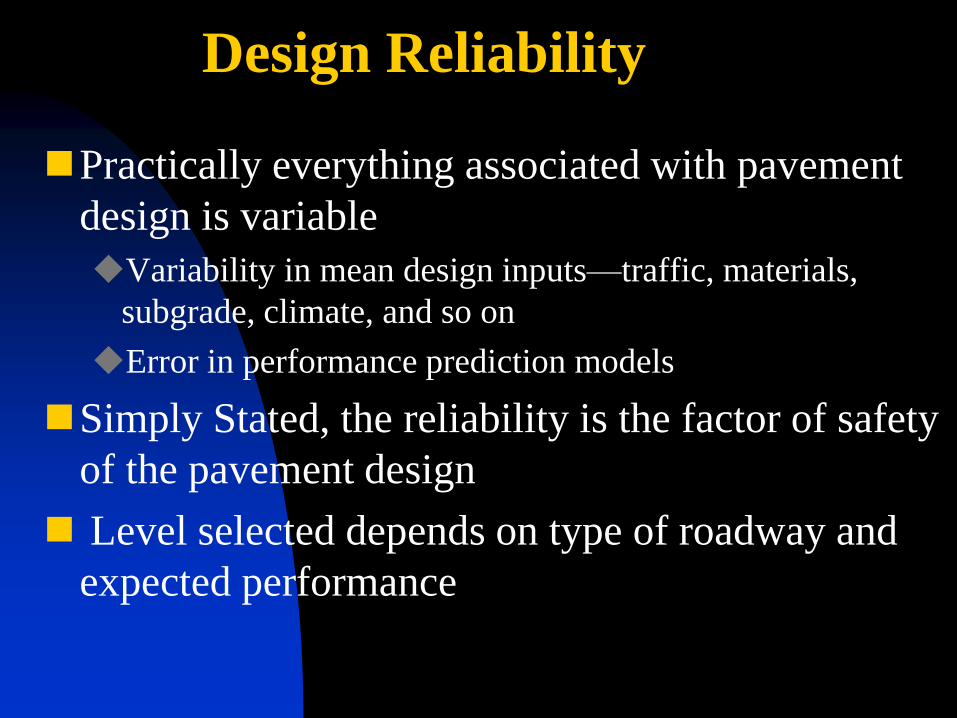
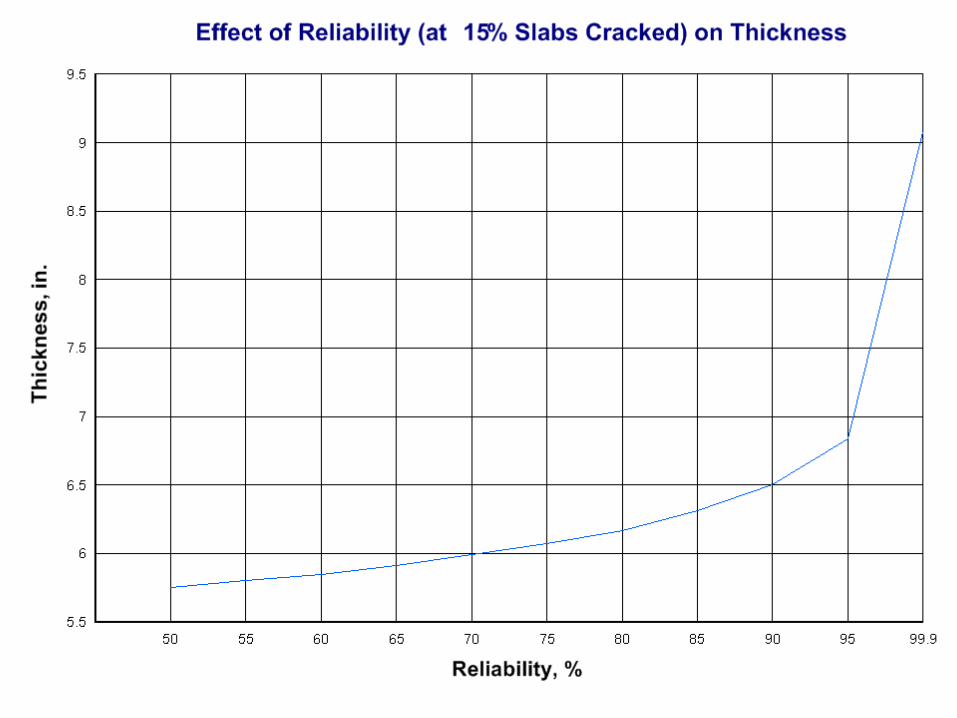
Design Reliability
Practically everything associated with pavement
design is variable
Variability in mean design inputs—traffic, materials,
subgrade, climate, and so on
Error in performance prediction models
Simply Stated, the reliability is the factor of safety
of the pavement design
Level selected depends on type of roadway and
expected performance
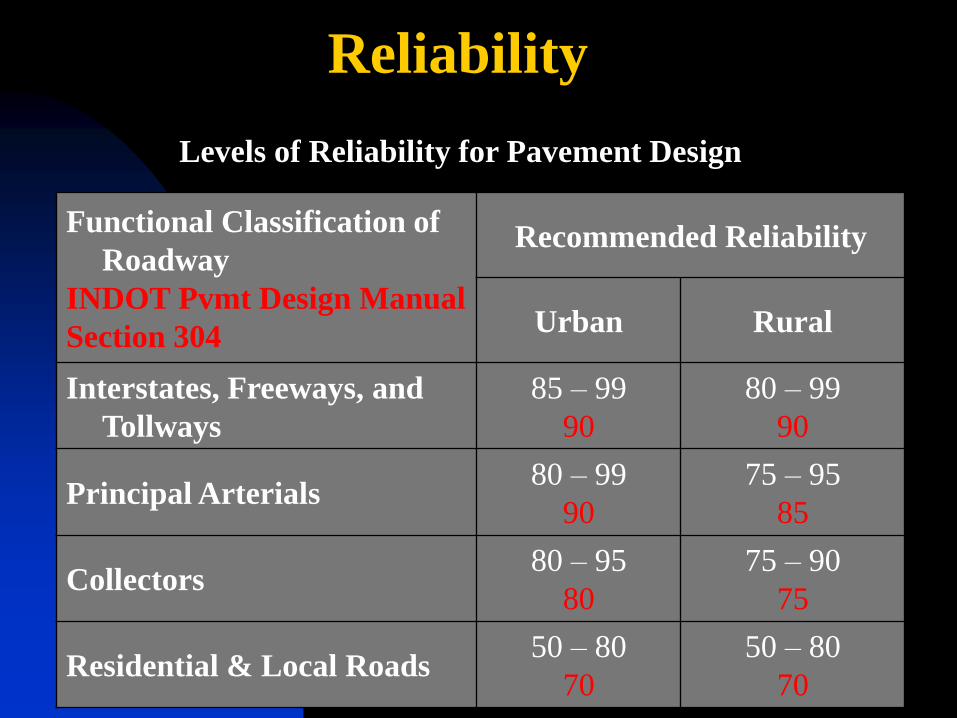
Reliability
Functional Classification of
Roadway
INDOT Pvmt Design Manual
Section 304
Recommended Reliability
Urban Rural
Interstates, Freeways, and
Tollways
85 – 99
90
80 – 99
90
Principal Arterials 80 – 99
90
75 – 95
85
Collectors 80 – 95
80
75 – 90
75
Residential & Local Roads 50 – 80
70
50 – 80
70
Levels of Reliability for Pavement Design
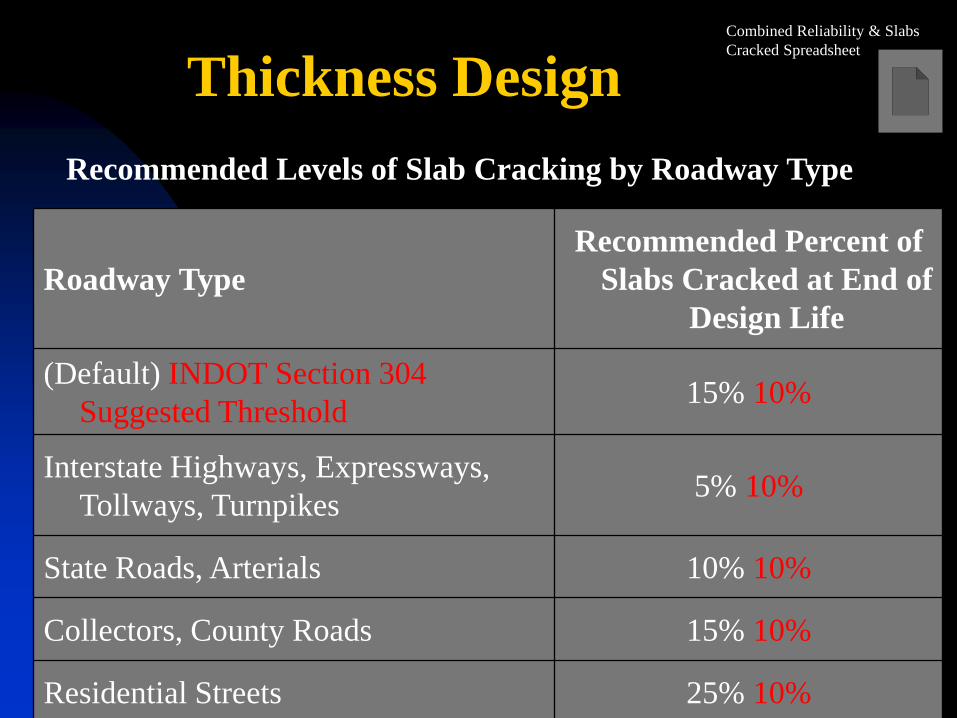
Thickness Design
Roadway Type
Recommended Percent of
Slabs Cracked at End of
Design Life
(Default) INDOT Section 304
Suggested Threshold 15% 10%
Interstate Highways, Expressways,
Tollways, Turnpikes 5% 10%
State Roads, Arterials 10% 10%
Collectors, County Roads 15% 10%
Residential Streets 25% 10%
Recommended Levels of Slab Cracking by Roadway Type
Combined Reliability & Slabs
Cracked Spreadsheet

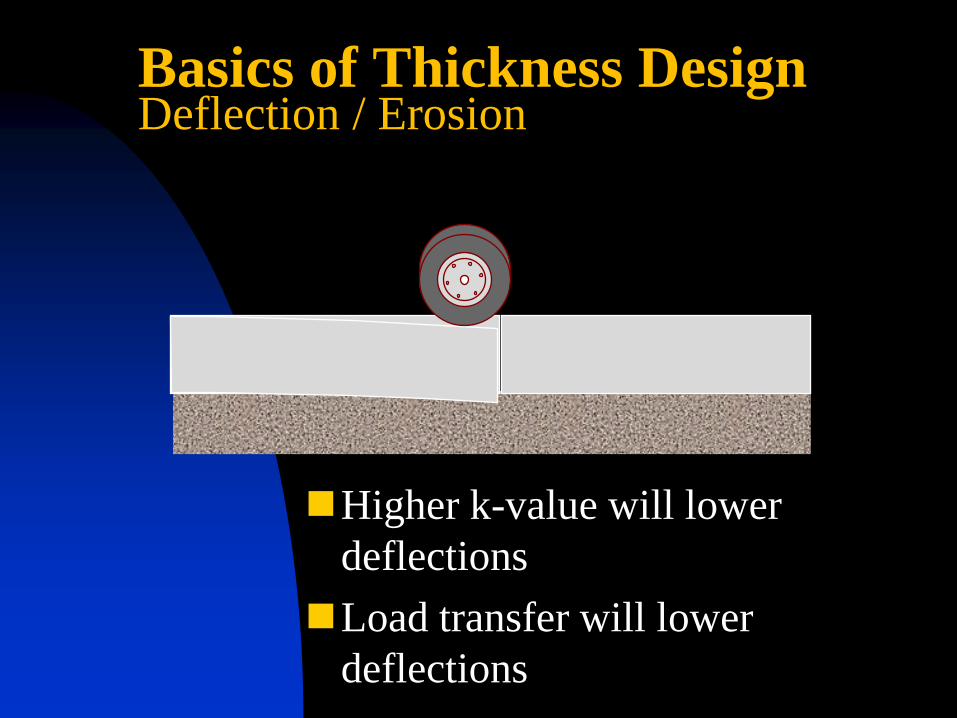
Basics of Thickness Design Deflection / Erosion
Higher k-value will lower
deflections
Load transfer will lower
deflections
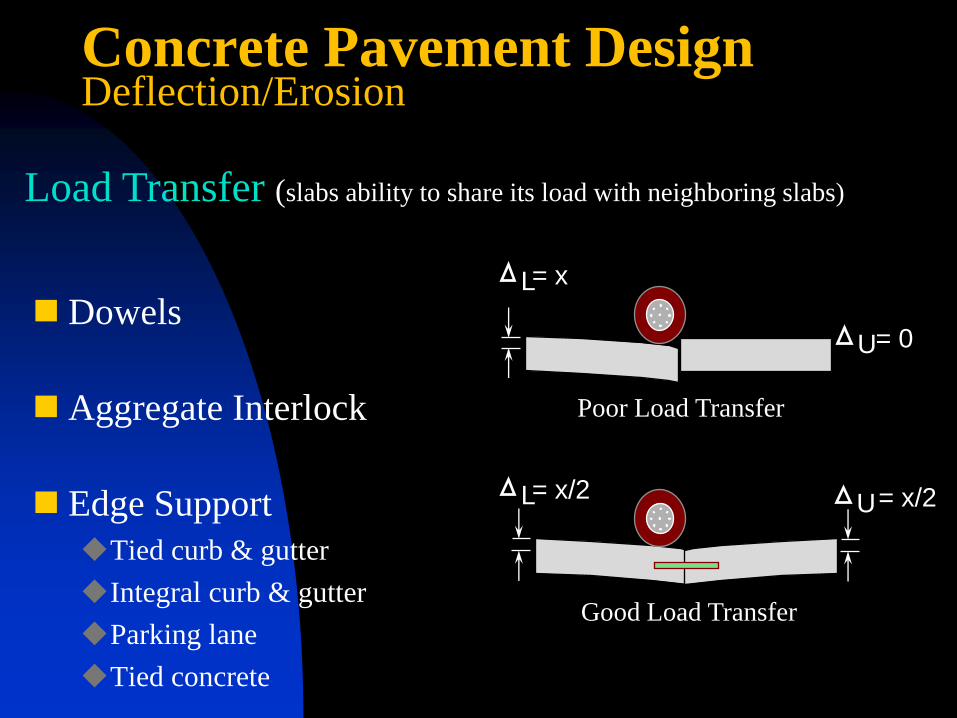
Concrete Pavement Design Deflection/Erosion
Dowels
Aggregate Interlock
Edge Support
Tied curb & gutter
Integral curb & gutter
Parking lane
Tied concrete
L = x
U = 0
Poor Load Transfer
Load Transfer (slabs ability to share its load with neighboring slabs)
Good Load Transfer
L = x/2 U = x/2
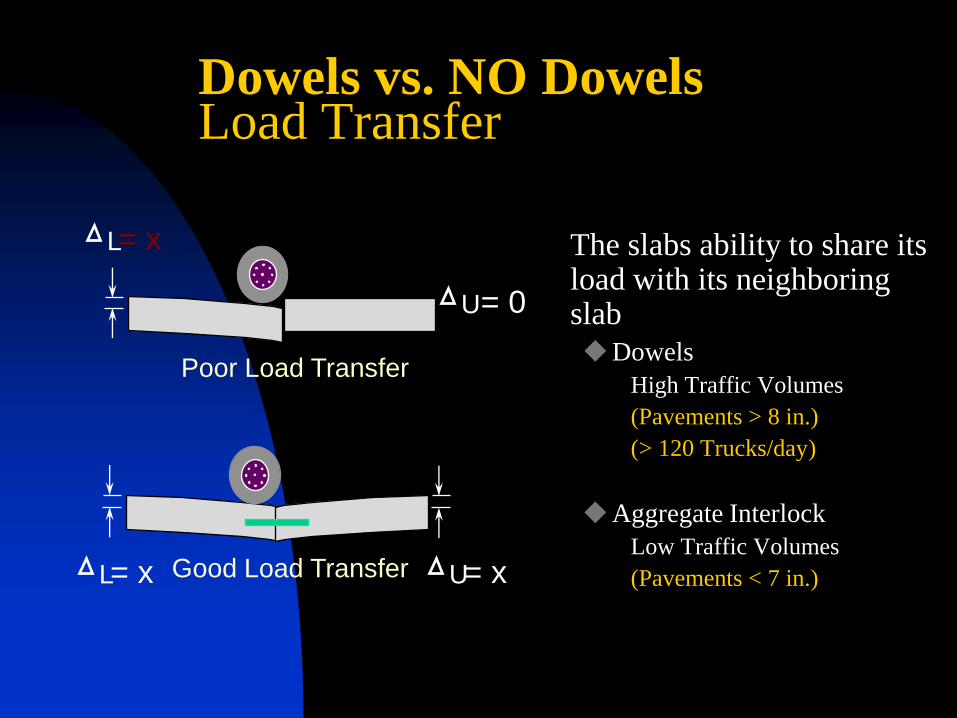
Dowels vs. NO Dowels Load Transfer
The slabs ability to share its load with its neighboring slab
Dowels
High Traffic Volumes
(Pavements > 8 in.)
(> 120 Trucks/day)
Aggregate Interlock
Low Traffic Volumes
(Pavements < 7 in.)
L = x
U = 0
Poor Load Transfer
Good Load Transfer L = x U = x
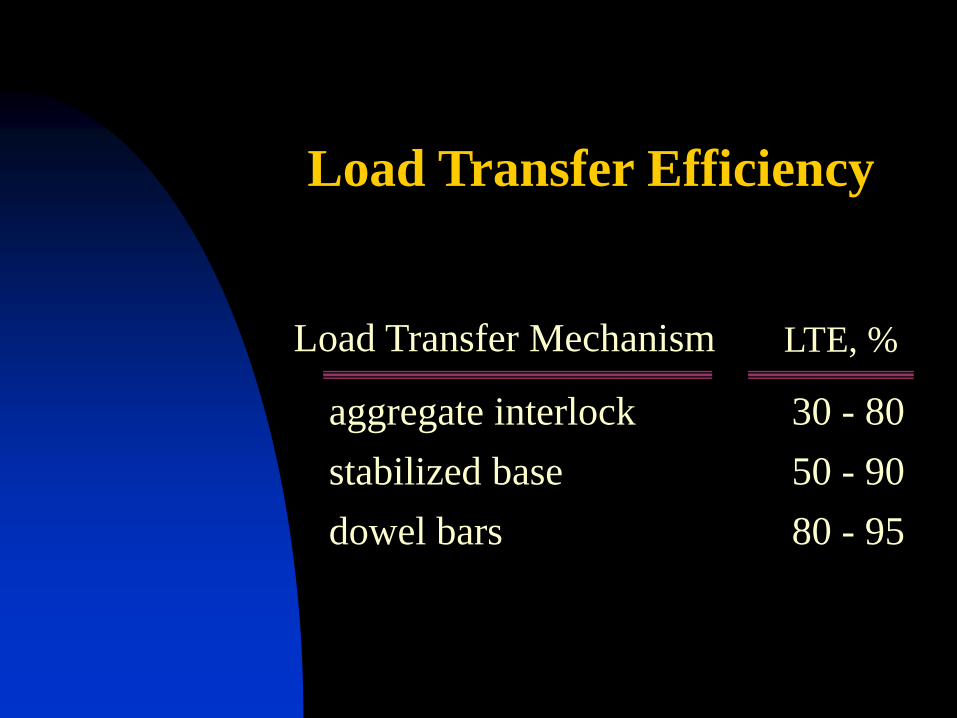
Load Transfer Efficiency
aggregate interlock 30 - 80
stabilized base 50 - 90
dowel bars 80 - 95
LTE, % Load Transfer Mechanism
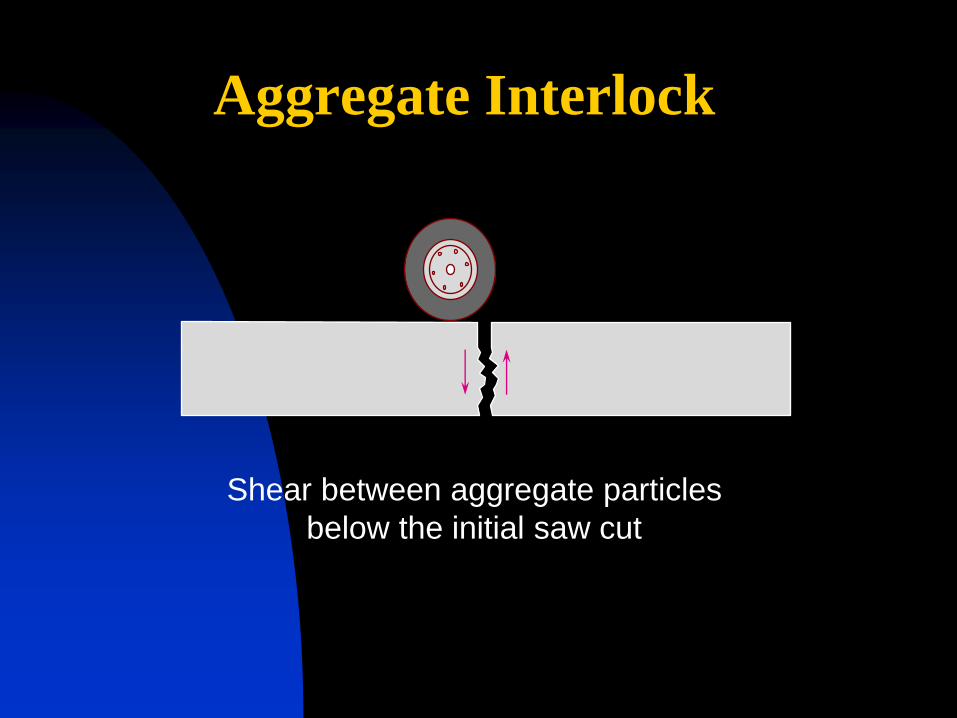
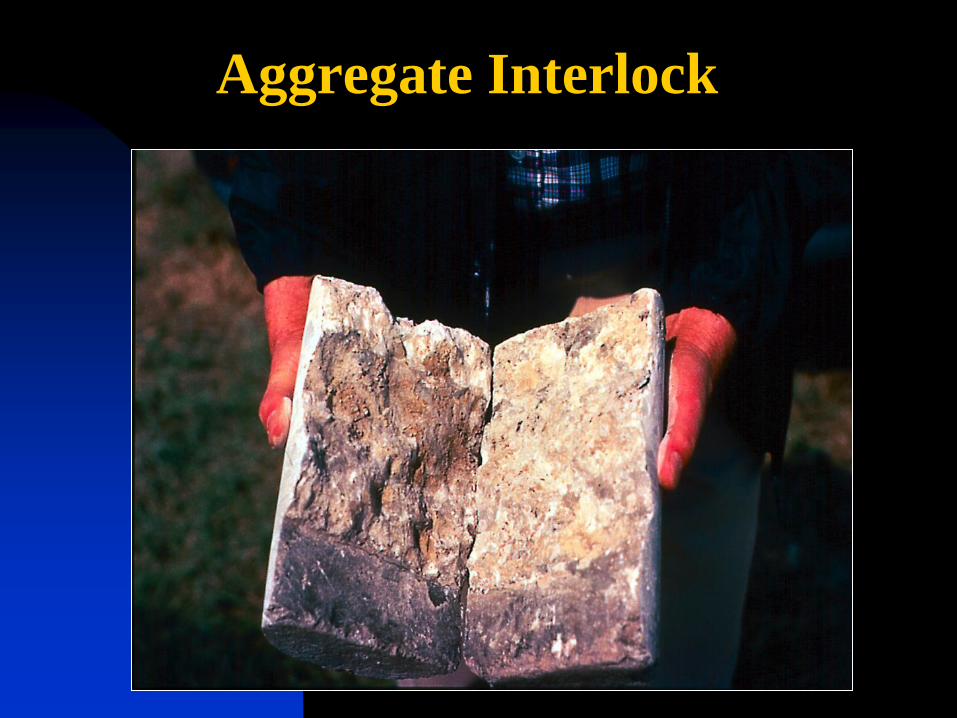
Aggregate Interlock
Shear between aggregate particles
below the initial saw cut
Aggregate Interlock
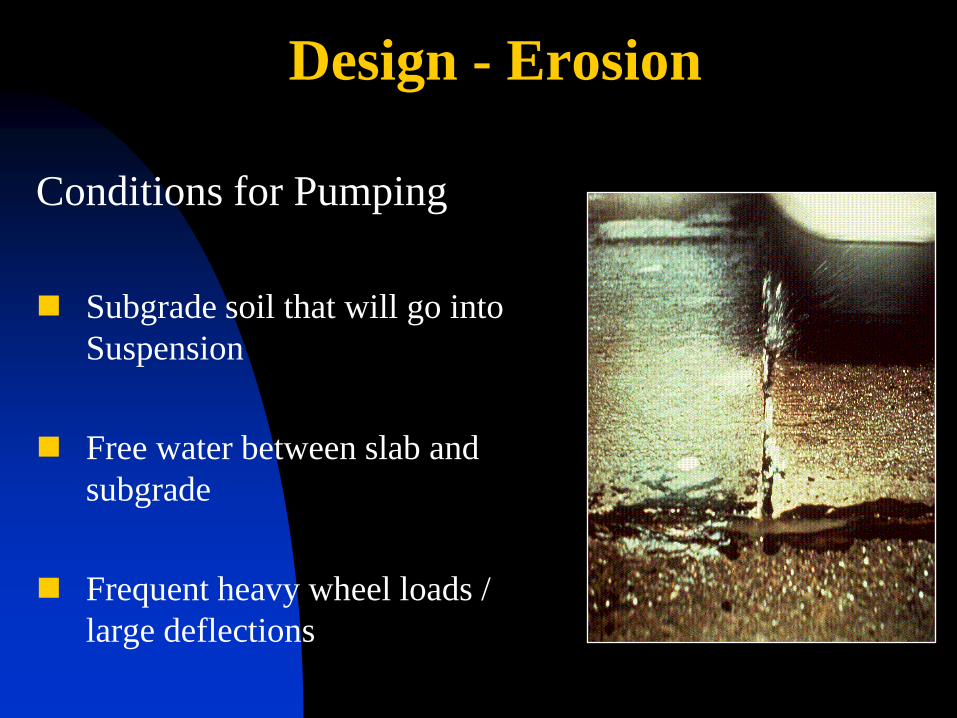
Design - Erosion
Conditions for Pumping
Subgrade soil that will go into
Suspension
Free water between slab and
subgrade
Frequent heavy wheel loads /
large deflections
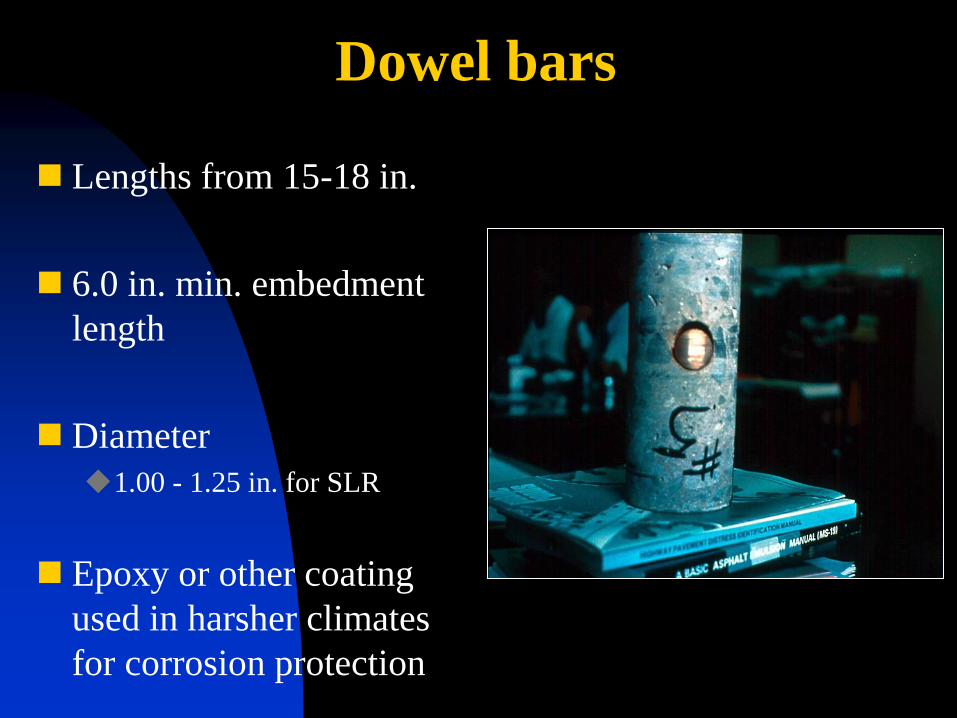
Dowel bars
Lengths from 15-18 in.
6.0 in. min. embedment
length
Diameter
1.00 - 1.25 in. for SLR
Epoxy or other coating
used in harsher climates
for corrosion protection
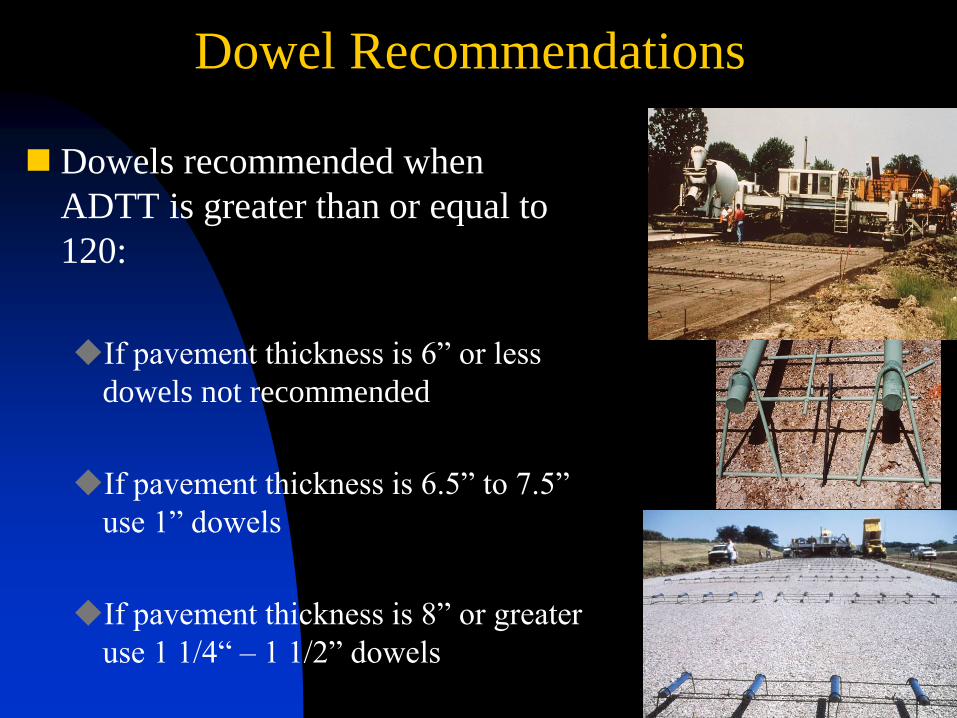
Dowel Recommendations
Dowels recommended when
ADTT is greater than or equal to
120:
If pavement thickness is 6” or less
dowels not recommended
If pavement thickness is 6.5” to 7.5”
use 1” dowels
If pavement thickness is 8” or greater
use 1 1/4“ – 1 1/2” dowels
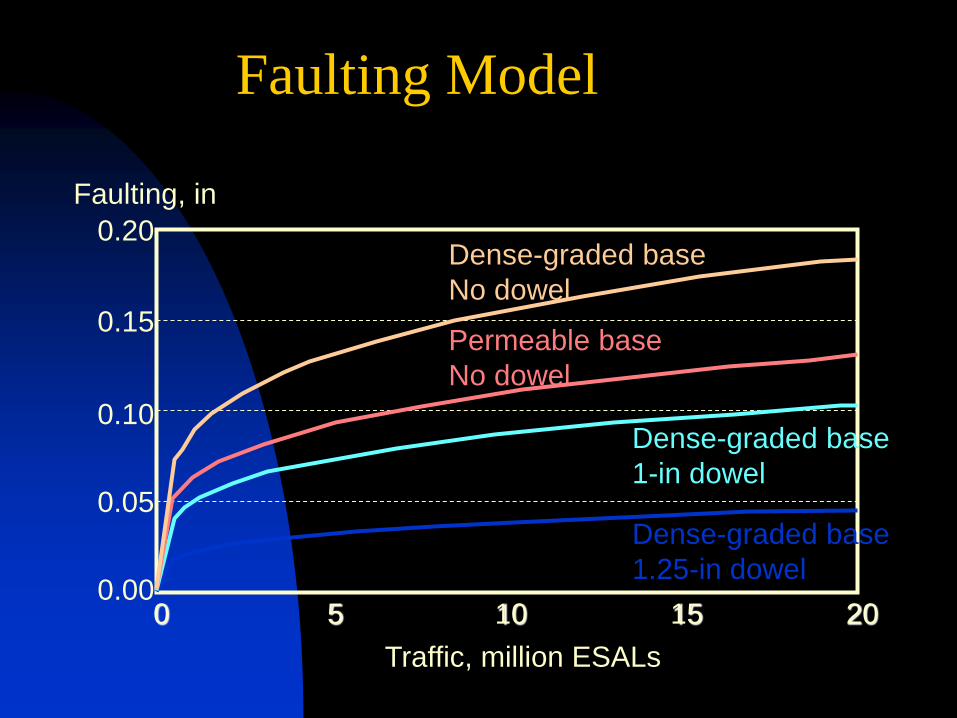
Faulting Model
0 5 10 15 20 0.00
0.05
0.10
0.15
0.20
Faulting, in
Dense-graded base
No dowel
Permeable base
No dowel
Dense-graded base
1-in dowel
Dense-graded base
1.25-in dowel
Traffic, million ESALs
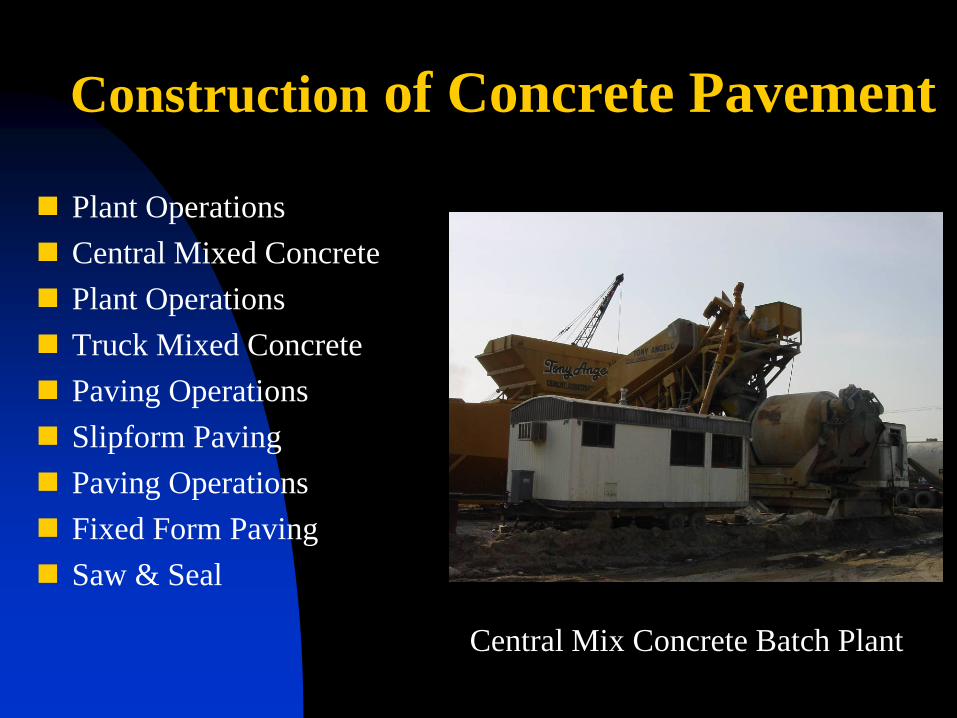
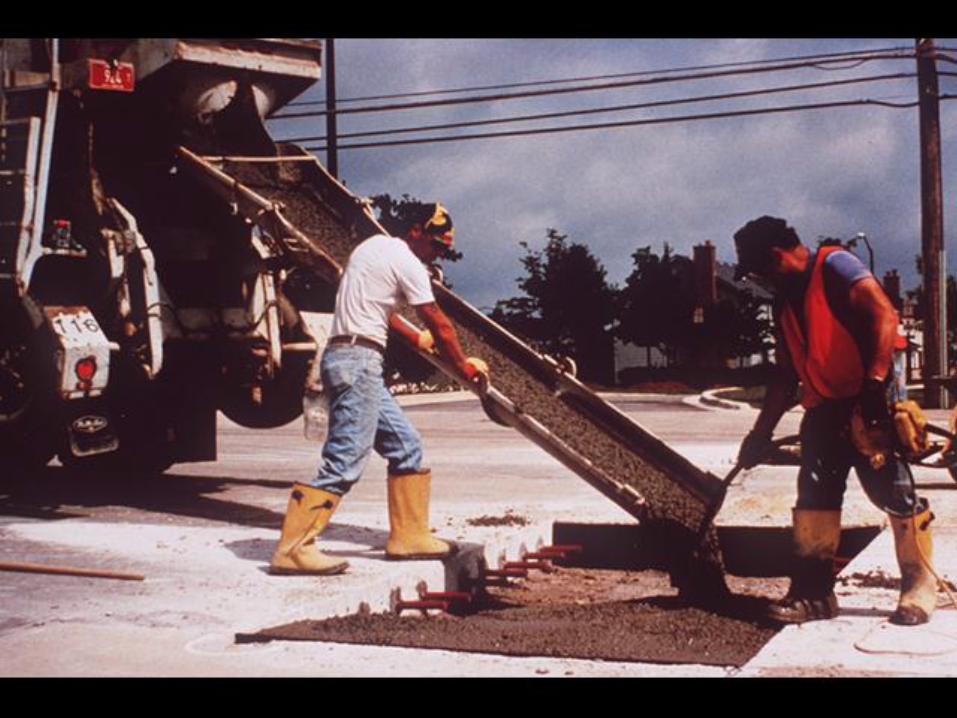
Construction of Concrete Pavement
Plant Operations
Central Mixed Concrete
Plant Operations
Truck Mixed Concrete
Paving Operations
Slipform Paving
Paving Operations
Fixed Form Paving
Saw & Seal
Central Mix Concrete Batch Plant
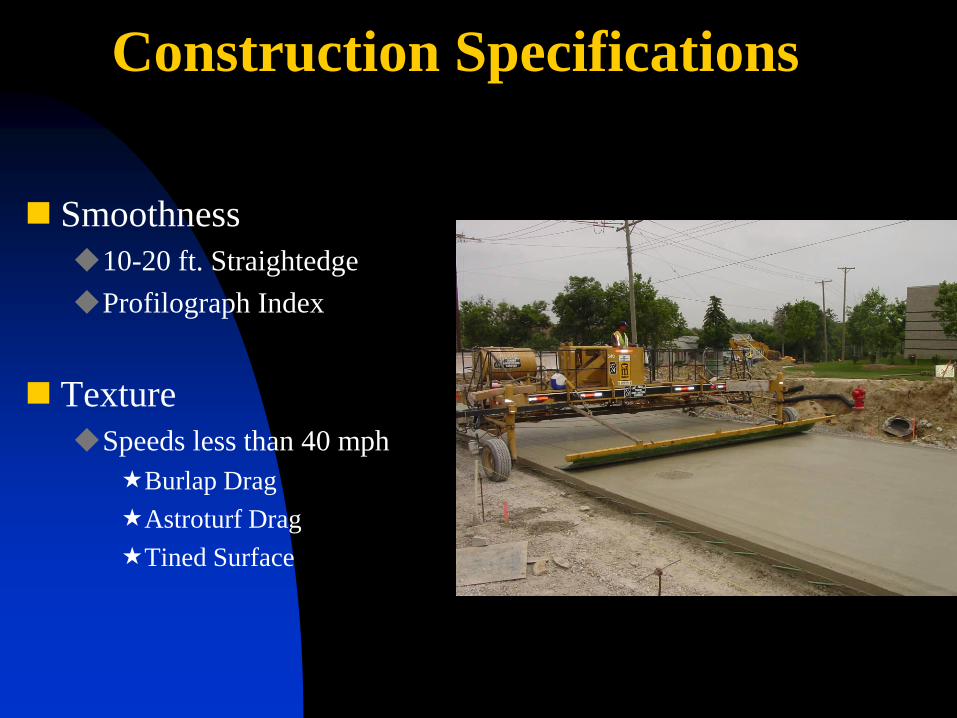
Construction Specifications
Smoothness
10-20 ft. Straightedge
Profilograph Index
Texture
Speeds less than 40 mph
Burlap Drag
Astroturf Drag
Tined Surface
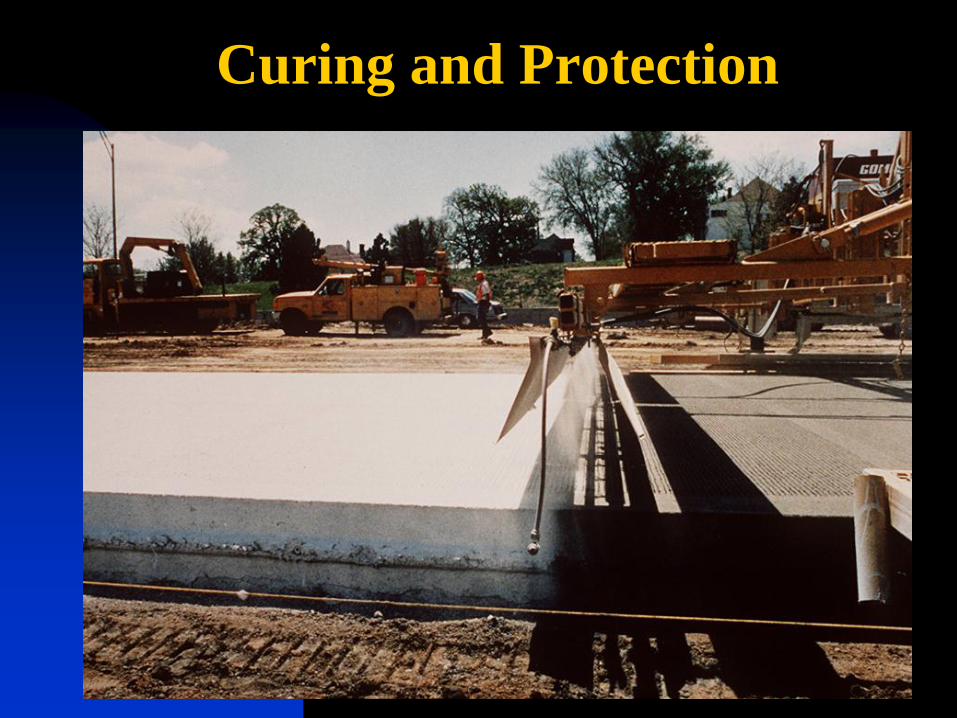
Curing and Protection
Curing
Curing is one of the most important steps in quality concrete construction and one of the most neglected.
Effective curing is absolutely essential for surface durability.
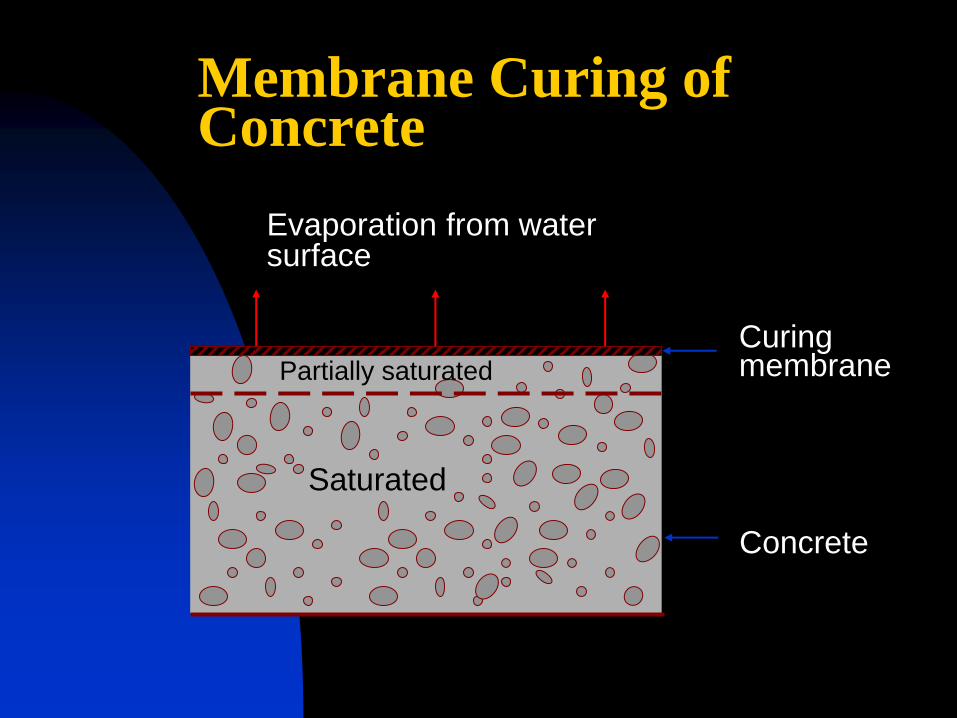
Membrane Curing of Concrete
Evaporation from water surface
Concrete
Curing membrane
Saturated
Partially saturated
Curing
The simplest, most economical and widely used method is a liquid membrane which is sprayed on the surface of a slab as soon as possible after finishing.
Apply at manufacture’s rate of coverage.
Perform field check to verify application rate.
Increased
Strength
Watertightness
Abrasion resistance
Freeze-thaw resistance
Volume stability
Effect of Adequate Curing on Hardened Concrete
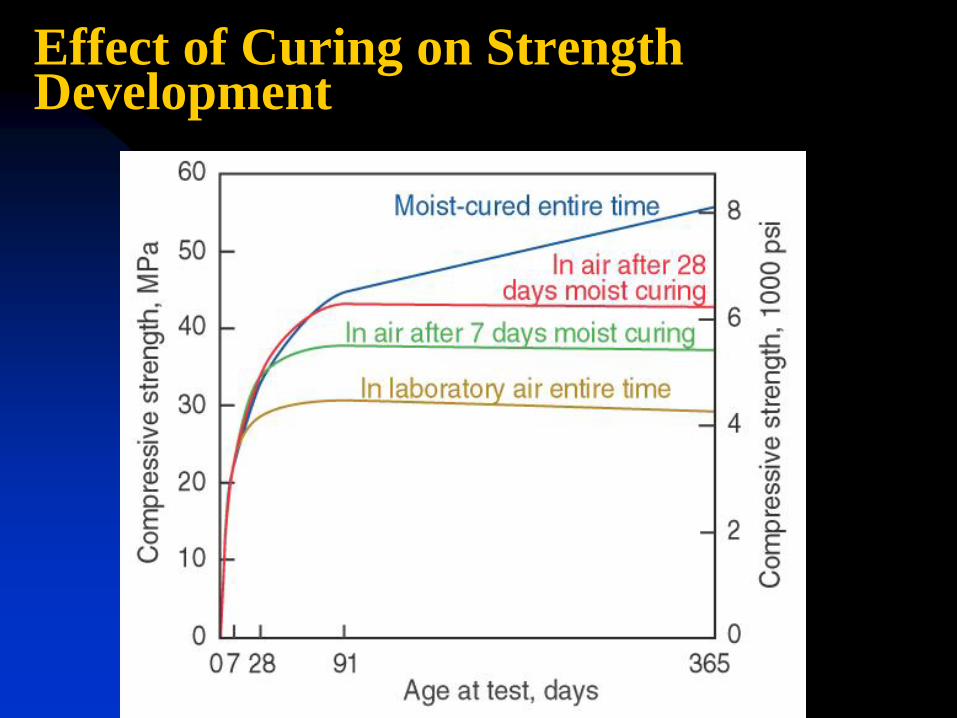
Effect of Curing on Strength Development
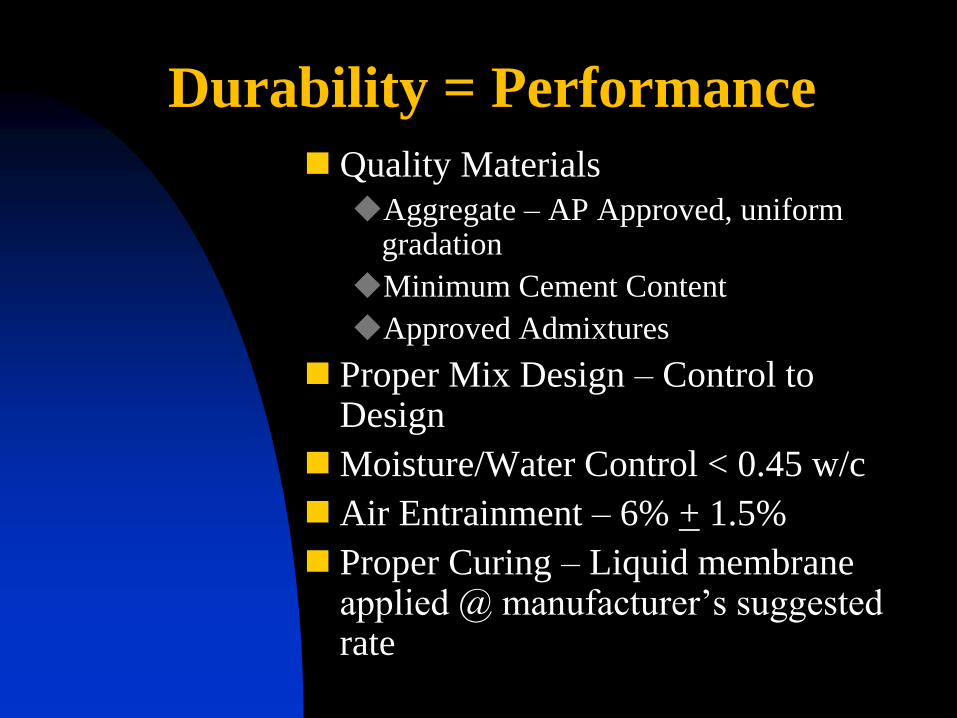
Durability = Performance
Quality Materials
Aggregate – AP Approved, uniform gradation
Minimum Cement Content
Approved Admixtures
Proper Mix Design – Control to Design
Moisture/Water Control < 0.45 w/c
Air Entrainment – 6% + 1.5%
Proper Curing – Liquid membrane applied @ manufacturer’s suggested rate
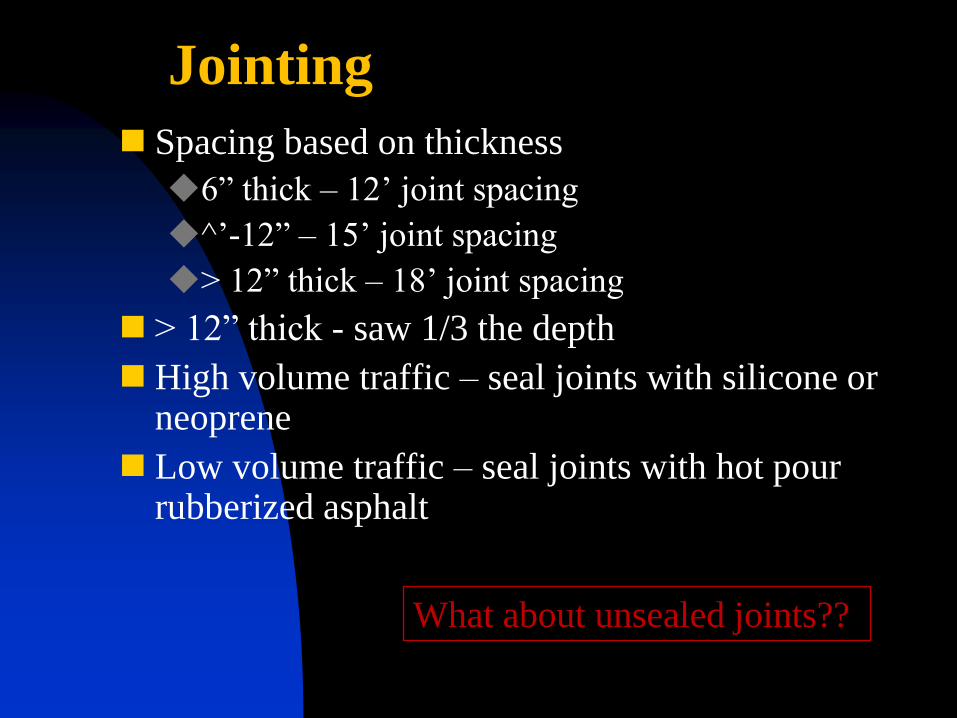
Jointing
Spacing based on thickness
6” thick – 12’ joint spacing
^’-12” – 15’ joint spacing
> 12” thick – 18’ joint spacing
> 12” thick - saw 1/3 the depth
High volume traffic – seal joints with silicone or neoprene
Low volume traffic – seal joints with hot pour rubberized asphalt
What about unsealed joints??
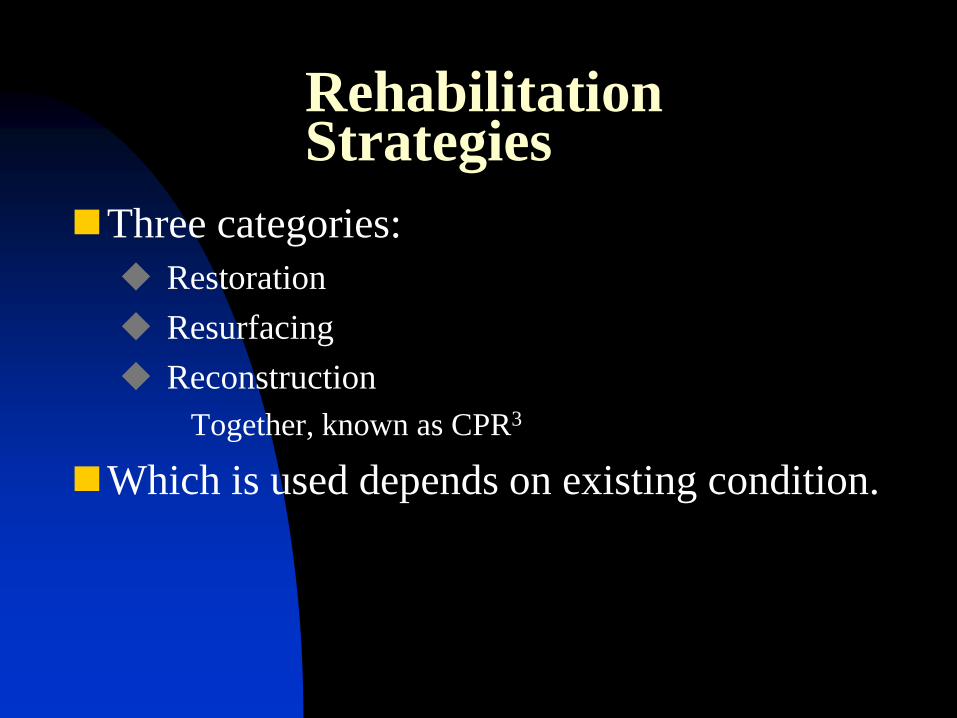
Rehabilitation Strategies
Three categories:
Restoration
Resurfacing
Reconstruction
Together, known as CPR3
Which is used depends on existing condition.
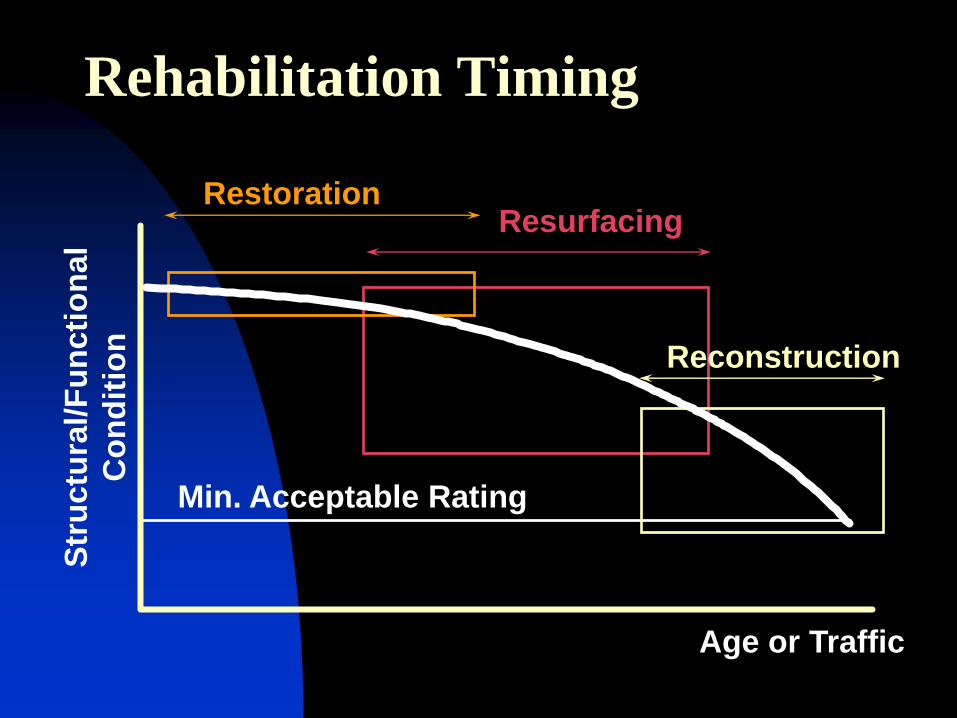
Min. Acceptable Rating
Resurfacing
Reconstruction
Restoration
Rehabilitation Timing S
tru
ctu
ral/
Fu
ncti
on
al
Co
nd
itio
n
Age or Traffic
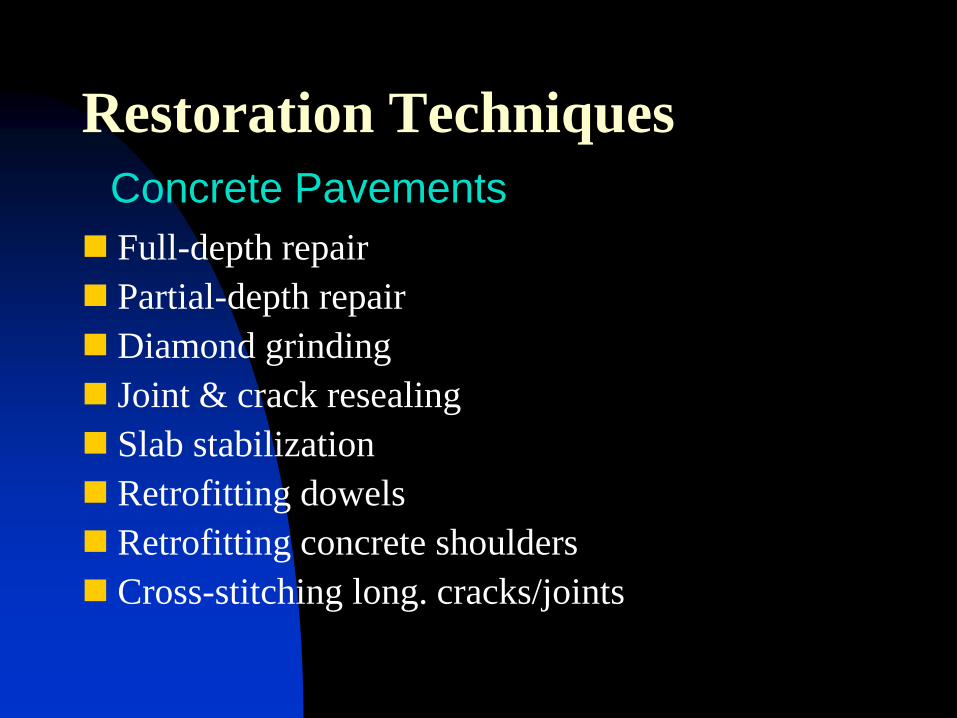
Restoration Techniques
Full-depth repair
Partial-depth repair
Diamond grinding
Joint & crack resealing
Slab stabilization
Retrofitting dowels
Retrofitting concrete shoulders
Cross-stitching long. cracks/joints
Concrete Pavements
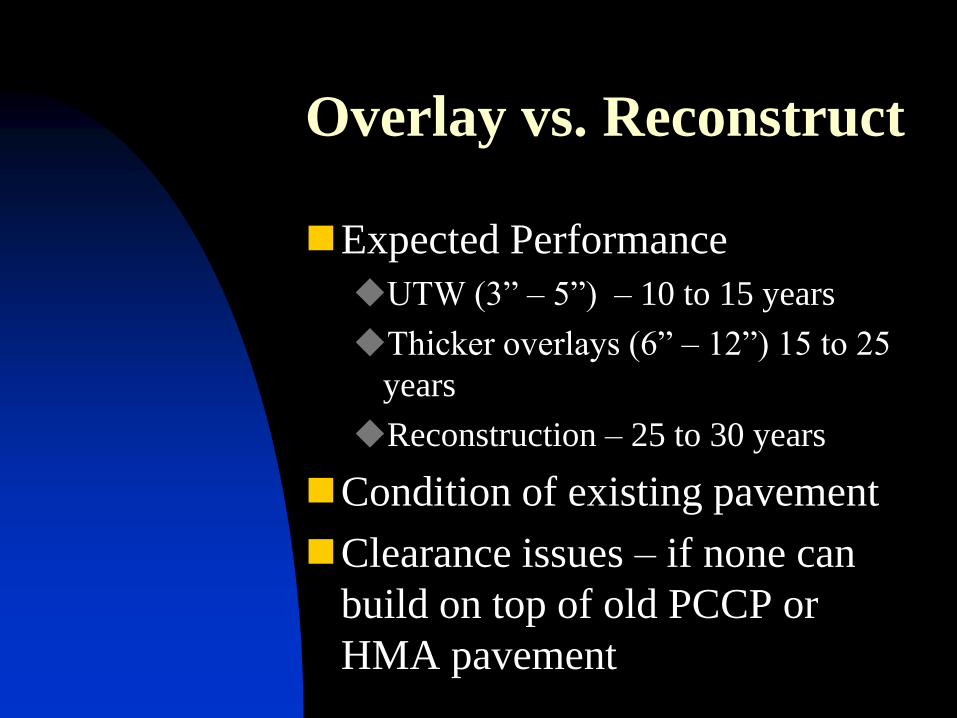
Overlay vs. Reconstruct
Expected Performance
UTW (3” – 5”) – 10 to 15 years
Thicker overlays (6” – 12”) 15 to 25
years
Reconstruction – 25 to 30 years
Condition of existing pavement
Clearance issues – if none can
build on top of old PCCP or
HMA pavement

PCCP Overlay Design Advancements
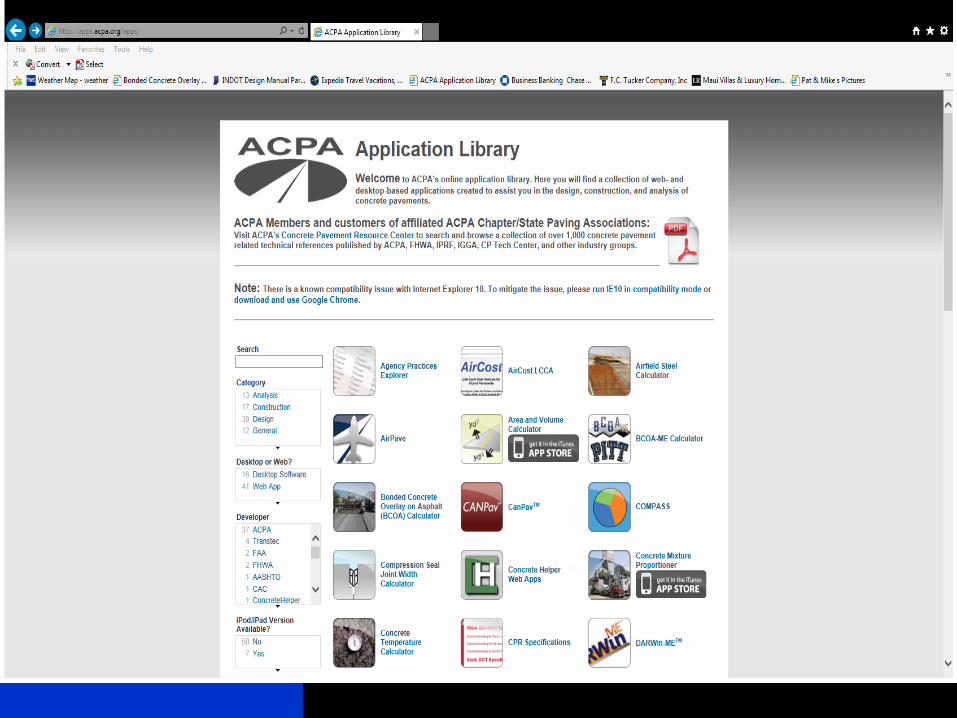
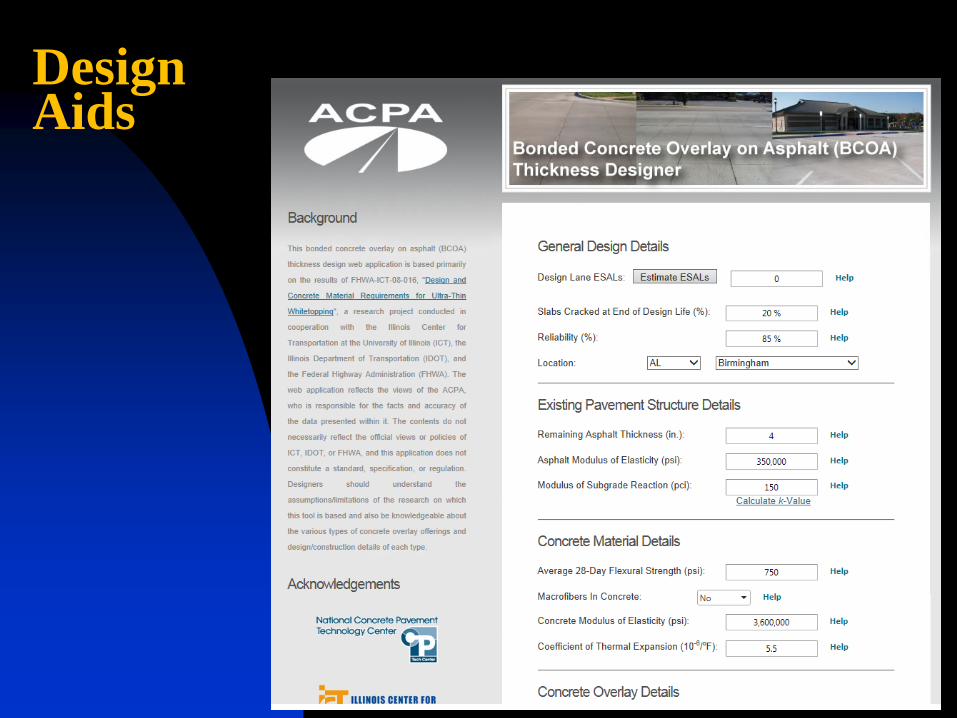
Design Aids

Design Aids
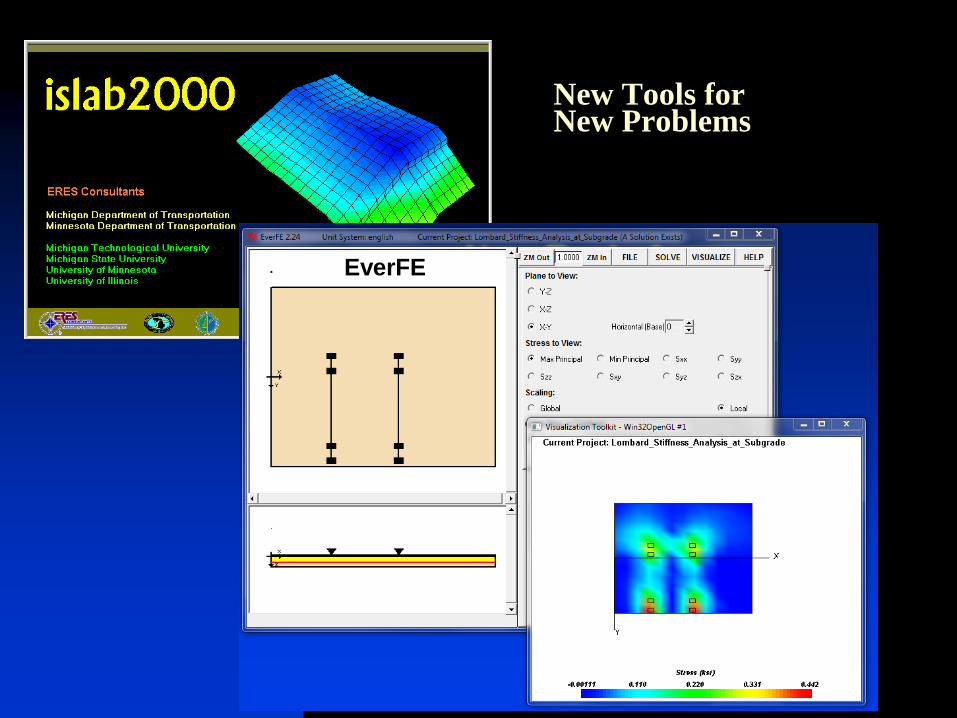
New Tools for New Problems
EverFE

Other Design Developments
Wadsworth Blvd., Colorado DOT
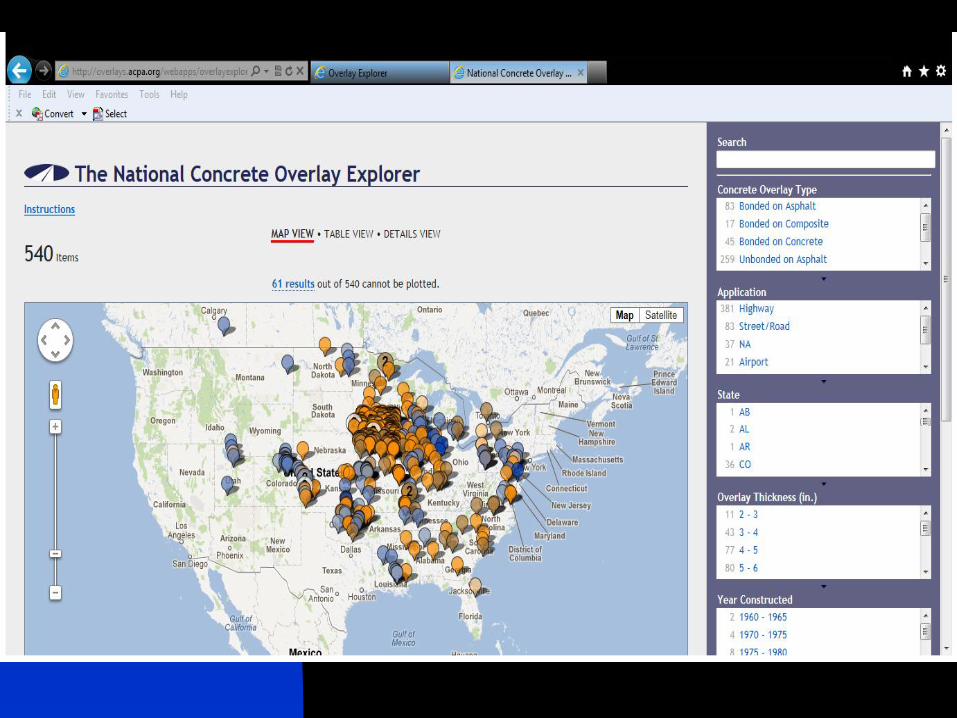
MNRoad, MnDOT
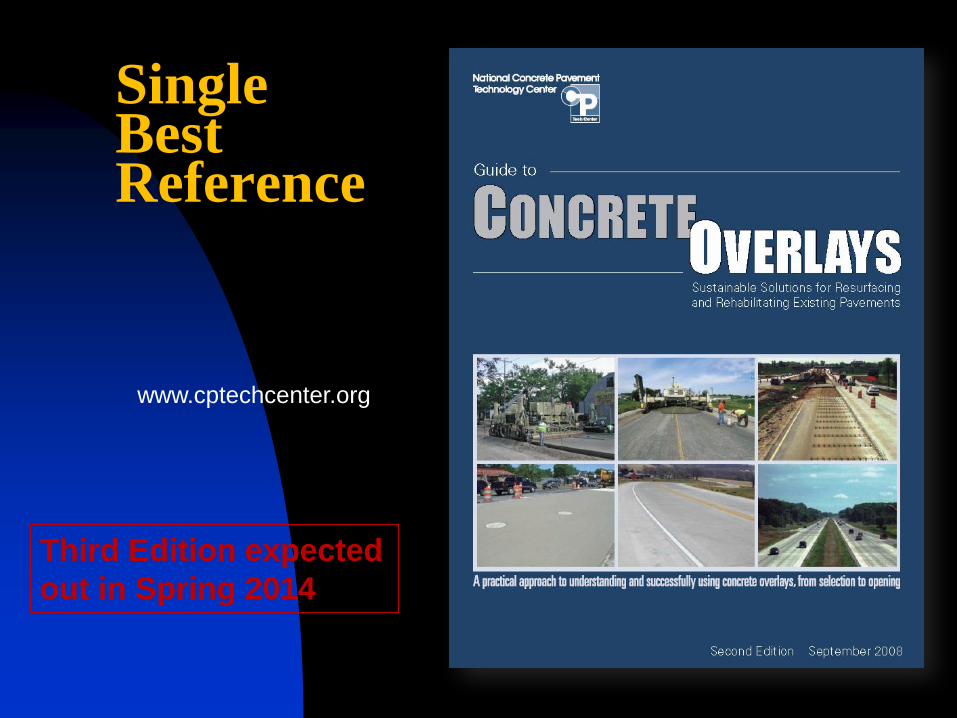
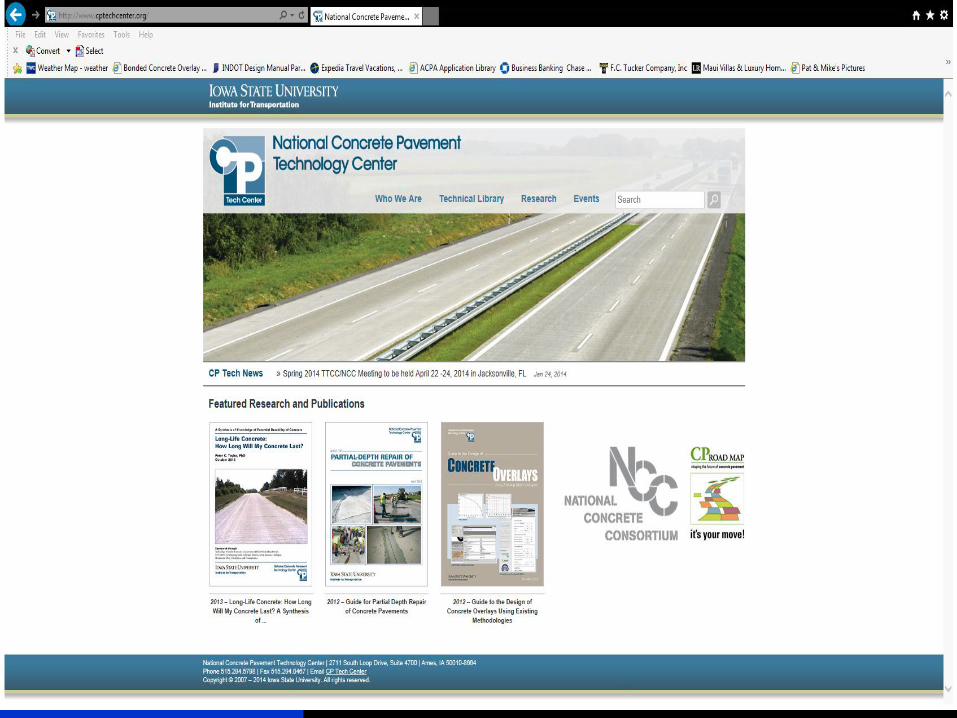
Single Best Reference
www.cptechcenter.org
Third Edition expected
out in Spring 2014
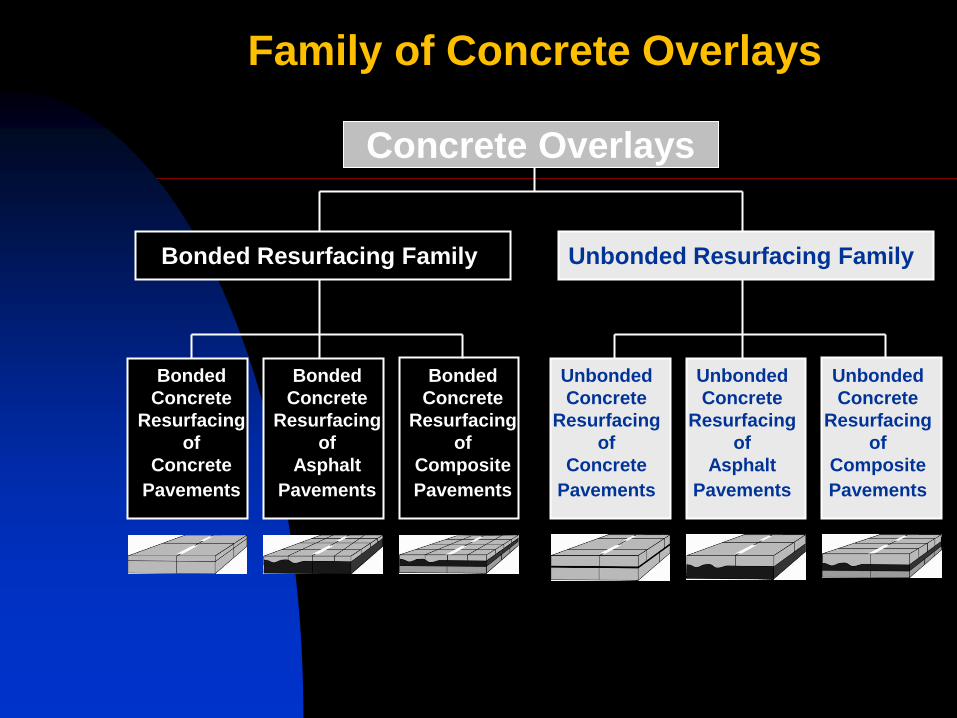
Family of Concrete Overlays
Concrete Overlays
Bonded
Concrete
Resurfacing
of
Concrete
Pavements
Bonded
Concrete
Resurfacing
of
Asphalt
Pavements
Bonded
Concrete
Resurfacing
of
Composite
Pavements
Unbonded
Concrete
Resurfacing
of
Concrete
Pavements
Unbonded
Concrete
Resurfacing
of
Asphalt
Pavements
Unbonded
Concrete
Resurfacing
of
Composite
Pavements
Bonded Resurfacing Family
Unbonded Resurfacing Family
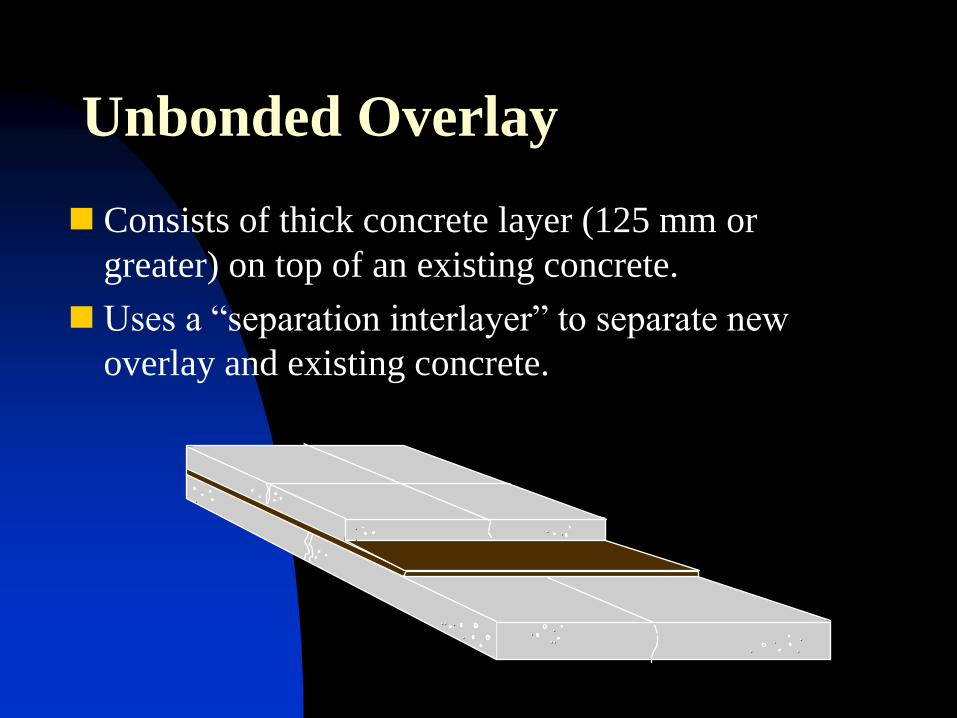
Unbonded Overlay
. . ..
. .. .
. .
. .
. .
.
.
.
Consists of thick concrete layer (125 mm or
greater) on top of an existing concrete.
Uses a “separation interlayer” to separate new
overlay and existing concrete.
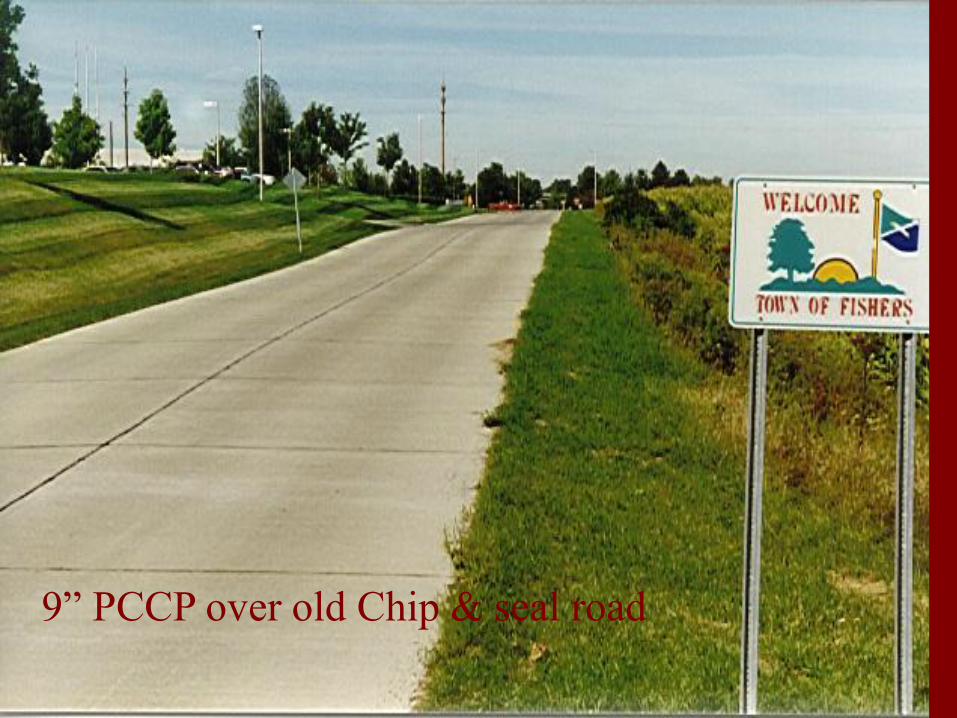
9” PCCP over old Chip & seal road
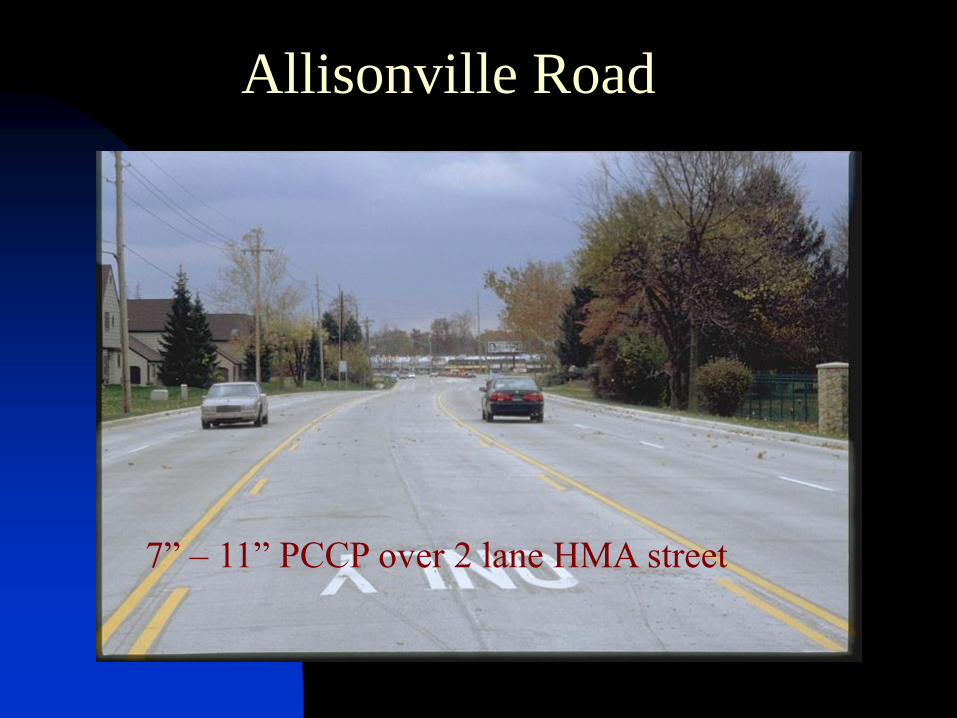
Allisonville Road
7” – 11” PCCP over 2 lane HMA street
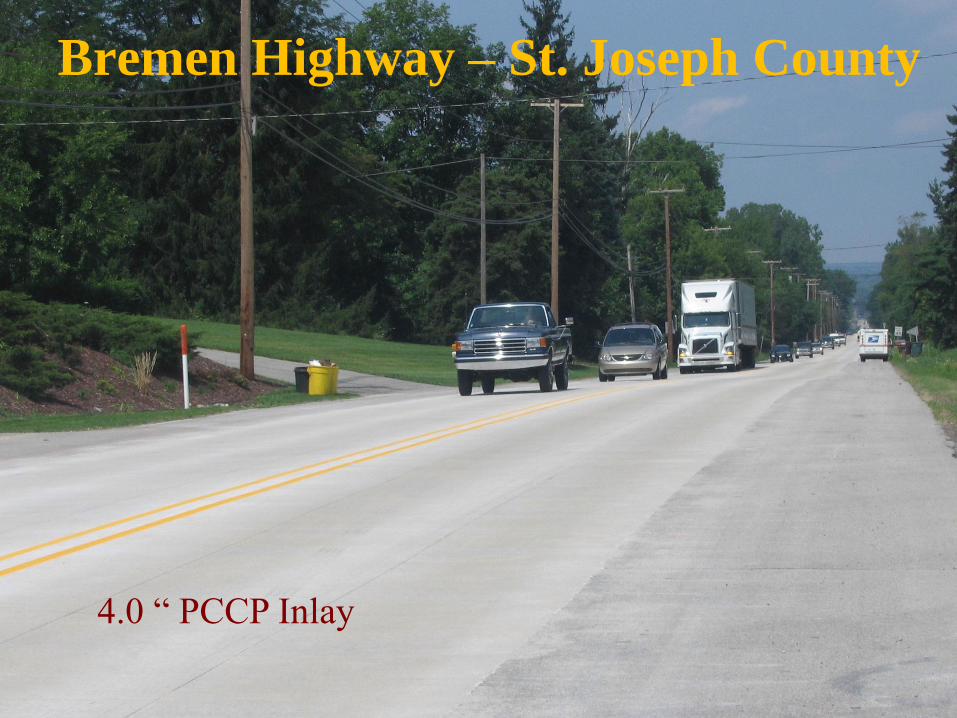
Bremen Highway – St. Joseph County
4.0 “ PCCP Inlay
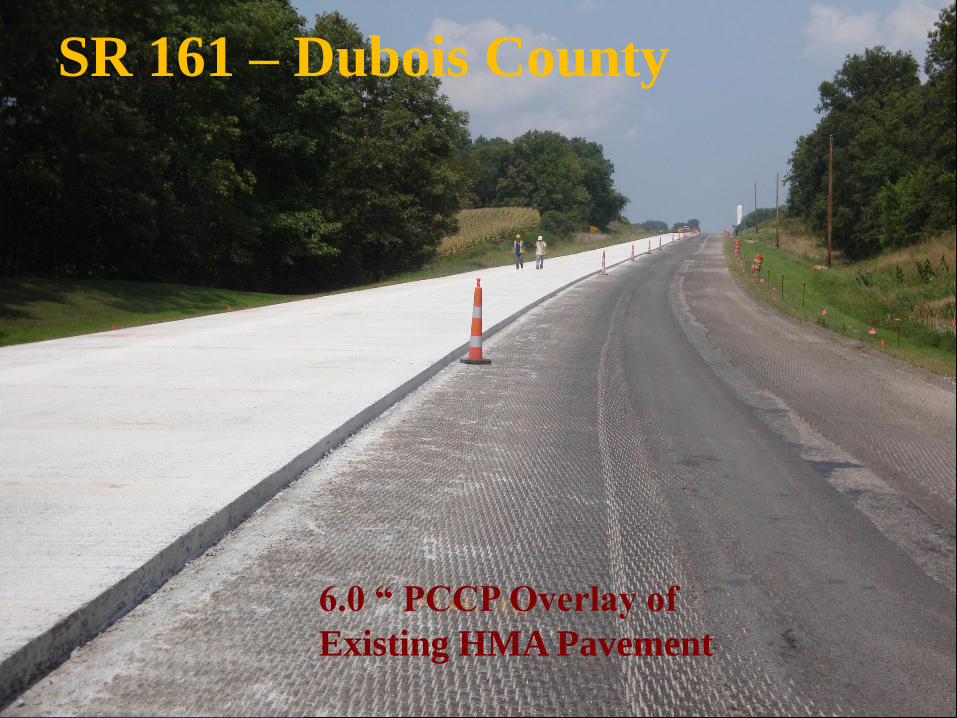
SR 161 – Dubois County
6.0 “ PCCP Overlay of
Existing HMA Pavement
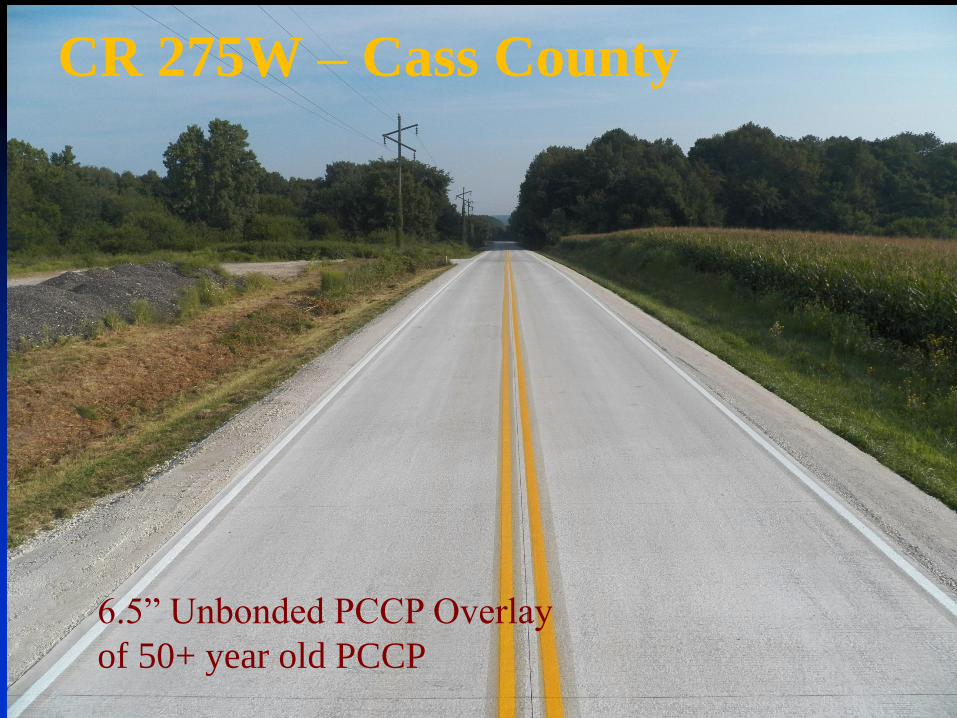
CR 275W – Cass County
6.5” Unbonded PCCP Overlay
of 50+ year old PCCP
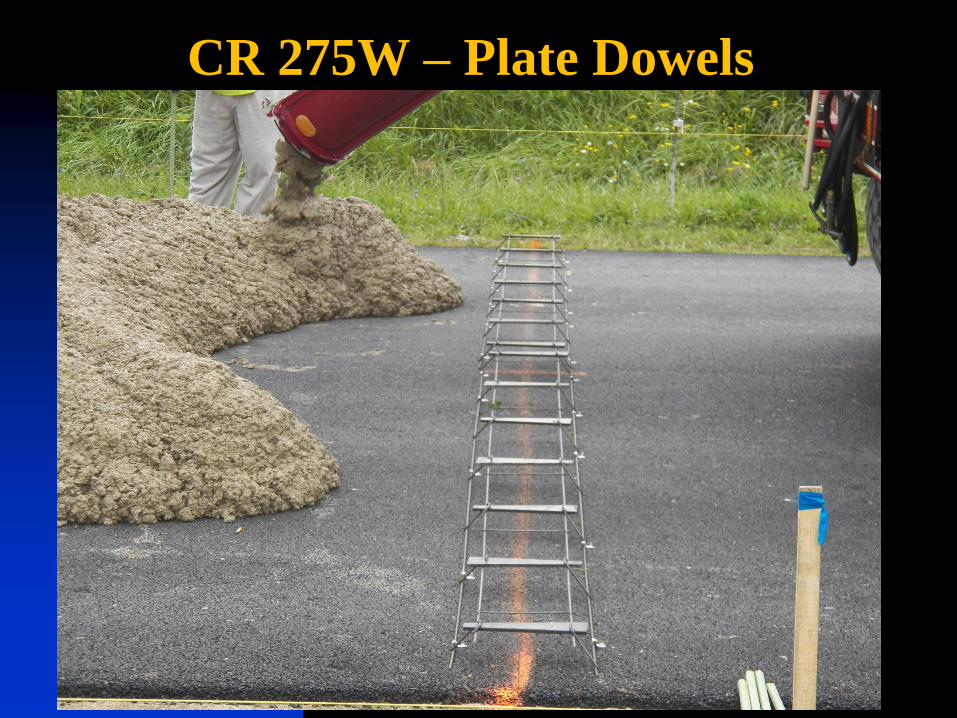
CR 275W – Plate Dowels
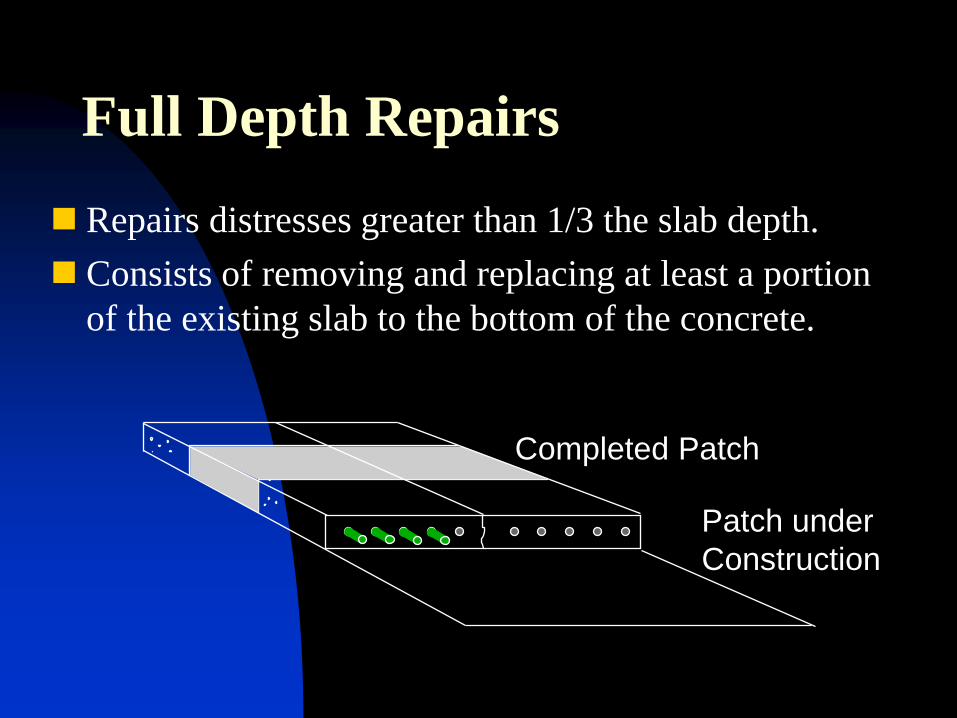
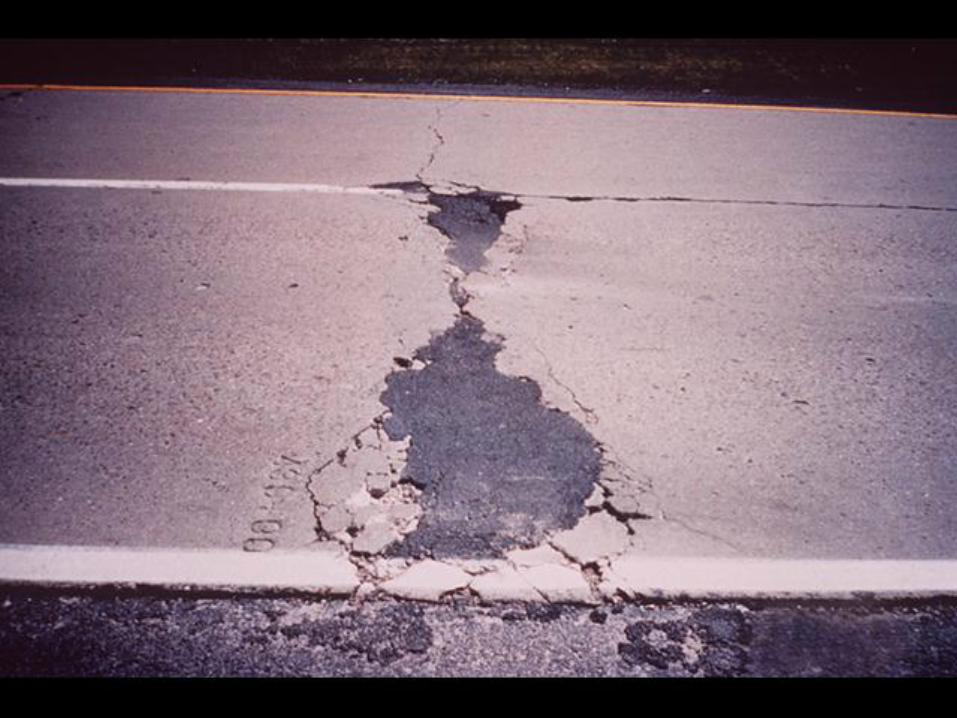
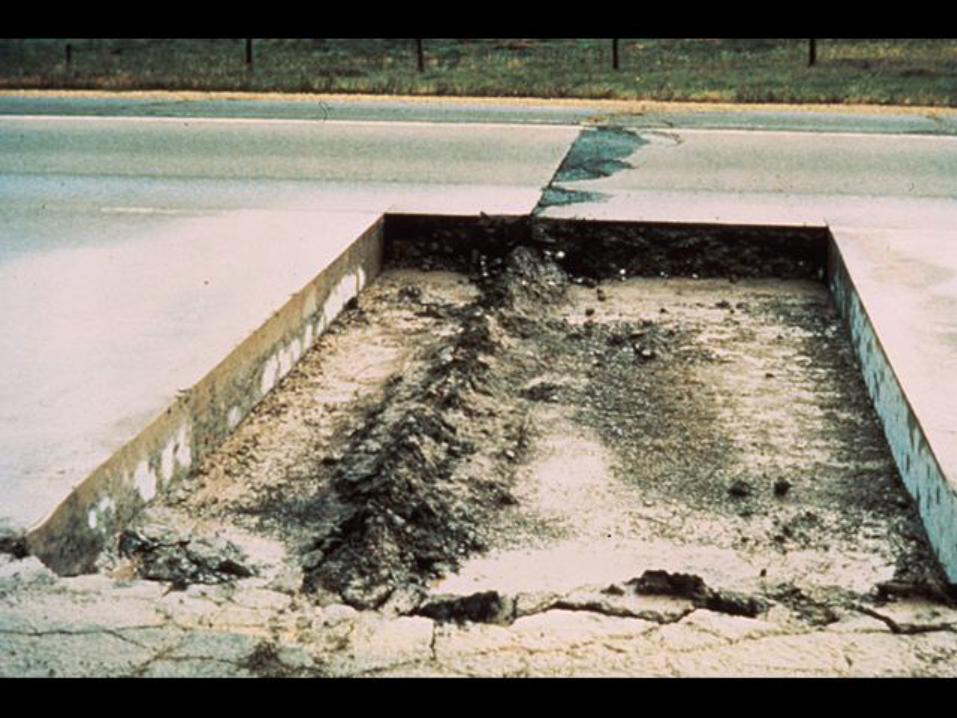
Full Depth Repairs
Repairs distresses greater than 1/3 the slab depth.
Consists of removing and replacing at least a portion
of the existing slab to the bottom of the concrete.
.
.
Completed Patch
Patch under
Construction
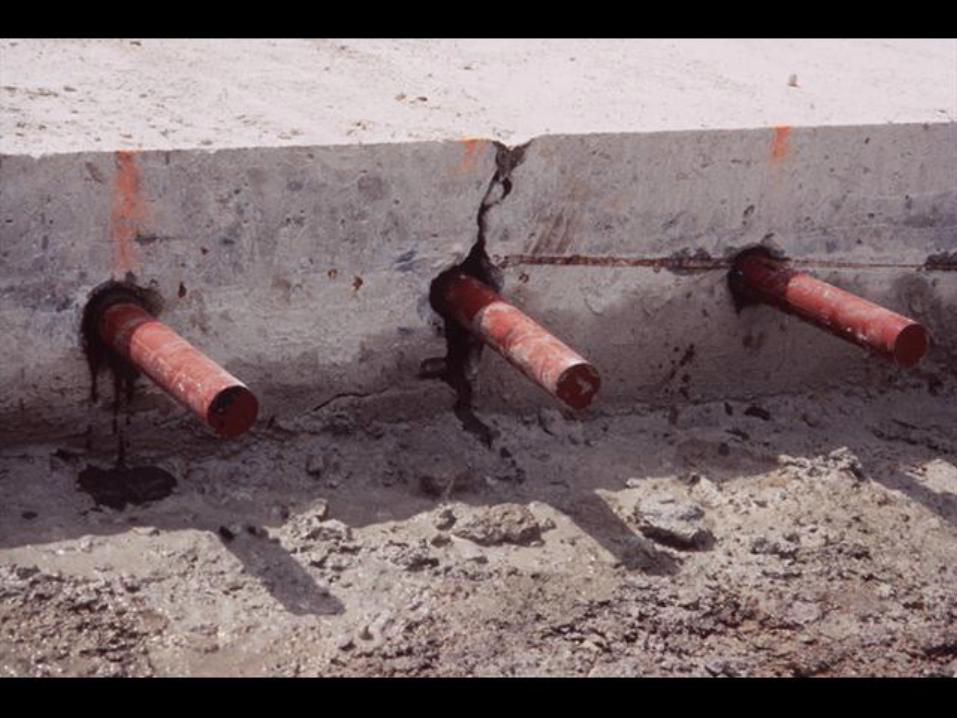
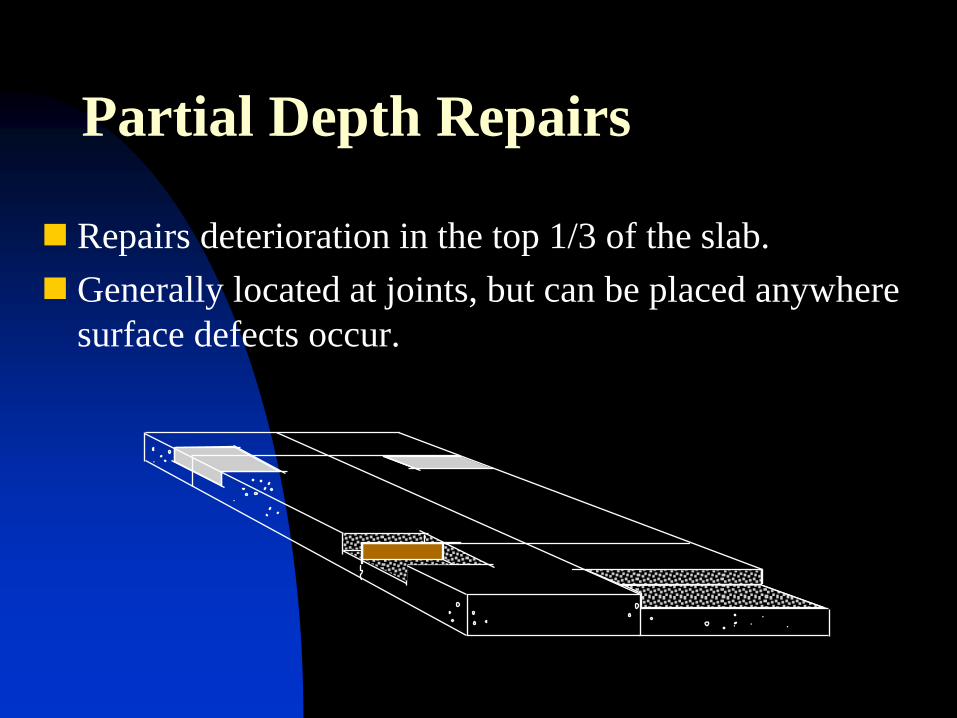
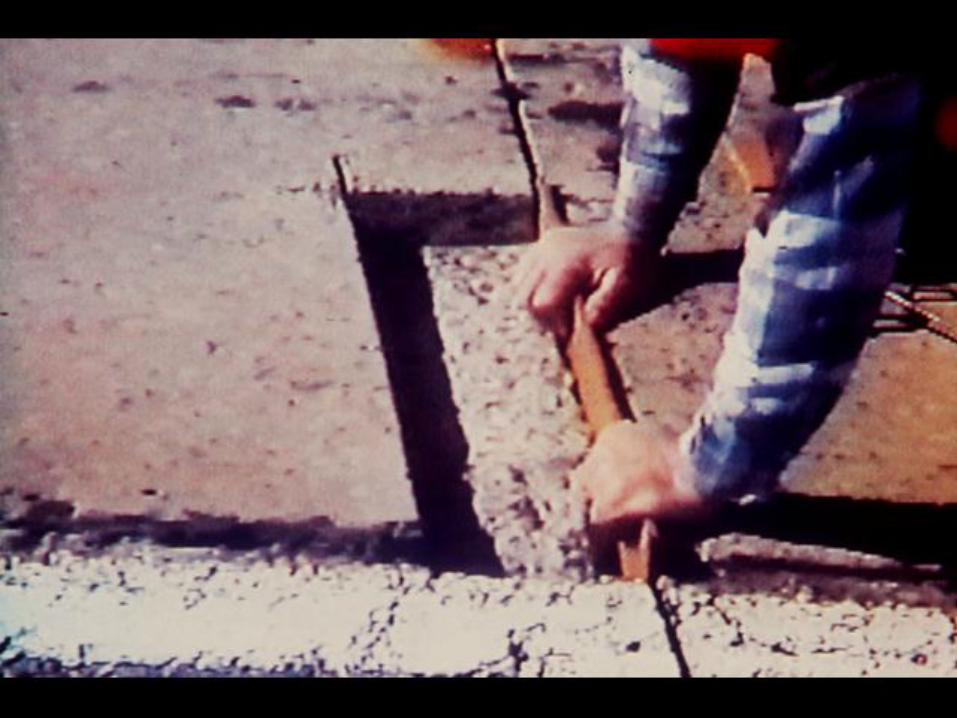
Partial Depth Repairs
Repairs deterioration in the top 1/3 of the slab.
Generally located at joints, but can be placed anywhere
surface defects occur.
. . . .
.
.
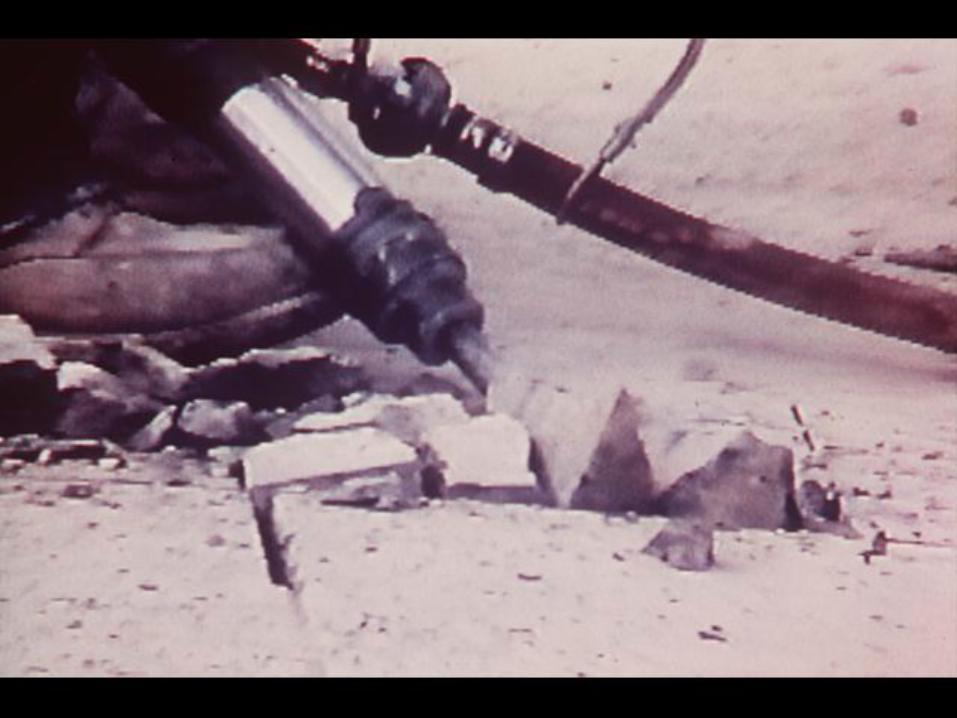
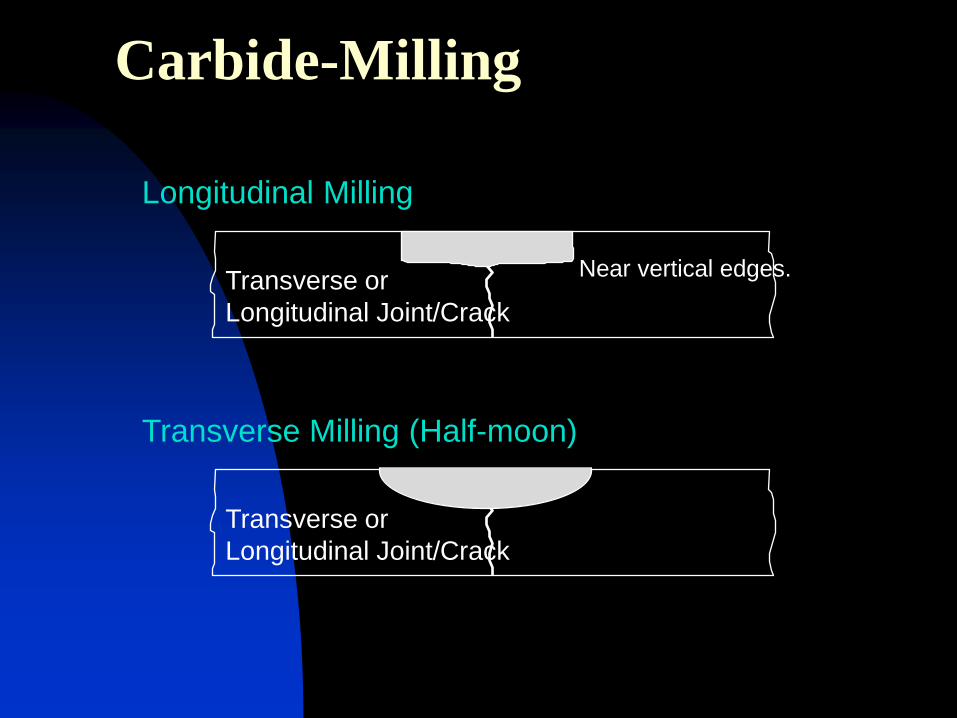
Carbide-Milling
Longitudinal Milling
Transverse or
Longitudinal Joint/Crack
Near vertical edges.
Transverse or
Longitudinal Joint/Crack
Transverse Milling (Half-moon)
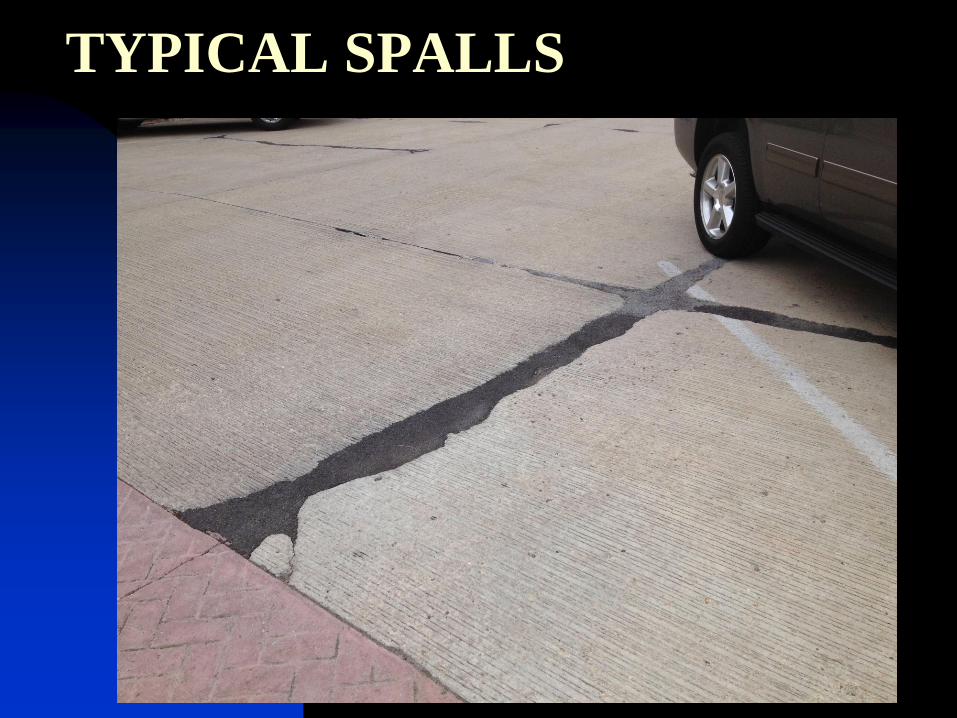
TYPICAL SPALLS
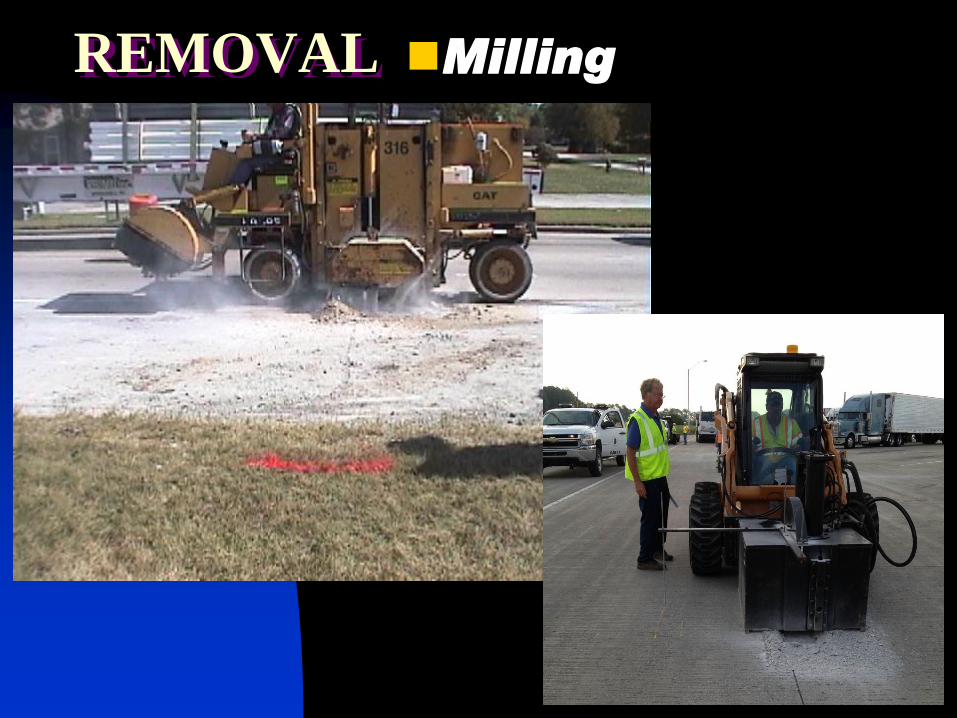
REMOVAL Milling
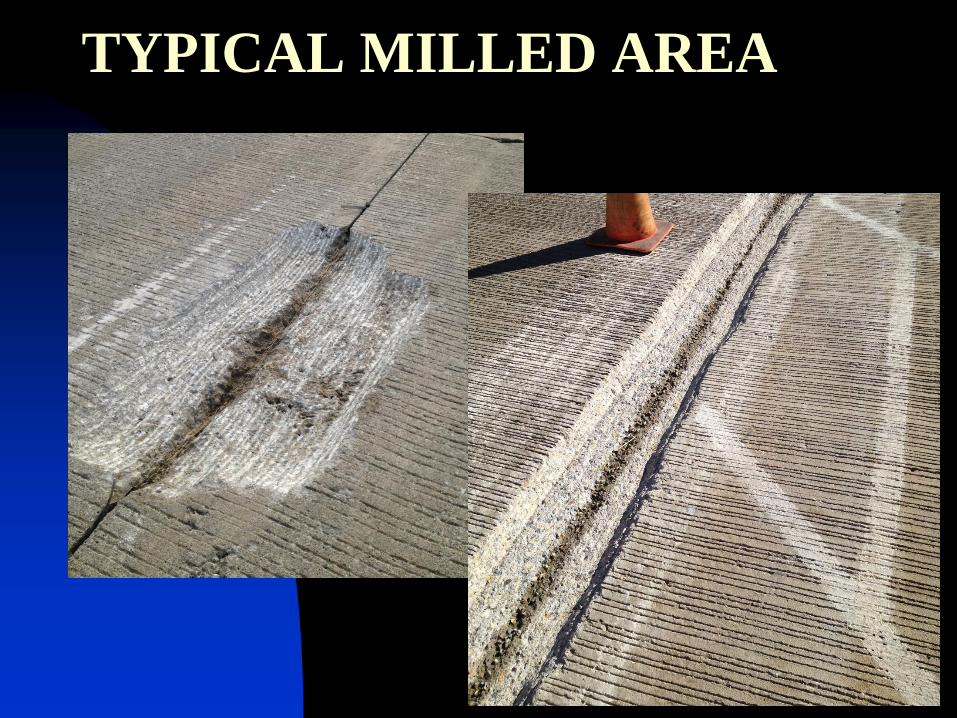
TYPICAL MILLED AREA
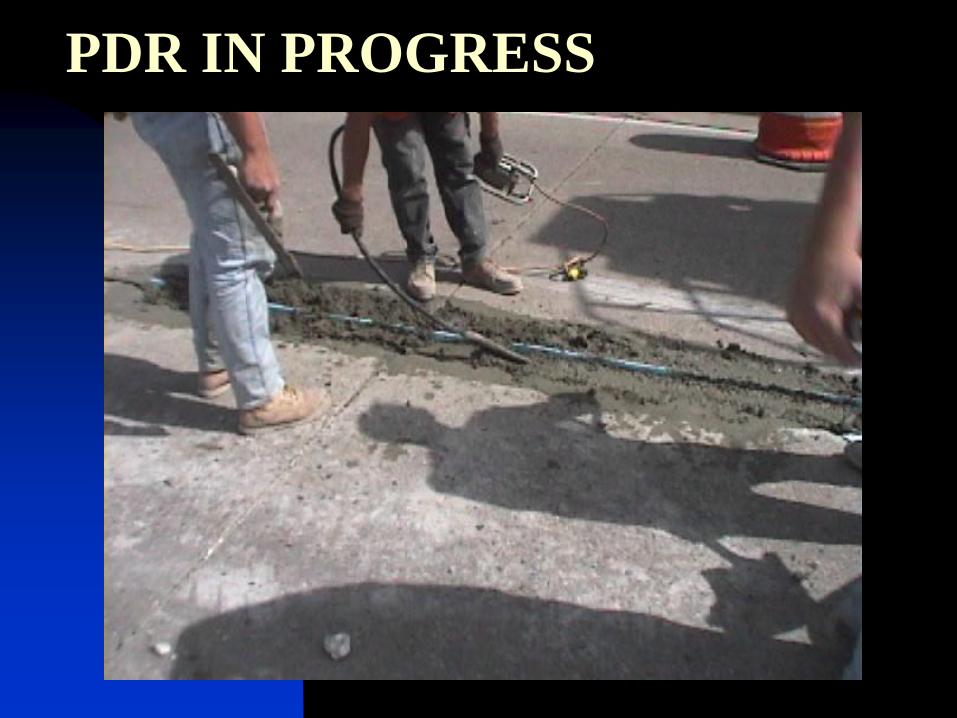
PDR IN PROGRESS
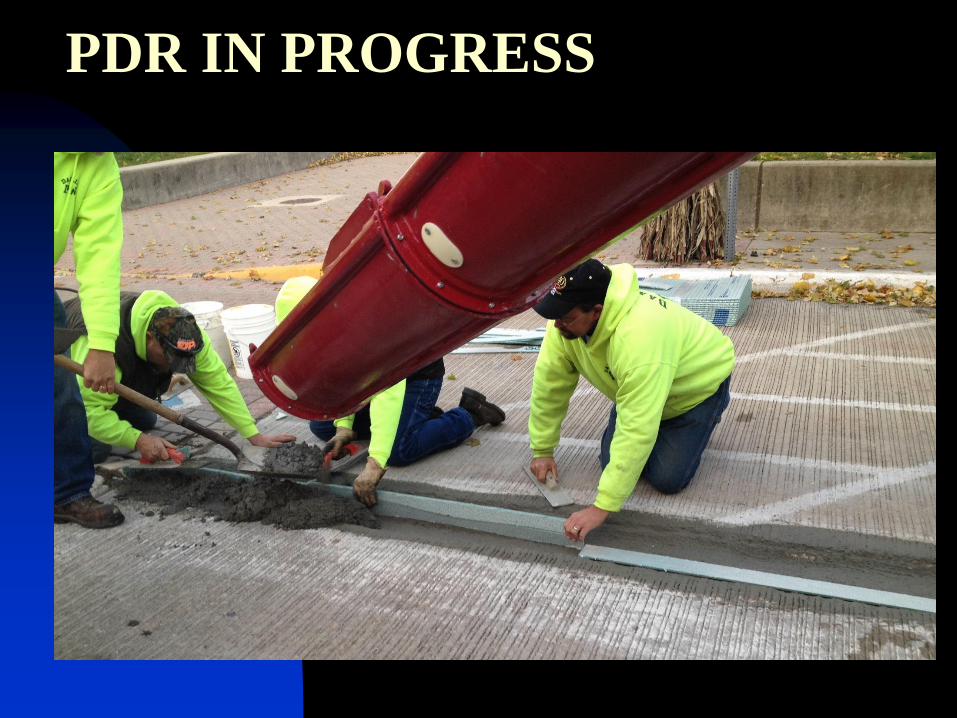
PDR IN PROGRESS
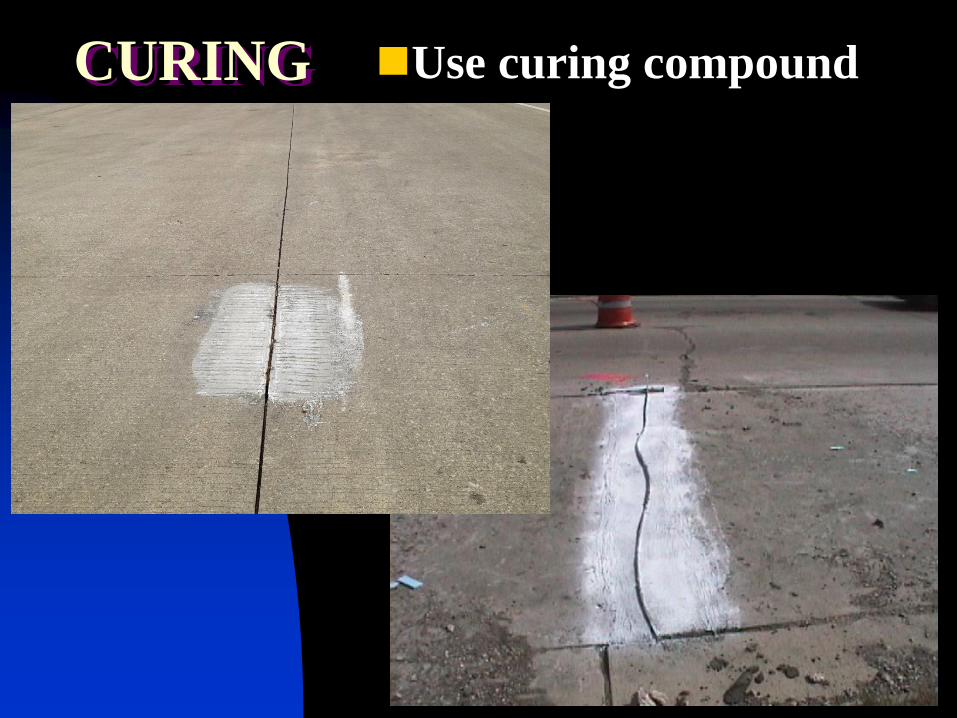
CURING Use curing compound
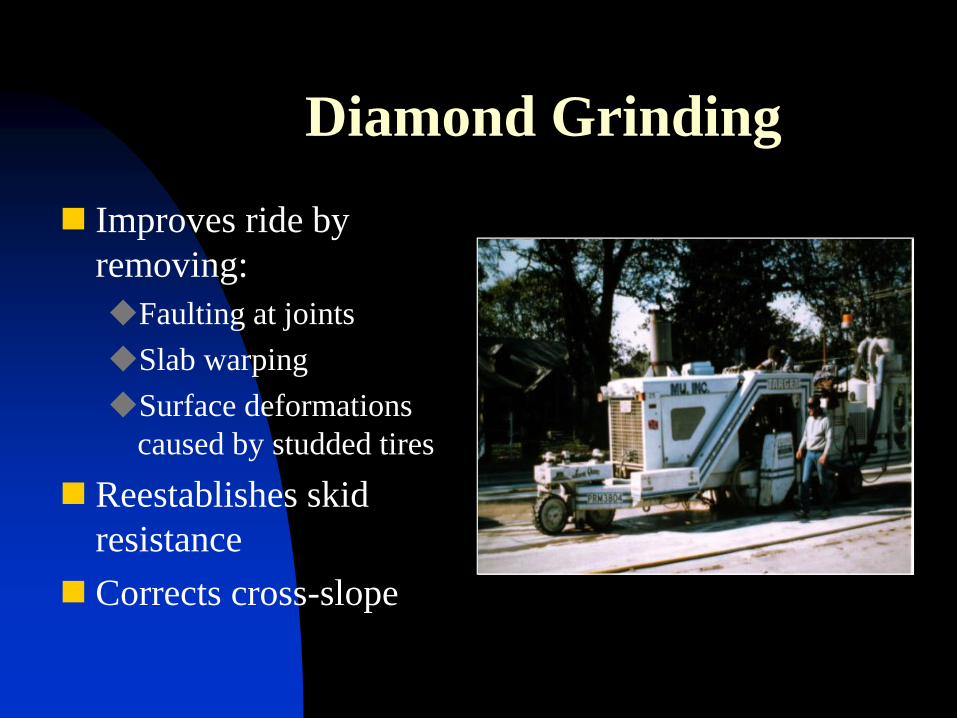
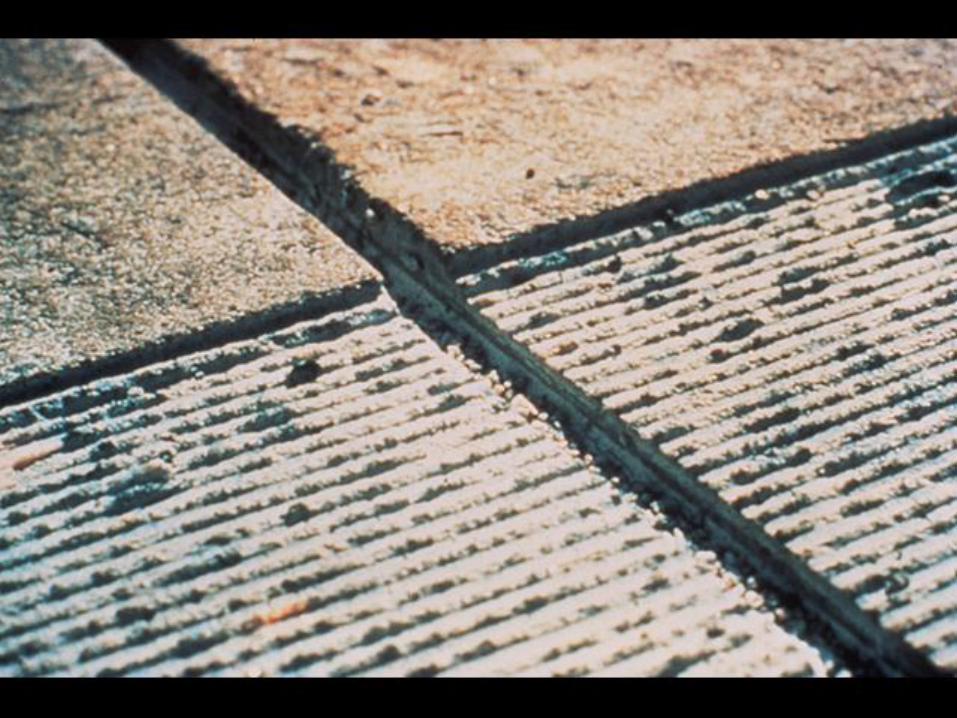
Diamond Grinding
Improves ride by
removing:
Faulting at joints
Slab warping
Surface deformations
caused by studded tires
Reestablishes skid
resistance
Corrects cross-slope

ACPA Apps Library
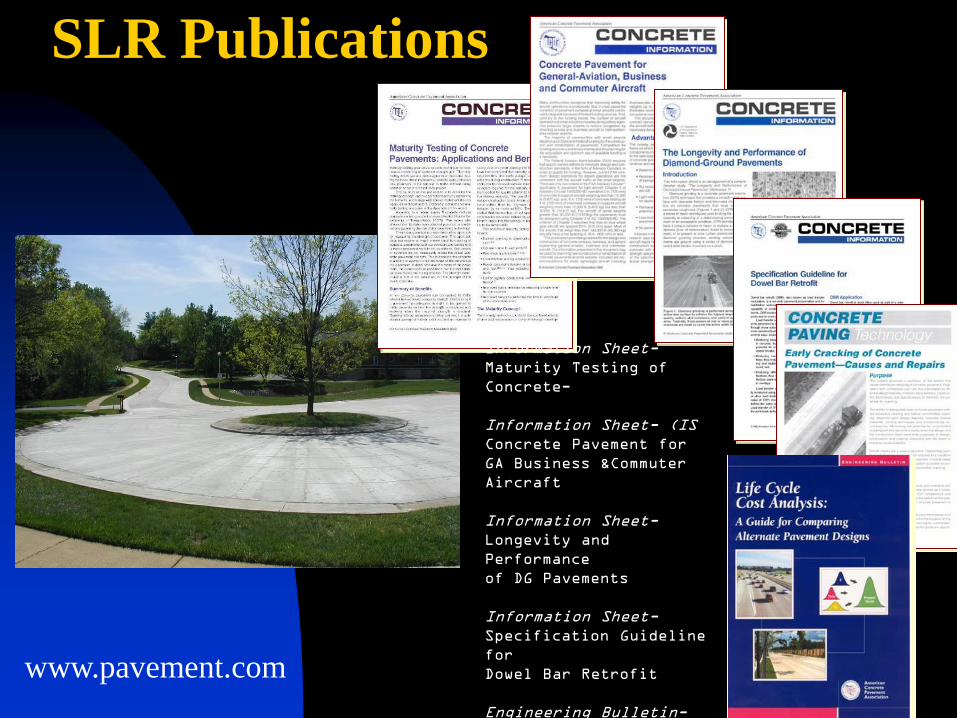
Information Sheet-
Maturity Testing of
Concrete-
Information Sheet- (IS
Concrete Pavement for
GA Business &Commuter
Aircraft
Information Sheet-
Longevity and
Performance
of DG Pavements
Information Sheet-
Specification Guideline
for
Dowel Bar Retrofit
Engineering Bulletin-
(EB
Early Cracking
Causes/Solutions
Engineering Bulletin-(EB
Life Cycle Cost Analysis
SLR Publications
www.pavement.com
Indiana Concrete Resources
Mike Byers
Pat Long
Chris Tull, P.E., LEED AP
Jerry Larson
Questions?
Contacts for further information
INDIANA CHAPTER
www.irmca.com
www.indianaconcretepavement.com
Thank You