Embed Size (px)
Citation preview
13
Chapter 2
Basic Tools of Analytical Chemistry
Chapter Overview2A Measurements in Analytical Chemistry2B Concentration2C Stoichiometric Calculations2D Basic Equipment2E Preparing Solutions2F Spreadsheets and Computational Software2G The Laboratory Notebook2H Key Terms2I Chapter Summary2J Problems2K Solutions to Practice Exercises
In the chapters that follow we will explore many aspects of analytical chemistry. In the process we will consider important questions such as “How do we treat experimental data?”, “How do we ensure that our results are accurate?”, “How do we obtain a representative sample?”, and “How do we select an appropriate analytical technique?” Before we look more closely at these and other questions, we will first review some basic tools of importance to analytical chemists.
Source URL: http://www.asdlib.org/onlineArticles/ecourseware/Analytical%20Chemistry%202.0/Text_Files.html Saylor URL: http://www.saylor.org/courses/chem108 Attributed to [David Harvey]
Saylor.org Page 1 of 28
14 Analytical Chemistry 2.0 2A Measurements in Analytical Chemistry
Analytical chemistry is a quantitative science. Whether determining the concentration of a species, evaluating an equilibrium constant, measuring a reaction rate, or drawing a correlation between a compound’s structure and its reactivity, analytical chemists engage in “measuring important chemical things.”1 In this section we briefly review the use of units and significant figures in analytical chemistry.
2A.1 Units of Measurement
A measurement usually consists of a unit and a number expressing the quantity of that unit. We may express the same physical measurement with different units, which can create confusion. For example, the mass of a sample weighing 1.5 g also may be written as 0.0033 lb or 0.053 oz. To ensure consistency, and to avoid problems, scientists use a common set of fundamental units, several of which are listed in Table 2.1. These units are called SI units after the Système International d’Unités.
We define other measurements using these fundamental SI units. For example, we measure the quantity of heat produced during a chemical reac-tion in joules, (J), where
1 J 1
m kgs
2
2=
1 Murray, R. W. Anal. Chem. 2007, 79, 1765.
Some measurements, such as absorbance, do not have units. Because the meaning of a unitless number may be unclear, some authors include an artificial unit. It is not unusual to see the abbreviation AU, which is short for absorbance unit, following an absorbance value. Including the AU clari-fies that the measurement is an absorbance value.
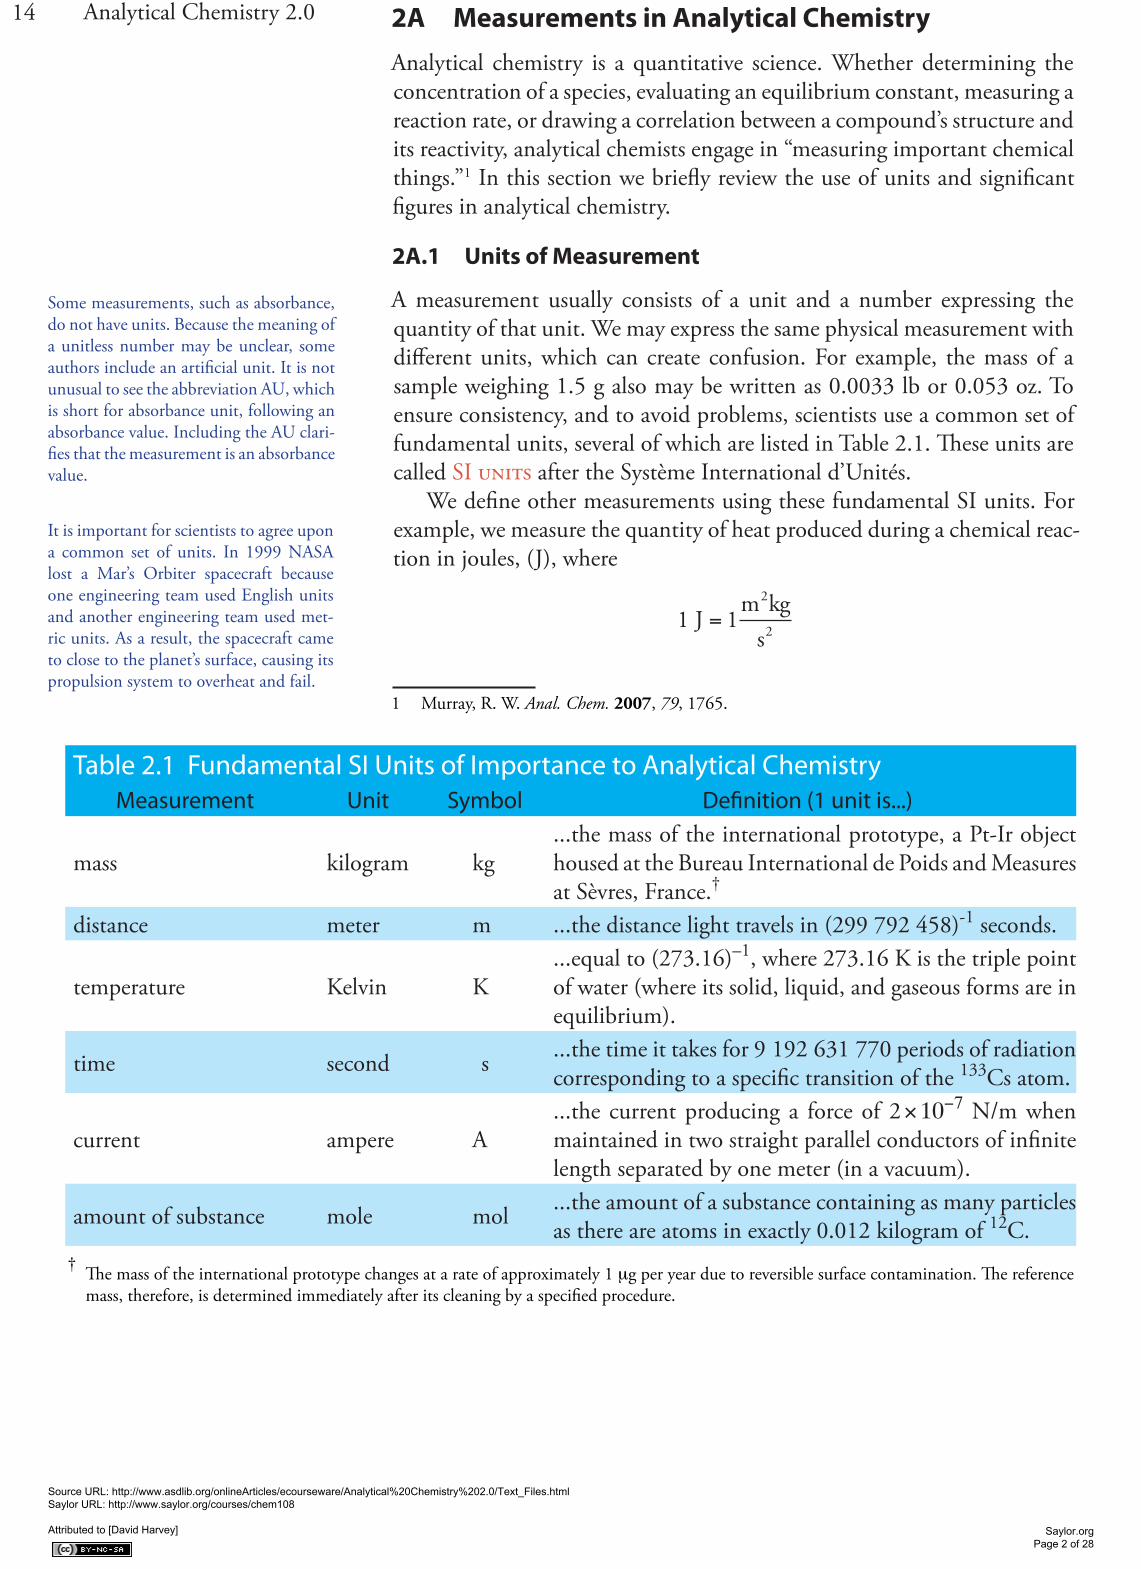
Table 2.1 Fundamental SI Units of Importance to Analytical ChemistryMeasurement Unit Symbol Definition (1 unit is...)
mass kilogram kg...the mass of the international prototype, a Pt-Ir object housed at the Bureau International de Poids and Measures at Sèvres, France.†
distance meter m ...the distance light travels in (299 792 458)-1 seconds.
temperature Kelvin K...equal to (273.16)–1, where 273.16 K is the triple point of water (where its solid, liquid, and gaseous forms are in equilibrium).
time second s ...the time it takes for 9 192 631 770 periods of radiation corresponding to a specific transition of the 133Cs atom.
current ampere A...the current producing a force of 2 × 10⁻⁷ N/m when maintained in two straight parallel conductors of infinite length separated by one meter (in a vacuum).
amount of substance mole mol ...the amount of a substance containing as many particles as there are atoms in exactly 0.012 kilogram of 12C.
† The mass of the international prototype changes at a rate of approximately 1 μg per year due to reversible surface contamination. The reference mass, therefore, is determined immediately after its cleaning by a specified procedure.
It is important for scientists to agree upon a common set of units. In 1999 NASA lost a Mar’s Orbiter spacecraft because one engineering team used English units and another engineering team used met-ric units. As a result, the spacecraft came to close to the planet’s surface, causing its propulsion system to overheat and fail.
Source URL: http://www.asdlib.org/onlineArticles/ecourseware/Analytical%20Chemistry%202.0/Text_Files.html Saylor URL: http://www.saylor.org/courses/chem108 Attributed to [David Harvey]
Saylor.org Page 2 of 28
15Chapter 2 Basic Tools of Analytical Chemistry
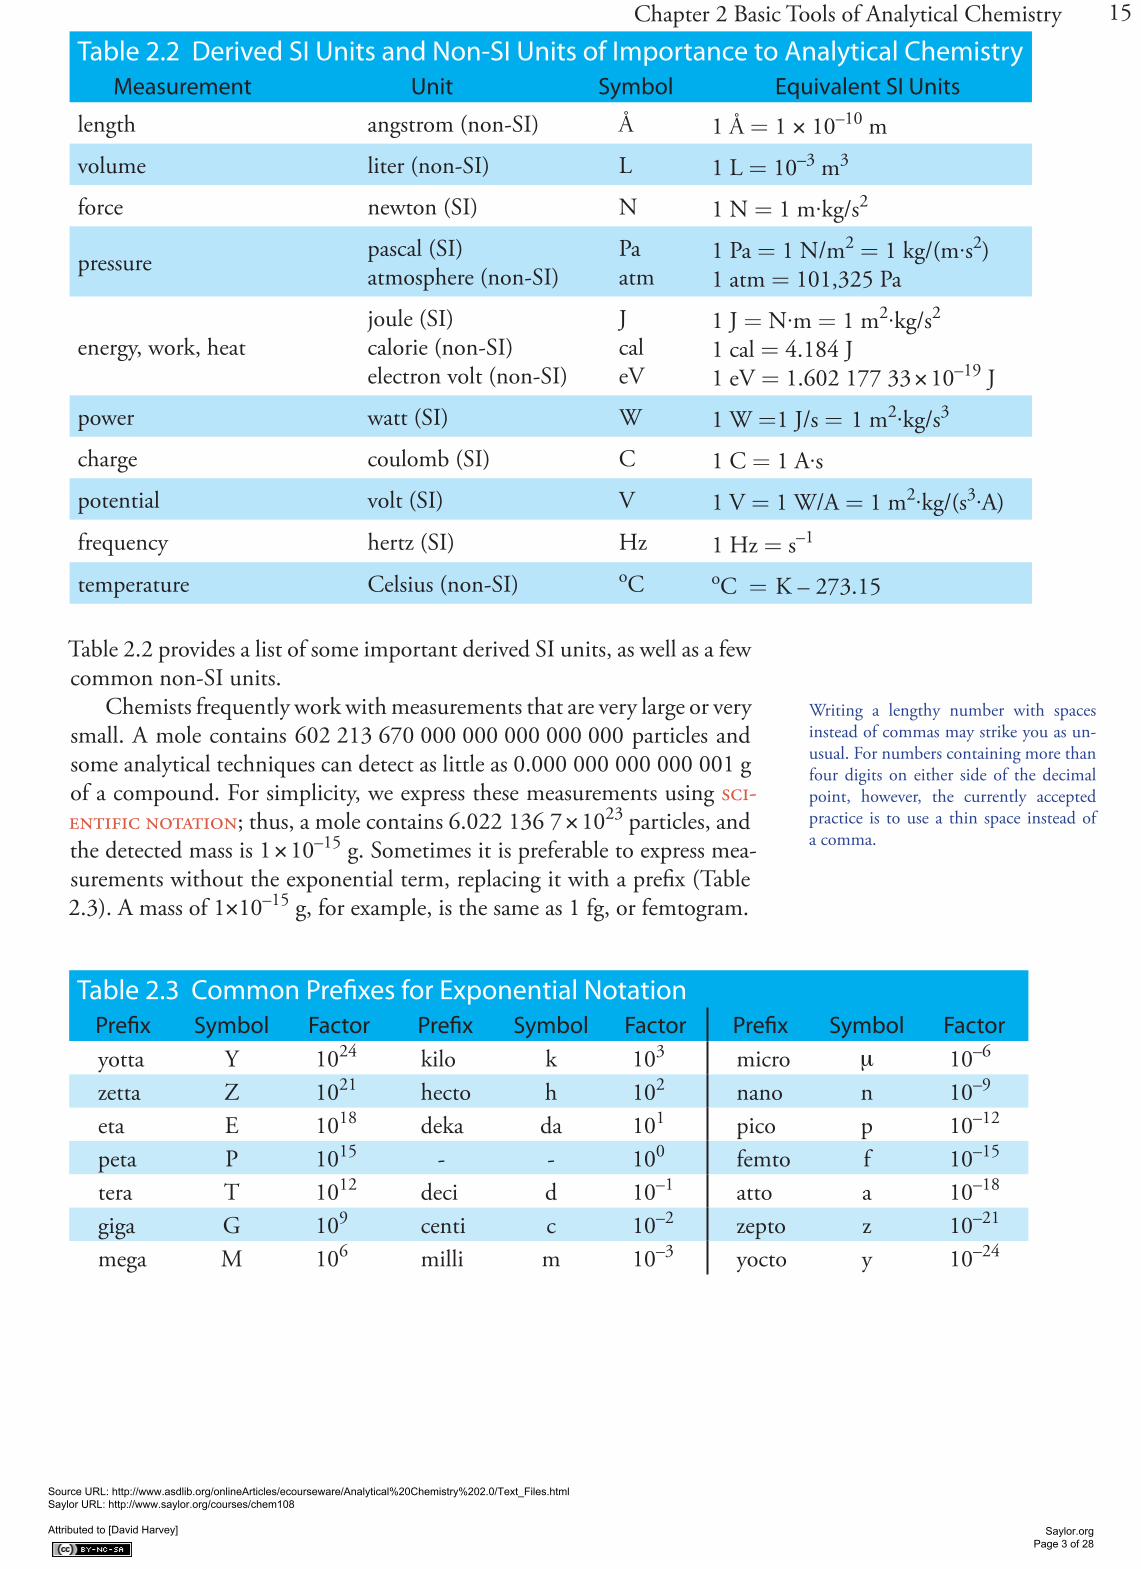
Table 2.2 provides a list of some important derived SI units, as well as a few common non-SI units.
Chemists frequently work with measurements that are very large or very small. A mole contains 602 213 670 000 000 000 000 000 particles and some analytical techniques can detect as little as 0.000 000 000 000 001 g of a compound. For simplicity, we express these measurements using sci-entific notation; thus, a mole contains 6.022 136 7 × 10²³ particles, and the detected mass is 1 × 10–15 g. Sometimes it is preferable to express mea-surements without the exponential term, replacing it with a prefix (Table 2.3). A mass of 1×10–15 g, for example, is the same as 1 fg, or femtogram.
Writing a lengthy number with spaces instead of commas may strike you as un-usual. For numbers containing more than four digits on either side of the decimal point, however, the currently accepted practice is to use a thin space instead of a comma.
Table 2.2 Derived SI Units and Non-SI Units of Importance to Analytical ChemistryMeasurement Unit Symbol Equivalent SI Units
length angstrom (non-SI) Å 1 Å = 1 × 10⁻¹⁰ m
volume liter (non-SI) L 1 L = 10–3 m3
force newton (SI) N 1 N = 1 m·kg/s2
pressure pascal (SI)atmosphere (non-SI)
Paatm
1 Pa = 1 N/m2 = 1 kg/(m·s2)1 atm = 101,325 Pa
energy, work, heatjoule (SI)calorie (non-SI)electron volt (non-SI)
JcaleV
1 J = N·m = 1 m2·kg/s2
1 cal = 4.184 J1 eV = 1.602 177 33 × 10–19 J
power watt (SI) W 1 W =1 J/s = 1 m2·kg/s3
charge coulomb (SI) C 1 C = 1 A·s
potential volt (SI) V 1 V = 1 W/A = 1 m2·kg/(s3·A)
frequency hertz (SI) Hz 1 Hz = s–1
temperature Celsius (non-SI) oC oC = K – 273.15
Table 2.3 Common Prefixes for Exponential NotationPrefix Symbol Factor Prefix Symbol Factor Prefix Symbol Factoryotta Y 1024 kilo k 103 micro μ 10–6
zetta Z 1021 hecto h 102 nano n 10–9
eta E 1018 deka da 101 pico p 10–12
peta P 1015 - - 100 femto f 10–15
tera T 1012 deci d 10–1 atto a 10–18
giga G 109 centi c 10–2 zepto z 10–21
mega M 106 milli m 10–3 yocto y 10–24
Source URL: http://www.asdlib.org/onlineArticles/ecourseware/Analytical%20Chemistry%202.0/Text_Files.html Saylor URL: http://www.saylor.org/courses/chem108 Attributed to [David Harvey]
Saylor.org Page 3 of 28
16 Analytical Chemistry 2.0 2A.2 Uncertainty in Measurements
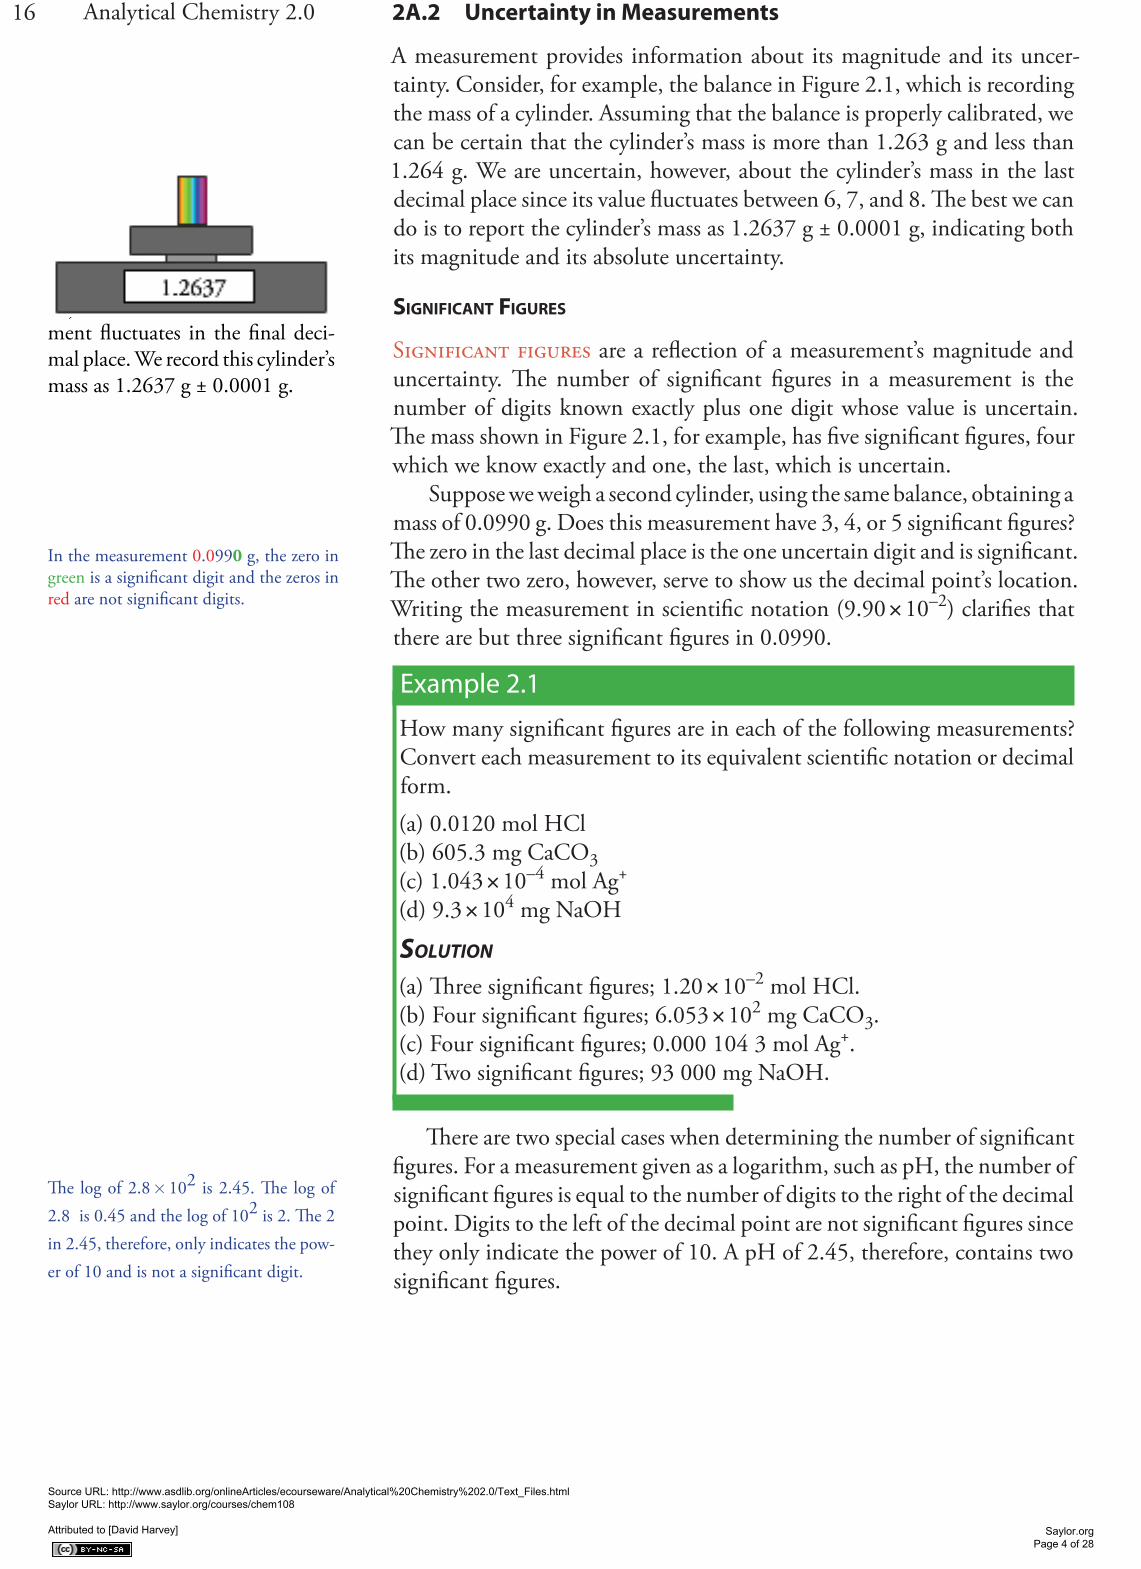
A measurement provides information about its magnitude and its uncer-tainty. Consider, for example, the balance in Figure 2.1, which is recording the mass of a cylinder. Assuming that the balance is properly calibrated, we can be certain that the cylinder’s mass is more than 1.263 g and less than 1.264 g. We are uncertain, however, about the cylinder’s mass in the last decimal place since its value fluctuates between 6, 7, and 8. The best we can do is to report the cylinder’s mass as 1.2637 g ± 0.0001 g, indicating both its magnitude and its absolute uncertainty.
SIGNIFICANT FIGURES
Significant figures are a reflection of a measurement’s magnitude and uncertainty. The number of significant figures in a measurement is the number of digits known exactly plus one digit whose value is uncertain. The mass shown in Figure 2.1, for example, has five significant figures, four which we know exactly and one, the last, which is uncertain.
Suppose we weigh a second cylinder, using the same balance, obtaining a mass of 0.0990 g. Does this measurement have 3, 4, or 5 significant figures? The zero in the last decimal place is the one uncertain digit and is significant. The other two zero, however, serve to show us the decimal point’s location. Writing the measurement in scientific notation (9.90 × 10⁻²) clarifies that there are but three significant figures in 0.0990.
Example 2.1
How many significant figures are in each of the following measurements? Convert each measurement to its equivalent scientific notation or decimal form.(a) 0.0120 mol HCl(b) 605.3 mg CaCO3(c) 1.043 × 10⁻⁴ mol Ag+
(d) 9.3 × 10⁴ mg NaOH
SOLUTION
(a) Three significant figures; 1.20 × 10⁻² mol HCl.(b) Four significant figures; 6.053 × 10² mg CaCO3.(c) Four significant figures; 0.000 104 3 mol Ag+.(d) Two significant figures; 93 000 mg NaOH.
There are two special cases when determining the number of significant figures. For a measurement given as a logarithm, such as pH, the number of significant figures is equal to the number of digits to the right of the decimal point. Digits to the left of the decimal point are not significant figures since they only indicate the power of 10. A pH of 2.45, therefore, contains two significant figures.
Figure 2.1 When weighing an object on a balance, the measure-ment fluctuates in the final deci-mal place. We record this cylinder’s mass as 1.2637 g ± 0.0001 g.
In the measurement 0.0990 g, the zero in green is a significant digit and the zeros in red are not significant digits.
The log of 2.8 × 10² is 2.45. The log of 2.8 is 0.45 and the log of 102 is 2. The 2 in 2.45, therefore, only indicates the pow-er of 10 and is not a significant digit.
Source URL: http://www.asdlib.org/onlineArticles/ecourseware/Analytical%20Chemistry%202.0/Text_Files.html Saylor URL: http://www.saylor.org/courses/chem108 Attributed to [David Harvey]
Saylor.org Page 4 of 28
17Chapter 2 Basic Tools of Analytical ChemistryAn exact number has an infinite number of significant figures. Stoi-
chiometric coefficients are one example of an exact number. A mole of CaCl2, for example, contains exactly two moles of chloride and one mole of calcium. Another example of an exact number is the relationship between some units. There are, for example, exactly 1000 mL in 1 L. Both the 1 and the 1000 have an infinite number of significant figures.
Using the correct number of significant figures is important because it tells other scientists about the uncertainty of your measurements. Suppose you weigh a sample on a balance that measures mass to the nearest ±0.1 mg. Reporting the sample’s mass as 1.762 g instead of 1.7623 g is incorrect because it does not properly convey the measurement’s uncertainty. Report-ing the sample’s mass as 1.76231 g also is incorrect because it falsely suggest an uncertainty of ±0.01 mg.
SIGNIFICANT FIGURES IN CALCULATIONS
Significant figures are also important because they guide us when reporting the result of an analysis. In calculating a result, the answer can never be more certain than the least certain measurement in the analysis. Rounding answers to the correct number of significant figures is important.
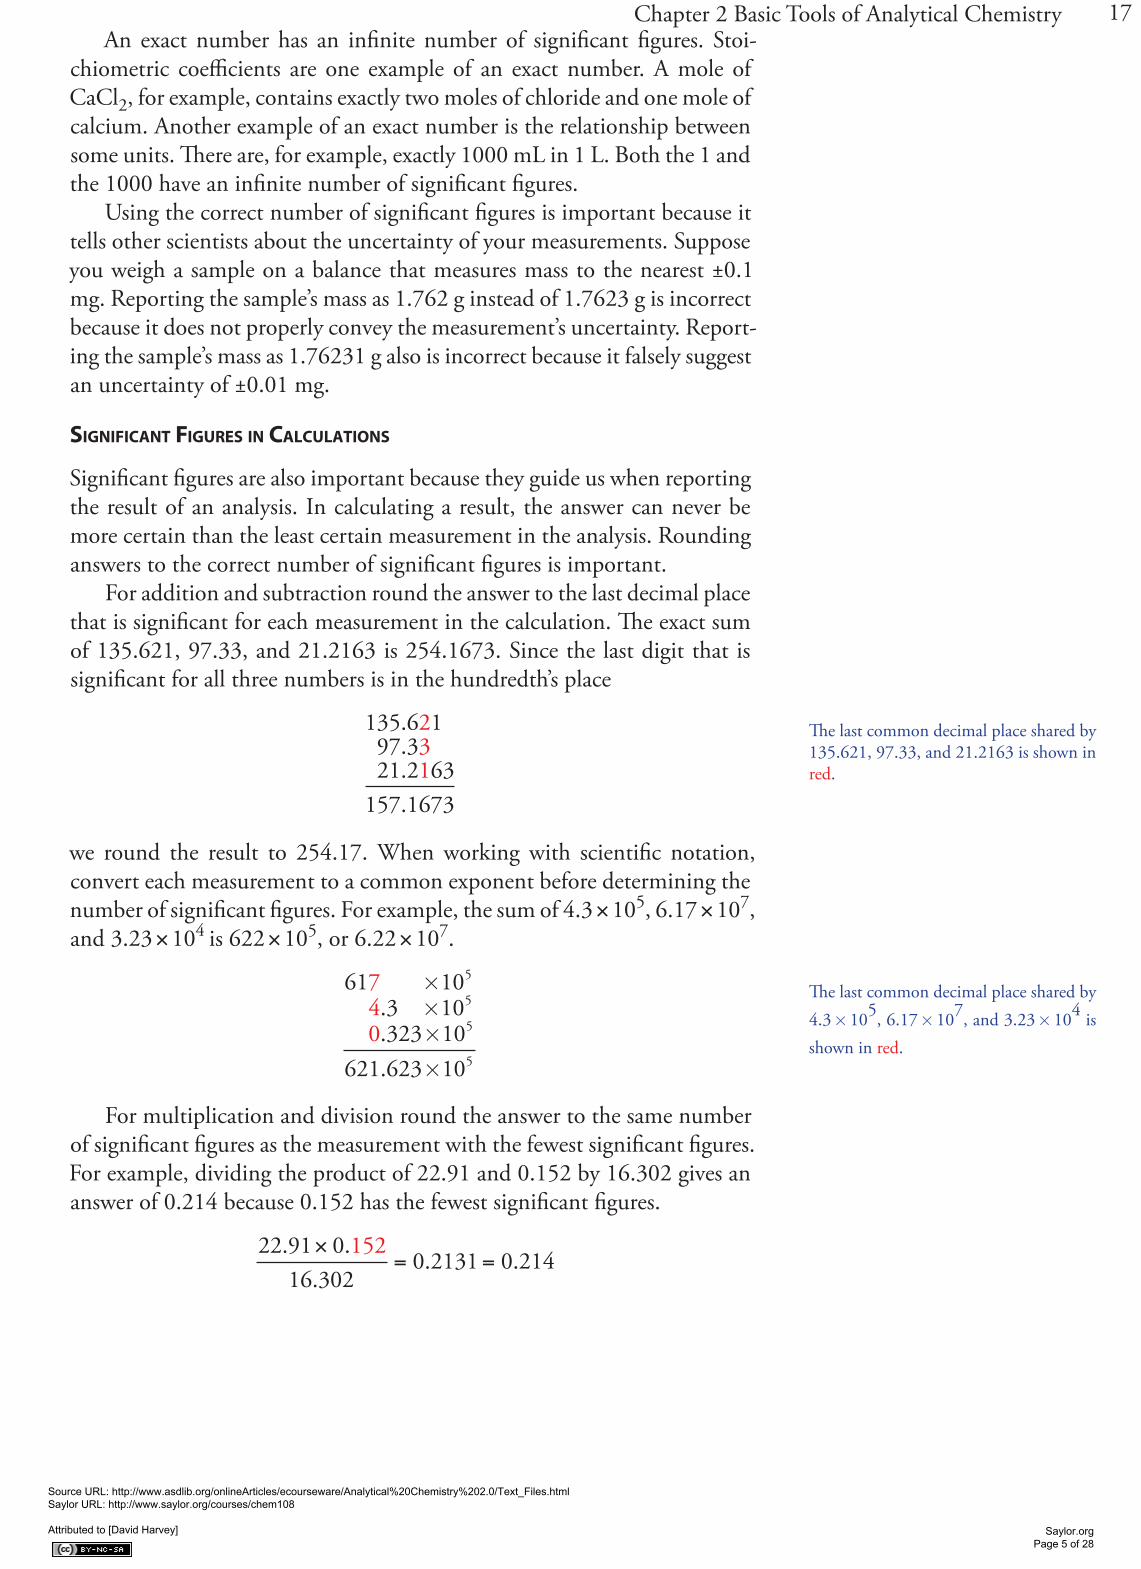
For addition and subtraction round the answer to the last decimal place that is significant for each measurement in the calculation. The exact sum of 135.621, 97.33, and 21.2163 is 254.1673. Since the last digit that is significant for all three numbers is in the hundredth’s place
135.6 197.321.2 63
157.1673
231
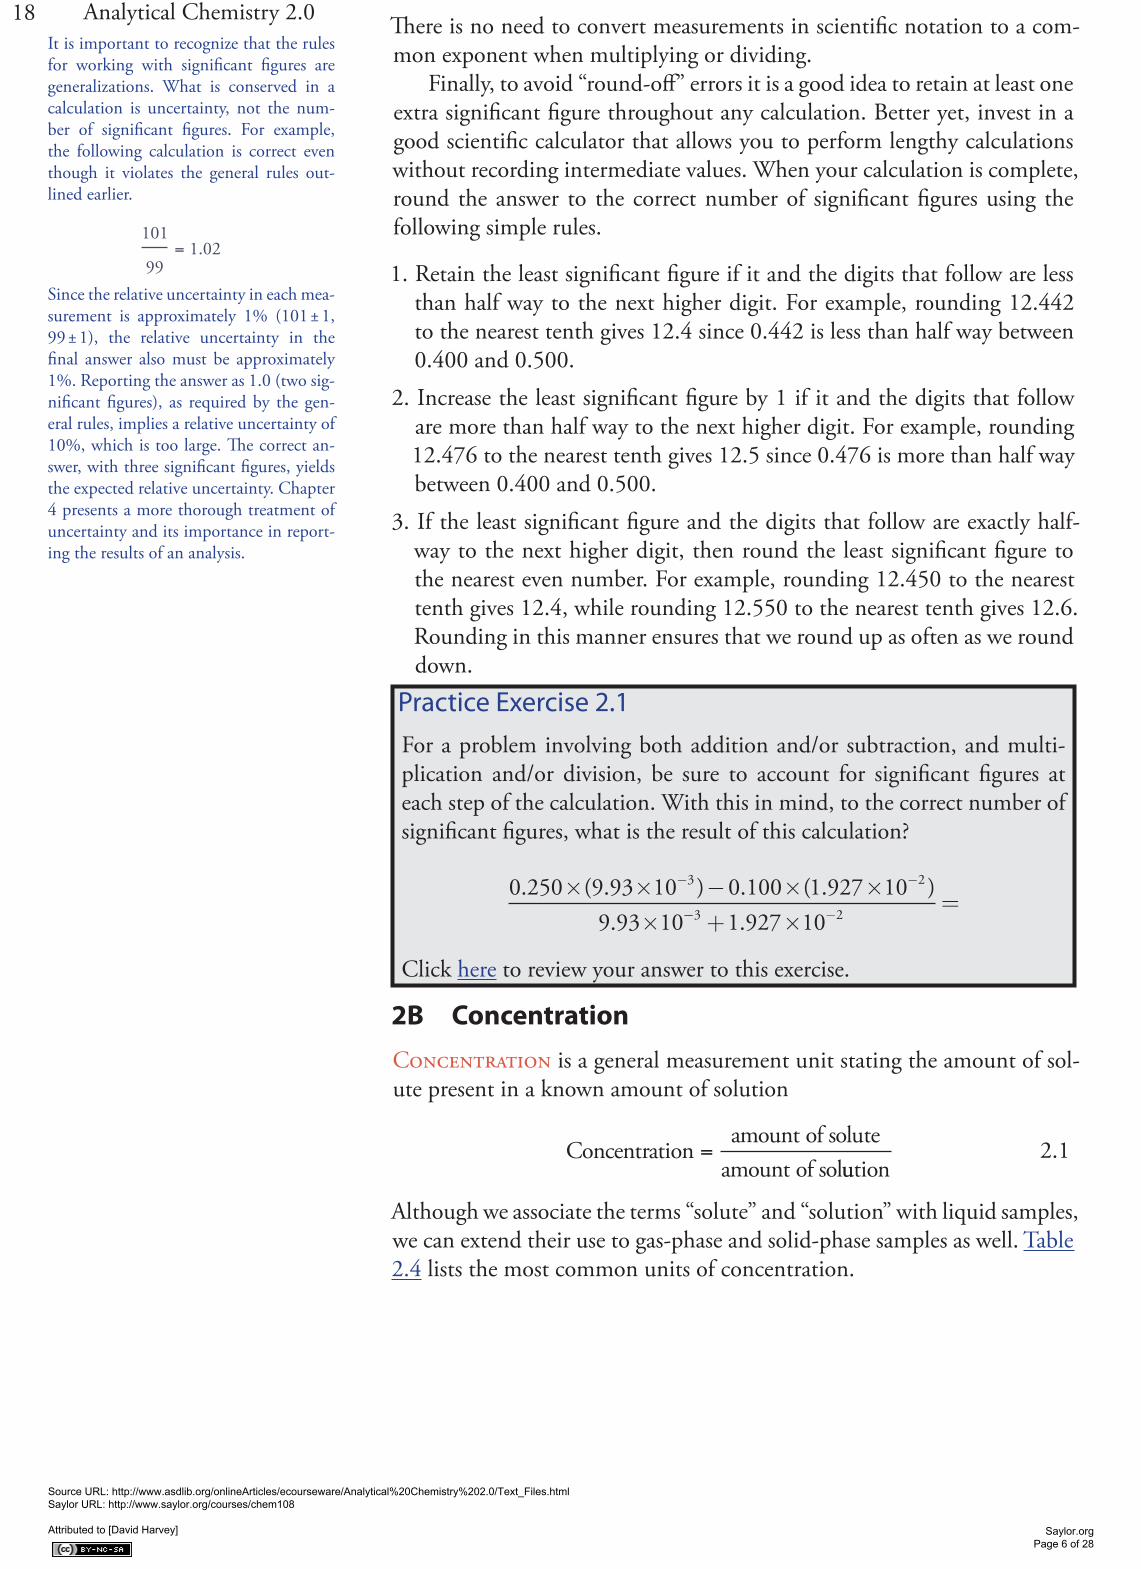
we round the result to 254.17. When working with scientific notation, convert each measurement to a common exponent before determining the number of significant figures. For example, the sum of 4.3 × 10⁵, 6.17 × 10⁷, and 3.23 × 10⁴ is 622 × 105, or 6.22 × 10⁷.
61 103 10323 10
621 623 10
740
5
5
5
5
.
.
.
.
××××
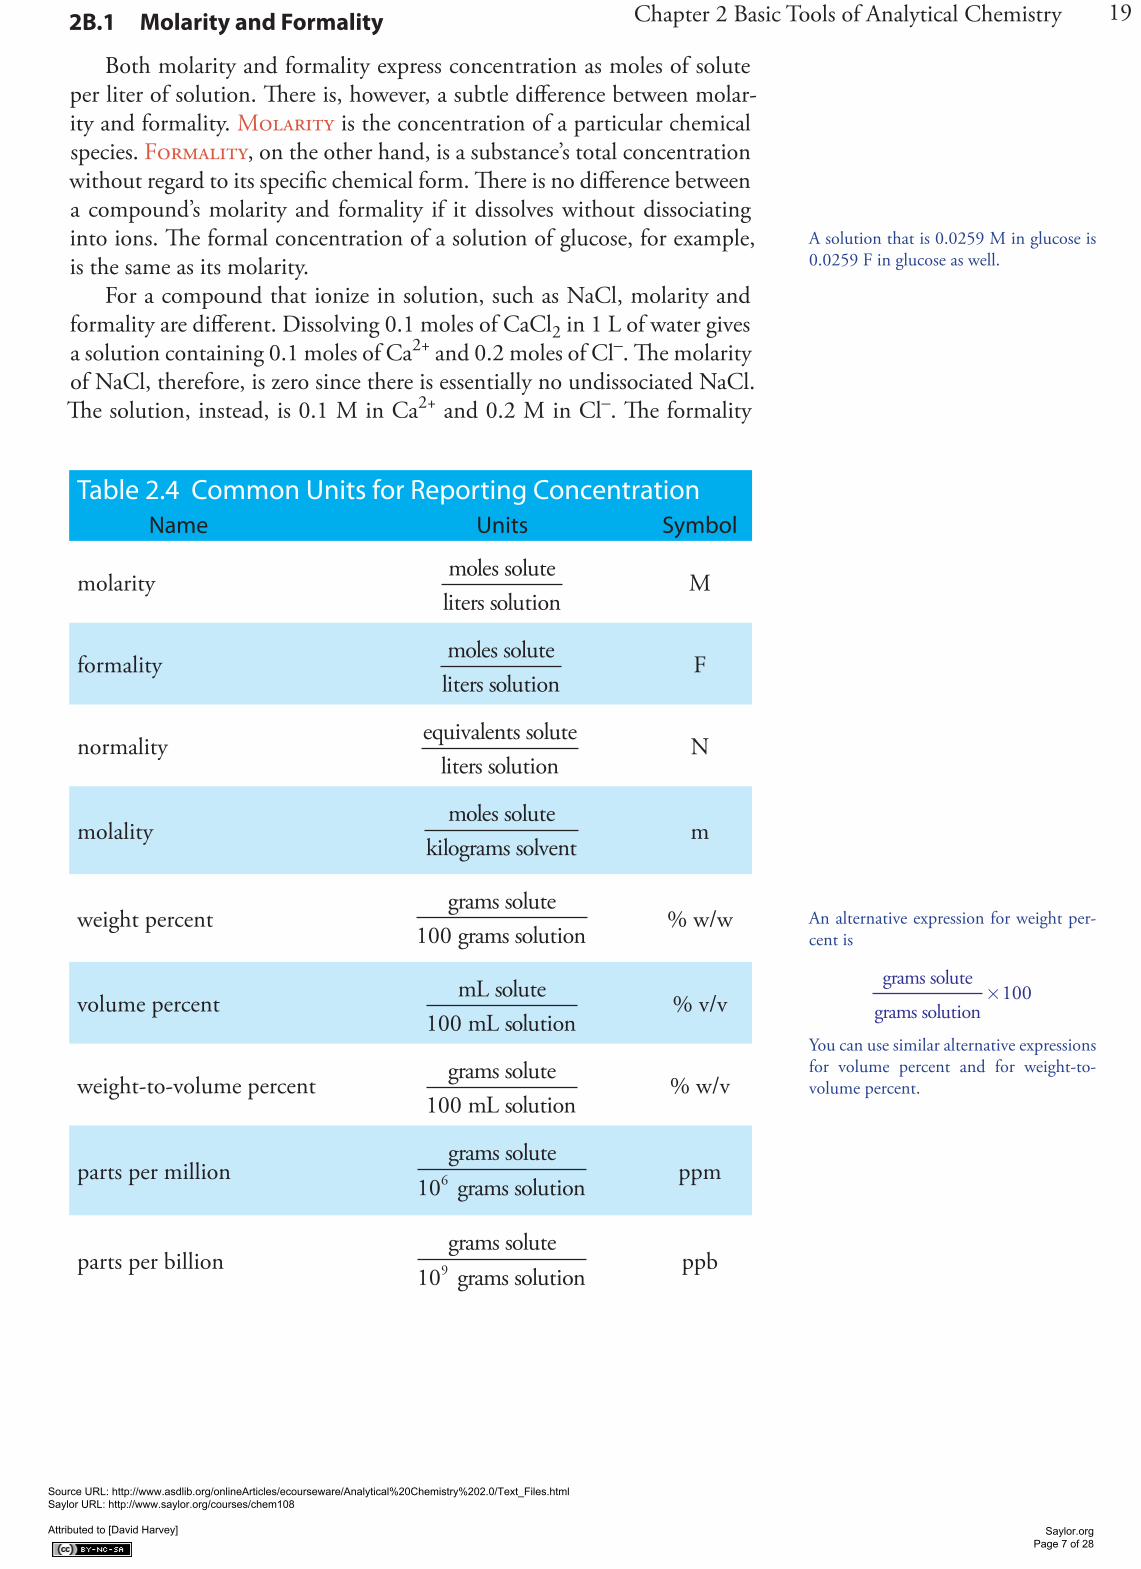
For multiplication and division round the answer to the same number of significant figures as the measurement with the fewest significant figures. For example, dividing the product of 22.91 and 0.152 by 16.302 gives an answer of 0.214 because 0.152 has the fewest significant figures.
22 91 016 302
0 2131 0 214152. .
.. .
×= =
The last common decimal place shared by 135.621, 97.33, and 21.2163 is shown in red.
The last common decimal place shared by 4.3 × 10⁵, 6.17 × 10⁷, and 3.23 × 10⁴ is shown in red.
Source URL: http://www.asdlib.org/onlineArticles/ecourseware/Analytical%20Chemistry%202.0/Text_Files.html Saylor URL: http://www.saylor.org/courses/chem108 Attributed to [David Harvey]
Saylor.org Page 5 of 28
18 Analytical Chemistry 2.0 There is no need to convert measurements in scientific notation to a com-mon exponent when multiplying or dividing.
Finally, to avoid “round-off” errors it is a good idea to retain at least one extra significant figure throughout any calculation. Better yet, invest in a good scientific calculator that allows you to perform lengthy calculations without recording intermediate values. When your calculation is complete, round the answer to the correct number of significant figures using the following simple rules.
1. Retain the least significant figure if it and the digits that follow are less than half way to the next higher digit. For example, rounding 12.442 to the nearest tenth gives 12.4 since 0.442 is less than half way between 0.400 and 0.500.
2. Increase the least significant figure by 1 if it and the digits that follow are more than half way to the next higher digit. For example, rounding 12.476 to the nearest tenth gives 12.5 since 0.476 is more than half way between 0.400 and 0.500.
3. If the least significant figure and the digits that follow are exactly half-way to the next higher digit, then round the least significant figure to the nearest even number. For example, rounding 12.450 to the nearest tenth gives 12.4, while rounding 12.550 to the nearest tenth gives 12.6. Rounding in this manner ensures that we round up as often as we round down.
2B Concentration
Concentration is a general measurement unit stating the amount of sol-ute present in a known amount of solution
Concentrationamount of solute
amount of sol=
uution2.1
Although we associate the terms “solute” and “solution” with liquid samples, we can extend their use to gas-phase and solid-phase samples as well. Table 2.4 lists the most common units of concentration.
It is important to recognize that the rules for working with significant figures are generalizations. What is conserved in a calculation is uncertainty, not the num-ber of significant figures. For example, the following calculation is correct even though it violates the general rules out-lined earlier.
101
991 02= .
Since the relative uncertainty in each mea-surement is approximately 1% (101 ± 1, 99 ± 1), the relative uncertainty in the final answer also must be approximately 1%. Reporting the answer as 1.0 (two sig-nificant figures), as required by the gen-eral rules, implies a relative uncertainty of 10%, which is too large. The correct an-swer, with three significant figures, yields the expected relative uncertainty. Chapter 4 presents a more thorough treatment of uncertainty and its importance in report-ing the results of an analysis.
Practice Exercise 2.1For a problem involving both addition and/or subtraction, and multi-plication and/or division, be sure to account for significant figures at each step of the calculation. With this in mind, to the correct number of significant figures, what is the result of this calculation?
0 250 9 93 10 0 100 1 927 109 93 10
3 2. ( . ) . ( . ).
× × − × ××
− −
−− −+ ×=
3 21 927 10.
Click here to review your answer to this exercise.
Source URL: http://www.asdlib.org/onlineArticles/ecourseware/Analytical%20Chemistry%202.0/Text_Files.html Saylor URL: http://www.saylor.org/courses/chem108 Attributed to [David Harvey]
Saylor.org Page 6 of 28
19Chapter 2 Basic Tools of Analytical Chemistry2B.1 Molarity and Formality
Both molarity and formality express concentration as moles of solute per liter of solution. There is, however, a subtle difference between molar-ity and formality. Molarity is the concentration of a particular chemical species. Formality, on the other hand, is a substance’s total concentration without regard to its specific chemical form. There is no difference between a compound’s molarity and formality if it dissolves without dissociating into ions. The formal concentration of a solution of glucose, for example, is the same as its molarity.
For a compound that ionize in solution, such as NaCl, molarity and formality are different. Dissolving 0.1 moles of CaCl2 in 1 L of water gives a solution containing 0.1 moles of Ca2+ and 0.2 moles of Cl–. The molarity of NaCl, therefore, is zero since there is essentially no undissociated NaCl. The solution, instead, is 0.1 M in Ca2+ and 0.2 M in Cl–. The formality
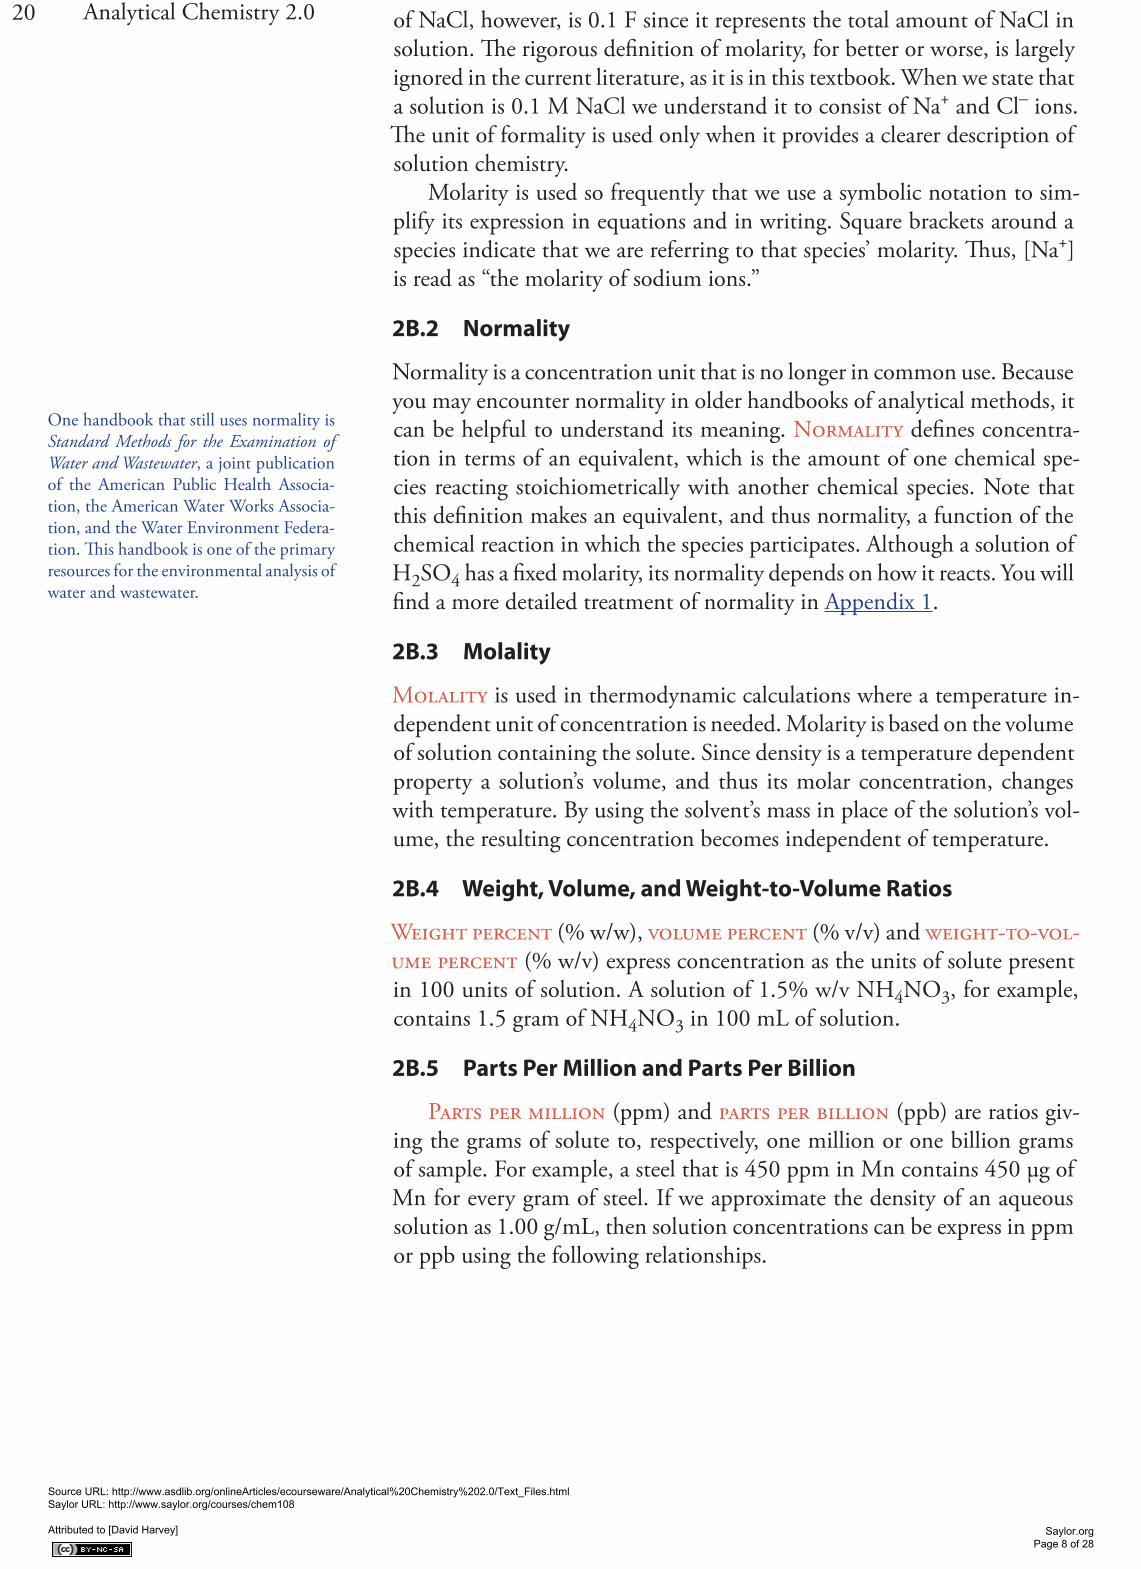
Table 2.4 Common Units for Reporting ConcentrationName Units Symbol
molarity moles soluteliters solution
M
formality moles soluteliters solution
F
normality equivalents soluteliters solution
N
molalitymoles solute
kilograms solventm
weight percentgrams solute
100 grams solution% w/w
volume percent mL solute100 mL solution
% v/v
weight-to-volume percent grams solute100 mL solution
% w/v
parts per milliongrams solute
10 grams solution6 ppm
parts per billiongrams solute
10 grams solution9 ppb
A solution that is 0.0259 M in glucose is 0.0259 F in glucose as well.
An alternative expression for weight per-cent is
grams solute
grams solution×100
You can use similar alternative expressions for volume percent and for weight-to-volume percent.
Source URL: http://www.asdlib.org/onlineArticles/ecourseware/Analytical%20Chemistry%202.0/Text_Files.html Saylor URL: http://www.saylor.org/courses/chem108 Attributed to [David Harvey]
Saylor.org Page 7 of 28
20 Analytical Chemistry 2.0 of NaCl, however, is 0.1 F since it represents the total amount of NaCl in solution. The rigorous definition of molarity, for better or worse, is largely ignored in the current literature, as it is in this textbook. When we state that a solution is 0.1 M NaCl we understand it to consist of Na+ and Cl– ions. The unit of formality is used only when it provides a clearer description of solution chemistry.
Molarity is used so frequently that we use a symbolic notation to sim-plify its expression in equations and in writing. Square brackets around a species indicate that we are referring to that species’ molarity. Thus, [Na+] is read as “the molarity of sodium ions.”
2B.2 Normality
Normality is a concentration unit that is no longer in common use. Because you may encounter normality in older handbooks of analytical methods, it can be helpful to understand its meaning. Normality defines concentra-tion in terms of an equivalent, which is the amount of one chemical spe-cies reacting stoichiometrically with another chemical species. Note that this definition makes an equivalent, and thus normality, a function of the chemical reaction in which the species participates. Although a solution of H2SO4 has a fixed molarity, its normality depends on how it reacts. You will find a more detailed treatment of normality in Appendix 1.
2B.3 Molality
Molality is used in thermodynamic calculations where a temperature in-dependent unit of concentration is needed. Molarity is based on the volume of solution containing the solute. Since density is a temperature dependent property a solution’s volume, and thus its molar concentration, changes with temperature. By using the solvent’s mass in place of the solution’s vol-ume, the resulting concentration becomes independent of temperature.
2B.4 Weight, Volume, and Weight-to-Volume Ratios
Weight percent (% w/w), volume percent (% v/v) and weight-to-vol-ume percent (% w/v) express concentration as the units of solute present in 100 units of solution. A solution of 1.5% w/v NH4NO3, for example, contains 1.5 gram of NH4NO3 in 100 mL of solution.
2B.5 Parts Per Million and Parts Per Billion
Parts per million (ppm) and parts per billion (ppb) are ratios giv-ing the grams of solute to, respectively, one million or one billion grams of sample. For example, a steel that is 450 ppm in Mn contains 450 μg of Mn for every gram of steel. If we approximate the density of an aqueous solution as 1.00 g/mL, then solution concentrations can be express in ppm or ppb using the following relationships.
One handbook that still uses normality is Standard Methods for the Examination of Water and Wastewater, a joint publication of the American Public Health Associa-tion, the American Water Works Associa-tion, and the Water Environment Federa-tion. This handbook is one of the primary resources for the environmental analysis of water and wastewater.
Source URL: http://www.asdlib.org/onlineArticles/ecourseware/Analytical%20Chemistry%202.0/Text_Files.html Saylor URL: http://www.saylor.org/courses/chem108 Attributed to [David Harvey]
Saylor.org Page 8 of 28
21Chapter 2 Basic Tools of Analytical Chemistry
ppmmgL
gg
= =
ppbg
LngmL
= =
For gases a part per million usually is a volume ratio. Thus, a helium con-centration of 6.3 ppm means that one liter of air contains 6.3 μL of He.
2B.6 Converting Between Concentration Units
The most common ways to express concentration in analytical chemistry are molarity, weight percent, volume percent, weight-to-volume percent, parts per million and parts per billion. By recognizing the general defini-tion of concentration given in equation 2.1, it is easy to convert between concentration units.
Example 2.2
A concentrated solution of ammonia is 28.0% w/w NH3 and has a density of 0.899 g/mL. What is the molar concentration of NH3 in this solu-tion?
SOLUTION
28 0 0 899. .g NH100 g solution
g solutionmL
3 ×solution
mol NH17.04 g NH
mLL
3
3
× × =1 1000
14..8 M
Example 2.3
The maximum permissible concentration of chloride in a municipal drink-ing water supply is 2.50 × 10² ppm Cl–. When the supply of water exceeds this limit it often has a distinctive salty taste. What is the equivalent molar concentration of Cl–?
SOLUTION
2 50 10 1 135 453
2..
×× ×
mg ClL
g1000 mg
mol Cl− −
g ClM
−−= ×7 05 10 3.
You should be careful when using parts per million and parts per billion to express the concentration of an aqueous solute. The difference between a solute’s concen-tration in mg/L and μg/g, for example, is significant if the solution’s density is not 1.00 g/mL. For this reason many organi-zations advise against using the abbrevia-tion ppm and ppb (see www.nist.gov). If in doubt, include the exact units, such as 0.53 μg Pb2+/L for the concentration of lead in a sample of seawater.
Practice Exercise 2.2Which solution—0.50 M NaCl or 0.25 M SrCl2—has the larger concen-tration when expressed in μg/mL?
Click here to review your answer to this exercise.
Source URL: http://www.asdlib.org/onlineArticles/ecourseware/Analytical%20Chemistry%202.0/Text_Files.html Saylor URL: http://www.saylor.org/courses/chem108 Attributed to [David Harvey]
Saylor.org Page 9 of 28
22 Analytical Chemistry 2.0
2B.7 p-Functions
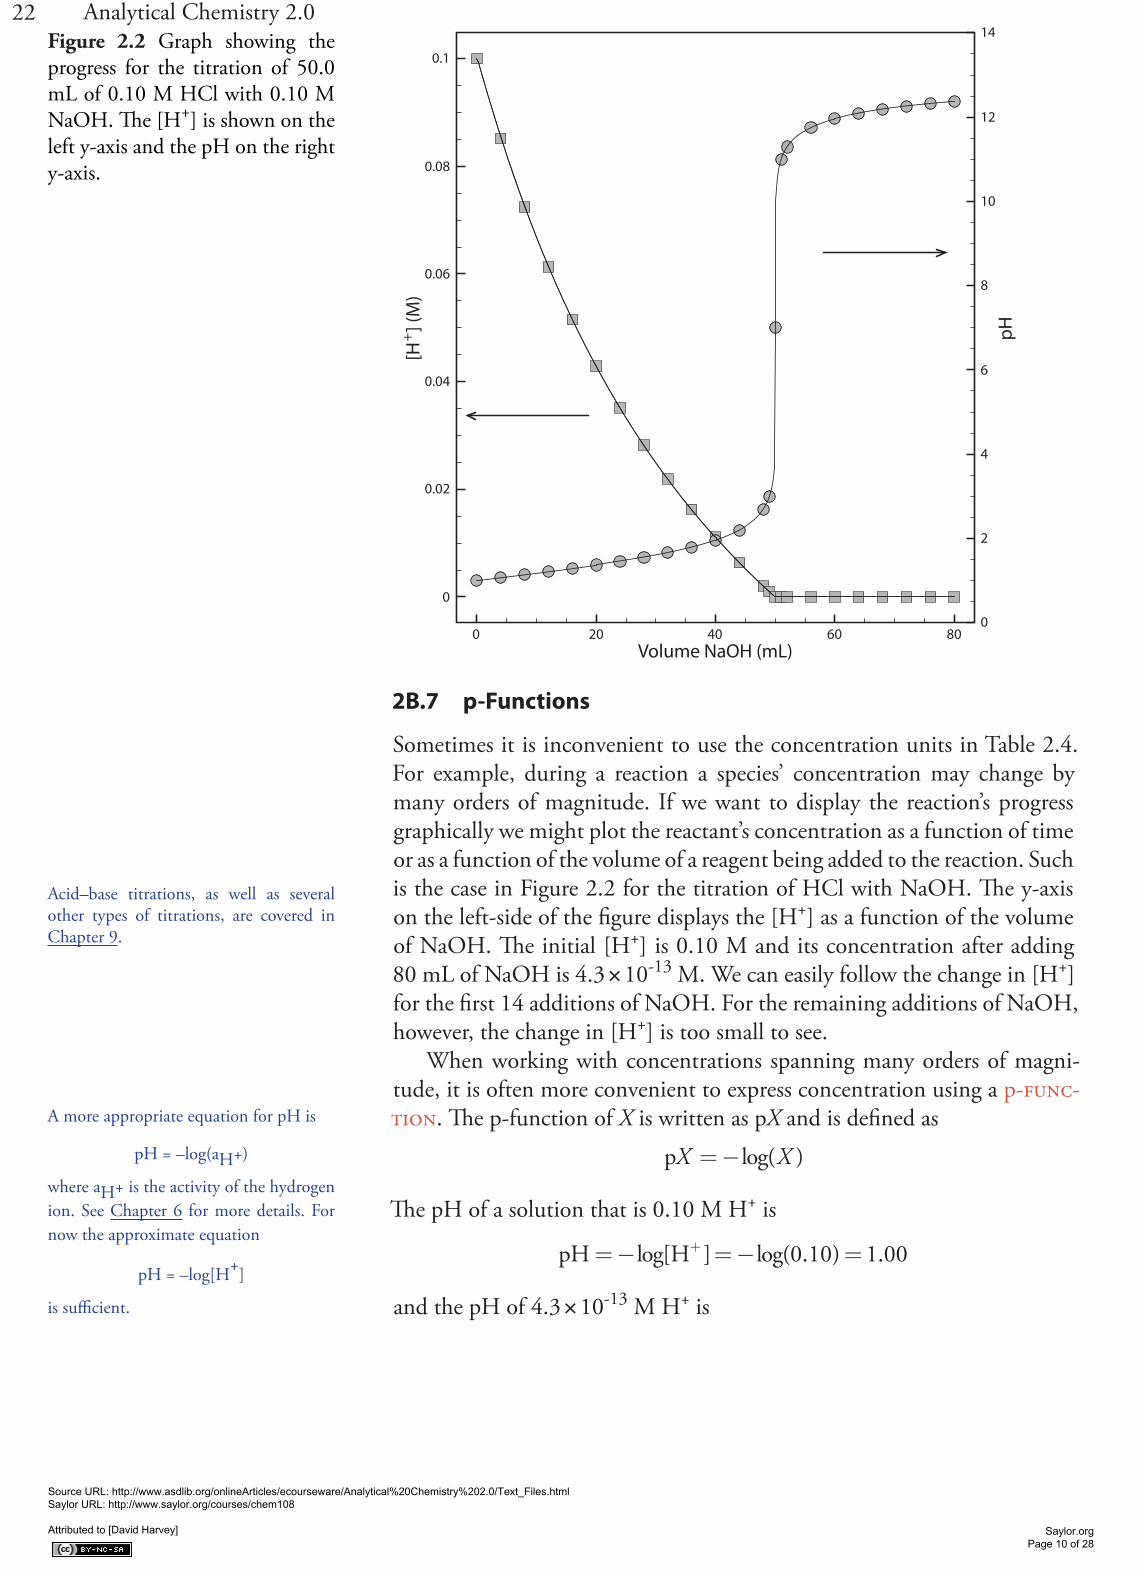
Sometimes it is inconvenient to use the concentration units in Table 2.4. For example, during a reaction a species’ concentration may change by many orders of magnitude. If we want to display the reaction’s progress graphically we might plot the reactant’s concentration as a function of time or as a function of the volume of a reagent being added to the reaction. Such is the case in Figure 2.2 for the titration of HCl with NaOH. The y-axis on the left-side of the figure displays the [H+] as a function of the volume of NaOH. The initial [H+] is 0.10 M and its concentration after adding 80 mL of NaOH is 4.3 × 10⁻¹³ M. We can easily follow the change in [H+] for the first 14 additions of NaOH. For the remaining additions of NaOH, however, the change in [H+] is too small to see.
When working with concentrations spanning many orders of magni-tude, it is often more convenient to express concentration using a p-func-tion. The p-function of X is written as pX and is defined as
pX X=−log( )
The pH of a solution that is 0.10 M H+ is
pH H=− =− =+log[ ] log( . ) .0 10 1 00
and the pH of 4.3 × 10⁻¹³ M H+ is
0 20 40 60 80Volume NaOH (mL)
0
0.02
0.04
0.06
0.08
0.1
[H] (
M)
0
2
4
6
8
10
12
14
pH
Figure 2.2 Graph showing the progress for the titration of 50.0 mL of 0.10 M HCl with 0.10 M NaOH. The [H+] is shown on the left y-axis and the pH on the right y-axis.
Acid–base titrations, as well as several other types of titrations, are covered in Chapter 9.
A more appropriate equation for pH is
pH = –log(aH+)
where aH+ is the activity of the hydrogen ion. See Chapter 6 for more details. For now the approximate equation
pH = –log[H+]
is sufficient.
Source URL: http://www.asdlib.org/onlineArticles/ecourseware/Analytical%20Chemistry%202.0/Text_Files.html Saylor URL: http://www.saylor.org/courses/chem108 Attributed to [David Harvey]
Saylor.org Page 10 of 28
23Chapter 2 Basic Tools of Analytical ChemistrypH H=− =− × =+ −log[ ] log( . ) .4 3 10 12 3713
Figure 2.2 shows that plotting pH as a function of the volume of NaOH provides more detail about how the concentration of H+ changes during the titration.
Example 2.4
What is pNa for a solution of 1.76 × 10⁻³ M Na3PO4?
SOLUTION
Since each mole of Na3PO4 contains three moles of Na+, the concentra-tion of Na+ is
[Na Mmol Na
mol Na PO
+
3 4
+ −= ×( )× =] . .1 76 103
5 23 88 10 3× − M
and pNa is
pNa Na=− =− × =+ −log[ ] log( . ) .5 28 10 2 2773
Example 2.5
What is the [H+] in a solution that has a pH of 5.16?
SOLUTION
The concentration of H+ is
pH H=− =+log[ ] .5 16
log[ ] .H+ =−5 16
[ ] log( . ) ..H anti M+ − −= − = = ×5 16 10 6 9 105 16 6
If X = 10a, then log(X) = a.
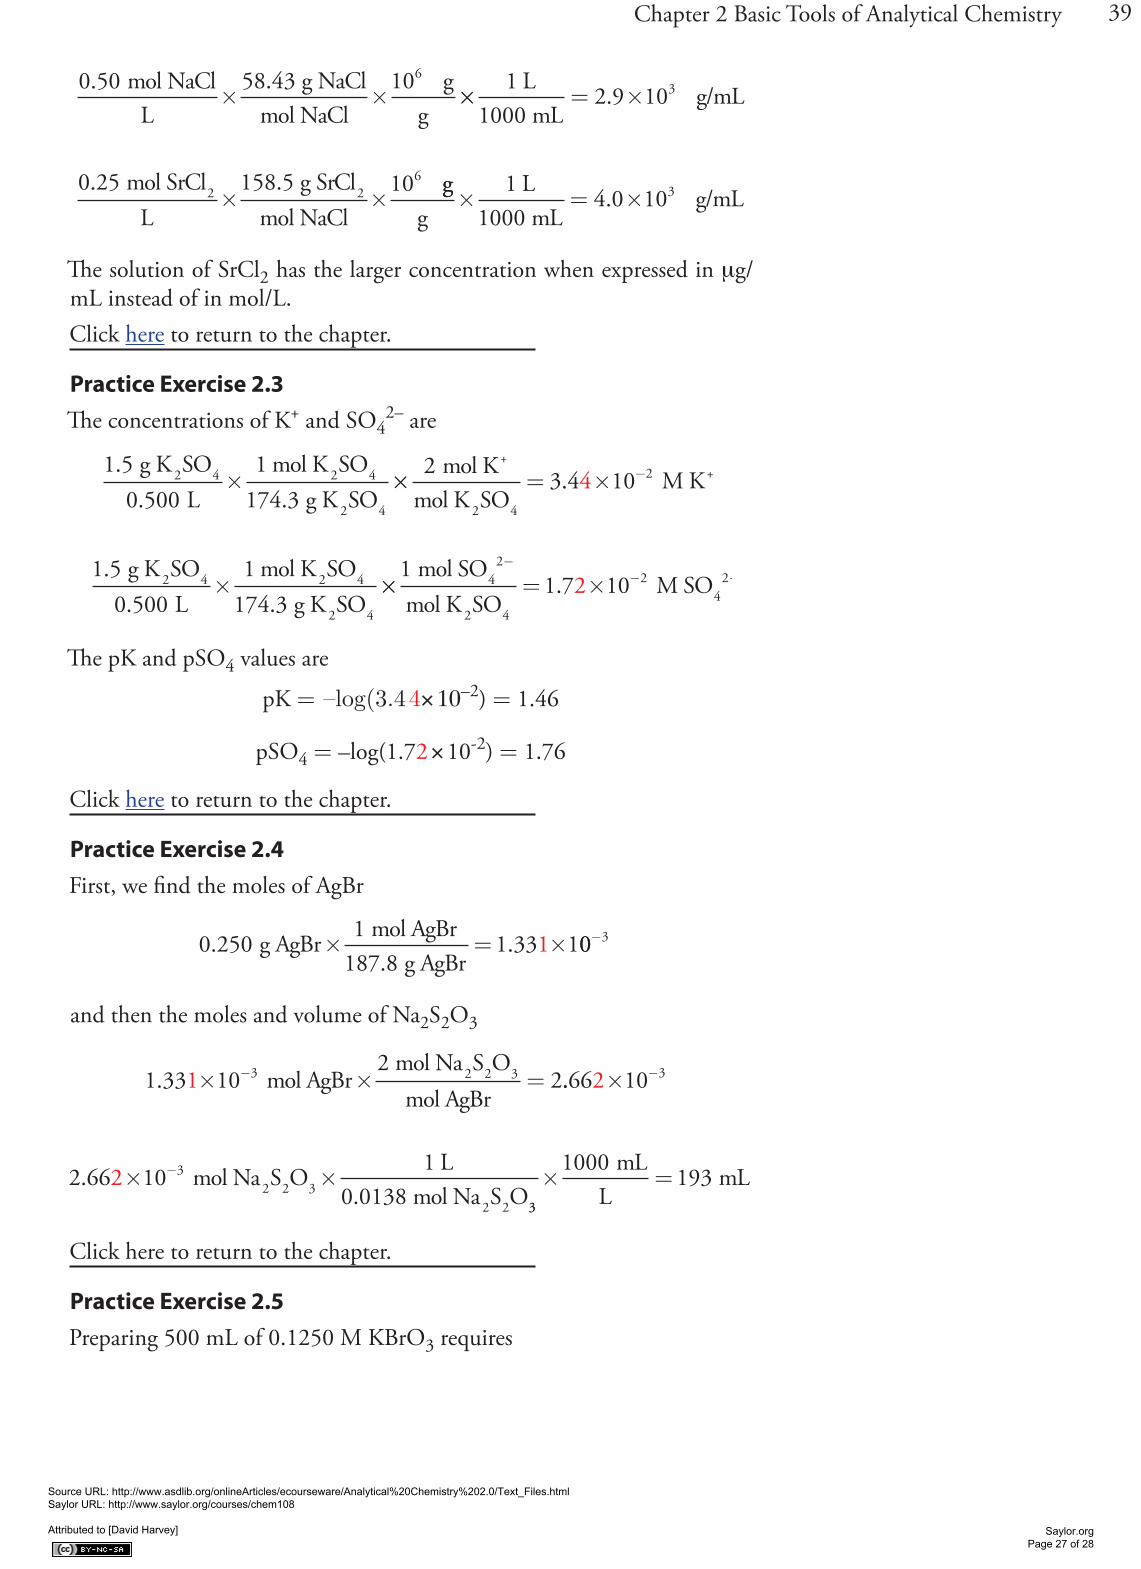
Practice Exercise 2.3What is pK and pSO4 for a solution containing 1.5 g K2SO4 in a total volume of 500.0 mL?
Click here to review your answer to this exercise.
2C Stoichiometric Calculations
A balanced reaction, which gives the stoichiometric relationship between the moles of reactants and the moles of products, provides the basis for many analytical calculations. Consider, for example, an analysis for oxalic acid, H2C2O4, in which Fe3+ oxidizes oxalic acid to CO2.
Source URL: http://www.asdlib.org/onlineArticles/ecourseware/Analytical%20Chemistry%202.0/Text_Files.html Saylor URL: http://www.saylor.org/courses/chem108 Attributed to [David Harvey]
Saylor.org Page 11 of 28
24 Analytical Chemistry 2.02 2
2 2
34
22
Fe H C O H O
Fe CO2 2 2
+
+
+ + →
+
( ) ( ) ( )
( )
aq aq l
aq (( ) ( )g aq+ +2H O3
The balanced reaction indicates that one mole of oxalic acid reacts with two moles of Fe3+. As shown in Example 2.6, we can use this balanced reaction to determine the amount of oxalic acid in a sample of rhubarb.
Example 2.6
The amount of oxalic acid in a sample of rhubarb was determined by react-ing with Fe3+. After extracting a 10.62 g of rhubarb with a solvent, oxida-tion of the oxalic acid required 36.44 mL of 0.0130 M Fe3+. What is the weight percent of oxalic acid in the sample of rhubarb?
SOLUTION
We begin by calculating the moles of Fe3+ used in the reaction
0 01300 03644 4 73 107 4.. .
mol FeL
L mol F3+
× = × − ee3+
The moles of oxalic acid reacting with the Fe3+, therefore, is
4 73 101
7 4. × × =− mol Femol H C O2 mol Fe
3+ 2 2 43+
22 36 108 4. × − mol H C O2 2 4
Converting the moles of oxalic acid to grams of oxalic acid
2 36 1090 03
8 4..
× ×− mol C H Og H C O
mol H C2 2 42 2 4
2 22 42 2 4O
g H C O= × −2 13 102 2.
and calculating the weight percent gives the concentration of oxalic acid in the sample of rhubarb as
2 13 1010 62
100 0 202 2.
..
×× =
− g H C Og rhubarb
2 2 4 11% w/w H C O2 2 4
The analyte in Example 2.6, oxalic acid, is in a chemically useful form because there is a reagent, Fe3+, that reacts with it quantitatively. In many analytical methods, we must convert the analyte into a more accessible
Oxalic acid, in sufficient amounts, is toxic. At lower physiological concentrations it leads to the formation of kidney stones. The leaves of the rhubarb plant contain relatively high concentrations of oxalic acid. The stalk, which many individuals enjoy eating, contains much smaller con-centrations of oxalic acid.
O OH
OHO
oxalic acid
Practice Exercise 2.4You can dissolve a precipitate of AgBr by reacting it with Na2S2O3, as shown here.
AgBr(s) + 2Na2S2O3(aq)→Ag(S2O3)23–(aq) + Br–(aq) + 4Na+(aq)
How many mL of 0.0138 M Na2S2O3 do you need to dissolve 0.250 g of AgBr?
Click here to review your answer to this question
Note that we retain an extra significant figure throughout the calculation, round-ing to the correct number of significant figures at the end. We will follow this con-vention in any problem involving more than one step.
If we forget that we are retaining an extra significant figure, we might report the fi-nal answer with one too many significant figures. In this chapter we will mark the extra digit in red for emphasis. Be sure that you pick a system for keeping track of significant figures.
Source URL: http://www.asdlib.org/onlineArticles/ecourseware/Analytical%20Chemistry%202.0/Text_Files.html Saylor URL: http://www.saylor.org/courses/chem108 Attributed to [David Harvey]
Saylor.org Page 12 of 28
25Chapter 2 Basic Tools of Analytical Chemistryform before we can complete the analysis. For example, one method for the quantitative analysis of disulfiram, C10H20N2S4—the active ingedient in the drug Anatbuse—requires that we convert the sulfur to H2SO4 by first oxidizing it to SO2 by combustion, and then oxidizing the SO2 to H2SO4 by bubbling it through a solution of H2O2. When the conversion is com-plete, the amount of H2SO4 is determined by titrating with NaOH.
To convert the moles of NaOH used in the titration to the moles of dis-ulfiram in the sample, we need to know the stoichiometry of the reactions. Writing a balanced reaction for H2SO4 and NaOH is straightforward
H SO NaOH H O Na SO2 4 2 2 4( ) ( ) ( ) ( )aq aq l aq+ → +2 2
but the balanced reactions for the oxidations of C10H20N2S4 to SO2, and of SO2 to H2SO4 are not as immediately obvious. Although we can balance these redox reactions, it is often easier to deduce the overall stoichiometry by using a little chemical logic.
Example 2.7
An analysis for disulfiram, C10H20N2S4, in Antabuse is carried out by oxidizing the sulfur to H2SO4 and titrating the H2SO4 with NaOH. If a 0.4613-g sample of Antabuse is taken through this procdure, requiring 34.85 mL of 0.02500 M NaOH to titrate the H2SO4, what is the %w/w disulfiram in the sample?
SOLUTION
Calculating the moles of H2SO4 is easy—first, we calculate the moles of NaOH used in the titration
( . ( . .0 02500 0 03485 8 712 105 4M) L) mol NaO× = × − HH
and then we use the balanced reaction to calcualte the corresponding moles of H2SO4.
8 712 105 4. × ×− mol NaOH1 mol H SO2 mol NaOH
2 4 == × −4 356 102 4. mol H SO2 4
We do not need balanced reactions to convert the moles of H2SO4 to the corresponding moles of C10H20N2S4. Instead, we take advantage of a conservation of mass—all the sulfur in C10H20N2S4 must end up in the H2SO4; thus
4 356 101
2 4. × × ×− mol H SOmol S
mol H SO1 mo
2 42 4
ll C H N Smol S
mol C H10 20 2 410 204
1 089 100 4= × −. NN S2 4
N SS N
S
S
disulfram
Here is where we use a little chemical log-ic! A conservation of mass is the essence of stoichiometry.
Source URL: http://www.asdlib.org/onlineArticles/ecourseware/Analytical%20Chemistry%202.0/Text_Files.html Saylor URL: http://www.saylor.org/courses/chem108 Attributed to [David Harvey]
Saylor.org Page 13 of 28
26 Analytical Chemistry 2.0 or
1 089 10296 54
0 4..
× ×− mol C H N Sg C H N
10 20 2 4
10 20 22 4
10 20 2 410 20 2 4
Smol C H N S
g C H N S= 0 032293.
0 032290 4613
100 73.
..
g C H N Sg sample
10 20 2 4 × = 0000% w/w C H N S10 20 2 4
2D Basic Equipment
The array of equipment for making analytical measurements is impressive, ranging from the simple and inexpensive, to the complex and expensive. With three exceptions—measuring mass, measuring volume, and drying materials—we will postpone the discussion of equipment to later chapters where its application to specific analytical methods is relevant.
2D.1 Equipment for Measuring Mass
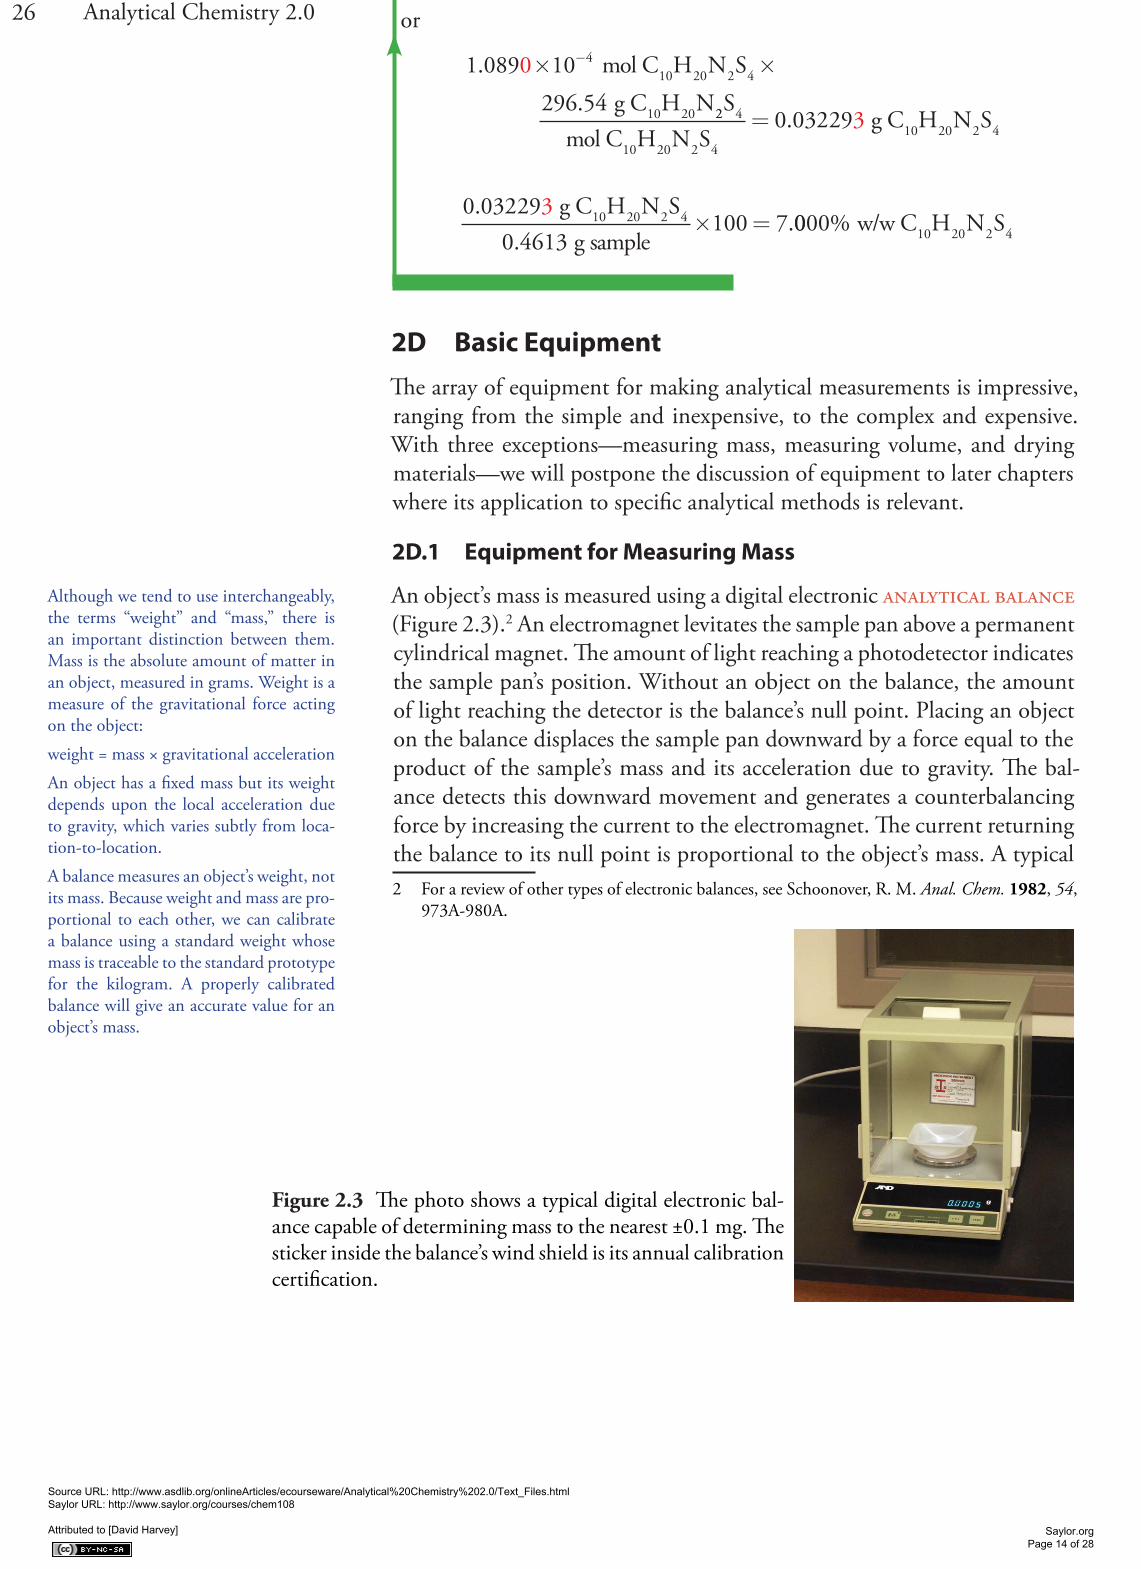
An object’s mass is measured using a digital electronic analytical balance (Figure 2.3).2 An electromagnet levitates the sample pan above a permanent cylindrical magnet. The amount of light reaching a photodetector indicates the sample pan’s position. Without an object on the balance, the amount of light reaching the detector is the balance’s null point. Placing an object on the balance displaces the sample pan downward by a force equal to the product of the sample’s mass and its acceleration due to gravity. The bal-ance detects this downward movement and generates a counterbalancing force by increasing the current to the electromagnet. The current returning the balance to its null point is proportional to the object’s mass. A typical 2 For a review of other types of electronic balances, see Schoonover, R. M. Anal. Chem. 1982, 54,
973A-980A.
Although we tend to use interchangeably, the terms “weight” and “mass,” there is an important distinction between them. Mass is the absolute amount of matter in an object, measured in grams. Weight is a measure of the gravitational force acting on the object:
weight = mass × gravitational acceleration
An object has a fixed mass but its weight depends upon the local acceleration due to gravity, which varies subtly from loca-tion-to-location.
A balance measures an object’s weight, not its mass. Because weight and mass are pro-portional to each other, we can calibrate a balance using a standard weight whose mass is traceable to the standard prototype for the kilogram. A properly calibrated balance will give an accurate value for an object’s mass.
Figure 2.3 The photo shows a typical digital electronic bal-ance capable of determining mass to the nearest ±0.1 mg. The sticker inside the balance’s wind shield is its annual calibration certification.
Source URL: http://www.asdlib.org/onlineArticles/ecourseware/Analytical%20Chemistry%202.0/Text_Files.html Saylor URL: http://www.saylor.org/courses/chem108 Attributed to [David Harvey]
Saylor.org Page 14 of 28
27Chapter 2 Basic Tools of Analytical Chemistryelectronic balance has a capacity of 100-200 grams, and can measure mass to the nearest ±0.01 mg to ±1 mg.
If the sample is not moisture sensitive, a clean and dry container is placed on the balance. The container’s mass is called the tare. Most balances allow you to set the container’s tare to a mass of zero. The sample is trans-ferred to the container, the new mass is measured and the sample’s mass determined by subtracting the tare. Samples that absorb moisture from the air are treated differently. The sample is placed in a covered weighing bottle and their combined mass is determined. A portion of the sample is removed and the weighing bottle and remaining sample are reweighed. The difference between the two masses gives the sample’s mass.
Several important precautions help to minimize errors when measuring an object’s mass. A balance should be placed on a stable surface to mini-mize the effect of vibrations in the surrounding environment, and should be maintained in a level position. The sensitivity of an analytical balance is such that it can measure the mass of a fingerprint. For this reason materi-als being weighed should normally be handled using tongs or laboratory tissues. Volatile liquid samples must be weighed in a covered container to avoid the loss of sample by evaporation. Air currents can significantly af-fect a sample’s mass. To avoid air currents the balance’s glass doors should be closed, or the balance’s wind shield should be in place. A sample that is cooler or warmer than the surrounding air will create a convective air currents that affects the measurement of its mass. For this reason, warm or cool your sample to room temperature before determining its mass. Finally, samples dried in an oven should be stored in a desiccator to prevent them from reabsorbing moisture from the atmosphere.
2D.2 Equipment for Measuring Volume
Analytical chemists use a variety of glassware to measure a liquid’s volume. The choice of what type of glassware to use depends on how accurately we need to know the liquid’s volume and whether we are interested in contain-ing or delivering the liquid.
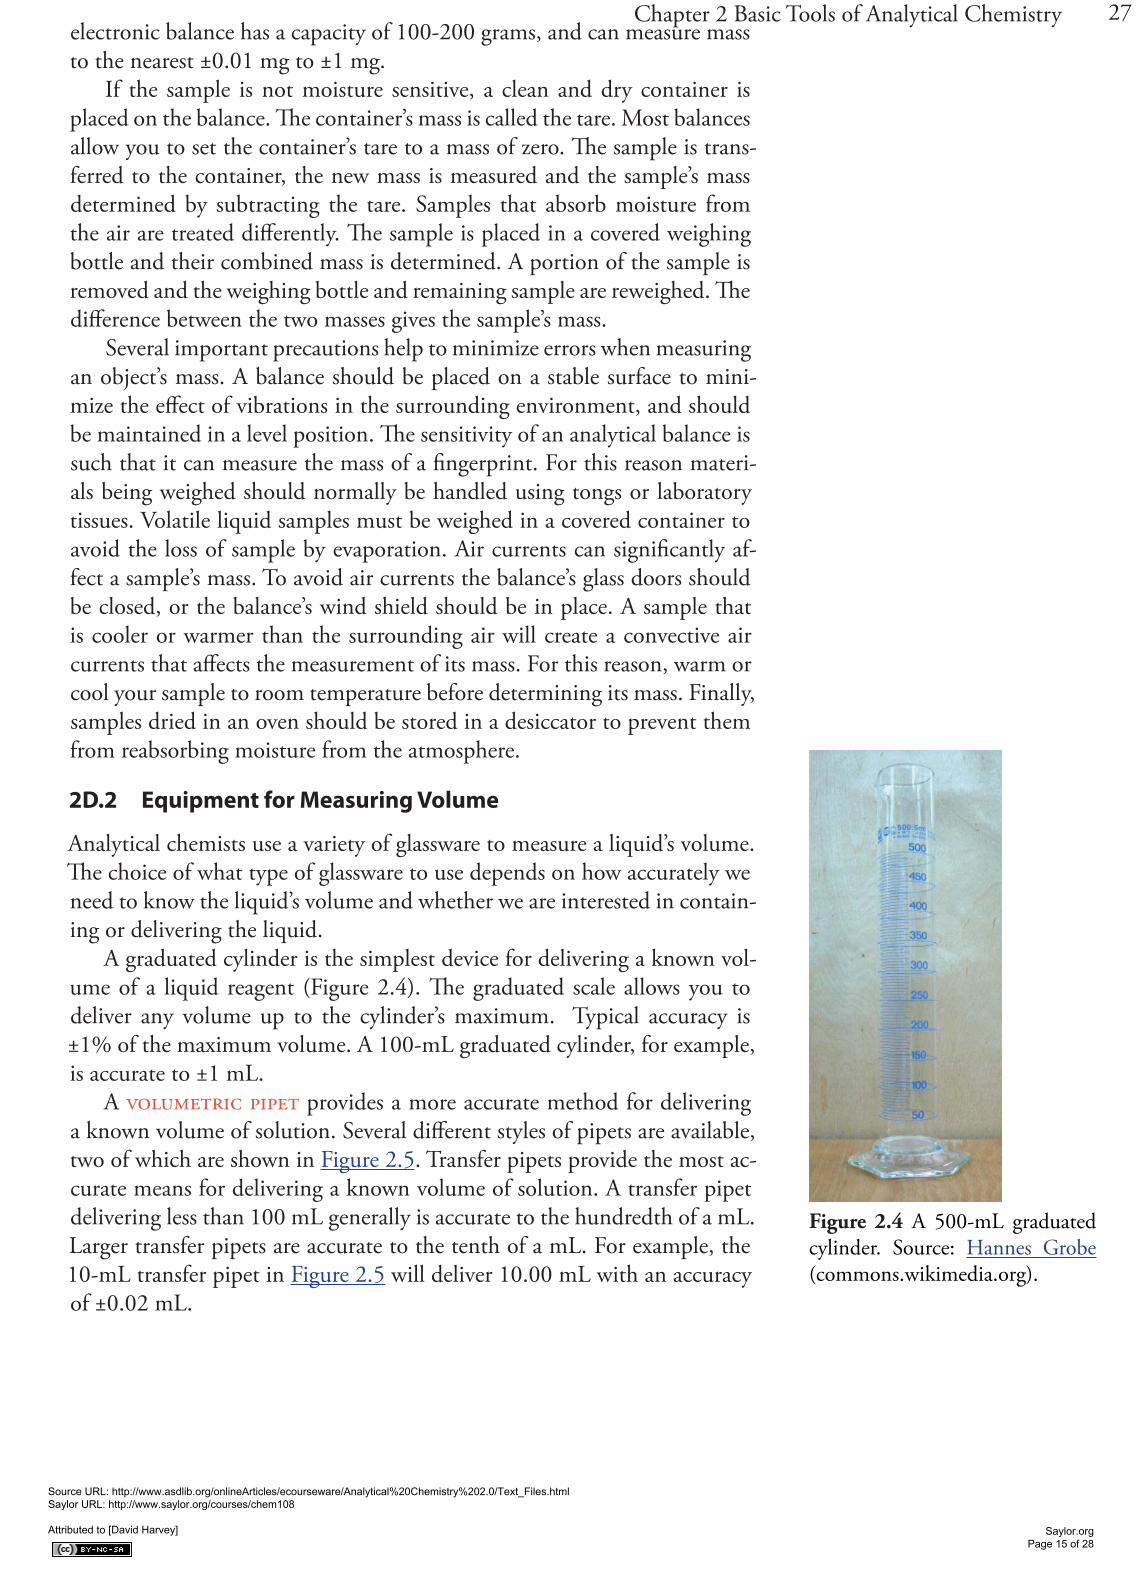
A graduated cylinder is the simplest device for delivering a known vol-ume of a liquid reagent (Figure 2.4). The graduated scale allows you to deliver any volume up to the cylinder’s maximum. Typical accuracy is ±1% of the maximum volume. A 100-mL graduated cylinder, for example, is accurate to ±1 mL.
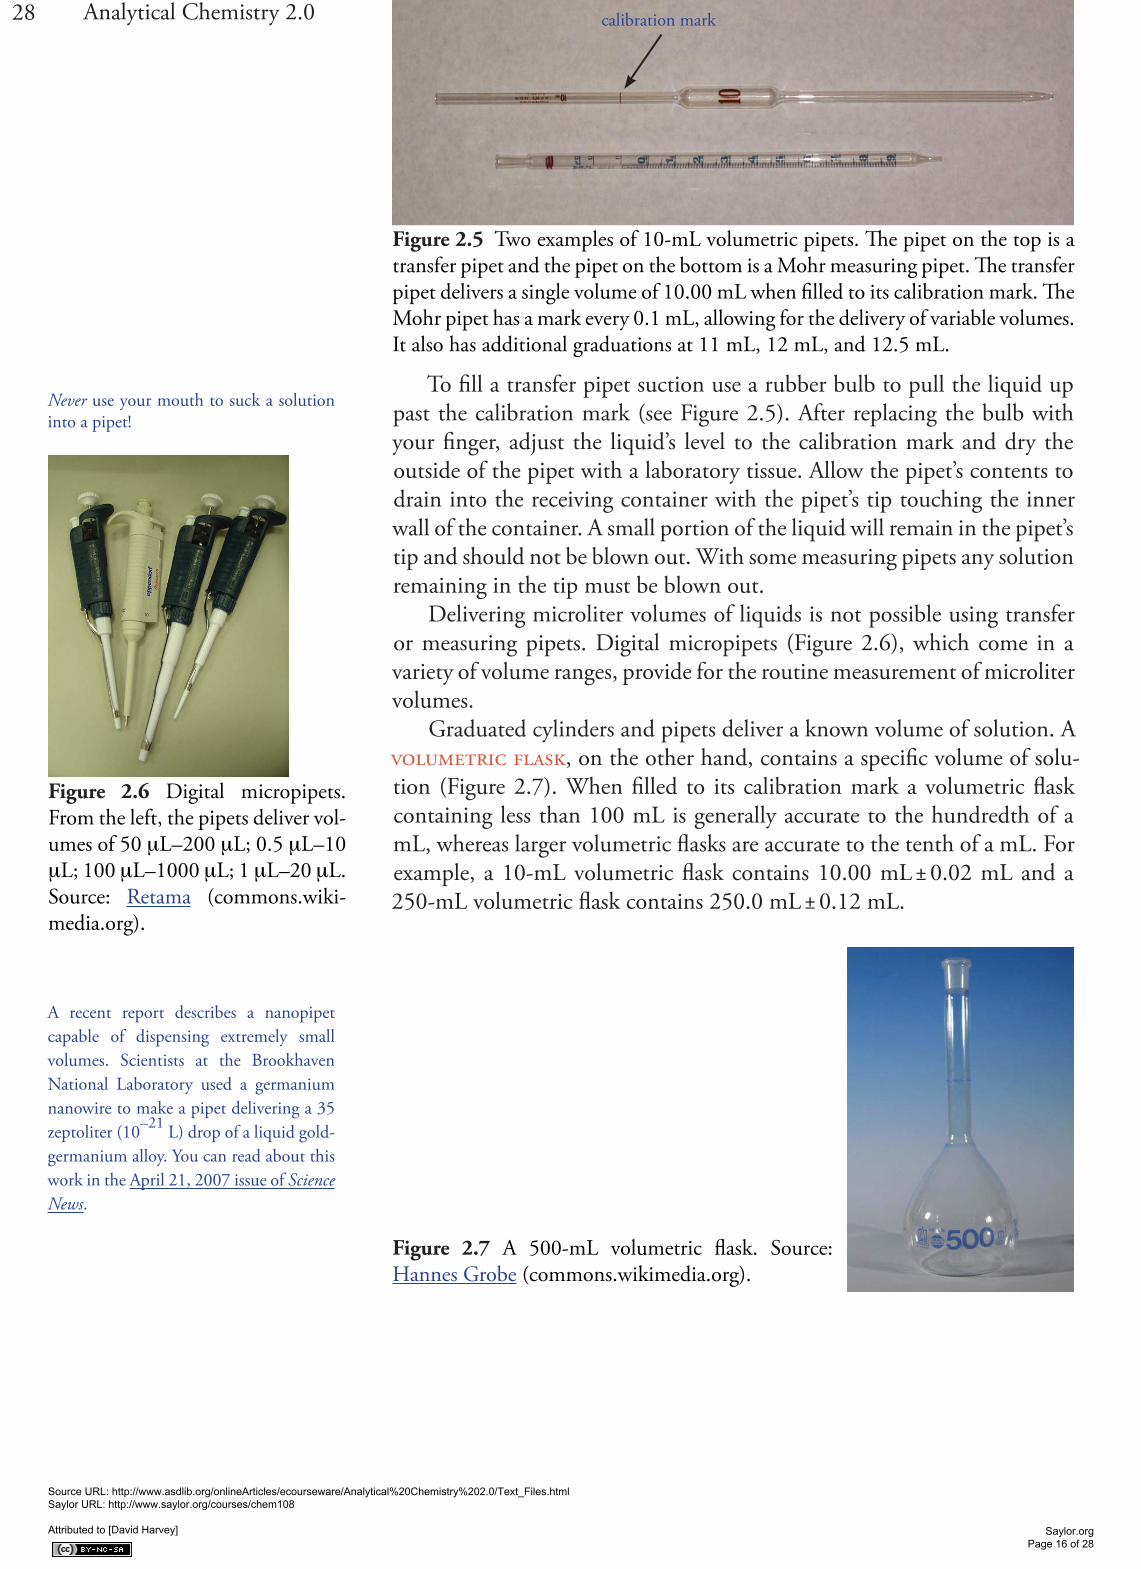
A volumetric pipet provides a more accurate method for delivering a known volume of solution. Several different styles of pipets are available, two of which are shown in Figure 2.5. Transfer pipets provide the most ac-curate means for delivering a known volume of solution. A transfer pipet delivering less than 100 mL generally is accurate to the hundredth of a mL. Larger transfer pipets are accurate to the tenth of a mL. For example, the 10-mL transfer pipet in Figure 2.5 will deliver 10.00 mL with an accuracy of ±0.02 mL.
Figure 2.4 A 500-mL graduated cylinder. Source: Hannes Grobe (commons.wikimedia.org).
Source URL: http://www.asdlib.org/onlineArticles/ecourseware/Analytical%20Chemistry%202.0/Text_Files.html Saylor URL: http://www.saylor.org/courses/chem108 Attributed to [David Harvey]
Saylor.org Page 15 of 28
28 Analytical Chemistry 2.0
To fill a transfer pipet suction use a rubber bulb to pull the liquid up past the calibration mark (see Figure 2.5). After replacing the bulb with your finger, adjust the liquid’s level to the calibration mark and dry the outside of the pipet with a laboratory tissue. Allow the pipet’s contents to drain into the receiving container with the pipet’s tip touching the inner wall of the container. A small portion of the liquid will remain in the pipet’s tip and should not be blown out. With some measuring pipets any solution remaining in the tip must be blown out.
Delivering microliter volumes of liquids is not possible using transfer or measuring pipets. Digital micropipets (Figure 2.6), which come in a variety of volume ranges, provide for the routine measurement of microliter volumes.
Graduated cylinders and pipets deliver a known volume of solution. A volumetric flask, on the other hand, contains a specific volume of solu-tion (Figure 2.7). When filled to its calibration mark a volumetric flask containing less than 100 mL is generally accurate to the hundredth of a mL, whereas larger volumetric flasks are accurate to the tenth of a mL. For example, a 10-mL volumetric flask contains 10.00 mL ± 0.02 mL and a 250-mL volumetric flask contains 250.0 mL ± 0.12 mL.
calibration mark
Figure 2.5 Two examples of 10-mL volumetric pipets. The pipet on the top is a transfer pipet and the pipet on the bottom is a Mohr measuring pipet. The transfer pipet delivers a single volume of 10.00 mL when filled to its calibration mark. The Mohr pipet has a mark every 0.1 mL, allowing for the delivery of variable volumes. It also has additional graduations at 11 mL, 12 mL, and 12.5 mL.
Never use your mouth to suck a solution into a pipet!
Figure 2.6 Digital micropipets. From the left, the pipets deliver vol-umes of 50 μL–200 μL; 0.5 μL–10 μL; 100 μL–1000 μL; 1 μL–20 μL. Source: Retama (commons.wiki-media.org).
A recent report describes a nanopipet capable of dispensing extremely small volumes. Scientists at the Brookhaven National Laboratory used a germanium nanowire to make a pipet delivering a 35 zeptoliter (10–21 L) drop of a liquid gold-germanium alloy. You can read about this work in the April 21, 2007 issue of Science News.
Figure 2.7 A 500-mL volumetric flask. Source: Hannes Grobe (commons.wikimedia.org).
Source URL: http://www.asdlib.org/onlineArticles/ecourseware/Analytical%20Chemistry%202.0/Text_Files.html Saylor URL: http://www.saylor.org/courses/chem108 Attributed to [David Harvey]
Saylor.org Page 16 of 28
29Chapter 2 Basic Tools of Analytical ChemistryBecause a volumetric flask contains a solution, it is useful for preparing
a solution with an accurately known concentration. Transfer the reagent to the volumetric flask and add enough solvent to bring the reagent into so-lution. Continuing adding solvent in several portions, mixing thoroughly after each addition. Adjust the volume to the flask’s calibration mark using a dropper. Finally, complete the mixing process by inverting and shaking the flask at least 10 times.
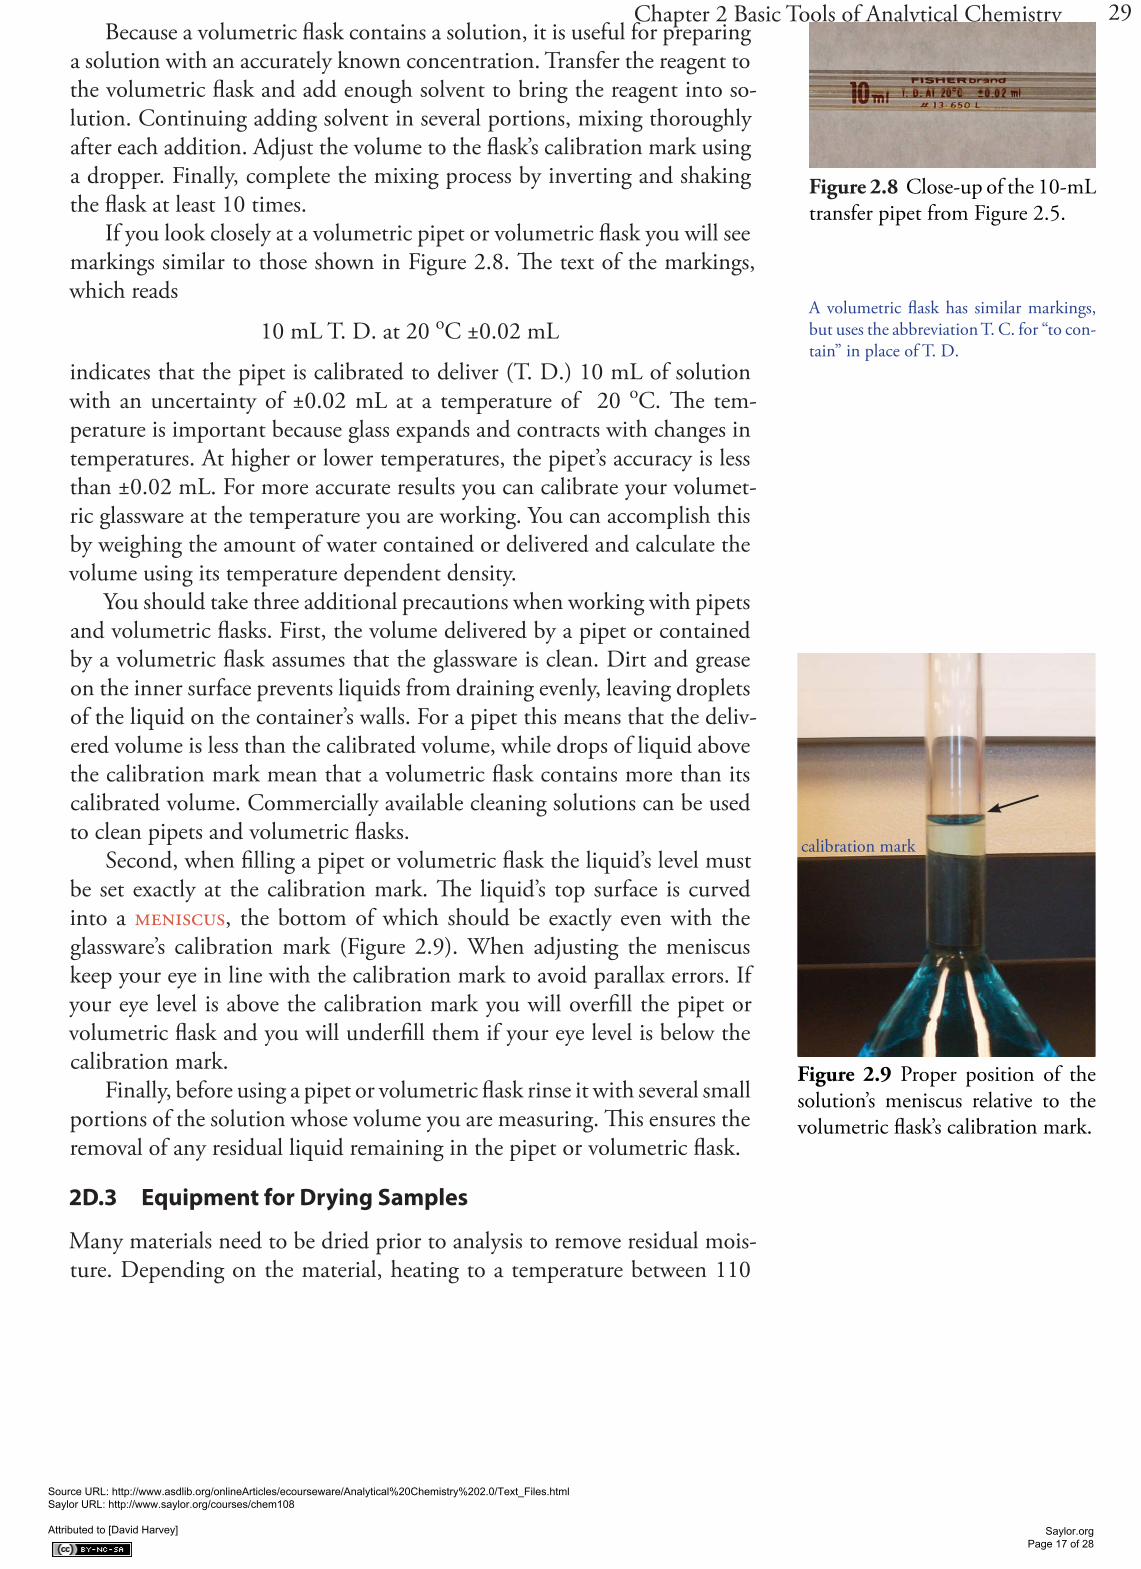
If you look closely at a volumetric pipet or volumetric flask you will see markings similar to those shown in Figure 2.8. The text of the markings, which reads
10 mL T. D. at 20 oC ±0.02 mL
indicates that the pipet is calibrated to deliver (T. D.) 10 mL of solution with an uncertainty of ±0.02 mL at a temperature of 20 oC. The tem-perature is important because glass expands and contracts with changes in temperatures. At higher or lower temperatures, the pipet’s accuracy is less than ±0.02 mL. For more accurate results you can calibrate your volumet-ric glassware at the temperature you are working. You can accomplish this by weighing the amount of water contained or delivered and calculate the volume using its temperature dependent density.
You should take three additional precautions when working with pipets and volumetric flasks. First, the volume delivered by a pipet or contained by a volumetric flask assumes that the glassware is clean. Dirt and grease on the inner surface prevents liquids from draining evenly, leaving droplets of the liquid on the container’s walls. For a pipet this means that the deliv-ered volume is less than the calibrated volume, while drops of liquid above the calibration mark mean that a volumetric flask contains more than its calibrated volume. Commercially available cleaning solutions can be used to clean pipets and volumetric flasks.
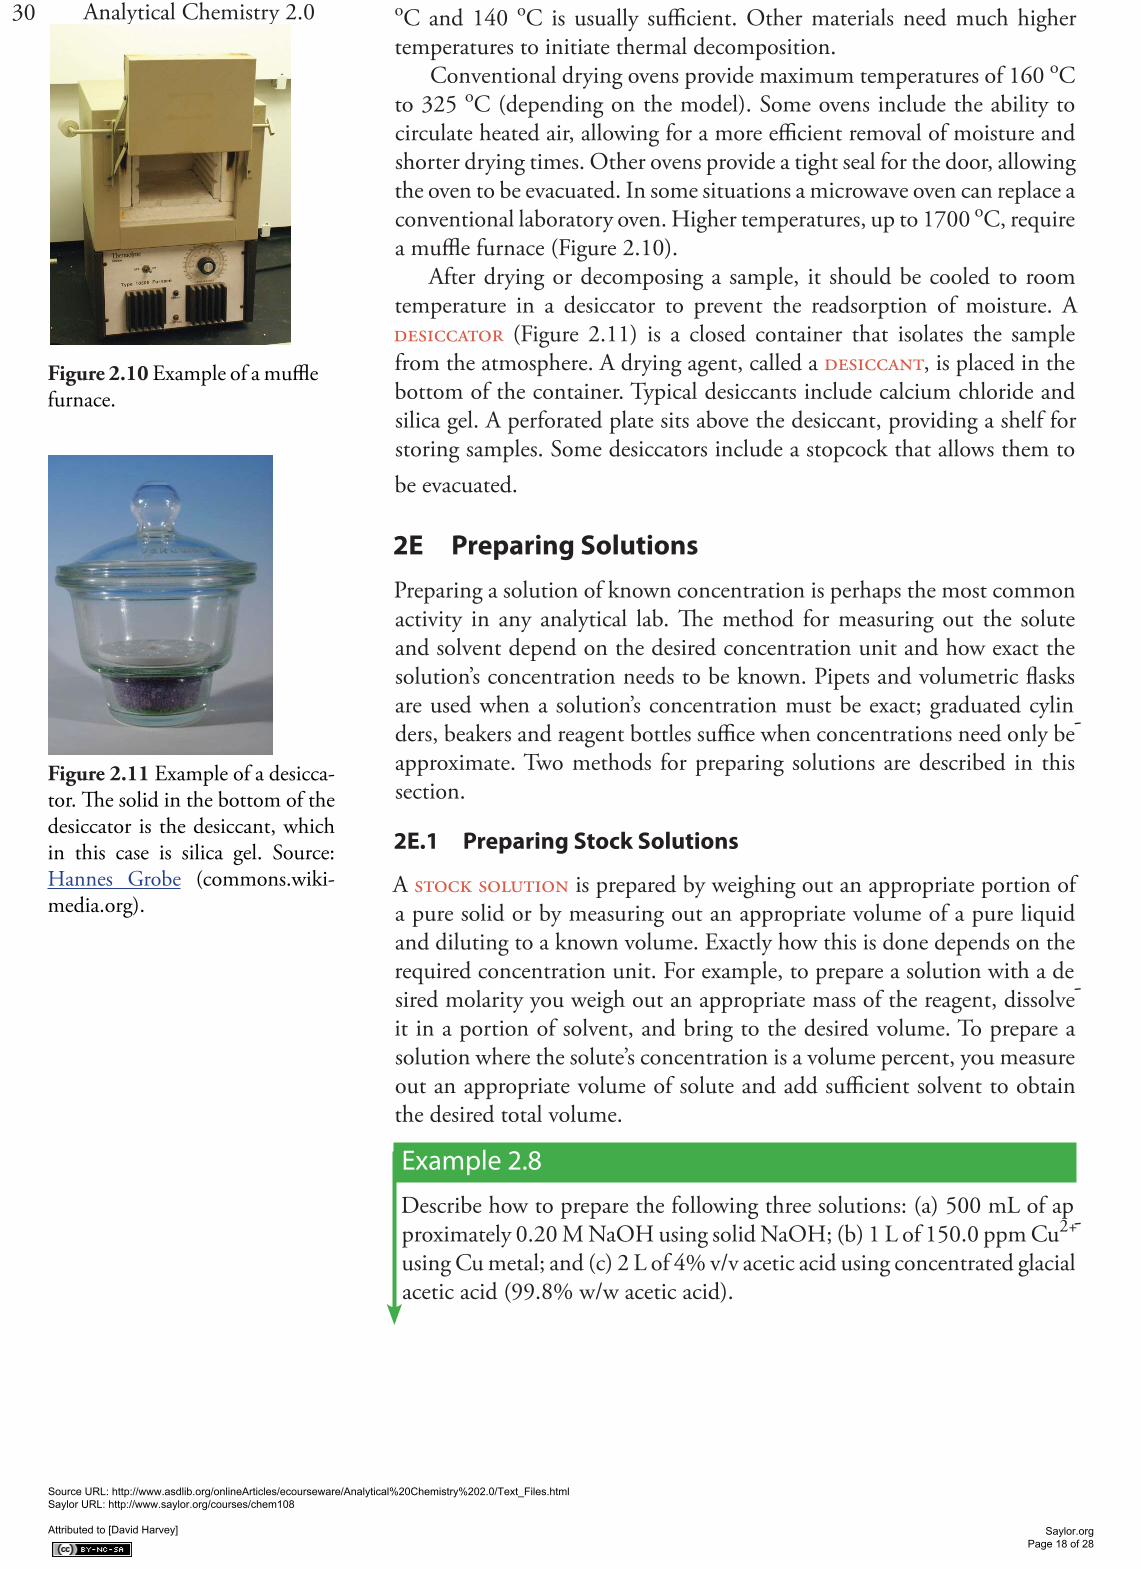
Second, when filling a pipet or volumetric flask the liquid’s level must be set exactly at the calibration mark. The liquid’s top surface is curved into a meniscus, the bottom of which should be exactly even with the glassware’s calibration mark (Figure 2.9). When adjusting the meniscus keep your eye in line with the calibration mark to avoid parallax errors. If your eye level is above the calibration mark you will overfill the pipet or volumetric flask and you will underfill them if your eye level is below the calibration mark.
Finally, before using a pipet or volumetric flask rinse it with several small portions of the solution whose volume you are measuring. This ensures the removal of any residual liquid remaining in the pipet or volumetric flask.
2D.3 Equipment for Drying Samples
Many materials need to be dried prior to analysis to remove residual mois-ture. Depending on the material, heating to a temperature between 110
A volumetric flask has similar markings, but uses the abbreviation T. C. for “to con-tain” in place of T. D.
Figure 2.8 Close-up of the 10-mL transfer pipet from Figure 2.5.
meniscus
calibration mark
Figure 2.9 Proper position of the solution’s meniscus relative to the volumetric flask’s calibration mark.
Source URL: http://www.asdlib.org/onlineArticles/ecourseware/Analytical%20Chemistry%202.0/Text_Files.html Saylor URL: http://www.saylor.org/courses/chem108 Attributed to [David Harvey]
Saylor.org Page 17 of 28
30 Analytical Chemistry 2.0 oC and 140 oC is usually sufficient. Other materials need much higher temperatures to initiate thermal decomposition.
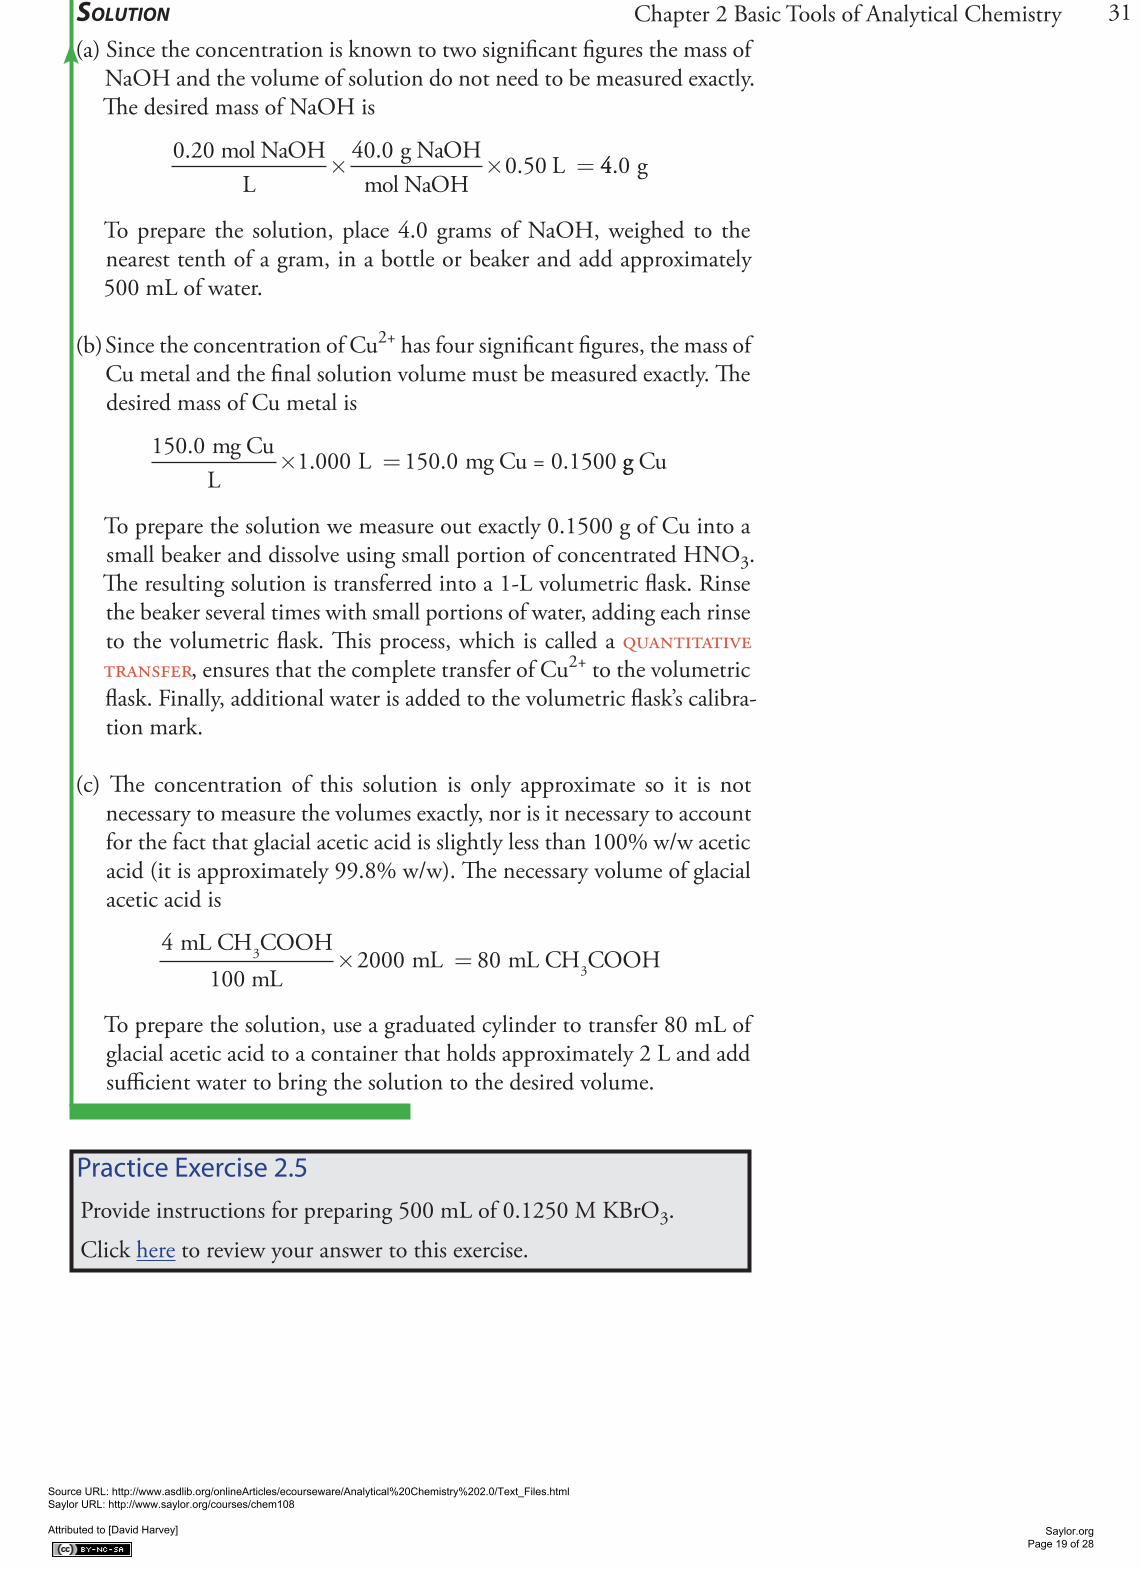
Conventional drying ovens provide maximum temperatures of 160 oC to 325 oC (depending on the model). Some ovens include the ability to circulate heated air, allowing for a more efficient removal of moisture and shorter drying times. Other ovens provide a tight seal for the door, allowing the oven to be evacuated. In some situations a microwave oven can replace a conventional laboratory oven. Higher temperatures, up to 1700 oC, require a muffle furnace (Figure 2.10).
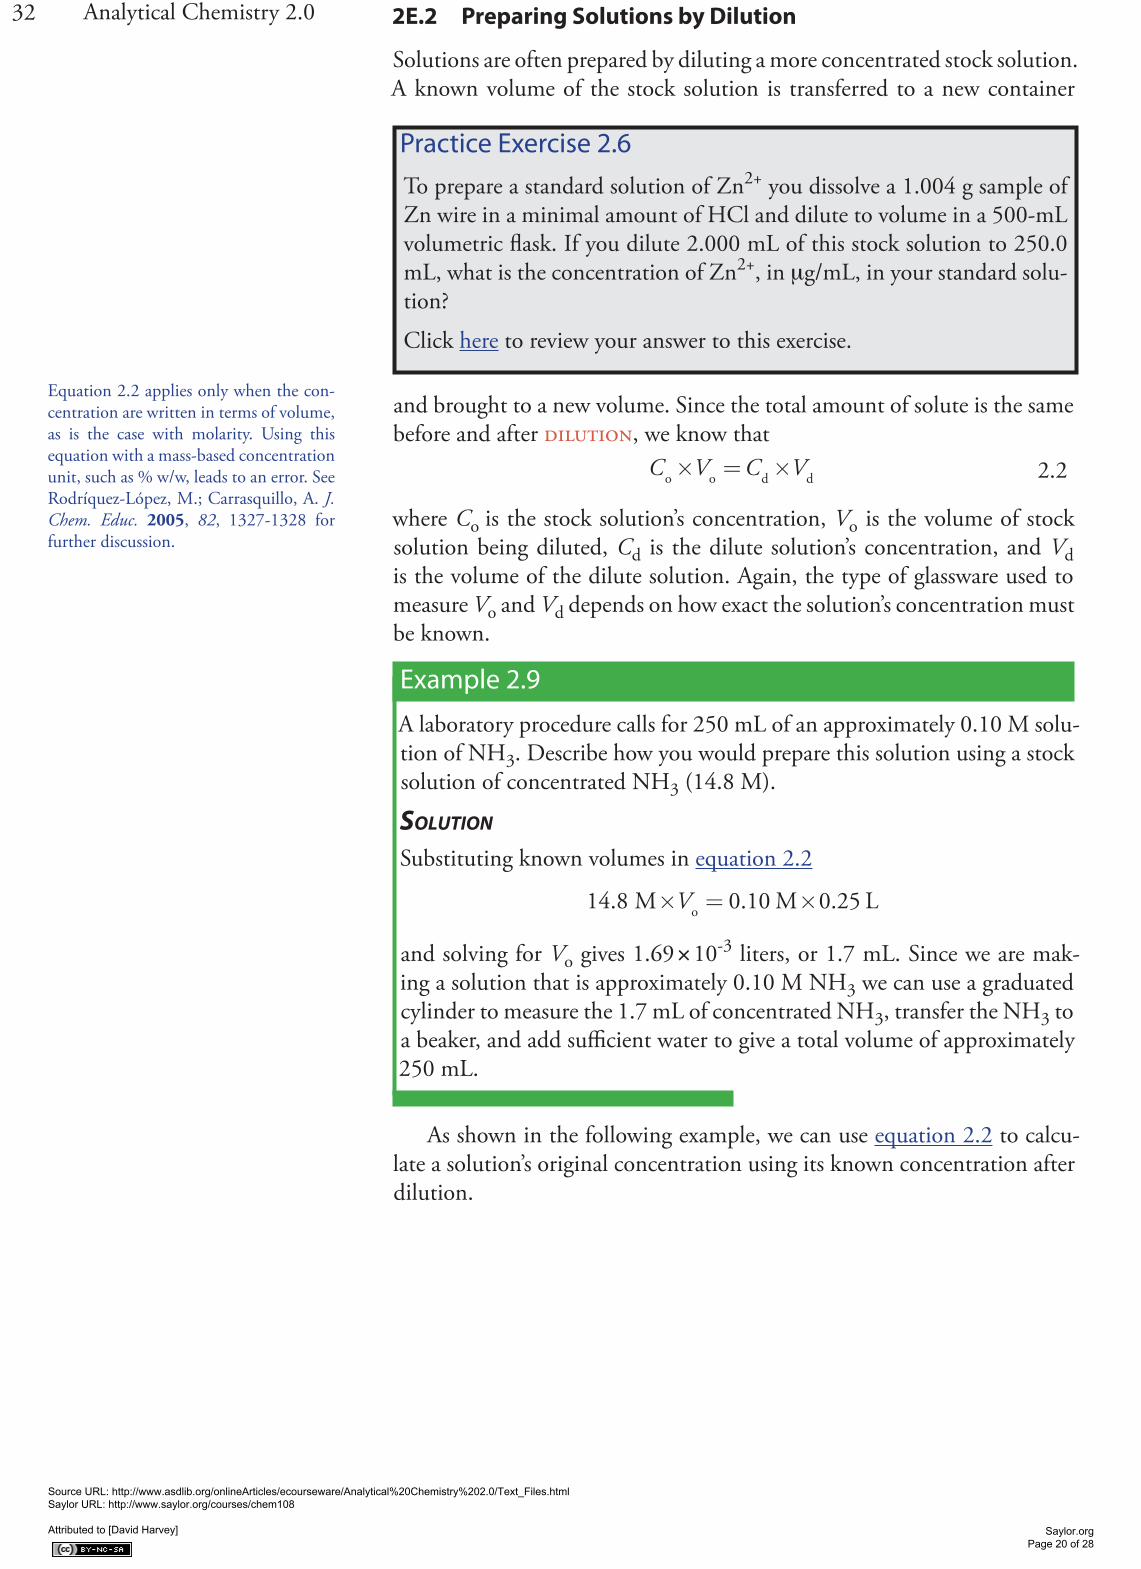
After drying or decomposing a sample, it should be cooled to room temperature in a desiccator to prevent the readsorption of moisture. A desiccator (Figure 2.11) is a closed container that isolates the sample from the atmosphere. A drying agent, called a desiccant, is placed in the bottom of the container. Typical desiccants include calcium chloride and silica gel. A perforated plate sits above the desiccant, providing a shelf for storing samples. Some desiccators include a stopcock that allows them to be evacuated.
2E Preparing Solutions
Preparing a solution of known concentration is perhaps the most common activity in any analytical lab. The method for measuring out the solute and solvent depend on the desired concentration unit and how exact the solution’s concentration needs to be known. Pipets and volumetric flasks are used when a solution’s concentration must be exact; graduated cylin
-ders, beakers and reagent bottles suffice when concentrations need only be approximate. Two methods for preparing solutions are described in this section.
2E.1 Preparing Stock Solutions
A stock solution is prepared by weighing out an appropriate portion of a pure solid or by measuring out an appropriate volume of a pure liquid and diluting to a known volume. Exactly how this is done depends on the required concentration unit. For example, to prepare a solution with a de
-sired molarity you weigh out an appropriate mass of the reagent, dissolve it in a portion of solvent, and bring to the desired volume. To prepare a solution where the solute’s concentration is a volume percent, you measure out an appropriate volume of solute and add sufficient solvent to obtain the desired total volume.
Example 2.8
Describe how to prepare the following three solutions: (a) 500 mL of ap-proximately 0.20 M NaOH using solid NaOH; (b) 1 L of 150.0 ppm Cu2+ using Cu metal; and (c) 2 L of 4% v/v acetic acid using concentrated glacial
acetic acid (99.8% w/w acetic acid).
Figure 2.10 Example of a muffle furnace.
Figure 2.11 Example of a desicca-tor. The solid in the bottom of the desiccator is the desiccant, which in this case is silica gel. Source: Hannes Grobe (commons.wiki-media.org).
Source URL: http://www.asdlib.org/onlineArticles/ecourseware/Analytical%20Chemistry%202.0/Text_Files.html Saylor URL: http://www.saylor.org/courses/chem108 Attributed to [David Harvey]
Saylor.org Page 18 of 28
31Chapter 2 Basic Tools of Analytical ChemistrySOLUTION
(a) Since the concentration is known to two significant figures the mass of NaOH and the volume of solution do not need to be measured exactly. The desired mass of NaOH is
0.20 mol NaOHL
g NaOHmol NaOH
L× × =40 0
0 50.
. 44 0. g
To prepare the solution, place 4.0 grams of NaOH, weighed to the nearest tenth of a gram, in a bottle or beaker and add approximately 500 mL of water.
(b) Since the concentration of Cu2+ has four significant figures, the mass of Cu metal and the final solution volume must be measured exactly. The desired mass of Cu metal is
150 01 000 150 0
.. .
mg CuL
L mg Cu = 0.1500× = gg Cu
To prepare the solution we measure out exactly 0.1500 g of Cu into a small beaker and dissolve using small portion of concentrated HNO3. The resulting solution is transferred into a 1-L volumetric flask. Rinse the beaker several times with small portions of water, adding each rinse to the volumetric flask. This process, which is called a quantitative transfer, ensures that the complete transfer of Cu2+ to the volumetric flask. Finally, additional water is added to the volumetric flask’s calibra-tion mark.
(c) The concentration of this solution is only approximate so it is not necessary to measure the volumes exactly, nor is it necessary to account for the fact that glacial acetic acid is slightly less than 100% w/w acetic acid (it is approximately 99.8% w/w). The necessary volume of glacial acetic acid is
42000 80
mL CH COOH100 mL
mL mL CH COOH33× =
To prepare the solution, use a graduated cylinder to transfer 80 mL of glacial acetic acid to a container that holds approximately 2 L and add sufficient water to bring the solution to the desired volume.
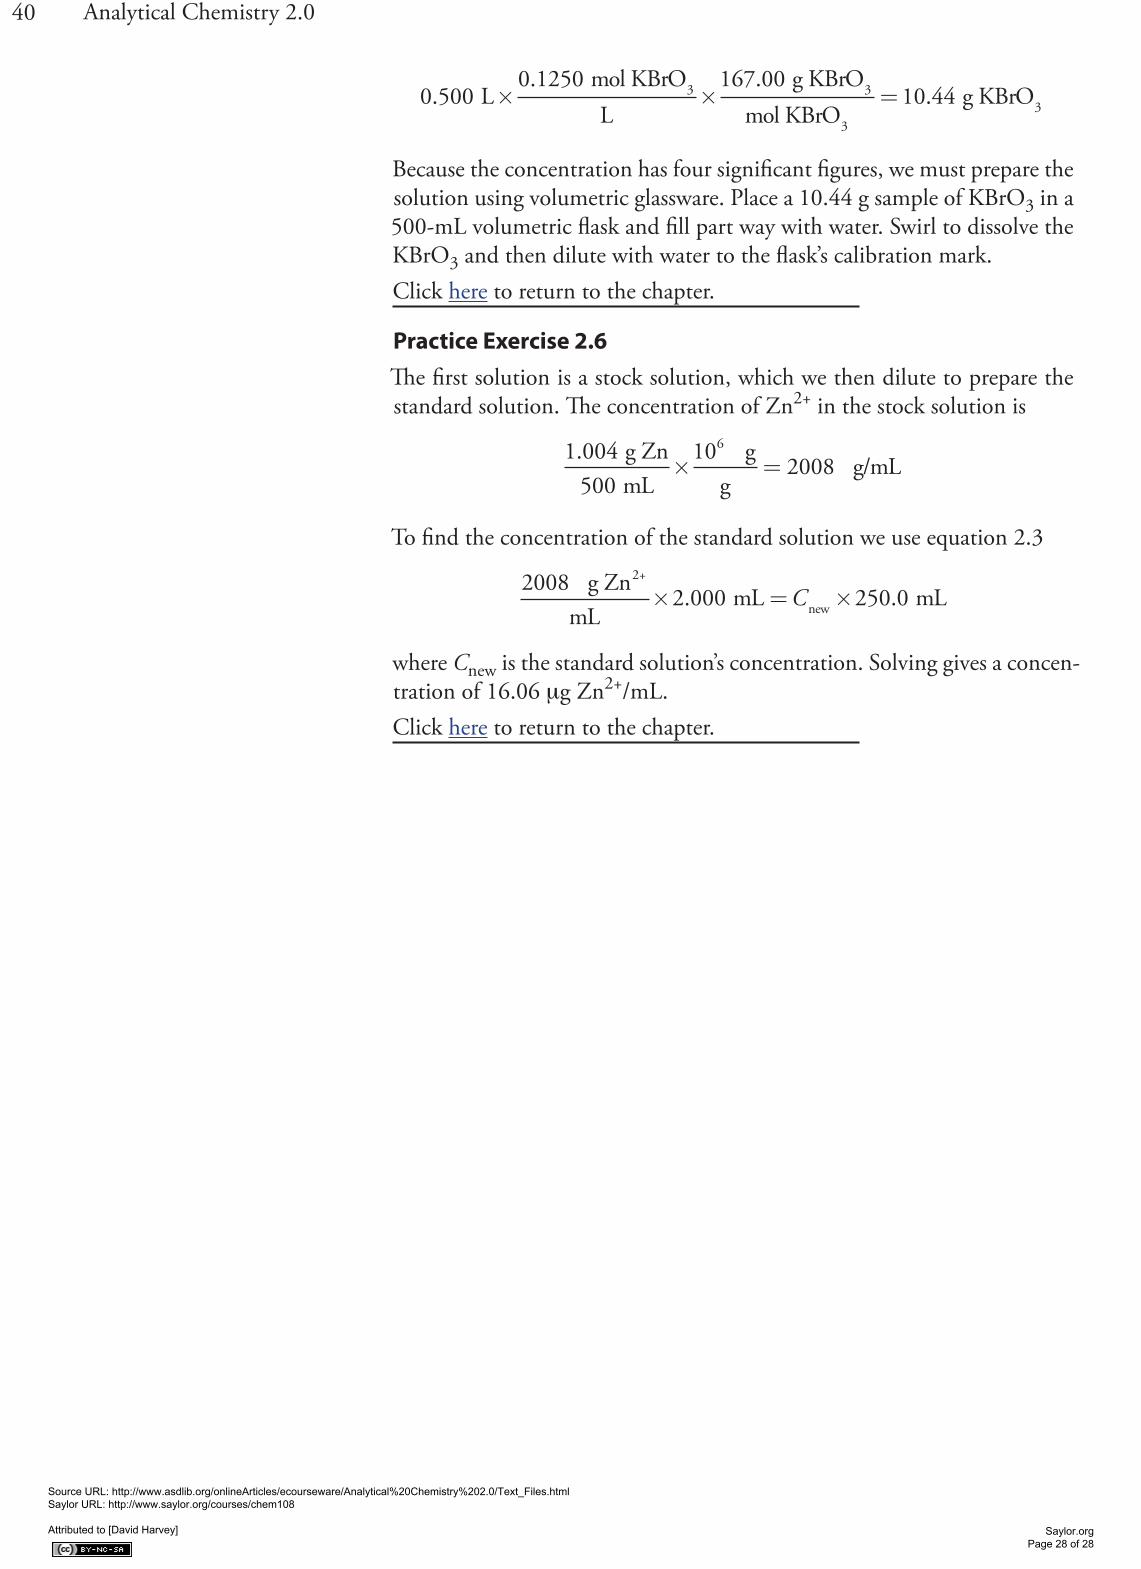
Practice Exercise 2.5Provide instructions for preparing 500 mL of 0.1250 M KBrO3.
Click here to review your answer to this exercise.
Source URL: http://www.asdlib.org/onlineArticles/ecourseware/Analytical%20Chemistry%202.0/Text_Files.html Saylor URL: http://www.saylor.org/courses/chem108 Attributed to [David Harvey]
Saylor.org Page 19 of 28
32 Analytical Chemistry 2.0 2E.2 Preparing Solutions by Dilution
Solutions are often prepared by diluting a more concentrated stock solution. A known volume of the stock solution is transferred to a new container
Practice Exercise 2.6To prepare a standard solution of Zn2+ you dissolve a 1.004 g sample of Zn wire in a minimal amount of HCl and dilute to volume in a 500-mL volumetric flask. If you dilute 2.000 mL of this stock solution to 250.0 mL, what is the concentration of Zn2+, in μg/mL, in your standard solu-tion?
Click here to review your answer to this exercise.
and brought to a new volume. Since the total amount of solute is the same before and after dilution, we know that
C V C Vo o d d× = × 2.2
where Co is the stock solution’s concentration, Vo is the volume of stock solution being diluted, Cd is the dilute solution’s concentration, and Vd is the volume of the dilute solution. Again, the type of glassware used to measure Vo and Vd depends on how exact the solution’s concentration must be known.
Example 2.9
A laboratory procedure calls for 250 mL of an approximately 0.10 M solu-tion of NH3. Describe how you would prepare this solution using a stock solution of concentrated NH3 (14.8 M).
SOLUTION
Substituting known volumes in equation 2.2
14 8 0 10 0 25. . .M M Lo× = ×V
and solving for Vo gives 1.69 × 10⁻³ liters, or 1.7 mL. Since we are mak-ing a solution that is approximately 0.10 M NH3 we can use a graduated cylinder to measure the 1.7 mL of concentrated NH3, transfer the NH3 to a beaker, and add sufficient water to give a total volume of approximately 250 mL.
As shown in the following example, we can use equation 2.2 to calcu-late a solution’s original concentration using its known concentration after dilution.
Equation 2.2 applies only when the con-centration are written in terms of volume, as is the case with molarity. Using this equation with a mass-based concentration unit, such as % w/w, leads to an error. See Rodríquez-López, M.; Carrasquillo, A. J. Chem. Educ. 2005, 82, 1327-1328 for further discussion.
Source URL: http://www.asdlib.org/onlineArticles/ecourseware/Analytical%20Chemistry%202.0/Text_Files.html Saylor URL: http://www.saylor.org/courses/chem108 Attributed to [David Harvey]
Saylor.org Page 20 of 28
33Chapter 2 Basic Tools of Analytical ChemistryExample 2.10
A sample of an ore was analyzed for Cu2+ as follows. A 1.25 gram sample of the ore was dissolved in acid and diluted to volume in a 250-mL volu-metric flask. A 20 mL portion of the resulting solution was transferred by pipet to a 50-mL volumetric flask and diluted to volume. An analysis of this solution gave the concentration of Cu2+ as 4.62 μg/L. What is the weight percent of Cu in the original ore?
SOLUTION
Substituting known volumes (with significant figures appropriate for pi-pets and volumetric flasks) into equation 2.2
( ) . . .g/L Cu mL g/L Cu2+o
2+× = ×20 00 4 62 50 00 mmL
and solving for (μg/L Cu2+)o gives the original solution concentration as 11.55 μg/L Cu2+. To calculate the grams of Cu2+ we multiply this concen-tration by the total volume
11 5250 0
102 88 10
58
6
.. .
g CumL
mL1 g
g
2+
× × = × −33 g Cu2+
The weight percent Cu is
2 88 101 25
100 0 2318 3..
. %×
× =− g Cu
g samplew
2+
//w Cu2+
2F Spreadsheets and Computational Software
Analytical chemistry is an inherently quantitative discipline. Whether you are completing a statistical analysis, trying to optimize experimental condi-tions, or exploring how a change in pH affects a compound’s solubility, the ability to work with complex mathematical equations is essential. Spread-sheets, such as Microsoft Excel can be an important tool for analyzing your data and for preparing graphs of your results. Scattered throughout the text you will find instructions for using spreadsheets.
Although spreadsheets are useful, they are not always well suited for working with scientific data. If you plan to pursue a career in chemistry you may wish to familiarize yourself with a more sophisticated computational software package, such as the freely available open-source program that goes by the name R, or commercial programs such as Mathematica and Matlab. You will find instructions for using R scattered throughout the text.
Despite the power of spreadsheets and computational programs, don’t forget that the most important software is that behind your eyes and between your ears. The ability to think intuitively about chemistry is a critically im-portant skill. In many cases you will find it possible to determine if an ana-
If you do not have access to Microsoft Excel or another commercial spreadsheet pack
-age, you might considering using Calc, a freely available open-source spreadsheet that is part of the OpenOffice.org soft
-ware package at www.openoffice.org.
You can download the current version of R from www.r-project.org. Click on the link for Download: CRAN and find a lo
-cal mirror site. Click on the link for the mirror site and then use the link for Linux, MacOS X, or Windows under the heading “Download and Install R.”
Source URL: http://www.asdlib.org/onlineArticles/ecourseware/Analytical%20Chemistry%202.0/Text_Files.html Saylor URL: http://www.saylor.org/courses/chem108 Attributed to [David Harvey]
Saylor.org Page 21 of 28
34 Analytical Chemistry 2.0 lytical method is feasible, or to approximate the optimum conditions for an analytical method without resorting to complex calculations. Why spend time developing a complex spreadsheet or writing software code when a
“back-of-the-envelope” estimate will do the trick? Once you know the gen-eral solution to your problem, you can spend time using spreadsheets and computational programs to work out the specifics. Throughout the text we will introduce tools for developing your ability to think intuitively.
2G The Laboratory Notebook
Finally, we can not end a chapter on the basic tools of analytical chemistry without mentioning the laboratory notebook. Your laboratory notebook is your most important tool when working in the lab. If kept properly, you should be able to look back at your laboratory notebook several years from now and reconstruct the experiments on which you worked.
Your instructor will provide you with detailed instructions on how he or she wants you to maintain your notebook. Of course, you should expect to bring your notebook to the lab. Everything you do, measure, or observe while working in the lab should be recorded in your notebook as it takes place. Preparing data tables to organize your data will help ensure that you record the data you need, and that you can find the data when it is time to calculate and analyze your results. Writing a narrative to accompany your data will help you remember what you did, why you did it, and why you thought it was significant. Reserve space for your calculations, for analyzing your data, and for interpreting your results. Take your notebook with you when you do research in the library.
Maintaining a laboratory notebook may seem like a great deal of ef-fort, but if you do it well you will have a permanent record of your work. Scientists working in academic, industrial and governmental research labs rely on their notebooks to provide a written record of their work. Ques-tions about research carried out at some time in the past can be answered by finding the appropriate pages in the laboratory notebook. A laboratory notebook is also a legal document that helps establish patent rights and proof of discovery.
2H Key Terms
analytical balance concentration desiccantdesiccator dilution formalitymeniscus molality molaritynormality parts per million parts per billionp-function quantitative transfer scientific notationsignificant figures SI units stock solutionvolume percent volumetric flask volumetric pipetweight percent weight-to-volume percent
As you review this chapter, try to define a key term in your own words. Check your answer by clicking on the key term, which will take you to the page where it was first introduced. Clicking on the key term there, will bring you back to this page so that you can continue with another key term.
Source URL: http://www.asdlib.org/onlineArticles/ecourseware/Analytical%20Chemistry%202.0/Text_Files.html Saylor URL: http://www.saylor.org/courses/chem108 Attributed to [David Harvey]
Saylor.org Page 22 of 28
35Chapter 2 Basic Tools of Analytical Chemistry
2I Chapter Summary
There are a few basic numerical and experimental tools with which you must be familiar. Fundamental measurements in analytical chemistry, such as mass and volume, use base SI units, such as the kilogram. Other units, such as energy, are defined in terms of these base units. When reporting measurements, we must be careful to include only those digits that are significant, and to maintain the uncertainty implied by these significant figures when transforming measurements into results.
The relative amount of a constituent in a sample is expressed as a concen-tration. There are many ways to express concentration, the most common of which are molarity, weight percent, volume percent, weight-to-volume percent, parts per million and parts per billion. Concentrations also can be expressed using p-functions.
Stoichiometric relationships and calculations are important in many quantitative analyses. The stoichiometry between the reactants and prod-ucts of a chemical reaction are given by the coefficients of a balanced chemi-cal reaction.
Balances, volumetric flasks, pipets, and ovens are standard pieces of equipment that you will routinely use in the analytical lab. You should be familiar with the proper way to use this equipment. You also should be familiar with how to prepare a stock solution of known concentration, and how to prepare a dilute solution from a stock solution.
2J Problems
1. Indicate how many significant figures are in each of the following num-bers.
a. 903 b. 0.903 c. 1.0903 d. 0.0903 e. 0.09030 f. 9.03x10²
2. Round each of the following to three significant figures.
a. 0.89377 b. 0.89328 c. 0.89350 d. 0.8997 e. 0.08907
3. Round each to the stated number of significant figures.
a. the atomic weight of carbon to 4 significant figures b. the atomic weight of oxygen to 3 significant figures c. Avogadro’s number to 4 significant figures d. Faraday’s constant to 3 significant figures
4. Report results for the following calculations to the correct number of significant figures.
a. 4.591 + 0.2309 + 67.1 =
Source URL: http://www.asdlib.org/onlineArticles/ecourseware/Analytical%20Chemistry%202.0/Text_Files.html Saylor URL: http://www.saylor.org/courses/chem108 Attributed to [David Harvey]
Saylor.org Page 23 of 28
36 Analytical Chemistry 2.0
b. 313 – 273.15 = c. 712 × 8.6 = d. 1.43/0.026 = e. (8.314 × 298)/96485 = f. log(6.53 × 10⁻⁵) = g. 10–7.14 = h. (6.51 × 10–5) × (8.14 × 10–9) =
5. A 12.1374 g sample of an ore containing Ni and Co was carried through Fresenius’ analytical scheme shown in Figure 1.1. At point A the com-bined mass of Ni and Co was found to be 0.2306 g, while at point B the mass of Co was found to be 0.0813 g. Report the weight percent Ni in the ore to the correct number of significant figures.
6. Figure 1.2 shows an analytical method for the analysis of Ni in ores based on the precipitation of Ni2+ using dimethylglyoxime. The for-mula for the precipitate is Ni(C4H14N4O4)2. Calculate the precipitate’s formula weight to the correct number of significant figures.
7. An analyst wishes to add 256 mg of Cl– to a reaction mixture. How many mL of 0.217 M BaCl2 is this?
8. The concentration of lead in an industrial waste stream is 0.28 ppm. What is its molar concentration?
9. Commercially available concentrated hydrochloric acid is 37.0% w/w HCl. Its density is 1.18 g/mL. Using this information calculate (a) the molarity of concentrated HCl, and (b) the mass and volume (in mL) of solution containing 0.315 moles of HCl.
10. The density of concentrated ammonia, which is 28.0% w/w NH3, is 0.899 g/mL. What volume of this reagent should be diluted to 1.0 × 10³ mL to make a solution that is 0.036 M in NH3?
11. A 250.0 mL aqueous solution contains 45.1 μg of a pesticide. Express the pesticide’s concentration in weight percent, in parts per million, and in parts per billion.
12. A city’s water supply is fluoridated by adding NaF. The desired concen-tration of F– is 1.6 ppm. How many mg of NaF should be added per gallon of treated water if the water supply already is 0.2 ppm in F–?
13. What is the pH of a solution for which the concentration of H+ is 6.92 × 10⁻⁶ M? What is the [H+] in a solution whose pH is 8.923?
Source URL: http://www.asdlib.org/onlineArticles/ecourseware/Analytical%20Chemistry%202.0/Text_Files.html Saylor URL: http://www.saylor.org/courses/chem108 Attributed to [David Harvey]
Saylor.org Page 24 of 28
37Chapter 2 Basic Tools of Analytical Chemistry
14. When using a graduate cylinder, the absolute accuracy with which you can deliver a given volume is ±1% of the cylinder’s maximum volume. What are the absolute and relative uncertainties if you deliver 15 mL of a reagent using a 25 mL graduated cylinder? Repeat for a 50 mL graduated cylinder.
15. Calculate the molarity of a potassium dichromate solution prepared by placing 9.67 grams of K2Cr2O7 in a 100-mL volumetric flask, dissolv-ing, and diluting to the calibration mark.
16. For each of the following explain how you would prepare 1.0 L of a solution that is 0.10 M in K+. Repeat for concentrations of 1.0 × 10² ppm K+ and 1.0% w/v K+.
a. KCl b. K2SO4 c. K3Fe(CN)6
17. A series of dilute NaCl solutions are prepared starting with an initial stock solution of 0.100 M NaCl. Solution A is prepared by pipeting 10 mL of the stock solution into a 250-mL volumetric flask and dilut-ing to volume. Solution B is prepared by pipeting 25 mL of solution A into a 100-mL volumetric flask and diluting to volume. Solution C is prepared by pipeting 20 mL of solution B into a 500-mL volumetric flask and diluting to volume. What is the molar concentration of NaCl in solutions A, B and C?
18. Calculate the molar concentration of NaCl, to the correct number of significant figures, if 1.917 g of NaCl is placed in a beaker and dissolved in 50 mL of water measured with a graduated cylinder. If this solution is quantitatively transferred to a 250-mL volumetric flask and diluted to volume, what is its concentration to the correct number of significant figures?
19. What is the molar concentration of NO3– in a solution prepared by
mixing 50.0 mL of 0.050 M KNO3 with 40.0 mL of 0.075 M NaNO3? What is pNO3 for the mixture?
20. What is the molar concentration of Cl– in a solution prepared by mix-ing 25.0 mL of 0.025 M NaCl with 35.0 mL of 0.050 M BaCl2? What is pCl for the mixture?
21. To determine the concentration of ethanol in cognac a 5.00 mL sample of cognac is diluted to 0.500 L. Analysis of the diluted cognac gives an ethanol concentration of 0.0844 M. What is the molar concentration of ethanol in the undiluted cognac?
This is an example of a serial dilution, which is a useful method for preparing very dilute solutions of reagents.
Source URL: http://www.asdlib.org/onlineArticles/ecourseware/Analytical%20Chemistry%202.0/Text_Files.html Saylor URL: http://www.saylor.org/courses/chem108 Attributed to [David Harvey]
Saylor.org Page 25 of 28
38 Analytical Chemistry 2.0
2K Solutions to Practice Exercises
Practice Exercise 2.1
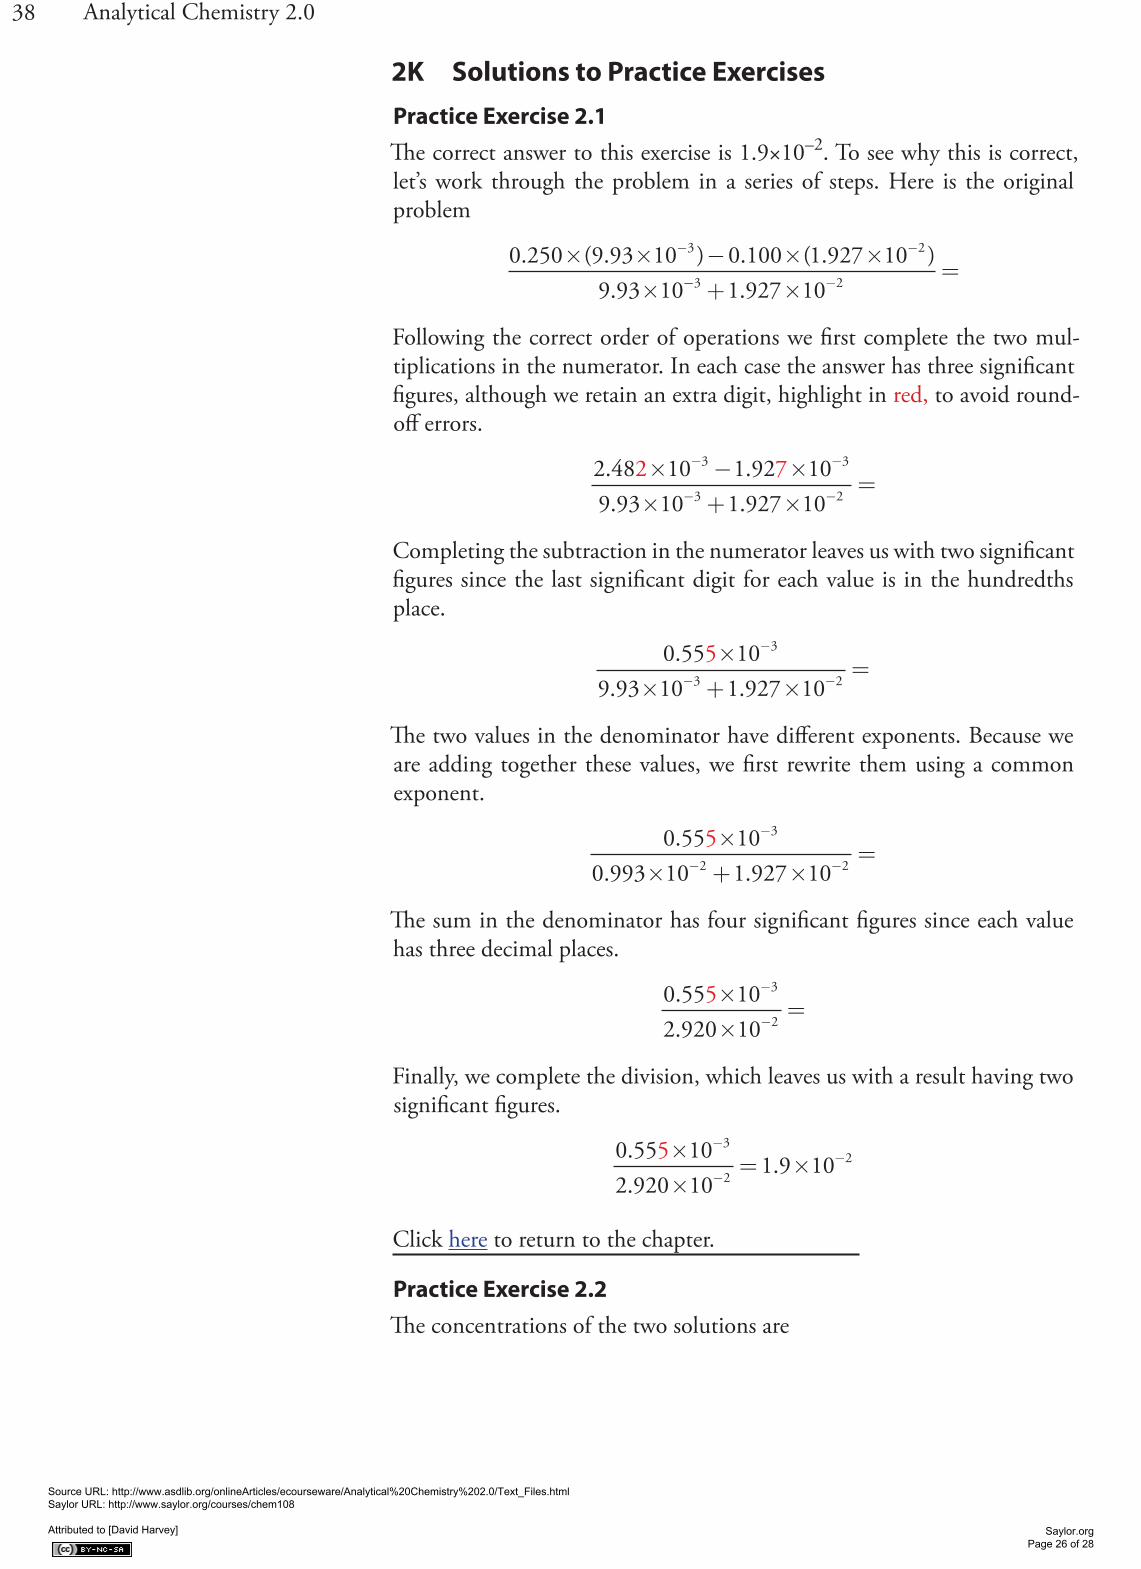
The correct answer to this exercise is 1.9×10⁻². To see why this is correct, let’s work through the problem in a series of steps. Here is the original problem
0 250 9 93 10 0 100 1 927 109 93 10
3 2. ( . ) . ( . ).
× × − × ××
− −
−− −+ ×=
3 21 927 10.
Following the correct order of operations we first complete the two mul-tiplications in the numerator. In each case the answer has three significant figures, although we retain an extra digit, highlight in red, to avoid round-off errors.
2 48 10 1 92 109 93 10 1 927 10
2 73 3
3 2
. .. .
× − ×× + ×
=− −
− −
Completing the subtraction in the numerator leaves us with two significant figures since the last significant digit for each value is in the hundredths place.
0 55 109 93 10 1 927 10
5 3
3 2
.. .
×× + ×
=−
− −
The two values in the denominator have different exponents. Because we are adding together these values, we first rewrite them using a common exponent.
0 55 100 993 10 1 927 10
5 3
2 2
.. .
×× + ×
=−
− −
The sum in the denominator has four significant figures since each value has three decimal places.
0 55 102 920 10
5 3
2
.
.××
=−
−
Finally, we complete the division, which leaves us with a result having two significant figures.
0 55 102 920 10
1 9 105 3
22.
..
××
= ×−
−−
Click here to return to the chapter.
Practice Exercise 2.2
The concentrations of the two solutions are
Source URL: http://www.asdlib.org/onlineArticles/ecourseware/Analytical%20Chemistry%202.0/Text_Files.html Saylor URL: http://www.saylor.org/courses/chem108 Attributed to [David Harvey]
Saylor.org Page 26 of 28
39Chapter 2 Basic Tools of Analytical Chemistry
0 50 106. mol NaClL
58.43 g NaClmol NaCl
gg
× × ×× = ×1
2 9 103L1000 mL
g/mL.
0 25 106. mol SrClL
158.5 g SrClmol NaCl
2 2× ×gg
gL
1000 mLg/mL× = ×
14 0 103.
The solution of SrCl2 has the larger concentration when expressed in μg/mL instead of in mol/L.Click here to return to the chapter.
Practice Exercise 2.3
The concentrations of K+ and SO42– are
1 50 500
1174 3
.. .g K SO
Lmol K SO
g K SO2 4 2 4
2 4
× ×× = × −23 4 104 2mol K
mol K SOM K
+
2 4
+.
1 50 500
1174 3
.. .g K SO
Lmol K SO
g K SO2 4 2 4
2 4
× ×× = ×−
− −1 mol SOmol K SO
M SO4
2 44
22 21 7 102.
The pK and pSO4 values are
pK = –log(3.4 4× 10⁻²) = 1.46
pSO4 = –log(1.72 × 10⁻²) = 1.76
Click here to return to the chapter.
Practice Exercise 2.4
First, we find the moles of AgBr
0 250187 8
1 33 11..
.g AgBr1 mol AgBr
g AgBr× = × 00 3−
and then the moles and volume of Na2S2O3
1 33 10 21 3. × × =− mol AgBr2 mol Na S O
mol AgBr2 2 3 ..66 102 3× −
2 66 101
2 3. × ×− mol Na S OL
0.0138 mol Na S O2 2 32 2 33
mLL
mL× =1000
193
Click here to return to the chapter.
Practice Exercise 2.5
Preparing 500 mL of 0.1250 M KBrO3 requires
Source URL: http://www.asdlib.org/onlineArticles/ecourseware/Analytical%20Chemistry%202.0/Text_Files.html Saylor URL: http://www.saylor.org/courses/chem108 Attributed to [David Harvey]
Saylor.org Page 27 of 28
40 Analytical Chemistry 2.0
0 5000 1250 167 00
.. .
Lmol KBrOL
g KBrOmol
3 3× ×KBrO
g KBrO3
3= 10 44.
Because the concentration has four significant figures, we must prepare the solution using volumetric glassware. Place a 10.44 g sample of KBrO3 in a 500-mL volumetric flask and fill part way with water. Swirl to dissolve the KBrO3 and then dilute with water to the flask’s calibration mark. Click here to return to the chapter.
Practice Exercise 2.6
The first solution is a stock solution, which we then dilute to prepare the standard solution. The concentration of Zn2+ in the stock solution is
1 004500
102008
6. g ZnmL
gg
g/mL× =
To find the concentration of the standard solution we use equation 2.3
20082 000 250 0
g ZnmL
mL mL2+
new× = ×. .C
where Cnew is the standard solution’s concentration. Solving gives a concen-tration of 16.06 μg Zn2+/mL.Click here to return to the chapter.
Source URL: http://www.asdlib.org/onlineArticles/ecourseware/Analytical%20Chemistry%202.0/Text_Files.html Saylor URL: http://www.saylor.org/courses/chem108 Attributed to [David Harvey]
Saylor.org Page 28 of 28