Embed Size (px)
Citation preview
Basic Techniques in Text Miningusing Open-source Tools
Jun IioSocio-Informatics, Faculty of Letters, Chuo University
742–1 Higashinakano, Hachioji-shiTokyo 192–0393, [email protected]
ABSTRACTThere are many text mining tools provided commerciallyand non-commercially. However, the elementary text-basedanalysis can be done with basic Unix commands, shell-scripts,and small program of scripting languages, instead of usingsuch extensive software. This paper introduces the basictechniques for text mining, using combination of a set ofstandard commands, small code, and generic tools providedas the open-source software. The target of the analysis aresixty-seven articles written by one author in a relay columnsince 1998. Several text-based analyses reveals a trend of in-terest moved within about fifteen years. In addition, at theend of this paper, the results of text-based analysis are com-pared with that of non-text-based analysis and the efficiencyof non-parametric analysis is discussed.
Categories and Subject DescriptorsH.4 [Information Systems Applications]: Miscellaneous;I.7 [Document and Text Processing]: Miscellaneous—text mining, clustering
Keywordstext mining, open-source, visualization
1. INTRODUCTIONA dozen research analysts and consultants working for
Mitsubishi Research Institute, Inc. are engaged in the relaycolumn1 named “Take IT Easy,” which is a series of essaysexplaining some topics in the information technology area.
In 2010, Iio et al. tried to illustrate that some text-basedanalyses could reveal tendencies of the information technol-ogy trend[3]. In this study, the scope of the analysis wasset narrower than the previous study. The sixty-seven ar-ticles that were written by one author from the beginningof the relay column were set as the target of the text-based
1http://easy.mri.co.jp/ (in Japanese)
Permission to make digital or hard copies of all or part of this work forpersonal or classroom use is granted without fee provided that copies arenot made or distributed for profit or commercial advantage and that copiesbear this notice and the full citation on the first page. To copy otherwise, torepublish, to post on servers or to redistribute to lists, requires prior specificpermission and/or a fee.WikiSym’13, Aug 05-07 2013, Hong Kong, ChinaACM 978-1-4503-1852-5/13/08.http://dx.doi.org/10.1145/2491055.2491099
Figure 1: An author index page. The red box showsthe list of links to the articles previously posted bythe author.
analysis and it was expected that the result could show themovement of his interest for a decade. This paper showsprocedures and results of the analysis.
2. PREROCESS AND VISUALIZATIONThere are many text mining tools provided commercially
and non-commercially[2, 4]. This paper introduces the ele-mentary text-based analysis using simple open-source toolsinstead of such complicated software.
In this section, some preparation steps as preprocessing forthe clustering analysis and simple visualization using wordcloud are explained.
2.1 Scraping Text Data from WWWFirstly, get the target data ready to analyze. In this case,
the bunch of text files can be downloaded from a page whichhas a list of articles previously published (Figure 1).
The list contains the URLs of backnumbers can be ex-tracted from the page. The list of URLs makes the arti-cles downloaded automatically, using a shell script and wget
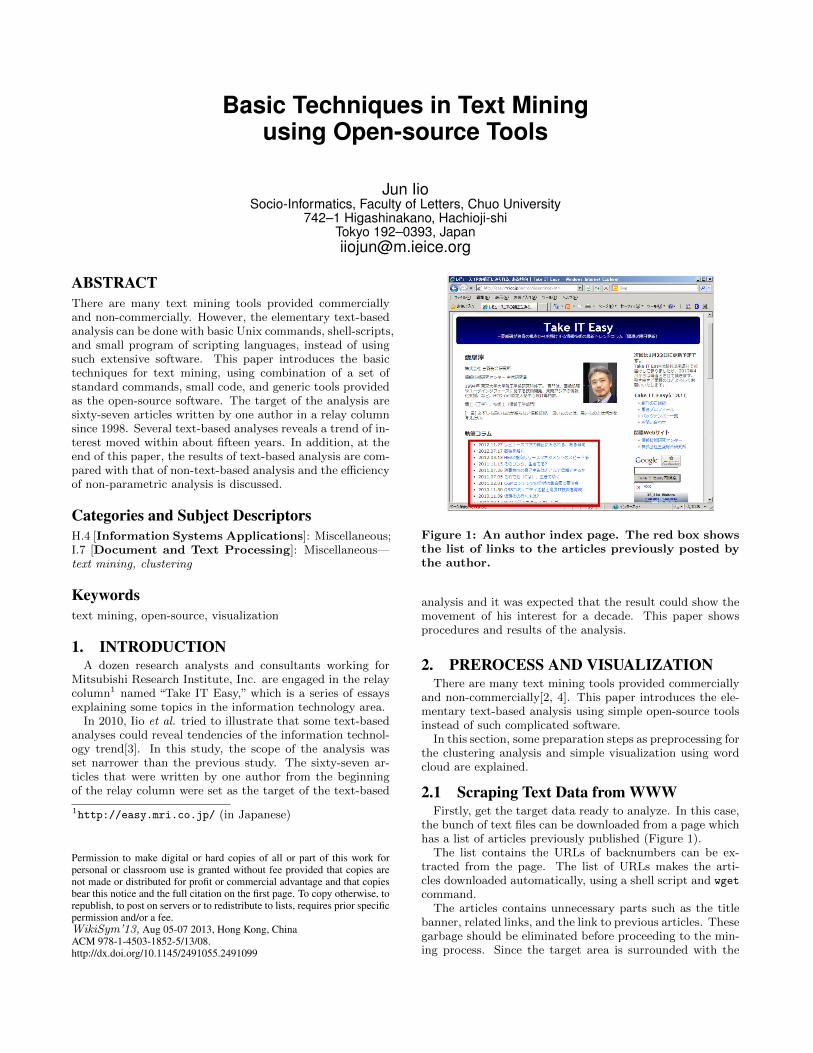
command.The articles contains unnecessary parts such as the title
banner, related links, and the link to previous articles. Thesegarbage should be eliminated before proceeding to the min-ing process. Since the target area is surrounded with the
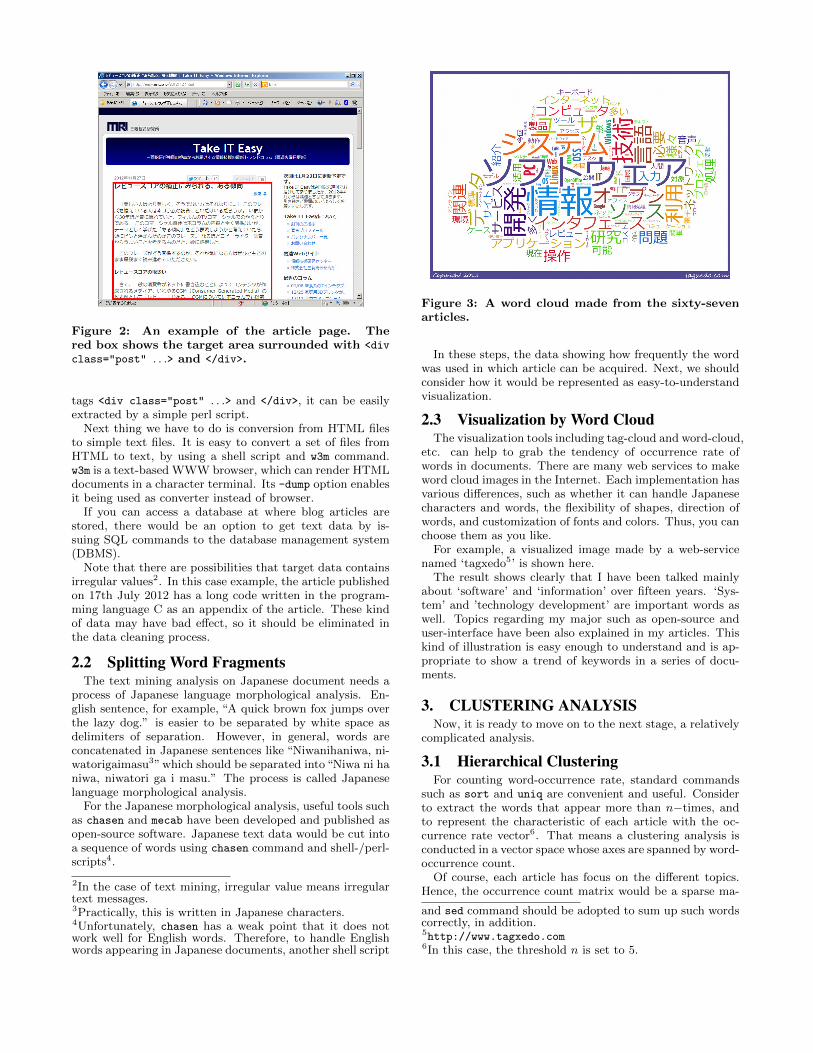
Figure 2: An example of the article page. Thered box shows the target area surrounded with <div
class="post" . . .> and </div>.
tags <div class="post" . . .> and </div>, it can be easilyextracted by a simple perl script.
Next thing we have to do is conversion from HTML filesto simple text files. It is easy to convert a set of files fromHTML to text, by using a shell script and w3m command.w3m is a text-based WWW browser, which can render HTMLdocuments in a character terminal. Its -dump option enablesit being used as converter instead of browser.
If you can access a database at where blog articles arestored, there would be an option to get text data by is-suing SQL commands to the database management system(DBMS).
Note that there are possibilities that target data containsirregular values2. In this case example, the article publishedon 17th July 2012 has a long code written in the program-ming language C as an appendix of the article. These kindof data may have bad effect, so it should be eliminated inthe data cleaning process.
2.2 Splitting Word FragmentsThe text mining analysis on Japanese document needs a
process of Japanese language morphological analysis. En-glish sentence, for example, “A quick brown fox jumps overthe lazy dog.” is easier to be separated by white space asdelimiters of separation. However, in general, words areconcatenated in Japanese sentences like “Niwanihaniwa, ni-watorigaimasu3”which should be separated into“Niwa ni haniwa, niwatori ga i masu.” The process is called Japaneselanguage morphological analysis.
For the Japanese morphological analysis, useful tools suchas chasen and mecab have been developed and published asopen-source software. Japanese text data would be cut intoa sequence of words using chasen command and shell-/perl-scripts4.
2In the case of text mining, irregular value means irregulartext messages.3Practically, this is written in Japanese characters.4Unfortunately, chasen has a weak point that it does notwork well for English words. Therefore, to handle Englishwords appearing in Japanese documents, another shell script
Figure 3: A word cloud made from the sixty-sevenarticles.
In these steps, the data showing how frequently the wordwas used in which article can be acquired. Next, we shouldconsider how it would be represented as easy-to-understandvisualization.
2.3 Visualization by Word CloudThe visualization tools including tag-cloud and word-cloud,
etc. can help to grab the tendency of occurrence rate ofwords in documents. There are many web services to makeword cloud images in the Internet. Each implementation hasvarious differences, such as whether it can handle Japanesecharacters and words, the flexibility of shapes, direction ofwords, and customization of fonts and colors. Thus, you canchoose them as you like.
For example, a visualized image made by a web-servicenamed ‘tagxedo5’ is shown here.
The result shows clearly that I have been talked mainlyabout ‘software’ and ‘information’ over fifteen years. ‘Sys-tem’ and ’technology development’ are important words aswell. Topics regarding my major such as open-source anduser-interface have been also explained in my articles. Thiskind of illustration is easy enough to understand and is ap-propriate to show a trend of keywords in a series of docu-ments.
3. CLUSTERING ANALYSISNow, it is ready to move on to the next stage, a relatively
complicated analysis.
3.1 Hierarchical ClusteringFor counting word-occurrence rate, standard commands
such as sort and uniq are convenient and useful. Considerto extract the words that appear more than n−times, andto represent the characteristic of each article with the oc-currence rate vector6. That means a clustering analysis isconducted in a vector space whose axes are spanned by word-occurrence count.
Of course, each article has focus on the different topics.Hence, the occurrence count matrix would be a sparse ma-
and sed command should be adopted to sum up such wordscorrectly, in addition.5http://www.tagxedo.com6In this case, the threshold n is set to 5.
trix which elements are almost 0. However, on theoreticalgrounds, each article is represented as a point in the space.Therefore, a distance between an article and another articlecan be calculated. Based on the distances among articles,we can consider the hierarchical clustering analysis.
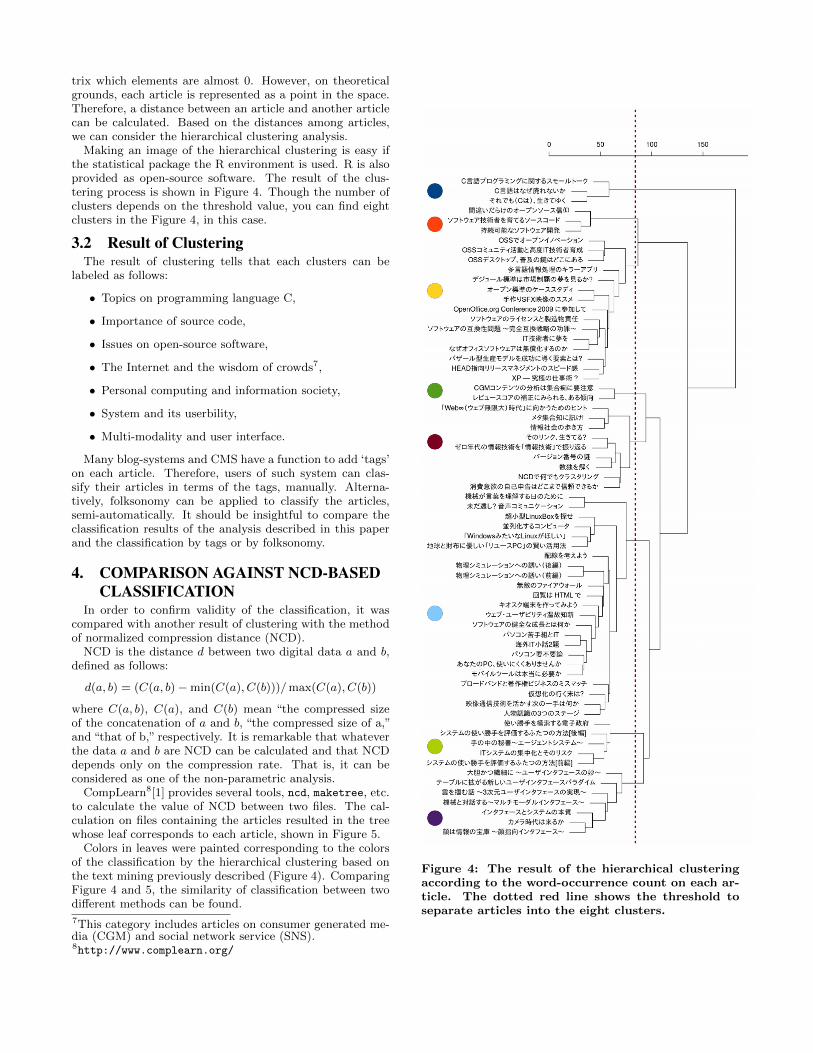
Making an image of the hierarchical clustering is easy ifthe statistical package the R environment is used. R is alsoprovided as open-source software. The result of the clus-tering process is shown in Figure 4. Though the number ofclusters depends on the threshold value, you can find eightclusters in the Figure 4, in this case.
3.2 Result of ClusteringThe result of clustering tells that each clusters can be
labeled as follows:
• Topics on programming language C,
• Importance of source code,
• Issues on open-source software,
• The Internet and the wisdom of crowds7,
• Personal computing and information society,
• System and its userbility,
• Multi-modality and user interface.
Many blog-systems and CMS have a function to add ‘tags’on each article. Therefore, users of such system can clas-sify their articles in terms of the tags, manually. Alterna-tively, folksonomy can be applied to classify the articles,semi-automatically. It should be insightful to compare theclassification results of the analysis described in this paperand the classification by tags or by folksonomy.
4. COMPARISON AGAINST NCD-BASEDCLASSIFICATION
In order to confirm validity of the classification, it wascompared with another result of clustering with the methodof normalized compression distance (NCD).
NCD is the distance d between two digital data a and b,defined as follows:
d(a, b) = (C(a, b) − min(C(a), C(b)))/max(C(a), C(b))
where C(a, b), C(a), and C(b) mean “the compressed sizeof the concatenation of a and b, “the compressed size of a,”and “that of b,” respectively. It is remarkable that whateverthe data a and b are NCD can be calculated and that NCDdepends only on the compression rate. That is, it can beconsidered as one of the non-parametric analysis.
CompLearn8[1] provides several tools, ncd, maketree, etc.to calculate the value of NCD between two files. The cal-culation on files containing the articles resulted in the treewhose leaf corresponds to each article, shown in Figure 5.
Colors in leaves were painted corresponding to the colorsof the classification by the hierarchical clustering based onthe text mining previously described (Figure 4). ComparingFigure 4 and 5, the similarity of classification between twodifferent methods can be found.
7This category includes articles on consumer generated me-dia (CGM) and social network service (SNS).8http://www.complearn.org/
Figure 4: The result of the hierarchical clusteringaccording to the word-occurrence count on each ar-ticle. The dotted red line shows the threshold toseparate articles into the eight clusters.
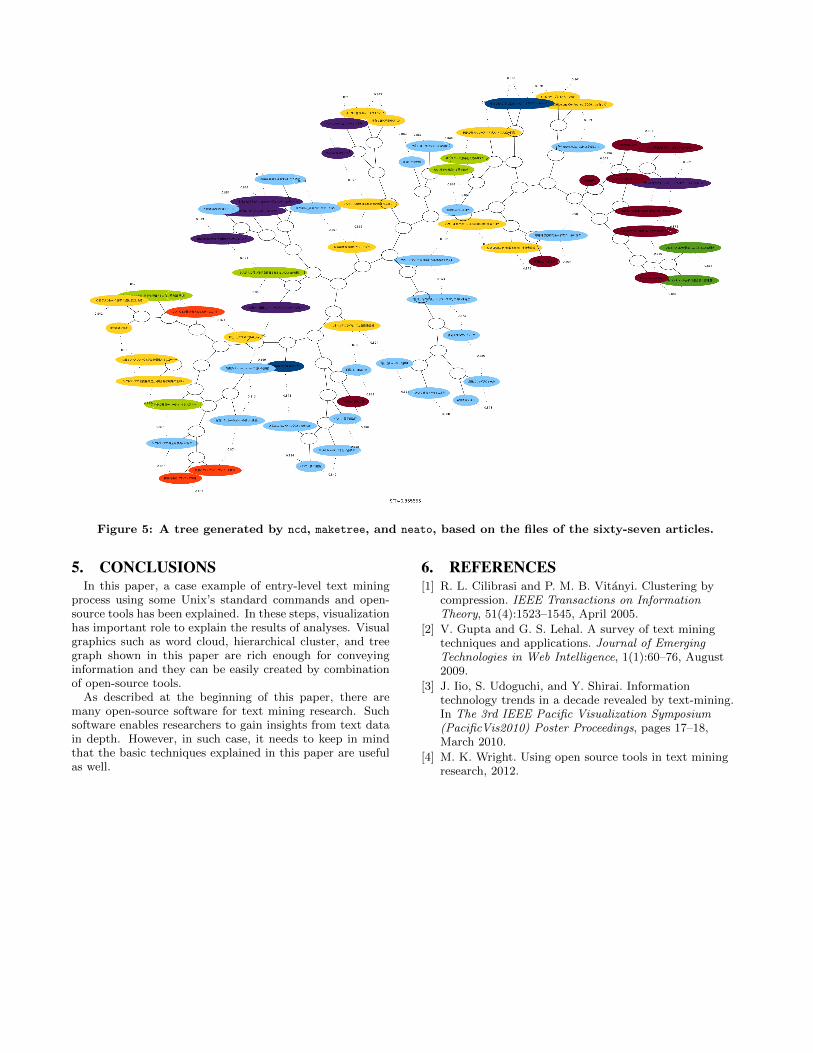
Figure 5: A tree generated by ncd, maketree, and neato, based on the files of the sixty-seven articles.
5. CONCLUSIONSIn this paper, a case example of entry-level text mining
process using some Unix’s standard commands and open-source tools has been explained. In these steps, visualizationhas important role to explain the results of analyses. Visualgraphics such as word cloud, hierarchical cluster, and treegraph shown in this paper are rich enough for conveyinginformation and they can be easily created by combinationof open-source tools.
As described at the beginning of this paper, there aremany open-source software for text mining research. Suchsoftware enables researchers to gain insights from text datain depth. However, in such case, it needs to keep in mindthat the basic techniques explained in this paper are usefulas well.
6. REFERENCES[1] R. L. Cilibrasi and P. M. B. Vitanyi. Clustering by
compression. IEEE Transactions on InformationTheory, 51(4):1523–1545, April 2005.
[2] V. Gupta and G. S. Lehal. A survey of text miningtechniques and applications. Journal of EmergingTechnologies in Web Intelligence, 1(1):60–76, August2009.
[3] J. Iio, S. Udoguchi, and Y. Shirai. Informationtechnology trends in a decade revealed by text-mining.In The 3rd IEEE Pacific Visualization Symposium(PacificVis2010) Poster Proceedings, pages 17–18,March 2010.
[4] M. K. Wright. Using open source tools in text miningresearch, 2012.


![A Survey of Text Mining Techniques and Applications · Text mining [1] is similar to data mining, except that data mining tools [2] are designed to handle structured data from databases](https://img.pdfslide.us/doc/110x75/5f53bcf4618636597671add2/a-survey-of-text-mining-techniques-and-text-mining-1-is-similar-to-data-mining.jpg)


![GAIL: An interactive webserver for inference and dynamic ...of biomedical text, advanced techniques such as text mining need to be used [15]. One popular text mining approach is co-occurrence](https://img.pdfslide.us/doc/110x75/5f17fedcf532797d9c1003d5/gail-an-interactive-webserver-for-inference-and-dynamic-of-biomedical-text.jpg)