Embed Size (px)
Citation preview
Basic Statistics(for this class)
Special thanks to Jay Pinckney (The HPLC and Statistics Guru)
APOS
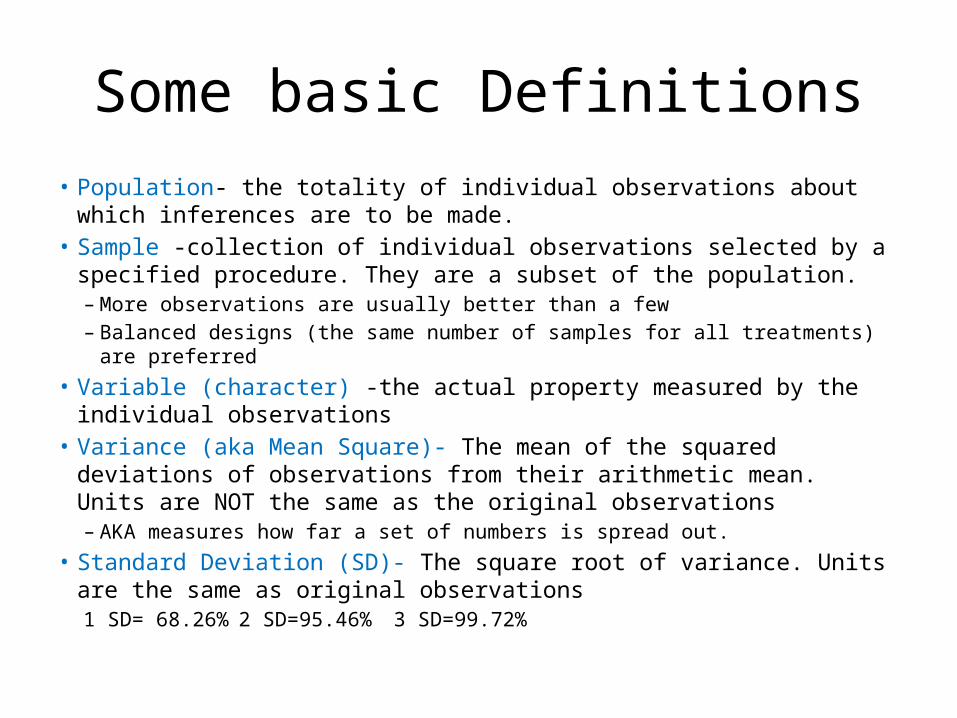
Some basic Definitions• Population- the totality of individual observations about which inferences are
to be made. • Sample -collection of individual observations selected by a specified
procedure. They are a subset of the population.– More observations are usually better than a few– Balanced designs (the same number of samples for all treatments) are preferred
• Variable (character) -the actual property measured by the individual observations
• Variance (aka Mean Square)- The mean of the squared deviations of observations from their arithmetic mean. Units are NOT the same as the original observations – AKA measures how far a set of numbers is spread out.
• Standard Deviation (SD)- The square root of variance. Units are the same as original observations
1 SD= 68.26% 2 SD=95.46% 3 SD=99.72%
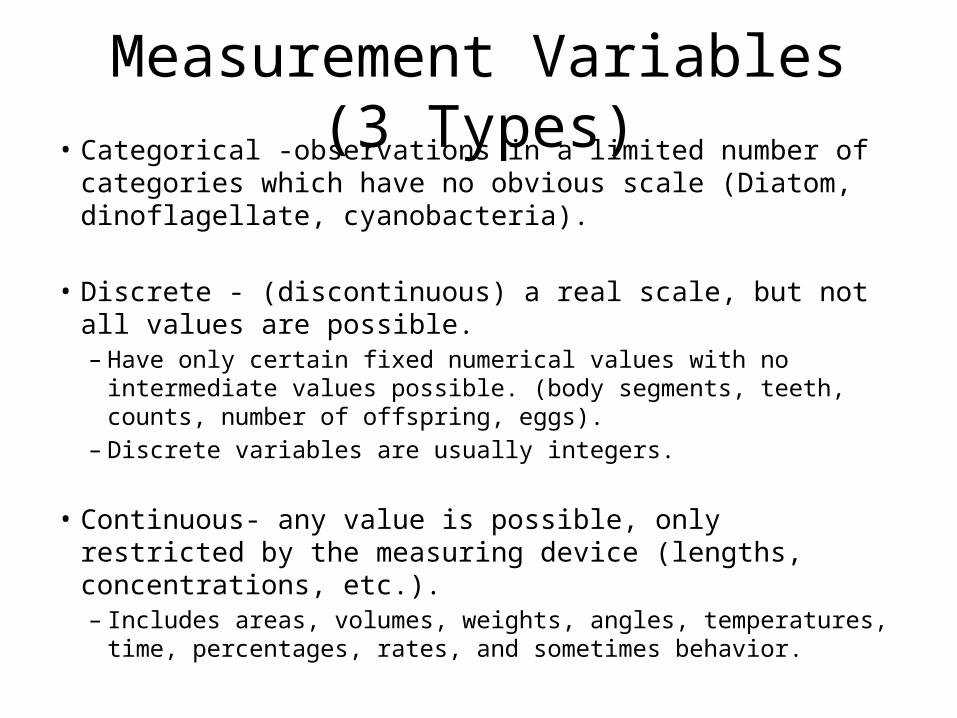
Measurement Variables (3 Types)• Categorical -observations in a limited number of categories
which have no obvious scale (Diatom, dinoflagellate, cyanobacteria).
• Discrete - (discontinuous) a real scale, but not all values are possible. – Have only certain fixed numerical values with no intermediate values
possible. (body segments, teeth, counts, number of offspring, eggs). – Discrete variables are usually integers.
• Continuous- any value is possible, only restricted by the measuring device (lengths, concentrations, etc.). – Includes areas, volumes, weights, angles, temperatures, time,
percentages, rates, and sometimes behavior.
The Awesome Power of Statistics (APOS)
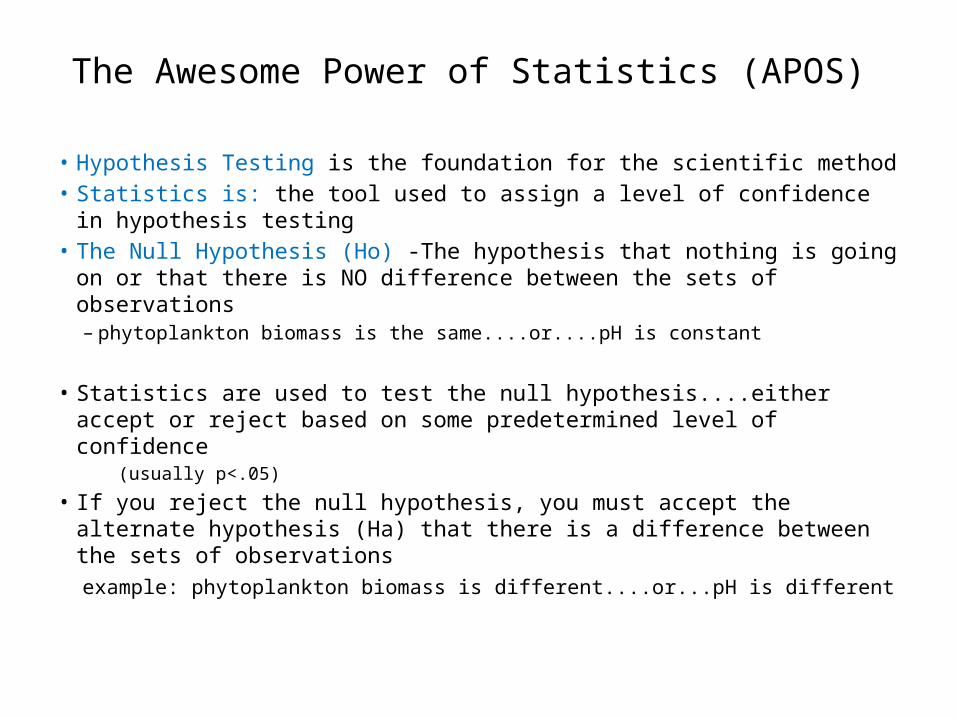
• Hypothesis Testing is the foundation for the scientific method• Statistics is: the tool used to assign a level of confidence in hypothesis
testing• The Null Hypothesis (Ho) -The hypothesis that nothing is going on or
that there is NO difference between the sets of observations– phytoplankton biomass is the same....or....pH is constant
• Statistics are used to test the null hypothesis....either accept or reject based on some predetermined level of confidence
(usually p<.05)
• If you reject the null hypothesis, you must accept the alternate hypothesis (Ha) that there is a difference between the sets of observations
example: phytoplankton biomass is different....or...pH is different
How confident are you in your decision?
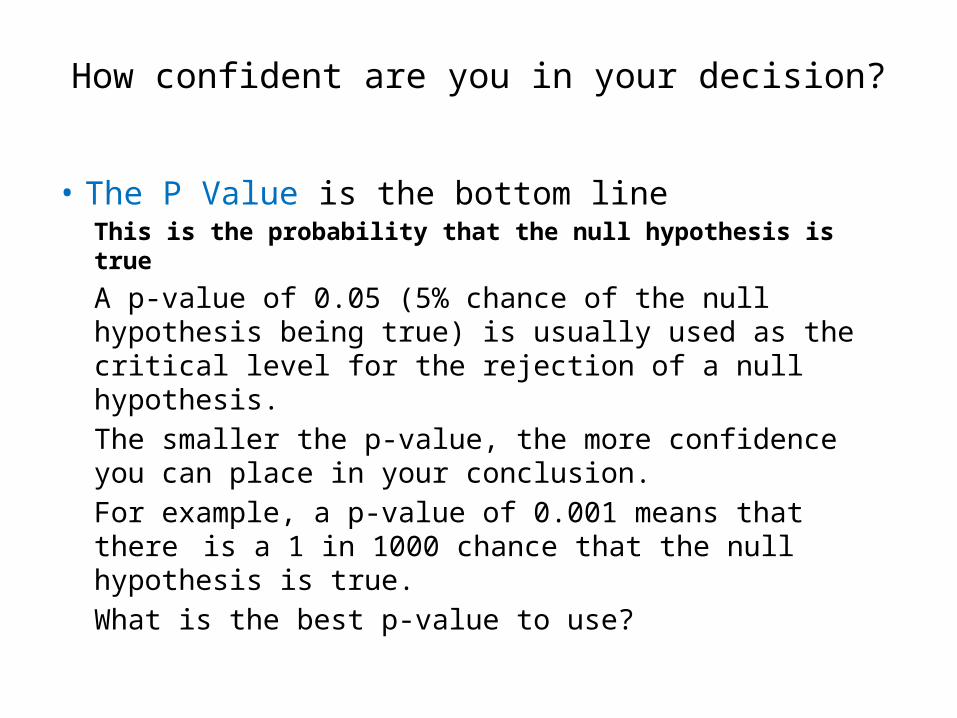
• The P Value is the bottom lineThis is the probability that the null hypothesis is true
A p-value of 0.05 (5% chance of the null hypothesis being true) is usually used as the critical level for the rejection of a null hypothesis.The smaller the p-value, the more confidence you can place in your conclusion.
For example, a p-value of 0.001 means that there is a 1 in 1000 chance that the null hypothesis is true.
What is the best p-value to use?
T-Test2 Basic Types
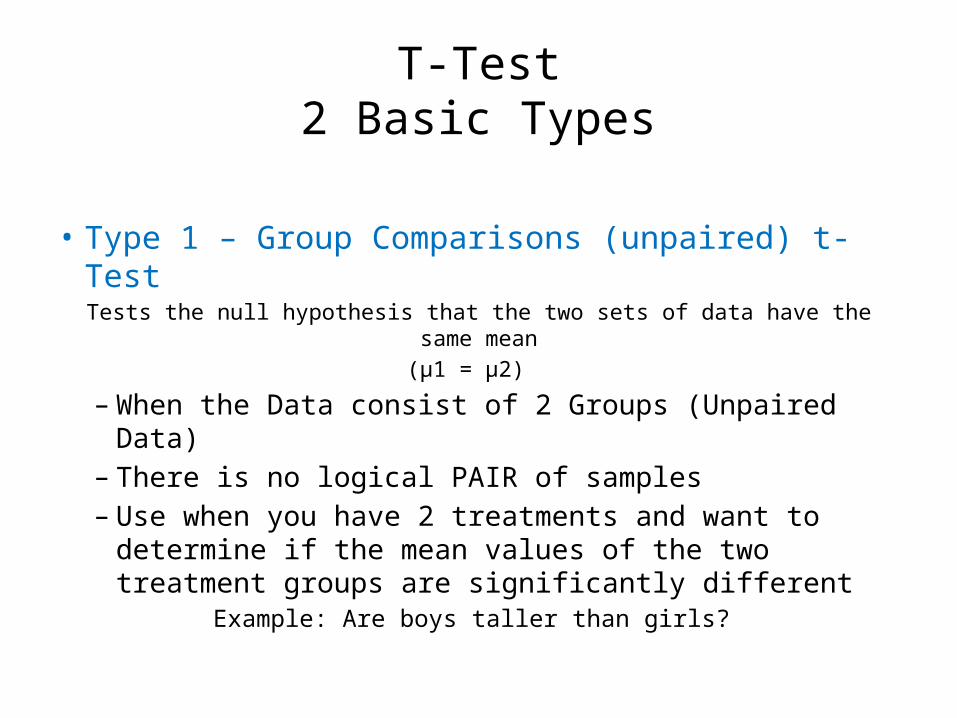
• Type 1 – Group Comparisons (unpaired) t-Test Tests the null hypothesis that the two sets of data have the same mean
(μ1 = μ2)
– When the Data consist of 2 Groups (Unpaired Data) – There is no logical PAIR of samples – Use when you have 2 treatments and want to
determine if the mean values of the two treatment groups are significantly different
Example: Are boys taller than girls?
T-Test2 Basic Types
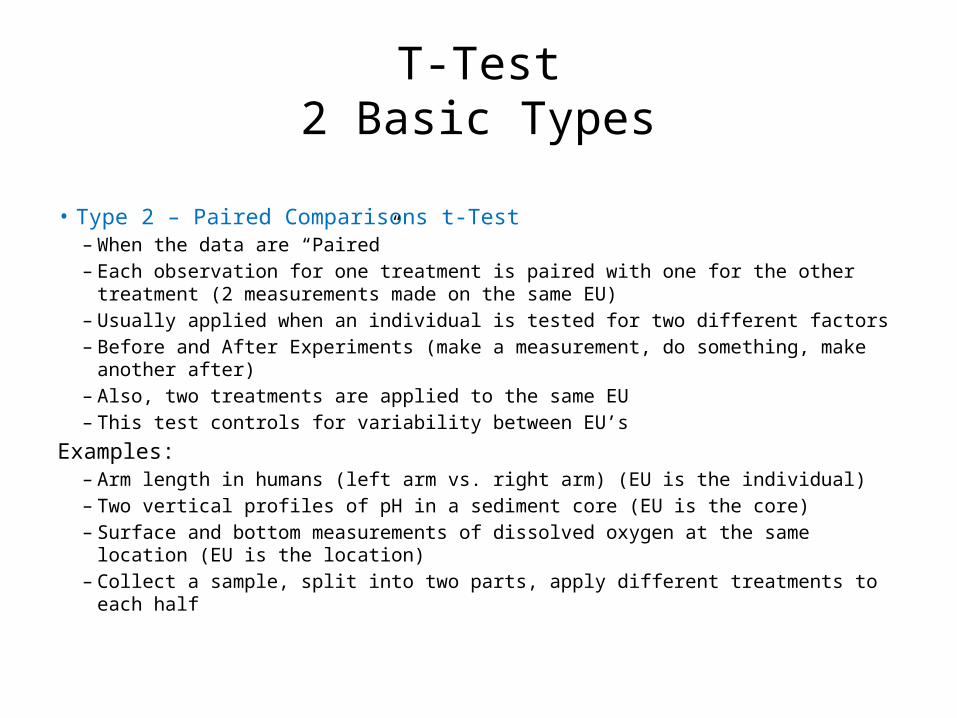
• Type 2 – Paired Comparisons t-Test – When the data are “Paired” – Each observation for one treatment is paired with one for the other treatment (2
measurements made on the same EU) – Usually applied when an individual is tested for two different factors – Before and After Experiments (make a measurement, do something, make another
after) – Also, two treatments are applied to the same EU – This test controls for variability between EU’s
Examples: – Arm length in humans (left arm vs. right arm) (EU is the individual) – Two vertical profiles of pH in a sediment core (EU is the core) – Surface and bottom measurements of dissolved oxygen at the same location (EU is the
location) – Collect a sample, split into two parts, apply different treatments to each half
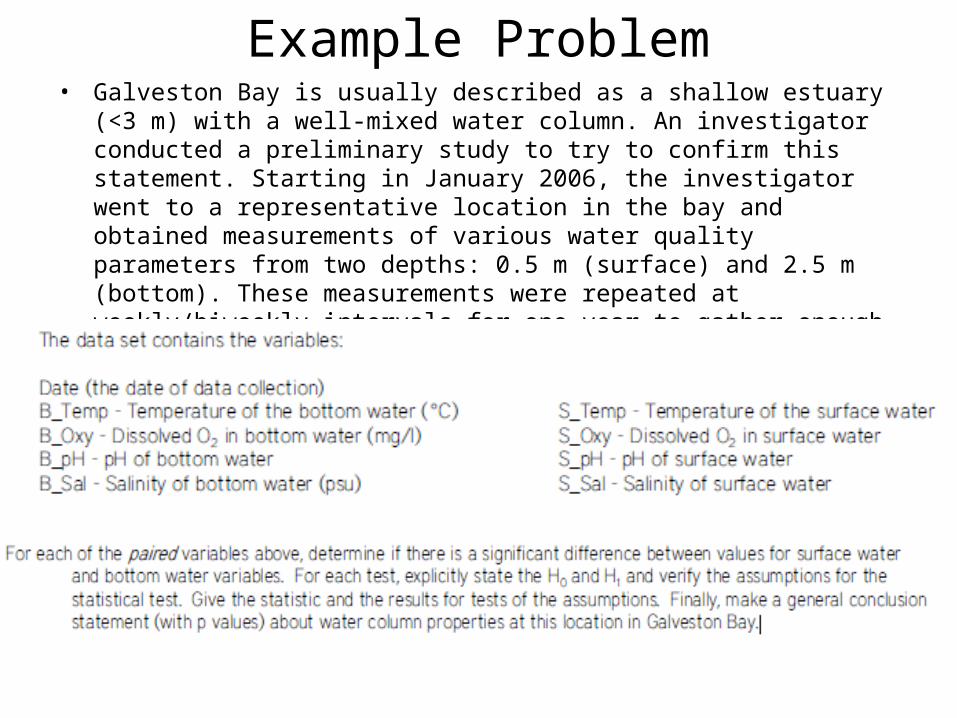
Example Problem• Galveston Bay is usually described as a shallow estuary (<3 m) with a well-mixed
water column. An investigator conducted a preliminary study to try to confirm this statement. Starting in January 2006, the investigator went to a representative location in the bay and obtained measurements of various water quality parameters from two depths: 0.5 m (surface) and 2.5 m (bottom). These measurements were repeated at weekly/biweekly intervals for one year to gather enough data to make a general conclusion about the mixing status (mixed or stratified) of the water column at this location.
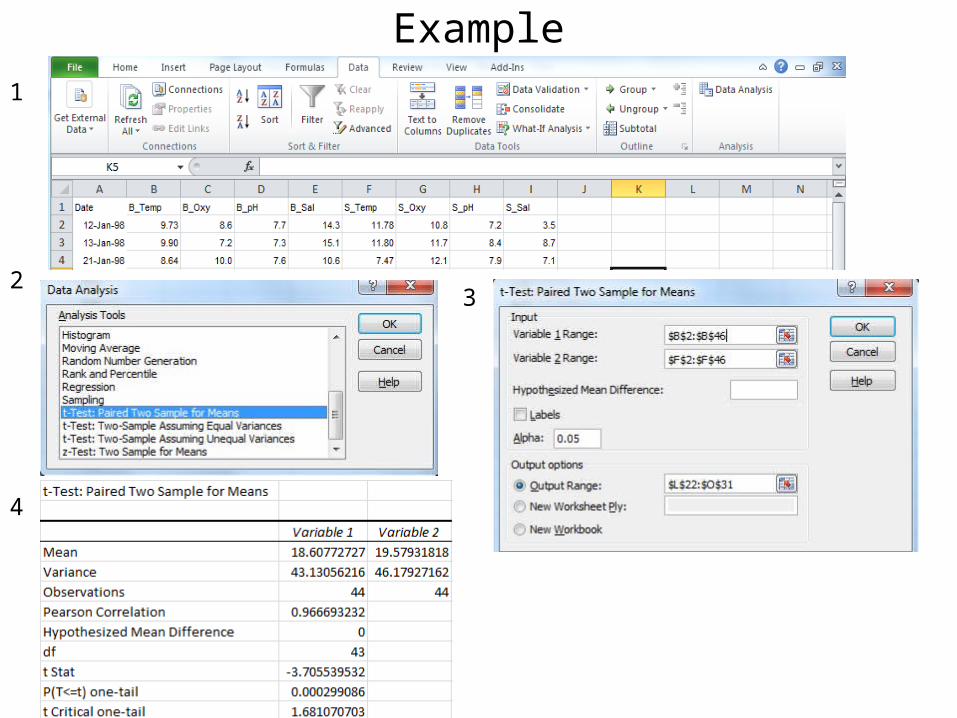
Example1
23
4
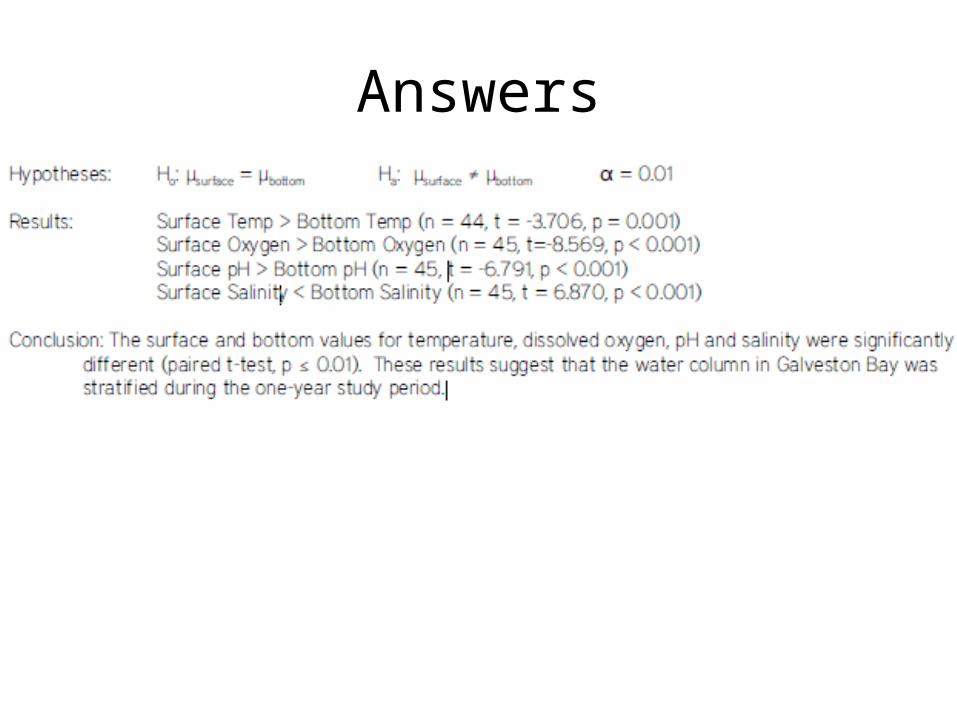
Answers
Correlations
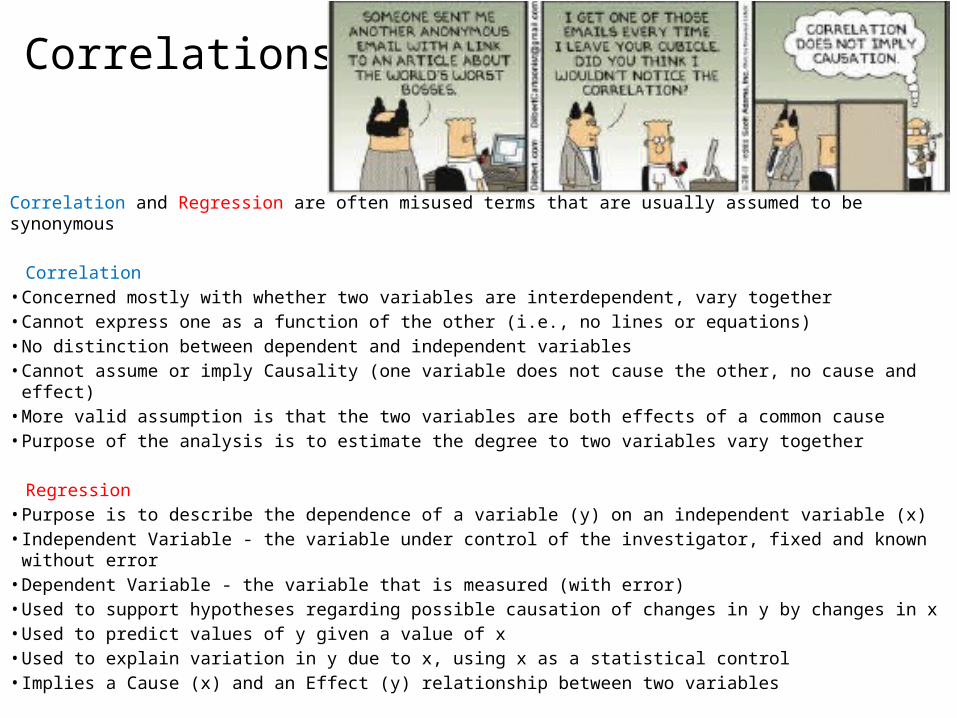
Correlation and Regression are often misused terms that are usually assumed to be synonymous
Correlation • Concerned mostly with whether two variables are interdependent, vary together • Cannot express one as a function of the other (i.e., no lines or equations) • No distinction between dependent and independent variables • Cannot assume or imply Causality (one variable does not cause the other, no cause and effect) • More valid assumption is that the two variables are both effects of a common cause • Purpose of the analysis is to estimate the degree to two variables vary together
Regression • Purpose is to describe the dependence of a variable (y) on an independent variable (x) • Independent Variable - the variable under control of the investigator, fixed and known without error • Dependent Variable - the variable that is measured (with error) • Used to support hypotheses regarding possible causation of changes in y by changes in x • Used to predict values of y given a value of x • Used to explain variation in y due to x, using x as a statistical control • Implies a Cause (x) and an Effect (y) relationship between two variables
Cont…• Correlation analysis is used to determine the degree of association
between two variables • Determine whether two sets of observations are associated or
correlated, the strength of the correlation, and whether it is significant or not
• Standard Correlation - Pearson’s Product-Moment Correlation • The statistic is denoted as r (true correlation is ρ) and is termed the
correlation coefficient r ranges from -1 (perfect negative correlation) to 0 (no correlation) to +1 (perfect positive correlation)
• The p-value indicates the significance for testing the hypothesis: H0: ρ = 0 Ha: ρ ≠ 0
• Results are usually reported as “Pearson product-moment correlation analysis indicates a significant positive association between y1 and y2 (r = 0.51, n=22, p < 0.05)”
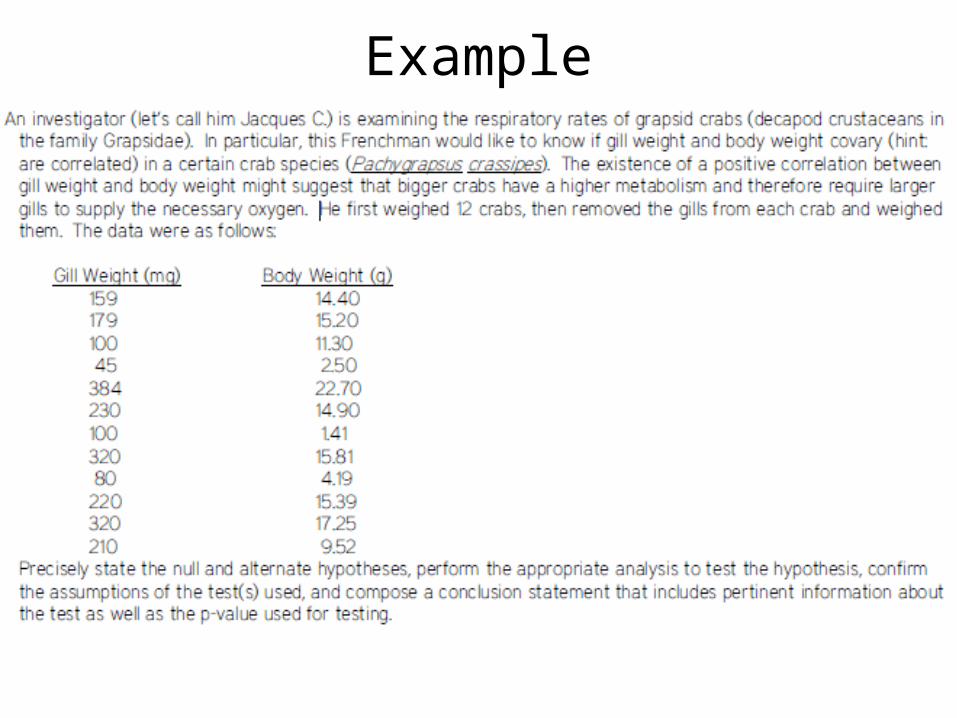
Example
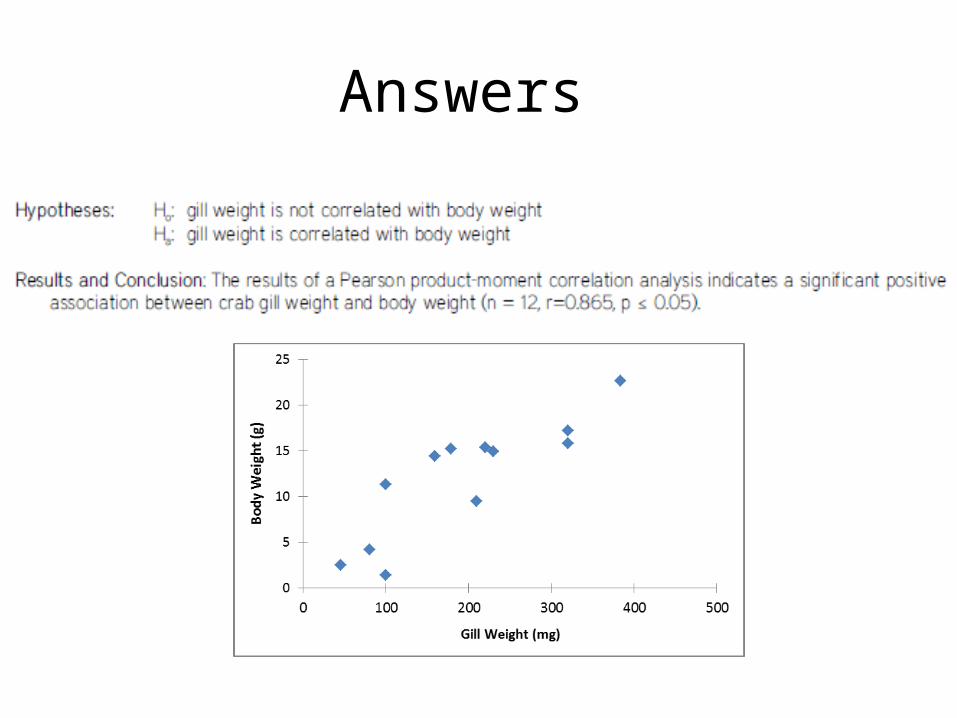
Answers
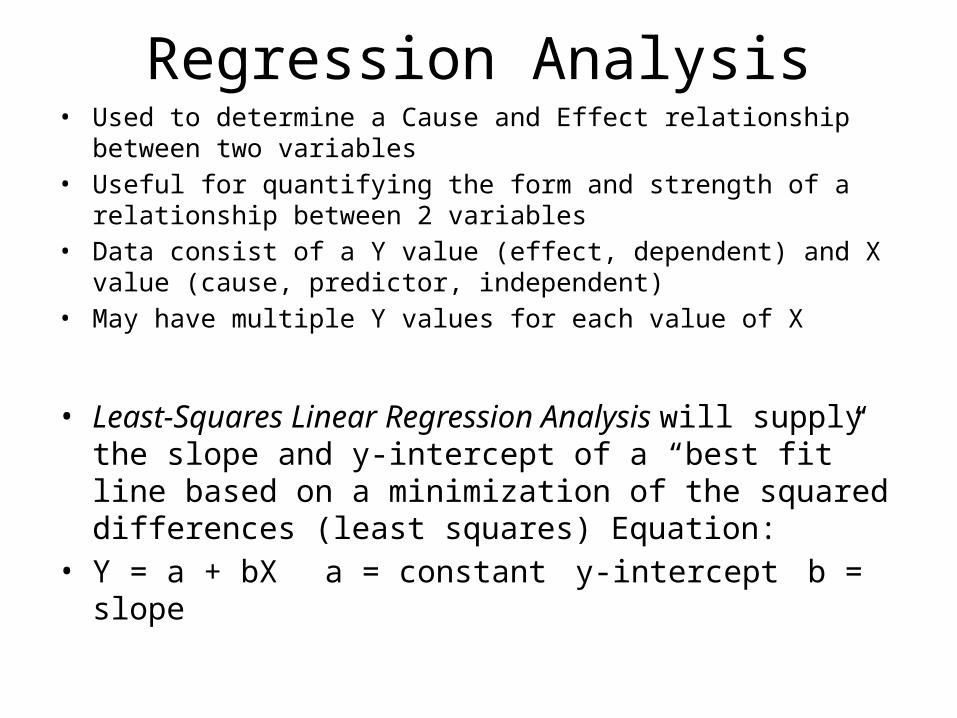
Regression Analysis• Used to determine a Cause and Effect relationship between two variables • Useful for quantifying the form and strength of a relationship between 2
variables • Data consist of a Y value (effect, dependent) and X value (cause, predictor,
independent) • May have multiple Y values for each value of X
• Least-Squares Linear Regression Analysis will supply the slope and y-intercept of a “best fit” line based on a minimization of the squared differences (least squares) Equation:
• Y = a + bX a = constant y-intercept b = slope
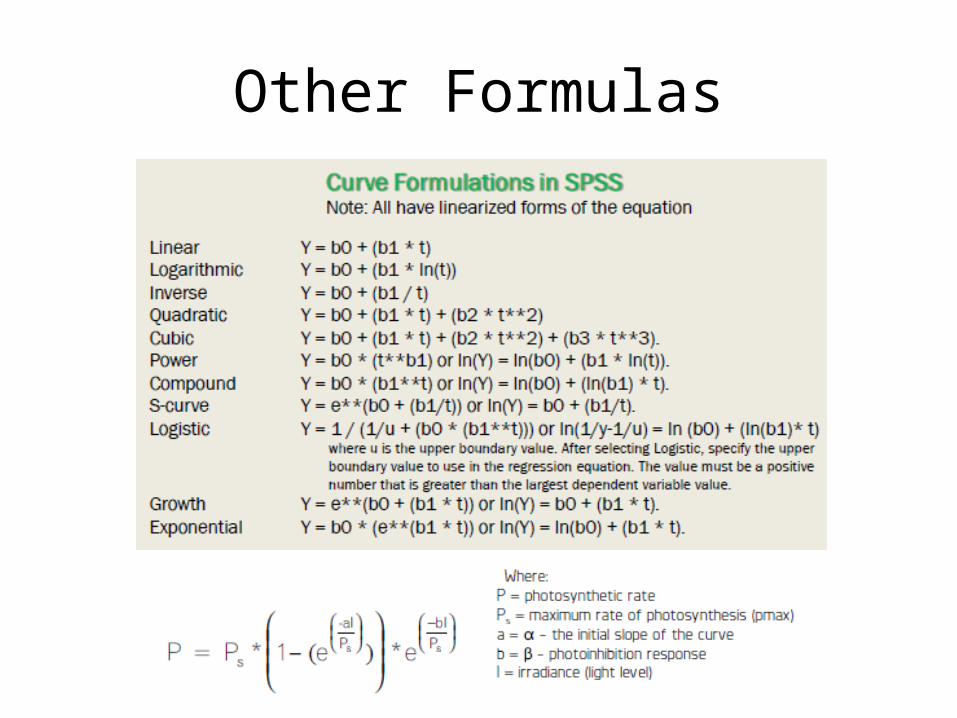
Other Formulas
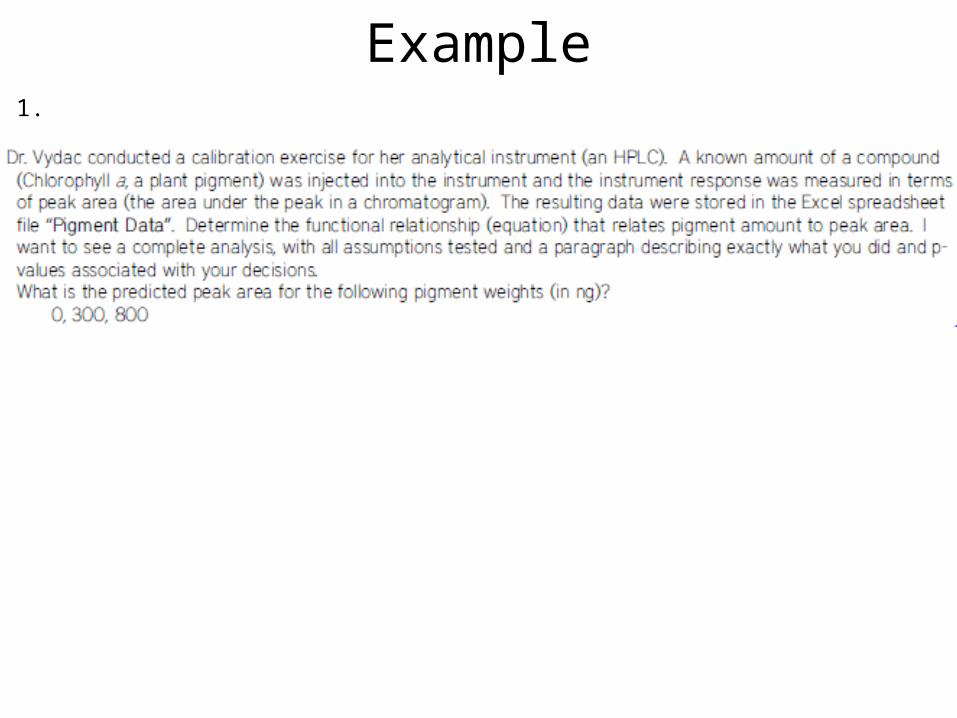
Example1.
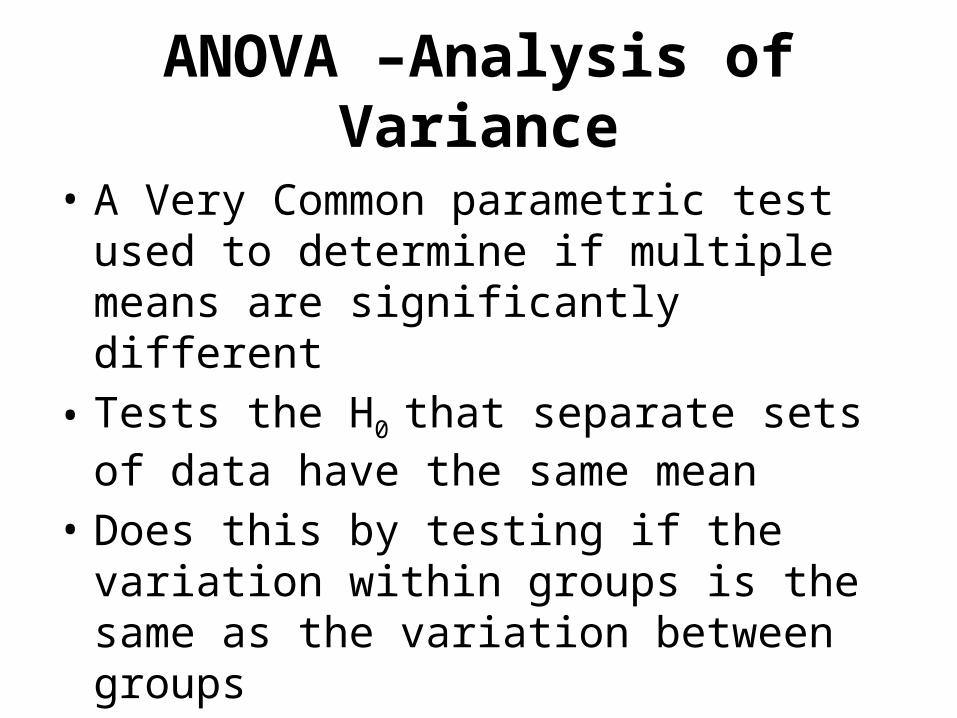
ANOVA –Analysis of Variance
• A Very Common parametric test used to determine if multiple means are significantly different
• Tests the H0 that separate sets of data have the same mean
• Does this by testing if the variation within groups is the same as the variation between groups
Terminology
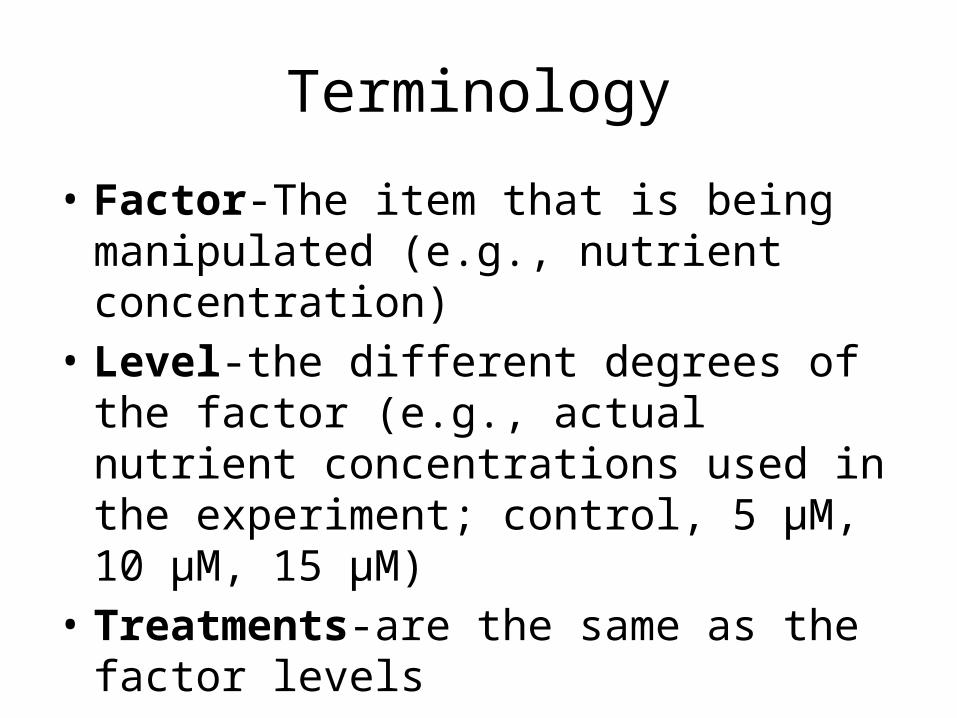
• Factor-The item that is being manipulated (e.g., nutrient concentration)
• Level-the different degrees of the factor (e.g., actual nutrient concentrations used in the experiment; control, 5 μM, 10 μM, 15 μM)
• Treatments-are the same as the factor levels
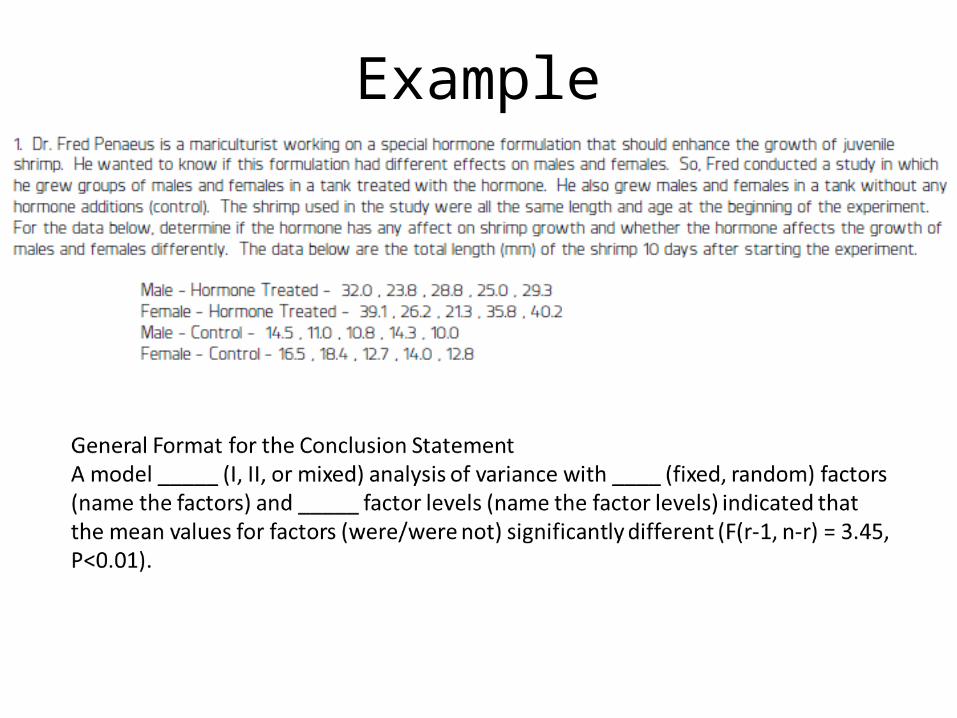
Example
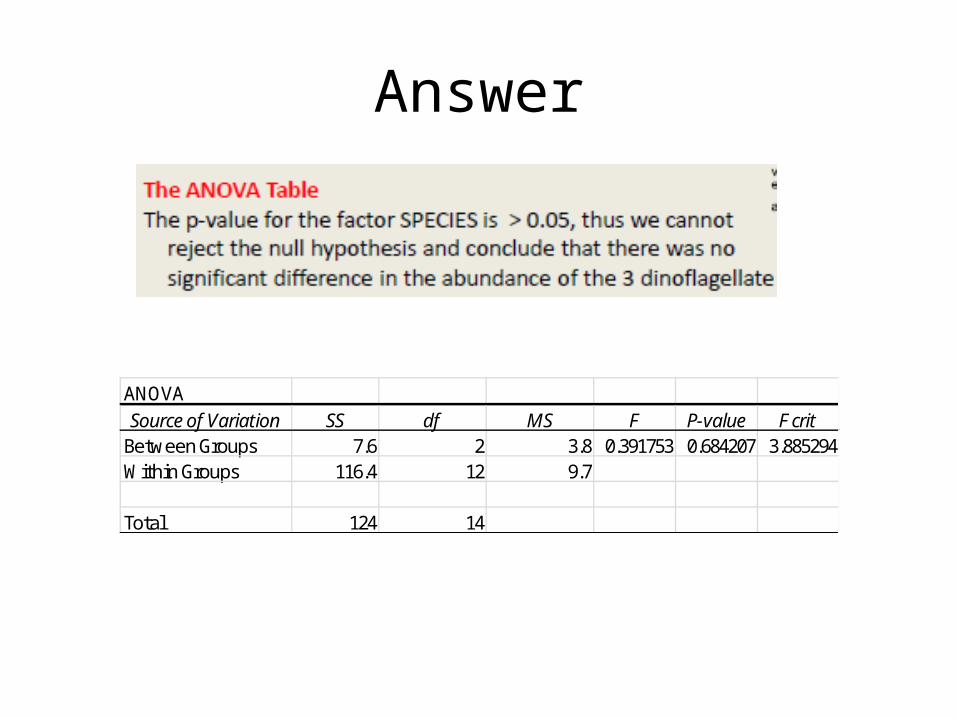
Answer
ANOVASource of Variation SS df MS F P-value F crit
Between Groups 7.6 2 3.8 0.391753 0.684207 3.885294Within Groups 116.4 12 9.7
Total 124 14