Embed Size (px)
DESCRIPTION
Understand the simple calculating methods about Statistics
Citation preview

What is Arithmetic Mean?
How to calculate Median number?
How to calculate Mode and Range?
How to calculate Standard Deviation?
How to calculate Geometric Mean?
How to calculate Grouped Data Arithmetic Mean?
How to calculate Class Interval Arithmetic Mean?
How to calculate Root Mean Square?
How to calculate Correlation Co-efficient?
How to calculate Regression?
How to calculate Harmonic Mean?
What is Factorial?
What is Permutation and Combination?
What is Single Event Probability?
What is Multiple Event Probability?
Discrete vs Continuous Distribution?
How to calculate Normal Distribution?
How to calculate PDF Normal Distribution?
Z Table for Normal Distribution
How to calculate Binomial Distribution?
How to calculate Negative Binomial?
How to calculate Poisson Distribution? How to calculate Cumulative Poisson Distribution? How to calculate Hypergeometric Distribution? How to calculate Cumulative Hypergeometric Distribution?
Arithmetic MeanArithmetic Mean Definition: Arithmetic mean is commonly called as average.Mean orAverage is defined as the sum of all the given elements divided by the total number of elements.
Formula: Mean = sum of elements / number of elements = a1+a2+a3+.....+an/n
Example: To find the mean of 3,5,7. Step 1: Find the sum of the numbers. 3+5+7 = 15
Step 2: Calculate the total number. there are 3 numbers.
Step 3: Finding mean. 15/3 = 5
Arithmetic MedianArithmetic Median Definition: Median is the middle value of the given numbers or distributionin their ascending order.Median is the average value of the two middle elements when the size of the distribution is even.
Example 1: To find the median of 4,5,7,2,1 [ODD]. Step 1: Count the total numbers given. There are 5 elements or numbers in the distribution.
Step 2: Arrange the numbers in ascending order. 1,2,4,5,7
Step 3: The total elements in the distribution (5) is odd. The middle position can be calculated using the formula.(n+1)/2 So the middle position is (5+1)/2 = 6/2 = 3 The number at 3rd position is = Median = 4
Example 2: To find the median of 4,5,7,2,1,8 [Even] Step 1: Count the total numbers given. There are 6 elements or numbers in the distribution.
Step 2: Arrange the numbers in ascending order. 1,2,4,5,7,8
Step 3: The total elements in the distribution (6) is even. As the total is even, we have to take average of number atn/2 and (n/2)+1 So the position are n/2= 6/2 = 3 and 4 The number at 3rd and 4th position are 4,5
Step 4: Find the median. The average is (4+5)/2 = Median = 4.5
Arithmetic ModeMode Definition: Mode is the most frequently occurring value in a frequencydistribution.
Example: To find the mode of 11,3,5,11,7,3,11 Step 1:Arrange the numbers in ascending order. 3,3,5,7,11,11,11
Step 2: In the above distribution Number 11 occurs 3 times, Number 3 occurs 2 times, Number 5 occurs 1 times, Number 7 occurs 1 times. So the number with most occurrances is 11 and is the Modeof this distribution. Mode = 11
Range Definition: Range is the difference between the highest and the lowestvalues in a frequency distribution.
Example: To find the range in 3,5,7,3,11 Step 1: Arrange the numbers in ascending order. 3,3,5,7,11
Step 2: In the above distribution The largest number is 11 The smallest value is 3 Formula = largest number - smallest number
Range = 11-3 = 8
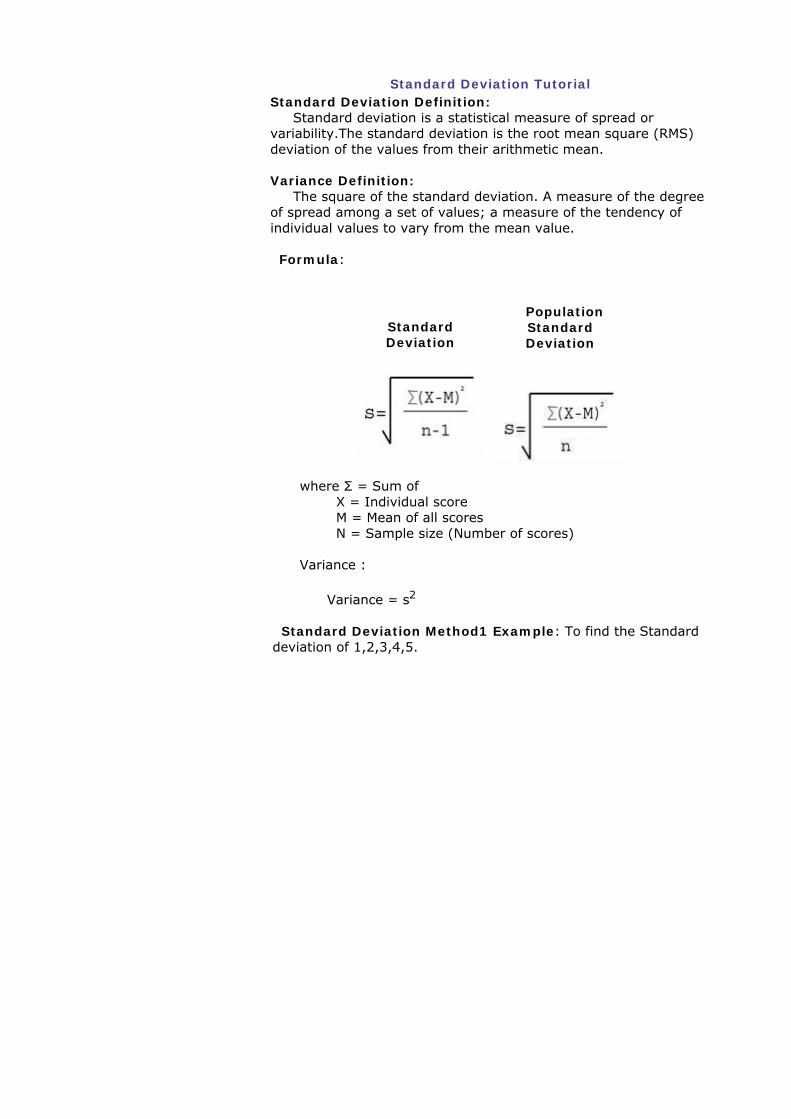
Standard Deviation TutorialStandard Deviation Definition: Standard deviation is a statistical measure of spread orvariability.The standard deviation is the root mean square (RMS) deviation of the values from their arithmetic mean.
Variance Definition: The square of the standard deviation. A measure of the degreeof spread among a set of values; a measure of the tendency of individual values to vary from the mean value.
Formula:
Standard Deviation
PopulationStandard Deviation
where Σ = Sum of X = Individual score M = Mean of all scores N = Sample size (Number of scores)
Variance :
Variance = s2
Standard Deviation Method1 Example: To find the Standard deviation of 1,2,3,4,5.
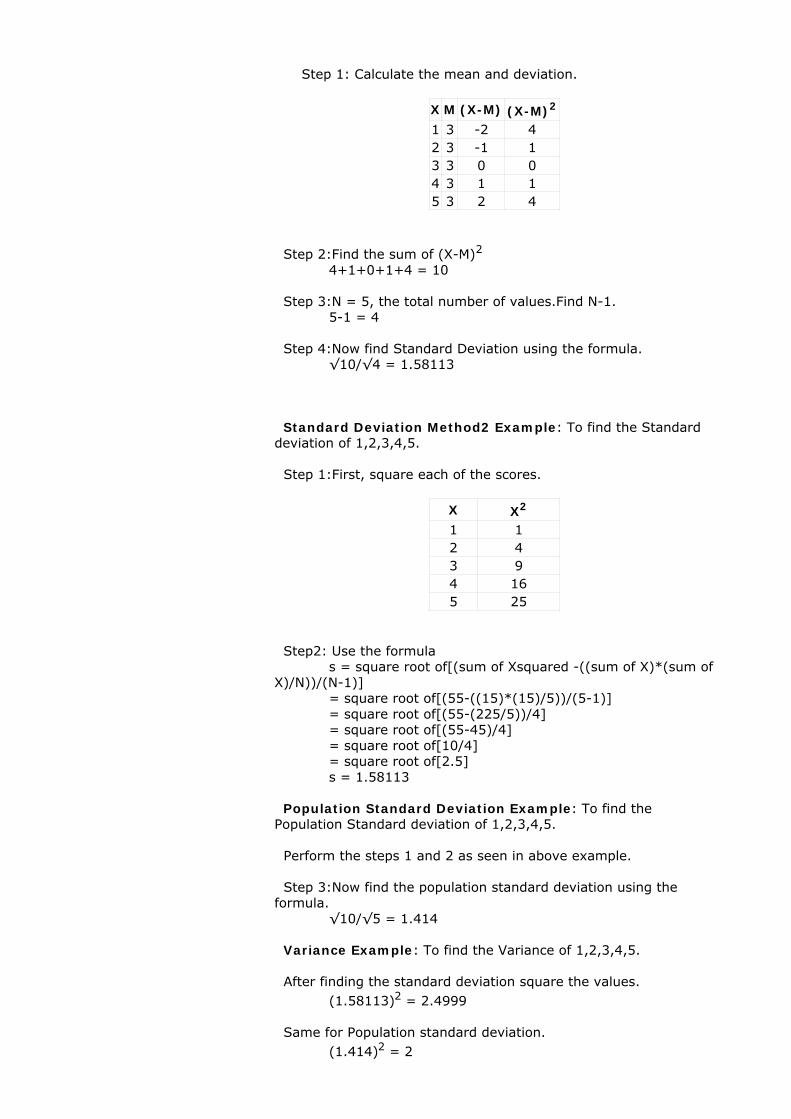
Step 1: Calculate the mean and deviation.
X M (X-M) (X-M)2
1 3 -2 42 3 -1 13 3 0 04 3 1 15 3 2 4
Step 2:Find the sum of (X-M)2
4+1+0+1+4 = 10
Step 3:N = 5, the total number of values.Find N-1. 5-1 = 4
Step 4:Now find Standard Deviation using the formula. √10/√4 = 1.58113
Standard Deviation Method2 Example: To find the Standard deviation of 1,2,3,4,5.
Step 1:First, square each of the scores.
X X2
1 12 43 94 165 25
Step2: Use the formula s = square root of[(sum of Xsquared -((sum of X)*(sum ofX)/N))/(N-1)] = square root of[(55-((15)*(15)/5))/(5-1)] = square root of[(55-(225/5))/4] = square root of[(55-45)/4] = square root of[10/4] = square root of[2.5] s = 1.58113
Population Standard Deviation Example: To find the Population Standard deviation of 1,2,3,4,5.
Perform the steps 1 and 2 as seen in above example.
Step 3:Now find the population standard deviation using theformula. √10/√5 = 1.414
Variance Example: To find the Variance of 1,2,3,4,5.
After finding the standard deviation square the values. (1.58113)2 = 2.4999
Same for Population standard deviation. (1.414)2 = 2
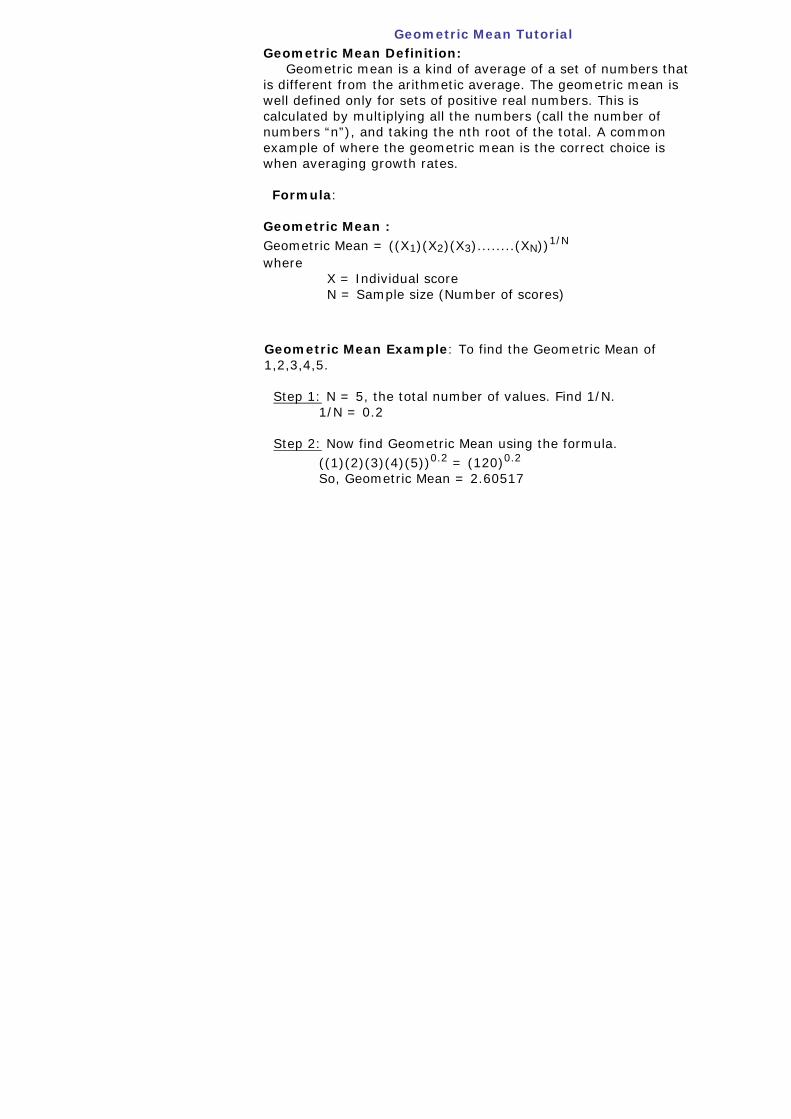
Geometric Mean TutorialGeometric Mean Definition: Geometric mean is a kind of average of a set of numbers thatis different from the arithmetic average. The geometric mean iswell defined only for sets of positive real numbers. This iscalculated by multiplying all the numbers (call the number ofnumbers “n”), and taking the nth root of the total. A commonexample of where the geometric mean is the correct choice iswhen averaging growth rates.
Formula:
Geometric Mean :Geometric Mean = ((X1)(X2)(X3)........(XN))1/N
where X = Individual score N = Sample size (Number of scores)
Geometric Mean Example: To find the Geometric Mean of 1,2,3,4,5.
Step 1: N = 5, the total number of values. Find 1/N. 1/N = 0.2
Step 2: Now find Geometric Mean using the formula. ((1)(2)(3)(4)(5))0.2 = (120)0.2 So, Geometric Mean = 2.60517
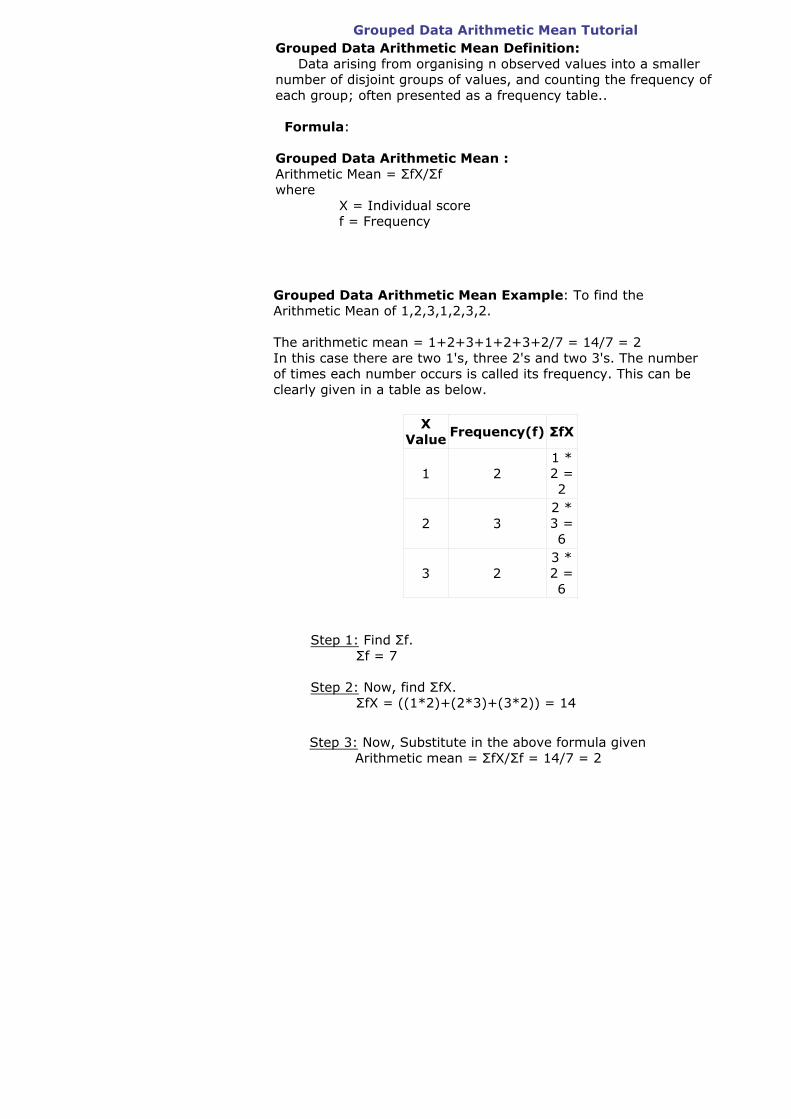
Grouped Data Arithmetic Mean TutorialGrouped Data Arithmetic Mean Definition: Data arising from organising n observed values into a smallernumber of disjoint groups of values, and counting the frequency of each group; often presented as a frequency table..
Formula:
Grouped Data Arithmetic Mean :Arithmetic Mean = ΣfX/Σfwhere X = Individual score f = Frequency
Grouped Data Arithmetic Mean Example: To find the Arithmetic Mean of 1,2,3,1,2,3,2.
The arithmetic mean = 1+2+3+1+2+3+2/7 = 14/7 = 2In this case there are two 1's, three 2's and two 3's. The numberof times each number occurs is called its frequency. This can beclearly given in a table as below.
X Value Frequency(f) ΣfX
1 21 * 2 = 2
2 32 * 3 = 6
3 23 * 2 = 6
Step 1: Find Σf. Σf = 7
Step 2: Now, find ΣfX. ΣfX = ((1*2)+(2*3)+(3*2)) = 14
Step 3: Now, Substitute in the above formula given Arithmetic mean = ΣfX/Σf = 14/7 = 2
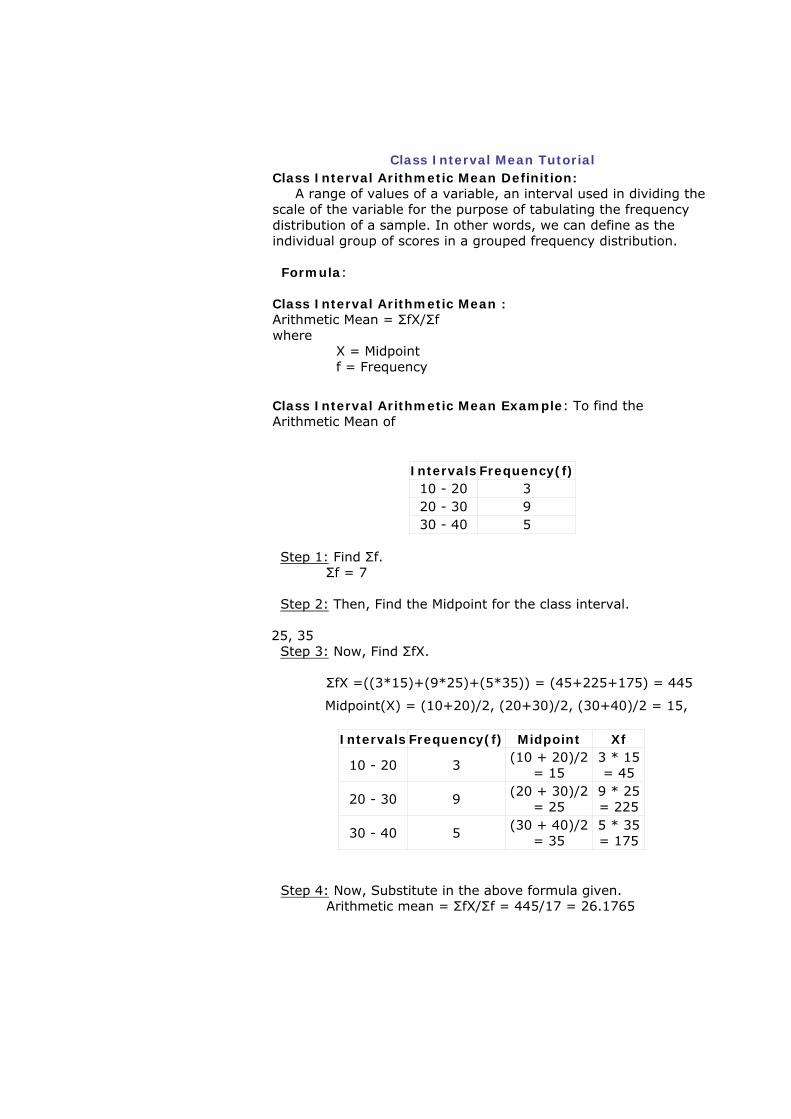
Class Interval Mean TutorialClass Interval Arithmetic Mean Definition: A range of values of a variable, an interval used in dividing thescale of the variable for the purpose of tabulating the frequency distribution of a sample. In other words, we can define as the individual group of scores in a grouped frequency distribution.
Formula:
Class Interval Arithmetic Mean :Arithmetic Mean = ΣfX/Σfwhere X = Midpoint f = Frequency
Class Interval Arithmetic Mean Example: To find the Arithmetic Mean of
Intervals Frequency(f)10 - 20 320 - 30 930 - 40 5
Step 1: Find Σf.
Σf = 7
Step 2: Then, Find the Midpoint for the class interval.
Midpoint(X) = (10+20)/2, (20+30)/2, (30+40)/2 = 15,
25, 35 Step 3: Now, Find ΣfX.
ΣfX =((3*15)+(9*25)+(5*35)) = (45+225+175) = 445
Intervals Frequency(f) Midpoint Xf
10 - 20 3(10 + 20)/2
= 153 * 15 = 45
20 - 30 9(20 + 30)/2
= 259 * 25 = 225
30 - 40 5(30 + 40)/2
= 355 * 35 = 175
Step 4: Now, Substitute in the above formula given. Arithmetic mean = ΣfX/Σf = 445/17 = 26.1765
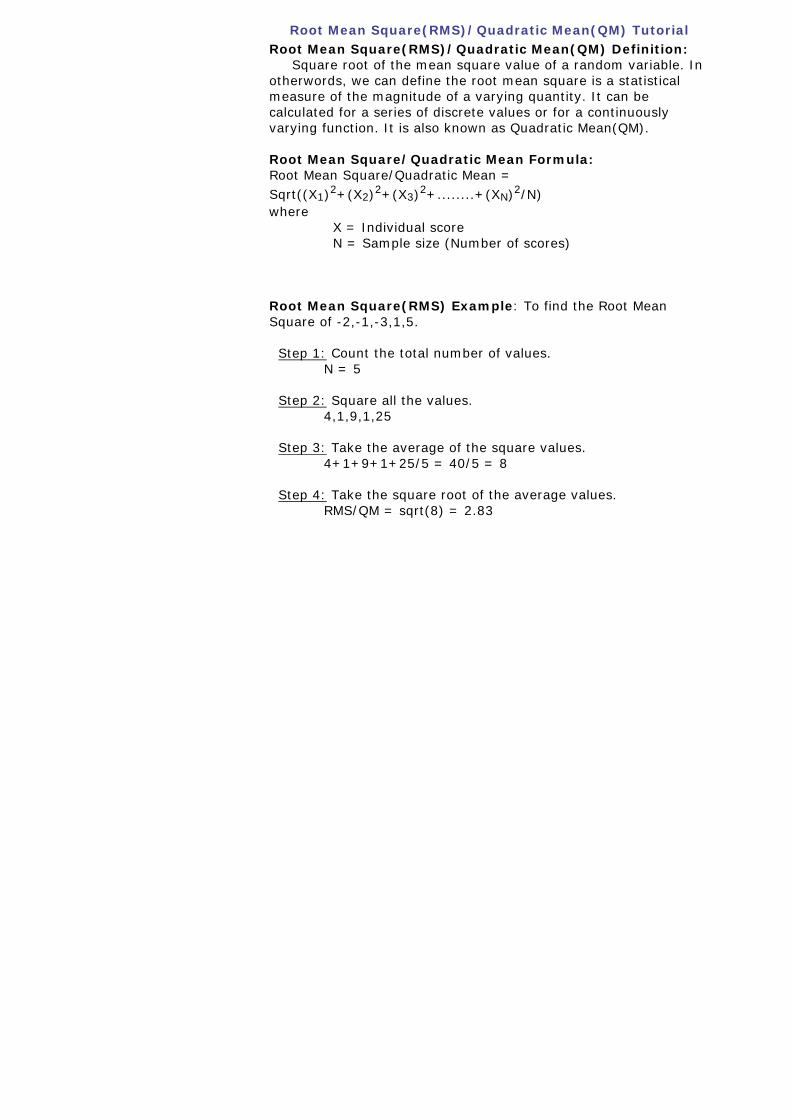
Root Mean Square(RMS)/Quadratic Mean(QM) TutorialRoot Mean Square(RMS)/Quadratic Mean(QM) Definition: Square root of the mean square value of a random variable. Inotherwords, we can define the root mean square is a statistical measure of the magnitude of a varying quantity. It can be calculated for a series of discrete values or for a continuously varying function. It is also known as Quadratic Mean(QM).
Root Mean Square/Quadratic Mean Formula:Root Mean Square/Quadratic Mean =Sqrt((X1)2+(X2)2+(X3)2+........+(XN)2/N)where X = Individual score N = Sample size (Number of scores)
Root Mean Square(RMS) Example: To find the Root Mean Square of -2,-1,-3,1,5.
Step 1: Count the total number of values. N = 5
Step 2: Square all the values. 4,1,9,1,25
Step 3: Take the average of the square values. 4+1+9+1+25/5 = 40/5 = 8
Step 4: Take the square root of the average values. RMS/QM = sqrt(8) = 2.83
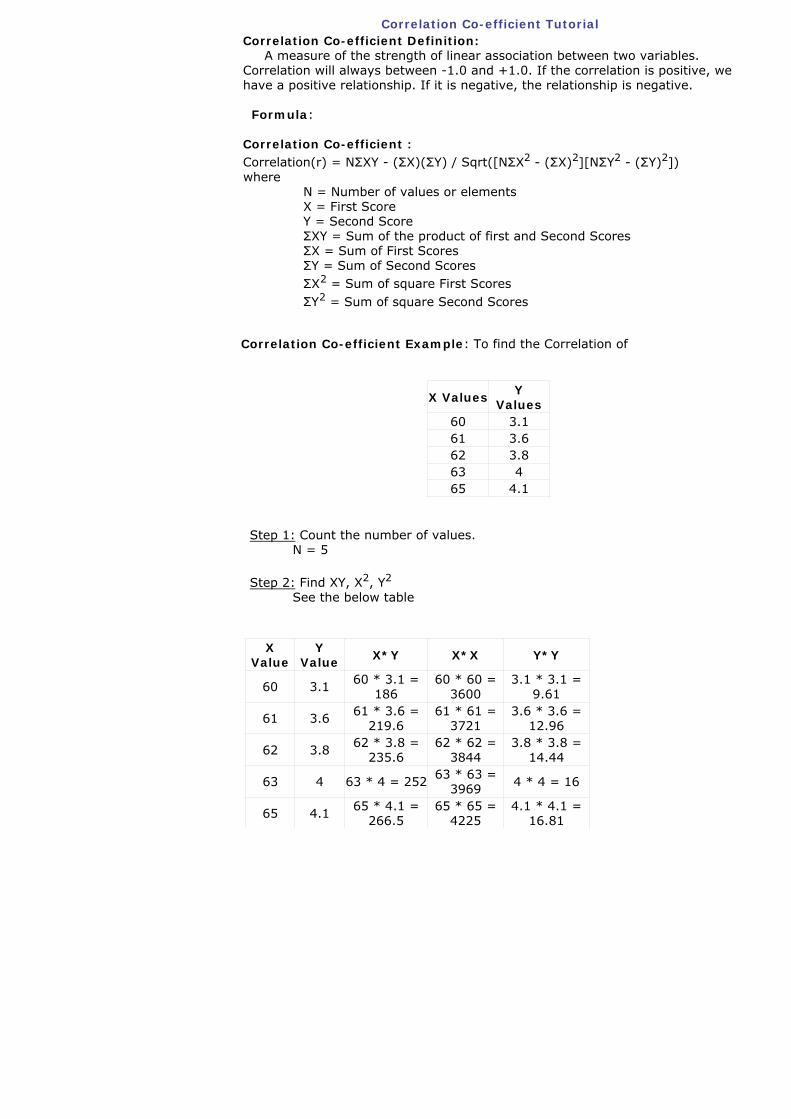
Correlation Co-efficient TutorialCorrelation Co-efficient Definition: A measure of the strength of linear association between two variables.Correlation will always between -1.0 and +1.0. If the correlation is positive, we have a positive relationship. If it is negative, the relationship is negative.
Formula:
Correlation Co-efficient :Correlation(r) = NΣXY - (ΣX)(ΣY) / Sqrt([NΣX2 - (ΣX)2][NΣY2 - (ΣY)2]) where N = Number of values or elements X = First Score Y = Second Score ΣXY = Sum of the product of first and Second Scores ΣX = Sum of First Scores ΣY = Sum of Second Scores ΣX2 = Sum of square First Scores ΣY2 = Sum of square Second Scores
Correlation Co-efficient Example: To find the Correlation of
X ValuesY
Values60 3.161 3.662 3.863 465 4.1
Step 1: Count the number of values. N = 5
Step 2: Find XY, X2, Y2
See the below table
X Value
Y Value X*Y X*X Y*Y
60 3.160 * 3.1 =
18660 * 60 =
36003.1 * 3.1 =
9.61
61 3.661 * 3.6 =
219.661 * 61 =
37213.6 * 3.6 =
12.96
62 3.862 * 3.8 =
235.662 * 62 =
38443.8 * 3.8 =
14.44
63 4 63 * 4 = 25263 * 63 =
3969 4 * 4 = 16
65 4.165 * 4.1 =
266.565 * 65 =
42254.1 * 4.1 =
16.81
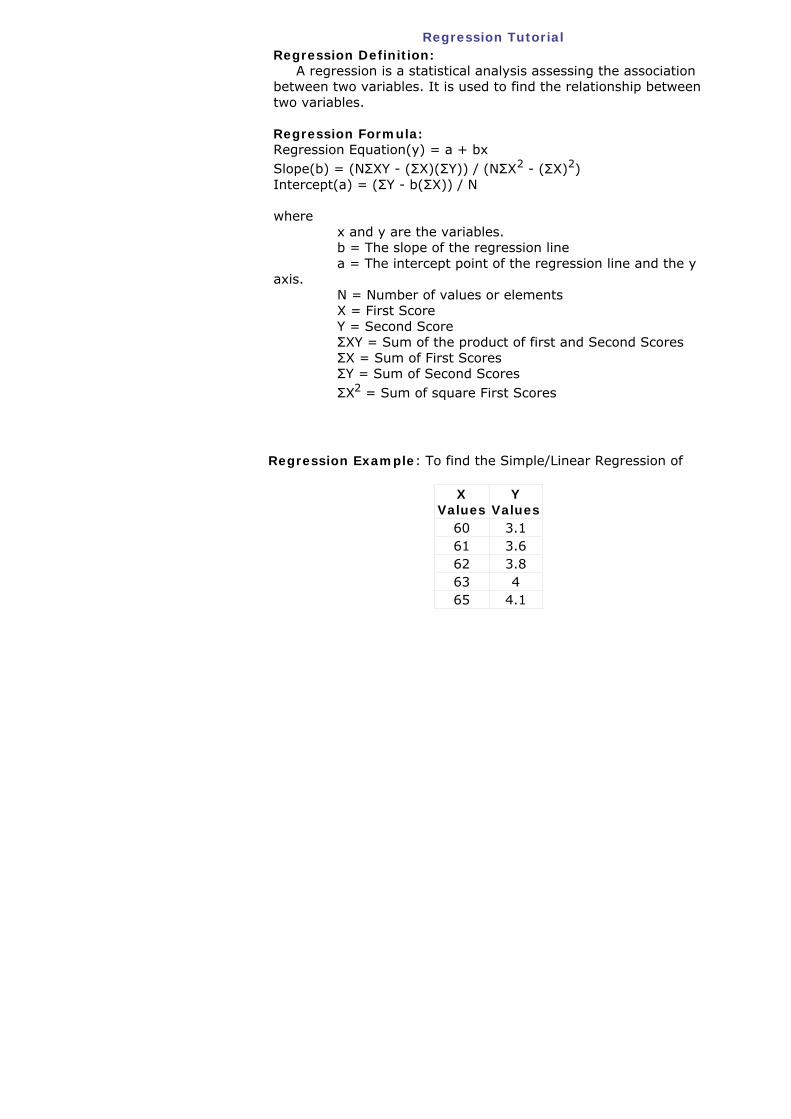
Regression TutorialRegression Definition: A regression is a statistical analysis assessing the associationbetween two variables. It is used to find the relationship between two variables.
Regression Formula:Regression Equation(y) = a + bx Slope(b) = (NΣXY - (ΣX)(ΣY)) / (NΣX2 - (ΣX)2)Intercept(a) = (ΣY - b(ΣX)) / N
where x and y are the variables. b = The slope of the regression line a = The intercept point of the regression line and the yaxis. N = Number of values or elements X = First Score Y = Second Score ΣXY = Sum of the product of first and Second Scores ΣX = Sum of First Scores ΣY = Sum of Second Scores ΣX2 = Sum of square First Scores
Regression Example: To find the Simple/Linear Regression of
X Values
Y Values
60 3.161 3.662 3.863 465 4.1
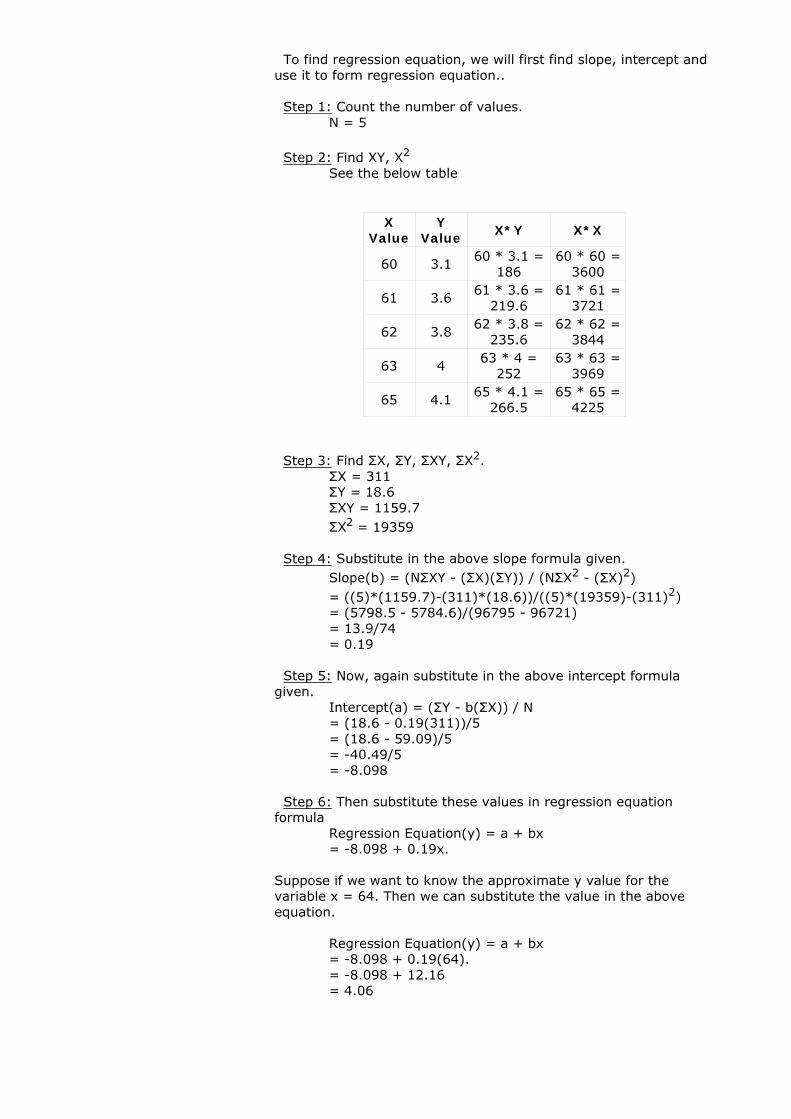
To find regression equation, we will first find slope, intercept anduse it to form regression equation..
Step 1: Count the number of values. N = 5
Step 2: Find XY, X2
See the below table
X Value
Y Value
X*Y X*X
60 3.160 * 3.1 =
18660 * 60 =
3600
61 3.661 * 3.6 =
219.661 * 61 =
3721
62 3.862 * 3.8 =
235.662 * 62 =
3844
63 463 * 4 =
25263 * 63 =
3969
65 4.165 * 4.1 =
266.565 * 65 =
4225
Step 3: Find ΣX, ΣY, ΣXY, ΣX2. ΣX = 311 ΣY = 18.6 ΣXY = 1159.7 ΣX2 = 19359
Step 4: Substitute in the above slope formula given. Slope(b) = (NΣXY - (ΣX)(ΣY)) / (NΣX2 - (ΣX)2) = ((5)*(1159.7)-(311)*(18.6))/((5)*(19359)-(311)2) = (5798.5 - 5784.6)/(96795 - 96721) = 13.9/74 = 0.19
Step 5: Now, again substitute in the above intercept formula given. Intercept(a) = (ΣY - b(ΣX)) / N = (18.6 - 0.19(311))/5 = (18.6 - 59.09)/5 = -40.49/5 = -8.098
Step 6: Then substitute these values in regression equation formula Regression Equation(y) = a + bx = -8.098 + 0.19x.
Suppose if we want to know the approximate y value for thevariable x = 64. Then we can substitute the value in the above equation.
Regression Equation(y) = a + bx = -8.098 + 0.19(64). = -8.098 + 12.16 = 4.06
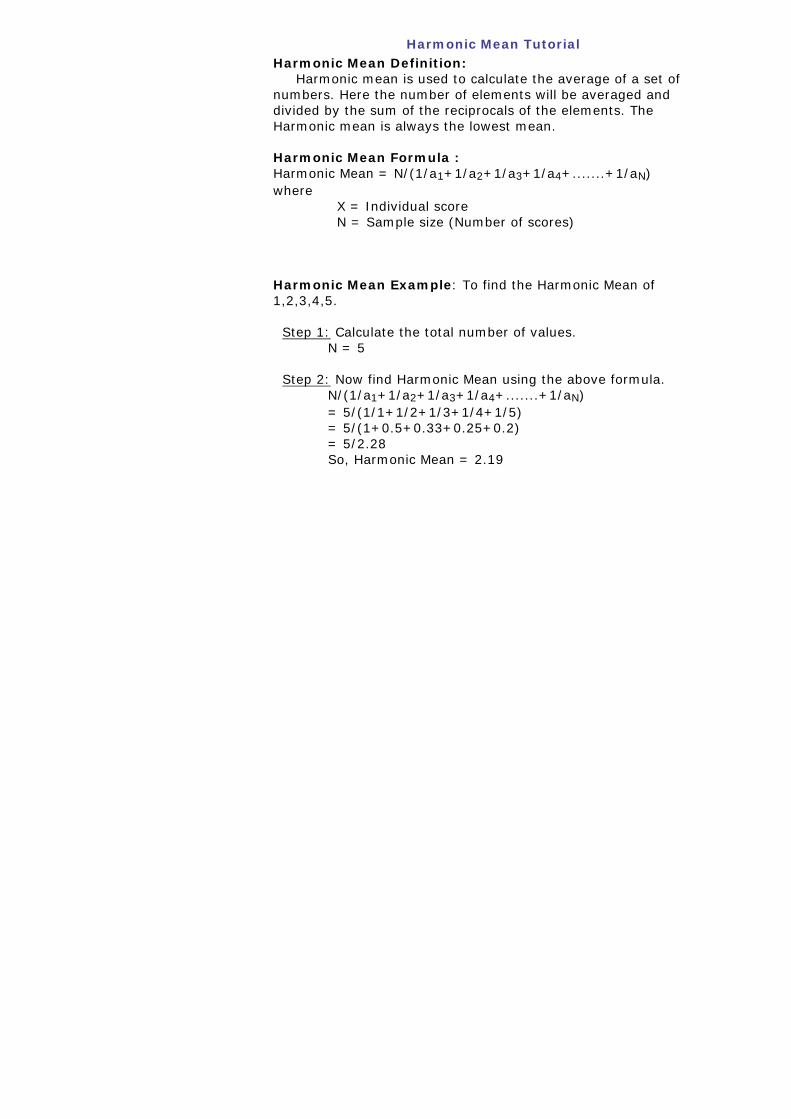
Harmonic Mean TutorialHarmonic Mean Definition: Harmonic mean is used to calculate the average of a set ofnumbers. Here the number of elements will be averaged and divided by the sum of the reciprocals of the elements. The Harmonic mean is always the lowest mean.
Harmonic Mean Formula :Harmonic Mean = N/(1/a1+1/a2+1/a3+1/a4+.......+1/aN)where X = Individual score N = Sample size (Number of scores)
Harmonic Mean Example: To find the Harmonic Mean of 1,2,3,4,5.
Step 1: Calculate the total number of values. N = 5
Step 2: Now find Harmonic Mean using the above formula. N/(1/a1+1/a2+1/a3+1/a4+.......+1/aN) = 5/(1/1+1/2+1/3+1/4+1/5) = 5/(1+0.5+0.33+0.25+0.2) = 5/2.28 So, Harmonic Mean = 2.19
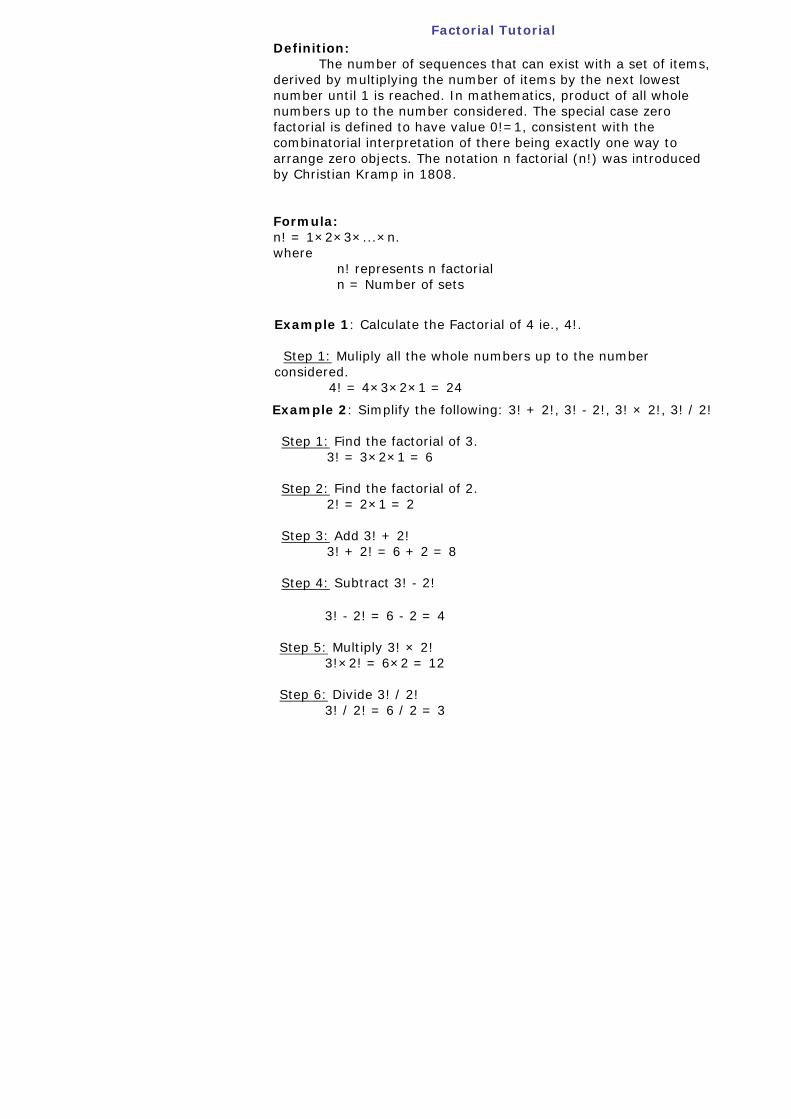
Factorial TutorialDefinition: The number of sequences that can exist with a set of items,derived by multiplying the number of items by the next lowest number until 1 is reached. In mathematics, product of all wholenumbers up to the number considered. The special case zero factorial is defined to have value 0!=1, consistent with thecombinatorial interpretation of there being exactly one way to arrange zero objects. The notation n factorial (n!) was introducedby Christian Kramp in 1808.
Formula:n! = 1×2×3×...×n.where n! represents n factorial n = Number of sets
Example 1: Calculate the Factorial of 4 ie., 4!.
Step 1: Muliply all the whole numbers up to the number considered. 4! = 4×3×2×1 = 24
Example 2: Simplify the following: 3! + 2!, 3! - 2!, 3! × 2!, 3! / 2!
Step 1: Find the factorial of 3. 3! = 3×2×1 = 6
Step 2: Find the factorial of 2. 2! = 2×1 = 2
Step 3: Add 3! + 2! 3! + 2! = 6 + 2 = 8
Step 4: Subtract 3! - 2!
3! - 2! = 6 - 2 = 4
Step 5: Multiply 3! × 2! 3!×2! = 6×2 = 12
Step 6: Divide 3! / 2! 3! / 2! = 6 / 2 = 3
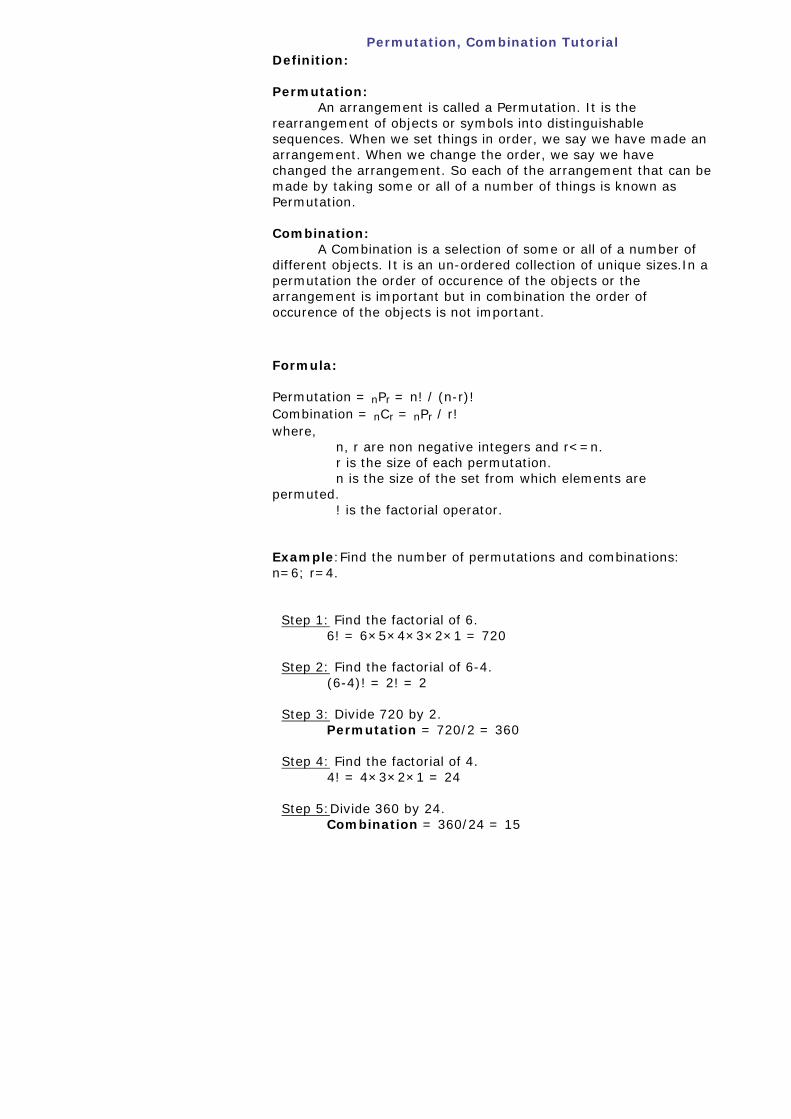
Permutation, Combination TutorialDefinition:
Permutation: An arrangement is called a Permutation. It is therearrangement of objects or symbols into distinguishable sequences. When we set things in order, we say we have made anarrangement. When we change the order, we say we have changed the arrangement. So each of the arrangement that can bemade by taking some or all of a number of things is known as Permutation.
Combination: A Combination is a selection of some or all of a number ofdifferent objects. It is an un-ordered collection of unique sizes.In apermutation the order of occurence of the objects or the arrangement is important but in combination the order ofoccurence of the objects is not important.
Formula:
Permutation = nPr = n! / (n-r)! Combination = nCr = nPr / r! where, n, r are non negative integers and r<=n. r is the size of each permutation. n is the size of the set from which elements arepermuted. ! is the factorial operator.
Example:Find the number of permutations and combinations: n=6; r=4.
Step 1: Find the factorial of 6. 6! = 6×5×4×3×2×1 = 720
Step 2: Find the factorial of 6-4. (6-4)! = 2! = 2
Step 3: Divide 720 by 2. Permutation = 720/2 = 360
Step 4: Find the factorial of 4. 4! = 4×3×2×1 = 24
Step 5:Divide 360 by 24. Combination = 360/24 = 15
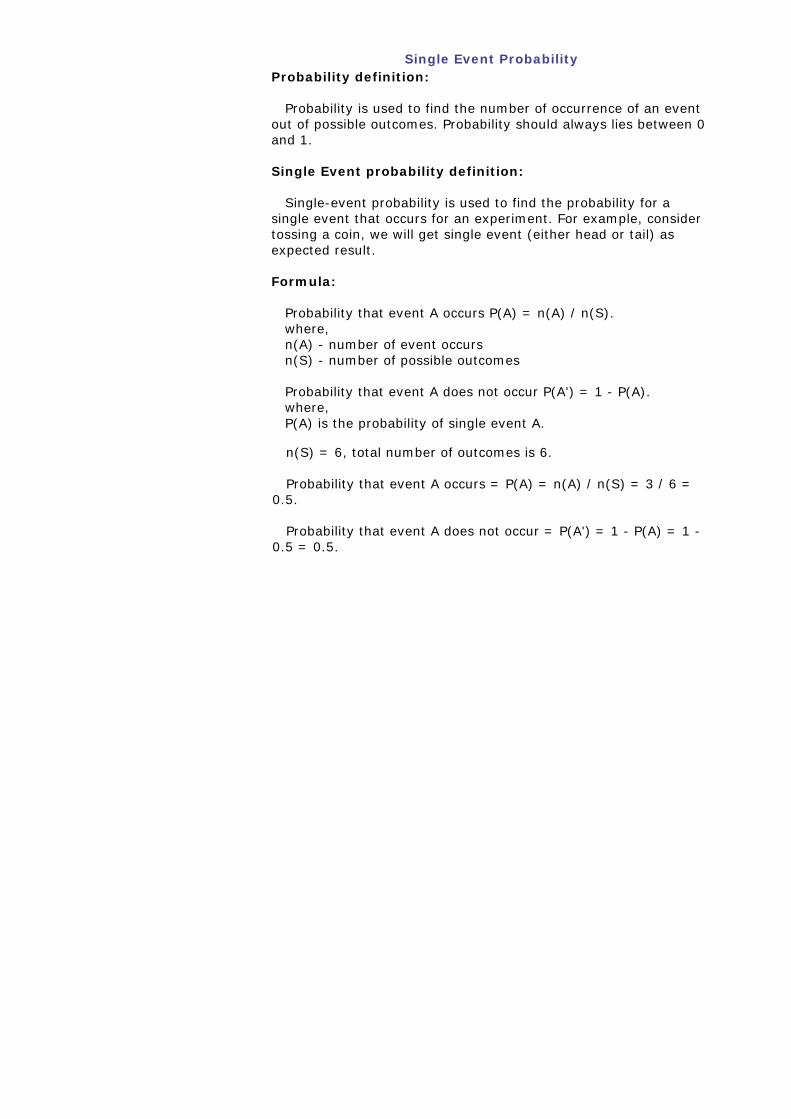
Single Event ProbabilityProbability definition:
Probability is used to find the number of occurrence of an eventout of possible outcomes. Probability should always lies between 0 and 1.
Single Event probability definition:
Single-event probability is used to find the probability for asingle event that occurs for an experiment. For example, consider tossing a coin, we will get single event (either head or tail) as expected result.
Formula:
Probability that event A occurs P(A) = n(A) / n(S). where, n(A) - number of event occurs n(S) - number of possible outcomes
Probability that event A does not occur P(A') = 1 - P(A). where, P(A) is the probability of single event A.
n(S) = 6, total number of outcomes is 6.
Probability that event A occurs = P(A) = n(A) / n(S) = 3 / 6 =0.5.
Probability that event A does not occur = P(A') = 1 - P(A) = 1 -0.5 = 0.5.
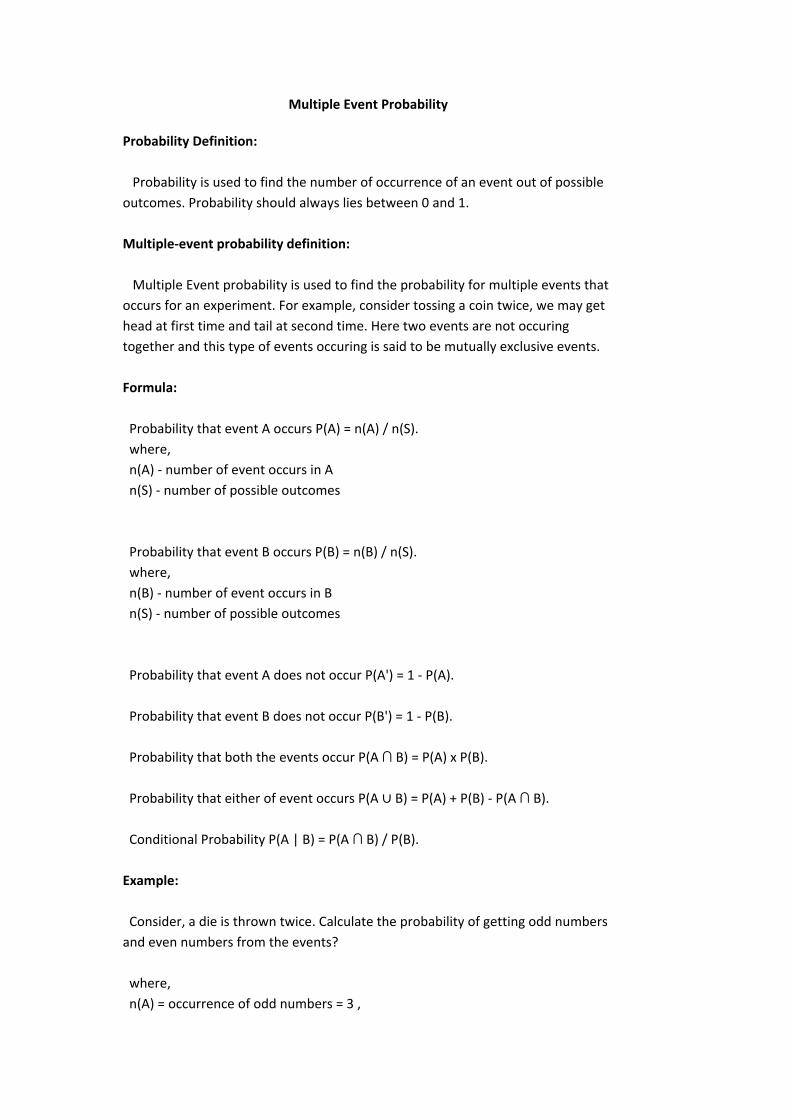
Multiple Event Probability
Probability Definition: Probability is used to find the number of occurrence of an event out of possible outcomes. Probability should always lies between 0 and 1. Multiple‐event probability definition: Multiple Event probability is used to find the probability for multiple events that occurs for an experiment. For example, consider tossing a coin twice, we may get head at first time and tail at second time. Here two events are not occuring together and this type of events occuring is said to be mutually exclusive events. Formula: Probability that event A occurs P(A) = n(A) / n(S). where, n(A) ‐ number of event occurs in A n(S) ‐ number of possible outcomes Probability that event B occurs P(B) = n(B) / n(S). where, n(B) ‐ number of event occurs in B n(S) ‐ number of possible outcomes Probability that event A does not occur P(A') = 1 ‐ P(A). Probability that event B does not occur P(B') = 1 ‐ P(B). Probability that both the events occur P(A ∩ B) = P(A) x P(B). Probability that either of event occurs P(A B) = P(A) + P(B) ‐ P(A ∩ B). Conditional Probability P(A | B) = P(A ∩ B) / P(B). Example: Consider, a die is thrown twice. Calculate the probability of getting odd numbers and even numbers from the events? where, n(A) = occurrence of odd numbers = 3 ,
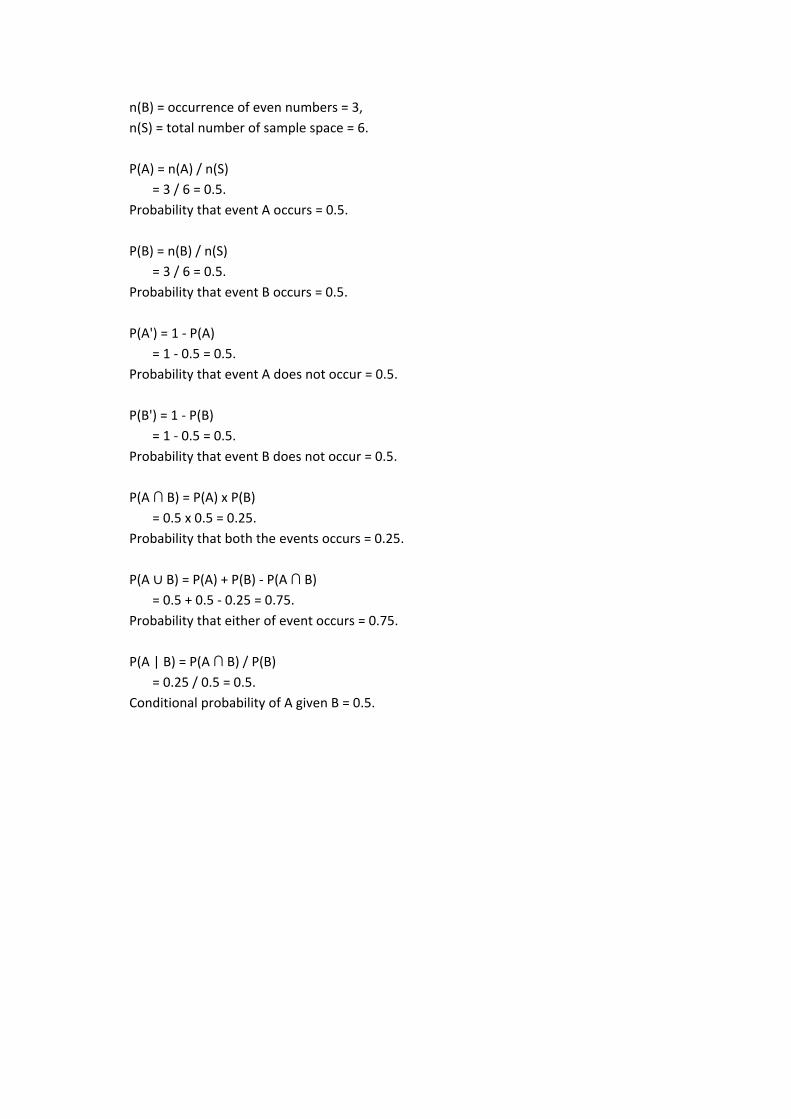
n(B) = occurrence of even numbers = 3, n(S) = total number of sample space = 6. P(A) = n(A) / n(S) = 3 / 6 = 0.5. Probability that event A occurs = 0.5. P(B) = n(B) / n(S) = 3 / 6 = 0.5. Probability that event B occurs = 0.5. P(A') = 1 ‐ P(A) = 1 ‐ 0.5 = 0.5. Probability that event A does not occur = 0.5. P(B') = 1 ‐ P(B) = 1 ‐ 0.5 = 0.5. Probability that event B does not occur = 0.5. P(A ∩ B) = P(A) x P(B) = 0.5 x 0.5 = 0.25. Probability that both the events occurs = 0.25. P(A B) = P(A) + P(B) ‐ P(A ∩ B) = 0.5 + 0.5 ‐ 0.25 = 0.75. Probability that either of event occurs = 0.75. P(A | B) = P(A ∩ B) / P(B) = 0.25 / 0.5 = 0.5. Conditional probability of A given B = 0.5.
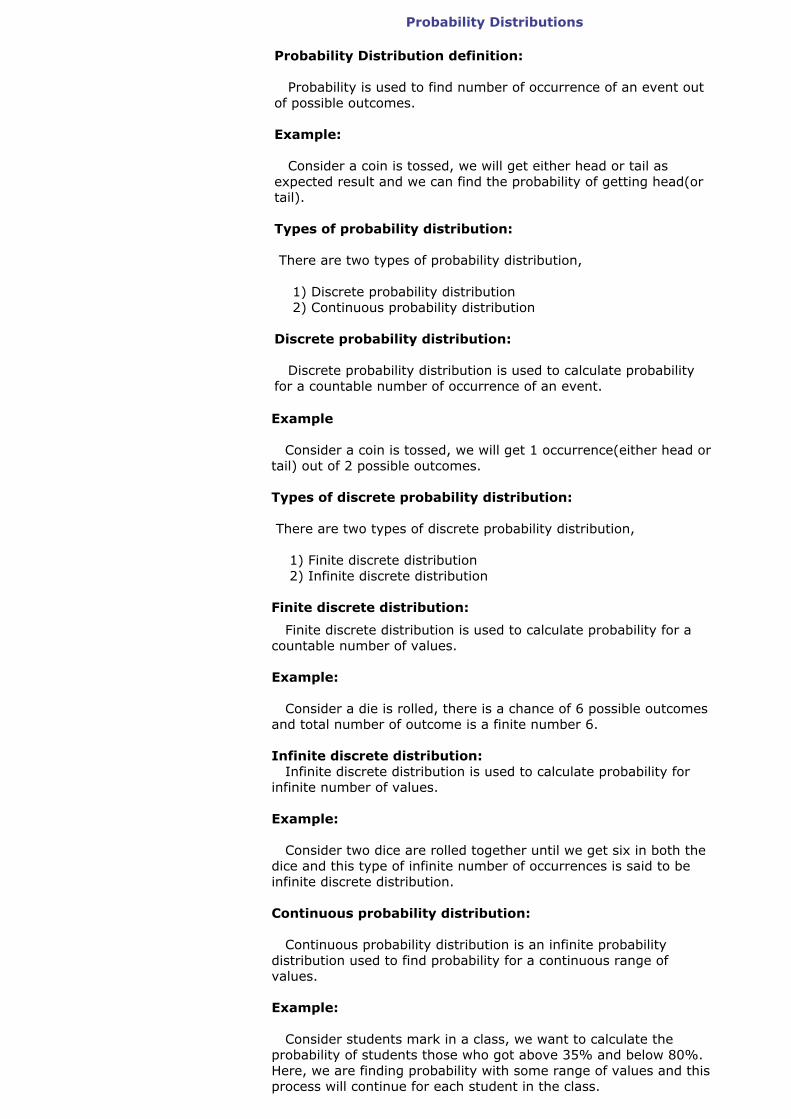
Probability Distributions
Probability Distribution definition:
Probability is used to find number of occurrence of an event outof possible outcomes.
Example:
Consider a coin is tossed, we will get either head or tail asexpected result and we can find the probability of getting head(or tail).
Types of probability distribution:
There are two types of probability distribution,
1) Discrete probability distribution 2) Continuous probability distribution
Discrete probability distribution:
Discrete probability distribution is used to calculate probabilityfor a countable number of occurrence of an event.
Example
Consider a coin is tossed, we will get 1 occurrence(either head ortail) out of 2 possible outcomes.
Types of discrete probability distribution:
There are two types of discrete probability distribution,
1) Finite discrete distribution 2) Infinite discrete distribution
Finite discrete distribution:
Finite discrete distribution is used to calculate probability for acountable number of values.
Example:
Consider a die is rolled, there is a chance of 6 possible outcomesand total number of outcome is a finite number 6.
Infinite discrete distribution: Infinite discrete distribution is used to calculate probability forinfinite number of values.
Example:
Consider two dice are rolled together until we get six in both thedice and this type of infinite number of occurrences is said to beinfinite discrete distribution.
Continuous probability distribution:
Continuous probability distribution is an infinite probabilitydistribution used to find probability for a continuous range of values.
Example:
Consider students mark in a class, we want to calculate theprobability of students those who got above 35% and below 80%. Here, we are finding probability with some range of values and this process will continue for each student in the class.
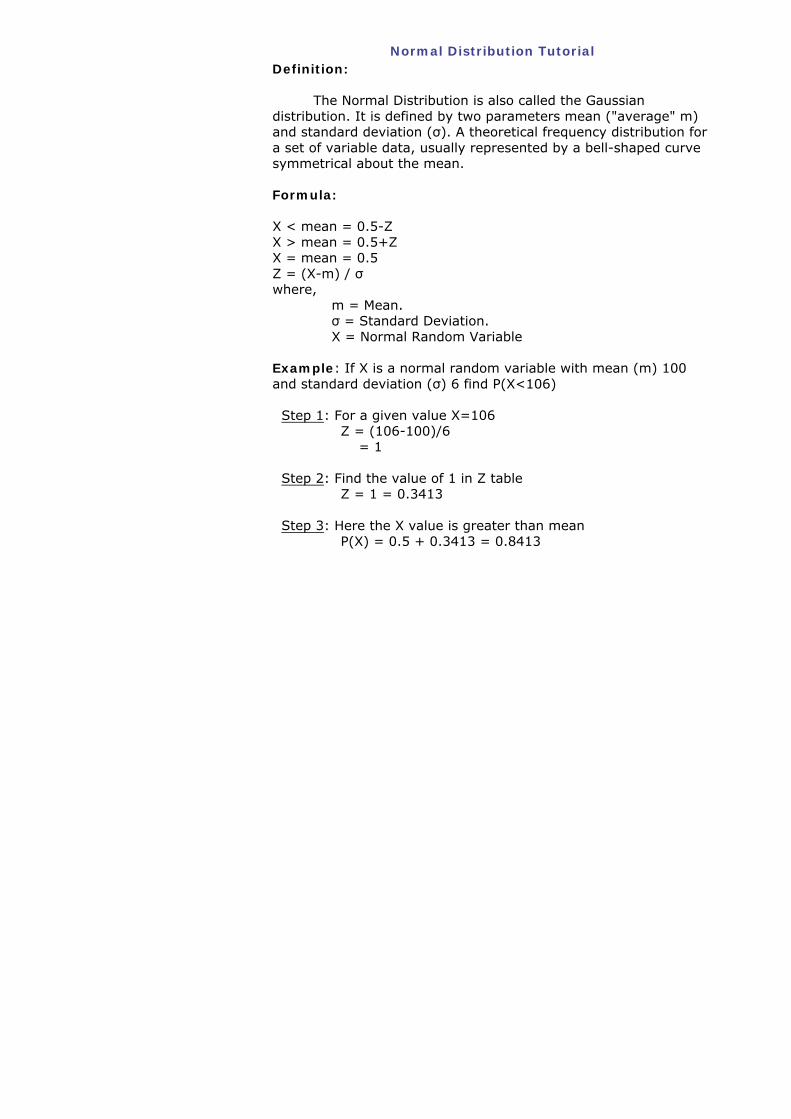
Normal Distribution TutorialDefinition:
The Normal Distribution is also called the Gaussiandistribution. It is defined by two parameters mean ("average" m)and standard deviation (σ). A theoretical frequency distribution fora set of variable data, usually represented by a bell-shaped curvesymmetrical about the mean.
Formula:
X < mean = 0.5-ZX > mean = 0.5+ZX = mean = 0.5Z = (X-m) / σwhere, m = Mean. σ = Standard Deviation. X = Normal Random Variable
Example: If X is a normal random variable with mean (m) 100and standard deviation (σ) 6 find P(X<106)
Step 1: For a given value X=106 Z = (106-100)/6 = 1
Step 2: Find the value of 1 in Z table Z = 1 = 0.3413
Step 3: Here the X value is greater than mean P(X) = 0.5 + 0.3413 = 0.8413
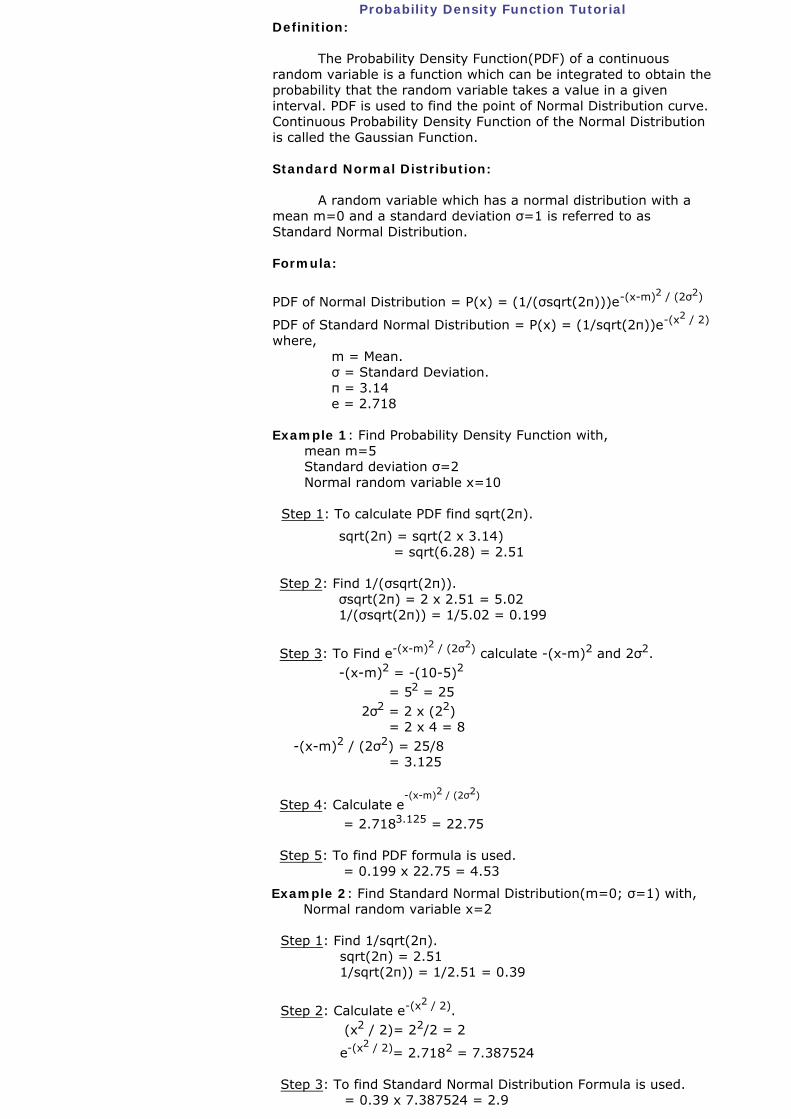
Probability Density Function TutorialDefinition:
The Probability Density Function(PDF) of a continuousrandom variable is a function which can be integrated to obtain theprobability that the random variable takes a value in a given interval. PDF is used to find the point of Normal Distribution curve.Continuous Probability Density Function of the Normal Distribution is called the Gaussian Function.
Standard Normal Distribution:
A random variable which has a normal distribution with amean m=0 and a standard deviation σ=1 is referred to asStandard Normal Distribution.
Formula:
PDF of Normal Distribution = P(x) = (1/(σsqrt(2π)))e-(x-m)2 / (2σ2)
PDF of Standard Normal Distribution = P(x) = (1/sqrt(2π))e-(x2 / 2)
where, m = Mean. σ = Standard Deviation. π = 3.14 e = 2.718
Example 1: Find Probability Density Function with, mean m=5 Standard deviation σ=2 Normal random variable x=10
Step 1: To calculate PDF find sqrt(2π).
sqrt(2π) = sqrt(2 x 3.14) = sqrt(6.28) = 2.51
Step 2: Find 1/(σsqrt(2π)). σsqrt(2π) = 2 x 2.51 = 5.02 1/(σsqrt(2π)) = 1/5.02 = 0.199
Step 3: To Find e-(x-m)2 / (2σ2) calculate -(x-m)2 and 2σ2. -(x-m)2 = -(10-5)2
= 52 = 25 2σ2 = 2 x (22) = 2 x 4 = 8 -(x-m)2 / (2σ2) = 25/8 = 3.125
Step 4: Calculate e-(x-m)2 / (2σ2)
= 2.7183.125 = 22.75
Step 5: To find PDF formula is used. = 0.199 x 22.75 = 4.53
Example 2: Find Standard Normal Distribution(m=0; σ=1) with, Normal random variable x=2
Step 1: Find 1/sqrt(2π). sqrt(2π) = 2.51 1/sqrt(2π)) = 1/2.51 = 0.39
Step 2: Calculate e-(x2 / 2). (x2 / 2)= 22/2 = 2
e-(x2 / 2)= 2.7182 = 7.387524
Step 3: To find Standard Normal Distribution Formula is used. = 0.39 x 7.387524 = 2.9
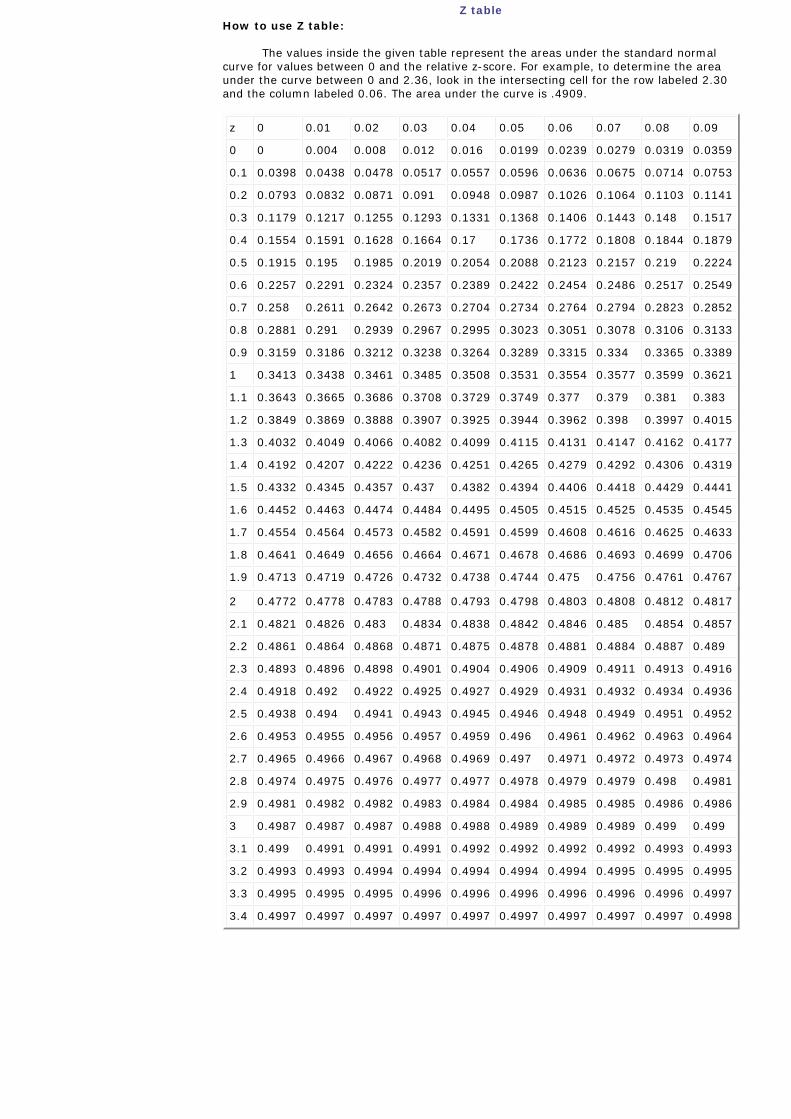
Z tableHow to use Z table:
The values inside the given table represent the areas under the standard normalcurve for values between 0 and the relative z-score. For example, to determine the areaunder the curve between 0 and 2.36, look in the intersecting cell for the row labeled 2.30 and the column labeled 0.06. The area under the curve is .4909.
z 0 0.01 0.02 0.03 0.04 0.05 0.06 0.07 0.08 0.09
0 0 0.004 0.008 0.012 0.016 0.0199 0.0239 0.0279 0.0319 0.0359
0.1 0.0398 0.0438 0.0478 0.0517 0.0557 0.0596 0.0636 0.0675 0.0714 0.0753
0.2 0.0793 0.0832 0.0871 0.091 0.0948 0.0987 0.1026 0.1064 0.1103 0.1141
0.3 0.1179 0.1217 0.1255 0.1293 0.1331 0.1368 0.1406 0.1443 0.148 0.1517
0.4 0.1554 0.1591 0.1628 0.1664 0.17 0.1736 0.1772 0.1808 0.1844 0.1879
0.5 0.1915 0.195 0.1985 0.2019 0.2054 0.2088 0.2123 0.2157 0.219 0.2224
0.6 0.2257 0.2291 0.2324 0.2357 0.2389 0.2422 0.2454 0.2486 0.2517 0.2549
0.7 0.258 0.2611 0.2642 0.2673 0.2704 0.2734 0.2764 0.2794 0.2823 0.2852
0.8 0.2881 0.291 0.2939 0.2967 0.2995 0.3023 0.3051 0.3078 0.3106 0.3133
0.9 0.3159 0.3186 0.3212 0.3238 0.3264 0.3289 0.3315 0.334 0.3365 0.3389
1 0.3413 0.3438 0.3461 0.3485 0.3508 0.3531 0.3554 0.3577 0.3599 0.3621
1.1 0.3643 0.3665 0.3686 0.3708 0.3729 0.3749 0.377 0.379 0.381 0.383
1.2 0.3849 0.3869 0.3888 0.3907 0.3925 0.3944 0.3962 0.398 0.3997 0.4015
1.3 0.4032 0.4049 0.4066 0.4082 0.4099 0.4115 0.4131 0.4147 0.4162 0.4177
1.4 0.4192 0.4207 0.4222 0.4236 0.4251 0.4265 0.4279 0.4292 0.4306 0.4319
1.5 0.4332 0.4345 0.4357 0.437 0.4382 0.4394 0.4406 0.4418 0.4429 0.4441
1.6 0.4452 0.4463 0.4474 0.4484 0.4495 0.4505 0.4515 0.4525 0.4535 0.4545
1.7 0.4554 0.4564 0.4573 0.4582 0.4591 0.4599 0.4608 0.4616 0.4625 0.4633
1.8 0.4641 0.4649 0.4656 0.4664 0.4671 0.4678 0.4686 0.4693 0.4699 0.4706
1.9 0.4713 0.4719 0.4726 0.4732 0.4738 0.4744 0.475 0.4756 0.4761 0.4767
2 0.4772 0.4778 0.4783 0.4788 0.4793 0.4798 0.4803 0.4808 0.4812 0.4817
2.1 0.4821 0.4826 0.483 0.4834 0.4838 0.4842 0.4846 0.485 0.4854 0.4857
2.2 0.4861 0.4864 0.4868 0.4871 0.4875 0.4878 0.4881 0.4884 0.4887 0.489
2.3 0.4893 0.4896 0.4898 0.4901 0.4904 0.4906 0.4909 0.4911 0.4913 0.4916
2.4 0.4918 0.492 0.4922 0.4925 0.4927 0.4929 0.4931 0.4932 0.4934 0.4936
2.5 0.4938 0.494 0.4941 0.4943 0.4945 0.4946 0.4948 0.4949 0.4951 0.4952
2.6 0.4953 0.4955 0.4956 0.4957 0.4959 0.496 0.4961 0.4962 0.4963 0.4964
2.7 0.4965 0.4966 0.4967 0.4968 0.4969 0.497 0.4971 0.4972 0.4973 0.4974
2.8 0.4974 0.4975 0.4976 0.4977 0.4977 0.4978 0.4979 0.4979 0.498 0.4981
2.9 0.4981 0.4982 0.4982 0.4983 0.4984 0.4984 0.4985 0.4985 0.4986 0.4986
3 0.4987 0.4987 0.4987 0.4988 0.4988 0.4989 0.4989 0.4989 0.499 0.499
3.1 0.499 0.4991 0.4991 0.4991 0.4992 0.4992 0.4992 0.4992 0.4993 0.4993
3.2 0.4993 0.4993 0.4994 0.4994 0.4994 0.4994 0.4994 0.4995 0.4995 0.4995
3.3 0.4995 0.4995 0.4995 0.4996 0.4996 0.4996 0.4996 0.4996 0.4996 0.4997
3.4 0.4997 0.4997 0.4997 0.4997 0.4997 0.4997 0.4997 0.4997 0.4997 0.4998
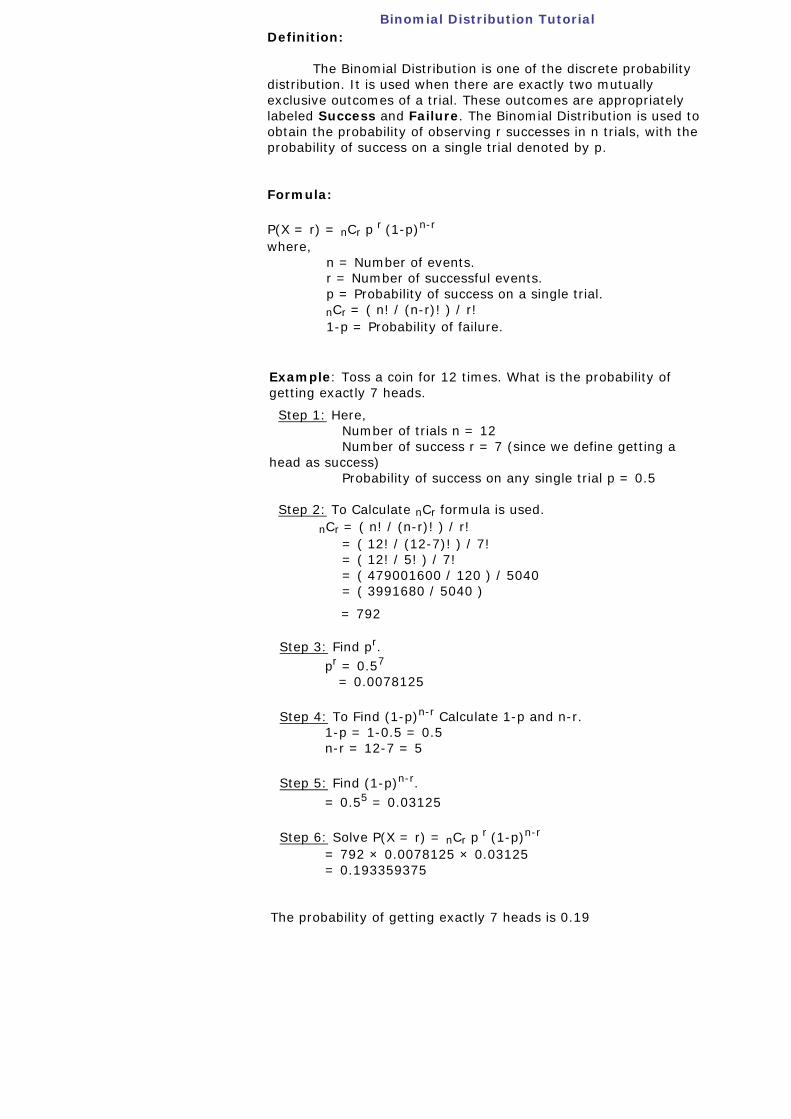
Binomial Distribution TutorialDefinition:
The Binomial Distribution is one of the discrete probabilitydistribution. It is used when there are exactly two mutuallyexclusive outcomes of a trial. These outcomes are appropriatelylabeled Success and Failure. The Binomial Distribution is used to obtain the probability of observing r successes in n trials, with theprobability of success on a single trial denoted by p.
Formula:
P(X = r) = nCr p r (1-p)n-r
where, n = Number of events. r = Number of successful events. p = Probability of success on a single trial. nCr = ( n! / (n-r)! ) / r! 1-p = Probability of failure.
Example: Toss a coin for 12 times. What is the probability of getting exactly 7 heads.
Step 1: Here, Number of trials n = 12 Number of success r = 7 (since we define getting ahead as success) Probability of success on any single trial p = 0.5
Step 2: To Calculate nCr formula is used. nCr = ( n! / (n-r)! ) / r! = ( 12! / (12-7)! ) / 7! = ( 12! / 5! ) / 7! = ( 479001600 / 120 ) / 5040 = ( 3991680 / 5040 )
= 792
Step 3: Find pr. pr = 0.57
= 0.0078125
Step 4: To Find (1-p)n-r Calculate 1-p and n-r. 1-p = 1-0.5 = 0.5 n-r = 12-7 = 5
Step 5: Find (1-p)n-r. = 0.55 = 0.03125
Step 6: Solve P(X = r) = nCr p r (1-p)n-r
= 792 × 0.0078125 × 0.03125 = 0.193359375
The probability of getting exactly 7 heads is 0.19
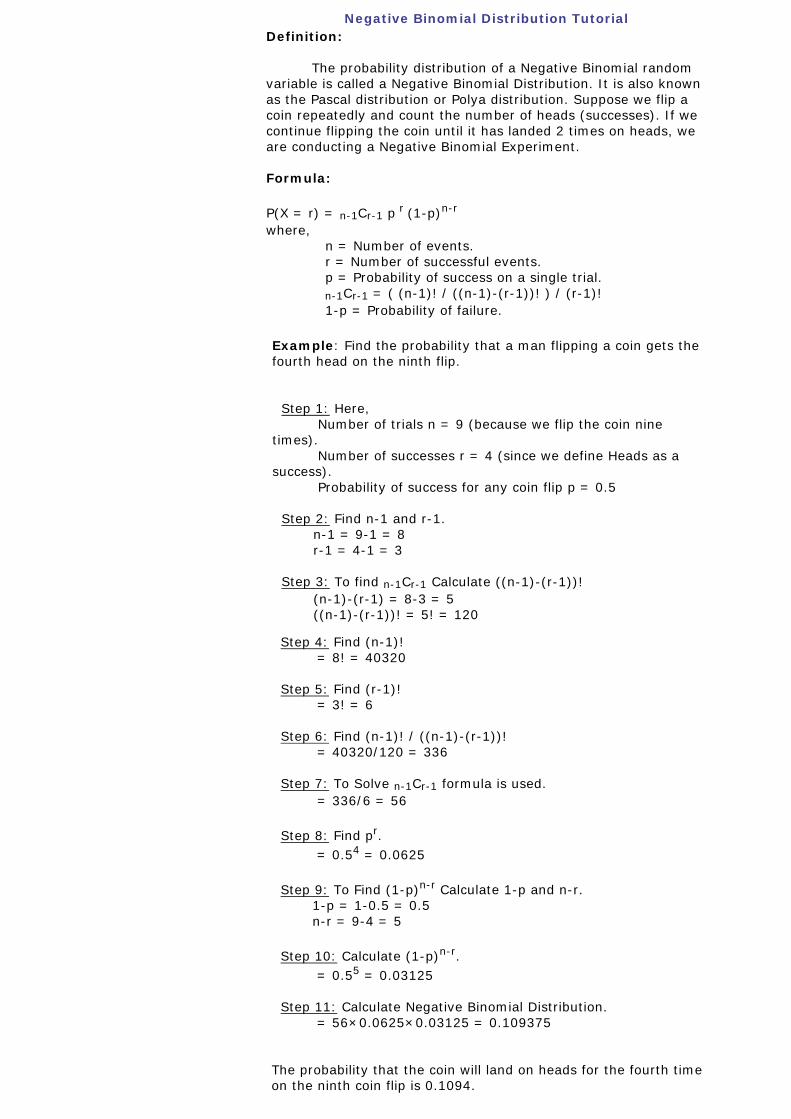
Negative Binomial Distribution TutorialDefinition:
The probability distribution of a Negative Binomial randomvariable is called a Negative Binomial Distribution. It is also known as the Pascal distribution or Polya distribution. Suppose we flip acoin repeatedly and count the number of heads (successes). If we continue flipping the coin until it has landed 2 times on heads, we are conducting a Negative Binomial Experiment.
Formula:
P(X = r) = n-1Cr-1 p r (1-p)n-r
where, n = Number of events. r = Number of successful events. p = Probability of success on a single trial. n-1Cr-1 = ( (n-1)! / ((n-1)-(r-1))! ) / (r-1)! 1-p = Probability of failure.
Example: Find the probability that a man flipping a coin gets the fourth head on the ninth flip.
Step 1: Here, Number of trials n = 9 (because we flip the coin ninetimes). Number of successes r = 4 (since we define Heads as asuccess). Probability of success for any coin flip p = 0.5
Step 2: Find n-1 and r-1. n-1 = 9-1 = 8 r-1 = 4-1 = 3
Step 3: To find n-1Cr-1 Calculate ((n-1)-(r-1))! (n-1)-(r-1) = 8-3 = 5 ((n-1)-(r-1))! = 5! = 120
Step 4: Find (n-1)! = 8! = 40320
Step 5: Find (r-1)! = 3! = 6
Step 6: Find (n-1)! / ((n-1)-(r-1))! = 40320/120 = 336
Step 7: To Solve n-1Cr-1 formula is used. = 336/6 = 56
Step 8: Find pr. = 0.54 = 0.0625
Step 9: To Find (1-p)n-r Calculate 1-p and n-r. 1-p = 1-0.5 = 0.5 n-r = 9-4 = 5
Step 10: Calculate (1-p)n-r. = 0.55 = 0.03125
Step 11: Calculate Negative Binomial Distribution. = 56×0.0625×0.03125 = 0.109375
The probability that the coin will land on heads for the fourth timeon the ninth coin flip is 0.1094.
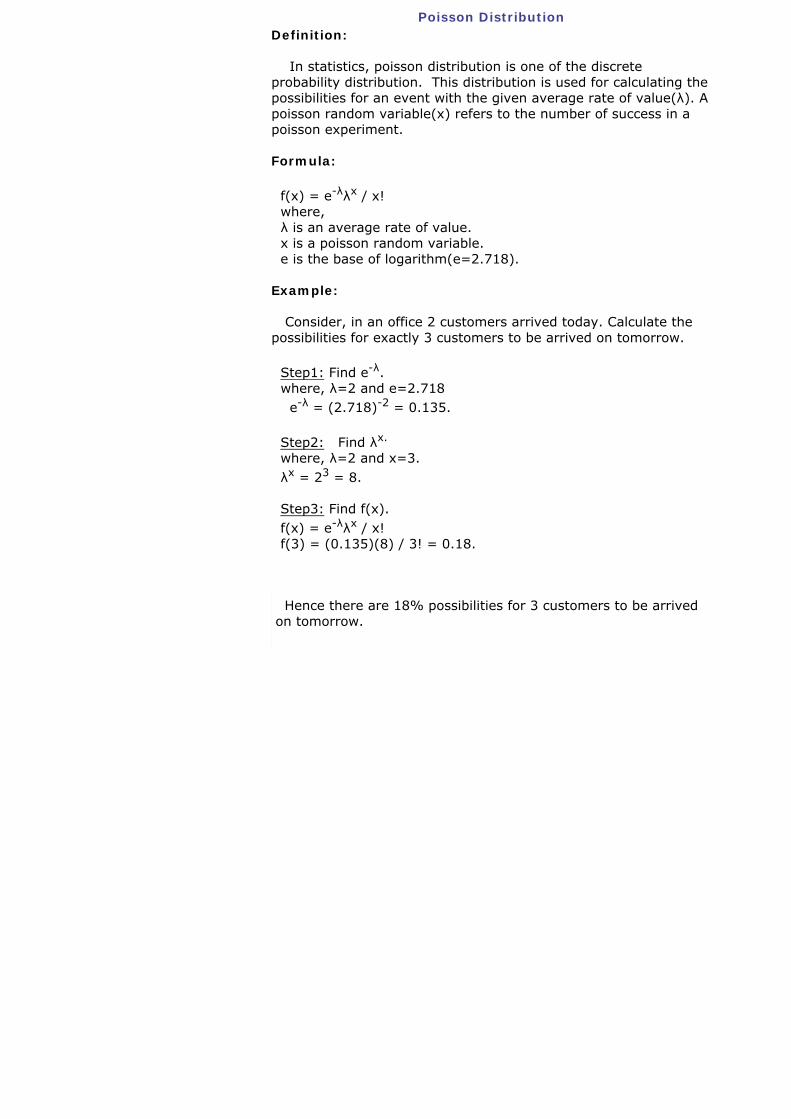
Poisson DistributionDefinition:
In statistics, poisson distribution is one of the discreteprobability distribution. This distribution is used for calculating thepossibilities for an event with the given average rate of value(λ). Apoisson random variable(x) refers to the number of success in apoisson experiment.
Formula:
f(x) = e-λλx / x! where, λ is an average rate of value. x is a poisson random variable. e is the base of logarithm(e=2.718).
Example:
Consider, in an office 2 customers arrived today. Calculate thepossibilities for exactly 3 customers to be arrived on tomorrow.
Step1: Find e-λ. where, λ=2 and e=2.718 e-λ = (2.718)-2 = 0.135.
Step2: Find λx.
where, λ=2 and x=3. λx = 23 = 8.
Step3: Find f(x). f(x) = e-λλx / x! f(3) = (0.135)(8) / 3! = 0.18.
Hence there are 18% possibilities for 3 customers to be arrivedon tomorrow.
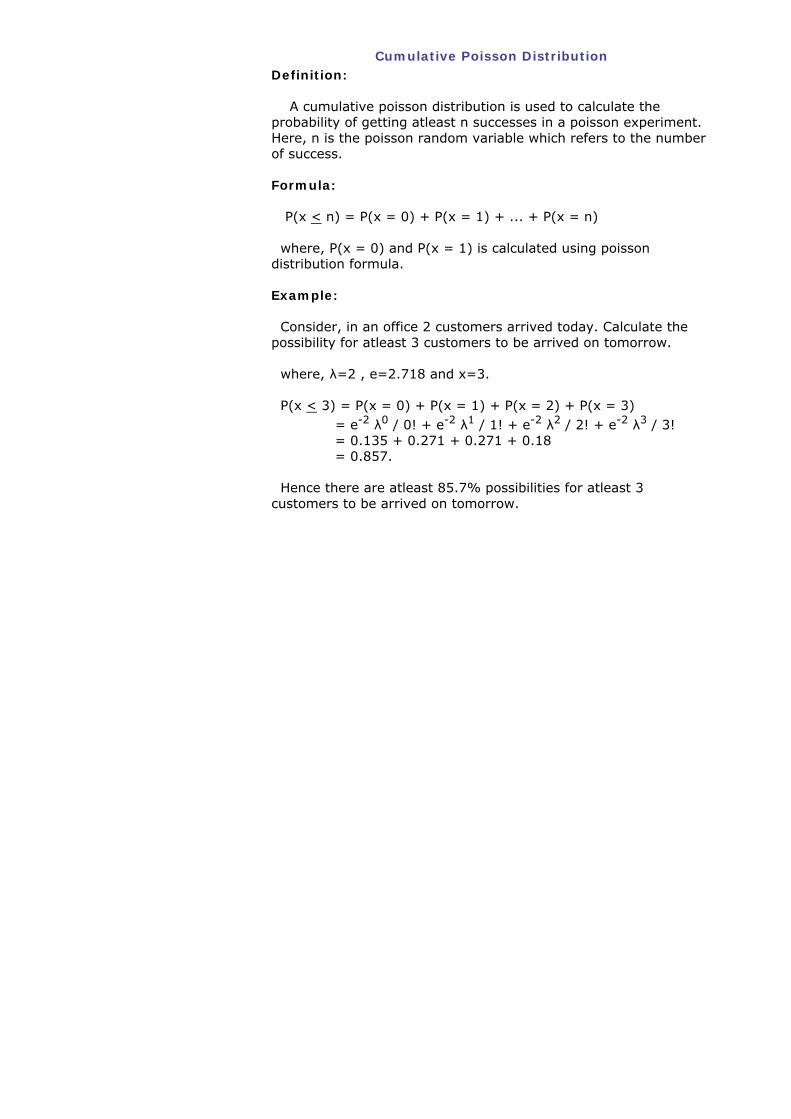
Cumulative Poisson DistributionDefinition:
A cumulative poisson distribution is used to calculate theprobability of getting atleast n successes in a poisson experiment. Here, n is the poisson random variable which refers to the number of success.
Formula:
P(x < n) = P(x = 0) + P(x = 1) + ... + P(x = n)
where, P(x = 0) and P(x = 1) is calculated using poissondistribution formula.
Example:
Consider, in an office 2 customers arrived today. Calculate thepossibility for atleast 3 customers to be arrived on tomorrow.
where, λ=2 , e=2.718 and x=3.
P(x < 3) = P(x = 0) + P(x = 1) + P(x = 2) + P(x = 3) = e-2 λ0 / 0! + e-2 λ1 / 1! + e-2 λ2 / 2! + e-2 λ3 / 3! = 0.135 + 0.271 + 0.271 + 0.18 = 0.857.
Hence there are atleast 85.7% possibilities for atleast 3customers to be arrived on tomorrow.
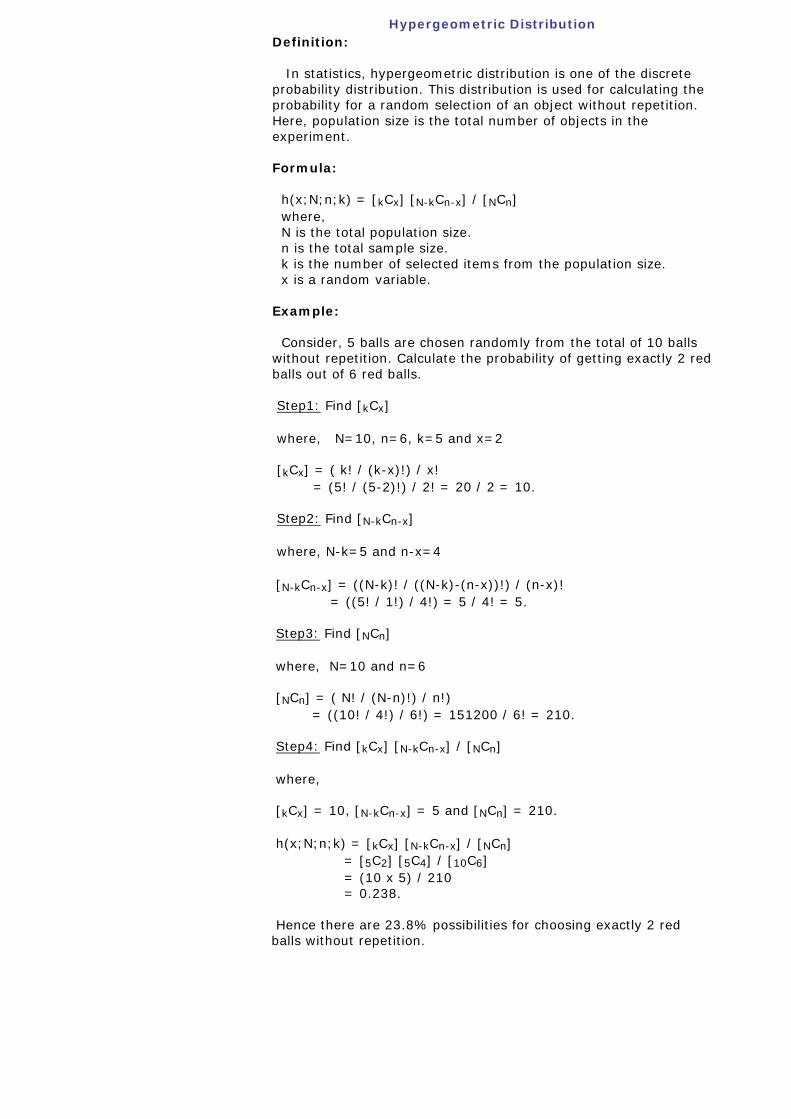
Hypergeometric DistributionDefinition:
In statistics, hypergeometric distribution is one of the discreteprobability distribution. This distribution is used for calculating the probability for a random selection of an object without repetition. Here, population size is the total number of objects in the experiment.
Formula:
h(x;N;n;k) = [kCx] [N-kCn-x] / [NCn] where, N is the total population size. n is the total sample size. k is the number of selected items from the population size. x is a random variable.
Example:
Consider, 5 balls are chosen randomly from the total of 10 ballswithout repetition. Calculate the probability of getting exactly 2 red balls out of 6 red balls.
Step1: Find [kCx]
where, N=10, n=6, k=5 and x=2
[kCx] = ( k! / (k-x)!) / x! = (5! / (5-2)!) / 2! = 20 / 2 = 10.
Step2: Find [N-kCn-x]
where, N-k=5 and n-x=4
[N-kCn-x] = ((N-k)! / ((N-k)-(n-x))!) / (n-x)! = ((5! / 1!) / 4!) = 5 / 4! = 5.
Step3: Find [NCn]
where, N=10 and n=6
[NCn] = ( N! / (N-n)!) / n!) = ((10! / 4!) / 6!) = 151200 / 6! = 210.
Step4: Find [kCx] [N-kCn-x] / [NCn]
where,
[kCx] = 10, [N-kCn-x] = 5 and [NCn] = 210.
h(x;N;n;k) = [kCx] [N-kCn-x] / [NCn] = [5C2] [5C4] / [10C6] = (10 x 5) / 210 = 0.238.
Hence there are 23.8% possibilities for choosing exactly 2 redballs without repetition.
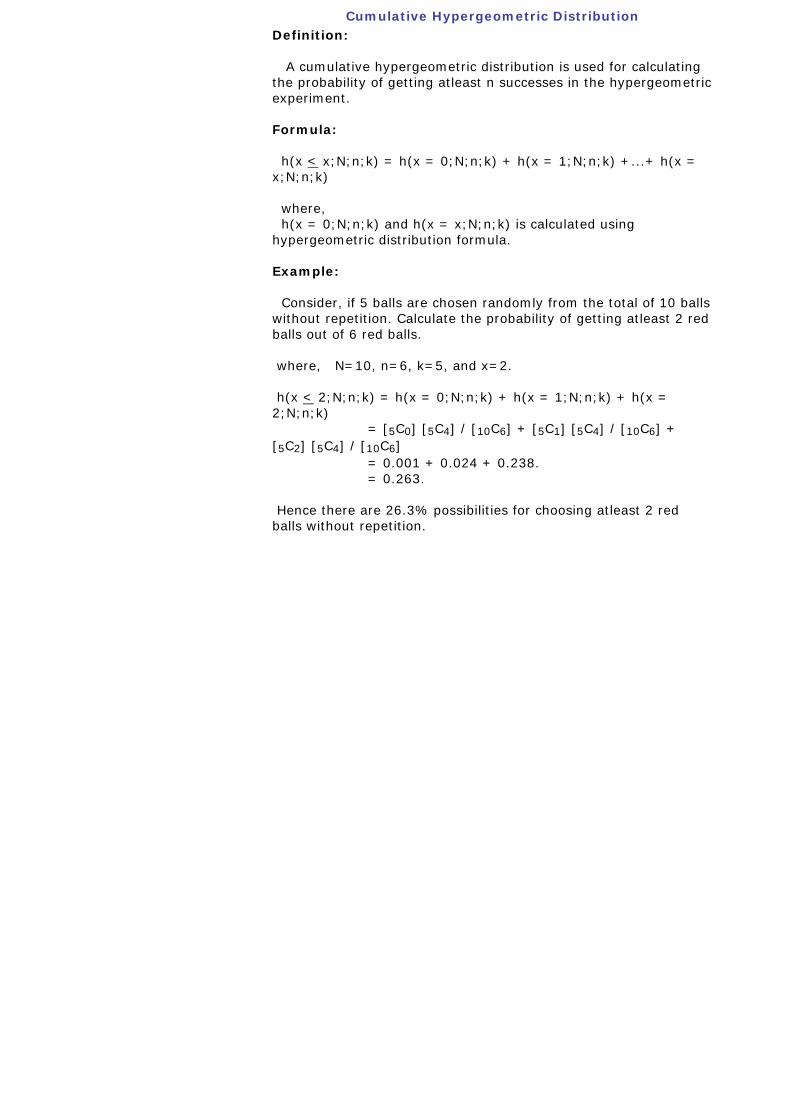
Cumulative Hypergeometric DistributionDefinition:
A cumulative hypergeometric distribution is used for calculatingthe probability of getting atleast n successes in the hypergeometric experiment.
Formula:
h(x < x;N;n;k) = h(x = 0;N;n;k) + h(x = 1;N;n;k) +...+ h(x = x;N;n;k)
where, h(x = 0;N;n;k) and h(x = x;N;n;k) is calculated usinghypergeometric distribution formula.
Example:
Consider, if 5 balls are chosen randomly from the total of 10 ballswithout repetition. Calculate the probability of getting atleast 2 red balls out of 6 red balls.
where, N=10, n=6, k=5, and x=2.
h(x < 2;N;n;k) = h(x = 0;N;n;k) + h(x = 1;N;n;k) + h(x =2;N;n;k) = [5C0] [5C4] / [10C6] + [5C1] [5C4] / [10C6] + [5C2] [5C4] / [10C6] = 0.001 + 0.024 + 0.238. = 0.263.
Hence there are 26.3% possibilities for choosing atleast 2 redballs without repetition.