Embed Size (px)
Citation preview

B A S I C N U T R I T I O N M O D U L EB A S I C N U T R I T I O N M O D U L E

iii
Part 1: Setting the Stage — Food, Nutrition, and America’s Waistline ............................................................ 1-1The Big Picture ...............................................................................................1-2Food Economics and Nutrition ......................................................................1-3The Good News ...............................................................................................1-4WIC’s Commitment ........................................................................................1-4What is Your Role? .........................................................................................1-5
Part 2: Nutrient Basics ...............................................................2-1The Nutrients ................................................................................................. 2-2 How Much of Each Nutrient do People Need? ............................................. 2-4Which Nutrients Provide Calories? ............................................................... 2-4 How Many Calories do People Need? ............................................................2-5Which Nutrients are in Your Foods? .............................................................2-7 USDA’s National Nutrient Database for Standard Reference .......................2-7The Nutrition Facts Label ..............................................................................2-7Tracking Nutrient Intake with a Food Record .............................................. 2-9
Part 3: Carbohydrates, Fats, and Proteins ..................................3-1Carbohydrates, Fats, and Proteins: Finding the Right Balance ....................3-2Carbohydrates.................................................................................................3-3
Naturally-present Sugars .........................................................................3-3Added Sugars ............................................................................................3-3Starches ....................................................................................................3-5Fiber ..........................................................................................................3-5
Fats ............................................................................................................. 3-8 Harmful Fats............................................................................................ 3-8Healthier Fats .......................................................................................... 3-9Cholesterol ..............................................................................................3-10Dietary Recommendations for Fats ....................................................... 3-11
Proteins .........................................................................................................3-12Food Sources of Proteins ........................................................................3-12Meeting Protein Needs ...........................................................................3-13Dietary Recommendations for Proteins ................................................3-15
Contents
Basic Nutrition Module

iviv
Part 4: Vitamins, Minerals, and Water ...................................4-1Vitamin and Mineral Basics ..................................................................... 4-2Vitamin A .................................................................................................. 4-3Vitamin D ...................................................................................................4-5Vitamin C ...................................................................................................4-7Folate (and Folic Acid) ............................................................................4-10Calcium ....................................................................................................4-12Iron ..........................................................................................................4-15Sodium .....................................................................................................4-18 Potassium ................................................................................................4-21Dietary Supplements .............................................................................. 4-23Water ...................................................................................................... 4-24
Part 5: Sound Advice for a Healthier America ........................5-1 The 2010 Dietary Guidelines for Americans .............................................5-2USDA’s ChooseMyPlate.gov ......................................................................5-2The 2008 Physical Activity Guidelines .....................................................5-4More Ways to Put Good Health into Practice .......................................... 5-8
Eat Less, Move More .......................................................................... 5-8Cook at Home More Often ................................................................ 5-11Dine out with your Health in Mind ................................................... 5-11Limit Screen Time .............................................................................5-12Practice Food Safety ..........................................................................5-12Practice Mindful Eating ....................................................................5-13Control Your Portions .......................................................................5-14
Making Sense of it All ..............................................................................5-15

Part 6: Your Own Checklist for Good Health ............................. 6-1Being at a Healthy Weight ............................................................................ 6-2
Body Mass Index .................................................................................... 6-2Waist Circumference .............................................................................. 6-4What is Your Weight Status? ................................................................. 6-4
Choosing Healthy Foods ...............................................................................6-5 Being Physically Active ................................................................................. 6-6Knowing Your Other Risk Factors ................................................................6-7
High Blood Pressure (Hypertension) ......................................................6-7Blood Cholesterol, Lipoproteins, and Triglycerides .............................. 6-8High Blood Glucose ................................................................................ 6-9Tobacco Use ...........................................................................................6-10Family History .......................................................................................6-10Other Risk Factors ................................................................................. 6-11
Setting Goals for a Healthy Lifestyle ........................................................... 6-11
References ................................................................................R-1
Glossary ................................................................................... G-1
Answer Key .............................................................................. K-1
Tables2.1 Nutrient Needs Based on Age and Gender ......................................... 2-32.2 Estimated Calorie Needs Based on Age, Gender and Activity Level .. 2-63.1 Approximate Fiber Content of Various Foods .................................... 3-63.2 Approximate Cholesterol Content of Various Foods ........................ 3-103.3 Approximate Protein Content of Various Foods ...............................3-134.1 Daily Vitamin A Recommendations .................................................... 4-44.2 Approximate Vitamin A Content of Various Foods ............................ 4-44.3 Daily Vitamin D Recommendations ................................................... 4-64.4 Approximate Vitamin D Content of Various Foods ............................ 4-64.5 Daily Vitamin C Recommendations ....................................................4-84.6 Approximate Vitamin C Content of Various Foods ............................ 4-94.7 Daily Folate Recommendations .........................................................4-114.8 Approximate Folate and Folic Acid Content of Various Foods .........4-11
vi
4.9 Daily Calcium Recommendations ......................................................4-134.10 Approximate Calcium Content of Various Foods ............................. 4-144.11 Daily Iron Recommendations ............................................................4-174.12 Approximate Iron Content of Various Foods ....................................4-174.13 Approximate Sodium Content of Various Foods ..............................4-204.14 Daily Potassium Recommendations ..................................................4-214.15 Approximate Potassium Content of Various Foods ......................... 4-225.1 Calories Burned per Hour in Common Physical Activities ................ 5-9
Figures1.1 Prevalence of Food Insecurity ..............................................................1-32.1 Carbohydrate Calories Versus Fat Calories ........................................ 2-54.1 Most Sodium Comes from Processed and Restaurant Food ............ 4-184.2 Quick Guide to the Best Beverages for Adults ..................................4-265.1 Image of www.ChooseMyPlate.gov .................................................... 5-25.2 Key Messages from USDA ................................................................... 5-3
Boxes2.1 Reading a Label in 4 Easy Steps .........................................................2-83.1 Putting Dietary Ranges into Practice .................................................. 3-23.2 Whole Grain Basics ............................................................................. 3-73.3 FAQs About Protein ...........................................................................3-145.1 Examples of Moderate and Vigorous Activities .................................. 5-55.2 The 2008 Physical Activity Guidelines for Americans ....................... 5-75.3 Balancing Calories for a Healthier Weight ....................................... 5-10
About the Basic Nutrition Module: The purpose of this module is to provide WIC staff with information about basic nutrition and current dietary guidelines. After completing this module, staff will be able to express an understanding of how healthy food choices, weight maintenance, and physical activity relate to good health. WIC staff will be able to promote these concepts in daily interactions with clients and be aware of ways to make positive changes in their own eating habits and lifestyles.
The Basic Nutrition Module has two components: 1) the Basic Nutrition Module which contains the main text, and 2) the Basic Nutrition Workbook, which contains the activities and test questions.
How to Use the Basic Nutrition Module This module contains six parts. As you read through each part, the following icons will prompt you to stop and go to your workbook to complete the activities and test questions.
Activity Icon — When you see this icon, stop where you are and complete the corresponding activity in the Basic Nutrition Workbook.
Test Icon — When you see this icon in the module, stop and complete the corresponding test questions in the Basic Nutrition Workbook.
Terms that appear in bold type in the text are defined in the glossary in the back of the module. There is a single Reference List in the back of the module that contains all the references cited throughout the text.
Introduction


1-1
As a nation, Americans are overfed but undernourished — we’re eating too many calories, yet we don’t always get the nutrients we need. As a result, our country has record high rates of obesity, heart disease, diabetes, and other chronic diseases. Fortunately, there are programs like WIC that can help.
Objectives
After reading Part 1 you’ll be able to:
• IdentifytrendsrelatedtothehealthandlifestyleofAmericans.
• Identifyspecificfactorsthatareleadingtoweightgain in Americans.
• Definefoodinsecurityandrecognizefactorsthataffectit.
• Definethetermfooddesert.
• RecognizetheimportanceofyourroleasaWICstaffmemberin promoting healthier lifestyles.
Part 1Setting the Stage — Food, Nutrition, and America’s Waistline

1-2
Part 1
The Big Picture
Americans are eating too much saturated fat, sugar, sodium, and calories,andnotenoughvitamins,minerals,fiber,andbeneficialoils.We’re snacking on packaged foods full of empty calories rather than eating fresh foods full of wholesome nutrients. And we’re eating on the run instead of taking the time to cook at home, savor our foods, and enjoy meals with family. Consider these alarming trends and statistics:
• TwooutofeverythreeAmericanadultsareoverweightorobese.About 72% of women and 64% of men in the U.S. are overweight or obese. And many more people are at risk of becomingpartofthesestatistics(UnitedStatesDepartmentofAgriculture[USDA],2010a).
• MostAmericansdon’tgetenoughregularphysicalactivity.Many people get none at all. Only 31% of U.S. adults say they are physically active on a regular basis, and research shows that actual activity is much lower than what people report (Troianoetal.,2008).
• Beingoverweightorobeseputspeopleatriskforchronicdiseases,including high blood pressure, heart disease, and type 2 diabetes. Poor dietary habits have also been linked to osteoporosis andsometypesofcancer.AccordingtoUSDA,thenumberofdeaths related to poor diet and physical inactivity is increasing and may soon overtake tobacco use as the leading preventable cause of death(USDA,2010b).
• America’schildrenarelearningbyexample.The prevalence of overweight and obesity has practically doubled among younger children, and tripled among adolescents since the early1970s.Likeadults,kidsareeatingtoomanycalories,fatsandsugars. The top three sources of calories among kids are grain-baseddesserts(cookies,cakes,pies,pastries,etc.),pizza,andhigh-sugarsodasandenergydrinks(USDA,2010a).
• Americansspend45%lesstimepreparingfoodathomethanbefore. Processed and packaged foods crowd supermarket shelves, more fast food is available, and Americans are eating away from home more often than before. That means we’re getting more salt, saturated fat, and additives compared to what we would get if wecookedmostofourfoodsathomefromscratch(USDA,2010b).

1-3
Setting the Stage
• Portionsizeshaveballoonedalongwitheverythingelse. Today, you can buy a 64-ounce “Mega Jug” soda, which will load youdownwith780caloriesand217gramsofsugar.Thisis10 timesthesizeofanoriginal6.5ounceCoca-Colabottle.Worseyet, fast food restaurants and convenience stores typically offer thelarge-sizeportionforjustpenniesmorethanthemedium-sizeserving, giving consumers more food for their money. But as we know, more is not always better.
Food Economics and Nutrition
Even though our country is plagued with overweight, obesity, and overconsumption, there are still millions of people in the U.S who are “food insecure.” Foodinsecurity means there are times during the year that a person may not have enough money or other resources to get thefoodtheyneed.During2009,17.4millionofallU.S.households(14.7%)werefoodinsecureat some point during the year (Nord, Coleman-Jensen,Andrews,&Carlson,2010).Texasisoneoffivestateswithafoodinsecurityratehigher thanthenationalaverage(seeFigure1.1).
Figure 1.1 Prevalence of Food Insecurity, average 2007-09
Food insecurity is closely tied to household income.Basedon2009statistics,43%ofhouseholdsbelowthepovertylinehadadifficulttime putting enough food on the table at some pointduringtheyear.Also,57%offood-insecurehouseholds said that they had taken part in the SupplementalNutritionAssistanceProgram(SNAP),TheNationalSchoolLunchProgram,and/orWICduringthepreviousmonth(Nordetal.,2010).
Geographic location can also affect a family’s nutrition. Some Americans live in fooddeserts – large geographic areas that don’t have reasonable access to affordable fruits, vegetables, whole grains, low-fat milk, or other healthy foods. Food deserts can be in inner city or rural settings, often in areas where residents have fairly low incomes. In some food deserts, the closest and easiest places to get food are fast food chains or convenience stores. People living in food desertsareinneedofhealthierfoodoptions(CentersforDiseaseControlandPrevention[CDC],2010b).
1-4
Part 1
The Good News
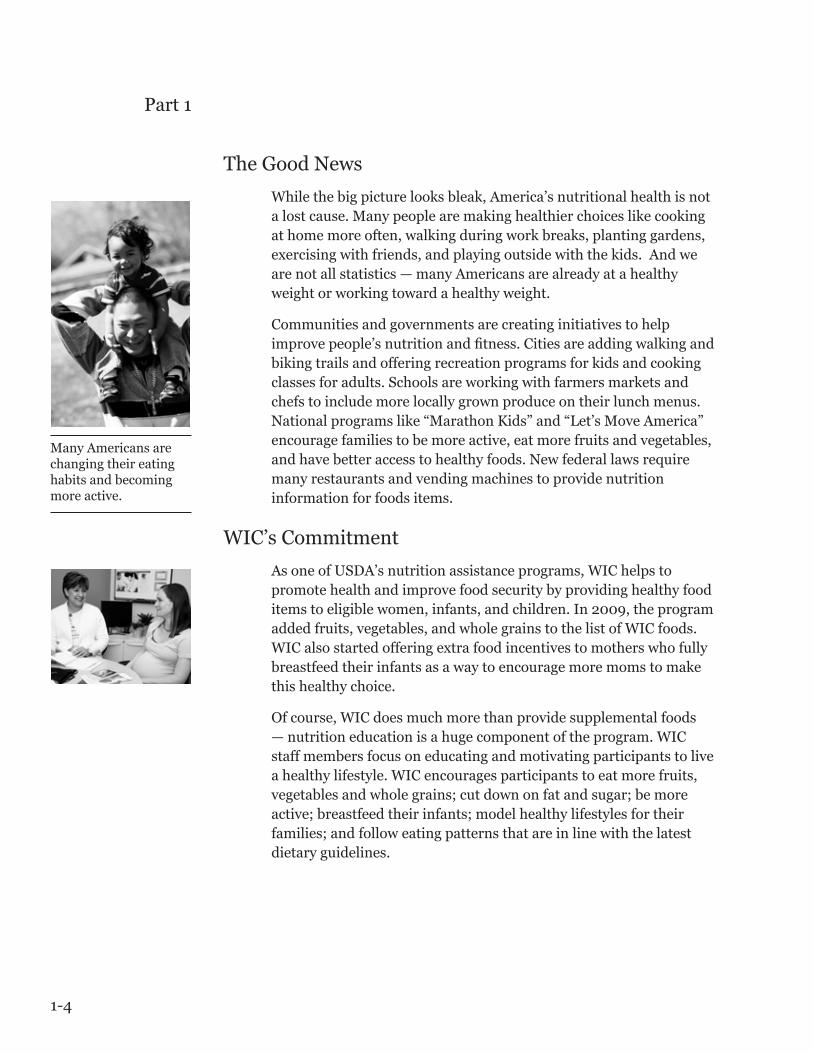
While the big picture looks bleak, America’s nutritional health is not a lost cause. Many people are making healthier choices like cooking at home more often, walking during work breaks, planting gardens, exercisingwithfriends,andplayingoutsidewiththekids.Andweare not all statistics — many Americans are already at a healthy weight or working toward a healthy weight.
Communities and governments are creating initiatives to help improvepeople’snutritionandfitness.Citiesareaddingwalkingandbiking trails and offering recreation programs for kids and cooking classes for adults. Schools are working with farmers markets and chefs to include more locally grown produce on their lunch menus. Nationalprogramslike“MarathonKids”and“Let’sMoveAmerica”encourage families to be more active, eat more fruits and vegetables, and have better access to healthy foods. New federal laws require many restaurants and vending machines to provide nutrition information for foods items.
Many Americans are changing their eating habits and becoming more active.
WIC’s Commitment
AsoneofUSDA’snutritionassistanceprograms,WIChelpstopromote health and improve food security by providing healthy food itemstoeligiblewomen,infants,andchildren.In2009,theprogramadded fruits, vegetables, and whole grains to the list of WIC foods. WICalsostartedofferingextrafoodincentivestomotherswhofullybreastfeed their infants as a way to encourage more moms to make this healthy choice.
Of course, WIC does much more than provide supplemental foods — nutrition education is a huge component of the program. WIC staff members focus on educating and motivating participants to live a healthy lifestyle. WIC encourages participants to eat more fruits, vegetables and whole grains; cut down on fat and sugar; be more active; breastfeed their infants; model healthy lifestyles for their families; and follow eating patterns that are in line with the latest dietary guidelines.
1-5
Setting the Stage
WhatisYourRole?
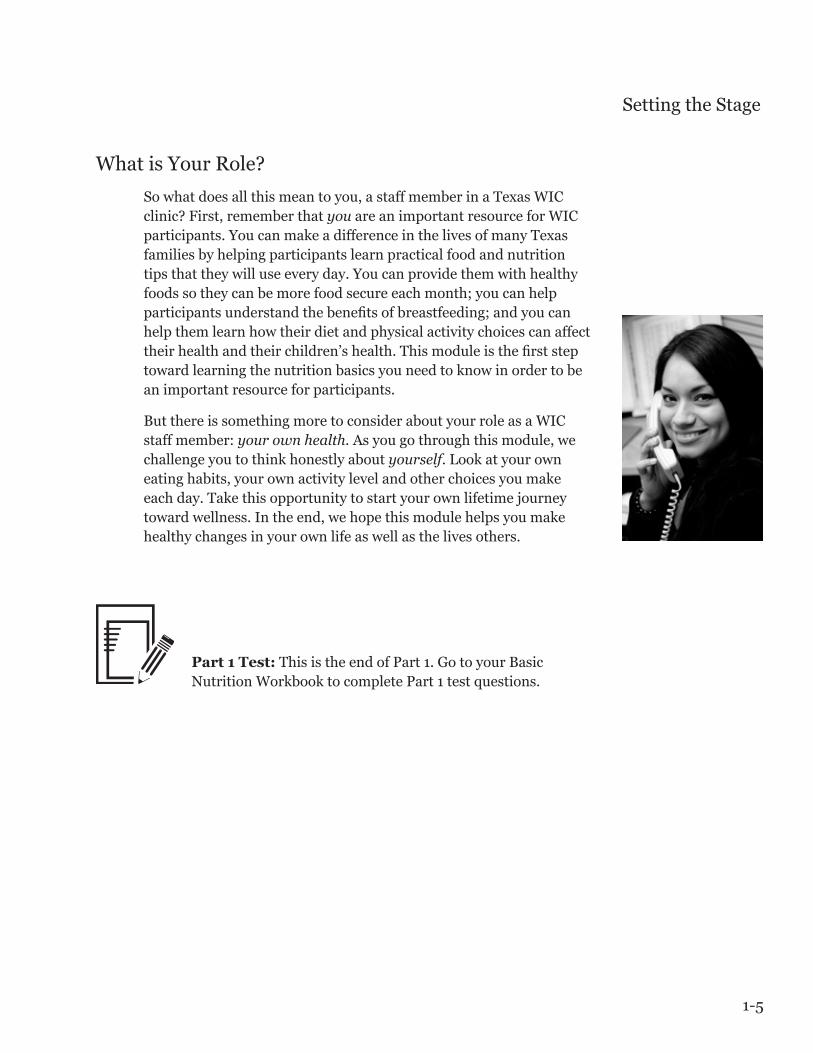
Sowhatdoesallthismeantoyou,astaffmemberinaTexasWICclinic?First,rememberthatyou are an important resource for WIC participants.YoucanmakeadifferenceinthelivesofmanyTexasfamilies by helping participants learn practical food and nutrition tips that they will use every day. You can provide them with healthy foods so they can be more food secure each month; you can help participantsunderstandthebenefitsofbreastfeeding;andyoucanhelp them learn how their diet and physical activity choices can affect theirhealthandtheirchildren’shealth.Thismoduleisthefirststeptoward learning the nutrition basics you need to know in order to be an important resource for participants.
But there is something more to consider about your role as a WIC staff member: your own health. As you go through this module, we challenge you to think honestly about yourself.Lookatyourowneating habits, your own activity level and other choices you make each day. Take this opportunity to start your own lifetime journey toward wellness. In the end, we hope this module helps you make healthy changes in your own life as well as the lives others.
Part1Test: This is the end of Part 1. Go to your Basic Nutrition Workbook to complete Part 1 test questions.

2-1
Nourishing ourselves is no small task — it takes over 45 nutrients to keep our bodies going every day. In this section, we will introduce the different categories of nutrients and also discuss some practical aspects, like how to tell what nutrients are in your food, and how to keep a one-day food record.
Objectives
After reading this section you’ll be able to:
• Identifythesixmajorcategoriesofnutrients.
• Understandwhichnutrientsprovidecalories.
• Recognizewhichfactorscaninfluenceaperson’snutrientneeds.
• Practiceusingafooddiarytorecordyourfoodintake.
• Demonstratehowtoreadandanalyzeafoodlabel.
Part2Nutrient Basics

2-2
Part 2
The Nutrients
Thenutrientsourbodyneedsaregroupedintosixmajorcategories:
• Carbohydrates are the body’s major source of energy (calories). Current guidelines suggest 45-65% daily calories should come from carbohydrates.
• Fats transport nutrients and are an important part of the cell structure. Fats also contribute calories — lots of them. Many Americans eat too many saturated and trans fats, raising their risk ofcardiovasculardisease.Expertsrecommendthat20-35%ofourcalories come from fat.
• Proteins are made up of amino acids that the body uses to build, repair, and maintain tissues. Most Americans get plenty of protein eachday.Thelatestguidelinesadvisegetting10-35%ofourcalories from protein each day.
• Vitamins are present in foods in small quantities, yet they have big jobs, helping with chemical reactions in the body. Vitamins don’t provide calories, but they help the body use calories from carbohydrates, proteins and fat. In this module, we’ll focus on vitaminA,vitaminC,vitaminD,andfolicacid.
• Minerals are similar to vitamins in that they are present in tiny quantities,theydon’tprovidecalories,andtheyplayspecificroles in body functions. In this module we’ll cover iron, calcium, sodium, and potassium.
• Waterisanessentialpartofthediet.Waterispartofeveryfluidinthebody;itcarriesnutrientsandoxygen,carriesoutwaste,andnormalizesourbodytemperature.Ourbodiescansurviveforsixto eight weeks without food, but a healthy adult can’t make it more than3to5dayswithoutwater(Bryant,2008).

Nutrient Basics
Table 2.1 Nutrient Needs Based on Age and Gender (USDA, 2010a) This table does not include data for pregnant or breastfeeding women. A copy of this table is available in the Appendix of your Basic Nutrition Workbook.
Macronutrients Nutrient (units)
Source of Goala
Child 1–3
Female 4–8
Male 4–8
Female 9–13
Male 9–13
Female 14–18
Male 14–18
Female 19–30
Male 19–30
Female 31–50
Male 31–50
Female 51+
Male 51+
Protein (g) RDAb 13 19 19 34 34 46 52 46 56 46 56 46 56 (% of calories) AMDRc 5–20 10–30 10–30 10–30 10–30 10–30 10–30 10–35 10–35 10–35 10–35 10–35 10–35 Carbohydrate (g) RDA 130 130 130 130 130 130 130 130 130 130 130 130 130 (% of calories) AMDR 45–65 45–65 45–65 45–65 45–65 45–65 45–65 45–65 45–65 45–65 45–65 45–65 45–65 Total fiber (g) IOMd 14 17 20 22 25 25 31 28 34 25 31 22 28 Total fat (% of calories) AMDR 30–40 25–35 25–35 25–35 25–35 25–35 25–35 20–35 20–35 20–35 20–35 20–35 20–35
Saturated fat (% of calories) DGe <10% <10% <10% <10% <10% <10% <10% <10% <10% <10% <10% <10% <10%
Linoleic acid (g) AIf 7 10 10 10 12 11 16 12 17 12 17 11 14 (% of calories) AMDR 5–10 5–10 5–10 5–10 5–10 5–10 5–10 5–10 5–10 5–10 5–10 5–10 5–10 alpha-Linolenic acid (g) AI 0.7 0.9 0.9 1.0 1.2 1.1 1.6 1.1 1.6 1.1 1.6 1.1 1.6
(% of calories) AMDR 0.6–1.2 0.6–1.2 0.6–1.2 0.6–1.2 0.6–1.2 0.6–1.2 0.6–1.2 0.6–1.2 0.6–1.2 0.6–1.2 0.6–1.2 0.6–1.2 0.6–1.2 Cholesterol (mg) DG <300 <300 <300 <300 <300 <300 <300 <300 <300 <300 <300 <300 <300
Minerals Nutrient (units)
Source of Goala
Child 1-3
Female 4-8
Male 4-8
Female 9-13
Male 9-13
Female 14-18
Male 14-18
Female 19-30
Male 19-30
Female 31-50
Male 31-50
Female 51+
Male 51+
Calcium (mg) RDA 700 1,000 1,000 1,300 1,300 1,300 1,300 1,000 1,000 1,000 1,000 1,200 1,200 Iron (mg) RDA 7 10 10 8 8 15 11 18 8 18 8 8 8 Magnesium (mg) RDA 80 130 130 240 240 360 410 310 400 320 420 320 420 Phosphorus (mg) RDA 460 500 500 1,250 1,250 1,250 1,250 700 700 700 700 700 700
Potassium (mg) AI 3,000 3,800 3,800 4,500 4,500 4,700 4,700 4,700 4,700 4,700 4,700 4,700 4,700 Sodium (mg) ULg <1,500 <1,900 <1,900 <2,200 <2,200 <2,300 <2,300 <2,300 <2,300 <2,300 <2,300 <2,300 <2,300 Zinc (mg) RDA 3 5 5 8 8 9 11 8 11 8 11 8 11 Copper (mcg) RDA 340 440 440 700 700 890 890 900 900 900 900 900 900 Selenium (mcg) RDA 20 30 30 40 40 55 55 55 55 55 55 55 55
Vitamins Nutrient (units)
Source of Goala
Child 1-3
Female 4-8
Male 4-8
Female 9-13
Male 9-13
Female 14-18
Male 14-18
Female 19-30
Male 19-30
Female 31-50
Male 31-50
Female 51+
Male 51+
Vitamin A (mcg RAE) RDA 300 400 400 600 600 700 900 700 900 700 900 700 900
Vitamin Dh (mcg) RDA 15 15 15 15 15 15 15 15 15 15 15 15 15 Vitamin E (mg AT) RDA 6 7 7 11 11 15 15 15 15 15 15 15 15 Vitamin C (mg) RDA 15 25 25 45 45 65 75 75 90 75 90 75 90 Thiamin (mg) RDA 0.5 0.6 0.6 0.9 0.9 1.0 1.2 1.1 1.2 1.1 1.2 1.1 1.2 Riboflavin (mg) RDA 0.5 0.6 0.6 0.9 0.9 1.0 1.3 1.1 1.3 1.1 1.3 1.1 1.3 Niacin (mg) RDA 6 8 8 12 12 14 16 14 16 14 16 14 16 Folate (mcg) RDA 150 200 200 300 300 400 400 400 400 400 400 400 400 Vitamin B6 (mg) RDA 0.5 0.6 0.6 1.0 1.0 1.2 1.3 1.3 1.3 1.3 1.3 1.5 1.7 Vitamin B12 (mcg) RDA 0.9 1.2 1.2 1.8 1.8 2.4 2.4 2.4 2.4 2.4 2.4 2.4 2.4 Choline (mg) AI 200 250 250 375 375 400 550 425 550 425 550 425 550 Vitamin K (mcg) AI 30 55 55 60 60 75 75 90 120 90 120 90 120
a Dietary Guidelines recommendations are used when no quantitative Dietary Reference Intake value is available; apply to ages 2 years and older. b Recommended Dietary Allowance, Institute of Medicine (IOM). c Acceptable Macronutrient Distribution Range, IOM. d 14 grams per 1,000 calories, Institute of Medicine. e Dietary Guidelines recommendation. f Adequate Intake, IOM. g Upper Limit, IOM. h 1 mcg of vitamin D is equivalent to 40 IU. AT = alpha-tocopherol; DFE = dietary folate equivalents; RAE = retinol activity equivalent.
2-3

2-4
Part 2
HowMuchofEachNutrientdoPeopleNeed?
Scientists routinely look at the latest research to come up with nutrient recommendations for people in different age groups. Individualnutrientneedsdependonyourage,sex,height,weight,and physical activity, as well as your health status. Table 2.1 lists nutrient needs based on age and gender.
WhichNutrientsProvideCalories?
Only three types of nutrients provide calories: carbohydrates, proteins, and fats. Most foods and drinks have combinations of these nutrients in different amounts. Alcohol also provides calories. Alcohol isn’t a nutrient since our bodies don’t need it to function, but alcoholic beverages can add a lot of calories to a diet.
Sources of Calories in the Diet:
• Carbohydratehas4calories/gram
• Proteinhas4calories/gram
• Fathas9calories/gram
• Alcoholhas7calories/gram
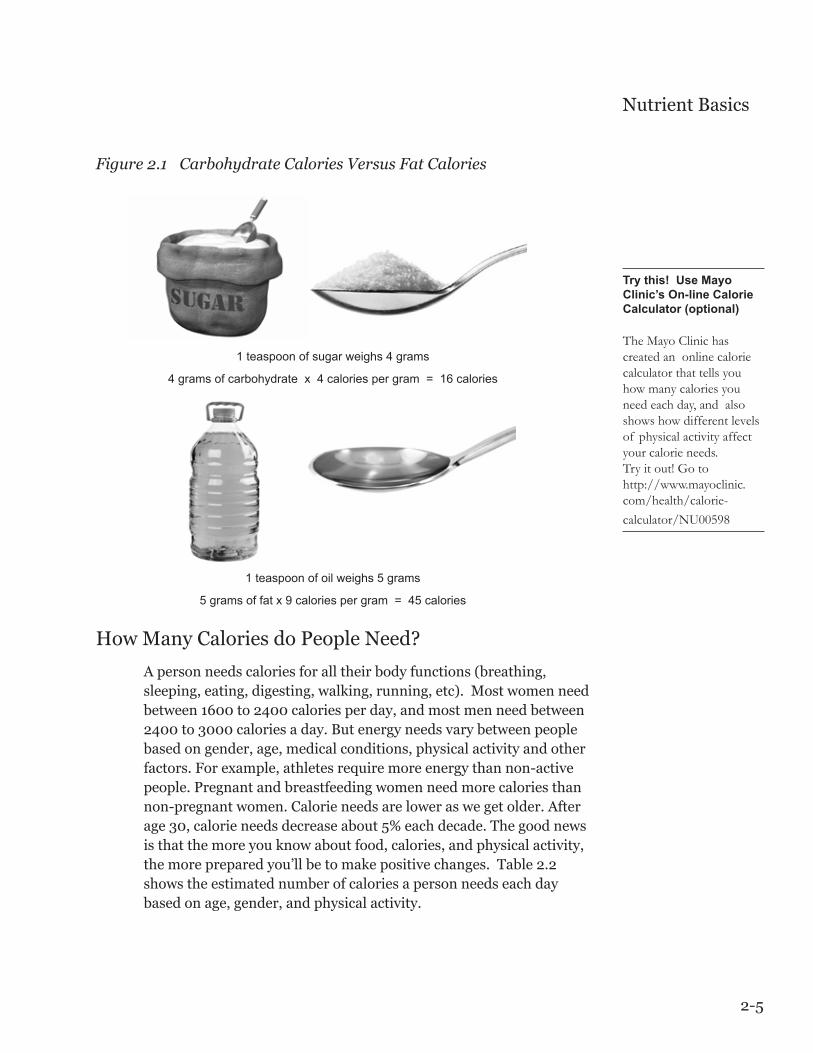
Notice that fat has more than twice the calories per gram compared to protein or carbohydrate. To help picture this, compare the teaspoonsofsugarandoilinFigure2.1.Becausetheoilispurefat,ithas almost three times the calories of a teaspoon of sugar. That’s why butter, sauces, gravies, salad dressings, and other high-fat foods add so many calories to our diets.
Making Sense of Calories Simply put, a calorie is a unit of energy. The number of calories in a food tells you how much energy that food provides. For example, an apple provides about 100 calories that your body can use for energy. We also refer to calories when we talk about how much energy our bodies use or “burn.” Example: if you walk 3.5 miles in an hour, you’ll burn about 280 calories.
2-5
Nutrient Basics
Figure 2.1 Carbohydrate Calories Versus Fat Calories
1 teaspoon of sugar weighs 4 grams
4 grams of carbohydrate x 4 calories per gram = 16 calories
1 teaspoon of oil weighs 5 grams
5 grams of fat x 9 calories per gram = 45 calories
Try this! Use Mayo Clinic’s On-line Calorie Calculator (optional) The Mayo Clinic has created an online calorie calculator that tells you how many calories you need each day, and also shows how different levels of physical activity affect your calorie needs. Try it out! Go to http://www.mayoclinic.com/health/calorie-calculator/NU00598
HowManyCaloriesdoPeopleNeed?
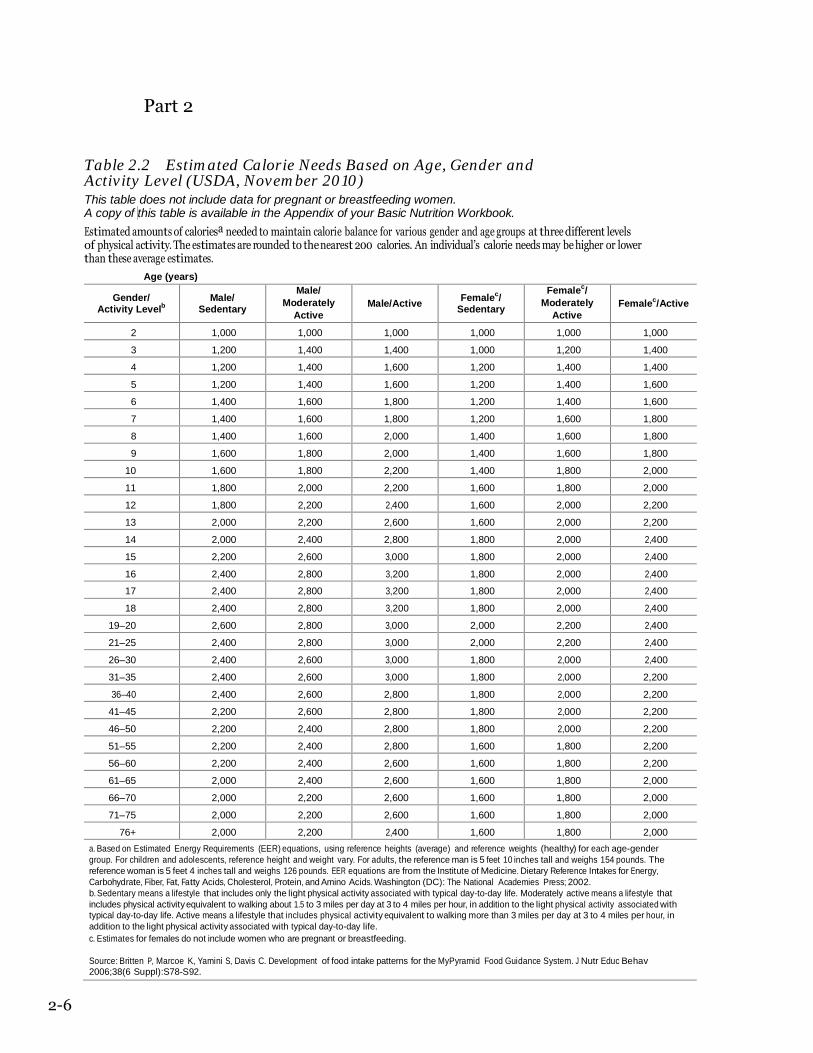
A person needs calories for all their body functions (breathing, sleeping, eating, digesting, walking, running, etc). Most women need between1600to2400caloriesperday,andmostmenneedbetween2400to3000caloriesaday.Butenergyneedsvarybetweenpeoplebased on gender, age, medical conditions, physical activity and other factors.Forexample,athletesrequiremoreenergythannon-activepeople.Pregnantandbreastfeedingwomenneedmorecaloriesthannon-pregnant women. Calorie needs are lower as we get older. After age30,calorieneedsdecreaseabout5%eachdecade.Thegoodnewsis that the more you know about food, calories, and physical activity, the more prepared you’ll be to make positive changes. Table 2.2 shows the estimated number of calories a person needs each day based on age, gender, and physical activity.
Part 2
Table 2.2 Estimated Calorie Needs Based on Age, Gender and Activity Level (USDA, November 2010) This table does not include data for pregnant or breastfeeding women. A copy of this table is available in the Appendix of your Basic Nutrition Workbook.
Estimated amounts of caloriesa needed to maintain calorie balance for various gender and age groups at three different levels of physical activity. The estimates are rounded to the nearest 200 calories. An individual’s calorie needs may be higher or lower than these average estimates.
Age (years) Gender/
Activity Levelb Male/
Sedentary
Male/ Moderately
Active Male/Active Femalec/
Sedentary
Femalec/ Moderately
Active Femalec/Active
2 1,000 1,000 1,000 1,000 1,000 1,000
3 1,200 1,400 1,400 1,000 1,200 1,400
4 1,200 1,400 1,600 1,200 1,400 1,400
5 1,200 1,400 1,600 1,200 1,400 1,600
6 1,400 1,600 1,800 1,200 1,400 1,600
7 1,400 1,600 1,800 1,200 1,600 1,800
8 1,400 1,600 2,000 1,400 1,600 1,800
9 1,600 1,800 2,000 1,400 1,600 1,800
10 1,600 1,800 2,200 1,400 1,800 2,000
11 1,800 2,000 2,200 1,600 1,800 2,000
12 1,800 2,200 2,400 1,600 2,000 2,200
13 2,000 2,200 2,600 1,600 2,000 2,200
14 2,000 2,400 2,800 1,800 2,000 2,400
15 2,200 2,600 3,000 1,800 2,000 2,400
16 2,400 2,800 3,200 1,800 2,000 2,400
17 2,400 2,800 3,200 1,800 2,000 2,400
18 2,400 2,800 3,200 1,800 2,000 2,400
19–20 2,600 2,800 3,000 2,000 2,200 2,400
21–25 2,400 2,800 3,000 2,000 2,200 2,400
26–30 2,400 2,600 3,000 1,800 2,000 2,400
31–35 2,400 2,600 3,000 1,800 2,000 2,200
36–40 2,400 2,600 2,800 1,800 2,000 2,200
41–45 2,200 2,600 2,800 1,800 2,000 2,200
46–50 2,200 2,400 2,800 1,800 2,000 2,200
51–55 2,200 2,400 2,800 1,600 1,800 2,200
56–60 2,200 2,400 2,600 1,600 1,800 2,200
61–65 2,000 2,400 2,600 1,600 1,800 2,000
66–70 2,000 2,200 2,600 1,600 1,800 2,000
71–75 2,000 2,200 2,600 1,600 1,800 2,000
76+ 2,000 2,200 2,400 1,600 1,800 2,000 a. Based on Estimated Energy Requirements (EER) equations, using reference heights (average) and reference weights (healthy) for each age-gender group. For children and adolescents, reference height and weight vary. For adults, the reference man is 5 feet 10 inches tall and weighs 154 pounds. The reference woman is 5 feet 4 inches tall and weighs 126 pounds. EER equations are from the Institute of Medicine. Dietary Reference Intakes for Energy, Carbohydrate, Fiber, Fat, Fatty Acids, Cholesterol, Protein, and Amino Acids. Washington (DC): The National Academies Press; 2002. b. Sedentary means a lifestyle that includes only the light physical activity associated with typical day-to-day life. Moderately active means a lifestyle that includes physical activity equivalent to walking about 1.5 to 3 miles per day at 3 to 4 miles per hour, in addition to the light physical activity associated with typical day-to-day life. Active means a lifestyle that includes physical activity equivalent to walking more than 3 miles per day at 3 to 4 miles per hour, in addition to the light physical activity associated with typical day-to-day life. c. Estimates for females do not include women who are pregnant or breastfeeding.
Source: Britten P, Marcoe K, Yamini S, Davis C. Development of food intake patterns for the MyPyramid Food Guidance System. J Nutr Educ Behav 2006;38(6 Suppl):S78-S92.
2-6

2-7
Nutrient Basics
WhichNutrientsareinYourFoods?
Areyouevercuriousabouthowmuchsodiumisinyoursoup?IsvitaminAinapricots?Howmuchcalciumisinkale?Learningthenutrient content of your favorite foods can take a bit of detective work. Two important tools you can use are:
• USDA’sNationalNutrientDatabase.
• TheNutritionFactsLabelsonpackagedfoods.
USDA’s National Nutrient Database for Standard Reference
USDA’sonlinetoolprovidesdataforresearch,nutritionmonitoring,food policy development, and daily nutrient tracking. It is the foundationofmostfoodandnutritiondatabasesintheU.S.Tousethis database, simply type in the name a food, and follow the steps. The end result is a detailed report of all the nutrients in the serving sizesofthefoodthatyouselected.Thedatabaseisavailableat:http://www.nal.usda.gov/fnic/foodcomp/search/.
Activity 2.1 — Using the USDA Nutrient Database. StophereandgotoyourBasicNutritinWorkbookandcomplete the activity.
The Nutrition Facts Label
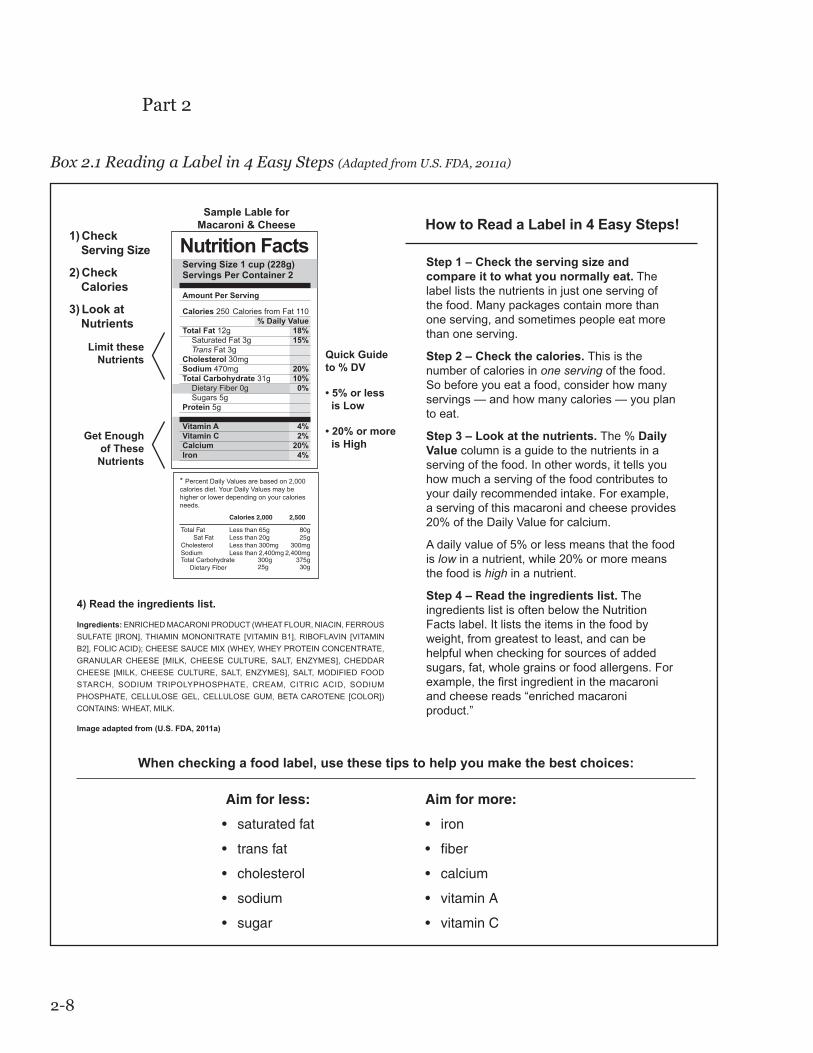
Most packaged foods in today’s grocery stores must have a Nutrition FactsLabel.Thelabeltellsyouthenutrientsinafoodandshowshow a serving of the food contributes to your daily nutrient needs. Although most people are familiar with what the label looks like, manystillaren’tsurehowtoproperlyreadit.Box2.1breakstheprocess down into four easy steps.
2-8
Part 2
Box 2.1 Reading a Label in 4 Easy Steps (Adapted from U.S. FDA, 2011a)
How to Read a Label in 4 Easy Steps!
Step 1 – Check the serving size and compare it to what you normally eat. The label lists the nutrients in just one serving of the food. Many packages contain more than one serving, and sometimes people eat more than one serving.
Step 2 – Check the calories. This is the number of calories in one serving of the food. So before you eat a food, consider how many servings — and how many calories — you plan to eat.
Step 3 – Look at the nutrients. The % Daily Value column is a guide to the nutrients in a serving of the food. In other words, it tells you how much a serving of the food contributes to your daily recommended intake. For example, a serving of this macaroni and cheese provides 20% of the Daily Value for calcium.
A daily value of 5% or less means that the food is low in a nutrient, while 20% or more means the food is high in a nutrient.
Step 4 – Read the ingredients list. The ingredients list is often below the Nutrition Facts label. It lists the items in the food by weight, from greatest to least, and can be helpful when checking for sources of added sugars, fat, whole grains or food allergens. For example, the first ingredient in the macaroni and cheese reads “enriched macaroni product.”
When checking a food label, use these tips to help you make the best choices:
Aim for more:
• iron
• fiber
• calcium
• vitaminA
• vitaminC
4) Read the ingredients list.
Ingredients: ENRICHED MACARONI PRODUCT (WHEAT FLOUR, NIACIN, FERROUS SULFATE [IRON], THIAMIN MONONITRATE [VITAMIN B1], RIBOFLAVIN [VITAMIN B2], FOLIC ACID); CHEESE SAUCE MIX (WHEY, WHEY PROTEIN CONCENTRATE, GRANULAR CHEESE [MILK, CHEESE CULTURE, SALT, ENZYMES], CHEDDAR CHEESE [MILK, CHEESE CULTURE, SALT, ENZYMES], SALT, MODIFIED FOOD STARCH, SODIUM TRIPOLYPHOSPHATE, CREAM, CITRIC ACID, SODIUM PHOSPHATE, CELLULOSE GEL, CELLULOSE GUM, BETA CAROTENE [COLOR]) CONTAINS: WHEAT, MILK.
Image adapted from (U.S. FDA, 2011a)
1) Check Serving Size
2) Check Calories
3) Look at Nutrients
Sample Lable for Macaroni & Cheese
Nutrition FactsServing Size 1 cup (228g)Servings Per Container 2
Amount Per Serving
Calories 250 Calories from Fat 110 % Daily ValueTotal Fat 12g 18% Saturated Fat 3g 15% Trans Fat 3gCholesterol 30mgSodium 470mg 20%Total Carbohydrate 31g 10% Dietary Fiber 0g 0% Sugars 5gProtein 5g Vitamin A 4%Vitamin C 2%Calcium 20%Iron 4%
* Percent Daily Values are based on 2,000 calories diet. Your Daily Values may be higher or lower depending on your calories needs.
Get Enough of These Nutrients
Limit these Nutrients Quick Guide
to % DV
• 5% or less is Low
• 20% or more is High
Aim for less:
• saturatedfat
• transfat
• cholesterol
• sodium
• sugar
Calories 2,000 2,500
TotalFat Lessthan65g 80gSatFat Lessthan20g 25gCholesterol Lessthan300mg 300mgSodium Lessthan2,400mg 2,400mgTotalCarbohydrateDietaryFiber
300g 375g25g 30g

2-9
Nutrient Basics
TrackingNutrientIntakewithaFoodRecord
Doyoueverstoptothinkaboutthefoodsyoueat?Howdoyouknowifyouaregettingenoughnutrients?Onewaytofindoutistowritedownallthefoodsyoueatusingafoodrecord.Thenyoucananalyzetherecordusingafreecomputerizeddietanalysisprogramliketheoneavailableatwww.ChooseMyPlate.gov.
Writing down everything you eat in a food record helps you think twice about what kinds of foods you put into your body. This is what makes a food record such a powerful tool! You don’t have to stop at one day — keeping a food record for a longer time can help you make small dietary changes. You can encourage your clients to become more mindful of their eating habits by creating their own food record.
Activity 2.2 — Keep a One-Day Food Record.RefertoyourBasicNutritionWorkbookandcompletetheactivity.
Part 2 Test: ThisistheendofPart2.Gotoyour BasicNutritionWorkbooktocompletePart2test questions.

3-1
Carbohydrates, fats, and proteins often take center stage when we discuss diet and nutrition. They are the three major nutrients in our diet that provide energy (or calories), and we usually talk about foods based on their carbohydrate, fat, or protein content.
Objectives
After reading this section you’ll be able to:
• Identifysourcesandbenefitsofcarbohydratesinthediet.
• Recognizefoodsourcesofsaturatedfats,transfats,and omega-3 fats.
• Distinguishbetweentheeffectsofsolidfatsandbeneficialoils.
• Listfoodsourcesofdietarycholesterol.
• Demonstrateknowledgeregardingthefunctions,sources,anddietary requirements for protein.
Part 3Carbohydrates, Fats, and Proteins
3-2
Part 3
How do these percentages apply to your daily intake? Based on current guidelines, if you eat 1800 calories a day and would like to follow a diet that contains 55% calories from carbohydrate, 25% calories from fat, and 20% calories from protein, your daily consumption would look like this:
• Carbohydrates:248grams(or990caloriesfromCarbohydrates)
Calculations:
1800 calories x 55% = 990 calories from carbohydrate
990 calories ÷ 4 calories per gram of carbohydrate = 248 grams of carbohydrates
• Fats:50grams(or450caloriesfromFats)
Calculations:
1800 calories x 25% = 450 calories from fat
450 calories ÷ 9 calories per gram of fat = 50 grams of fats
• Proteins:90grams(or360caloriesfromProteins)
Calculations:
1800 calories x 20% = 360 calories from protein
360 calories ÷ 4 calories per gram of protein = 90 grams of protein
Carbohydrates, Fats, and Proteins: Finding the RightBalance
It’simportanttoeatahealthybalanceofcarbohydrates,fats,andproteins. Over the years, popular diet plans have made different claims about how much of each nutrient we should eat, especially when it comestolosingweight.Butalong-termdietthatgoesoverboardorskimps on one of these major nutrients can lead to trouble.
TheInstituteofMedicinehaspublishedacceptablerangesforcarbohydrates,fatsandproteins,basedonscientificresearch(USDA,2010a). Here are the ranges for adults, age 19 years and older:
• 45-65%ofcaloriesfromcarbohydrates.
• 20-35%ofcaloriesfromfats.
• 10-35%ofcaloriesfromproteins.
Theserangesoffersoundguidancealongwithsomeflexibility.Forexample,someonewhowantstofollowalower-fatdietcanchoosetoconsumeonly20%ofcaloriesfromfats,andincreasethepercentofcaloriesfromproteinsandcarbohydrates.Itisnotrecommendedto go above or below the ranges without guidance from a health-care professional.
Box 3.1: Putting Dietary Ranges into Practice

3-3
Carbohydrates, Fats, and Proteins
Carbohydrates
Thanks to carbohydrates, you have the energy to walk, run, breathe, and read this module. That’s because the primary role of carbohydrates is to provide energy, especially for your brain and nervoussystem.Eachgramofcarbohydrateinafoodprovides4calories that your body can use for energy.
Carbohydrates have gotten a bad rap over the years. People blame theirextraweightontoomany“carbs”andtalkaboutcarbohydratesnegatively.Butnotallcarbohydratesarecreatedthesame.Granted,we need to cut back on less healthy carbohydrates like cookies, candy, cake and other grain-based desserts, but our body needs other healthycarbohydrates.Let’stakeacloserlookatthedifferenttypesof carbohydrates and their common food sources:
• Naturally-presentsugars–in fruits, milk products, and some vegetables
• Addedsugars–in candy, baked goods, sweetened dairy products, etc.
• Starches – primarily in grains, vegetables, and legumes
• Fiber–found in all plant products including grains, vegetables, fruits, and legumes
Naturally-PresentSugars
Manysugarsarenaturally present in foods like the sugars in fruit, fruitjuice,certainvegetables,andmilkproducts.Sadly,somepeopleonextremeweight-lossdietswillcutthesefoodsoutoftheirdietssimplybecausetheycontainsugar.Butthefactis,thesefoodsprovide important vitamins, minerals, and other key nutrients, while adding balance and variety to a healthy diet.
AddedSugars
Sugarsthatareadded to food are the real culprits when it comes to excesscaloriesandweightgain.ManyAmericanseattoomanyaddedsugars, usually in the form of soft drinks, energy drinks, candy, cakes, cookies, pies, fruit drinks, sugary cereals, and sweetened milk products like ice cream, yogurts, and chocolate milk. Not only do thesefoodsloadyoudownwithextrasugarandcalories,buttheyareoftenpoorsourcesofvitamins,mineralsandfiber.
Carbohydrates like whole grains, fruits, vegetables, and dried beans and peas are full of nutrients your body needs.
3-4
Part 3
Whataboutsweetenersthatmanufacturersclaimtobe“natural”,like raw sugar, evaporated cane juice and brown rice syrup? These maybelessrefinedthantablesugar,butthey’restillsugarsthatmanufacturers addtoproducts.Inotherwords,abrownieisstillabrownie, whether it is made with table sugar or brown rice syrup. Your body breaks down all the sugars you eat to glucose, regardless ifit’sfromfruit,milkorcandy.Soinsteadoflookingatthetypeofadded sugar, it’s best to focus on how nutritious the food is overall.
CheckFoodLabelsandIngredientLists
TheNutritionFactsLabelprovidesinformationontotalsugarsperserving, but it won’t tell you if the sugars are naturally present or if they are added sugars. You need to check the ingredients lists on packages to look for added sugars. This can take some detective work,asmanyaddedsugarshavescientificnames.Herearesomecommon addedsugars that you might see in ingredients lists:
BrownSugar CornSyrup Dextrose
Fructose Sugar Lactose
Honey InvertSugar Mannitol
Maltose MaltSyrup RawSugar
Molasses Nectars Syrup
Sucrose HighFructoseCornSyrup
What’sthebestadviceforsugars?
Cut back on foods and drinks that contain added sugars, since they tend to be less nutritious. That means less candy, cakes, cookies, pies, regular soft drinks, fruit punch, ice cream and sweet rolls, to name a few. Also, take it easy on fruit juice. Even though the sugar in juiceisnaturallypresent,there’salotofit.Infact,an8-ounceglassofjuicehasaboutthesameamountofsugarasan8-ounceglassofregularsoda.Ifyoureallywanttoenjoysomenaturalsweetness,have a piece of fruit instead — you’ll get less sugar, fewer calories andmorefiber.

3-5
Carbohydrates, Fats, and Proteins
Activity3.1—AddedSugarsRealityCheckRefertoyourBasicNutritionWorkbookandcompletetheactivity.
Starches
Technically speaking, starches are just simple sugars linked together into longer chains. Our bodies break starches down to simple sugars, andthentoglucoseforenergy.Starchyfoodsincludepotatoes,yams,breads,cornandothergrains.Dietersoftenavoidstarchyfoods, but it’s based on misguided information as many starchy foods are full of nutrients. Potatoes are one of the top sources of potassium, corn is a whole grain food, and breads, cereals and pasta madefromwholegrainflourcontainfiber.Thekeyistoenjoythesefoods in variety and moderation, keeping in mind healthy recipes and cooking methods.
Fiber
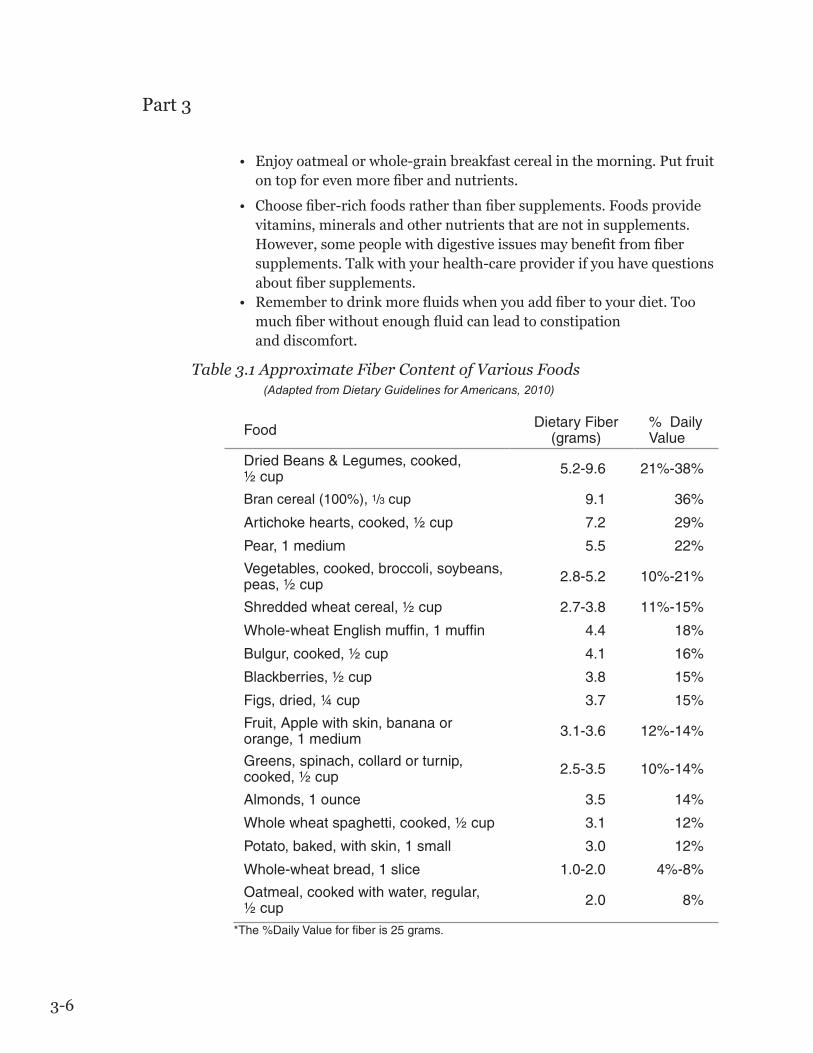
Allplantfoodscontainfiber:grains,fruits,vegetables,beans,andnuts.Ourbodiescannotdigestfiber,whichiswhatmakesitsobeneficial.Fiberactslikeaspongeinthedigestivetract,absorbingwater as it travels. This adds bulk and softness to the stool, helping with problems like constipation, hemorrhoids and diverticulitis. And evenmoreimportantly,fibercanloweryourriskofheartdiseaseand help maintain normal blood glucose levels, lowering your risk ofdiabetes(Higdon,2005).Table3.1showstheamountoffiberindifferentfoods.Mostadultsneedbetween21to38gramsoffibereachday,orabout14gramsforevery1000calories.Herearesuggestionsforaddingfibertoyourdiet:
• Makehalfyourgrainswholegrains.
• Eatwholefruitratherthandrinkingfruitjuice.
• Includeatleasttwovegetableswithyoureveningmeal.
• Preparerawveggiesandstoretheminyourrefrigerator for a quick snack as part of your lunch or to add to a salad. Try carrots, sweet peppers, cucumbers, or celery. Check www.fruitsandveggiesmatter.gov for more ideas.
• Usebeansinsteadofmeatseveraltimesaweek.Driedbeansandpeasarefulloffiber,proteinandothernutrients.
3-6
Part 3
• Enjoyoatmealorwhole-grainbreakfastcerealinthemorning.Putfruitontopforevenmorefiberandnutrients.
• Choosefiber-richfoodsratherthanfibersupplements.Foodsprovidevitamins, minerals and other nutrients that are not in supplements. However,somepeoplewithdigestiveissuesmaybenefitfromfibersupplements. Talk with your health-care provider if you have questions aboutfibersupplements.
• Remembertodrinkmorefluidswhenyouaddfibertoyourdiet.Toomuchfiberwithoutenoughfluidcanleadtoconstipation and discomfort.
Table 3.1 Approximate Fiber Content of Various Foods (Adapted from Dietary Guidelines for Americans, 2010)
Food Dietary Fiber (grams)
% Daily Value
Dried Beans & Legumes, cooked, ½ cup 5.2-9.6 21%-38%
Bran cereal (100%), 1/3 cup 9.1 36%
Artichoke hearts, cooked, ½ cup 7.2 29%
Pear, 1 medium 5.5 22%
Vegetables, cooked, broccoli, soybeans, peas, ½ cup 2.8-5.2 10%-21%
Shredded wheat cereal, ½ cup 2.7-3.8 11%-15%
Whole-wheat English muffin, 1 muffin 4.4 18%
Bulgur, cooked, ½ cup 4.1 16%
Blackberries, ½ cup 3.8 15%
Figs, dried, ¼ cup 3.7 15%
Fruit, Apple with skin, banana or orange, 1 medium 3.1-3.6 12%-14%
Greens, spinach, collard or turnip, cooked, ½ cup 2.5-3.5 10%-14%
Almonds, 1 ounce 3.5 14%
Whole wheat spaghetti, cooked, ½ cup 3.1 12%
Potato, baked, with skin, 1 small 3.0 12%
Whole-wheat bread, 1 slice 1.0-2.0 4%-8%
Oatmeal, cooked with water, regular, ½ cup 2.0 8%
*The %Daily Value for fiber is 25 grams.
3-7
Carbohydrates, Fats, and Proteins
Box 3.2 Whole Grain Basics
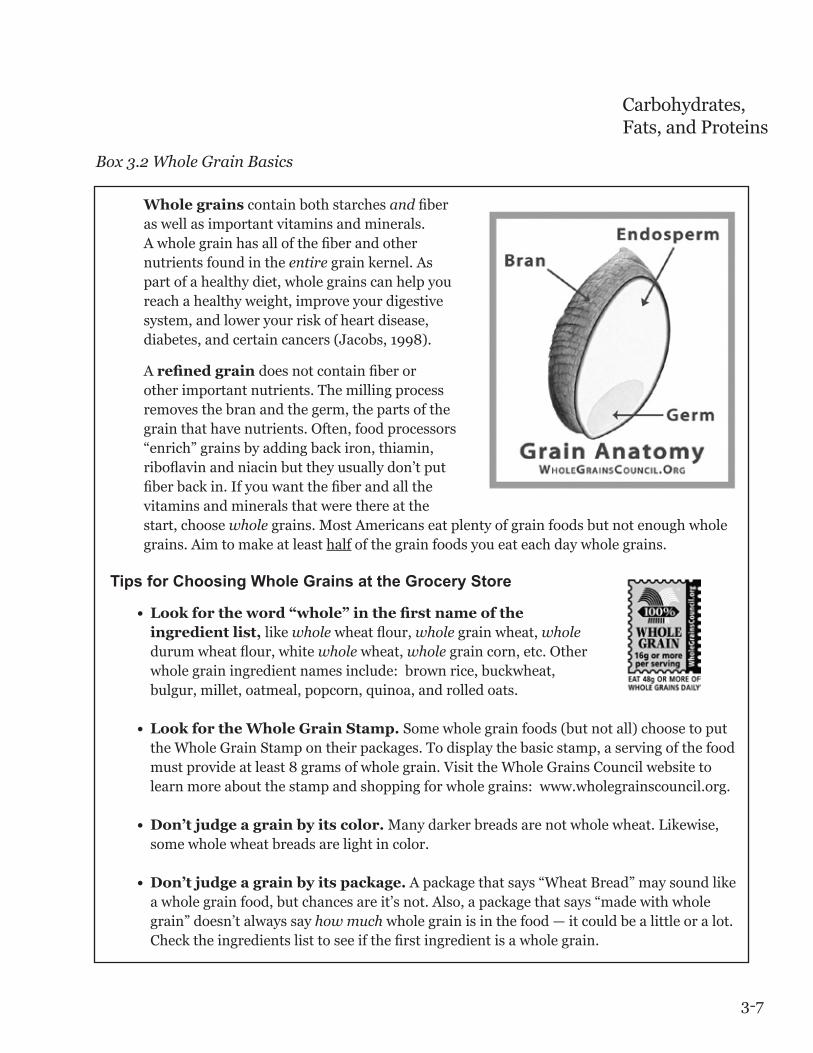
Wholegrains contain both starches andfiberas well as important vitamins and minerals. Awholegrainhasallofthefiberandothernutrients found in the entire grain kernel. As part of a healthy diet, whole grains can help you reach a healthy weight, improve your digestive system, and lower your risk of heart disease, diabetes,andcertaincancers(Jacobs,1998).
A refinedgraindoesnotcontainfiberorother important nutrients. The milling process removes the bran and the germ, the parts of the grain that have nutrients. Often, food processors “enrich”grainsbyaddingbackiron,thiamin,riboflavinandniacinbuttheyusuallydon’tputfiberbackin.Ifyouwantthefiberandallthevitamins and minerals that were there at the start, choose wholegrains.MostAmericanseatplentyofgrainfoodsbutnotenoughwholegrains. Aim to make at least half of the grain foods you eat each day whole grains.
TipsforChoosingWholeGrainsattheGroceryStore
• Lookfortheword“whole”inthefirstnameoftheingredientlist,like wholewheatflour,whole grain wheat, whole durumwheatflour,whitewhole wheat, whole grain corn, etc. Other whole grain ingredient names include: brown rice, buckwheat, bulgur, millet, oatmeal, popcorn, quinoa, and rolled oats.
• LookfortheWholeGrainStamp.Somewholegrainfoods(butnotall)choosetoputtheWholeGrainStampontheirpackages.Todisplaythebasicstamp,aservingofthefoodmustprovideatleast8gramsofwholegrain.VisittheWholeGrainsCouncilwebsitetolearn more about the stamp and shopping for whole grains: www.wholegrainscouncil.org.
• Don’tjudgeagrainbyitscolor.Manydarkerbreadsarenotwholewheat.Likewise,some whole wheat breads are light in color.
• Don’tjudgeagrainbyitspackage.Apackagethatsays“WheatBread”maysoundlikeawholegrainfood,butchancesareit’snot.Also,apackagethatsays“madewithwholegrain”doesn’talwayssayhow much whole grain is in the food — it could be a little or a lot. Checktheingredientslisttoseeifthefirstingredientisawholegrain.

3-8
Part 3
Fats
Fats do more than make our ice cream creamier and our buttered toast tastier. Fats play a major role in cholesterol levels and provide the essential fatty acids our bodies can’t make. Also, they help us absorbthefourfat-solublevitamins,vitaminsA,D,E,andK.Fatsare especially important for brain development and growth in infants and toddlers up to age 2. Each gram of fat has 9 calories that we use for energy.
Soiffatsaresoimportantwhyarehealthexpertsalwaystalkingabouteatinglessfat?SimplyputAmericanseattoomuchofthewrong kinds of fat.It’simportanttoknowaboutthedifferenttypesof fat in foods because some are better for you than others.
HarmfulFats(“SolidFats”)
TheDietaryGuidelinesusetheterm“solidfats”to refer to both saturatedfatsandtransfats.ThetopsourcesofsolidfatsintheU.S.diet are grain-based desserts (cookies, cakes, pies, doughnuts, and granolabars),pizza,cheese,sausage,franks,bacon,ribs,andFrenchfries(USDA,2010b).Americansneedtofindwaystoreducethesefoods and replace them with foods containing healthier fats.
• SaturatedFats –Thesearethe“bad”fatsfoundinanimalfats.Lard,butter,beef,chickenskin,pork,eggyolks,wholemilk,cream,andcheeseareafewexamples.Palmoil,palmkerneloil,andcoconutoilarealsosaturatedfats(Risérus,U.,Willett,W.C,andHu,F.B.,2009).Eatinglargeamountsofsaturatedfatsraisesthe risk for cardiovascular disease and type 2 diabetes. Americans should limit saturated fat to 10 percent of daily calories. Cutting back to 7 percent can lower the risk of heart disease even more (USDA,2010a).
• Transfat– Trans fats occur naturally in certain foods. Food manufacturers can also make trans fat through a process called hydrogenation. Hydrogenation chemically changes liquidoilintosolidfat.Shorteningandmargarinearebothexamplesofhydrogenatedfats(U.S.FoodandDrugAdministration[FDA],2011b).
Transfatenhancesflavorandextendstheshelflifeoffoods,but eating trans fat greatly raises your risk of heart disease.
Large amounts of saturated fats in the diet increase risk for heart disease and type 2 diabetes.

3-9
Carbohydrates, Fats, and Proteins
Specifically,itraisestotalcholesterolandLDLcholesterol,whileloweringthegoodHDL-cholesterol(CDC,2010d).Thegoalistokeep your intake of trans fat as low as possible.
In2006,FDArequiredfoodmakerstolisttransfatontheNutritionFactsLabel.Thefoodindustryhascutbackbutmanyprocessed foods still contain at least small amounts of trans fats. Amounts≤0.5gramsperservingdonothavetoappearontheNutritionFactsLabel,solabelreadingcanbetricky.Evenifthefood does not appear to have any trans fats, small amounts eaten inseveralservingscanaddup.Savvyconsumersshouldreadtheingredientslistandlookforthingslike“shortening”or“partially-hydrogenatedvegetableoil,”astheseareindicatorsthatthefoodcontains trans fat. Trans fats are also in some margarines, snack foods,andprepareddesserts(FDA,2003).
HealthierFats(“Oils”)
Incontrasttosolidfats,oilsofferanumberofnutritionalbenefits.Byreplacingharmfulsolidfatswithmoderateamountsofhealthieroils,Americanscanlowertheirriskforheartdisease(MayoFoundation,2011a).Studiesshowthatreplacingsolidfatswithoils can also reduce the risk of Type 2 diabetes. Oils are present in vegetables,nuts,seeds,fattyfish,olives,andavocados.Therearetwomain types of unsaturated oils:
• Monounsaturatedfats–Sourcesincludeoliveoil,canolaoil,peanut oil, sesame oil, avocados, olives, many nuts, nut butters, andseeds.ThetraditionalMediterranean-styleeatingpatternishigh in monounsaturated fats and people who follow this eating patternhavealowerriskforheartdisease(USDA,2010a).
• Polyunsaturatedfats –Mostpolyunsaturatedfatsarepresentinplant-basedfoodsandoils.Examplesincludesoybeanoil,cornoil,andsaffloweroil,plusmanynutsandseeds.Fattyfishprovidea special group of polyunsaturated fats called omega-3fats. Omega-3 fats from seafood appear to lower heart disease risk and insomestudieslowerbloodpressure.Beawarethatonlycertaintypesoffishprovideomega-3fats.Thebestsourcesofomega-3sinclude salmon, certain types of tuna and mackerel, herring and freshwater trout.
3-10
Part 3
Activity3.2—AreYouGettingtheRightKindsofFats?RefertoyourBasicNutritionWorkbookandcompletetheactivity.
Cholesterol
Cholesterolisawaxyfat-likesubstancefoundineverycellinthebody.Itisimportantforcellstructureandthemetabolismoffat-soluble vitamins. Cholesterol is found in all foods of animal origin, but you can’t see it or taste it. Plant products do not contain cholesterol. Our bodies can make all the cholesterol we need, so wedon’tneedtoconsumeany.ButmanyAmericansregularlyeatcholesterol daily — from foods like eggs, chicken, beef and burgers. Womeneatanaverageof240milligrams(mg)ofcholesterolperday,whilemengetanaverageof350mgperday(USDA,2010a).
Dietarycholesterol can raise bloodcholesterol levels in some people.Butovertheyears,researchershavelearnedthatsaturatedand trans fats are much bigger culprits when it comes to raising blood cholesterol and increasing risk for heart disease. The 2010 DietaryGuidelinessaytoeatlessthat300mgperdayofdietarycholesterol. Table 3.2 lists the cholesterol content of various foods:
Table 3.2 Approximate Cholesterol Content of Various Foods (USDA, 2010c)
Food Cholesterol (mg)
Liver (3 ounce cooked) 337 mg
Egg (1 yolk) 184 mg
Ground Beef (3 ounce cooked) 76 mg
Chicken (3 ounce cooked) 72 mg
Cheddar Cheese (1 ounce) 30 mg
Whole Milk (1 cup) 24 mg
Bacon (2 slices) 18 mg
Lard (1 tablespoon) 12 mg
Skim Milk 5 mg
3-11
Carbohydrates, Fats, and Proteins
DietaryRecommendationsforFats
TheInstituteofMedicinerecommendsthatadultsget20-35percentof their calories from fat, and most fat should be in the form of unsaturatedoils(USDA,2010a).Americansshouldlimittheirintakeofsaturatedfattolessthan10percentofcalories.Forexample,thiswould be about 20 grams of saturated fat for a person following an 1,800-caloriediet.Reducingsaturatedfattolessthan7percentofcalories would be even better.
Here are some tips:
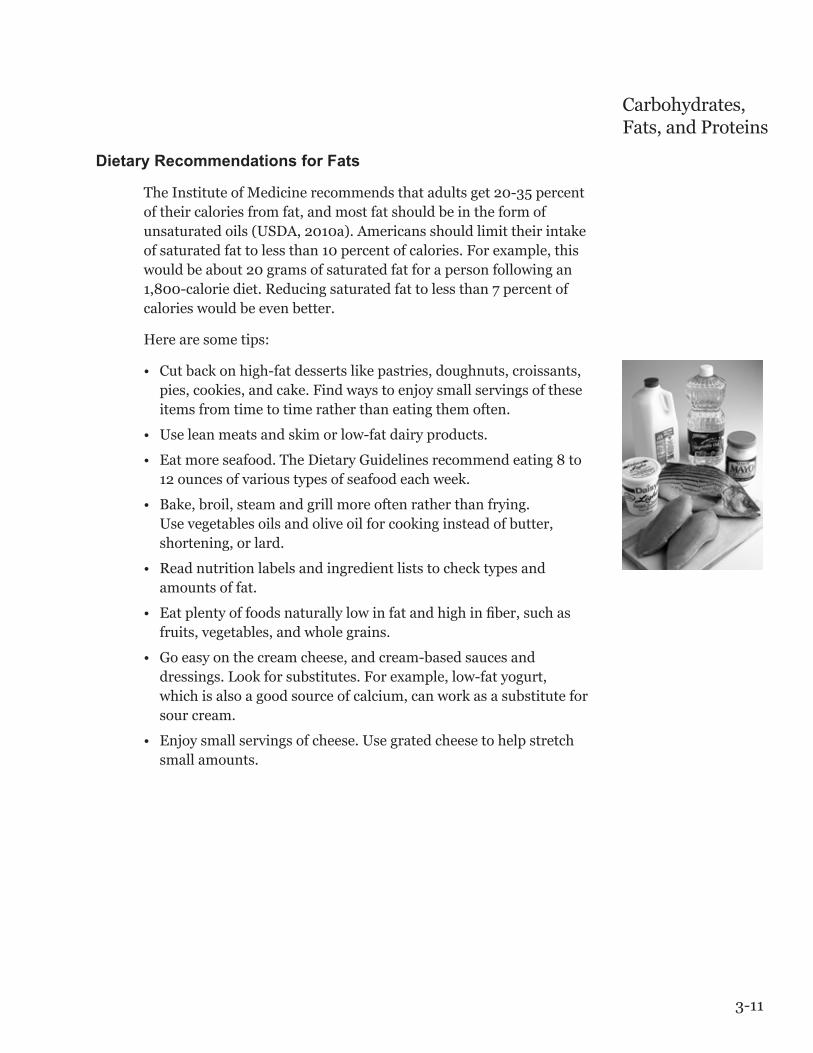
• Cutbackonhigh-fatdessertslikepastries,doughnuts,croissants,pies, cookies, and cake. Find ways to enjoy small servings of these items from time to time rather than eating them often.
• Useleanmeatsandskimorlow-fatdairyproducts.
• Eatmoreseafood.TheDietaryGuidelinesrecommendeating8to12 ounces of various types of seafood each week.
• Bake,broil,steamandgrillmoreoftenratherthanfrying.Usevegetablesoilsandoliveoilforcookinginsteadofbutter,shortening, or lard.
• Readnutritionlabelsandingredientliststochecktypesandamounts of fat.
• Eatplentyoffoodsnaturallylowinfatandhighinfiber,suchasfruits, vegetables, and whole grains.
• Goeasyonthecreamcheese,andcream-basedsaucesanddressings.Lookforsubstitutes.Forexample,low-fatyogurt, which is also a good source of calcium, can work as a substitute for sour cream.
• Enjoysmallservingsofcheese.Usegratedcheesetohelpstretchsmall amounts.
3-12
Part 3
Proteins
Asachild,youprobablylearnedthatproteinwouldhelpyou“growuptobebigandstrong.”Andthat’snottoofaroff.Ourbodiesbreakdown and rebuild tissue all the time, so we need a steady supply of protein to build new tissue. Protein is especially important during periods of rapid growth, like during childhood and pregnancy.
Protein is in many of the foods we eat each day including meats, poultry,andfish,drybeansandpeas,tofu,eggs,nuts,seeds,milkandmilkproducts,andbreadsandcereals.Specialtyhigh-proteinproducts have been a recent fad, suggesting that we need dietary shakesorproteinbarstostaystrongandhealthy.Butthefactis,most of us get more than enough protein from food sources on a daily basis.
Aminoacids are the building blocks of protein. They combine in different ways to create thousands of proteins. Our bodies can make most of these amino acids, but there are nine essentialamino acids that we can’t make. They are named as such because it’s essential that we get them from our food supply. Animal products, like meat, milk, and milk products, have all the essential amino acids in the amounts that our bodies need, so they’re known as completeproteins.Mostplantfoodsdon’thaveenoughofallessentialaminoacids, so scientists classify them as incompleteproteins.
FoodSourcesofProtein
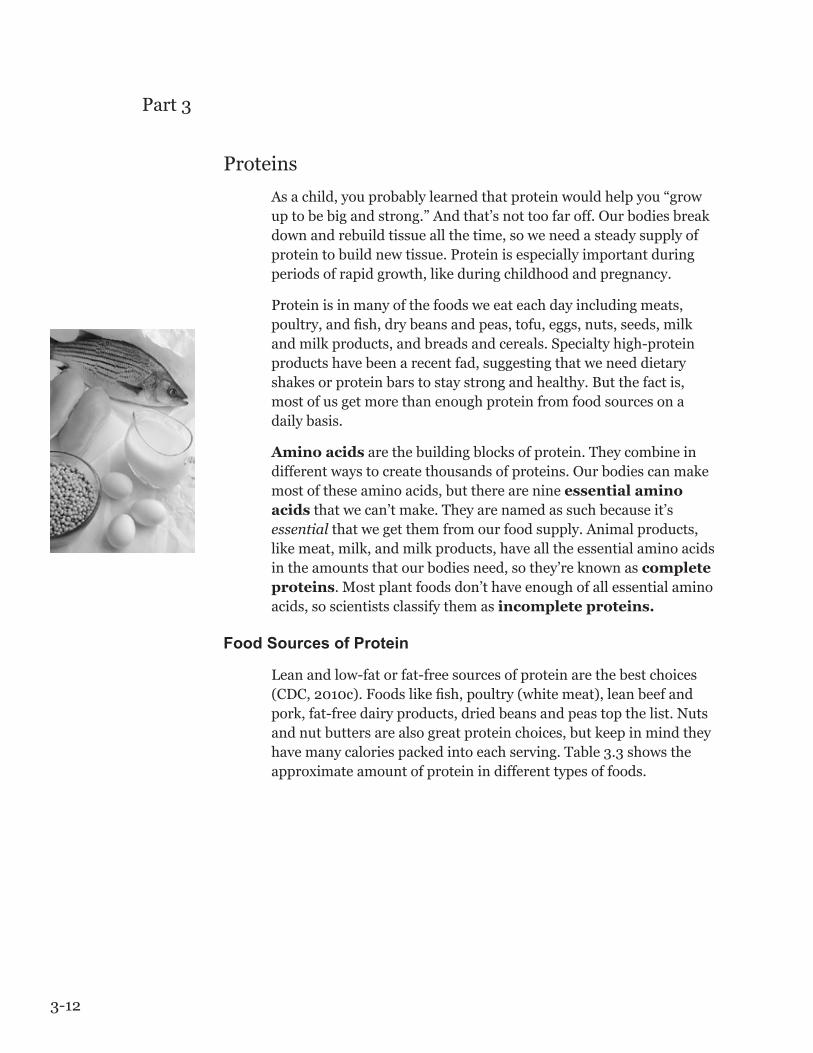
Leanandlow-fatorfat-freesourcesofproteinarethebestchoices(CDC,2010c).Foodslikefish,poultry(whitemeat),leanbeefandpork, fat-free dairy products, dried beans and peas top the list. Nuts and nut butters are also great protein choices, but keep in mind they have many calories packed into each serving. Table 3.3 shows the approximateamountofproteinindifferenttypesoffoods.
3-13
Carbohydrates, Fats, and Proteins
Table 3.3 Approximate Protein Content of Various Foods
Food Grams of Protein
3 ounces meat, fish, poultry 21 grams
3 ounces tofu, firm 13 grams
8 ounces low-fat yogurt 11 grams
8 ounces milk 8 grams
½ cup cooked beans 8 grams
2 tablespoon peanut butter 8 grams
1 ounce cheese 7 grams
¼ cup nuts 7 grams
1 large egg 6 grams
½ cup cereal 3 grams
1 slice bread 2 grams
½ cup grains/pasta, cooked 2 grams
½ cup non-starchy vegetables, cooked 2 grams
Fruits 0 grams
Oils 0 grams
(Adapted from Wheeler et al, 2008)
MeetingProteinNeeds
Forhealthyadults,theRecommendedDietaryAllowanceforproteinis 46gramsforwomen and 56gramsformen.Becauseproteinis widely available in many foods most Americans meet their protein requirements without any problem.
Activity3.3—Howmuchproteindidyoueatyesterday?RefertoyourBasicNutritionWorkbookandcompletetheactivity.
A 3½ ounce boneless chicken breast has about 30 grams of protein; more than half of the protein most adults need in a day (UDSA, 2010c).
3-14
Part 3
Box 3.3 FAQs About Protein
Q:CanIgetalltheproteinIneedbyeatingonlyplantfoods?
A: Yes! It’s easy to include different plant proteins in your diet so that you get all the amino acids you need. And these days, there are more vegetarian choices than ever – including soybeans, soymilk, tofu, veggie burgers, amaranth, and quinoa – just to name a few. Be sure to include plenty of whole grains, dried beans and peas, and vegetables.
Q:WhathappensifIeattoomuchprotein?
A: Most people eat more protein than they need without harmful effects. But some experts warn that eating too much protein over a long period of time can strain the kidneys. That’s why people with certain kidney diseases often follow a low-protein diet. Also, be aware that protein-rich foods like cheeses, whole eggs, and high-fat cuts of meat can add a lot of saturated fat to your diet, which can raise your risk for heart disease.
Q:Whataboutallthenewfoodproductswithaddedprotein?
A: Many special high-protein foods are processed items aimed at dieters who have hopped on the high-protein bandwagon. Many of these items are pricey formulated bars and shakes that can contain extra sodium, added sugars, and unwanted solid fats. Healthier, tastier, and less expensive options would include natural sources of protein like nuts, peanut butter, lean meats, and low-fat dairy products. And again, remember that most people can easily meet their daily protein needs without special foods or supplements.

3-15
Carbohydrates, Fats, and Proteins
DietaryRecommendationsforProteins
Ratherthanfocusingonproteinintake,chooseanoverallhealthydiet with reasonable portions of lean protein as well as other nutrients.Herearesomespecifictips:
• Don’tgooverboardonmeatandpoultry.Includemore meatless meals.
• Whenyoudoeatmeat,thinkofitasaflavoringoringredient.Stretchsmallerportionsbycuttingupmeatsandusingtheminmixeddishesandwithwholegrains.Chooseleanermeatsandpoultry and trim away skin and visible fat.
• Eatmoredriedbeansandpeas—beans,chickpeas,lentilsandsoybeans are great sources of protein. What’s more, they’re practicallyfat-freeandloadedwithfiberandothergreatnutrients.
• Enjoya¼cupservingofnutsasasnackorusenutsasaningredient in salads and other dishes. Nuts are great sources of protein, plus they contain healthy oils.
• Chooselow-fatorfat-freedairyproducts.
• Beadventurouswithsourcesofhigh-qualityplantproteinlikesoybeans, quinoa and amaranth. These foods are making their way into restaurants and grocery stores, so give them a try.
• Checkwithyourhealthcareproviderifyou’rethinkingaboutfollowing a high-protein diet for any reason.
Part3Test:ThisistheendofPart3.Gotoyour BasicNutritionWorkbooktocompletePart3test questions.

4-1
Our bodies need at least 13 vitamins, 16 minerals, and plenty of water to function properly. This part of the module covers vitamin A, vitamin C, vitamin D, folate, calcium, iron, sodium, potassium, and water.
Objectives
After reading this section you’ll be able to:
• Recognizethemajorfunctionsofvitamins,mineralsandwater.
• Exhibitknowledgeaboutvitaminandmineralbasics:identifydailyrequirements, good food sources, and signs and symptoms ofdeficiency.
• Recognizegroupsatincreasedriskforvitaminormineralimbalances.
• Understandwaterneedsandsignsofdehydrationandoverhydration.
Part 4Vitamins, Minerals, and Water
4-2
Part 4
Vitamin and Mineral Basics
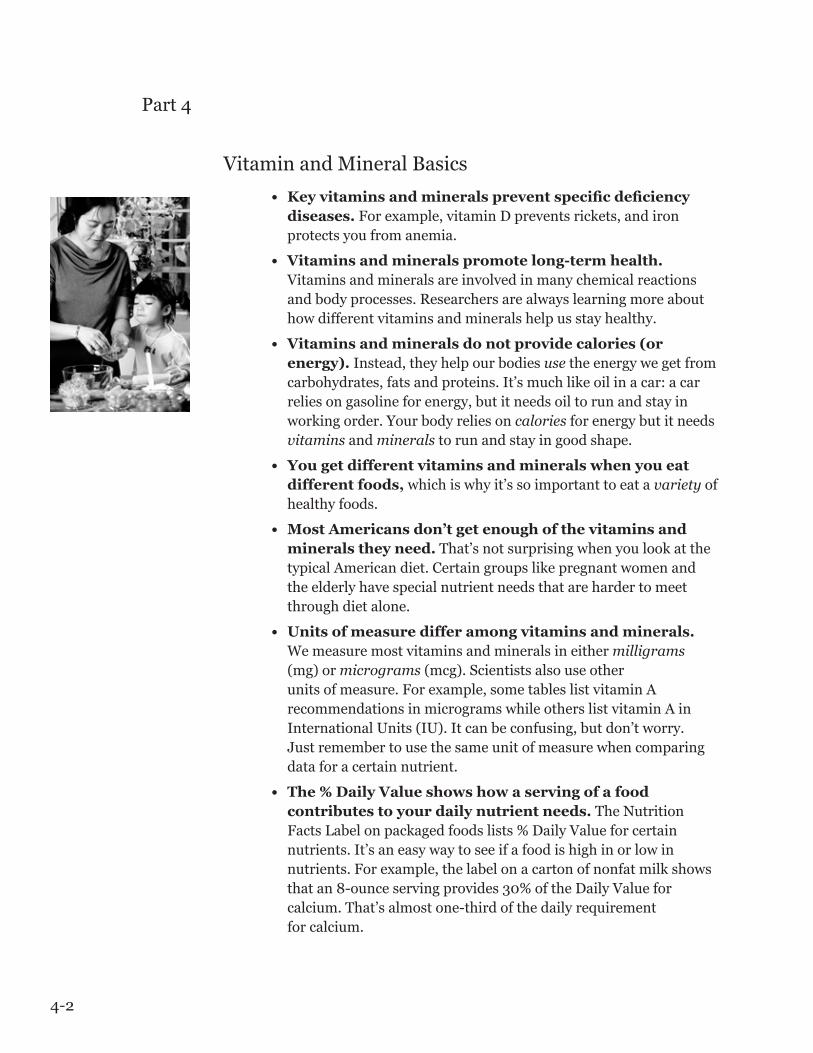
• Keyvitaminsandmineralspreventspecificdeficiencydiseases.Forexample,vitaminDpreventsrickets,andironprotects you from anemia.
• Vitaminsandmineralspromotelong-termhealth. Vitamins and minerals are involved in many chemical reactions andbodyprocesses.Researchersarealwayslearningmoreabouthow different vitamins and minerals help us stay healthy.
• Vitaminsandmineralsdonotprovidecalories(orenergy).Instead, they help our bodies use the energy we get from carbohydrates,fatsandproteins.It’smuchlikeoilinacar:acarrelies on gasoline for energy, but it needs oil to run and stay in workingorder.Yourbodyreliesoncalories for energy but it needs vitamins and minerals to run and stay in good shape.
• Yougetdifferentvitaminsandmineralswhenyoueatdifferentfoods,which is why it’s so important to eat a variety of healthy foods.
• MostAmericansdon’tgetenoughofthevitaminsandmineralstheyneed.That’snotsurprisingwhenyoulookatthetypicalAmericandiet.Certaingroupslikepregnantwomenandthe elderly have special nutrient needs that are harder to meet through diet alone.
• Unitsofmeasuredifferamongvitaminsandminerals.We measure most vitamins and minerals in either milligrams (mg) or micrograms (mcg). Scientists also use other unitsofmeasure.Forexample,sometableslistvitaminArecommendations in micrograms while others list vitamin A in InternationalUnits(IU).Itcanbeconfusing,butdon’tworry.Just remember to use the same unit of measure when comparing data for a certain nutrient.
• The%DailyValueshowshowaservingofafoodcontributestoyourdailynutrientneeds.The Nutrition FactsLabelonpackagedfoodslists%DailyValueforcertainnutrients. It’s an easy way to see if a food is high in or low in nutrients.Forexample,thelabelonacartonofnonfatmilkshowsthatan8-ounceservingprovides30%oftheDailyValueforcalcium. That’s almost one-third of the daily requirement for calcium.

4-3
Vitamins, Minerals, and Water Vitamin A
We need vitaminAtoresistinfectionandtokeepoureyes,skin,and internal organs healthy. Studies have shown that diets high in vitamin-Arichfruitsandvegetablesmaybelinkedtoalowerrateofcertaincancers(NationalInstitutesofHealthOfficeofDietarySupplements, [NIH ODS], 2006).
VitaminADeficiency—AseverevitaminAdeficiencycancauseblindness,poorgrowth,problemsfightinginfections,poortoothformation,anddry,scalyskin.SeriousdeficienciesarerareintheU.S.,butsomepeople’sdietsarelowenoughinvitaminAthattheymayhavelessserioussymptoms,likeslowbonedevelopment,slowgrowth,poornightvision,andahigherriskofinfections.Groupswho might not get enough vitamin A include children who are at or below poverty level and people who don’t eat vegetables (NIH ODS, 2006).
Table 4.1 lists recommended amounts for vitamin A in both InternationalUnits(IU)andmicrogramsofRetinolActivityEquivalents(RAE).Beawarethatmanyfoodtableslistvitamin AcontentinIUs.
FoodSourcesofVitaminA— We get vitamin A from both plant and animal foods. Animal sources include eggs, liver, butter, margarine,fortifiedmilk,andcheese.PlantsourcesofvitaminAincludetheyellowpigmentsofplantslikecarrots,sweetpotatoes,pumpkins,cantaloupes,tomatoes,redpeppers,apricots,mango,papaya,aswellasdarkgreenvegetableslikespinachandkale.
DangersoftooMuchVitaminAfromSupplements— HighdosesofvitaminAfromsupplementscanbetoxic,leadingto serious birth defects, liver damage, reduced bone strength, and central nervous system disorders. But don’t worry about getting too much vitamin A from fruits and vegetables. Large amounts of this formofvitaminAcanturntheskinyellow,butit’snotdangerous (NIH ODS, 2006).
GoodTipsforincludingVitaminA
• Includemorefreshfruitsandvegetablesasroutinesnacks.
• SetagoaltoeatatleastonevitaminA-richfruitorvegetable every day.

4-4
Part 4
• Makeyourmealscolorful.Includedarkgreenandorangevegetables and fruits.
• RelyonfoodsnotsupplementsforvitaminA.
Table 4.1 Daily Vitamin A Recommendations (NIH ODS, 2006)
Age Group
Daily Vitamin A Recommendation
1-3 years 300 mcg* (1000 IU**)
4-8 years 400 mcg (1320 IU)
9-13 years 600 mcg (2000 IU)
14 years and older, Males 900 mcg (3000 IU)
14 years and older, Females 700 mcg (2310 IU)
Pregnant, 14 to 18 years 750 mcg (2500 IU)
Pregnant, 19 years and older 770 mcg (2565 IU)
Breastfeeding, 14 to 18 years 1200 mcg (4000 IU)
Breastfeeding, 19 years and older 1300 mcg (4300 IU)
* micrograms of Retinol Activity Equivalents (RAE) ** International Units (1 mcg RAE = 3.3 IU)
Table 4.2 Approximate Vitamin A Content of Various Foods (USDA, 2010c)
Food
Vitamin A (IU)*
% Daily Value**
Sweet potato cooked, 1 medium (5” long) 21,900 440%
Carrots, boiled, ½ cup sliced 13,286 265%
Spinach or Kale, frozen, boiled, ½ cup 9,500 190%
Vegetable soup, canned, 1 cup 5,820 115%
Cantaloupe, 1 cup cubes 5,411 110%
Apricots with skin, juice pack, ½ cup 2,063 40%
Papaya, 1 cup cubed 1,532 30%
Mango, 1 cup sliced 1,262 25%
Milk, fortified skim, 1 cup 500 10%
* U = International Units ** DV = Daily Value. The DV for vitamin A is 5,000 IU for healthy adults.

4-5
Vitamins, Minerals, and Water
Vitamin D
VitaminD helps build strong bones and teeth and plays an importantroleinpreventingbonediseaseslikerickets (NIH, ODS, 2011b).RicketsoccursinchildrenwhohaveaverylowvitaminDintake.Thediseasecausessoft,weakbones,whichcanleadtoshortstature,bowedlegs,andotherskeletaldeformities.VitaminDisalsoimportantforbonesinadulthood,asitworksinconjunctionwithcalcium to prevent osteoporosis. We will discuss osteoporosis in more detail in the calcium section.
In addition to bone health, vitamin D is important for the nervous system, muscles, and immune system. There’s a lot of interest in vitaminDanditspossibleroleinreducingriskforheartdisease,diabetes,andcertaincancers.Itwillbesometimebeforeweknowthe results of current research, but for now, be aware that adequate vitaminDiskeyforgoodhealth(NIHODS,2011b).
VitaminDStatusinAmericans—Vitamin D is currently a hot topicnotonlybecauseofthevitamin’spossiblebenefitsbutalsobecause many Americans apparently have low blood levels of vitamin D. The most recent national data from 2001 to 2006 shows that about one-third of Americans have vitamin D levels that are either loworverylow(Lookeretal.,2011).Thisisprobablydueinpart,tolesssunexposure(Ginde,Liu,&Camargo,2009).
The“SunshineVitamin”—TheskinmakesvitaminDwhenit’sexposedtothesun,andsunlighthasbeenamajorsourceofvitaminD production for humans until recent years. These days, many people wisely use sunscreen or cover up when they go outside, so they’re getting less vitamin D from the sun. Also, people living in areas of heavy pollution tend to get less sunshine and older adults andpeoplewithdarkerskinnaturallymakelessvitaminD(NIHODS, 2011b). Since fewer people rely on sunshine for vitamin D, there is a greater focus on vitamin D supplements and food sources.
FoodSourcesofVitaminD— Be aware that vitamin D is not naturally present in many foods. The few good sources include fatty fishlikesalmon,tuna,andmackerel.Therearesmalleramountsinliver,cheese,butter,andeggyolks.ManyfoodsarefortifiedwithvitaminDincludingmanybrandsofmilk,yogurt,breakfastcereals, orange juice, margarine, and soy beverages. Some brands of mushrooms treated with ultraviolet light provide a full day’s worth of vitamin D (NIH ODS, 2011b).

4-6
Part 4
Table 4.3 Daily Vitamin D Recommendations (NIH ODS, 2011b)
Age Group
Daily Vitamin D Recommendation
Birth to 12 months 10 mcg (400 IU)*
1-13 years 15 mcg (600 IU)
14-18 years 15 mcg (600 IU)
19-70 years 15 mcg (600 IU)
71 years and older 20 mcg (800 IU)
Pregnant and breastfeeding women 20 mcg (800 IU)
* International Units
Table 4.4 Approximate Vitamin D Content of Various Foods (USDA, 2010c)
Food
Vitamin D (IU)*
% Daily Value**
Salmon (Sockeye), cooked, 3 ounces 447 112%
Mushrooms exposed to ultraviolet light (check labels)
400 100%
Mackerel, cooked, 3 ounces 388 97%
Tuna fish, canned in water, drained, 3 ounces
154 39%
Milk, nonfat, reduced fat, or whole, vitamin D-fortified, 1 cup
120 30%
Orange juice fortified with vitamin D, 1 cup (check labels)
100 25%
Yogurt, fortified with vitamin D, 6 ounces (some may have more)
80 20%
Margarine, fortified, 1 tablespoon 60 15%
Ready-to-eat cereal, fortified with vitamin D, ¾ -1 cup (check labels)
40 10%
Egg, 1 whole (vitamin D is found in yolk) 41 10%
* mg = milligrams ** DV = Daily Value. The DV for vitamin D is 400 IU for healthy adults.

4-7
Vitamins, Minerals, and Water Vitamin C
VitaminC(ascorbicacid)helpsthebodyfightoffinfections,heals wounds, and plays an important role in growth and repair of tissues. Vitamin C also enhances iron absorption, so it’s a good idea to combine iron-rich foods with foods high in vitamin C. Vitamin C is one of the common antioxidantsinourdiet.Antioxidantsaresubstancesthatmayprotectthebody’scellsagainstoxidativedamageandpossiblyhelplowertheriskofheartdisease,cancer,andother diseases (National Center for Complementary and Alternative Medicine, 2011).
VitaminCDeficiency—AseverevitaminCdeficiencycanleadtoscurvy, a disease that once plagued sailors who were on long voyages without vitamin C-rich fresh fruits or vegetables. Symptoms included slow wound healing, easy bruising, swollen and painful joints, dry andscalyskinandbleedinggums.ScurvyisrareintheU.S.today,butmanygroupsareatriskfornotmeetingtheirdailyneedsforvitaminC,includingsmokers,alcoholics,andthosewithlowfruitandvegetableintake(NIHODS,2010).
FoodSourcesofVitaminC—Fruits and vegetables are the best sources of vitamin C, especially red and green peppers, citrus fruits andjuices,broccoli,kiwi,Brusselssprouts,tomatoes,andtomatojuice. Heat, light, and air can destroy vitamin C, so the vitamin content depends on if your food is raw, steamed, boiled, freshly harvested or previously stored.
VitaminCandtheCommonCold—Youmayhaveheard claimsthattakingsupplementalvitaminCcanpreventorcurethecommoncold.ResearchsuggeststhattakingvitaminConaregularbasis does not prevent the common cold in the general population, buttakingitbeforetheonsetofacoldmight shorten the duration andlessenthesymptomsinsomepeople.Ontheotherhand,takingextravitaminCafter the onset of cold symptoms does not seem tohelp(NIH,ODS,2010).Sothenexttimeyou’resnifflingandsneezing,youmaywanttothinktwicebeforespendingyourmoneyon vitamin C supplements.

4-8
Part 4
VitaminCTips—Try eating at least one vitamin C-rich food every day.SincestorageandcookingreducevitaminClevels,followthesetips to get the most vitamin C from your foods:
• Chooseproducethatlooksfresh,notwiltedorsunkenin.
• Buyproduceinseasonorgrowyourownathome.
• Includerawfruitsandvegetablesinyourmeals.
• Avoidsoakingvegetablesinwater.Steamvegetablesandcookthemquickly.
• Cookpotatoesintheirskins.
• Coverandrefrigeratejuice.
Table 4.5 Daily Vitamin C Recommendations (NIH ODS, 2010)
Age Group
Daily Vitamin C Recommendation
Birth to 6 months 40 mg*
7-12 months 50 mg
1-3 years 15 mg
4-8 years 25 mg
9-13 years 45 mg
14-18 years Females: 65 mg Males: 75 mg
19 years and older Females: 75 mg Males: 90 mg
Pregnancy: 14-18 years 80 mg
Pregnancy: 19 years and older 85 mg
Breastfeeding: 14-18 years 115 mg
Breastfeeding: 19 years and older 120 mg
Smokers Smokers need an additional 35 mg/day more vitamin C
than non-smokers
* mg = milligrams
4-9
Vitamins, Minerals, and Water
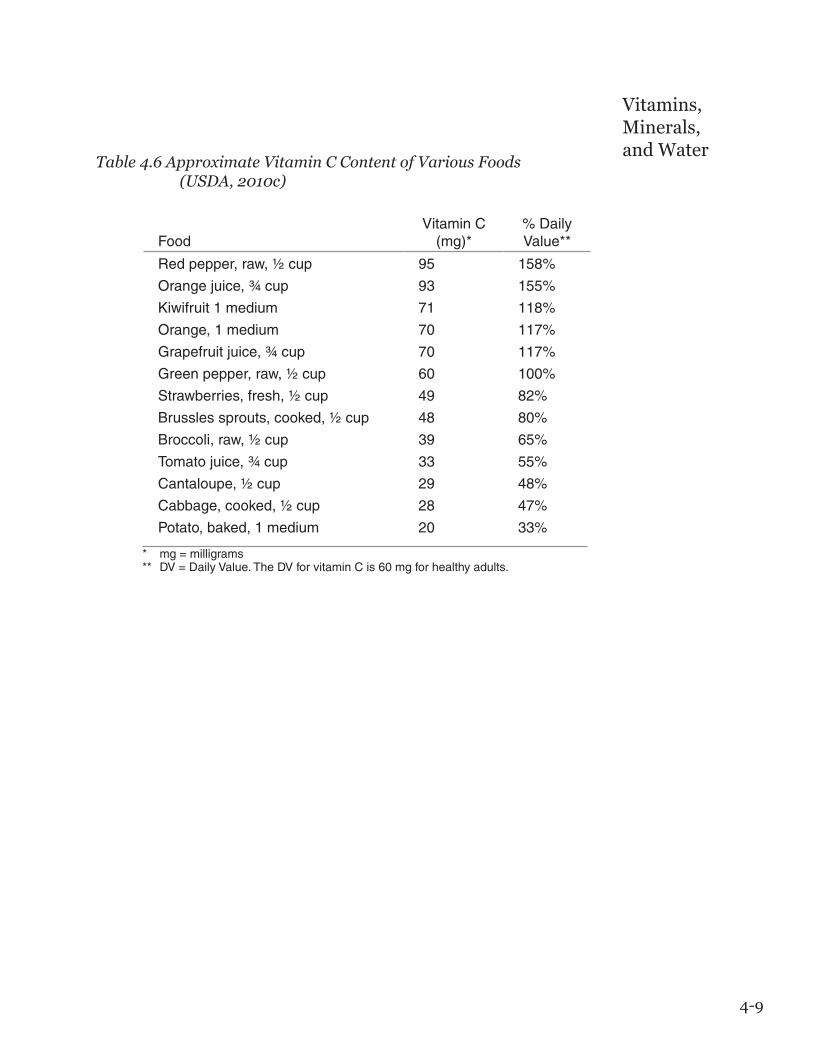
Table 4.6 Approximate Vitamin C Content of Various Foods (USDA, 2010c)
Food
Vitamin C (mg)*
% Daily Value**
Red pepper, raw, ½ cup 95 158%
Orange juice, ¾ cup 93 155%
Kiwifruit 1 medium 71 118%
Orange, 1 medium 70 117%
Grapefruit juice, ¾ cup 70 117%
Green pepper, raw, ½ cup 60 100%
Strawberries, fresh, ½ cup 49 82%
Brussles sprouts, cooked, ½ cup 48 80%
Broccoli, raw, ½ cup 39 65%
Tomato juice, ¾ cup 33 55%
Cantaloupe, ½ cup 29 48%
Cabbage, cooked, ½ cup 28 47%
Potato, baked, 1 medium 20 33%
* mg = milligrams ** DV = Daily Value. The DV for vitamin C is 60 mg for healthy adults.

4-10
Part 4
Folate (and Folic Acid)
The body uses folate to create new cells, so this is an important nutrientduringtimesofrapidgrowth,likepregnancyandinfancy(NIHODS,2009).FolategetsitsnamefromtheLatinwordfolium, meaning leaf. Not surprisingly, green leafy vegetables are good sources of folate. Folicacid is the synthetic form used in supplementsandfoodslikecereals,breadsandgrainproducts.
WIC puts a great deal of effort into teaching women about folic acid becausethisvitaminreducestheriskofneuraltubedefects,agroupofseriousbirthdefects.Thebenefitsoffolicacidbecameclearinthemid-1990swhenfoodcompaniesbeganaddingfolicacidtobreads,cereals, and other grain products. As a result, the prevalence of neuraltubedefectsdroppedby36%(Corderoetal.,2010).
Thekeyistogetenoughfolicacidduringthefirst30daysofpregnancy,atimewhenmanywomendon’tevenknowtheyarepregnant.That’swhyexpertsrecommendthatwomenwhocouldbecomepregnantget400mcgoffolicacidperdayfromfortifiedfoods and/or dietary supplements, in addition to eating foods rich in folate(NIH,ODS,2009).Formoreinformationonthistopic,refertoTexasWIC’sWomen’s Health Module.
BestSourcesofFolateandFolicAcid— Leafy green vegetables, likespinachandturnipgreens,driedbeans,peas,citrusfruits,andjuice are all natural sources of folate. The best sources of folic acid arefortifiedbreakfastcerealsandgrains.

4-11
Vitamins, Minerals, and Water
Table 4.7 Daily Folate Recommendation (NIH ODS, 2009)
Age Group
Daily Folate Recommendation
1-3 years 150 mcg*
4-8 years 200 mcg
9-13 years 300 mcg
14-18 years 400 mcg
19 years and older 400 mcg
Pregnancy: 14 years and older 600 mcg
Breastfeeding: 14 years and older 500 mcg
* listed in micrograms of Dietary Folate Equivalents (DFE), 1 DFE = 1 mcg food folate = 0.6 mcg folic acid from supplements and fortified foods.
Table 4.8 Approximate Folate and Folic Acid Content of Various Foods (USDA, 2010c)
Food
Folate or Folic Acid (mcg)*
% Daily Value**
Breakfast cereals, fortified with 100% of the DV, ¾ cup***
400 100%
Black-eyed peas, cooked, boiled, ½ cup 105 25%
Spinach, frozen, cooked, boiled, ½ cup 100 25%
Great Northern beans, boiled, ½ cup 90 20%
Asparagus, boiled, 4 spears 85 20%
Rice, white, parboiled, enriched, cooked, ½ cup***
65 15%
Spinach, raw, 1 cup 60 15%
Broccoli, raw, 2 spears (each 5 inches long)
45 10%
Avocado, raw, all varieties, sliced, ½ cup 45 10%
Lettuce, Romaine, shredded, ½ cup 40 10%
Orange juice, 6 ounces 35 10%
* listed in micrograms of Dietary Folate Equivalents (DFE), 1 DFE = 1 mcg food folate = 0.6 mcg folic acid from supplements and fortified foods ** DV = Daily Value. The DV for folate is 400 micrograms for healthy adults. *** These items are fortified with folic acid.

4-12
Part 4
Calcium
Calciumisimportantforbonehealth.Yourbonesareinacontinuousstateofchange—theyconstantlytakeupcalciumandreleaseitbackintotheblood.Asyourbodyusesupcalcium,youneed to replace it by eating more calcium-rich foods. If you don’t eat enough calcium, bones can become porous and fragile. But there’s moretocalciumthanjustkeepingbonesstrong.Calciumisalsoimportantforbloodclotting,stimulatingnerves,keepingyourbloodpressure normal, helping muscles contract, and maintaining your heartbeat (NIH ODS, 2011a).
Buildingandkeepingstrongbonesthroughoutlife—The body forms most of its bone mass during the childhood and teenage years, so children and teenagers need plenty of calcium. After age 20, the bones quit growing, but most people continue to form bone mass until about age 30. At that point, the bones start to lose more calciumthantheygain,aprocesswhichslowlyweakenstheskeleton.Fortunately, most people can prevent this bone loss by getting enoughcalcium,vitaminD,andexercise,andbyavoidingtobaccoandexcessivealcohol(NIHOsteoporosisandRelatedBoneDiseasesNationalResourceCenter,2009).
In later adulthood, osteoporosis can develop if there’s a long historyofpoorcalciumintakeand/orotherriskfactors.Apersonwithosteoporosishasporousandbrittlebones,andahighriskofbreakingbones.Patientscandevelopahumpedbackasthebonesofthespineshrink.Theriskofosteoporosisincreaseswith:
• Beingawoman
• Earlymenopause
• Afamilyhistoryofosteoporosis
• BeingCaucasianorAsianrace
• Beingunderweight
• Smokingcigarettes
• Alcoholabuse
• Asedentarylifestyle
• Averylowintakeofdietarycalcium
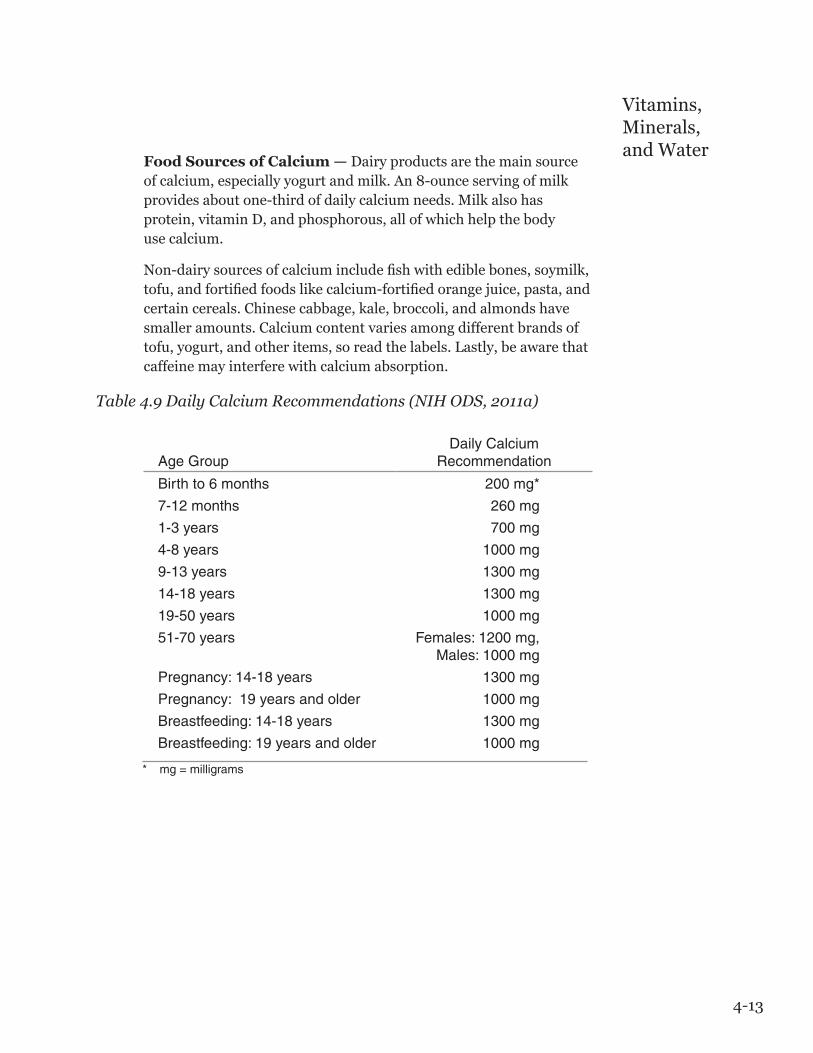
4-13
Vitamins, Minerals, and Water
FoodSourcesofCalcium—Dairy products are the main source ofcalcium,especiallyyogurtandmilk.An8-ounceservingofmilkprovidesaboutone-thirdofdailycalciumneeds.Milkalsohasprotein, vitamin D, and phosphorous, all of which help the body use calcium.
Non-dairysourcesofcalciumincludefishwithediblebones,soymilk,tofu,andfortifiedfoodslikecalcium-fortifiedorangejuice,pasta,andcertaincereals.Chinesecabbage,kale,broccoli,andalmondshavesmaller amounts. Calcium content varies among different brands of tofu, yogurt, and other items, so read the labels. Lastly, be aware that caffeine may interfere with calcium absorption.
Table 4.9 Daily Calcium Recommendations (NIH ODS, 2011a)
Age Group
Daily Calcium Recommendation
Birth to 6 months 200 mg*
7-12 months 260 mg
1-3 years 700 mg
4-8 years 1000 mg
9-13 years 1300 mg
14-18 years 1300 mg
19-50 years 1000 mg
51-70 years Females: 1200 mg, Males: 1000 mg
Pregnancy: 14-18 years 1300 mg
Pregnancy: 19 years and older 1000 mg
Breastfeeding: 14-18 years 1300 mg
Breastfeeding: 19 years and older 1000 mg
* mg = milligrams

4-14
Part 4
Table 4.10 Approximate Calcium Content of Various Foods (USDA, 2010c)
Food
Calcium (mg)*
% Daily Value**
Ready-to-eat cereal, calcium-fortified, 1 cup 100-1000 10-100%
Tofu, regular, prepared with calcium sul-fate, ½ cup 434*** 43%
Orange juice, calcium fortified, 6 ounces 375 38%
Yogurt, low-fat or non-fat, 8 ounces 245-384 25-38%
Sardines, with edible bones, canned in oil, 3 ounces 306 31%
Cheese, cheddar or part-skim mozzarella, 1.5 ounces 275-306 28-31%
Milk, 8 ounces 300 30%
Pink salmon, canned, solids with bone, 3 ounces 181 18%
Spinach, cooked, ½ cup 120 12%
Kale, cooked, 1 cup 94 9%
Almonds, 1 ounce 75 8%
Pinto beans, boiled, ½ cup 39 4%
Broccoli, raw, ½ cup 21 2%
* mg = milligrams ** DV = Daily Value. The DV for calcium is 1000 mg for healthy adults. *** Calcium content is for tofu processed with a calcium salt. Tofu processed with other salts does not provide significant amounts of calcium
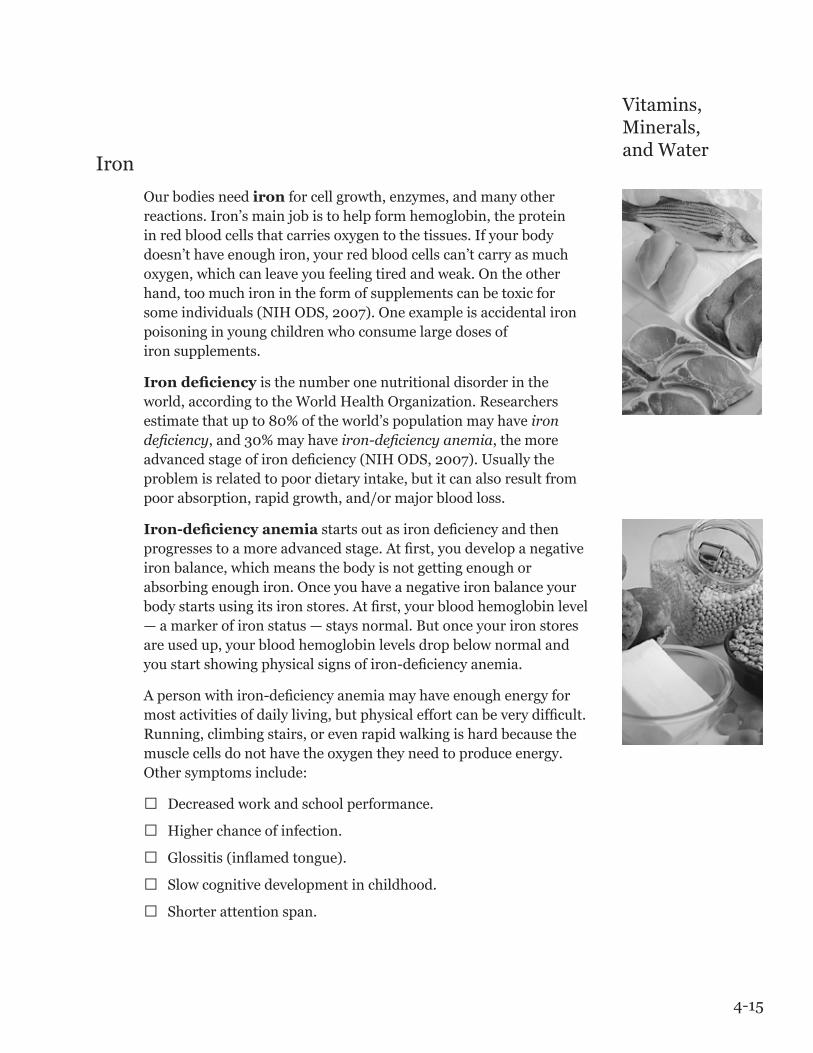
4-15
Vitamins, Minerals, and Water
Iron
Our bodies need ironforcellgrowth,enzymes,andmanyotherreactions. Iron’s main job is to help form hemoglobin, the protein inredbloodcellsthatcarriesoxygentothetissues.Ifyourbodydoesn’t have enough iron, your red blood cells can’t carry as much oxygen,whichcanleaveyoufeelingtiredandweak.Ontheotherhand,toomuchironintheformofsupplementscanbetoxicforsomeindividuals(NIHODS,2007).Oneexampleisaccidentalironpoisoning in young children who consume large doses of iron supplements.
Irondeficiencyis the number one nutritional disorder in the world,accordingtotheWorldHealthOrganization.Researchersestimatethatupto80%oftheworld’spopulationmayhaveiron deficiency,and30%mayhaveiron-deficiency anemia, the more advancedstageofirondeficiency(NIHODS,2007).Usuallytheproblemisrelatedtopoordietaryintake,butitcanalsoresultfrompoor absorption, rapid growth, and/or major blood loss.
Iron-deficiencyanemiastartsoutasirondeficiencyandthenprogressestoamoreadvancedstage.Atfirst,youdevelopanegativeiron balance, which means the body is not getting enough or absorbing enough iron. Once you have a negative iron balance your bodystartsusingitsironstores.Atfirst,yourbloodhemoglobinlevel—amarkerofironstatus—staysnormal.Butonceyourironstoresare used up, your blood hemoglobin levels drop below normal and youstartshowingphysicalsignsofiron-deficiencyanemia.
Apersonwithiron-deficiencyanemiamayhaveenoughenergyformostactivitiesofdailyliving,butphysicaleffortcanbeverydifficult.Running,climbingstairs,orevenrapidwalkingishardbecausethemusclecellsdonothavetheoxygentheyneedtoproduceenergy.Other symptoms include:
□ Decreasedworkandschoolperformance.□ Higher chance of infection.
□ Glossitis(inflamedtongue).□ Slow cognitive development in childhood.
□ Shorter attention span.
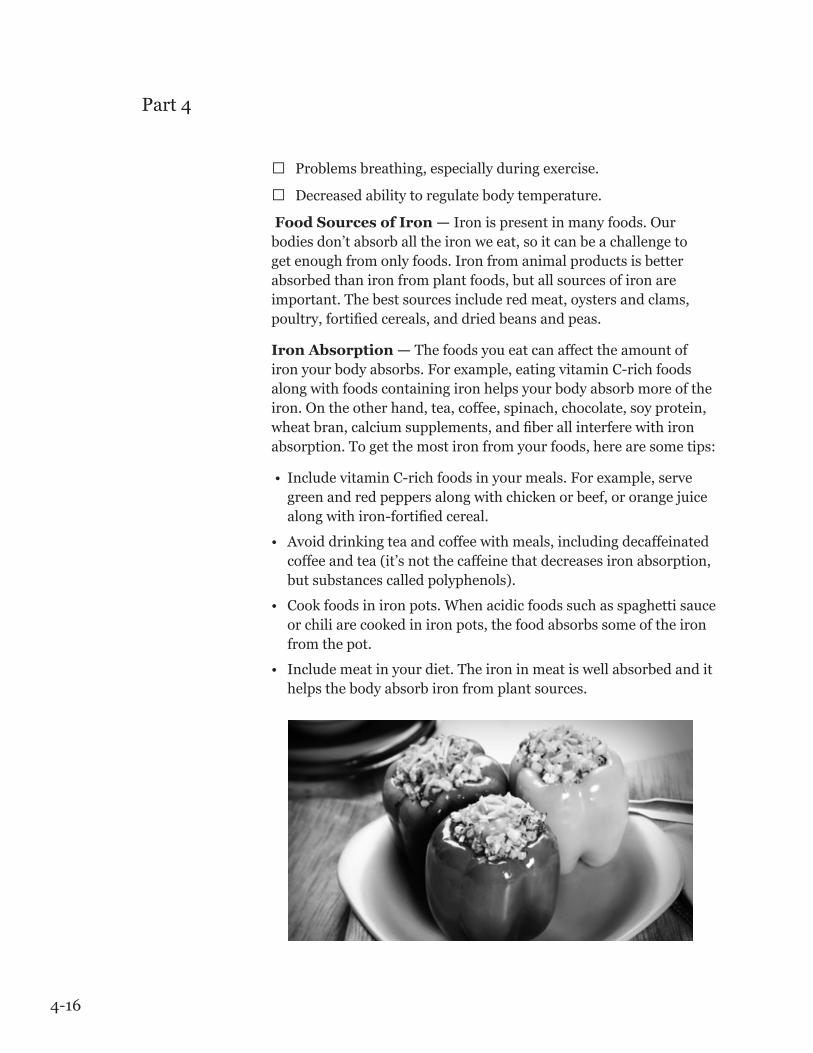
4-16
Part 4
□ Problemsbreathing,especiallyduringexercise.□ Decreased ability to regulate body temperature.
FoodSourcesofIron—Iron is present in many foods. Our bodies don’t absorb all the iron we eat, so it can be a challenge to get enough from only foods. Iron from animal products is better absorbed than iron from plant foods, but all sources of iron are important. The best sources include red meat, oysters and clams, poultry,fortifiedcereals,anddriedbeansandpeas.
IronAbsorption—The foods you eat can affect the amount of ironyourbodyabsorbs.Forexample,eatingvitaminC-richfoodsalong with foods containing iron helps your body absorb more of the iron. On the other hand, tea, coffee, spinach, chocolate, soy protein, wheatbran,calciumsupplements,andfiberallinterferewithironabsorption. To get the most iron from your foods, here are some tips:
• IncludevitaminC-richfoodsinyourmeals.Forexample,servegreenandredpeppersalongwithchickenorbeef,ororangejuicealongwithiron-fortifiedcereal.
• Avoiddrinkingteaandcoffeewithmeals,includingdecaffeinatedcoffee and tea (it’s not the caffeine that decreases iron absorption, but substances called polyphenols).
• Cookfoodsinironpots.Whenacidicfoodssuchasspaghettisauceorchiliarecookedinironpots,thefoodabsorbssomeoftheironfrom the pot.
• Includemeatinyourdiet.Theironinmeatiswellabsorbedandithelps the body absorb iron from plant sources.
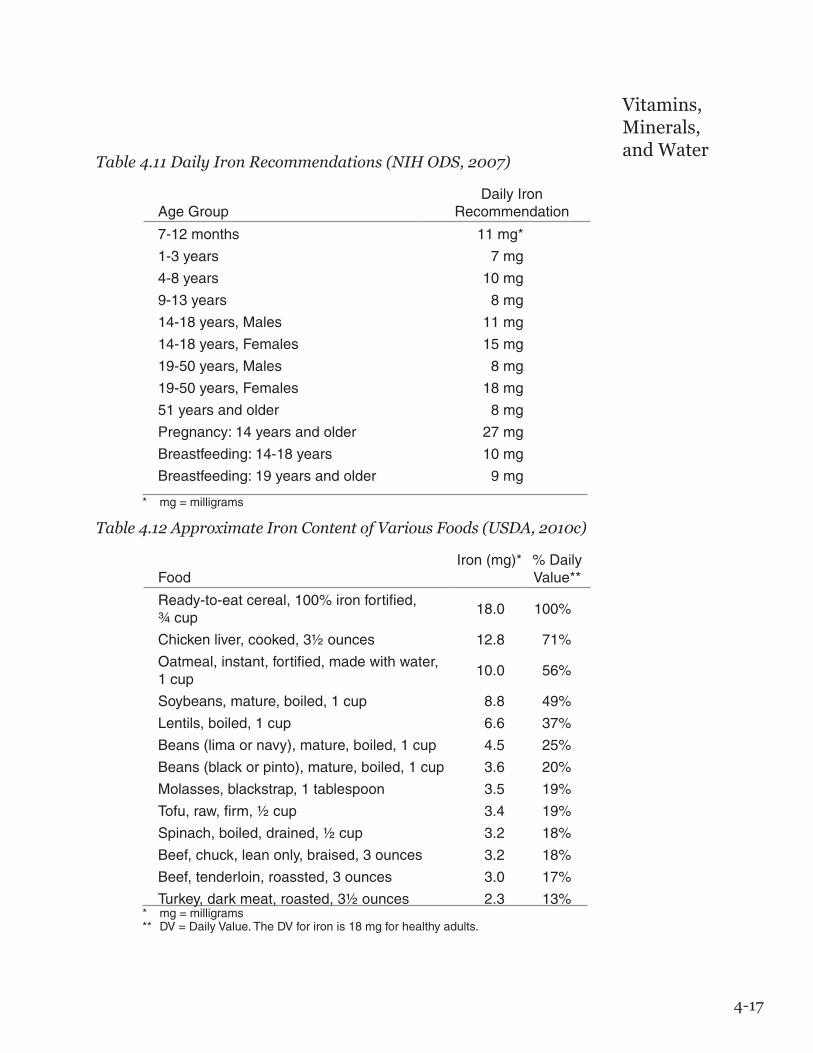
4-17
Vitamins, Minerals, and Water
Table 4.11 Daily Iron Recommendations (NIH ODS, 2007)
Age Group
Daily Iron Recommendation
7-12 months 11 mg*
1-3 years 7 mg
4-8 years 10 mg
9-13 years 8 mg
14-18 years, Males 11 mg
14-18 years, Females 15 mg
19-50 years, Males 8 mg
19-50 years, Females 18 mg
51 years and older 8 mg
Pregnancy: 14 years and older 27 mg
Breastfeeding: 14-18 years 10 mg
Breastfeeding: 19 years and older 9 mg
* mg = milligrams
Table 4.12 Approximate Iron Content of Various Foods (USDA, 2010c)
Food
Iron (mg)* % Daily Value**
Ready-to-eat cereal, 100% iron fortified, ¾ cup
18.0 100%
Chicken liver, cooked, 3½ ounces 12.8 71%
Oatmeal, instant, fortified, made with water, 1 cup
10.0 56%
Soybeans, mature, boiled, 1 cup 8.8 49%
Lentils, boiled, 1 cup 6.6 37%
Beans (lima or navy), mature, boiled, 1 cup 4.5 25%
Beans (black or pinto), mature, boiled, 1 cup 3.6 20%
Molasses, blackstrap, 1 tablespoon 3.5 19%
Tofu, raw, firm, ½ cup 3.4 19%
Spinach, boiled, drained, ½ cup 3.2 18%
Beef, chuck, lean only, braised, 3 ounces 3.2 18%
Beef, tenderloin, roassted, 3 ounces 3.0 17%
Turkey, dark meat, roasted, 3½ ounces 2.3 13%* mg = milligrams ** DV = Daily Value. The DV for iron is 18 mg for healthy adults.
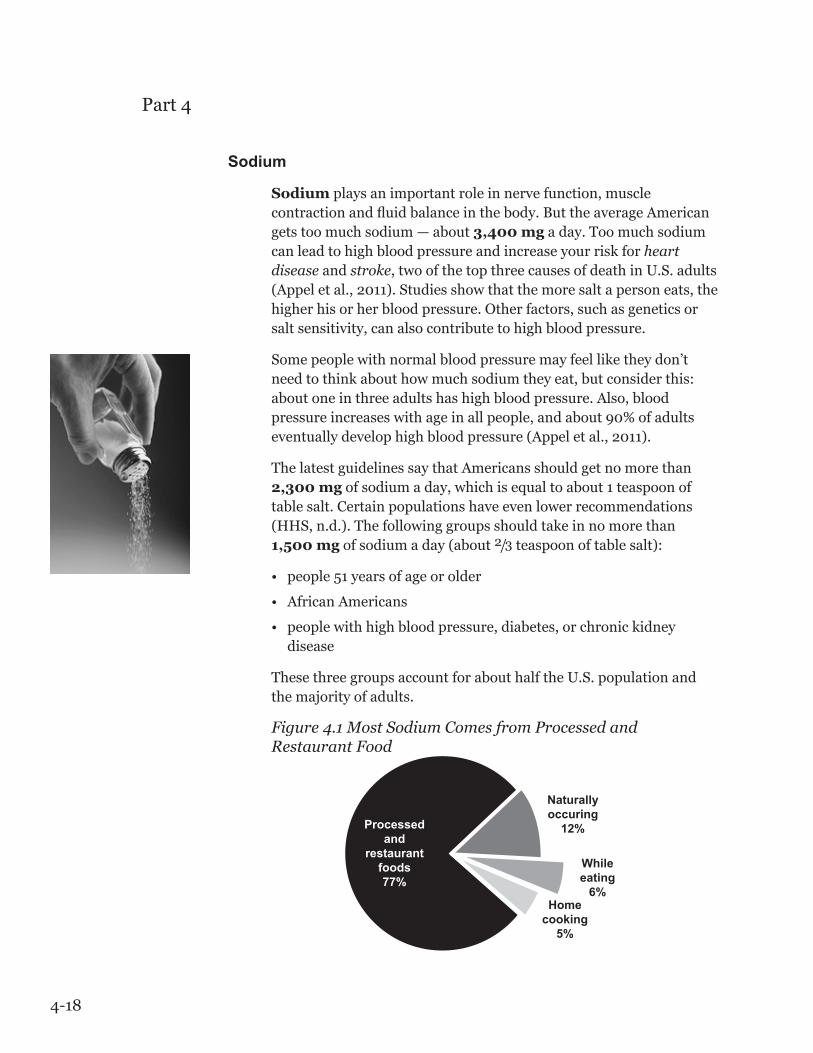
Homecooking
5%
Naturallyoccuring
12%
Whileeating
6%
Processedand
restaurantfoods77%
4-18
Part 4
Sodium
Sodium plays an important role in nerve function, muscle contractionandfluidbalanceinthebody.ButtheaverageAmericangets too much sodium — about 3,400mg a day. Too much sodium canleadtohighbloodpressureandincreaseyourriskforheart disease and stroke,twoofthetopthreecausesofdeathinU.S.adults(Appel et al., 2011). Studies show that the more salt a person eats, the higher his or her blood pressure. Other factors, such as genetics or salt sensitivity, can also contribute to high blood pressure.
Somepeoplewithnormalbloodpressuremayfeelliketheydon’tneedtothinkabouthowmuchsodiumtheyeat,butconsiderthis:about one in three adults has high blood pressure. Also, blood pressureincreaseswithageinallpeople,andabout90%ofadultseventually develop high blood pressure (Appel et al., 2011).
The latest guidelines say that Americans should get no more than 2,300mg of sodium a day, which is equal to about 1 teaspoon of table salt. Certain populations have even lower recommendations (HHS,n.d.).Thefollowinggroupsshouldtakeinnomorethan1,500mg of sodium a day (about 2/3 teaspoon of table salt):
• people51yearsofageorolder
• AfricanAmericans
• peoplewithhighbloodpressure,diabetes,orchronickidneydisease
ThesethreegroupsaccountforabouthalftheU.S.populationandthe majority of adults.
Figure 4.1 Most Sodium Comes from Processed and Restaurant Food

4-19
Vitamins, Minerals, and Water
High-SodiumFoods—Only5to10%ofoursodiumintakecomesfromaddingsaltwhilecookingandeating.Mostofthesodiumweeat(about75%)comesfromprocessedfoods,fastfoods,andrestaurantfoods. A small amount of sodium is naturally present in foods. Figure 4.1 shows where most of our sodium comes from (Mattes and Donnelly,1991).
Someofthehighestsodiumfoodsincludesoups,pizza,frozenmealswithsauces,boxedstuffing,instantriceorpastamixes,processedlunchmeats, and cheeses. If it’s a convenience food, chances are it is high in sodium. The good news is that the food industry is getting the message. A number of food companies are reformulating their productstolowerthesodium.It’salsouptoyoutomakeafewchanges.Followthesetipstocutbackonsodium:
• Eatmore fresh foods and fewerprocessedfoods.Cookmorefoodsat home from scratch.
• Seasonyourfoodswithspices,herbs,orlemonjuiceratherthantable salt or seasoned salt blends.
• Choosefresh,frozen,orlow-sodiumcannedvegetablesratherthancanned. If you do choose canned vegetables, rinse them prior to cookingtoremoveextrasodium.
• Choosefreshorfrozenmeat,poultry,andseafoodratherthanbreaded,canned,cured,smokedproducts,orprocessedlunchmeats.
• Lookforlabelsthatsay“low-sodium.”Theycontain140mgorlessof sodium per serving.
AdjustingtoaLowerSodiumDiet—Wetendtolikesaltyflavors,soitmightbehardtoeatlower-sodiumfoodsatfirst.Rememberthatchangestaketime.Cutbackslowly,andovertime,your taste for salt will lessen and your taste buds will learn to appreciatetheotherflavorsinfoods(MayoFoundation,2011b).
Activity4.1—Howmuchsodiumisinyourfoods?RefertoyourBasicNutritionWorkbookandcompletetheactivity.

4-20
Part 4
Table 4.13 Approximate Sodium Content of Various Foods (Adapted from Center for Science in the Public Interest, 2008 and USDA, 2010c)
Food
Sodium (mg)*
% Daily Value**
Soy sauce, 1 tablespoon 920-1160 38-48%
Tomato soup, reconstituted, 8 ounces 700-1260 29-53%
Tomato juice, 8 ounces 340-1040 14-43%
Instant noodles, 1 serving 875-1170 36-49%
Frozen pizza, cheese, 4 ounces (1 small slice)
450-1200 19-50%
Macaroni & cheese, canned/boxed, 1 cup 520-1027 22-43%
Spaghetti sauce, 4 ounces 330-700 14-29%
Lunch meat, ham or bologna, 1 slice 300-365 13-15%
Pretzels, salted, 1 ounce (~17 small pret-zels)
385-560 16-23%
Cottage cheese, ½ cup 370-460 15-20%
Cheese, processed, American, 1 ounce 275 12%
Canned mixed vegetables, ½ cup 250 10%
Barbeque sauce, 2 tablespoons 230-510 10-21%
Salad dressing, regular, 2 tablespoons 110-505 5-21%
Salsa, 2 tablespoons 150-240 6-10%
Instant oatmeal, flavored, 1 packet 180-294 8-12%
Bacon, pork, 1 slice 190-261 8-11%
Breads, all types, 1 slice 95-210 4-9%
Potato chips, 1 ounce (~15 chips) 120-180 5-8%
Tortilla chips, 1 ounce (~10 chips) 105-160 4-7%
* DV = Daily Value. The DV for sodium is 2400 mg
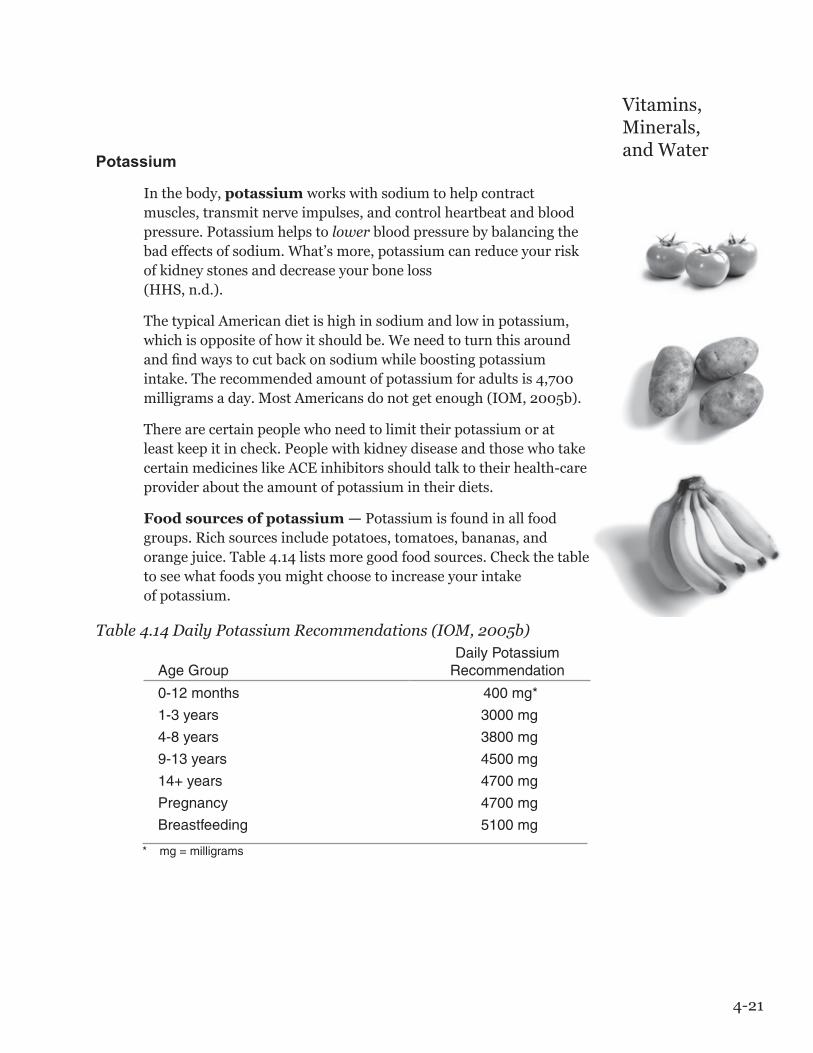
4-21
Vitamins, Minerals, and Water Potassium
In the body, potassium works with sodium to help contract muscles, transmit nerve impulses, and control heartbeat and blood pressure. Potassium helps to lower blood pressure by balancing the bad effects of sodium. What’s more, potassium can reduce your risk of kidney stones and decrease your bone loss (HHS, n.d.).
The typical American diet is high in sodium and low in potassium, which is opposite of how it should be. We need to turn this around and find ways to cut back on sodium while boosting potassium intake. The recommended amount of potassium for adults is 4,700 milligrams a day. Most Americans do not get enough (IOM, 2005b).
There are certain people who need to limit their potassium or at least keep it in check. People with kidney disease and those who take certain medicines like ACE inhibitors should talk to their health-care provider about the amount of potassium in their diets.
Food sources of potassium — Potassium is found in all food groups. Rich sources include potatoes, tomatoes, bananas, and orange juice. Table 4.14 lists more good food sources. Check the table to see what foods you might choose to increase your intake of potassium.
Table 4.14 Daily Potassium Recommendations (IOM, 2005b) Age Group
Daily Potassium Recommendation
0-12 months 400 mg*
1-3 years 3000 mg
4-8 years 3800 mg
9-13 years 4500 mg
14+ years 4700 mg
Pregnancy 4700 mg
Breastfeeding 5100 mg
* mg = milligrams

4-22
Part 4
Table 4.15 Approximate Potassium Content of Various Foods (USDA, 2010c)
Food
Potassium (mg)*
% Daily Value**
Potato, 1 small baked russet or 1 cup mashed
690-760 20-22%
Prune juice, 1 cup 707 20%
Carrot juice, 1 cup 689 17%
White beans, canned, ½ cup 595 17%
Tomato juice, 1 cup 556 16%
Plain yogurt, low-fat or nonfat, 8 ounces 531-579 15-17%
Sweet potato, baked in skin, 1 medium 542 15%
Orange juice, 1 cup 500 14%
Fish, Pacific cod or Rockfish, 3 ounces cooked
440 13%
Milk, all varieties, 1 cup 350-425 10-12%
Banana, 1 medium 422 12%
Spinach, cooked, ½ cup 400 11%
Pork loin, center rib, roasted, 3 ounces 371 11%
Lentils, kidney or pinto beans, cooked, ½ cup
300-370 9-11%
* mg = milligrams ** DV = Daily Value. The DV for potassium is 3500 mg.
Activity4.2—WhatareYourFavoriteSourcesofKeyVitaminsandMinerals?RefertoyourBasicNutritionWorkbookandcompletetheactivity.
4-23
Vitamins, Minerals, and Water
Dietary Supplements
Supplements are a hot topic. They are easy to buy, they don’t require aprescription,andtheyclaimtohaveamazingbenefits.Whateverailsyou,thereseemstobesomekindofvitamin,mineral,herbalproduct,enzyme,orothersubstancethatcanhelp.
MorethanhalfofU.S.adultstakeadietarysupplement (Bailey et al, 2011). But the reality is that most people can meet their daily requirements from food alone, without dietary supplements. Andresearchshowsthattherearemanybenefitstogettingyournutrients from whole foods. The bottom line is that supplements shouldn’t replace a healthy diet, but simply do as the name implies — supplement, or enhance, a healthy diet. Here are some other things to remember about supplements:
• Supplementsarenotregulated.TheU.S.governmentdoesnot control or approve supplements for safety and effectiveness. Dietarysupplementscancontainothersubstancessuchasfillersor other ingredients that can be harmful.
• Labelscanbemisleading.Manufacturers often use terms thathavenoofficialdefinition.Forexample,there’snoofficialdefinitionfor“natural,”andaproductlabeled“natural”isnotnecessarily safe. Many supplements have false claims such as “cure-all,”“totallysafe,”and“nosideeffects.”
• Highdosescanbeexpensiveanddangerous.Both manufacturersandconsumerstendtothink“moreisbetter”whenit comes to supplements. So people often get more than the daily recommendedintakeofvariousnutrients.Inmanycases,thebodyabsorbswhatitcanandthenexcretestherest,whichcanresultinsomeveryexpensiveurine!Inothercases,veryhighdosesofcertain nutrients can cause harmful side effects.
• Foodsarefortified.Ifyouthinkyouaren’tgettingenoughnutrientsfromyourfood,thinkagain.Manyfoodcompaniesaddvitaminsandmineralstocertainfoodslikecereals,bread,flour,grainproducts,milk,andjuices.
For more information on the safe use of supplements, visit the National Institute of Health Office of Dietary Supplements webpage at: http://ods.od.nih.gov/
4-24
Part 4
While most people can get all they need from foods alone, certain populations may need supplements:
• Womenofchildbearingage
• Pregnantorbreastfeedingwomen
• Elderly
• Smokers
• Alcoholics
• Vegetariansorvegans
• Thosewithcertaindiseasesormedicalconditions(includingcancer, digestive tract diseases, metabolic conditions, and eating disorders)
• Recipientsofgastric-bypasssurgery
If you are unsure about whether you or a participant needs a supplement,talktoadoctor.
Water
Considerthisamazingfact:overhalfofourbodyiswater—that’sabout10to12gallons!Waterlubricates joints and organs; helps regulateourtemperature;removeswasteproducts;andmakesupmajorbodyfluidslikeblood,saliva,sweat,urine,andamnioticfluid.Obviously, we need water — we can’t survive long without it.
Ourbodiesnaturallyloseaboutonetotwolitersoffluideachdaythroughurine.Thingslikeillness,vomitingordiarrhea,vigorousexercise,orjustbeingintheTexassummerheatcanincreasewaterloss. If you don’t replace the water that your body loses, you can get dehydrated. Symptoms include dry mouth, very little or no urine output,darkyellowurine,sunkeneyes,lowbloodpressure,andheadache. In severe dehydration, symptoms progress to delirium and can cause brain damage or death. Infants, children, and the elderly areathigherriskfordehydration.(MedlinePlus,2009)
Sometimes people become overhydrated. Overhydration (or water intoxication)happenswhenapersondrinksmorewaterthantheirbodyneeds.Peoplewithheart,kidneyorliverdiseaseareatahigherriskofdevelopingoverhydrationbecausetheymaynotbeabletogetridofwatereasily.Also,enduranceathleteswhodrinktoo
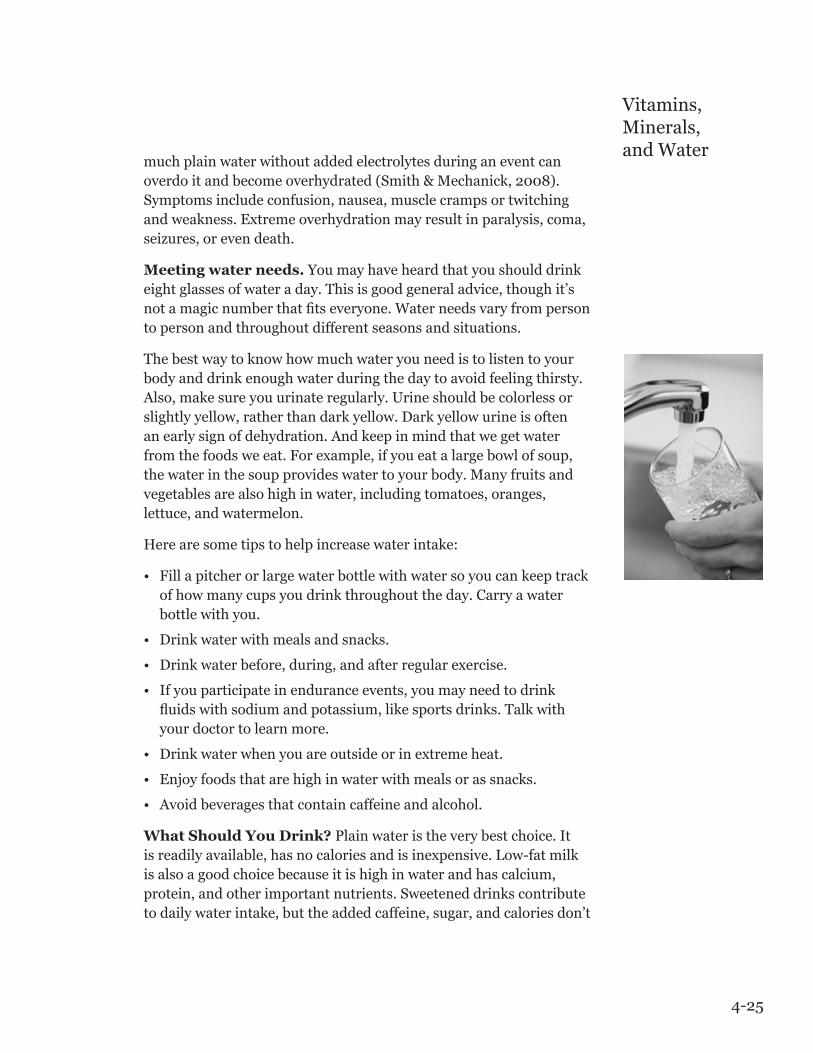
4-25
Vitamins, Minerals, and Water
much plain water without added electrolytes during an event can overdoitandbecomeoverhydrated(Smith&Mechanick,2008).Symptoms include confusion, nausea, muscle cramps or twitching andweakness.Extremeoverhydrationmayresultinparalysis,coma,seizures,orevendeath.
Meetingwaterneeds.Youmayhaveheardthatyoushoulddrinkeight glasses of water a day. This is good general advice, though it’s notamagicnumberthatfitseveryone.Waterneedsvaryfrompersonto person and throughout different seasons and situations.
Thebestwaytoknowhowmuchwateryouneedistolistentoyourbodyanddrinkenoughwaterduringthedaytoavoidfeelingthirsty.Also,makesureyouurinateregularly.Urineshouldbecolorlessorslightlyyellow,ratherthandarkyellow.Darkyellowurineisoftenanearlysignofdehydration.Andkeepinmindthatwegetwaterfromthefoodsweeat.Forexample,ifyoueatalargebowlofsoup,the water in the soup provides water to your body. Many fruits and vegetables are also high in water, including tomatoes, oranges, lettuce, and watermelon.
Herearesometipstohelpincreasewaterintake:
• Fillapitcherorlargewaterbottlewithwatersoyoucankeeptrackofhowmanycupsyoudrinkthroughouttheday.Carryawaterbottle with you.
• Drinkwaterwithmealsandsnacks.
• Drinkwaterbefore,during,andafterregularexercise.
• Ifyouparticipateinenduranceevents,youmayneedtodrinkfluidswithsodiumandpotassium,likesportsdrinks.Talkwithyour doctor to learn more.
• Drinkwaterwhenyouareoutsideorinextremeheat.
• Enjoyfoodsthatarehighinwaterwithmealsorassnacks.
• Avoidbeveragesthatcontaincaffeineandalcohol.
WhatShouldYouDrink?Plain water is the very best choice. It isreadilyavailable,hasnocaloriesandisinexpensive.Low-fatmilkis also a good choice because it is high in water and has calcium, protein,andotherimportantnutrients.Sweeteneddrinkscontributetodailywaterintake,buttheaddedcaffeine,sugar,andcaloriesdon’t

4-26
Part 4
offer the best nutrition for your body. Too much caffeine and alcohol causeyourbodytoloseextrawatersodrinkthesesparingly.Yourbestbetistoreachforwaterwheneveryoucan.(Popkinetal.,2006).
Figure 4.2 Quick Guide to the Best Beverages for Adults
Poor Better Best
Fruit Drinks Reduced fat/ whole milk
Plain water
Sports/energy drinks
100% Fruit and vegetable juices
Low-fat/skim milk (regular or soy)
Sweetened coffee or tea beverages
Diet soda or diet flavored water
Regular soda Small amounts of unsweetened tea or coffee
Alcohol(Adapted from Popkin et al., 2006)
Part4Test:ThisistheendofPart4.Gotoyour BasicNutritionWorkbookandcompletethePart4test questions.

5-1
In this section, we will discuss practical ways to apply the nutrient basics. We’ll briefly review the 2010 Dietary Guidelines for Americans, ChooseMyPlate.gov, the 2008 Physical Activity Guidelines, and other practical strategies that will help you and your WIC clients live a healthier lifestyle.
Objectives
After reading Part 5 you’ll be able to:
• Distinguish empty-calorie foods from nutrient-dense foods.
• Identify calories burned in various physical activities.
• Describe the benefits of cooking at home.
• List the four principles of food safety.
• Identify visuals that are equivalent to certain portion sizes.
• State the physical activity guidelines for adults.
• Describe eating practices that are examples of mindful eating.
• Recognize the USDA’s MyPlate method of meal planning.
Part 5Sound Advice for a Healthier America

5-2
Part 5
The 2010 Dietary Guidelines for Americans
Every 5 years, USDA and the US Department of Health and Human Services (HHS) issue an updated version of the Dietary Guidelines. The guidelines offer sound nutrition advice based on high-quality scientific data and expert reviews.
With two of every three Americans being overweight or obese, the 2010 Dietary Guidelines Committee issued a call to action for individuals, communities, governments and the food industry to combat obesity. The 2010 Dietary Guidelines have two key messages:
• “Maintainacaloriebalancetoreachandstayatahealthyweight.”In other words, Americans need to eat less and move more.
• “Focusonnutrient-densefoodsandbeverages.” Eat more vegetables, fruits, whole grains, fat-free and low-fat dairy products, fish, and lean meats, and eat fewer snack foods, grain-based desserts, refined grains, and sugary beverages.
The Guidelines also advise Americans to get more of certain healthy nutrients (like potassium, fiber, calcium and vitamin D), and cut back on unhealthy nutrients (like sodium, saturated fats and trans fats). To read the full Dietary Guidelines publication and other related materials go to http://www.cnpp.usda.gov/dietaryguidelines.htm.
USDA’s ChooseMyPlate.gov
In 2011, USDA replaced the Food Guide Pyramid with an easy-to-understand symbol called MyPlate (see Figure 5.1). The MyPlate icon shows how the five major food groups fit together for a healthy lifestyle. For a healthy meal, fill half of your plate with fruits and vegetables, add a serving of whole grains, choose a healthy source of protein, and add a side of low-fat dairy (USDA 2011).
USDA’s accompanying website, www.ChooseMyPlate.gov, serves as a tool that consumers can use to help put the U.S. Dietary Guidelines into practice. ChooseMyPlate.gov focuses on portion control, balance, and increasing healthy nutrients (see figure 5.2).
Figure 5.1

5-3
Sound Advicefor a HealthierAmerica
Figure 5.2 Key Messages from USDA
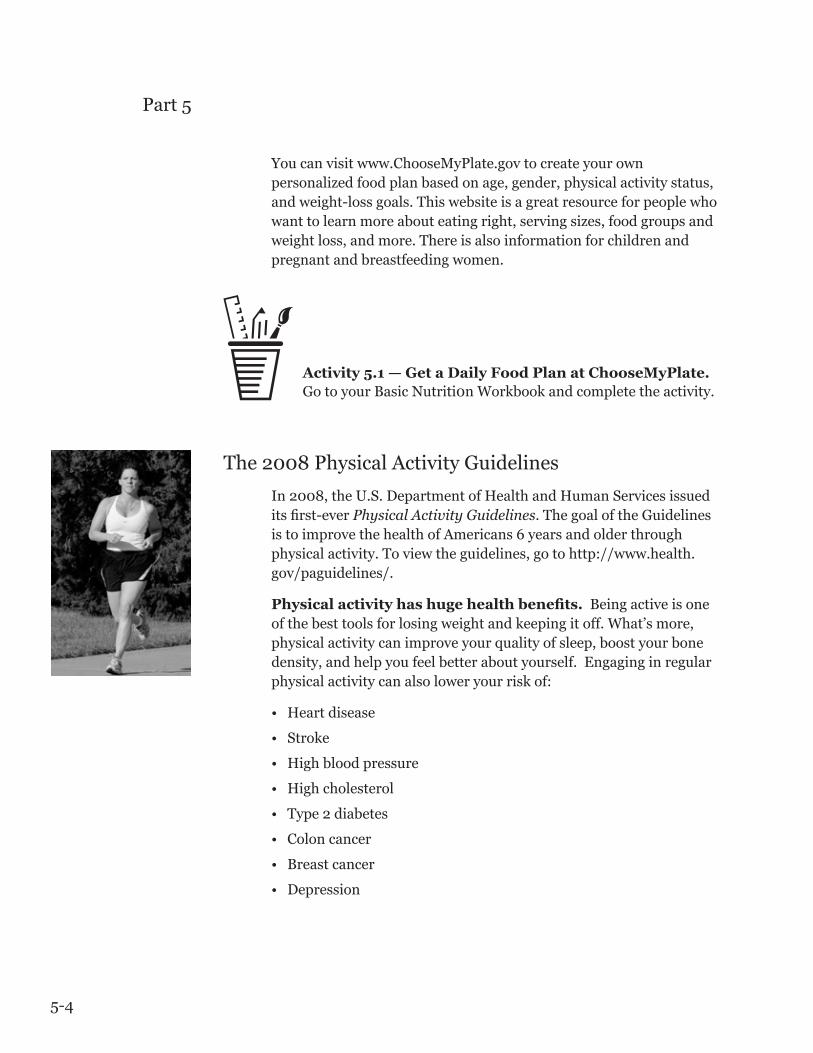
5-4
Part 5
You can visit www.ChooseMyPlate.gov to create your own personalized food plan based on age, gender, physical activity status, and weight-loss goals. This website is a great resource for people who want to learn more about eating right, serving sizes, food groups and weight loss, and more. There is also information for children and pregnant and breastfeeding women.
Activity5.1—GetaDailyFoodPlanatChooseMyPlate.Go to your Basic Nutriti0n Workbook and complete the activity.
The 2008 Physical Activity Guidelines
In 2008, the U.S. Department of Health and Human Services issued its first-ever Physical Activity Guidelines. The goal of the Guidelines is to improve the health of Americans 6 years and older through physical activity. To view the guidelines, go to http://www.health.gov/paguidelines/.
Physicalactivityhashugehealthbenefits. Being active is one of the best tools for losing weight and keeping it off. What’s more, physical activity can improve your quality of sleep, boost your bone density, and help you feel better about yourself. Engaging in regular physical activity can also lower your risk of:
• Heart disease
• Stroke
• High blood pressure
• High cholesterol
• Type 2 diabetes
• Colon cancer
• Breast cancer
• Depression

5-5
Sound Advicefor a HealthierAmerica
Howmuchactivitydopeopleneed? The amount of exercise a person needs each week depends on how intense the activities are and how much activity they already do. For example, a casual stroll down the street is a “low-intensity” activity, and is a great first step toward being active for a person who does not exercise regularly. “Moderate” activities, like brisk walking, provide more benefits than low-intensity exercise because they raise the heart rate to a higher level. “Vigorous” activities, like jogging, increase the heart rate even more and burn more calories in a shorter time period compared to moderate activities. See box 5.1 for more examples of moderate and vigorous activities.
Box 5.1 Examples of Moderate and Vigorous Activities
Moderate Activities – When you do a moderate activity, your heart rate goes up. You should be able to talk comfortably. Typical examples include:
• Walking(3-4mph,butnotrace-walking)
• Wateraerobics
• Bicyclingatacasualpace
• Tennis(doubles)
• Ballroomdancing
• GeneralgardeningVigorous Activities–When you do a vigorous activity, you breatheharderandyourheartrateisstronger.Itmaybedifficulttospeakmorethanafewwordsatatime.Examplesinclude:
• Racewalking,jogging,orrunning
• Swimminglaps
• Tennis(singles)
• Aerobicdancing
• Bicyclingfastoruphills
• Jumpingrope
• Heavygardening(continuousdiggingorhoeing)
• Hikinguphillorwithaheavybackpack
5-6
Part 5
Adults should get 150 minutes per week of moderate activity, or 75 minutes each week of vigorous activity or an equivalent combination of both (U.S. Department of Health and Human Services [HHS], 2008). It doesn’t have to be all at once; you can add it up over the course of a day, though each activity should last for at least 10 minutes. Also, the guidelines recommend muscle-strengthening activities on two or more days a week.
SomeActivityisBetterthanNoneatall–Keep in mind that doing any amount of physical activity provides health benefits. The idea is to start moving, keep moving, and increase activity until you reach your goals. See Box 5.2 for the specific guidelines for various groups.
Activity5.2—AssessYourPhysicalActivityRefer to your Basic Nutrition Workbook and complete the activity.

5-7
Sound Advicefor a HealthierAmerica Box 5.2 The 2008 Physical Activity Guidelines for Americans
(U.S. Department of Health and Human Services, 2008)
2008 Physical Activity Guidelines for AmericansKey Guidelines for Children and Adolescents (ages 6 – 17)
• Childrenandadolescentsshoulddo60 minutes (1 hour) or more of moderate or vigorous physical activity most days of the week.
• Childrenandadolescentsshouldincludemuscle-strengtheningactivities(suchasplayingonplaygroundequipment,tugofwarorclimbing)atleast3daysaweek,andbone-strengtheningactivities(suchasjumpingrope,skippingorhopping)atleast3daysoftheweek.
• Childrenshouldengageinactivitiesthatareenjoyableandage-appropriate.
Key Guidelines for Adults (ages 18 – 64)
• Somephysicalactivityisbetterthannone.Adultswhoparticipateinanyamountofphysicalactivitygainsomehealthbenefits.
• Adultsshouldgetatleast150 minutes of moderate activity per week, or 75 minutes of vigorous activity per week, or an equivalent combination of both. It doesn’t have to be all at once; a person can add up activity over the course of a day, though each activity should last for at least 10 minutes.
• Adultsshouldalsodomuscle-strengtheningactivitiesthatinvolveallmajormusclegroupsontwoormoredaysaweek.
• Adultswhowantevenmorehealthbenefitsshouldincreasetheiraerobicphysicalactivityto300minutesofmoderateactivityperweek,or150minutesofvigorousactivityperweek,oranequivalent combination of both.
Key Guidelines for Women During Pregnancy and the Postpartum Period
• Healthywomenwhoarenotalreadyhighlyactiveordoingvigorous-intensityactivityshouldgetatleast150minutesofmoderate-intensityaerobicactivityperweekduringpregnancyandthepostpartumperiod,orasdirectedbytheirhealth-careprovider.
• Pregnantwomenwhoarehighlyactivecancontinuephysicalactivityduringpregnancyandthepostpartumperiod,providedthattheyremainhealthyanddiscusswiththeirhealth-careproviderhowandwhentoadjustactivityovertime.
For guidelines for children under 6, refer to the Texas WIC Preschool Nutrition Module. For guidelines pertaining to older adults, adults with chronic diseases, and adults with disabilities, refer to http://www.health.gov/paguidelines/.
5-8
Part 5
More Ways to Put Good Health into Practice
Now we’ll look at some additional strategies that encourage healthy lifestyles. All of these concepts tie in closely with ideas that you’ll find in the 2010 Dietary Guidelines, ChooseMyPlate.gov, and the 2008 Physical Activity Guidelines.
1. Eat Less, Move More.
2. Cook at home more often.
3. Dine out with your health in mind.
4. Limit screen time.
5. Practice food safety.
6. Practice mindful eating.
7. Control your portions.
Eat Less, Move More
One key message in the Dietary Guidelines is to lose weight by cutting back on calories while increasing physical activity. The best weight loss programs combine both – eating less while moving more.
Eatless. Eating less means eating smaller portions of a well-balanced diet — it doesn’t mean skipping meals. A key strategy is to cut back on empty-caloriefoods — foods that are high in calories, fat, and simple sugars, and low in vitamins, minerals and fiber. Examples include candy, doughnuts, pastries, cakes, cookies, and pies, as well as sugary drinks like sodas, fruit drinks, coffee beverages and sports drinks.
Added sugars and solid fats contribute about 800 extra calories to the average American’s daily intake (USDA, 2010b). Alcohol is also a source of extra calories for many people. Here are some ways to cut back on calories:
• Drink fewer regular sodas, sports drinks, and energy drinks. Try water instead.
• Limit alcohol. If you choose to drink, do so in moderation.
• Try healthy food alternatives. Pizza is one of the top five sources of calories for Americans. It’s loaded with solid fats, calories, and sodium. Try whole-grain crust, vegetable toppings, and less cheese.

5-9
Sound Advicefor a HealthierAmerica
• Eat fewer desserts and baked goods like cookies, cakes, pies, muffins and doughnuts. Choose fruit as a dessert more often.
As you cut back on empty-calorie foods, eat more nutrient-densefoods — foods that are naturally high in vitamins, minerals and fiber while low in calories and fat. Nutrient-dense foods offer many healthy nutrients per serving and really pack a punch for their size. Fruits, vegetables, whole grains, beans, and lean meats are a few good examples.
MoveMore. Staying active burns calories, which can help you lose weight. Physical activity also boosts your mood and helps keep your heart and muscles strong. Table 5.1 shows approximately how many calories you can burn doing common physical activities. Exercise doesn’t have to be done in 30-minute increments — you can fit activities in throughout your day, moving your body for at least 10 minutes at a time. For adults who are inactive, remember that some physical activity is better than none.
Table 5.1 Calories Burned per Hour in Common Physical Activities
Moderate Activity
Approximate Calories burned in 30 minutes for a 154-lb. person
Stretching 90
Walking (3.5 mph) 140
Bicycling (<10 mph) 145
Golf (walking and carrying clubs)
165
Dancing 165
Light gardening/yard work 165
Hiking 185
Basketball (vigorous) 220
Weight lifting (vigorous effort) 220
Heavy yard work (chopping wood)
220
Walking (4.5 mph) 230
Aerobics 240
Swimming (slow freestyle laps) 255
Bicycling (>10 mph) 295
Running/jogging (5 mph) 295
Calories burned per hour will be higher for persons who weigh more than 154 lbs and lower for persons who weigh less.

5-10
Part 5
The healthiest, safest and best-tasting way to trim your waistline and adopt a healthier lifestyle is to eat more nutrient-dense foods and become more physically active. For every 3500 calories you cut out from your caloriebalance, you will lose a pound of body fat. See Box 5.3 for a summary of how small changes can add up over time.
Box 5.3 Balancing Calories for a Healthier Weight
Think about this…
1poundofbodyfat=3,500calories
What does this mean?
• Foreveryadditional3,500caloriesthatyoudon’teatorthatyouburnfromphysicalactivity,youwilllose one pound of fat.
• Foreveryadditional3,500extracaloriesyoueatfromfoodordonotburnthroughphysicalactivity,youwillgain one pound of fat.
Breaking it Down
3,500isabignumber,soit’seasiertothinkaboutasingleday.Ifyouloweryourtotalcaloriebalanceby500calorieseachday,youwillloseaboutonepoundeachweek,whichisasafeweightlossgoal.Evenasmallcaloriereductionperdaycanleadtoanoticeableweightlossovertheperiodofonemonth.
Thischartshowshowsmallchangescanhelpyouachieveweightlossgoals:
If you reduce your calories by
___ per day
Youwilllose about ___ pounds
per week
Youwilllose about ___ pounds
per month100 0.2 0.8200 0.4 1.6300 0.6 2.4400 0.8 3.2500 1 4
5-11
Sound Advicefor a HealthierAmerica Cook at Home More Often
Homemade meals are often healthier than eating out because you can control the ingredients and the portion sizes. Try to cook and eat more meals at home with friends or family. Take time to explore recipes, substitute ingredients, and learn new ways to prepare lean meats, fruits, vegetables, and whole grains. Your meals will likely cost less per serving compared to dining out, and you can plan ahead for leftovers by cooking in large batches.
Eating at home also helps to create a healthy food environment for your family. Dinners with family or friends allow for bonding, sharing, and communication. Children who regularly eat dinner with their families do better in school and are less likely to do drugs and alcohol. They also feel more comfortable talking to parents about personal concerns (The National Center for Addiction and Substance Abuse at Columbia University, 2010).
Dine Out with Your Health in Mind
We all go out to eat from time to time, but that doesn’t mean smart eating has to go out the window. Many restaurants have nutrition data available for customers, so be sure to ask for this information. Here are some ways you can be a smart diner:
• Choose dishes that include vegetables, fruits, and whole grains.
• Choose smaller portions, split your meal with somebody, or put aside half of the meal in a to-go box as soon as it’s delivered.
• Avoid creamy, fried, breaded, battered, or buttered foods. Grilled, steamed, or broiled foods are better choices.
• Don’t let toppings put you over the top! Keep portions of any toppings, including croutons, cheeses, syrups, dressings, and sauces small. Choose low-fat or light dressings and toppings whenever possible.
5-12
Part 5
Limit Screen Time
It’s hard to imagine a world without smart phones, laptops, and big-screen TVs. Our environment is full of technology, which contributes to unhealthy lifestyle habits and an epidemic of obesity. Many of us need to cut back on the time we spend watching television, using our smart phones and computers, or playing video games. This is especially true for children and adolescents, as there is a strong link between too much screen time and childhood obesity. The American Academy of Pediatrics (AAP) recommends no more than one to two hours of quality screen time per day for older children and discourages any screen time for children under the age of 2 (AAP, 2001). Use the time you would typically watch television to do other activities like family games or exercise.
Practice Food Safety
Preparing meals the safe way can help prevent food illnesses. Signs and symptoms of a foodborne illness may occur anywhere from 30 minutes to 3 weeks after eating a contaminated food (CDC, 2010a). The four basic principles of food safety include (USDA, 2010a):
• Clean. Wash hands, surfaces, utensils, and cuttings boards often. Rinse produce under tap water to remove visible dirt and dry it off with a clean towel before cutting or eating.
• Separate. Separate raw meat, seafood, and eggs from ready-to-eat foods to prevent cross contamination. Use different cutting boards, utensils, and plates for raw foods and cooked foods.
• Cook.Cook foods thoroughly to destroy harmful bacteria. Foods must reach certain temperatures in order to kill harmful microorganisms. For example, fish should be cooked to an internal temperature of 145°F and chicken should be cooked to 165°F. Use a food thermometer for the most accurate temperature reading. After cooking and preparing meals, keep cold foods cold (at or below 40°F) and hot foods hot (at or above 140°F).
• Chill. Bacteria grow very quickly at room temperature. Refrigerate or freeze leftovers within 2 hours.
5-13
Sound Advicefor a HealthierAmerica Practice Mindful Eating
Good nutrition goes far beyond using the Dietary Guidelines to select, cook, and eat the right foods. Eating also involves the mind – emotions, feelings, behaviors and habits all influence our mealtimes. We don’t usually stop to think about when, why, or how we eat. Eating habits are learned at a very young age and are often carried with us throughout our lifetime.
As Americans we often pride ourselves on our multi-tasking abilities. Our busy lifestyles (and eating habits) are often on the go. When we are distracted, rushed, or stressed, we may overeat. Why? Because our minds aren’t focused on the food we’re eating. Examples of mind-less eating include munching through an entire bag of chips during a movie; snacking when we’re nervous, bored, or emotional; endlessly eating at a restaurant or social gathering just because the food is there; or always feeling a need to ‘clean your plate’ at mealtimes. Mindless eating involves eating without considering if you’re really hungry. This can lead to overconsumption of high-calorie foods and beverages. Over time, these behaviors can contribute to weight gain, poor relationships with food, and long-term health consequences.
Good food habits involve mind “full” eating. Mindfuleatinginvolves being aware of the what, where, why, when, and how much you’re eating. It helps us avoid the food scenarios mentioned above. It allows for a greater control of dietary intake and a better overall relationship with food.
Hereareafewtipsforeatingmoremindfully:
• Beawareofyourhungercues.Are you honestly hungry or are there other reasons you want to eat? Listen to your appetite and eat only until satisfied, not until you are full.
• Keephealthyfoodsavailableforeasysnacking.Chopped fruits and vegetables are an easy, portable snack that will provide you with more nutrition than a candy bar or bag of chips.
• Avoideatingdirectlyoutofabox,cartonorcupboard.Put your food on a plate and sit down to eat. You can control your portion sizes and reduce the temptation to continue eating.
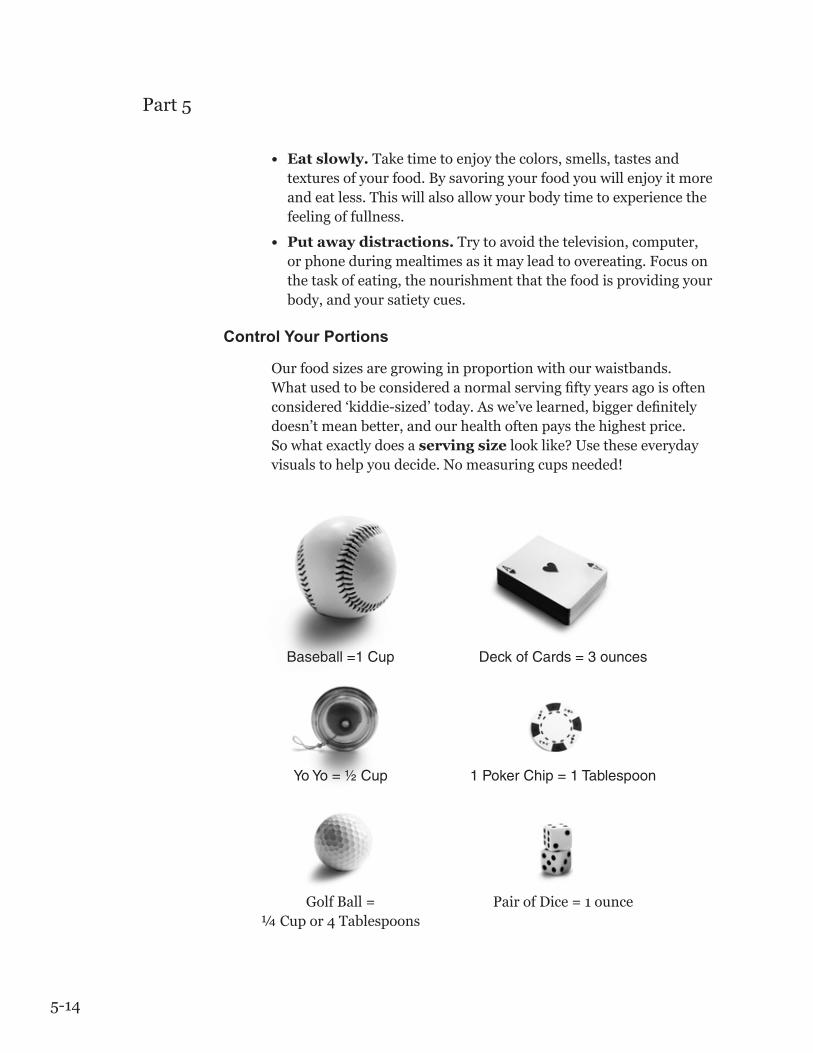
5-14
Part 5
• Eatslowly.Take time to enjoy the colors, smells, tastes and textures of your food. By savoring your food you will enjoy it more and eat less. This will also allow your body time to experience the feeling of fullness.
• Putawaydistractions. Try to avoid the television, computer, or phone during mealtimes as it may lead to overeating. Focus on the task of eating, the nourishment that the food is providing your body, and your satiety cues.
Control Your Portions
Our food sizes are growing in proportion with our waistbands. What used to be considered a normal serving fifty years ago is often considered ‘kiddie-sized’ today. As we’ve learned, bigger definitely doesn’t mean better, and our health often pays the highest price. So what exactly does a servingsize look like? Use these everyday visuals to help you decide. No measuring cups needed!
Baseball =1 Cup Deck of Cards = 3 ounces
Yo Yo = ½ Cup 1 Poker Chip = 1 Tablespoon
Golf Ball = ¼ Cup or 4 Tablespoons
Pair of Dice = 1 ounce
5-15
Sound Advicefor a HealthierAmerica Making Sense of it All
Healthy eating is not a one-size-fits-all approach, but the guidelines and tips in this module encourage the right balance of foods rather than fad dieting. Think about how you can make a difference in the lives of WIC families. Focus on helping participants eat more fruits and vegetables, whole grains, cut down on fat and sugar, be more active, and follow eating patterns that are in line with the latest dietary advice.
Part5Test:This is the end of Part 5. Go to your Basic Nutrition Workbook and complete the Part 5 test questions.

6-1
As a WIC employee it’s important to know the latest guidelines for healthy living and to put them into practice. By practicing healthy habits you can be a role model for WIC clients and boost your chances of living a healthier and longer life yourself.
Objectives
After reading Part 6 you’ll be able to:
• Distinguishbetweendifferentbodymeasurementsthatestimatebody fat and predict risk for long-term disease.
• Demonstrateknowledgeaboutthehealtheffectsofmakinghealthyfood choices and being physically active.
• Listtheriskfactorsforchronicdiseases.
• Identifyspecificparametersforvariouschronicdisease risk factors.
Part 6Your Own Checklist for Good Health
6-2
Part 6
In this part of the module you’ll assess your own health, looking at thesefiveareas:
• BeingataHealthyWeight
• ChoosingHealthyFoods
• BeingPhysicallyActive
• ManagingotherRiskFactors
• SettingGoalsforaHealthyLifestyle
Think of this section as a self-assessment — a snapshot of where are you today. When you’re done, you can decide what you’re going to do withtheinformationifanything.Maybeyou’llwanttostartplanningsome changes. Or maybe you’re already following a healthy lifestyle. Regardless,takingthistimetolookatyourownhealthwillgiveyou a better understanding of ways you can help WIC clients make healthier choices.
BeingataHealthyWeight
Manypeoplewanttobeatahealthyweightsothattheylookslimmer. That’s important, but there’s more to body weight than what you see in the mirror. It’s your health that’s on the line.
Being overweight or obese raises your risk of heart disease, high blood pressure, stroke, type 2 diabetes, breathing problems, arthritis, gallbladderdisease,sleepapnea,andsomecancers(CDC,2011a).Ontheflipside,beingtoothinraisestheriskofosteoporosis,nutrientdeficiencies,andmenstrualirregularitiesinwomen.Butbeingatahealthy weight means you have a lower risk of all these problems. In other words, if you’re at a healthy weight, you’re healthier overall.
InthissectionyouwillfigureoutyourownBodyMassIndex(BMI)and your waist circumference.
Body Mass Index (BMI)
BMIisameasureofyourweightbasedonyourheight.AhighBMIsuggeststhatapersonhasextrabodyfat,whichmeansagreaterriskofheartdiseaseandotherdiseases.Here’sthemathematicalequationtofigureoutBMI:

6-3
Your Own Checklist for Good Health
BMI = weight (in pounds) ÷ height (in inches)2 x 703
TherearefourstandardweightcategoriesbasedontheBMIvalues.Aftercalculatingaperson’sBMI,youneedtodeterminewhichweight category they are in.
BMI Weight Category
below 18.5 Underweight
18.5 – 24.9 Normal
25.0 – 29.9 Overweight
30.0 and above Obese
Activity6.1 — Determine Your BMI. GotoyourBasicNutritionWorkbookandcompletetheactivity.
BMI Doesn’t Tell the Whole Story–In general, the higher the BMIthemorebodyfatapersonhas.Butthat’snotalwaysthecase(NationalInstituteofDiabetesandDigestiveandKidneyDiseases[NIDDK],2008).Forexample,ahighly-trainedverymuscularathletecanbe“overweight”accordingtohisBMI,buthisbodyismostly muscle with very little fat.
The opposite is also true — many adults who are “normal weight” basedontheirBMIactuallyhaveahigh amount of body fat. In other words,eventhoughtheirBMIisnormaltheyhaveahigherriskofheartdiseaseandotherlong-termdiseases(Romero-Corraletal.,2010).Researchersusetheterm“normal weight obesity” to describe peoplewhohaveanormalBMIbutahighbodyfatpercentage.

6-4
Part 6
Waist Circumference
WhileBMIhelpstellusifwe’recarryingextrafat,waist circumferencehelpstoshowwheretheexcessfatislocated.Ingeneral, women carry fat in their hips and buttocks giving them a “pear”shape.Menusuallybuildupfataroundtheirbelliesandwaistso that they have more of an “apple” shape.
Ifyoustoreextrafatmainlyaroundyourwaist(“apple-shaped”),you are more likely to develop health problems than if you carry fat mainlyinyourhipsandthighsevenifyourBMIisinthehealthyrange. Women with a waist measurement over 35 inches and men with a waist measurement over 40 inches may have more health risksbecauseoftheirbodyfatdistribution(NIDDK,2008).
Activity 6.2 — Measure Your Waist Circumference. GotoyourBasicNutritionWorkbookandcompletetheactivity.
What is Your Weight Status?
BMIandwaistcircumferenceprovideabasicassessmentofweightstatus. At this point, consider your weight status and think about whatsortofgoalsyoumighttosetforyourself(seebelow).
Are you underweight?IfyourBMIis18.5orless,youmaywantto talk with your doctor to see if you need to gain weight. This is especiallytrueifyou’verecentlylost10ormorepoundswithouttrying to lose weight.
Are you overweight or obese? Consider talking with your doctor about ways to eat healthier and be more physically active if:
• YourBMIis30orabove.
• YourBMIisbetween25and30andyouhavetwoormoreofthe following health problems: type 2 diabetes, high blood pressure, heart disease, stroke, cancer, sleep apnea, osteoarthritis, gallbladder disease, liver disease, or irregular menstrual periods.
• Youhaveahighwaistsizeandtwoormoreofthehealthproblemslisted above.
BMI is a good screening tool, but it is not a direct measurement of body fat. Knowing a person’s waist circumference provides more information.
6-5
Your Own Checklist for Good Health
Evenasmallweightlossof10%ofcurrentweightcanloweryourriskof obesity-related diseases. It’s also important to try to avoid gaining any additional weight.
Do you have a healthy weight and waist size? That’s good news, but it’s still important to ask yourself some serious questions. Areyoueatingtherightfoods?Areyouphysicallyactive?Doyoudosome kind of strength training several times a week? Even people atahealthyweightstatuscanusuallyfindwaystoliveahealthierlifestyle.Keepinmindthatasyouageyourenergyneedswillprobably decrease and staying at your current weight can get harder. In fact, the average American gains about a pound a year between theagesof20to60years.Somegainmore.Soifyou’reatahealthyweight now, your goal should be to stay that way.
Choosing Healthy Foods
The food choices we make each day add up. Over months and years, poor choices can lead to disease while a lifetime of healthy choices can help prevent all kinds of health problems, especially as we age. Sowhydon’twealleatahealthydiet?Obviouslymanyfactorsaffectour daily food choices including:
• Personal preferences.Yourfoodpreferencesthefoodsyouwere raised on, and your basic “food philosophy” form the basis of your diet.
• Health status. Being pregnant, losing weight, having diabetes, andbattlingcancerareexamplesofhealthissuesthataffectnutrient needs and food choices.
• Advice from friends, family and the media. Nutritionadvice is everywhere — some of it is good, but there’s also a lot of misinformation too.
• Interest in food and cooking. People who enjoy cooking tend to be more adventurous when it comes to trying different foods and cooking them at home.
• Family and working situations. A single mother of two who works full-time may choose foods differently than a stay-at-home parent who can spend more time planning, shopping, and cooking meals.
6-6
Part 6
• Cues and signals.Hungerisonecuethatinfluencesourfoodchoices, but there are many others. Things like packaging, colors, labels,shapes,smells,appearance,servingsize,platesize,etc.,can all affect your decisions about which foods to eat, when to eat them and how much to eat.
Activity 6.3 — Rate Your Plate. GotoyourBasicNutritionWorkbookandcompletetheactivity.
Try This! Use an Online Nutrient Calculator (optional) The main reason for choosing healthy foods is to get the nutrients you need. Try this on-line tool from the Food and Nutrition Information Council — it calculates your nutrient needs based on age, sex, physical activity and pregnancy/lactation status. Go to the “Interactive DRI for Healthcare Professionals” at http://fnic.nal.usda.gov/interactiveDRI/ and enter the data as it pertains to you. Get a detailed list of all your nutrient needs as well as links to additional resources like fact sheets, the Dietary Guidelines, and more.
Being Physically Active
“Being physically active is one of the most important steps you can take to improve your health.”
— Centers for Disease Control and Prevention, 2011(b) —
Nowgobackandreadthatsentenceagain.Letitsinkin;reallysinkin.That’saprettystrongstatementisn’tit?YetmostAmericansdon’tdo enough physical activity to meet public health guidelines. In Part 5ofthismoduleyouassessedhowmuchphysicalactivityyou’redoing each day. If you’re like most Americans you need to do more.
Just Move. Firstrememberthatsomeactivityisbetterthannoneatall.Movingyourbody,evenifyou’rejustdoinglightactivity,hasimportantbenefits.Sotakethestairs,parkfurtheraway,andplayoutside with the kids! It’s all helpful!
Take the First Step! If you’re ready to start being more active, thentakethatfirststep—literally.Askanyonewhohastransformedthemselves from couch potato to an active person — they all took afirststep.Whetheritwassteppingoutthedoortostartwalking,stepping onto the treadmill to start jogging, or stepping into the pool tostartswimming,itallstartswiththefirststep.
Sowhynotstarttoday?Find10minutestodaytowalkaroundtheblock, jog in the park, or dance to the radio in your living room. You’llfeelgoodaboutyourselfknowingyoutookthefirststep.
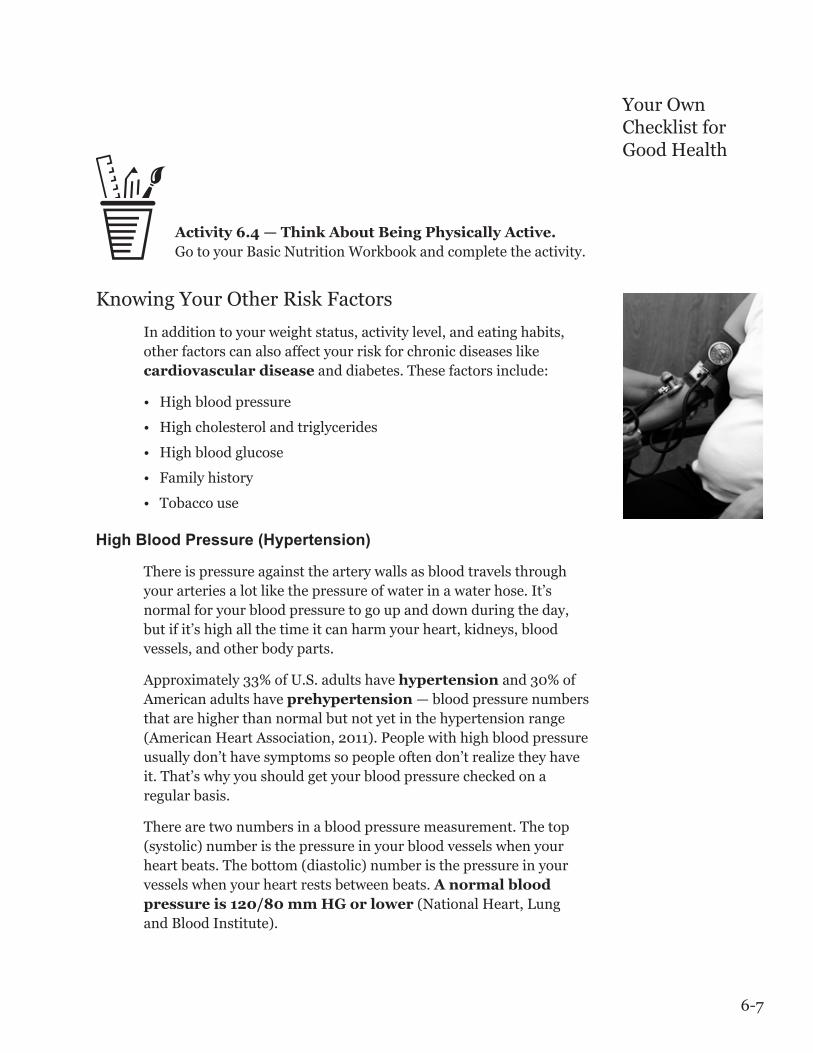
6-7
Your Own Checklist for Good Health
Activity 6.4 — Think About Being Physically Active. GotoyourBasicNutritionWorkbookandcompletetheactivity.
KnowingYourOtherRiskFactors
In addition to your weight status, activity level, and eating habits, other factors can also affect your risk for chronic diseases like cardiovascular disease and diabetes. These factors include:
• Highbloodpressure
• Highcholesterolandtriglycerides
• Highbloodglucose
• Familyhistory
• Tobaccouse
High Blood Pressure (Hypertension)
There is pressure against the artery walls as blood travels through your arteries a lot like the pressure of water in a water hose. It’s normal for your blood pressure to go up and down during the day, but if it’s high all the time it can harm your heart, kidneys, blood vessels, and other body parts.
Approximately33%ofU.S.adultshavehypertension and30%ofAmerican adults have prehypertension — blood pressure numbers that are higher than normal but not yet in the hypertension range (AmericanHeartAssociation,2011).Peoplewithhighbloodpressureusuallydon’thavesymptomssopeopleoftendon’trealizetheyhaveit. That’s why you should get your blood pressure checked on a regular basis.
There are two numbers in a blood pressure measurement. The top (systolic)numberisthepressureinyourbloodvesselswhenyourheartbeats.Thebottom(diastolic)numberisthepressureinyourvessels when your heart rests between beats. A normal blood pressure is 120/80 mm HG or lower (NationalHeart,Lung andBloodInstitute).
6-8
Part 6
Eating a healthy diet, cutting back on sodium, reaching a healthy weight, staying active and lowering your stress level can help to lower a person’s blood pressure. If you don’t know your blood pressure,getitchecked.Formoreinformation,goto http://www.cdc.gov/bloodpressure/.
Blood Cholesterol, Lipoproteins, and Triglycerides
Our bodies use cholesterol to make hormones, cell walls, bile, and vitaminD.Butcholesterolcanbuildupinthebloodvessels.Thisbuildup is called plaque. Over time, plaque can make the arteries narrow and increases the chance of a heart attack. That’s why it’s good to know the levels of cholesterol in your blood. A blood test can measure total blood cholesterol, lipoprotein, and triglyceride levels:
Total cholesterol is the total amount of cholesterol in your blood.ItincludesHDL,LDL,andotherlipoproteinsthatcarrycholesterol through the blood.
LDL (bad) cholesterol —WhenLDLcholesterolishigh,moreplaque builds up in the arteries, raising your risk for heart disease. That’swhyLDLcholesteroliscalled“bad”cholesterol.
HDL (good) cholesterol helps remove cholesterol from the blood and prevent the fatty buildup, so this is the “good” cholesterol.Highernumbersarebetter.
Triglycerides are another fat in your blood that can also raise your heart disease risk. Ideally you want your fasting triglyceride leveltobelessthan150mg/dL.Thingsthatraisetriglyceridesinclude being overweight, physical inactivity, cigarette smoking, excessivealcoholuse,veryhighcarbohydratediets,certaindiseases and drugs, and genetic disorders.
Desirable Cholesterol Levels (fasting)
Total Cholesterol Less than 200 mg/dL
LDL Cholesterol (“Bad” Cholesterol) Less than 100 mg/dL
HDL Cholesterol (“Good” Cholesterol) 60 mg/dL or highter
Triglycerides Less than 150 mg/dL
What are lipoproteins? In order for cholesterol to travel through your blood, it’s coated with a layer of protein to make a “lipoprotein.” Low-density lipoprotein (LDL) and high-density lipoprotein (HDL) are two of the common lipoproteins. Your diet, activity level, and genetics can all affect your lipoprotein levels.

6-9
Your Own Checklist for Good Health
HighcholesterolisaconcernforAmerica.Asof2008,approximately44%ofadultsover20havetotalcholesterollevelsatorabove200(AmericanHeartAssociation,2011).Eatingahealthydiet,reachinga healthy weight, and staying active can help to improve levels of cholesterol and triglycerides.
For more information about cholesterol, check out “High Blood Cholesterol: What You Need to Know” from the National Cholesterol Education Program: http://www.nhlbi.nih.gov/health/public/heart/chol/wyntk.pdf. The information explains what your cholesterol numbers mean, how to calculate your heart disease risk, and how you can make healthy changes to your diet.
High Blood Glucose
Ifyourbloodglucose(orbloodsugar)ishigher than normal, that’s a sign that you may have diabetes. The number of Americans being diagnosed with diabetes continues to rise every year as does the numberofchildrenwhodevelopdiabetes.Diabetescanleadtoheartdisease, blindness, kidney failure, and amputation of feet and legs. DiabetesistheseventhleadingcauseofdeathintheUnitedStates.
People with prediabetes have blood glucose levels higher than normalbutnothighenoughtobeclassifiedasdiabetes.TheCDCestimatesthat35%oftheU.S.populationhasprediabetes(CDC,2011b),yetmostpeoplewithprediabetesdon’trealizetheyhaveit(CDC,2008).Ifyouhaveprediabetes,youhaveanincreasedriskof developing type 2 diabetes and a higher risk of heart disease and stroke.
What causes high levels of blood sugar? When you eat food, yourbodyturnsmostofitintoglucose.Normallyahormonecalledinsulin moves the glucose into the body’s cells where they use it for energy. But if you have diabetes your body either doesn’t make enough insulin or doesn’t use insulin as well as it should. The result? Glucosebuildsupintheblood.Andthat’swhymanypeoplewithdiabetes take oral medications or insulin shots. They need an outside source of insulin to keep their blood glucose levels normal. Eating a healthy diet, reaching a healthy weight, and staying active can help to lower a person’s risk of getting diabetes, and can help improve a diabetic’s blood glucose levels.
Diagnosing diabetes — Physicians use several different blood tests to see if a person’s blood glucose is higher than normal. The most common test is a fasting blood glucose test which measures yourbloodglucoseafternoteatingforatleast8hours.Anormalreadingislessthan100mg/dL.Formoreinformationaboutotherdiagnostic tests, treatment and management of diabetes, refer to theNationalDiabetesInformationClearinghousewebsiteathttp://diabetes.niddk.nih.gov/.
Do you know what your fasting blood glucose level is? About 35% of Americans have prediabetes, but most don’t realize they have it.

6-1
As a WIC employee it’s important to know the latest guidelines for healthy living and to put them into practice. By practicing healthy habits you can be a role model for WIC clients and boost your chances of living a healthier and longer life yourself.
Objectives
After reading Part 6 you’ll be able to:
• Distinguishbetweendifferentbodymeasurementsthatestimatebody fat and predict risk for long-term disease.
• Demonstrateknowledgeaboutthehealtheffectsofmakinghealthyfood choices and being physically active.
• Listtheriskfactorsforchronicdiseases.
• Identifyspecificparametersforvariouschronicdisease risk factors.
Part 6Your Own Checklist for Good Health

6-2
Part 6
In this part of the module you’ll assess your own health, looking at thesefiveareas:
• BeingataHealthyWeight
• ChoosingHealthyFoods
• BeingPhysicallyActive
• ManagingotherRiskFactors
• SettingGoalsforaHealthyLifestyle
Think of this section as a self-assessment — a snapshot of where are you today. When you’re done, you can decide what you’re going to do withtheinformationifanything.Maybeyou’llwanttostartplanningsome changes. Or maybe you’re already following a healthy lifestyle. Regardless,takingthistimetolookatyourownhealthwillgiveyou a better understanding of ways you can help WIC clients make healthier choices.
BeingataHealthyWeight
Manypeoplewanttobeatahealthyweightsothattheylookslimmer. That’s important, but there’s more to body weight than what you see in the mirror. It’s your health that’s on the line.
Being overweight or obese raises your risk of heart disease, high blood pressure, stroke, type 2 diabetes, breathing problems, arthritis, gallbladderdisease,sleepapnea,andsomecancers(CDC,2011a).Ontheflipside,beingtoothinraisestheriskofosteoporosis,nutrientdeficiencies,andmenstrualirregularitiesinwomen.Butbeingatahealthy weight means you have a lower risk of all these problems. In other words, if you’re at a healthy weight, you’re healthier overall.
InthissectionyouwillfigureoutyourownBodyMassIndex(BMI)and your waist circumference.
Body Mass Index (BMI)
BMIisameasureofyourweightbasedonyourheight.AhighBMIsuggeststhatapersonhasextrabodyfat,whichmeansagreaterriskofheartdiseaseandotherdiseases.Here’sthemathematicalequationtofigureoutBMI:
6-3
Your Own Checklist for Good Health
BMI = weight (in pounds) ÷ height (in inches)2 x 703
TherearefourstandardweightcategoriesbasedontheBMIvalues.Aftercalculatingaperson’sBMI,youneedtodeterminewhichweight category they are in.
BMI Weight Category
below 18.5 Underweight
18.5 – 24.9 Normal
25.0 – 29.9 Overweight
30.0 and above Obese
Activity6.1 — Determine Your BMI. GotoyourBasicNutritionWorkbookandcompletetheactivity.
BMI Doesn’t Tell the Whole Story–In general, the higher the BMIthemorebodyfatapersonhas.Butthat’snotalwaysthecase(NationalInstituteofDiabetesandDigestiveandKidneyDiseases[NIDDK],2008).Forexample,ahighly-trainedverymuscularathletecanbe“overweight”accordingtohisBMI,buthisbodyismostly muscle with very little fat.
The opposite is also true — many adults who are “normal weight” basedontheirBMIactuallyhaveahigh amount of body fat. In other words,eventhoughtheirBMIisnormaltheyhaveahigherriskofheartdiseaseandotherlong-termdiseases(Romero-Corraletal.,2010).Researchersusetheterm“normal weight obesity” to describe peoplewhohaveanormalBMIbutahighbodyfatpercentage.

6-4
Part 6
Waist Circumference
WhileBMIhelpstellusifwe’recarryingextrafat,waist circumferencehelpstoshowwheretheexcessfatislocated.Ingeneral, women carry fat in their hips and buttocks giving them a “pear”shape.Menusuallybuildupfataroundtheirbelliesandwaistso that they have more of an “apple” shape.
Ifyoustoreextrafatmainlyaroundyourwaist(“apple-shaped”),you are more likely to develop health problems than if you carry fat mainlyinyourhipsandthighsevenifyourBMIisinthehealthyrange. Women with a waist measurement over 35 inches and men with a waist measurement over 40 inches may have more health risksbecauseoftheirbodyfatdistribution(NIDDK,2008).
Activity 6.2 — Measure Your Waist Circumference. GotoyourBasicNutritionWorkbookandcompletetheactivity.
What is Your Weight Status?
BMIandwaistcircumferenceprovideabasicassessmentofweightstatus. At this point, consider your weight status and think about whatsortofgoalsyoumighttosetforyourself(seebelow).
Are you underweight?IfyourBMIis18.5orless,youmaywantto talk with your doctor to see if you need to gain weight. This is especiallytrueifyou’verecentlylost10ormorepoundswithouttrying to lose weight.
Are you overweight or obese? Consider talking with your doctor about ways to eat healthier and be more physically active if:
• YourBMIis30orabove.
• YourBMIisbetween25and30andyouhavetwoormoreofthe following health problems: type 2 diabetes, high blood pressure, heart disease, stroke, cancer, sleep apnea, osteoarthritis, gallbladder disease, liver disease, or irregular menstrual periods.
• Youhaveahighwaistsizeandtwoormoreofthehealthproblemslisted above.
BMI is a good screening tool, but it is not a direct measurement of body fat. Knowing a person’s waist circumference provides more information.

6-5
Your Own Checklist for Good Health
Evenasmallweightlossof10%ofcurrentweightcanloweryourriskof obesity-related diseases. It’s also important to try to avoid gaining any additional weight.
Do you have a healthy weight and waist size? That’s good news, but it’s still important to ask yourself some serious questions. Areyoueatingtherightfoods?Areyouphysicallyactive?Doyoudosome kind of strength training several times a week? Even people atahealthyweightstatuscanusuallyfindwaystoliveahealthierlifestyle.Keepinmindthatasyouageyourenergyneedswillprobably decrease and staying at your current weight can get harder. In fact, the average American gains about a pound a year between theagesof20to60years.Somegainmore.Soifyou’reatahealthyweight now, your goal should be to stay that way.
Choosing Healthy Foods
The food choices we make each day add up. Over months and years, poor choices can lead to disease while a lifetime of healthy choices can help prevent all kinds of health problems, especially as we age. Sowhydon’twealleatahealthydiet?Obviouslymanyfactorsaffectour daily food choices including:
• Personal preferences.Yourfoodpreferencesthefoodsyouwere raised on, and your basic “food philosophy” form the basis of your diet.
• Health status. Being pregnant, losing weight, having diabetes, andbattlingcancerareexamplesofhealthissuesthataffectnutrient needs and food choices.
• Advice from friends, family and the media. Nutritionadvice is everywhere — some of it is good, but there’s also a lot of misinformation too.
• Interest in food and cooking. People who enjoy cooking tend to be more adventurous when it comes to trying different foods and cooking them at home.
• Family and working situations. A single mother of two who works full-time may choose foods differently than a stay-at-home parent who can spend more time planning, shopping, and cooking meals.

6-6
Part 6
• Cues and signals.Hungerisonecuethatinfluencesourfoodchoices, but there are many others. Things like packaging, colors, labels,shapes,smells,appearance,servingsize,platesize,etc.,can all affect your decisions about which foods to eat, when to eat them and how much to eat.
Activity 6.3 — Rate Your Plate. GotoyourBasicNutritionWorkbookandcompletetheactivity.
Try This! Use an Online Nutrient Calculator (optional) The main reason for choosing healthy foods is to get the nutrients you need. Try this on-line tool from the Food and Nutrition Information Council — it calculates your nutrient needs based on age, sex, physical activity and pregnancy/lactation status. Go to the “Interactive DRI for Healthcare Professionals” at http://fnic.nal.usda.gov/interactiveDRI/ and enter the data as it pertains to you. Get a detailed list of all your nutrient needs as well as links to additional resources like fact sheets, the Dietary Guidelines, and more.
Being Physically Active
“Being physically active is one of the most important steps you can take to improve your health.”
— Centers for Disease Control and Prevention, 2011(b) —
Nowgobackandreadthatsentenceagain.Letitsinkin;reallysinkin.That’saprettystrongstatementisn’tit?YetmostAmericansdon’tdo enough physical activity to meet public health guidelines. In Part 5ofthismoduleyouassessedhowmuchphysicalactivityyou’redoing each day. If you’re like most Americans you need to do more.
Just Move. Firstrememberthatsomeactivityisbetterthannoneatall.Movingyourbody,evenifyou’rejustdoinglightactivity,hasimportantbenefits.Sotakethestairs,parkfurtheraway,andplayoutside with the kids! It’s all helpful!
Take the First Step! If you’re ready to start being more active, thentakethatfirststep—literally.Askanyonewhohastransformedthemselves from couch potato to an active person — they all took afirststep.Whetheritwassteppingoutthedoortostartwalking,stepping onto the treadmill to start jogging, or stepping into the pool tostartswimming,itallstartswiththefirststep.
Sowhynotstarttoday?Find10minutestodaytowalkaroundtheblock, jog in the park, or dance to the radio in your living room. You’llfeelgoodaboutyourselfknowingyoutookthefirststep.

6-7
Your Own Checklist for Good Health
Activity 6.4 — Think About Being Physically Active. GotoyourBasicNutritionWorkbookandcompletetheactivity.
KnowingYourOtherRiskFactors
In addition to your weight status, activity level, and eating habits, other factors can also affect your risk for chronic diseases like cardiovascular disease and diabetes. These factors include:
• Highbloodpressure
• Highcholesterolandtriglycerides
• Highbloodglucose
• Familyhistory
• Tobaccouse
High Blood Pressure (Hypertension)
There is pressure against the artery walls as blood travels through your arteries a lot like the pressure of water in a water hose. It’s normal for your blood pressure to go up and down during the day, but if it’s high all the time it can harm your heart, kidneys, blood vessels, and other body parts.
Approximately33%ofU.S.adultshavehypertension and30%ofAmerican adults have prehypertension — blood pressure numbers that are higher than normal but not yet in the hypertension range (AmericanHeartAssociation,2011).Peoplewithhighbloodpressureusuallydon’thavesymptomssopeopleoftendon’trealizetheyhaveit. That’s why you should get your blood pressure checked on a regular basis.
There are two numbers in a blood pressure measurement. The top (systolic)numberisthepressureinyourbloodvesselswhenyourheartbeats.Thebottom(diastolic)numberisthepressureinyourvessels when your heart rests between beats. A normal blood pressure is 120/80 mm HG or lower (NationalHeart,Lung andBloodInstitute).

6-8
Part 6
Eating a healthy diet, cutting back on sodium, reaching a healthy weight, staying active and lowering your stress level can help to lower a person’s blood pressure. If you don’t know your blood pressure,getitchecked.Formoreinformation,goto http://www.cdc.gov/bloodpressure/.
Blood Cholesterol, Lipoproteins, and Triglycerides
Our bodies use cholesterol to make hormones, cell walls, bile, and vitaminD.Butcholesterolcanbuildupinthebloodvessels.Thisbuildup is called plaque. Over time, plaque can make the arteries narrow and increases the chance of a heart attack. That’s why it’s good to know the levels of cholesterol in your blood. A blood test can measure total blood cholesterol, lipoprotein, and triglyceride levels:
Total cholesterol is the total amount of cholesterol in your blood.ItincludesHDL,LDL,andotherlipoproteinsthatcarrycholesterol through the blood.
LDL (bad) cholesterol —WhenLDLcholesterolishigh,moreplaque builds up in the arteries, raising your risk for heart disease. That’swhyLDLcholesteroliscalled“bad”cholesterol.
HDL (good) cholesterol helps remove cholesterol from the blood and prevent the fatty buildup, so this is the “good” cholesterol.Highernumbersarebetter.
Triglycerides are another fat in your blood that can also raise your heart disease risk. Ideally you want your fasting triglyceride leveltobelessthan150mg/dL.Thingsthatraisetriglyceridesinclude being overweight, physical inactivity, cigarette smoking, excessivealcoholuse,veryhighcarbohydratediets,certaindiseases and drugs, and genetic disorders.
Desirable Cholesterol Levels (fasting)
Total Cholesterol Less than 200 mg/dL
LDL Cholesterol (“Bad” Cholesterol) Less than 100 mg/dL
HDL Cholesterol (“Good” Cholesterol) 60 mg/dL or highter
Triglycerides Less than 150 mg/dL
What are lipoproteins? In order for cholesterol to travel through your blood, it’s coated with a layer of protein to make a “lipoprotein.” Low-density lipoprotein (LDL) and high-density lipoprotein (HDL) are two of the common lipoproteins. Your diet, activity level, and genetics can all affect your lipoprotein levels.
6-9
Your Own Checklist for Good Health
HighcholesterolisaconcernforAmerica.Asof2008,approximately44%ofadultsover20havetotalcholesterollevelsatorabove200(AmericanHeartAssociation,2011).Eatingahealthydiet,reachinga healthy weight, and staying active can help to improve levels of cholesterol and triglycerides.
For more information about cholesterol, check out “High Blood Cholesterol: What You Need to Know” from the National Cholesterol Education Program: http://www.nhlbi.nih.gov/health/public/heart/chol/wyntk.pdf. The information explains what your cholesterol numbers mean, how to calculate your heart disease risk, and how you can make healthy changes to your diet.
High Blood Glucose
Ifyourbloodglucose(orbloodsugar)ishigher than normal, that’s a sign that you may have diabetes. The number of Americans being diagnosed with diabetes continues to rise every year as does the numberofchildrenwhodevelopdiabetes.Diabetescanleadtoheartdisease, blindness, kidney failure, and amputation of feet and legs. DiabetesistheseventhleadingcauseofdeathintheUnitedStates.
People with prediabetes have blood glucose levels higher than normalbutnothighenoughtobeclassifiedasdiabetes.TheCDCestimatesthat35%oftheU.S.populationhasprediabetes(CDC,2011b),yetmostpeoplewithprediabetesdon’trealizetheyhaveit(CDC,2008).Ifyouhaveprediabetes,youhaveanincreasedriskof developing type 2 diabetes and a higher risk of heart disease and stroke.
What causes high levels of blood sugar? When you eat food, yourbodyturnsmostofitintoglucose.Normallyahormonecalledinsulin moves the glucose into the body’s cells where they use it for energy. But if you have diabetes your body either doesn’t make enough insulin or doesn’t use insulin as well as it should. The result? Glucosebuildsupintheblood.Andthat’swhymanypeoplewithdiabetes take oral medications or insulin shots to help keep their blood glucose levels normal. Eating a healthy diet, reaching a healthy weight, and staying active can help to lower a person’s risk of getting diabetes, and can help improve a diabetic’s blood glucose levels.
Diagnosing diabetes — Physicians use several different blood tests to see if a person’s blood glucose is higher than normal. The most common test is a fasting blood glucose test which measures yourbloodglucoseafternoteatingforatleast8hours.Anormalreadingislessthan100mg/dL.Formoreinformationaboutotherdiagnostic tests, treatment and management of diabetes, refer to theNationalDiabetesInformationClearinghousewebsiteathttp://diabetes.niddk.nih.gov/.
Do you know what your fasting blood glucose level is? About 35% of Americans have prediabetes, but most don’t realize they have it.

6-10
Part 6
Tobacco Use
If you smoke you are at a higher risk of having a stroke, a heart attack,vasculardisease,andananeurysm.Smokingraisesyourheartrate, tightens your arteries, increases your blood pressure, and makes yourheartworkharder.What’smore,thetarandcarbonmonoxidefrom cigarettes can cause plaque to build up in your arteries, and affect the level of blood clotting factors in your blood, raising your riskofabloodclot(NationalInstituteonDrugAbuse[NIDA],2010).
Andthat’snotall—tobaccocausesone-thirdofallcancersand90percentoflungcancercases.Smokingcanalsoleadtolungdiseasessuch as chronic bronchitis and emphysema, and it is linked to leukemia, cataracts, and pneumonia. On average, adults who smoke die14yearsearlierthannonsmokers(NIDA,2010).
Readytoquit?ThencontacttheTexasQuitlineatwww.yesquit.comor1-877-YESQUIT(1-877-937-7848).Theprogramisfreeandconfidential,andincludespersonalphonecounselingsessions,readingmaterials,andifavailable,participantscanreceive8weeksworthoffreepatches,gumorlozengesdesignedtohelp smokers quit.
Family History
Youcan’tchangethegenesyouinherited,buthopefullyyoucantryto avoid or lower your risk for any health problems that are part of yourfamilyhistory.Ifpossible,findoutasmuchasyoucanaboutthehealthhistoriesofyourparents,grandparentsandsiblings.Yourhealth-care provider can help you learn what kinds of preventive steps you can take based on your family’s health history.
Activity 6.5 — Check Your Family Health History. GotoyourBasicNutriti0nWorkbookandcompletetheactivity.

6-11
Your Own Checklist for Good Health Other Risk Factors
Other factors like stress, depression, mental health issues, and alcohol and drug abuse can affect your health and risk for disease. If you or a family member is suffering from one or more of these problems it’s important to know that you’re not alone. There is help available, and reaching out for help just might save your life or the life of a loved one. Talk to your health-care provider or contact your employer about their Employee Assistance Program.
SettingGoalsforaHealthyLifestyle
Howdoyoufeelaboutyourweight?Doyouwanttodomorephysicalactivity?Doyouhaveriskfactorsyoucanchange?Inthislast activity, you will take a close look at your health habits and then create at least one personal health goal. After the goal-setting exercise,completethetestforPart6.
Activity 6.6 — Health Habit Inventory/Goal. GotoyourBasicNutriti0nWorkbookandcompletetheactivity.
Part 6 Test: ThisistheendofPart6.Gotoyour BasicNutritionWorkbookandcompletethePart6test questions.

R-1
American Academy of Pediatrics (2001, February). Children, adolescents and television. Pediatrics, 107(2), 423-426. Retrieved from http://aappolicy.aappublications.org/cgi/reprint/pediatrics;107/2/423.pdf
American Heart Association (2009). Meet the fats. Some are bad, some are better. Retrieved from http://www.heart.org/idc/groups/heart-public/@wcm/@global/documents/downloadable/ucm_305572.pdf
American Heart Association (2011). Heart disease and stroke statistics—2011 update: a report from the American Heart Association. Journal of the American Heart Association, 123:e18-e209. Retrieved from http://circ.ahajournals.org/content/123/4/e18.full.pdf . DOI: 10.1161/CIR.0b013e3182009701
Appel, L. J., Frohlich, E. D., Hall, J. E., Pearson, T. A., Sacco, R. L., Seals, D. R., Sacks, F. M., Smith Jr., S. C., Vafiadis, D. K., & Van Horn, L. V. (2011, March). The importance of population-wide sodium reduction as a means to prevent cardiovascular disease and stroke: a call to action from the American Heart Association. Journal of the American Heart Association. doi:10.1161/CIR.0b013e31820d0793.
Bailey, R., Burt, V., Hughes, J., Yetley, E., Dwyer, J., Picciano, M.,... Sempos, C. (2011, April). Dietary supplement use among U.S. adults has increased since NHANES III (1988–1994). NCHS Data Brief, 61. Retrieved from http://www.cdc.gov/nchs/data/databriefs/db61.htm
Bryant, Charles W. (2008). How long can you go without food and water? HowStuffWorks.com. Retrieved from http://health.howstuffworks.com/diseases-conditions/death-dying/live-without-food-and-water.htm
California Department of Public Health WIC Program (2008, September). My wellness journal. Retrieved from http://www.cdph.ca.gov/programs/wicworks/Documents/HealthyHabits/WIC-HH4L-WellnessJournal.pdf
Center for Science in the Public Interest (2008). Salt assault: brand name comparisons of processed foods(2). Retrieved from http://www.cspinet.org/new/pdf/salt_report_update.pdf
Centers for Disease Control and Prevention (2008, November). Self-reported prediabetes and risk-reduction activities — United States, 2006. CDC MMWR Weekly 57(44);1203-1205. Retrieved from http://www.cdc.gov/mmwr/preview/mmwrhtml/mm5744a3.htm
ReferencesReferences
R-2
References
Centers for Disease Control and Prevention (2010a, December). Foodborne illness. Retrieved from http://www.cdc.gov/ncidod/dbmd/diseaseinfo/foodborneinfections_g.htm
Centers for Disease Control and Prevention (2010b, July). Food deserts. Retrieved from http://www.cdc.gov/Features/FoodDeserts/
Centers for Disease Control and Prevention (2010c, April). Nutrition for everyone: protein. Retrieved from http://www.cdc.gov/nutrition/everyone/basics/protein.html
Centers for Disease Control and Prevention (2010d, April). Nutrition for everyone: trans fat. Retrieved from http://www.cdc.gov/nutrition/everyone/basics/fat/transfat.html
Centers for Disease Control and Prevention (2011a, February). Assessing your weight. Retrieved from http://www.cdc.gov/healthyweight/assessing/index.html
Centers for Disease Control and Prevention (2011b, February). Physical activity for everyone: physical activity and health. Retrieved from http://www.cdc.gov/physicalactivity/everyone/health/index.html
Centers for Disease Control and Prevention (2011b). National diabetes fact sheet: national estimates and general information on diabetes and prediabetes in the United States, 2011. Retrieved from: http://www.cdc.gov/diabetes/pubs/pdf/ndfs_2011.pdf
Cordero, A., Berry R. J., Boyle, C., Dietz, W., Johnston Jr., R., Leighton, J., & Popovic, T. (2010, August). CDC Grand Rounds: additional opportunities to prevent neural tube defects with folic acid fortification. Morbidity and Mortality Weekly Report, 59(31), 980-984.
East Carolina University, Brody School of Medicine, Department of Family Medicine. (n.d.). Physical activity assessment. Retrieved from http://www.ecu.edu/cs-dhs/fammed/customcf/resources/fitness/physical_activity_assessment.pdf
Ginde, A. A., Liu, M. C., & Camargo, C. A. (2009, March). Demographic Differences and Trends of Vitamin D Insufficiency in the US Population, 1988-2004. Archives of Internal Medicine, 169(6), 626-632.
Higdon, J. (2005). Whole Grains. Linus Pauling Institute Micronutrient Information Center. Retrieved from http://lpi.oregonstate.edu/infocenter/foods/grains/index.html#disease_prevention

R-3
References
Institute of Medicine [IOM] (2005a). Dietary reference intakes for energy, carbohydrate, fiber, fat, fatty acids, cholesterol, protein, and amino acids. Retrieved from http://www.nap.edu/openbook.php?isbn=0309085373
Institute of Medicine (2005b). Potassium. Dietary reference intakes for water, potassium, sodium chloride, and sulfate, 186-268. Retrieved from http://www.nap.edu/openbook.php?record_id=10925&page=R1
Jacobs D. ,Marquart L., Slavin J., Kushi L. (1998). Whole-grain intake and cancer: an expanded review and meta-analysis. Nutr Cancer, 30(2), 85-96. Retrieved from: http://www.ncbi.nlm.nih.gov/pubmed/9589426
Looker, A. C., Johnson C. L., Lacher, D. A., Pfeiffer, C. M., Schleicher, R. L., & Sempos, C.T. (2011, March). Vitamin D Status: United States, 2001-2006. National Center for Health Statistics Data Brief, 59.
Mattes, R. D., & Donnelly, D. (1991). Relative contributions of dietary sodium sources. Journal of the American College of Nutrition, 10(4), 383-393.
Mayo Foundation for Medical Education and Research (2010, April). Nutrition and healthy eating, calorie calculator. Retrieved from http://www.mayoclinic.com/health/calorie-calculator/NU00598
Mayo Foundation for Medical Education and Research (2011a, February). Dietary fats: know which ones to choose. Retrieved from http://www.mayoclinic.com/health/fat/NU00262
Mayo Foundation for Medical Education and Research (2011b, March). Sodium: How to tame your salt habit now. Retrieved from http://www.mayoclinic.com/health/sodium/NU00284
MedlinePlus (2009). Dehydration. Retrieved from http://www.nlm.nih.gov/medlineplus/ency/article/000982.htm
National Academy of Sciences, Institute of Medicine Food and Nutrition Board (2011). Dietary Reference Intakes: recommended intakes for individuals. Retrieved from http://www.iom.edu/Activities/Nutrition/SummaryDRIs/~/media/Files/Activity%20Files/Nutrition/DRIs/New%20Material/5DRI%20Values%20SummaryTables%2014.pdf

R-4
References
National Center for Complementary and Alternative Medicine, National Institutes of Health (2011). Backgrounder - Antioxidant Supplements for Health: An Introduction. NCCAM Publication No. D450R. Retrieved from http://nccam.nih.gov/health/antioxidants/introduction.htm
National Heart, Lung and Blood Institute, National Institute of Health (n.d.). What are High Blood Pressure and Prehypertension? Retrieved from http://www.nhlbi.nih.gov/hbp/hbp/whathbp.htm
National Institute of Diabetes and Digestive and Kidney Diseases [NIDDK] (2008, November). Waist and waist measurement: tools for adults. NIH Publication No. 04–5283. Retrieved from http://win.niddk.nih.gov/Publications/tools.htm
National Institutes of Health, National Institute of Arthritis and Musculoskeletal and Skin Diseases [NIAMS] National Resource Center (2009). What is bone? Retrieved from http://www.niams.nih.gov/Health_Info/Bone/Bone_Health/default.asp
National Institutes of Health, Office of Dietary Supplements [NIH, ODS] (2006). Dietary supplement fact sheet: vitamin A and carotenoids. Retrieved from http://ods.od.nih.gov/factsheets/vitamina/
National Institutes of Health, Office of Dietary Supplements (2007). Dietary supplement fact sheet: iron. Retrieved from http://ods.od.nih.gov/factsheets/Iron-HealthProfessional/
National Institutes of Health, Office of Dietary Supplements (2009). Dietary supplement fact sheet: Folate. Retrieved from http://ods.od.nih.gov/factsheets/Folate-HealthProfessional/
National Institutes of Health, Office of Dietary Supplements (2010). Dietary supplement fact sheet: vitamin C. Retrieved from http://ods.od.nih.gov/factsheets/VitaminC-HealthProfessional/
National Institutes of Health, Office of Dietary Supplements (2011a). Dietary supplement fact sheet: calcium. Retrieved from http://ods.od.nih.gov/factsheets/Calcium-HealthProfessional/
National Institutes of Health, Office of Dietary Supplements (2011b). Dietary supplement fact sheet: vitamin D. Retrieved from http://ods.od.nih.gov/factsheets/VitaminD-HealthProfessional/
National Institute on Drug Abuse [NIDA] (2010, August). NIDA infofacts: cigarettes and other tobacco products. Retrieved from: http://www.drugabuse.gov/infofacts/tobacco.html

R-5
References
Nord, M., Coleman-Jensen A., Andrews M., and Carlson S. (2010). Household food security in the United States, 2009. Key statistics and graphs. U.S. Department of Agriculture, Economic Research Service Report No. ERR-108. Retrieved from http://www.ers.usda.gov/Briefing/FoodSecurity/stats_graphs.htm
Popkin B. M., Armstrong L. E., Bray G. M., Caballero, B., Frei, B. Willett, W. C. (2006). A new proposed guidance system for beverage consumption in the United States. Am J Clin Nutr, 83(3):529-42.
Risérus, U., Willett, W., and Hu, F. (2009). Dietary fats and prevention of type 2 diabetes. Progress in Lipid Research, 48(1), 44-51. doi:10.1016/j.plipres.2008.10.002
Romero-Corral A, Somers VK, Sierra-Johnson J, Korenfeld Y, Boarin S, Korinek J., ...Lopez-Jimenez F. (2010). Normal weight obesity: a risk factor for cardiometabolic dysregulation and cardiovascular mortality. European Heart Journal, 31(6), 737-46. doi: 10.1093/eurheartj/ehp487. Retrieved from http://www.ncbi.nlm.nih.gov/pmc/articles/PMC2838679/
Smith, E. L., Mechanick, J. I. (2008). Hydration and nutrition for the athlete. Essential Sports Medicine, 169-180. DOI: 10.1007/978-1-59745-414-8_12. Retrieved from http://www.springerlink.com/context/x24uj3q4252lxr48/
The National Center for Addiction and Substance Abuse at Columbia University (2010, September). The Importance of Family Dinners V. Retrieved from: http://www.casacolumbia.org
Troiano, R.P., Berrigan, D., Dodd, K. W., Masse, L. C.; Tilert, T., McDowell, M. (2008). Physical activity in the United States measured by accelerometer. Medicine & Science in Sports & Exercise, 40(1), 181-188. doi: 10.1249/mss.0b013e31815a51b3.
U.S. Department of Agriculture & U.S. Department of Health and Human Services (2010a, December). Dietary Guidelines for Americans 2010. (7th Edition). Retrieved from http://www.cnpp.usda.gov/DGAs2010-PolicyDocument.htm
U.S. Department of Agriculture & U.S. Department of Health and Human Services (2010b, June). Report of the dietary guidelines advisory committee on the dietary guidelines for Americans, 2010. Retrieved from http://www.cnpp.usda.gov/DGAs2010-DGACReport.htm
R-6
References
U.S. Department of Agriculture, Agricultural Research Service (2010c, September). USDA National nutrient database for standard reference, Release 23. Retrieved from http://www.ars.usda.gov/ba/bhnrc/ndl
U.S. Department of Agriculture (2011, July). MyPlate. Retrieved from http://www.choosemyplate.gov/
U.S. Department of Health and Human Services (2008, October). 2008 Physical Activity Guidelines for Americans. Retrieved from http://www.health.gov/paguidelines/pdf/paguide.pdf
U.S. Department of Health and Human Services (n.d). Health facts: sodium and potassium. Retrieved from http://www.csrees.usda.gov/nea/food/pdfs/hhs_facts_sodium.pdf
U.S. Food and Drug Administration (2003, September). Revealing trans fats. FDA Consumer. Retrieved from http://findarticles.com/p/articles/mi_m1370/is_5_37/ai_109906683/
U.S. Food and Drug Administration (2011a). How to understand and use the nutrition facts label. Retrieved from http://www.fda.gov/Food/LabelingNutrition/ConsumerInformation/ucm078889.htm
U.S. Food and Drug Administration (2011b). Talking about trans fat: what you need to know. Retrieved from http://www.fda.gov/food/resourcesforyou/consumers/ucm079609.htm
Wheeler, M. L., Daly, A., Evert A., Franz, M. J., Geil P., Holzmeister, L. A., Kulkarni K., Loghmani E., Ross, T. A., & Woolf, P. (2008, May). Choose Your Foods: Exchange Lists for Diabetes. Journal of the American Dietetic Association, 108(5). doi: 10.1016/j.jada.2008.02.002
World Health Organization (2008, December). Waist circumference and waist-hip ratio, report of a WHO Expert Consultation, Geneva, 8-11. Retrieved from http://whqlibdoc.who.int/publications/2011/9789241501491

G-1
Added sugars – Sugars, syrups, and other caloric sweeteners that are added to foods during processing or preparation. Added sugars do not include naturally occurring sugars such as those in fruit or milk. Added sugars include: brown sugar, corn sweetener, corn syrup, dextrose, fructose, fruit juice concentrates, glucose, high-fructose corn syrup, honey, invert sugar, lactose, maltose, malt syrup, molasses, raw sugar, turbinado sugar, trehalose, and sucrose.
Alcohol – A dietary component that provides energy but no essential nutrients. 1 gram of alcohol provides 7 calories.
Amino Acids – Any of a large number of compounds found in living cells that contain carbon, oxygen, hydrogen, and nitrogen. Twenty of the naturally occurring amino acids connect to each other in chains to form the building blocks of proteins. (See essential amino acids.)
Antioxidant – A chemical compound or substance that inhibits oxidation. Certain vitamins such as vitamin E are antioxidants and may protect body cells from damage caused by the oxidative effects of free radicals.
Blood cholesterol – Cholesterol that travels in the blood as part of distinct particles containing both lipids and proteins (lipoproteins). Three major classes of lipoproteins are found in the serum of a fasting individual: low-density lipoprotein (LDL), high-density lipoprotein (HDL), and very-low-density lipoprotein (VLDL). Another lipoprotein class, intermediate-density lipoprotein (IDL), resides between VLDL and LDL; in clinical practice IDL is included in the LDL measurement. Elevated lipid levels in the blood is known as hyperlipidemia. (See HDL cholesterol and LDL cholesterol.)
Body mass index (BMI) – A measure of weight in kilograms (kg) relative to height in meters (m) squared. BMI is considered a reasonably reliable indicator of total body fat, which is related to the risk of disease and death. BMI status categories include underweight, healthy weight, overweight, and obese. Overweight and obese describe ranges of weight that are greater than what is considered healthy for a given height while underweight describes a weight that is lower than what is considered healthy. Because children and
GlossaryGlossary
G-2
Glossary
adolescents are growing, their BMI is plotted on growth charts for sex and age. The percentile indicates the relative position of the child’s BMI among children of the same sex and age.
Calorie – Unit of (heat) energy available from the metabolism of food that is required to sustain the various body functions, including metabolic processes and physical activity. Carbohydrate, fat, protein, and alcohol provide all of the energy supplied by foods and beverages.
Calcium – A mineral found mainly in the hard part of bones where it is stored. Calcium is constantly being used and replaced in the body. Calcium is essential for healthy bones, muscle contraction, heart action, nervous system maintenance, and normal blood clotting. Food sources of calcium include dairy foods, some leafy green vegetables such as broccoli and collards, canned salmon, clams, oysters, calcium-fortified foods, and tofu.
Calorie balance – The balance between calories consumed through eating and drinking and those expended through physical activity and metabolic processes.
Carbohydrates – One of the four dietary components that provides energy. 1 gram of carbohydrate provides 4 calories. The three main types of carbohydrates are sugars, starches, and fibers. (See sugars, starches, and fiber.)
Cardiovascular disease – Diseases of the heart and diseases of the blood vessel system (arteries, capillaries, veins).
Cholesterol – A natural sterol present in all animal tissues. Free cholesterol is a component of cell membranes and serves as a precursor for steroid hormones (estrogen, testosterone, aldosterone), and for bile acids. Humans are able to synthesize sufficient cholesterol to meet biologic requirements, and there is no evidence for a dietary requirement for cholesterol. (See blood cholesterol and dietary cholesterol.)
Complete proteins – Proteins containing all nine of essential amino acids. Animal foods are complete proteins; examples include fish, poultry, meat, eggs and milk products. Soybeans are the only plant product considered a complete protein.
Percent Daily Value – The Percent Daily Value appears on the Nutrition Facts label of packaged foods. It tells you if a serving of food is high or low in a nutrient.

G-3
Glossary
Diabetes – A disorder of metabolism—the way the body uses digested food for growth and energy. In diabetes, the pancreas either produces little or no insulin (a hormone that helps glucose, the body’s main source of fuel, get into cells), or the cells do not respond appropriately to the insulin that is produced. The three main types of diabetes are type 1, type 2, and gestational diabetes. About 90 to 95 percent of people with diabetes have type 2. This form of diabetes is most often associated with older age, obesity, family history of diabetes, previous history of gestational diabetes, physical inactivity, and certain ethnicities. About 80 percent of people with type 2 diabetes are overweight. (See prediabetes.)
Dietary cholesterol – Cholesterol found in foods of animal origin including meat, seafood, poultry, eggs, and dairy products. Biologically a liver is required to produce cholesterol, thus plant foods, such as grains, vegetables and fruits, and oils contain no dietary cholesterol.
Dietary supplement – A product taken orally that contains one or more ingredients that are not considered food but are intended to supplement one’s diet. Dietary supplements are not regulated for safety and effectiveness in the United States.
Empty-calorie foods – Foods that contain solid fats and/or added sugars. These foods contribute calories to the diet but few or no nutrients.
Enrichment – The addition of specific nutrients (iron, thiamin, riboflavin, and niacin) to refined-grain products in order to replace losses of the nutrients that occur during processing.
Essential Amino Acids – Amino acids that cannot be synthesized in the cells of humans and must be consumed as part of the diet. There are eight essential amino acids.
Essential nutrient – A vitamin, mineral, fatty acid, or amino acid required for normal body functioning that either cannot be synthesized by the body at all, or cannot be synthesized in amounts adequate for good health, and thus must be obtained from a dietary source. Other food components, such as dietary fiber, while not essential, also are considered to be nutrients.
Fats – One of the four dietary components that provides energy. 1 gram of fat provides 9 calories. (See solid fats, oils, monounsaturated fats, polyunsaturated fats, omega-3 fats, saturated fats, and trans fats.)

G-4
Glossary
Fiber – Nondigestible carbohydrates and lignin that are intrinsic and intact in plants. Fiber consists of dietary fiber (the fiber naturally occurring in foods) and functional fiber, which are isolated, nondigestible carbohydrates that have beneficial physiological effects in humans.
Food desert – Large geographic areas where healthy, affordable food is difficult to obtain, often due to grocery store shortages. Food deserts occur in both rural and urban areas and are most prevalent in low-socioeconomic minority communities. People living in food deserts may rely on fast food chains or convenience stores for food.
Food insecurity – The limited or uncertain availability of nutritionally adequate and safe foods or uncertain ability to acquire acceptable foods in socially acceptable ways.
Folate/Folic acid – One of the B vitamins that is a key factor in making nucleic acid (DNA and RNA). Lack of adequate folic acid during pregnancy increases the risk for the baby to have a birth defect involving the spinal cord and brain; a neural tube defect such as spina bifida (incomplete development of spinal cord) or anencephaly (absence of a major portion of the brain, skull and scalp). Folic acid is the synthetic version of folate that is added to cereals and other products.
Fortification – The addition of one or more essential nutrients to a food whether or not it is normally contained in the food. Fortification may be used for preventing or correcting a deficiency in the population or specific population groups; to restore naturally occurring nutrients lost during processing, storage, or handling; or to increase the nutrient level above that found in comparable food and to serve as a meaningful source of the specific nutrient.
HDL Cholesterol – The cholesterol in high-density lipoproteins also known as “good” cholesterol. A high level in the blood is thought to lower the risk of coronary artery disease.
Hydrogenation – A chemical reaction that adds hydrogen atoms across a double bonded carbon. Oils are frequently hydrogenated to increase shelf-life. Hydrogenation creates some trans-fat molecules, which have been determined to be dangerous and have a negative effect on cardiovascular health.

G-5
Glossary
Hypertension – A condition, also known as high blood pressure in which blood pressure is >140/90 mm HG and remains elevated over time. Hypertension makes the heart work too hard, and the high force of the blood flow can harm arteries and organs such as the heart, kidneys, brain, and eyes. Uncontrolled hypertension can lead to heart attacks, heart failure, kidney disease, stroke, and blindness. (See prehypertension.)
Incomplete proteins – Proteins that lack one or more of the nine essential amino acids. Incomplete proteins are non-animal products. Examples of incomplete proteins include beans, peas, nuts, seeds and grains. Vegetables also contain small amounts of incomplete proteins. Incomplete plant proteins can be combined to form a complete protein if they provide all of the essential amino acids. Examples of plant protein combinations that make a complete protein include rice and beans or corn and beans.
Iron – A mineral that allows red blood cells to transport oxygen and carbon dioxide throughout the body. Iron also plays an important role in enzymatic reactions, brain development and the immune system. (See iron deficiency and iron-deficiency anemia.)
Iron-deficiency – A condition resulting from too little iron in the body. It is usually due to poor dietary intake, poor absorption, rapid growth or major blood loss. During the initial stages of iron-deficiency, there may be no symptoms. More advanced iron-deficiency can lead to iron-deficiency anemia and physical symptoms.
Iron-deficiency anemia – The advanced stage of iron deficiency. Symptoms of iron-deficiency anemia include lack of energy, decreased cognition, inflamed tongue and difficulty breathing.
LDL cholesterol – The cholesterol in low-density lipoproteins also known as “bad” cholesterol. A high blood level of LDL cholesterol is related to various pathogenic conditions.
Mindful eating – Eating principle that focuses on a conscious nonjudgmental awareness of food choices and attention to hunger and satiety cues.
Monounsaturated fats – Monounsaturated fatty acids (MUFAs) have one double bond. Plant sources that are rich in MUFAs include nuts and vegetable oils that are liquid at room temperature. Examples include canola oil, olive oil, and high oleic safflower and sunflower oils.

G-6
Glossary
Naturally-present sugars – Sugars that occur naturally in fruits, vegetables, milk and milk products. Naturally-present sugars are in nutrient-dense foods that supply vitamins, minerals and other substances with relatively few calories. (See added sugars).
Nutrient-dense foods – Nutrient-dense foods and beverages provide vitamins, minerals, and other substances that may have positive health effects with relatively few calories. The term “nutrient dense” indicates the nutrients and other beneficial substances in a food have not been “diluted” by the addition of calories from added solid fats, added sugars, or added refined starches, or by the solid fats naturally present in the food. Nutrient-dense foods and beverages are lean or low in solid fats, and minimize or exclude added solid fats, sugars, starches, and sodium. Ideally, they also are in forms that retain naturally occurring components, such as dietary fiber. All vegetables, fruits, whole grains, seafood, eggs, beans and peas, unsalted nuts and seeds, fat-free and low-fat milk and milk products, and lean meats and poultry — when prepared without solid fats or added sugars — are nutrient-dense foods.
Oils – Fats that are liquid at room temperature. Oils come from many different plants and from seafood. Some common oils include canola, corn, olive, peanut, safflower, soybean, and sunflower oils. A number of foods are naturally high in oils such as nuts, olives, some fish, and avocados. Most oils are high in monounsaturated or polyunsaturated fats and low in saturated fats. A few plant oils, including coconut oil and palm kernel oil are high in saturated fats and for nutritional purposes should be considered solid fats. Hydrogenated oils that contain trans fats also should be considered solid fats for nutritional purposes. (See Fats, Monounsaturated fats, Omega-3 fats and Polyunsaturated fats).
Omega-3 fats – Also called n-3 fatty acids. Alpha-linolenic acid is an n-3 fatty acid that is required because it is not synthesized by humans and therefore is considered essential in the diet. It is obtained from plant sources including soybean oil, canola oil, walnuts, and flaxseed. Eicosapentaenoic acid (EPA) and docosahexaenoic acid (DHA) are long chain n-3 fatty acids that are contained in fish and shellfish.
Osteoporosis – A bone disease characterized by decrease in bone mass and density resulting in a predisposition to fractures and bone deformities. It occurs most commonly in women after menopause as

G-7
Glossary
a result of estrogen deficiency. Calcium supplementation and weight-bearing exercise are used to treat and prevent osteoporosis.
Physical activity – Any body movement that works your muscles and uses more energy than you use when you’re resting. Walking, running, dancing, swimming, yoga, and gardening are examples of physical activity.
Plaque – A substance made up of fat, cholesterol, calcium, and other substances found in the blood. Over time plaque hardens and narrows the arteries. This limits the flow of oxygen-rich blood to the organs and other parts of the body. Atherosclerosis is a disease in which plaque builds up inside your arteries.
Portion size – The amount of a food served or consumed in one eating occasion. A portion is not a standardized amount, and the amount considered to be a portion is subjective and varies. (See serving size.)
Potassium – A mineral that is important for normal cell function, the nervous system and the heart. Potassium helps to lower blood pressure, reduce risk of kidney stones and decrease bone loss. Food sources of potassium include dairy foods, vegetables like potatoes, tomatoes, carrots, spinach and fruits such as bananas and oranges.
Prediabetes – Also called impaired fasting glucose or impaired glucose tolerance. A state in which blood glucose levels are higher than normal but not high enough to be called diabetes.
Prehypertension – Blood pressure that is higher than normal but not high enough to be defined as hypertension. It is defined as blood pressures between 120/80 mm Hg and 139/89 mm Hg.
Polyunsaturated fats – Also called n-6 fatty acids. Polyunsaturated fatty acids (PUFAs) have two or more double bonds. Linoleic acid, one of the n-6 fatty acids, is essential but cannot be synthesized by humans. Primary sources are liquid vegetable oils, including soybean oil, corn oil, and safflower oil.
Proteins – One of the four dietary components that provides energy. 1 gram of protein provides 4 calories. Proteins are composed of amino acids, nine of which cannot be made by the body so they must be obtained from the diet. The quality of a source of dietary protein depends on its ability to provide the nitrogen and amino acid requirements that are necessary for the body’s growth, maintenance,
G-8
Glossary
and repair. Food sources of protein include fish, poultry, lean beef and pork, eggs, dairy products, dried beans, nuts and nut butters. (See complete proteins and incomplete proteins.)
Refined grains – Grains and grain products missing the bran, germ, and/or endosperm; any grain product that is not a whole grain. Many refined grains are low in fiber and enriched with thiamin, riboflavin, niacin, and iron, and fortified with folic acid as required by U.S. regulations. (See enrichment.)
Rickets – A deficiency disease resulting from a lack of vitamin D or calcium and insufficient exposure to sunlight. Rickets occurs in children and is characterized by defective bone growth such as short stature, bowed legs or easily broken bones.
Saturated fats – Saturated fatty acids have no double bonds. Examples include the fatty acids found in animal products such as meat, milk and milk products, hydrogenated shortening, and coconut or palm oils. In general foods with relatively high amounts of saturated fatty acids are solid at room temperature.
Trans fats – Unsaturated fatty acids that contain one or more isolated double bonds in a trans configuration produced by chemical hydrogenation. Sources of trans fatty acids include hydrogenated/partially hydrogenated vegetable oils that are used to make shortening and commercially prepared baked goods, snack foods, fried foods, and margarine. Trans fatty acids also are present in foods that come from ruminant animals (e.g., cattle and sheep). Such foods include dairy products, beef, and lamb.
Seafood – Marine animals that live in the sea and in freshwater lakes and rivers. Seafood includes fish, such as salmon, tuna, trout, and tilapia, and shellfish, such as shrimp, crab, and oysters.
Serving size – A standardized amount of a food such as a cup or an ounce used in providing information about a food within a food group, such as in dietary guidance. Serving size on the Nutrition Facts label is determined based on the Reference Amounts.
Sodium – A mineral that plays an important role in nerve function, muscle contraction and fluid balance in the body. Too much or too little sodium can cause cells to malfunction. Too much sodium can lead to high blood pressure and increased risk for heart disease and stroke.

G-9
Glossary
Solid fats – Fats that are usually not liquid at room temperature. Solid fats are found in most animal foods but also can be made from vegetable oils through hydrogenation. Some common solid fats include: butter, beef fat (tallow, suet), chicken fat, pork fat (lard), stick margarine, coconut oil, palm oil, and shortening. Foods high in solid fats include: full-fat (regular) cheese, cream, whole milk, ice cream, well-marbled cuts of meats, regular ground beef, bacon, sausages, poultry skin, and many baked goods (such as cookies, crackers, donuts, pastries, and croissants). Solid fats contain more saturated fatty acids and/or trans fatty acids, and less monounsaturated or polyunsaturated fatty acids than do most oils, which are liquid at room temperature.
Starches – Many glucose units linked together into long chains. Examples of foods containing starch include grains (e.g., brown rice, oats, wheat, barley, corn), beans and peas (e.g., kidney beans, garbanzo beans, lentils, split peas), and tubers (e.g., potatoes, carrots). Refined starches are added to foods during food processing or cooking as thickeners and stabilizers. Corn starch is an example of a refined starch.
Sugars – A simple carbohydrate composed of one unit (a monosaccharide such as glucose or fructose) or two joined units (a disaccharide such as lactose or sucrose). Sugars include those occurring naturally in foods, those added to foods during processing and preparation, and those consumed separately.
Triglycerides – The major form of fat stored by the body. A triglyceride consists of three molecules of fatty acid combined with a glycerol molecule. Triglycerides serve as the backbone of many types of lipids (fats). Triglycerides come from the food we eat as well as from being produced by the body.
Vitamin A – A fat-soluble vitamin important for normal vision, tissue growth, and healthy skin. It is found in fish-liver oils, milk, green leafy vegetables, and red, orange, and yellow vegetables and fruits. A deficiency of vitamin A in humans causes poor vision at night and damage to the skin and mucous membranes.
Vitamin D – A fat-soluble vitamin occurring in several forms, especially vitamin D2 or vitamin D3. Vitamin D is necessary for normal bone growth. Vitamin D is found in milk, fish, and eggs and can be produced in the skin on exposure to sunlight. A deficiency of vitamin D in the diet causes rickets in children.
G-10
Glossary
Vitamin C – A water-soluble vitamin that is important for healthy skin, teeth, bones, and blood vessels. It is found in citrus fruits, tomatoes, potatoes, and green leafy vegetables. A deficiency of vitamin C in the diet causes scurvy.
Waist circumference – A measurement of the girth of the waist. Fat around the waist increases the risk of obesity-related health problems. Women with a waist measurement of more than 35 inches or men with a waist measurement of more than 40 inches have a higher risk of developing obesity-related health problems, such as diabetes, high blood pressure, and heart disease.
Water – A clear, colorless, tasteless, odorless liquid that is essential for plant and animal life. In the human body water helps to lubricate joints and organs, regulate temperature, and remove waste products. Water also makes up major bodily fluids such as blood, saliva, swear, urine, and amniotic fluid.
Whole Grains – Grains and grain products made from the entire grain seed, usually called the kernel, which consists of the bran, germ, and endosperm. If the kernel has been cracked, crushed, or flaked, it must retain nearly the same relative proportions of bran, germ, and endosperm as the original grain in order to be called whole grain.
K-1
Part 1 Test
1. TRUE
2. FALSE
3. TRUE
4. e
5. b
6. a
7. e
Part 2 Test
1. d
2. FALSE
3. □ Age
□ Medical conditions
□ Gender
□ Weight
4. b
5. d
6. TRUE
7. FALSE
8. FALSE
Answer KeyBasic Nutrition Module Answer Key
K-2
Answer Key
Part 3 Test
1. □ Energy drinks
□ Apple pie
□ Fruit punch
□ Ice cream
2. FALSE
3. TRUE
4. TRUE
5. □ Shortening
□ Partially-hydrogenated vegetable oil
□ Whole milk
6. TRUE
7. TRUE
8. TRUE
9. □ Egg
□ Beef
10. TRUE
11. TRUE
12. FALSE
K-3
Answer Key
Part 4 Test
1. TRUE
2. FALSE
3. TRUE
4. d
5. b
6. d
7. □ Spinach
□ Fortified breakfast cereal
□ Black-eyed peas
□ Asparagus
8. □ Yogurt
□ Canned salmon with edible bones
□ Mozzarella cheese
□ Calcium-fortified orange juice
□ Milk
9. c
10. c

K-4
Answer Key
Part 5 Test
1. □ Regular soda
□ Doughnut
□ Candy
2. c
3. d
4. c
5. a
6. b
7. □ Turning off your cell phone during dinner.
□ Taking time to eat meals slowly.
8. c

K-5
Answer Key
Part 6 Test
1. TRUE
2. TRUE
3. FALSE
4. FALSE
5. TRUE
6. TRUE
7. TRUE
8. d
9. □ High blood pressure
□ High cholesterol and triglycerides
□ High blood glucose
□ Family history of chronic disease
□ Tobacco use


Nutrition Services Section Nutrition Education / Clinic Services UnitTexas Department of State Health Services
Stock No. 13-33July 2012
A companion publication, Basic Nutrition Module Workbook,stock number 13-33-1, is also available from DSHS.
In accordance with Federal Law and U.S. Department of Agriculture policy, this institution is prohibited from discriminating on the basis of race, color, national origin, sex, age, or disability.
To file a complaint of discrimination, write USDA, Director, Office of Adjudication, 1400 Independence Avenue, SW, Washington, D.C. 20250-9410 or call toll free 1-866-632-9992 (Voice). Individuals who
are hearing impaired or have speech disabilities may contact USDA through the Federal Relay Service at 1-800-877-8339; or 1-800-845-6136 (Spanish). USDA is an equal opportunity provider and employer.
Copyright 2012. No part of this manual may be reproduced or sold for commercial purposes without the express written permission of the Department of State Health Services, Nutrition Services Section.


![Odu%20 clinical%20science%20iii%20dcd%202011[1]](https://img.pdfslide.us/doc/110x75/55a736f71a28abd3528b46c5/odu20-clinical20science20iii20dcd2020111-55b0f672b26fc.jpg)


![Odu%20 clinical%20sciences%20iii%20high%20risk%20infant%202011[1]](https://img.pdfslide.us/doc/110x75/554b3179b4c905da088b5018/odu20-clinical20sciences20iii20high20risk20infant2020111.jpg)


![Odu%20 clinical%20science%20iii%20bpi%202011[1]](https://img.pdfslide.us/doc/110x75/5562dd99d8b42a49398b57b0/odu20-clinical20science20iii20bpi2020111.jpg)