Embed Size (px)
Citation preview
Chapter - 4
The effect of pH on the growth of Penaeus monodon (Fabricius) reared in the laboratory.
46
INTRODUCTION
There are many environmental factors interacting with the life cycle
of Penieus monodon (Fabricius). These factors are generally
responsible not only for the survival of the young and delicate
juveniles but also control physiological processes of the organism.
In a particular ecosystem, these factors are well defined and
among them pH is considered to be a most predominant abiotic
factor affecting the physiology of the juvenile shrimps. The growth
of an organism either directly or by altering the nutritional status of
the water is influenced by this factor. It also helps in determining the
environmental setting and geochemistry of the ocean (Mackenzie
and Garrels, 1966; Garrels and Mackenzie, 1967; Silien, 1967;
Stumm and Morgan, 1970). Mook and Koene (1975) have proposed._
a theoretical model for predicting the pH level in an estuary.
In a natural ecosystem, many factors act simultaneously and
it is not very easy to judge which factor affecting more on the
physiology of the animal. However, interaction of these factors on
the life cycle of the animal can be studied in detail in the laboratory
under controlled conditions. Several attempts have been made to
show that in the ambient water, pH plays a significant role on the
physiology of crustaceans (Power, 1930; Davis Ozburn, 1969).
47
A detailed study has not been reported so far, to show the
effect of pH on the physiology of young shrimps of P. monodon.
Therefore, an attempt was made and reported here to know exactly
the effect of pH on the growth of P. monodon under controlled
conditions.
MATERIAL AND METHODS
The postlarvae of Penaeus monodon (Fabricius) ranging in
weight from 0.3 to 0.A were collected from a single spawn from a
commercial hatchery. The juveniles were transported carefully with
adequate aeration and acclimated for 36 hours in different pH in
the laboratory before the commencement of the experiment.
In the present study, the shrimps (6.1-8.0 in weight)
previously acclimated in the laboratory conditions were considered
to know the effects of different pH on the growth. The experiment
was conducted under controlled conditions in a closed seawater
system where 5 glass aquarium tanks (cap 200 I) were used. The
salinity of the seawater was maintained to 30 x 10 -3 by adding
instant ocean synthetic sea salt/fresh salt. All experiments were
conducted at a constant temperature. The temperature of the
circulating water was controlled by a thermostatically regulated
titanium heaters (range: 30 - 100 ±1 ° C).
48
In each experimental tank, 10 specimens of approximately the
same size were kept at different pH in the experimental tanks. pH
ranging from 5 to 9 were maintained by adding 1N HCI or 1N
NaOH. The pH of the water was measured with the help of a
portable pH meter (Philips PP 9046) after calibrating it with standard
pH buffers of 4, 7.0 and 9.2.
The animals were fed regularly twice in a day at the rate of
10% of the body weight with a formulated feed (Grower A - Higashi
3000). The unfed food particles and moult if present, was siphoned
out every morning. Weight of each individual was recorded weekly
on an Electronic Digital Scale Single Pan Balance (Essae Digi
Model DC- 80 Precision 10 mg) after blotting the body of the
animal on a blotting paper to remove the water. Mean weekly
weight of the shrimps was determined after recording the weight of
each of the animal and the data were tested statistically by applying
Two-Way ANOVA. The experiment was conducted for a period of 6
weeks.
Mean weekly weight, specific growth rate (G), von
Bertalanffy's growth equation for each week attained by the
shrimps was calculated as described in Chapter 2.
49
RESULTS
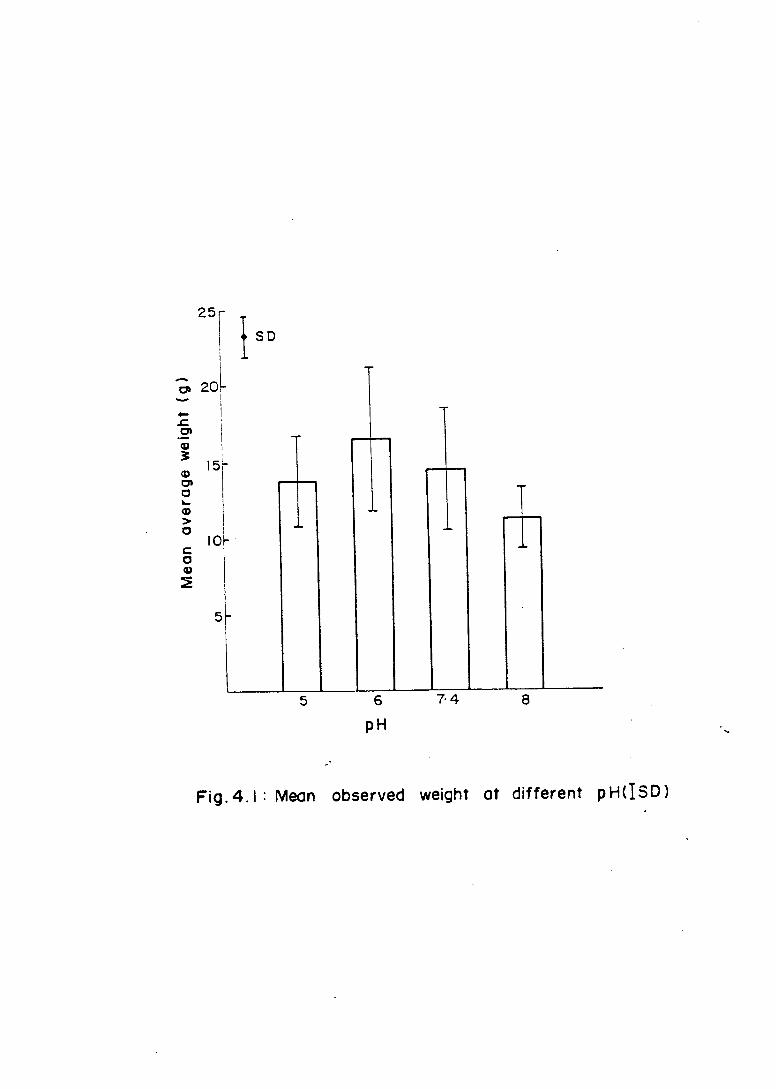
The average growth with respect to different pH is presented
in Fig. 4.1. Maximum growth was recorded at pH 6 (p<0.05 r=0.98)
whereas, it was moderate at pH 7.4 (p<0.05 r=0.89). However, the
growth in the shrimps was minimum at pH 5.0 and 8.0. A heavy
mortality in the shrimps was recorded at pH 9.0 where all the
animals were dead within one hour of the experiment.
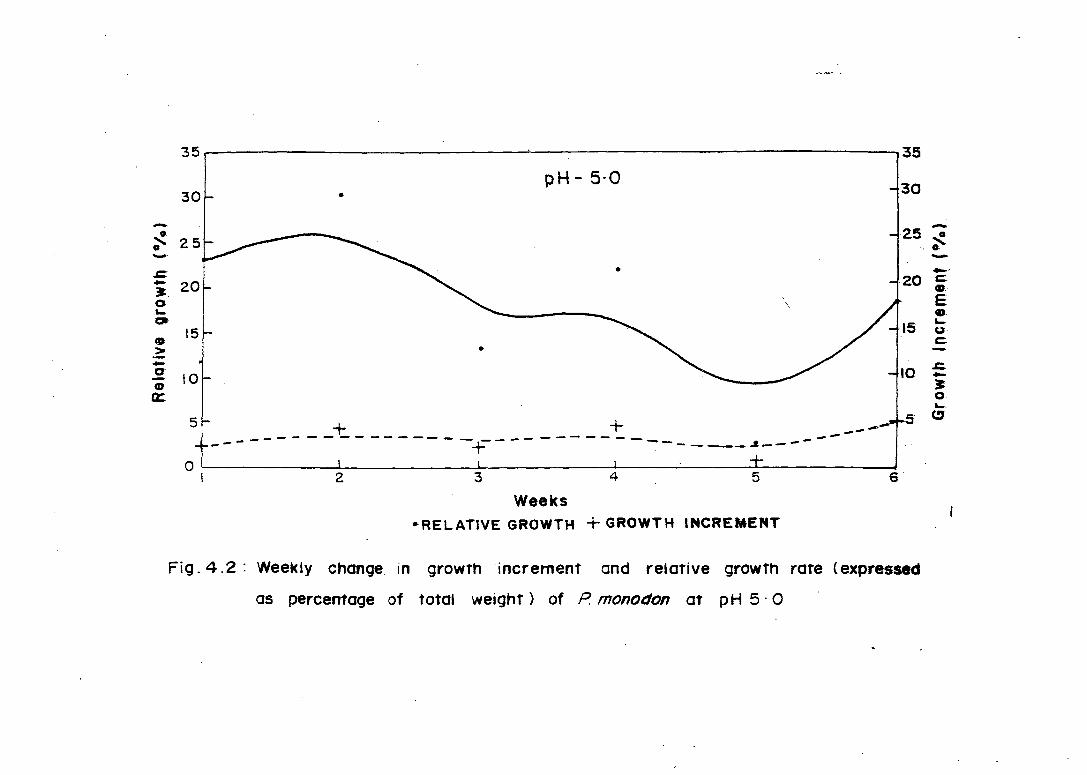
The relative growth as percentage of increment calculated in
different pH showed an interesting result. At pH 5.0, there was no
definite trend in the values of relative growth (Fig. 4.2) where the
maximum value was recorded as 30.20% and the minimum 2.65%
(Table 4.1). A maximum growth increment was also observed
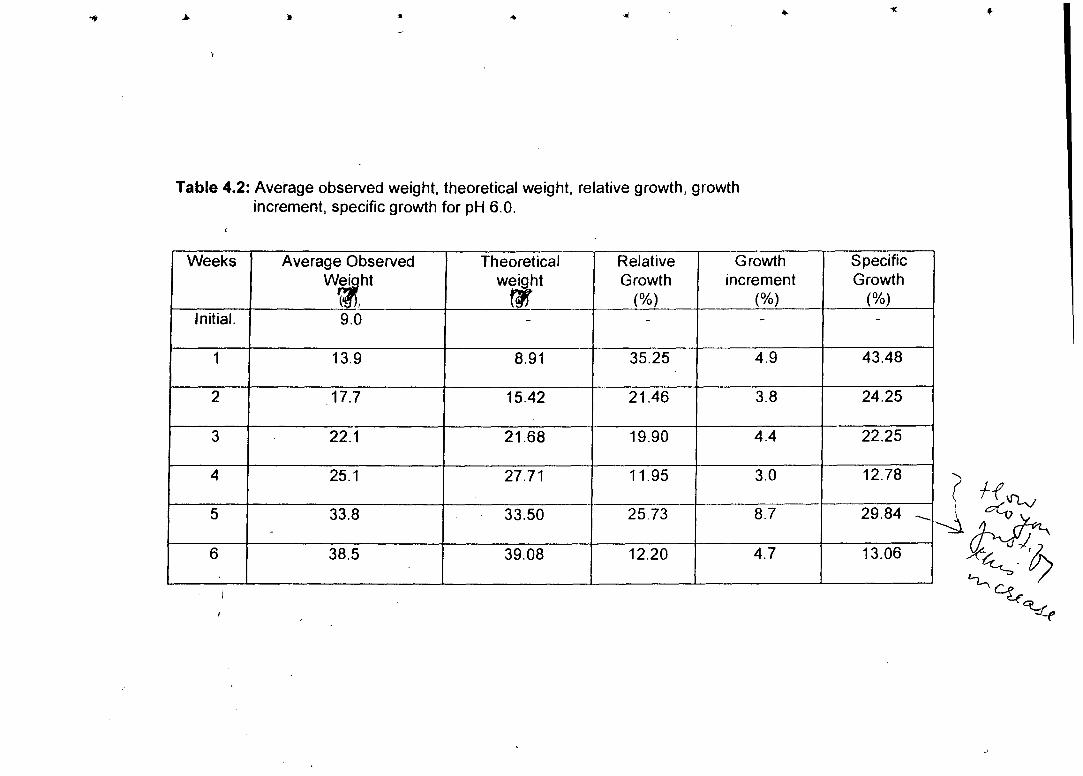
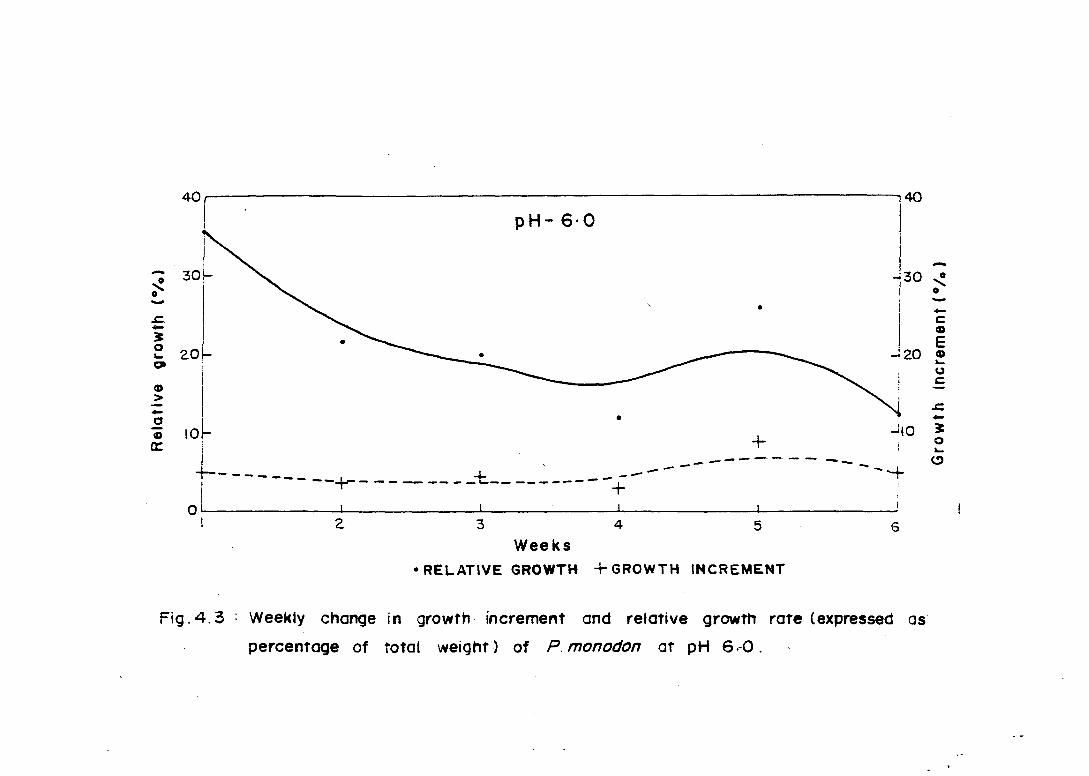
between the 4th and the 6th weeks (Table 4.1). At pH 6.0, the
values decreased consistently from 35.25 to 11.95% ( Fig. 4.3;
Table 4.2). The higher growth increment values were recorded
during the 1st and the 5th weeks of the experimental period.
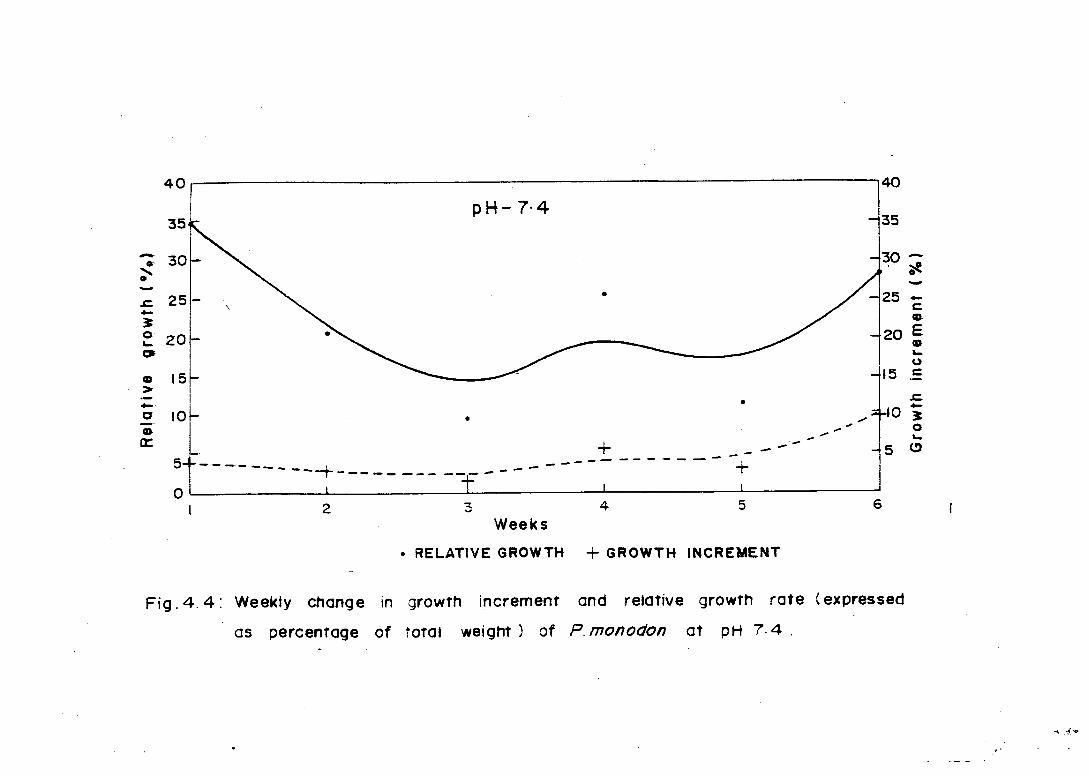
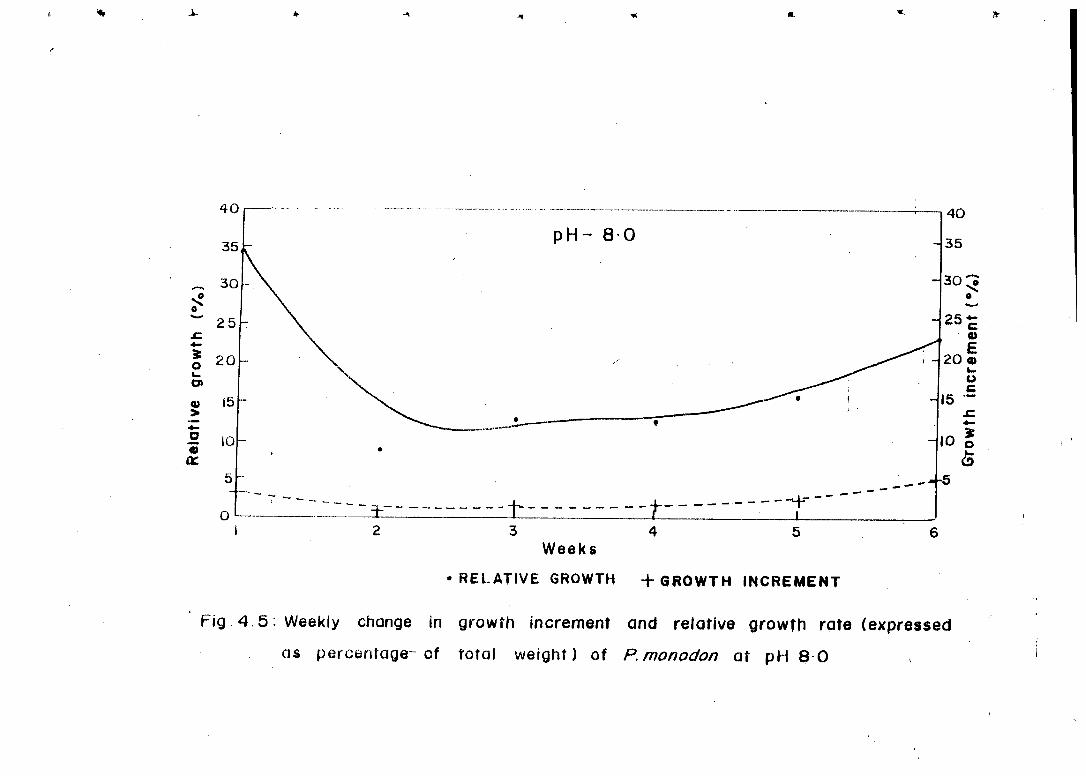
Similarly at pH 7.4 and pH 8.0, the trend was not definite (Figs 4.4
and 4.5). The maximum and minimum values were ranged
between 34.74% and 9.69% at pH 7.4 and 34.40% and 8.82% at
pH 8.0 (Tables 4.3 & 4.4). A higher growth increment at pH 7.4
was recorded in the 4th and 6th week whereas, at pH 8.0, it was in
the 1st and 6th week.
50
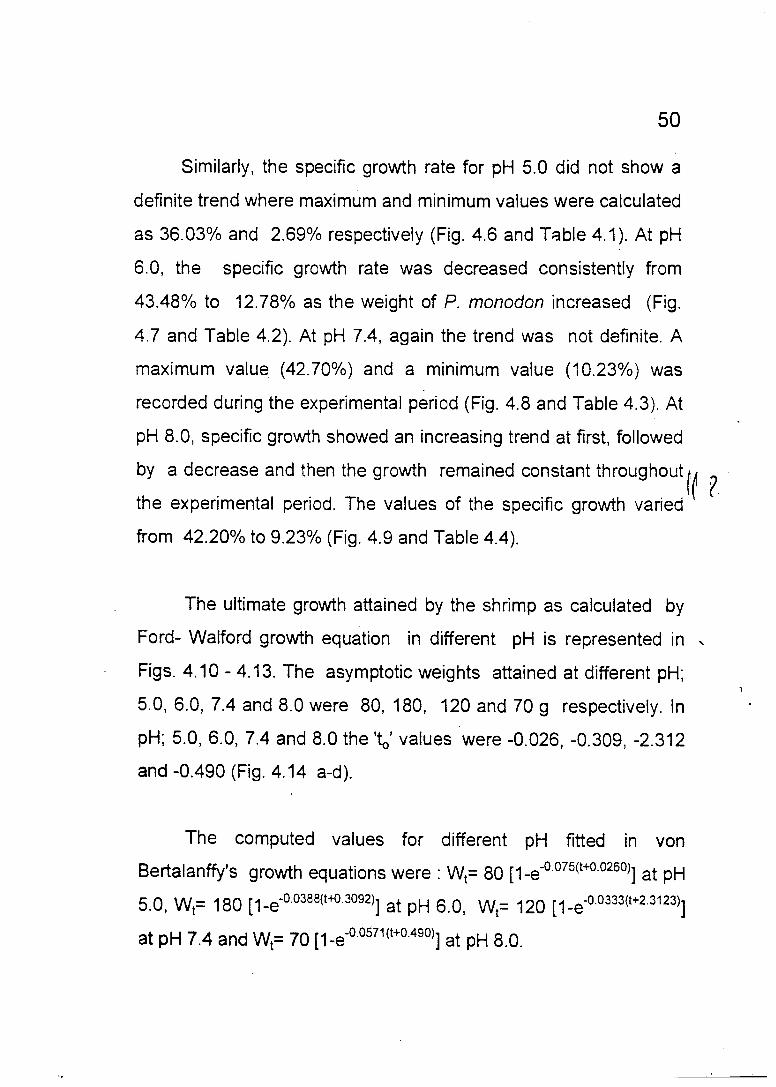
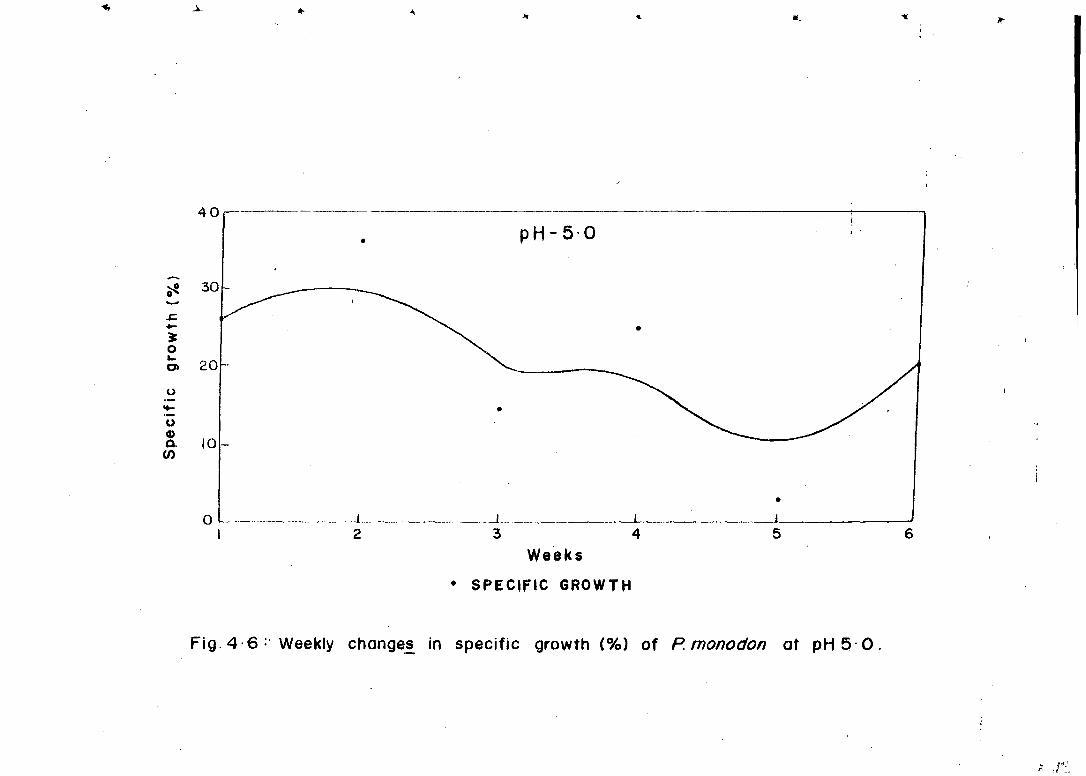
Similarly, the specific growth rate for pH 5.0 did not show a
definite trend where maximum and minimum values were calculated
as 36.03% and 2.69% respectively (Fig. 4.6 and Table 4.1). At pH
6.0, the specific growth rate was decreased consistently from
43.48% to 12.78% as the weight of P. monodon increased (Fig.
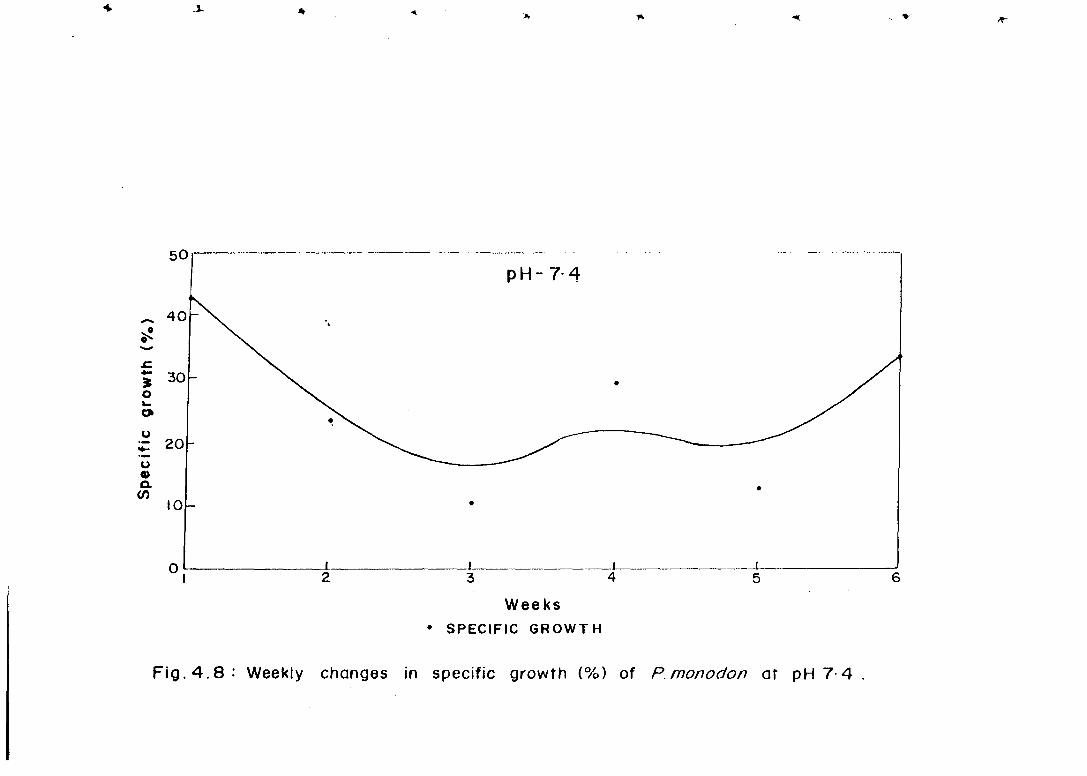
4.7 and Table 4.2). At pH 7.4, again the trend was not definite. A
maximum value (42.70%) and a minimum value (10.23%) was
recorded during the experimental period (Fig. 4.8 and Table 4.3). At
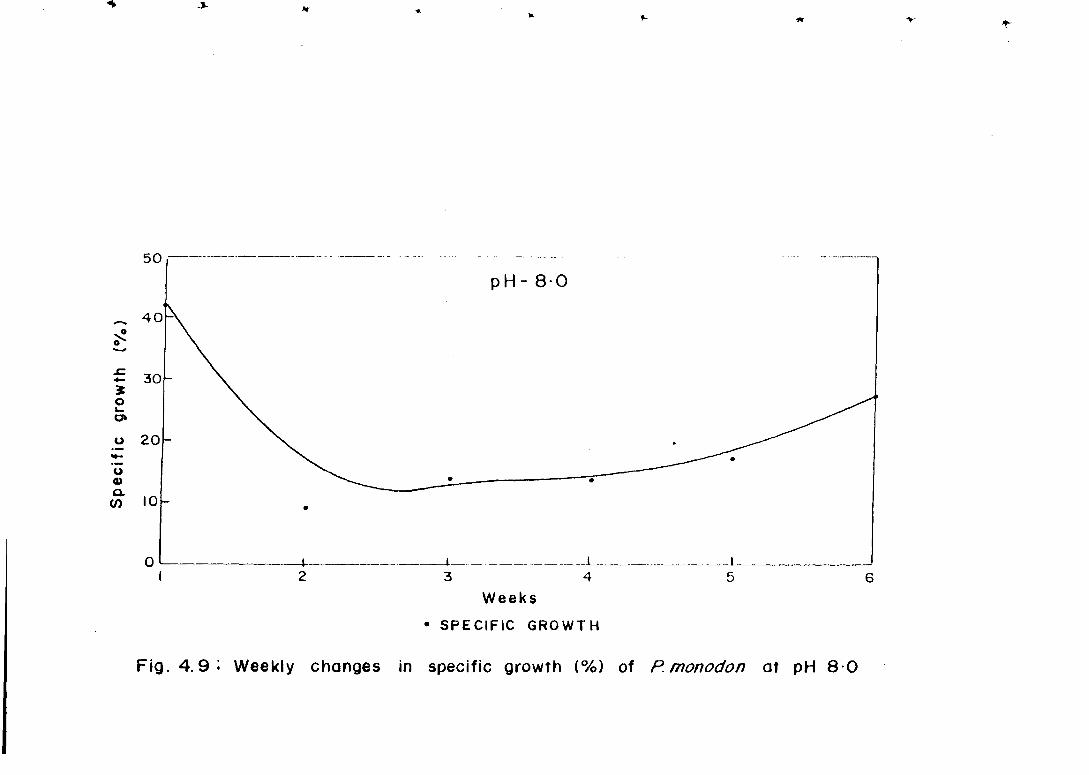
pH 8.0, specific growth showed an increasing trend at first, followed
by a decrease and then the growth remained constant throughout (( ?
the experimental period. The values of the specific growth varied
from 42.20% to 9.23% (Fig. 4.9 and Table 4.4).
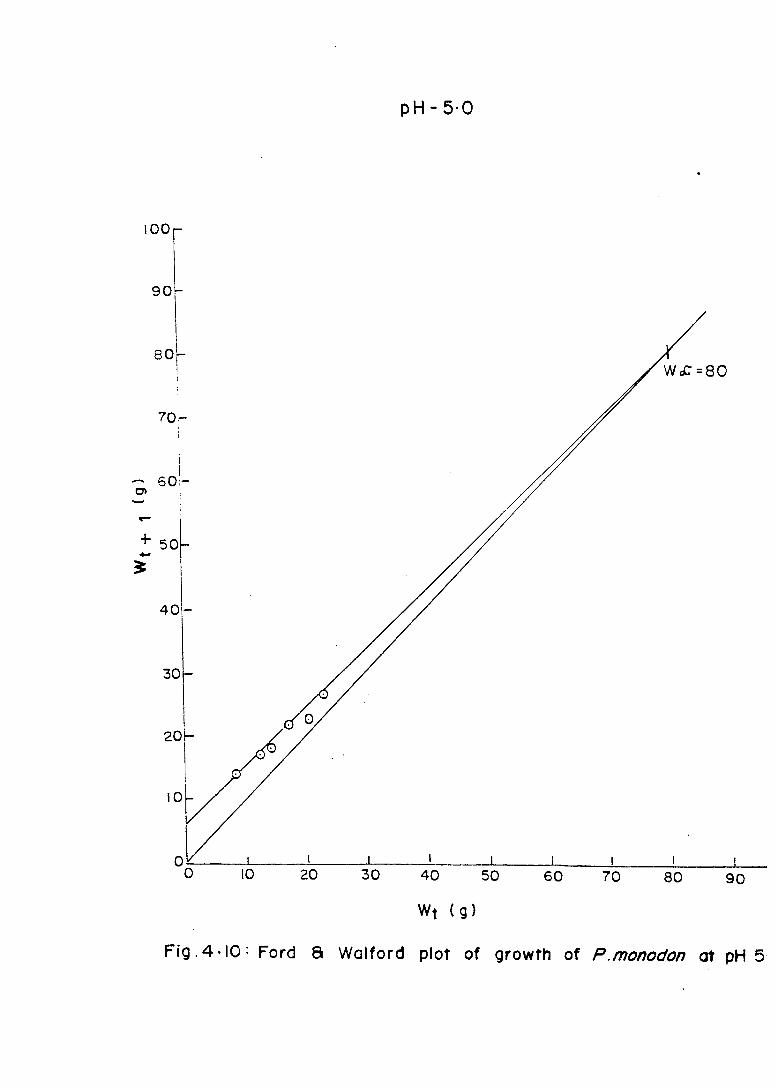
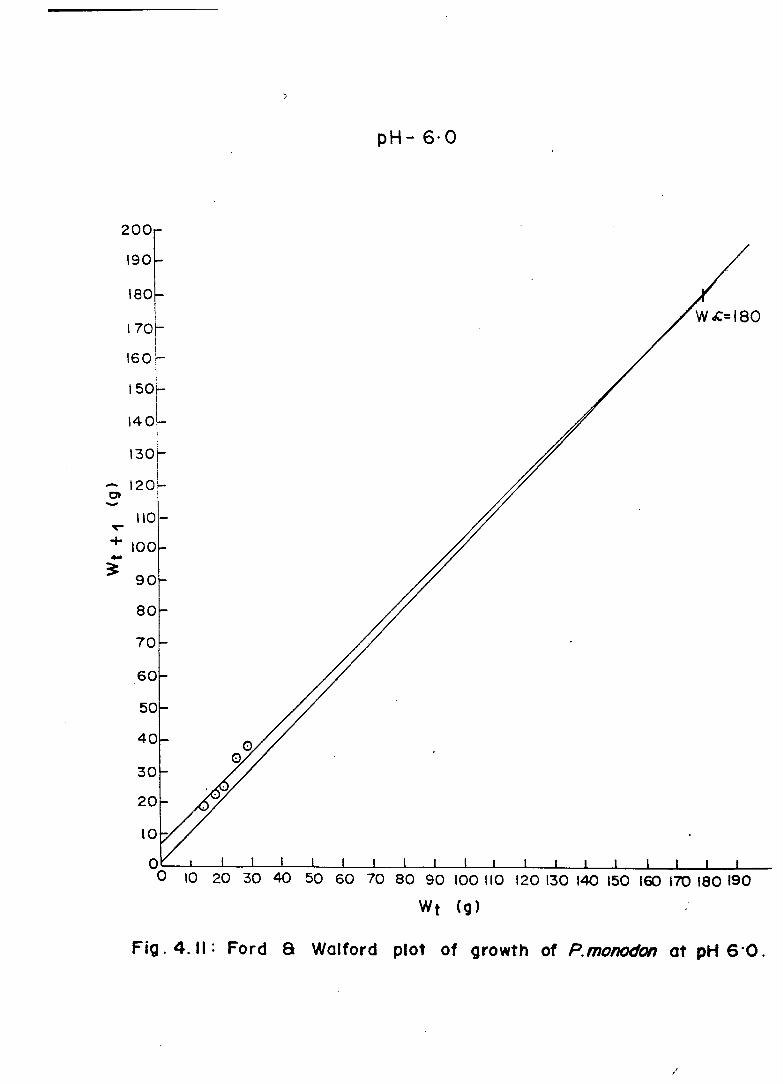
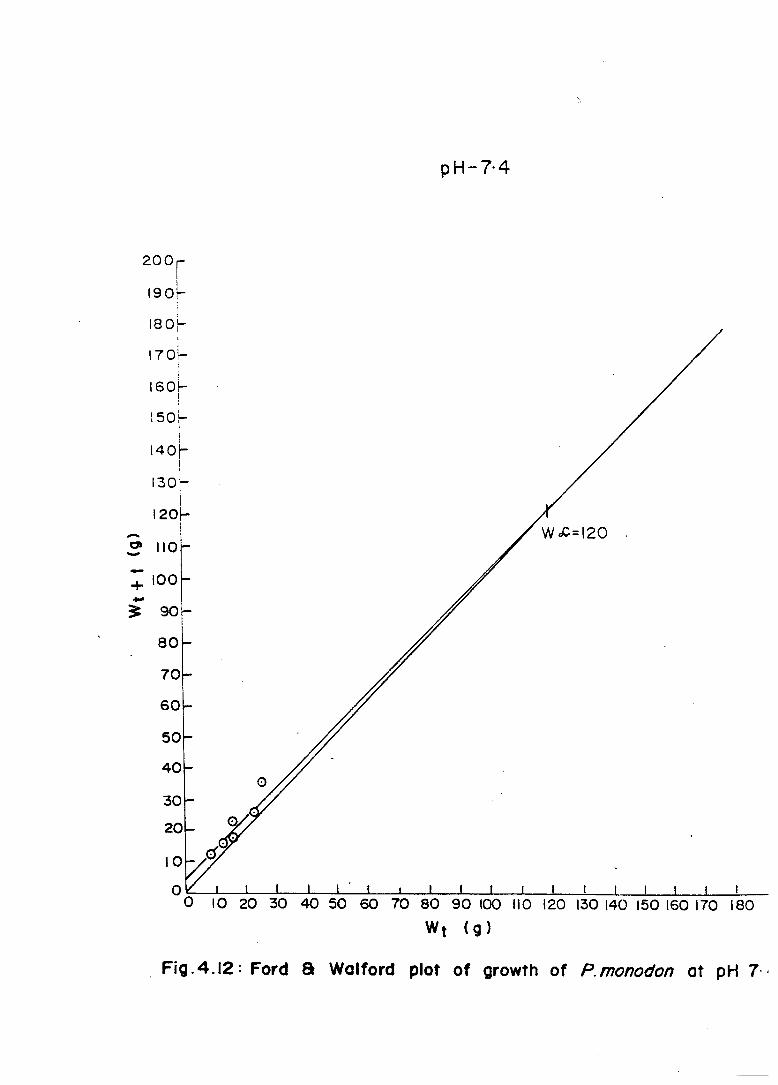
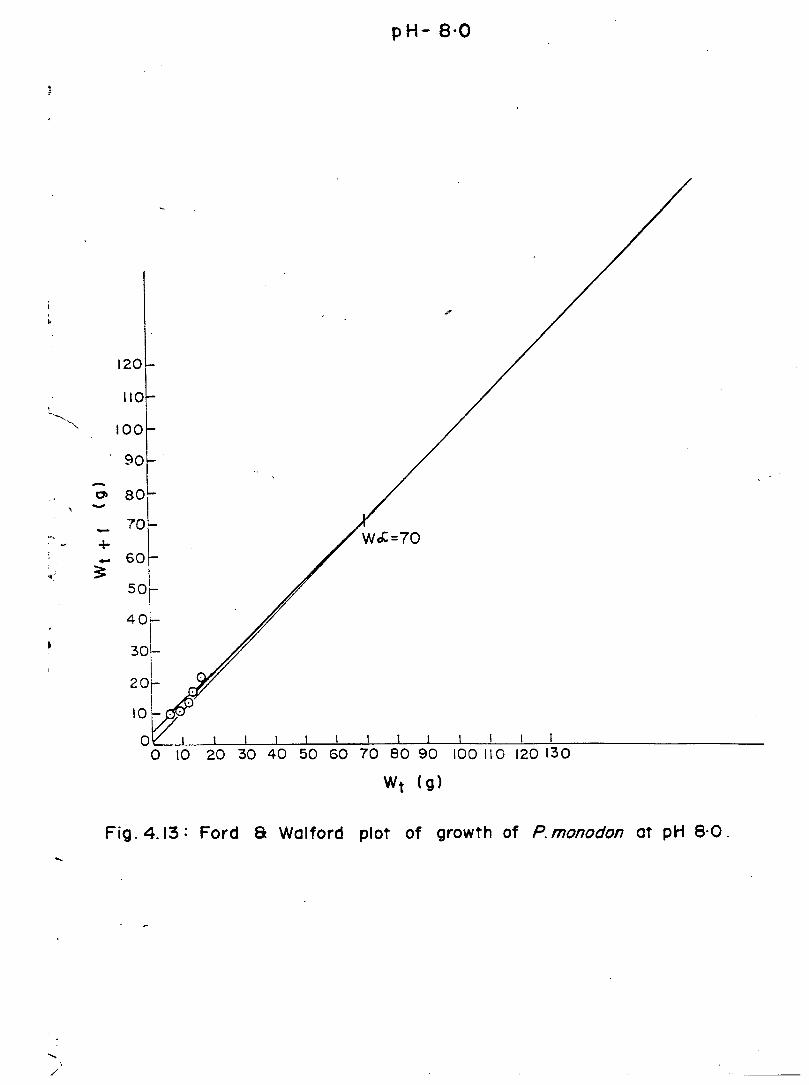
The ultimate growth attained by the shrimp as calculated by
Ford- Watford growth equation in different pH is represented in
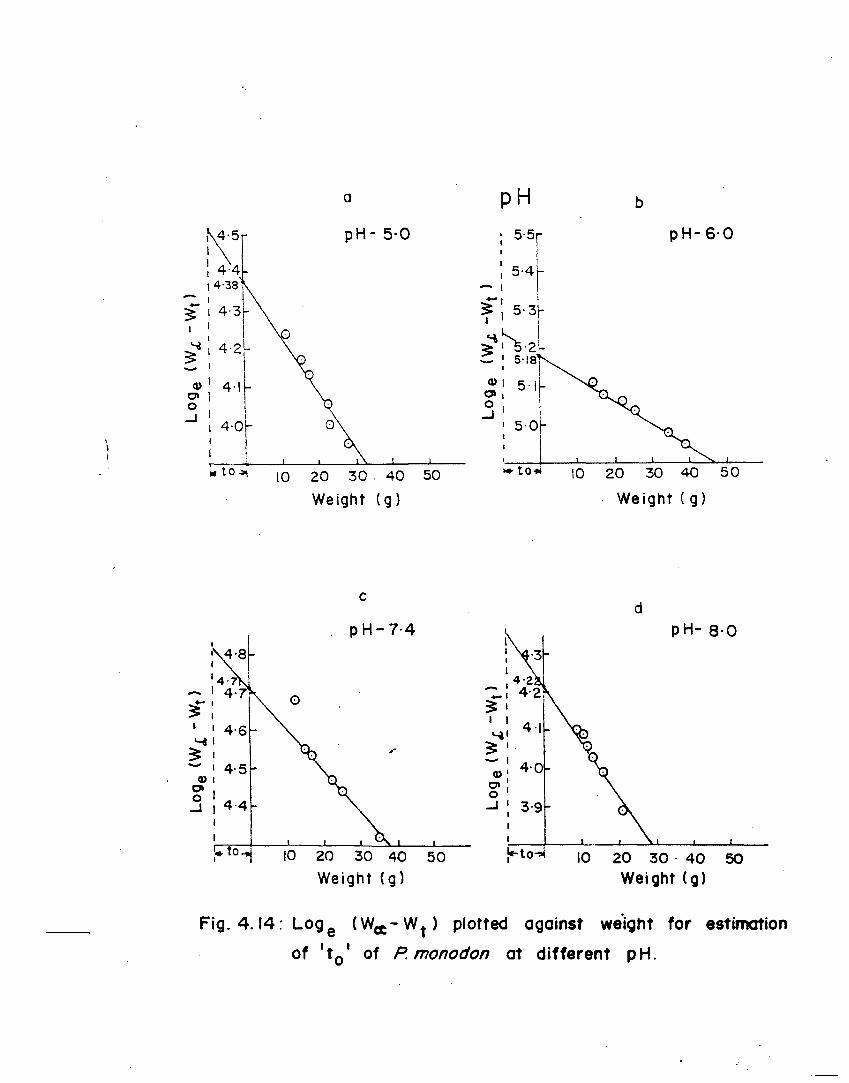
Figs. 4.10 - 4.13. The asymptotic weights attained at different pH;
5.0, 6.0, 7.4 and 8.0 were 80, 180, 120 and 70 g respectively. In
pH; 5.0, 6.0, 7.4 and 8.0 the 'to ' values were -0.026, -0.309, -2.312
and -0.490 (Fig. 4.14 a-d).
The computed values for different pH fitted in von
Bertalanffy's growth equations were : W t= 80 [1_e-0.075(t+0.0260), at pH
5.0, Wt= 180 [1-6.0.0388(t+0.3092)] at pH 6.0, Wt= 120 [1 -e-0.0333(t+2.3123)]
at pH 7.4 and Wt= 70 [1-e-0.0571(1-1-0.49°1 at pH 8.0.
51
DISCUSSION
Number of factors are responsible in changing the pH of the
aquatic ecosystem. Excessive photosynthetic activity changes the
equilibrium between carbon dioxide, water and production of
chlorophyll. This results in a decrease in the pH level of the water.
Moreover, if the sediment of the pond containing high acid sulphate
with excessive pyrites and exposed directly to air and water, the
pyrite is oxidised to form sulphuric acid (Webber and Webber, 1978;
Boyd, 1982; Simpson et a/., 1983; Gaviria et a/., 1986; Lin, 1986).
The formation of sulphuric acid also causes the reduction of pH
level of the water.
Aquaculture farms constructed in the high acid sulphate soil
are subjected for more reduction of pH. During the rainy season,
the acid soil of the pond dykes erodes into the ponds causing
reduction in pH (Webber and Webber, 1978; Lin, 1986; Boyd,
1989). Similarly, when the salinity of the pond decreases due to
mixing of the rain water, the pH of the media also goes down to
low level. However, information of lowering of salinity and pH and
its effect on the osmo-regulation in penaeids is lacking.
In the present study, maximum growth rate was observed at
pH 6.0. This indicates that P. monodon prefers an acidic condition] ;
The growth rate was moderate at pH 7.4 whereas, it was minimum
52
at pH 5.0 and 8.0. Survival rate of P. monodon decreases with
increase in pH from 8.0 as observed in the present study. At pH
9.0, the mortality was 100% within one hour of the experiment. The
survival rate in P. monodon has been reported to be very high at a
pH level of 7.5 whereas, it was lowest at pH 7.0 (Hamid et al.,
1994).
According to Apud et al. (1985) and Webber and Webber
(1978) mortality and poor growth of penaeid occurs when acid
sulphate soil acidify pond waters. However, in the present study P.
monodon was found to tolerate sublethal exposure to acidified
seawater over 42 days. The growth in shrimps was reduced at pH
5.0 and 8.0. Wickins (1984 b) found that at pH 6.7, the growth of P.
monodon was affected, badly. He further reported that carapace
weight of P. monodon was decreased at low pH (6.7). The growth
of P. monodon and P. accidentalis has been observed low at pH
below 6.4 (Wickins, 1984 a). However, developmental stages have
not been found affected with low pH level of the media (Hamid et
a/., 1994).
Apud et al. (1985) observed heavy mortality in penaeid at pH
< 5 whereas, in the present study, the growth rate was retarded at
pH 5.0. However, the maximum weight calculated by using von
Bertlanaffy's growth equation was 180 g at pH 6.0 whereas, the
53
weight was moderate (120 g) at pH 7.4. The minimum weight
calculated at pH 5.0 and 8.0 were 80 and 70 g respectively.
Tsai (1990) found that pH values below 4.8 or above 10.6 are
lethal to penaeids. The growth and food conversion efficiency has
also been found low between pH 6.6 and 8.5 (Tsai, 1990). Low pH
also effects the maturation and reproduction in crustaceans
(Walton et al., 1982; Zimmer and Storr, 1984; Zimmer, 1987). While
working on the maturation cycle of P. lndicus (Muthu et al., 1984)
reported that if the pH of the maturation tank is reduced below 7.9,
the ovaries in mature females showed a regression. This shows
that pH of the media where the animals are reared plays an
important role in controlling the development of gonad. At pH 8.2,
the development of ovaries in P. indicus has been found better
(Muthu et a/., 1984). It is quite obvious because the normal pH of
the seawater where the animal grows and matures is approximately
8.2. Normally, the maturation in penaeid shrimps takes place in sea
where the pH of the water is nearly 8.2. However, when the animals
are cultured in ponds, they do not attain maturity. The reason could
be the fluctuating pH of the confined water whe're pH level vary
from 6.5 to 9.5. A more fluctuating condition has been observed
when the phytoplankton concentration is maximum in the medium
(Muthu et al., 1984). Fluctuating pH level does not effect the
attainment of sexual maturity in males. In ponds, males generally
attain maturity and even they are reported to mate with immature
54
females (Muthu et a/., 1984). Parado-Estepo et a/. (1990)
suggested that pH between 7.3 and 8.5 is suitable for shrimp
hatchery. In an another study made by Hamid et a/. (1994), the pH
of the media between 7.0 and 8.0 is suitable to get maximum
production in a shrimp hatchery.
Sometimes the pH of pond water falls below 5.9 resulting in
the reduction in growth rate in the shrimps. At this stage, it has
been recommended to increase the pH of the water by regular
exchanges or by neutralizing the water with lime. It may also be
possible that the pH of water of a pond falls below 4.0. At this
stage, immediate action such as transferring the shrimps to
another pond or premature harvest has to be done. At low pH,
softening of the exoskeletons of shrimp has been observed
affecting the quality of the product severely.
The calculated weights of P. monodon obtained by applying
von Bertalanffy's growth equation in each week under different pH
showed a close agreement with the average observed weights
(Tables 4.1, 4.2, 4.3 and 4.4). This confirmed that von Bertalanffy's
growth equation described the growth of young P. monodon
adequately at different pH and in terms of weight where
environmental parameters like salinity, temperature, feed were kept
constant.
55 .
The effect of pH is particularly pronounced in shallow coastal zone
and estuaries under normal condition. In view of the increasing
industrial pollution threatening the aquatic ecosystem, studies
about the tolerance limit of pH will provide essential information for
the proper management of the inshore waters and the shrimp
culture farms which is gaining importance in recent years.
ABSTRACT
Growth rate in the laboratory reared Penaeus monodOn (Fabricius)
was studied under different pH conditions. Maximum growth was
observed at pH 6 whereas, the growth rate was moderate at pH 7.4.
Minimum growth was recorded at pH 5.0 and 8.0 and a heavy
mortality was found at pH 9.0 in the present study. The growth
pattern of P. monodon described well the von Bertalanify's growth
equation where Wt= ,80 .075(t+0.0260) j at pH 5, Wt= 180 31 0333
0. (t+2.23 _e-0.0388(t+0.3092 )] at pH. 6, Wt= 120 [1-e- at pH 7.4 and
Wt= 70 _e 0.0571(t+0.490)1 at pH 8.0 values were calculated.
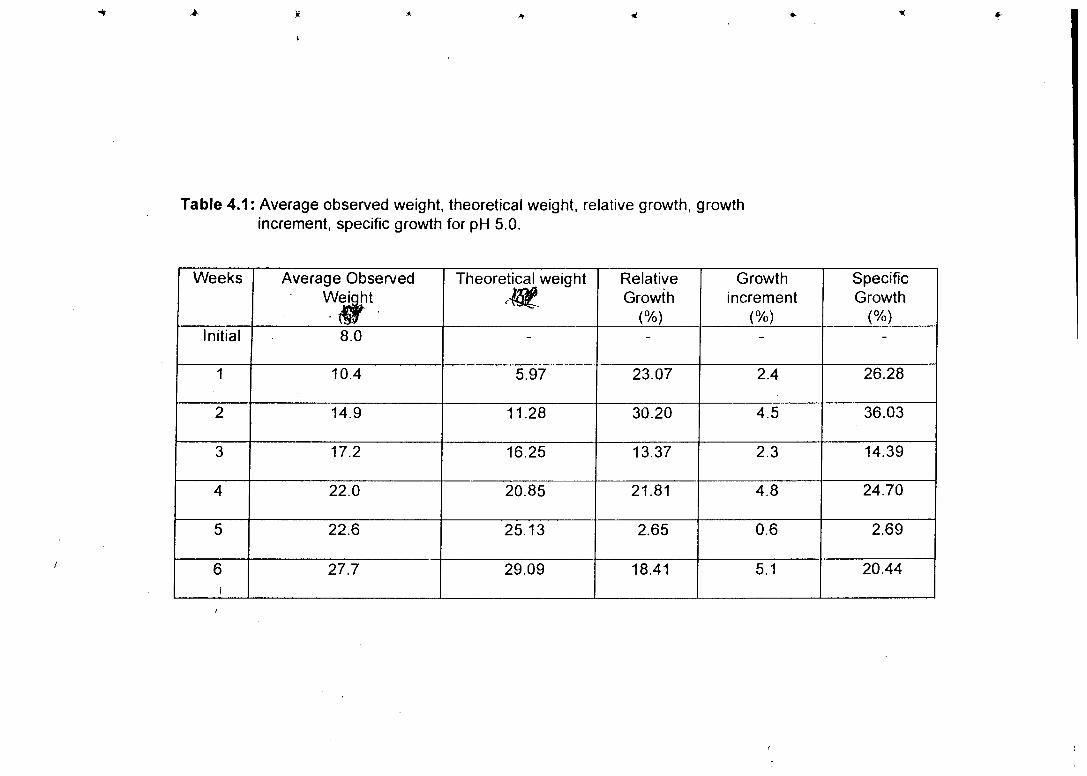
Table 4.1: Average observed weight, theoretical weight, relative growth, growth increment, specific growth for pH 5.0.
Weeks Average Observed • Wei ht
Theoretical weight
"ge- Relative Growth
(%)
Growth increment
(%)
Specific Growth
(%) Initial , 8.0 -
1 10.4 5.97 23.07 2.4 26.28
2 14.9 11.28 30.20 4.5 36.03
3 17.2 16.25 13.37 2.3 14.39
4 22.0 20.85 21.81 4.8 24.70
5 22.6 25.13 2.65 0.6 2.69
6 1
27.7 29.09 18.41 5.1 20.44
t
Table 4.2: Average observed weight, theoretical weight, relative growth, growth increment, specific growth for pH 6.0.
Weeks Average Observed Wei ht
>
T
Theoretical
weight Relative Growth
(%)
Growth increment
(%)
Specific Growth
(%) Initial. 9.0 -
1 13.9 8.91 35.25 4.9 43.48
2 17.7 15.42 21.46 3.8 24.25
3 22.1 21.68 19.90 4.4 22.25
4 25.1 27.71 11.95 3.0 12.78
5 33.8 33.50 25.73 8.7 29.84 -___
6 38.5 39.08 12.20 4.7 13.06
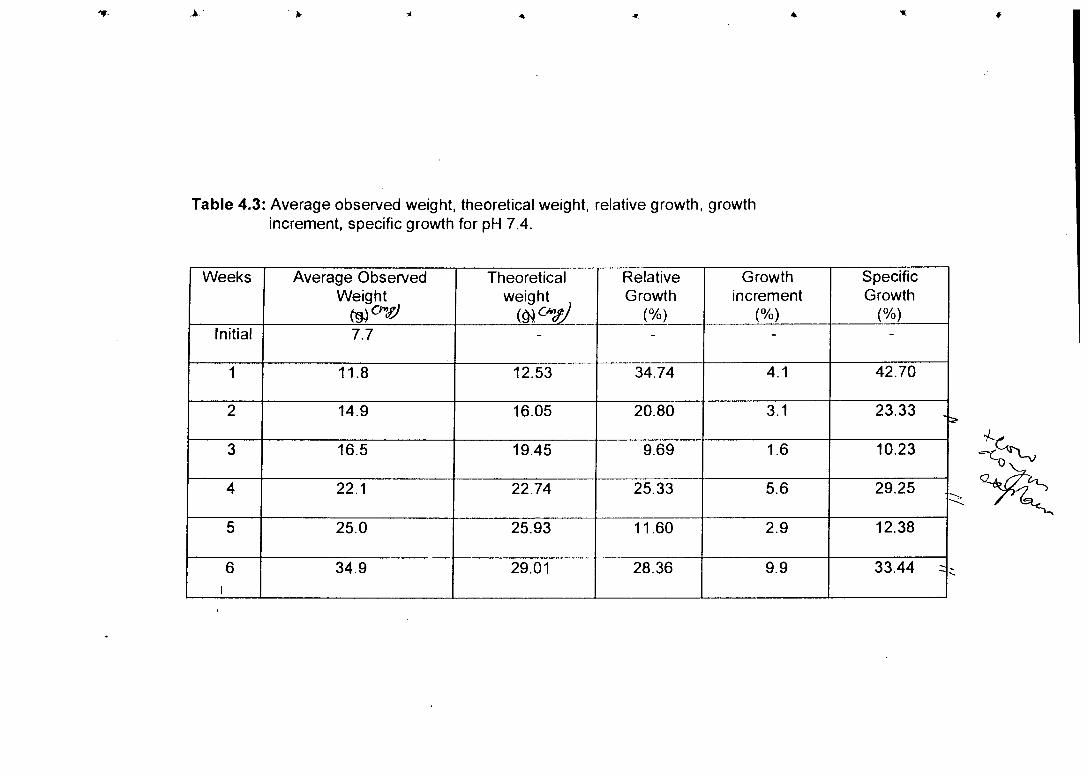
Table 4.3: Average observed weight, theoretical weight, relative growth, growth increment, specific growth for pH 7.4.
Weeks Average Observed Weight
(13) CV
Theoretical weight
(g,) CV}
Relative Growth
(%)
Growth increment
(%)
Specific Growth
(%)
Initial 7.7
1 11.8 12.53 34.74 4.1 42.70
2 14.9 16.05 20.80 3.1 23.33 ..
3 16.5 19.45 9.69 1.6 10.23
4 22.1 22.74 25.33 5.6 29.25
5 25.0 25.93 11.60 2.9 12.38
6 1
34.9 29.01 28.36 9.9 33.44 .---.
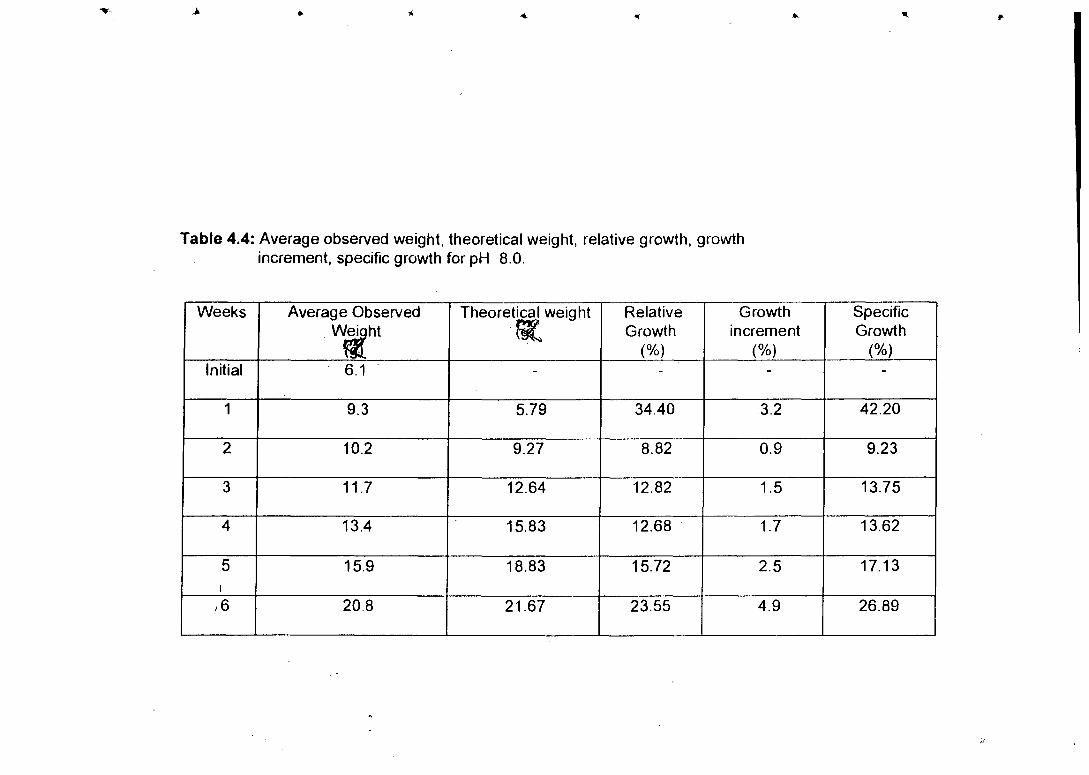
Table 4.4: Average observed weight, theoretical weight, relative growth, growth increment, specific growth for pH 8.0.
Weeks Average Observed Weight
Theoretical weight Relative Growth
(%)
Growth
(%) increment
Specific Growth
(%) Initial 6.1 -
1 9.3 5.79 34.40 3.2 42.20
2 10.2 9.27 8.82 0.9 9.23
3 11.7 12.64 12.82 1.5 13.75
4 13.4 15.83 12.68 1.7 13.62
5 15.9 18.83 15.72 2.5 17.13
6 20.8 21.67 23.55 4.9 26.89
Me
an a
ve
rag
e
6 7-4 8
pH
Fig.4.I : Mean observed weight at different pH(ISD)
pH- 5.0
• 5 a
o.
0 a E
.15 u
--
- m •
10 .- 3 0
CD
--i-- - - 0 I _i_ I +
2 3 4 5
Weeks
• RELAT1VE GROWTH + GROWTH INCREMENT
Fig. 4.2 : Weekly change in growth increment and relative growth rate (expressed
as percentage of total weight ) of P monodon at pH 5 . 0
35
30
0.W
0 0".■ 25
35
30
20
151--
I0
5
•
incr
emen
t (V
o )
-430
-20
40 140
pH- 6.0
^ 30 0 0
3
10 CC
•
....... •••■ •■•••■• ••■■••
201-
•
•
0 2. 3 4 5
6
Weeks
• RELATIVE GROWTH +GROWTH INCREMENT
Fig . 4.3 Weekly change in growth increment and relative growth rate (expressed as
percentage of total weight ) of P. monodon at pH 6.-0 .
40
35
30
So,
25 .-c (3)
20 E
L. 0 ;
0
5
40
35
• 30 0
• 25
0 ▪ 20 01,
15
▪ I0 a CC
pH-7.4
•
5
0 -17
2
3 4 5 6 1 Weeks
• RELATIVE GROWTH + GROWTH INCREMENT
Fig . 4. 4 : Weekly change in growth increment and relative growth rate ( expressed
as percentage of total weight ) of P.monodon at pH 7.4 .
10- 0 4)
5
---------
- - - - - - -
5 4
40
pH- 8.0 35
300. •
0
grow
th (
°/0
)
3 Weeks
• RELATIVE GROWTH + GROWTH INCREMENT
2
•• •
• Fig . 4. 5 : Weekly change in growth increment and relative growth rate (expressed
as percentage - of total weight) o f P. monodon at pH 8•0
40
30
4-
0
20
a. 10
0 2
3
4
5 6
Weeks
• SPECIFIC GROWTH
• pH-5.0
Fig. 4.6 Weekly changes in specific growth (%) of P rnonodon at pH 50.

50
40
30
20
10
0
2
3
4
5 Weeks
spgcinc GROWTH
. Fig. 4-7 : Weekly changes in specific growth (%) of P. monodon at pH 6 . 0 .
4 1 -
50
p H- 7- 4
40
■■•
30 • 0 b- at
20 U 4)
Ci) 10 •
3
Weeks
• SPECIFIC GROWTH
Fig. 4.8 Weekly changes in specific growth (%) of P.monodon at pH 7.4 .
•
2
3
4
5
6
Weeks
• SPECIFIC GROWTH
Fig. 4.9 ; Weekly changes in specific growth (%) of P. monodon at pH 8.0
1 00
90
80
70 -
^ 60 -
t--
50
40
30
10 20 30 40 50 60 70 80 90
Wt (9)
pH-5.0
Fig .4.10: Ford a Walford plot of growth of P.monocion at pH 5
pH- 6.0
200-
190
180
170L-
160-
150-
146-
130r
^ 120L
HO
100
90
80
70
60
50
40
30
20
I0
0 0 10 20 30 40 50 60 70 80 90 100 110 120 130 140 150 160 170 180 190
Wt (g)
Fig. 4.11: Ford a Wo!ford plot of growth of P.monalon at pH 6'0.
pH-7.4
200r
19 Of--
180-
17 01-
16 01-
150i-
14 0
WC=120 -c; 110 -
+ 100
90 -
80
70
60
50
40
30
20
10
0 t t t t t 0 10 20 30 40 50 60 70 80 90 100 110 120 130 140 150 160 170 180
Wt (g)
Fig.4.I2: Ford & Walford plot of growth of P.monodon at pH 7•,
120-
110-
100
90-
70L
60 -
50-
4 0-
30 -
80 -
10
0 t t t t t t 0 10 20 30 40 50 60 70 80 90 100 110 120 130
Wt (g)
Fig. 4.13 Ford & Walford plot of growth of P. monodon at pH 8.0 .
a
oi to-at 10 20 30 40 50
Weight (g)
4.5i
4.4
14.38 -
, 4.3L 4 - 2L
0 -J
1 40- i
pH- 5.0 pH-6-0
4 2 _' 4 §4... I 1 41
4.0 cri
3.9
pH- 8.0
10 20 • 30 - 40 50 Weight (9)
pH-7.4
4.6
pH b
1 5.5r
it 5.4
t 4- 1
1 5.31.-
;* 2-- --- i 5.18
g ! 5 . i 1- o f
I ' 5 . 01 -
6.- toy
Weight (g)
10 20 30 40 50
d
Fig. 4.14: Log e (Wet - W t ) plotted against weight for estimation
of 't o ' of P. monodon at different pH.