Embed Size (px)
Citation preview
FACTA UNIVERSITATIS Series: Working and Living Environmental Protection Vol. 2, No 5, 2005, pp. 383 - 392
BASIC INDICATORS OF INTEGRATED SOLID WASTE MANAGEMENT
UDC 628.4.032
Goran Ristić
Faculty of Occupational Safety Niš
Abstract. Environmental pressures from the generation and management of solid waste include emissions into the air, water and soil, all with potential impacts on human health and nature. Most of the municipal waste is landfilled, leading to significant pressures on the environment, while too little is recycled. Essential quality criteria for indicators are: analytical soundness, responsiveness, comparability and clarity. In this paper the basic indicators of integrated solid waste management are analysed: the generation and treatment of sewage sludge, landfilling of biodegradable municipal waste, total waste generation and waste generation from household and commercial activities. The development of useful environmental indicators requires not only an understanding of concepts and definitions, but also a good knowledge of environmental policy needs. Data is the most basic component of indicator work. Indicators, which are derived from data, are commonly the first, most basic, tools for analyzing change in society. Two main and important priorities of waste management are: the minimization of environmental impacts of waste generation and reduction of resource use. A necessary step into the practical world of indicators is to interpret the collected and developed indicators, to transform this into information, and to use that information to improve decision-making processes. A recommendation for future practical work with indicators is to remember that different stakeholders, contexts, and goals need different indicators.
Key Words: Solid waste management, indicators, environment, quality, tools
1. INTRODUCTION If there is one environmental policy field where the need for indicators as tools for
monitoring is particularly significant, that is the waste field. Possibly no other environ-mental issue has such a strong and relevant 'management' side as waste and no other has the same impact on the everyday life of consumers and producers.
Although the relevance of the waste theme is unchallenged, from a statistical perspec-tive there are weaknesses which result in an incomplete picture due to a lack of informa-tion, and which prevent the establishment of indicators that could provide powerful and comprehensive signals.
Received September 9, 2005
G. RISTIĆ 384
2. INTEGRATED SOLID WASTE MANAGEMENT
The more civilisation advances, the more problems with solid waste management arise. Permanent handling of the increasing and more and more hazardous quantities of solid waste materials is becoming a dominant global issue. Each waste material quantity, even the most minor one, and its uncontrollable return to nature, represents handing down one and the same problem to generations yet to come. A far more complex problem is solid waste management in urban areas.
For most of us, waste is the bags of household rubbish that leave our households every week. We know that it 'goes somewhere' – but few have actually seen a landfill site, a waste incineration plant, or a recycling centre, and most of us do not give it much thought.
Waste is generated by activities in all economic sectors and is generally regarded as an unavoidable by-product of economic activity (waste generated from inefficient production processes, the low durability of goods and unsustainable consumption patterns). The gen-eration of waste reflects a loss of materials and energy and imposes economic and envi-ronmental costs on a society for its collection, treatment and disposal. Waste forms an increasing part of the total material flow through the economy and is increasingly being considered in the context of material flows as a whole.
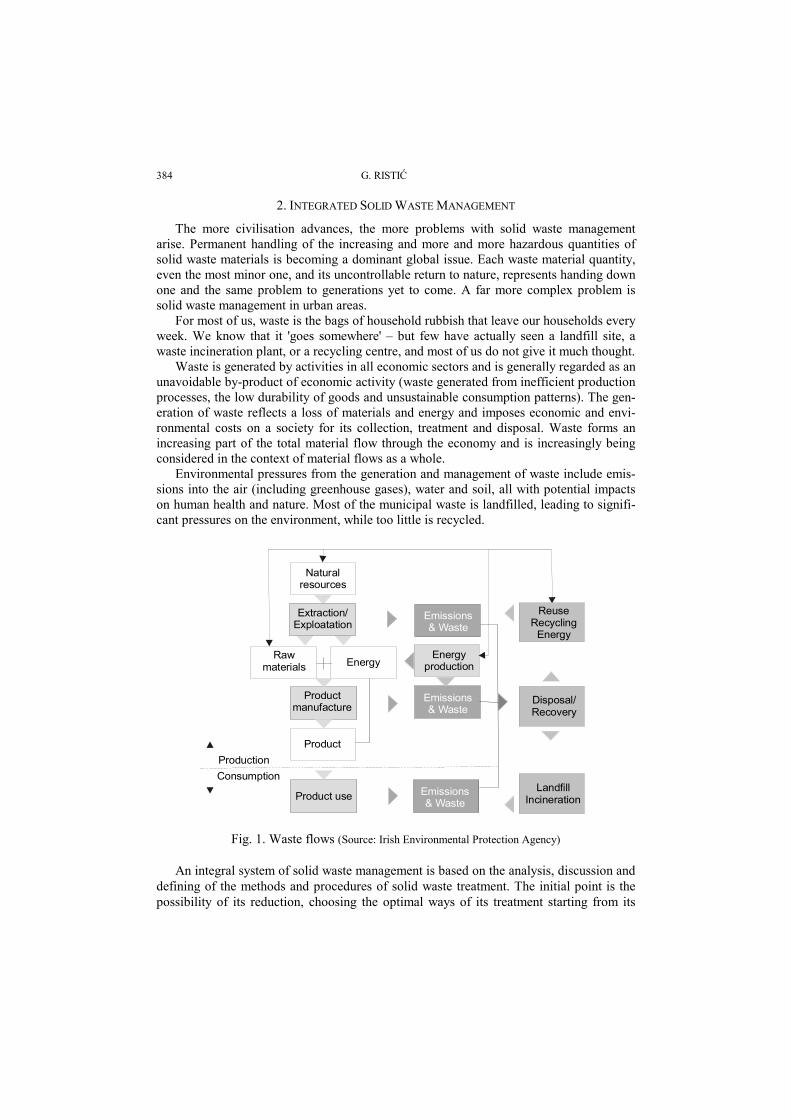
Environmental pressures from the generation and management of waste include emis-sions into the air (including greenhouse gases), water and soil, all with potential impacts on human health and nature. Most of the municipal waste is landfilled, leading to signifi-cant pressures on the environment, while too little is recycled.
Naturalresources
Extraction/Exploatation
ProductionConsumption
Rawmaterials Energy
Energyproduction
Emissions& Waste
ReuseRecycling
Energy
Disposal/Recovery
LandfillIncineration
Emissions& Waste
Product use
Product
Productmanufacture
Emissions& Waste
Fig. 1. Waste flows (Source: Irish Environmental Protection Agency)
An integral system of solid waste management is based on the analysis, discussion and defining of the methods and procedures of solid waste treatment. The initial point is the possibility of its reduction, choosing the optimal ways of its treatment starting from its
Basic Indicators of Integrated Solid Waste Management 385
creation to its final handling and its transformation into something safe for the environ-ment and the well-being of people.
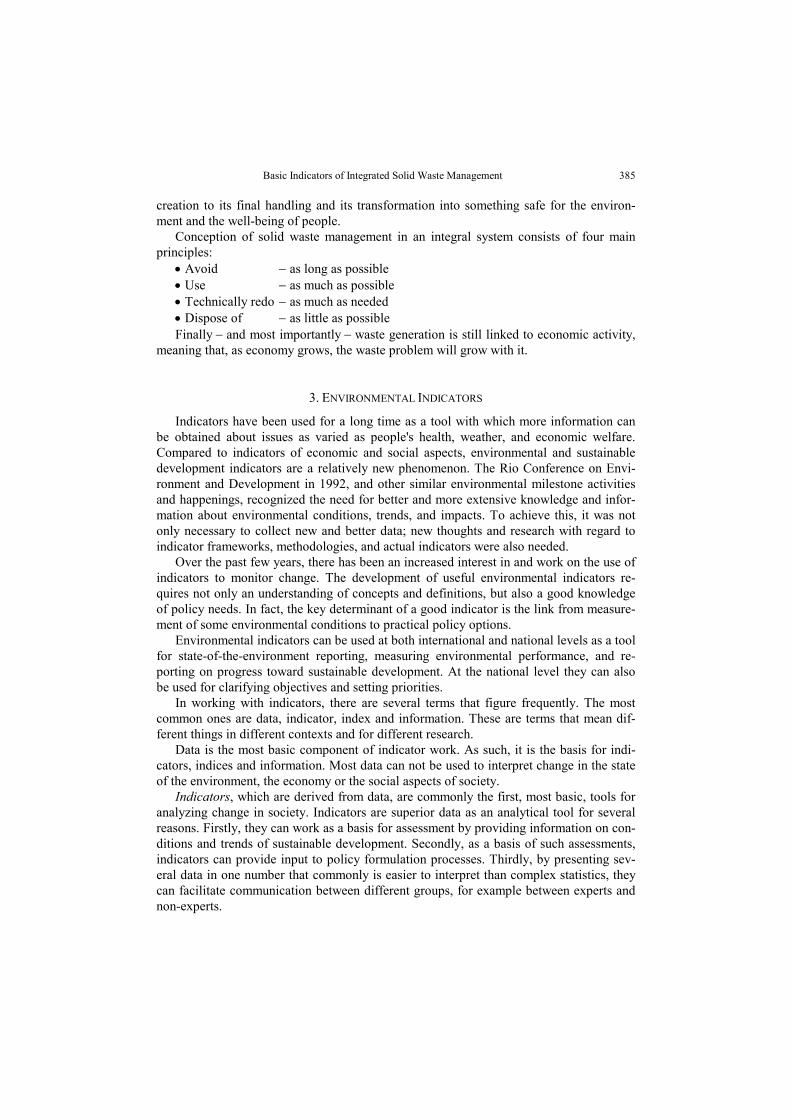
Conception of solid waste management in an integral system consists of four main principles:
• Avoid − as long as possible • Use − as much as possible • Technically redo − as much as needed • Dispose of − as little as possible Finally − and most importantly − waste generation is still linked to economic activity,
meaning that, as economy grows, the waste problem will grow with it.
3. ENVIRONMENTAL INDICATORS
Indicators have been used for a long time as a tool with which more information can be obtained about issues as varied as people's health, weather, and economic welfare. Compared to indicators of economic and social aspects, environmental and sustainable development indicators are a relatively new phenomenon. The Rio Conference on Envi-ronment and Development in 1992, and other similar environmental milestone activities and happenings, recognized the need for better and more extensive knowledge and infor-mation about environmental conditions, trends, and impacts. To achieve this, it was not only necessary to collect new and better data; new thoughts and research with regard to indicator frameworks, methodologies, and actual indicators were also needed.
Over the past few years, there has been an increased interest in and work on the use of indicators to monitor change. The development of useful environmental indicators re-quires not only an understanding of concepts and definitions, but also a good knowledge of policy needs. In fact, the key determinant of a good indicator is the link from measure-ment of some environmental conditions to practical policy options.
Environmental indicators can be used at both international and national levels as a tool for state-of-the-environment reporting, measuring environmental performance, and re-porting on progress toward sustainable development. At the national level they can also be used for clarifying objectives and setting priorities.
In working with indicators, there are several terms that figure frequently. The most common ones are data, indicator, index and information. These are terms that mean dif-ferent things in different contexts and for different research.
Data is the most basic component of indicator work. As such, it is the basis for indi-cators, indices and information. Most data can not be used to interpret change in the state of the environment, the economy or the social aspects of society.
Indicators, which are derived from data, are commonly the first, most basic, tools for analyzing change in society. Indicators are superior data as an analytical tool for several reasons. Firstly, they can work as a basis for assessment by providing information on con-ditions and trends of sustainable development. Secondly, as a basis of such assessments, indicators can provide input to policy formulation processes. Thirdly, by presenting sev-eral data in one number that commonly is easier to interpret than complex statistics, they can facilitate communication between different groups, for example between experts and non-experts.
G. RISTIĆ 386
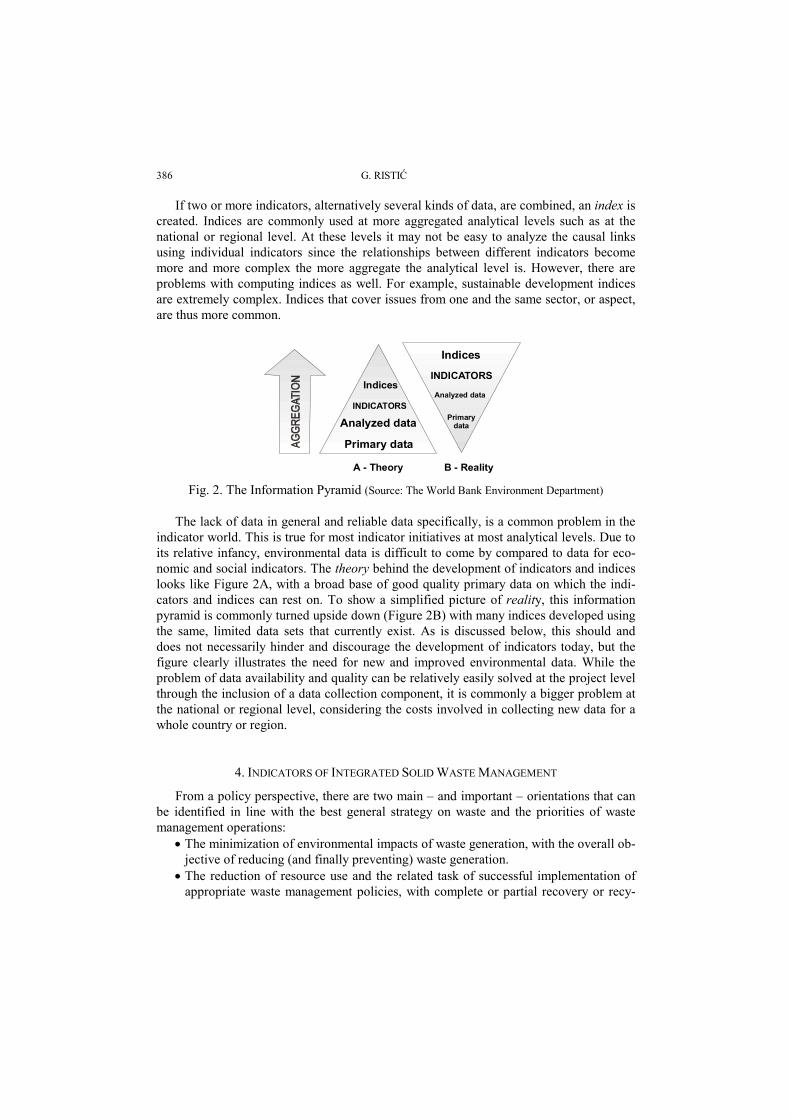
If two or more indicators, alternatively several kinds of data, are combined, an index is created. Indices are commonly used at more aggregated analytical levels such as at the national or regional level. At these levels it may not be easy to analyze the causal links using individual indicators since the relationships between different indicators become more and more complex the more aggregate the analytical level is. However, there are problems with computing indices as well. For example, sustainable development indices are extremely complex. Indices that cover issues from one and the same sector, or aspect, are thus more common.
Indices
Primary data
Analyzed dataINDICATORS
A - Theory B - Reality
Indices
INDICATORS
Analyzed data
Primarydata
Fig. 2. The Information Pyramid (Source: The World Bank Environment Department)
The lack of data in general and reliable data specifically, is a common problem in the indicator world. This is true for most indicator initiatives at most analytical levels. Due to its relative infancy, environmental data is difficult to come by compared to data for eco-nomic and social indicators. The theory behind the development of indicators and indices looks like Figure 2A, with a broad base of good quality primary data on which the indi-cators and indices can rest on. To show a simplified picture of reality, this information pyramid is commonly turned upside down (Figure 2B) with many indices developed using the same, limited data sets that currently exist. As is discussed below, this should and does not necessarily hinder and discourage the development of indicators today, but the figure clearly illustrates the need for new and improved environmental data. While the problem of data availability and quality can be relatively easily solved at the project level through the inclusion of a data collection component, it is commonly a bigger problem at the national or regional level, considering the costs involved in collecting new data for a whole country or region.
4. INDICATORS OF INTEGRATED SOLID WASTE MANAGEMENT
From a policy perspective, there are two main – and important – orientations that can be identified in line with the best general strategy on waste and the priorities of waste management operations:
• The minimization of environmental impacts of waste generation, with the overall ob-jective of reducing (and finally preventing) waste generation.
• The reduction of resource use and the related task of successful implementation of appropriate waste management policies, with complete or partial recovery or recy-
Basic Indicators of Integrated Solid Waste Management 387
cling of materials. The objective is to maximize 'recovery, reuse and recycling' op-erations (RRR) in order to achieve sustainable waste management.
The five essential quality criteria for indicators – also applicable to the waste domain – have to be highlighted:
• Analytical soundness (the correlation between changes in the indicator and changes in environmental pressure and/or use of resources),
• Responsiveness (the capacity of the indicator to reflect and respond to policy ac-tions),
• Comparability of the used data • Consistency with other related indicators (a consistent set) and, last but not least, • Clarity, meaning the capacity to be easily understood.
Table 1. Basic indicators of integrated solid waste management
Indicator Policy Issue Assesment
Generation and treatment of sewage sludge
Are we disposing of the growing stream of sewage sludge in an environmentally friendly way?
The amount of sewage sludge for disposal in landfills is expected to increase by 50% by 2005.
Landfilling of biodegradable municipal waste
Progress towards Directive target on landfilling of biodegradable municipal waste
Too much biodegradable waste is still being landfilled. In countries that make most use of landfill to dispose of their waste, no improvement has happened.
Total waste generation Is creating less waste, and is waste generation still tied to economic growth?
The limited information available indicates that total waste generation is increasing.
Waste generation from household and commercial activities
Are we on course for meeting targets for municipal and household waste generation?
Target for municipal and household waste was not met - and is unlikely to be met in the future if current trends are not reversed.
4.1 Generation and treatment of sewage sludge
Sewage sludge is the waste left over after wastewater treatment plants have done their work. Although it can be a valuable fertilizer, it is often contaminated by heavy metals, micro-organisms and a range of hazardous organic substances. As a result, in 1998 some 25% of sewage sludge was dumped in landfill sites.
The more severe demands for treatment in the Directive on Urban Waste Water Treatment will result in many new treatment plants coming into operation by 2005. The total amount of sewage sludge is expected to increase from 7.2 million tons of dry matter in 1998 to at least 9.4 million tons in 2005.
In 2005, the percentage dumped in landfills is expected to fall to 19%, fertilizer use will rise slightly (54%), and disposal by incineration will grow significantly (24%).
Currently, for example, the EU is considering tightening the limits on the contamina-tion levels allowed in sewage sludge used for fertilizer, with some countries already adopting lower levels. Tighter limits will increase costs – it costs over five times more to incinerate sludge than to use it as a fertilizer – thereby possibly increasing the quantity of sludge sent to landfill instead.
G. RISTIĆ 388
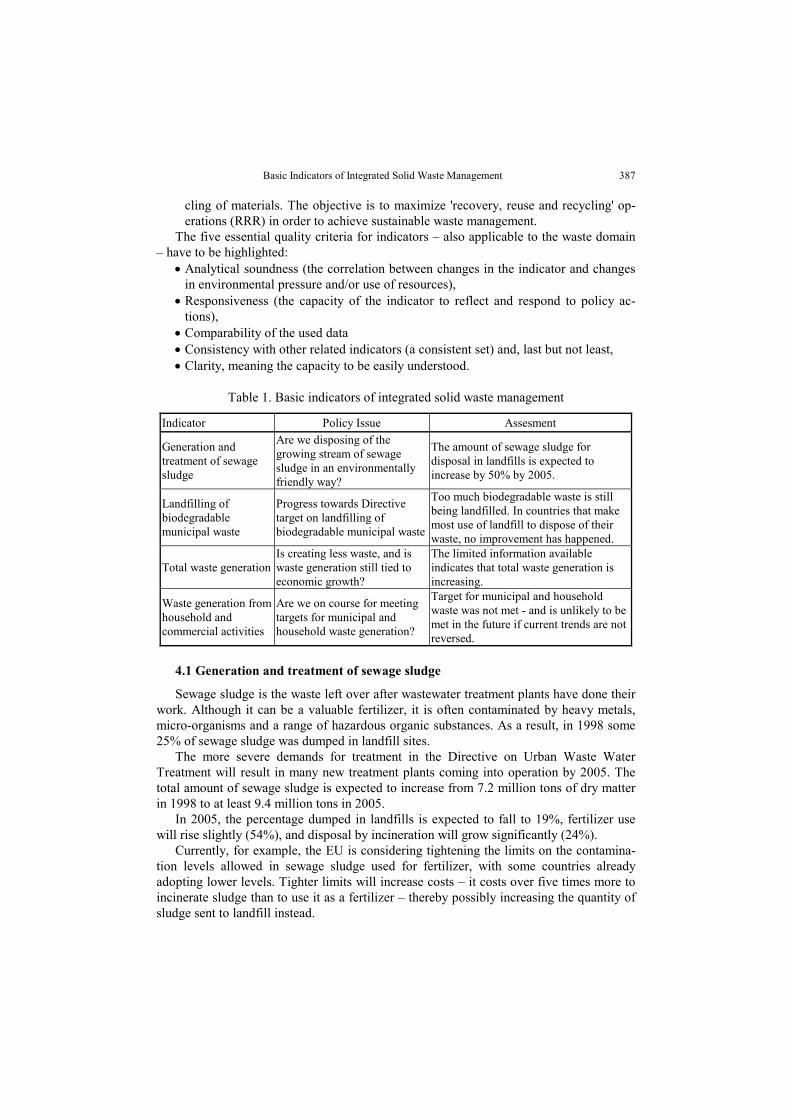
Reducing the contamination levels in sludge, therefore, would both reduce landfilling, pollution, and costs in the sector.
Fig. 3. Treatment of sewage sludge: selected EEA member countries, 1998 (Source: EEA)
4.2 Landfilling of biodegradable municipal waste
As biodegradable waste decomposes in landfills, it produces greenhouse gases and leaves behind potentially toxic liquids which can escape the landfill and pollute the sur-rounding environment. Adopting alternatives, such as composting and reusing the waste or burning it to generate energy, would therefore reduce both pollution and the amount of land devoted to waste disposal.
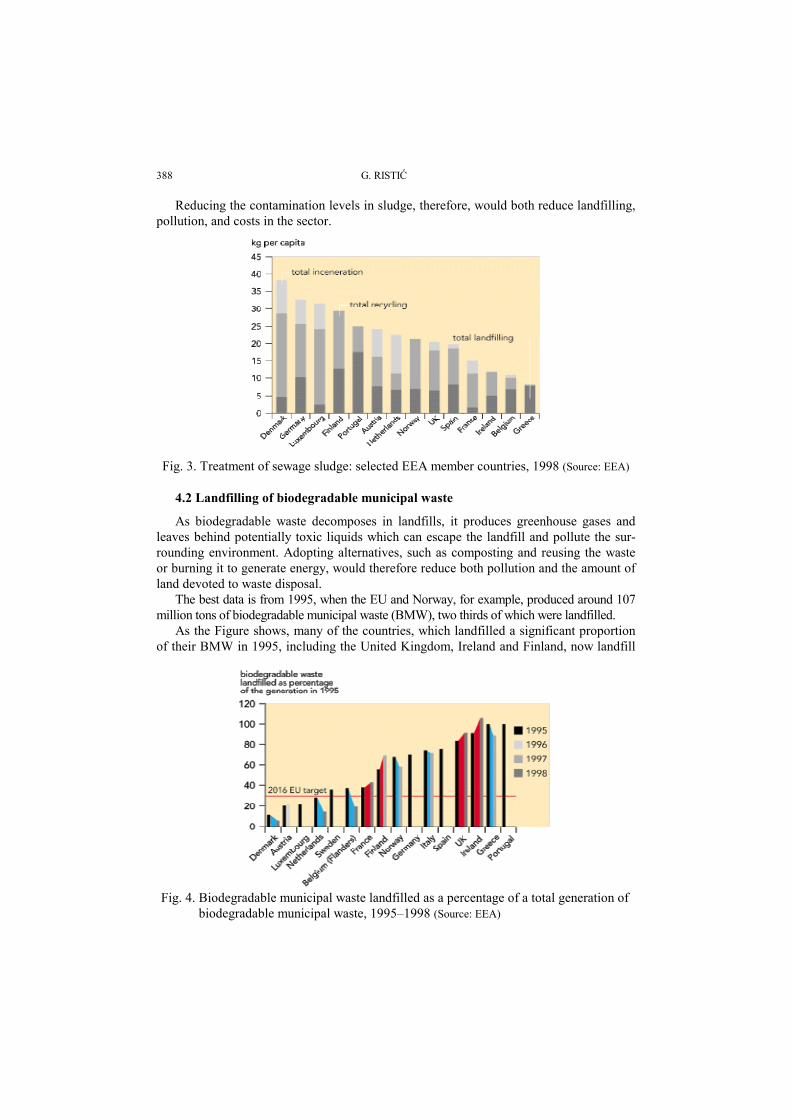
The best data is from 1995, when the EU and Norway, for example, produced around 107 million tons of biodegradable municipal waste (BMW), two thirds of which were landfilled.
As the Figure shows, many of the countries, which landfilled a significant proportion of their BMW in 1995, including the United Kingdom, Ireland and Finland, now landfill
Fig. 4. Biodegradable municipal waste landfilled as a percentage of a total generation of
biodegradable municipal waste, 1995–1998 (Source: EEA)
Basic Indicators of Integrated Solid Waste Management 389
even more. On the other hand, a certain number of countries actually reduced their pro-portion of landfilled BMW, including the Netherlands, Norway, Italy, and the Flemish region of Belgium.
The Directive on the Landfill of Waste sets targets for 2006, 2009, and 2016. Reach-ing them will require both reducing the fraction of BMW which is landfilled and reducing the total amount of BMW produced in the first place. This, in turn, will mean improving the collection of BMW, allowing it to be separated according to how contaminated it is, and creating new markets and outlets for BMW materials to be diverted away from land-fills.
4.3 Total waste generation
EU generates around 1.3 billion tons of waste every year. The data also shows that waste generation is still coupled to economic growth, making it impossible to pursue eco-nomic growth without generating increasingly serious waste management problems.
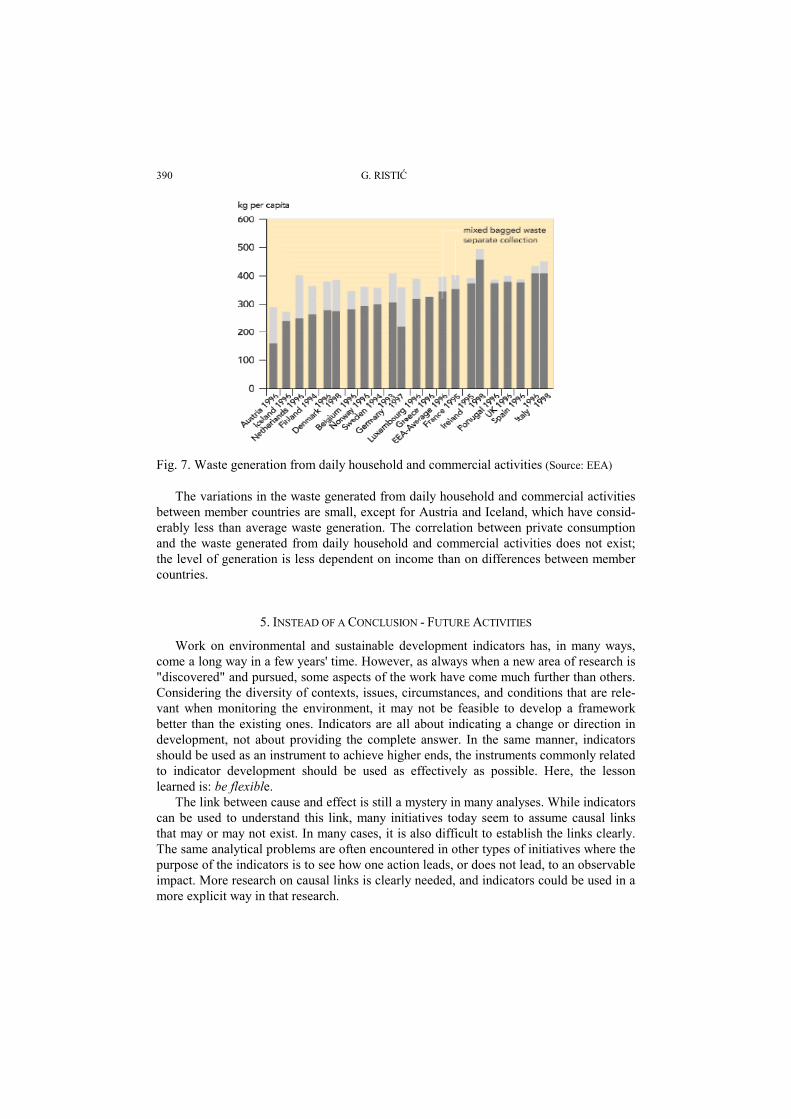
There is a particularly close link between economic growth and waste from the con-struction industry. As the Figure shows, this sector is responsible for around a fifth of all waste, while the largest sources are the manufacturing and mining/quarrying sectors.
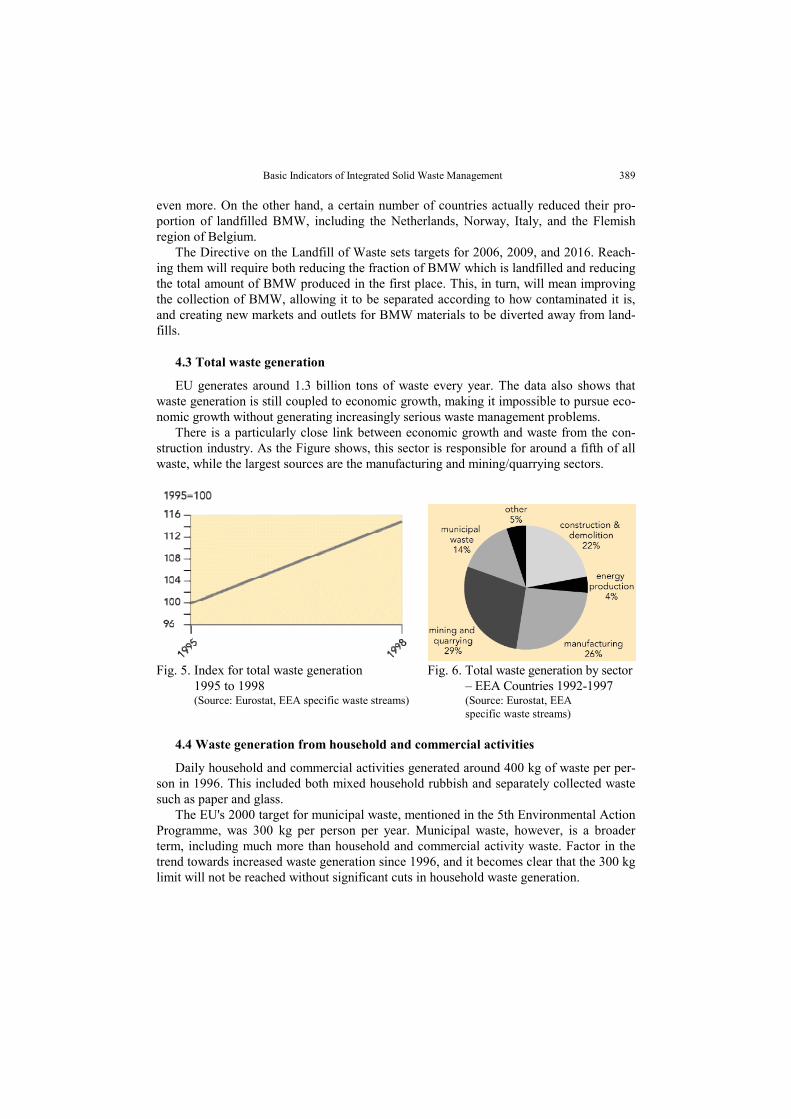
Fig. 5. Index for total waste generation
1995 to 1998 (Source: Eurostat, EEA specific waste streams)
Fig. 6. Total waste generation by sector – EEA Countries 1992-1997 (Source: Eurostat, EEA specific waste streams)
4.4 Waste generation from household and commercial activities
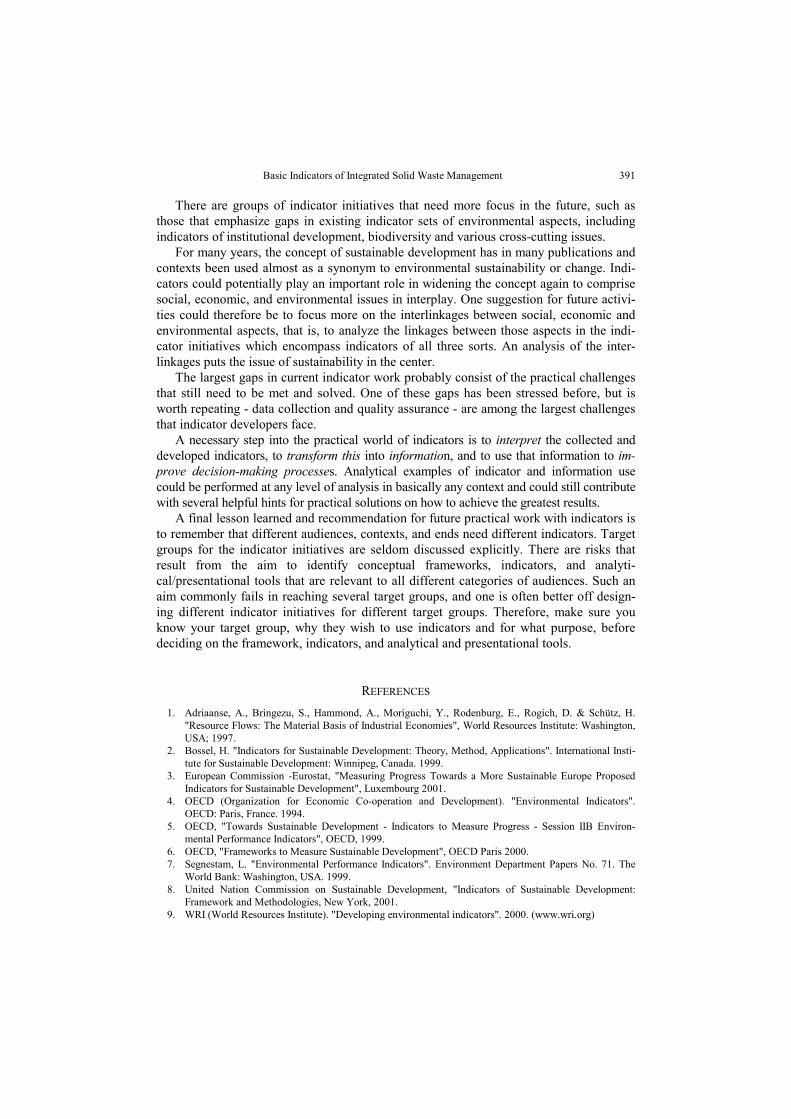
Daily household and commercial activities generated around 400 kg of waste per per-son in 1996. This included both mixed household rubbish and separately collected waste such as paper and glass.
The EU's 2000 target for municipal waste, mentioned in the 5th Environmental Action Programme, was 300 kg per person per year. Municipal waste, however, is a broader term, including much more than household and commercial activity waste. Factor in the trend towards increased waste generation since 1996, and it becomes clear that the 300 kg limit will not be reached without significant cuts in household waste generation.
G. RISTIĆ 390
Fig. 7. Waste generation from daily household and commercial activities (Source: EEA)
The variations in the waste generated from daily household and commercial activities between member countries are small, except for Austria and Iceland, which have consid-erably less than average waste generation. The correlation between private consumption and the waste generated from daily household and commercial activities does not exist; the level of generation is less dependent on income than on differences between member countries.
5. INSTEAD OF A CONCLUSION - FUTURE ACTIVITIES
Work on environmental and sustainable development indicators has, in many ways, come a long way in a few years' time. However, as always when a new area of research is "discovered" and pursued, some aspects of the work have come much further than others. Considering the diversity of contexts, issues, circumstances, and conditions that are rele-vant when monitoring the environment, it may not be feasible to develop a framework better than the existing ones. Indicators are all about indicating a change or direction in development, not about providing the complete answer. In the same manner, indicators should be used as an instrument to achieve higher ends, the instruments commonly related to indicator development should be used as effectively as possible. Here, the lesson learned is: be flexible.
The link between cause and effect is still a mystery in many analyses. While indicators can be used to understand this link, many initiatives today seem to assume causal links that may or may not exist. In many cases, it is also difficult to establish the links clearly. The same analytical problems are often encountered in other types of initiatives where the purpose of the indicators is to see how one action leads, or does not lead, to an observable impact. More research on causal links is clearly needed, and indicators could be used in a more explicit way in that research.
Basic Indicators of Integrated Solid Waste Management 391
There are groups of indicator initiatives that need more focus in the future, such as those that emphasize gaps in existing indicator sets of environmental aspects, including indicators of institutional development, biodiversity and various cross-cutting issues.
For many years, the concept of sustainable development has in many publications and contexts been used almost as a synonym to environmental sustainability or change. Indi-cators could potentially play an important role in widening the concept again to comprise social, economic, and environmental issues in interplay. One suggestion for future activi-ties could therefore be to focus more on the interlinkages between social, economic and environmental aspects, that is, to analyze the linkages between those aspects in the indi-cator initiatives which encompass indicators of all three sorts. An analysis of the inter-linkages puts the issue of sustainability in the center.
The largest gaps in current indicator work probably consist of the practical challenges that still need to be met and solved. One of these gaps has been stressed before, but is worth repeating - data collection and quality assurance - are among the largest challenges that indicator developers face.
A necessary step into the practical world of indicators is to interpret the collected and developed indicators, to transform this into information, and to use that information to im-prove decision-making processes. Analytical examples of indicator and information use could be performed at any level of analysis in basically any context and could still contribute with several helpful hints for practical solutions on how to achieve the greatest results.
A final lesson learned and recommendation for future practical work with indicators is to remember that different audiences, contexts, and ends need different indicators. Target groups for the indicator initiatives are seldom discussed explicitly. There are risks that result from the aim to identify conceptual frameworks, indicators, and analyti-cal/presentational tools that are relevant to all different categories of audiences. Such an aim commonly fails in reaching several target groups, and one is often better off design-ing different indicator initiatives for different target groups. Therefore, make sure you know your target group, why they wish to use indicators and for what purpose, before deciding on the framework, indicators, and analytical and presentational tools.
REFERENCES 1. Adriaanse, A., Bringezu, S., Hammond, A., Moriguchi, Y., Rodenburg, E., Rogich, D. & Schütz, H.
"Resource Flows: The Material Basis of Industrial Economies", World Resources Institute: Washington, USA; 1997.
2. Bossel, H. "Indicators for Sustainable Development: Theory, Method, Applications". International Insti-tute for Sustainable Development: Winnipeg, Canada. 1999.
3. European Commission -Eurostat, "Measuring Progress Towards a More Sustainable Europe Proposed Indicators for Sustainable Development", Luxembourg 2001.
4. OECD (Organization for Economic Co-operation and Development). "Environmental Indicators". OECD: Paris, France. 1994.
5. OECD, "Towards Sustainable Development - Indicators to Measure Progress - Session IIB Environ-mental Performance Indicators", OECD, 1999.
6. OECD, "Frameworks to Measure Sustainable Development", OECD Paris 2000. 7. Segnestam, L. "Environmental Performance Indicators". Environment Department Papers No. 71. The
World Bank: Washington, USA. 1999. 8. United Nation Commission on Sustainable Development, "Indicators of Sustainable Development:
Framework and Methodologies, New York, 2001. 9. WRI (World Resources Institute). "Developing environmental indicators". 2000. (www.wri.org)
G. RISTIĆ 392
OSNOVNI INDIKATORI INTEGRALNOG MENADŽMENTA ČVRSTIM OTPADOM
Goran Ristić
Nastajanje i menadžment čvrstim otpadom vrši "pritisak" na životnu sredinu emisijom u vazduh i vodu i zagadjivanjem zemljišta, sa značajnim potencijalnim uticajima na zdtavlje ljudi i prirodu. Većina komunalnog otpada se deponuje, sa značajnim "pritiskom" na životnu sredinu, dok se veoma mali deo reciklira. Najznačajniji kriterijumi kvaliteta indikatora su: analitička zasnovanost, osetljivost, komparabilnost-uporedivost i jasnost. U ovom radu analizirani su osnovni indikatori integralnog menadžmenta čvrstim otpadom: nastajanje i tretman otpadnog mulja, deponovanje biodegradabilnog komunalnog otpada, ukupna produkcija otpada i produkcija otpada iz domaćinstava i komercijalnih aktivnosti. Razvoj upotrebljivih indikatora životne sredine zahteva razumevanje ne samo koncepta i definicija, već i dobro poznavanje zahteva politike zaštite životne sredine. Podaci su osnovna komponenta indikatora. Indikator, izveden iz podataka, je opšti i osnovni alat za analizu promena u drustvu. Dva osnovna i najznačajnija prioriteta menadžmena čvrstim otpadom su: minimizacija uticaja nastajanja otpada na životnu sredinu i redukcija korišćenja resursa. Neophodni korak u prakticnoj primeni indikatora je tumačenje prikupljenih i razvijenih indikatora, njihova transformacija u informacije i korišćenje informacija za poboljšanje procesa donošenja odluka. Preporuka za buduće praktične aktivnosti u vezi sa indikatorima je zapamtiti da različite zainteresovane grupe, konteksti i ciljevi zahtevaju različite indikatore.
Ključne reči: Menadžment čvrstim otpadom, indikatori, životna sredina, kvalitet, alati