Embed Size (px)
Citation preview

RESEARCH ARTICLE Open Access
Basic ICT adoption and use by generalpractitioners: an analysis of primary caresystems in 31 European countriesSabina De Rosis* and Chiara Seghieri
Abstract
Background: There is general consensus that appropriate development and use of information and communicationtechnologies (ICT) are crucial in the delivery of effective primary care (PC). Several countries are defining policies tosupport and promote a structural change of the health care system through the introduction of ICT. This studyanalyses the state of development of basic ICT in PC systems of 31 European countries with the aim to describe theextent of, and main purposes for, computer use by General Practitioners (GPs) across Europe. Additionally, trends overtime have been analysed.
Methods: Descriptive statistical analysis was performed on data from the QUALICOPC (Quality and Costs of PrimaryCare in Europe) survey, to describe the geographic differences in the general use of computer, and in specificcomputerized clinical functions for different health-related purposes such as prescribing, medication checking,generating health records and research for medical information on the Internet.
Results: While all the countries have achieved a near-universal adoption of a computer in their primary care practices,with only a few countries near or under the boundary of 90 %, the computerisation of primary care clinical functionspresents a wide variability of adoption within and among countries and, in several cases (such as in the southern andcentral-eastern Europe), a large room for improvement.
Conclusions: At European level, more efforts could be done to support southern and central-eastern Europe in closingthe gap in adoption and use of ICT in PC. In particular, more attention seems to be need on the current usages of thecomputer in PC, by focusing policies and actions on the improvement of the appropriate usages that can impact onquality and costs of PC and can facilitate an interconnected health care system. However, policies and investmentsseem necessary but not sufficient to achieve these goals. Organizational, behavioural and also networking aspectsshould be taken in consideration.
Keywords: Primary care, General practitioners, ICT, Computer, E-health, Europe
BackgroundAmong the drivers of change in the health care sector,the advent of the computer and of its applications haverevolutionised health care systems and services [1, 2].The adoption and use of information and communica-tion technologies (ICT) are increasingly seen as sup-port, redesign and improvement tools for health care
delivery, especially in primary care (PC). ICT can con-tribute to address the main challenges of cost reduc-tion and improvements in equity and quality of care[3–6]. In fact, there is growing scientific evidence onthe potential of ICT adoption and use in PC, regardingappropriate services [7–9] and high-quality and effi-cient care [7, 10–13].Health information technologies, such as electronic
health records (EHRs) and digital interactions, have beendemonstrated to contribute to a more effective deliveryof PC services [14–22]. In particular, they can (i) facili-tate adherence to guidelines in clinical practice and
* Correspondence: [email protected] Superiore Sant’Anna, Institute of Management, LaboratorioManagement e Sanità, piazza Martiti della Libertà 33, Pisa 56127, Italy
© 2015 De Rosis and Seghieri. Open Access This article is distributed under the terms of the Creative CommonsAttribution 4.0 International License (http://creativecommons.org/licenses/by/4.0/), which permits unrestricted use,distribution, and reproduction in any medium, provided you give appropriate credit to the original author(s) and thesource, provide a link to the Creative Commons license, and indicate if changes were made. The Creative CommonsPublic Domain Dedication waiver (http://creativecommons.org/publicdomain/zero/1.0/) applies to the data madeavailable in this article, unless otherwise stated.
De Rosis and Seghieri BMC Medical Informatics and Decision Making (2015) 15:70 DOI 10.1186/s12911-015-0185-z
reduce medical errors with better knowledge manage-ment and evidence-based decision making [23–25]; (ii)contribute to integration and continuity of care with im-proved communication among physicians, patients andspecialists [26]; and (iii) produce savings of time andcosts [24, 27, 28]. Moreover, the health care workforce isexpected to experience improvements in efficiency, dele-gation support and remote care if health ICT and relatedelectronic applications are adopted in integrated andcomprehensive ICT systems [29].ICT solutions are increasingly available to PC physicians
without great investments in hardware, software and main-tenance. The development and availability of technologiesfor health care have facilitated the introduction of policiesin several countries, aimed at increasing their rapid adop-tion [13, 30, 31]. However, each country might respond dif-ferently to the actual challenges with various approachestowards potential solutions and drivers of growth, includingthe technological equipment for primary health care. Inaddition, the level of social and economic development, thecharacteristics of health care systems and the level of man-agerial capacity could make some technologies suitable forcertain countries but not others [32]. In recent decades, anumber of countries have experienced the implementationof various ICT applications in PC, including follow-up con-sultations via email, online access to laboratory results, mo-bile access to radiology images and new communicationtools [13]. However, a larger number of countries remain inthe first stages of technological innovation in PC. Thesefirst stages relate to the development of information sys-tems and the computerisation of PC functions, primarilyidentifiable in a shift from a paper-based processing/storagesystem to a computer-based one.The specific features of each country can contribute to
understanding the different states of ICT implementa-tion and its applications in PC systems. We found evi-dence in the literature of an association between the sizeof PC practice (PCP) and the use of ICT. For example, ahigher use of ICT is observed in larger practices than insingle-GP practices [33, 34]. Furthermore, the inter-professional setting of a PCP can promote the sharedadoption and use of technologies [35–38]. The locationof the practice can also be a lever to the adoption anduse of ICT. For instance, in rural areas, ICT can dimin-ish the quality and equity disparities between urban andrural settings of health care [13, 39–41]. However, thereis some evidence of the existence of a digital divide be-tween metropolitan and rural areas, where rural zonespresent lower rates of general practitioners (GPs) usingICT [34, 42]. The presence of financial incentives in thespecific remuneration model of the country can play arole in the deployment and use of ICT in health care.For example, in the USA, physicians salaried by capi-tated or budgeted organisations have been among the
earliest adopters of EHRs and other comprehensivehealth IT [43, 44].
AimsTo the best of our knowledge, most published studiesregarding ICT in PC have been largely conducted inEnglish-speaking countries or in Northern Europe[45–48]. The studies of the Commonwealth Fund onprofiles of health care systems also concerned topicsrelated to e-health including national policies andEHR-system implementation [20, 49, 50].The European Commission promoted two studies on
the adoption of e-health by European GPs: the first sur-vey was conducted in 2007 [30] and the second in 2013[51]. The 2013 survey aimed at measuring the adoptionof e-health applications among GPs in the EU-27,Croatia, Iceland, Norway and Turkey, and used four keyindicators: EHR; health information exchange, tele-health and personal health records. The study also aimedto explain the drives or barriers of adoption and tomeasure variations between 2007 and 2013. In 2010, aEuropean study presented an analysis of the nationalpolicies of Member States on e-health, understood asICT for health [31].Given these premises, the overall aim of this study is
to measure the current situation regarding the intro-duction and level of use of basic ICT in the PC systemsof 31 European countries using data from the Qualityand Costs of Primary Care in Europe (QUALICOPC)study [52]. Additionally, the study intends to measurevariations in the period 1993–2012 using data from theEuropean Study on GP Task Profiles (TP study) [53].In particular, starting from the QUALICOPC data, our
study focuses on ICT use by GPs because of their rolesas the main gatekeepers for PC services [53]. Severalcomputerised clinical functions were also investigated.In particular, we investigated “appropriate” applicationsof ICT in PC, which must be effective, cheap and safe. Abasic appropriate ICT infrastructure in GP practice (the“tangible” aspects) consists of one or more availablecomputers and an Internet connection [32]. Further-more, appropriate ICT equipment is the basis for differ-ent e-health uses and computerised clinical functions(“intangible” aspects), which can be appropriate if theycontribute to an improvement of the PC service delivery.(Note that e-health is defined as the delivery or improve-ment of information and health services through theInternet and related technologies [54].) The level of adop-tion of computers in PCP across Europe and the profes-sional use of these technologies by GPs were analysed usingselected questions from the QUALICOPC questionnaire toGPs. In particular, starting from existing studies on the ap-propriateness of computer uses [32, 55–57], we analysedthe uses that: contribute to an improvement of PC delivery
De Rosis and Seghieri BMC Medical Informatics and Decision Making (2015) 15:70 Page 2 of 16

[10]; can be economically sustained with local resources;are acceptable to users and recipients; respond to localhealth needs (not of a small minority); are scientifically vali-dated; and can be a part of a broader interconnected systemand be integrated in the usual practice of GPs [58–60]. TheICT applications from QUALICOPC data that present thecharacteristics listed above are as follows: (i) record keep-ing; (ii) drug prescriptions; (iii) storage of tests results; (v)communication with other parties; and (vi) searching med-ical information [10].Finally, we discuss our results to better understand
the variations across Europe. The large amount ofQUALICOPC data on different PC domains enabled usto analyse our results on ICT use with possible explana-tory variables. In particular, we used data related to thecharacteristics of both GPs and PCPs. We used the fol-lowing GP variables: age, gender, typology of employ-ment (self-employment vs. employment), typology ofremuneration (prospective, retrospective, other) and in-centives. The salient PCP variables are as follows: pa-tient population size and demographic characteristics(i.e., number of elderly), practice size (alone vs. shared)and location (urban, sub-urban, rural). We also discussour results in light of variables at the country level, suchas health system typology, expenditure on health careand health ICT and e-health strategies.
MethodsThe QUALICOPC project was funded by the EuropeanCommission under the Seventh Framework Program. Itcollected survey data from GPs and their patients in 31European countries (EU-27 excluding France, FYRMacedonia, Iceland, Norway, Switzerland and Turkey)and three non-European countries (Australia, Canada[Ontario] and New Zealand) [52]. For the aim of ourstudy, we only used data from the European countries.In the QUALICOPC project, a consortium of six
European partner institutes, coordinated by theNetherlands Institute for Health Services Research(NIVEL), developed and tested a number of hypothesesby concentrating on different domains: structure ofcare, quality of service provision, patients’ perceivedquality of care, costs, equity, avoidable hospitalisationand good practices [52]. Scuola Superiore Sant’Anna(SSSA) was the Italian partner of the QUALICOPCproject and was the leader of the work package on thecosts and efficiency of PC systems. SSSA also partici-pated in the work package on the structure of PC sys-tems, analysing their ICT structure and use. Theconcept of structure of care refers to the characteris-tics of PC such as equipment and human resourcesand was also analysed in terms of ICT infrastructureand use. This study is the first analysis of basic ICTstructure and use in PC using QUALICOPC data.
The QUALICOPC survey was conducted between2011 and 2013, depending on the country (hereafter wewill refer to the data as 2012 data). Three English-language questionnaires (one for GPs and two for pa-tients) were developed by the QUALICOPC consortiumafter a previous study on other validated questionnaires[52]. The questionnaires were translated and piloted inthree European countries (Belgium, the Netherlands andSlovenia) to a small sample of GPs and patients beforefinalising the source version for the European study. Thepilot showed that the questionnaires were of acceptableclarity and applicability. The pilot phase also revealedthe need for a further reduction of the questionnaire andthe reformulation of several questions. Based on thefindings of the pilot, the questionnaires were shortenedand rephrased where needed. In this phase, the aim wasto improve the intelligibility of questions without affect-ing their validity (because of a change in wording) [52].In every participating country, an institute coordinatedthe data collection. The national coordinators were alsoresponsible for the translation of the questionnaires. Ateam of PC experts in each country created draft transla-tions that were verified by professional translators usinga forward–backward methodology. The national coordi-nators were also responsible for organising, recruitingand collecting survey data from a representative sampleof GPs in each country. A number of PC physicians weresampled in each country with the following targets: 80GPs from small countries (Cyprus, Iceland, Luxembourgand Malta); 220 GPs from other countries. Where na-tional registers of GPs were available, random samplingwas used to select GPs from such lists (this method wasused in most countries). In countries where no nationalregisters exist, other sampling procedures were used, stillproviding a good representation the national situation(Finland, Greece, Hungary, Ireland, Italy and Norway).Only one GP per practice or health centre was eligible
to participate [52]. In most countries, the selected GPswere contacted via a mix of approaches (combinationsof letters, email and telephone contact). Furthermore, itwas common that one or more reminders were sent tothe selected GPs.Ethical approval was obtained in each country where
needed, in accordance with national requirements(Table 1). Patients and GPs were informed about thestudy and had to provide their consent before filling outthe questionnaires. Depending on the national require-ments, written or oral informed consent was requested.The general procedure was that GPs were invited via let-ter, e-mail or telephone and gave their consent to par-ticipate in the study. Patients were invited by thefieldworker or practice staff to complete a questionnaire.All participants were informed about the study and par-ticipation was voluntary. Both patient and GP surveys
De Rosis and Seghieri BMC Medical Informatics and Decision Making (2015) 15:70 Page 3 of 16

were carried out anonymously. An identification numberlinked GP responses to the responses of their patients.In most countries, paper questionnaires were sent by
mail to GPs and returned by mail to the national coord-inator and then electronically read into the Europeandatabase by a professional data management company.In other countries, GP questionnaires were filled outelectronically online or via a tablet computer.In the QUALICOPC survey for GPs, the use of com-
puters in the PCP and the main purposes of computer usewere collected using the following multiple-choice ques-tion: “For which of the following purposes do you use a
computer in your practice?” “i) Not applicable (I don’t use acomputer); ii) Making appointments; iii) Issuing invoices;iv) Issuing medicine prescriptions; v) Keeping records ofconsultations; vi) Sending referral letters to medicalspecialists; vii) Searching medical information on theInternet; viii) Storing diagnostic test results; ix) Send-ing prescriptions to the pharmacy” (question no. 43,GP questionnaire) [52].In our survey, e-prescribing was analysed in two oper-
ational states of implementation. Generally, the three stagesare e-capture, e-transfer and e-dispensation. With answersiv) and ix), we investigated, respectively, the first two states
Table 1 List of the ethics committees that approved the QUALICOPC study in each country
Country Ethics committee
Austria Ethics committee of the Medical University of Vienna.
Belgium University Hospital Ghent - Commission for Medical Ethics.
Bulgaria The coordinator sent an official letter to the Ministry of Health which gave consent and support for the survey.The coordinator confirmed that there is no statutory requirement for ethical approval for this study.
Cyprus National Bioethical Committee of Cyprus.
Czech Republic General University Hospital linked to the First Faculty of Medicine, Charles University in Prague.
Denmark The coordinator confirmed that there is no statutory requirement for ethical approval for this study.
Estonia The national coordinator consulted with the Ethics Review Committee on Human Research of theUniversity of Tartu. It was confirmed that there is no statutory requirement for ethical approval for this study.
Finland The ethical committee of Pirkanmaa Hospital District.
Germany Ethics Commision of the “Landesärtzenkammer Hessen”.
Greece Bioethical committees of seventy hospital.
Hungary National Ethical Committee.
Iceland The Icelandic Bioethics Committee. A national committee under the Ministry of Welfare.
Ireland Irish College of General Practitioners Research Ethics Committee – National Committee.
Italy At Local Health Authorities level. Approval was requested from LHA Ethical Committees.
Latvia Latvian Physicians Association Board of Certification
Lithuania Kauno Regionus Biomedicininu Tyrimu Etikos Komitetas.
Luxembourg National committee of Research Ethic (CNER) in Luxembourg.
Malta University of Malta Research Ethics Committee.
Netherlands The ethics committee of VU Medisch Centrum confirmed via an official letter that the research is outsidethe scope of the WMO Act (Medical Research Involving Human Subjects Act).
Norway The coordinator confirmed that there is no statutory requirement for ethical approval for this study.
Poland Bioethics approval of Jagiellonian University.
Portugal Ethical committee of Lisbon and Oporto regions; the National Commission for Health Data Safety.
Romania Scientific Committee of CPSS.
Spain Research Units of Primary Care of the Autonomous Community in the Basque Country. In all otherAtonomous Communities the study was approved at the Healthcare Area level.
Slovakia The national coordinator consulted with the Council of the Slovak Society of General Practice. It wasconfirmed that there is no statutory requirement for ethical approval for this study.
Slovenia National medical ethics committee.
Sweden Regional Research Ethics Committte.
Switzerland Ethical Committee of the University of Lausanne.
Turkey Ethical committee of Kartal Research and Education Hospital in Istanbul.
United Kingdom University of Lincoln School of Health and Social Care Ethics Committee; National Research Ethics Service.
De Rosis and Seghieri BMC Medical Informatics and Decision Making (2015) 15:70 Page 4 of 16

of implementation: the electronic transcription of medica-tion ordering and the electronic sending of prescriptions topharmacies. Moreover, most of these electronic clinicalfunctions (iv, v, vi, viii, ix) are possible with the adoption ofan EHR-like system. Using an electronic record system,other functions can be computerised to manage patientlists, generate a selection from the list and send remindersto patients for preventive care.The use of computers to communicate with patients
was also investigated using the answers to the followingquestion: “How many patient contacts do you have on anormal working day?” (question no. 10, GP question-naire). This question asked the number of daily face-to-face, telephone and email contacts [52].Moreover, comparisons over time were performed
using data from the TP study, which reviewed the stateof PC in 31 European countries and one non-Europeancountry in between 1993 and 1994 [53].With regard to the TP study, coordinated by NIVEL and
conducted in 1993, full access to the data was provided byNIVEL. The database includes responses from 7895 GPsfrom the following countries: Austria, Belgium, Bulgaria,Croatia, Czech Republic, Denmark, Germany, Estonia,Finland, France, Greece, Hungary, Iceland, Ireland, Israel,Italy, Latvia, Lithuania, Luxembourg, the Netherlands,Norway, Poland, Portugal, Romania, Slovenia, Spain,Sweden, Switzerland, Turkey, United Kingdom, Ukraineand Slovakia. The countries in the TP study that were notsurveyed in the QUALICOPC study were excluded fromour analysis. We used data from the following multiple-choice question in the TP questionnaire: “If a computer isat your disposal, for which purposes is it being used inyour practice?” “i) not applicable (no computer); ii) admin-istration/billing etc.; iii) making appointments; iv) record-ing drug prescriptions; v) keeping patient records; vi)research/audit; vii) other purposes” [53].T-test, chi-square and correlation tests with a 5 % level
of significance were used for the analyses described inthe following sections. All statistical analyses were con-ducted using Stata software, version 12.1.
ResultsCharacteristics of the sampleThe statistical population for the present study con-sisted of all GPs in their respective countries for the 31European surveyed countries (N = 6328). Results fromthe analysis of the sample are reported in Table 2.The surveyed countries present various differences in the
extent to which GPs play the role of gatekeeper to specia-lised care. Previous studies have analysed the role of GPs inPC [41]. In general, GPs have a gatekeeping role in systemsthat are largely public financed but not in those based onsocial insurance. However, there are countries where theboundaries between general and specialist medicine are
blurred, and for this reason, both practitioners and special-ists can have the first contact with patients. In countries likeDenmark, Iceland, Ireland, Italy, the Netherlands, Norway,Portugal, Slovenia, Spain, Sweden and the United Kingdom,patients go to their GP for referrals to specialists [41]. Inother countries, the GP does not have a gatekeeping role.In Eastern Europe, several countries have adopted, but withspecific national peculiarities, the Semashko model devel-oped in the former Soviet Union [61], with a greater focuson specialist and hospital care. Some (e.g., Bulgaria, CzechRepublic, Estonia, Hungary, Latvia, Lithuania, Poland,Romania, Slovakia and Slovenia) have been transitioning toother models [62], introducing strategic reforms like thegatekeeping role of GPs [63]. Furthermore, countries thatscore lower in terms of first contact through GPs are inEastern Europe (Bulgaria, Latvia and Lithuania); how-ever, some (e.g., Hungary and Slovenia) have scoresthat are equal or higher than those in Central Europe[53].Several primary health care systems show a gender im-
balance among GPs. For example, in the Czech Republic,Estonia, Finland, Latvia, Romania, Slovenia and FYRMacedonia, almost 70 % of GPs are female. In contrast,in Austria, Iceland, Lithuania, Malta, the Netherlands,Switzerland and Turkey, close to 70 % of GPs are male.The mean age of GPs ranges from 43.5 years in Greeceto 57.1 years in Italy.The majority of GPs in Austria, Bulgaria, Czech Republic,
Estonia, Hungary, Latvia, Slovakia and Slovenia work alone.In Cyprus, Denmark, Finland, Iceland, Ireland, theNetherlands, Norway, Poland, Spain, Sweden, Turkey andEngland, GPs share their offices with other GPs. In theremaining countries, there is a mix of the two.The PCP population estimated by GPs falls generally in
the range of 1000–3000 patients (Table 2). Belgium,Bulgaria, Greece, Norway, Switzerland and the formerYugoslav Republic of Macedonia (FYROM) also present animportant quota of smaller PC practices (<1000 patients).In contrast, Luxembourg, Malta, Sweden and England havea wide variability in terms of PC practice size, ranging fromless than 1000 patients to more than 5000; the average sizeof Swedish and English practice population is more than4000 patients per PCP.The location of the PC practice is another important fea-
ture differentiating PC systems. Table 2 shows the distribu-tion of the three location categories (city; suburb or smalltown; rural) by country. In Belgium and Switzerland, morethan 50 % GP practices are located in rural areas. InCyprus, Turkey, Lithuania and FYROM, there are a greaternumber of urban PCPs (in Lithuania more than 80 %). Pri-mary health care systems across Europe also vary regardingPCP density. The number of practicing physicians per 1000persons in the population varies from less than 2.5 inPoland to almost 5 in Austria [64].
De Rosis and Seghieri BMC Medical Informatics and Decision Making (2015) 15:70 Page 5 of 16

The countries also differ regarding GP employmenttype and remuneration [65, 64].
Computer useIn 2012, almost all the GPs in the surveyed European coun-tries used a computer (96 %) (Fig. 1). Comparing these re-sults with those of the TP study, we found an increase inthe use of computers in PC over time: in 1993, computers
were used by 40 % of GPs in the surveyed European coun-tries [53].The results also show a low but significant variability
in the general use of computers across and withincountries (Fig. 1). The lowest percentage of computeruse is in Poland, where 27 % of GPs stated they didnot use a computer in their daily PC practice, followedby Cyprus (24 %), Greece (18 %), Slovakia (16 %) and
Table 2 Characteristics of the sample of GPs by country: gender, age, location of practice and typology of practice accommodation(data on 31 European countries from the QUALICOPC survey)
Characteristics of the sample
Sample Gender Age Location of practice Typology of practice accommodation Practice population size
Number %female
Average % Big(inner)city
%Suburb/small town
%Urban–rural orrural
Shared accommodation
Alone With otherGPs
With medicalspecialist(s)
Average
Austria 184 30.3 54.3 34.27 23.03 42.70 80.6 8.1 6.1 3096.3
Belgium 408 37.6 49.2 21.38 24.57 54.05 45.4 40.1 2 1494.9
Bulgaria 223 63.2 50.5 49.77 35.48 14.75 63 20.3 9.3 1616.5
Cyprus 71 49.2 48 76.06 19.72 4.23 10.6 64.9 22.3 2384.8
Czech Rep 219 69.9 51.8 27.06 43.12 29.82 82.7 10.4 2.6 1950.3
Denmark 212 43.4 53 26.67 44.29 29.05 21.3 53.7 0 1690.7
Estonia 129 90.5 50.8 43.41 31.01 25.58 65.2 29.6 0.7 2161
Finland 288 71.4 45 16.14 42.11 41.75 27.9 53.6 13 1919
Germany 238 36.1 53.9 23.48 30.87 45.65 48.5 30.4 3.7 2859.5
Greece 220 45.9 43.5 5.91 19.09 75 43.5 38.2 8.8 2457.1
Hungary 222 46.8 53.4 31.22 28.96 39.82 79.3 10.3 3.3 1733.1
Iceland 80 27.5 54.5 37.97 45.57 16.46 1.9 74.3 20.9 1726.9
Ireland 169 33.7 50.6 8.59 37.42 53.99 21.4 57.6 7.1 2768.9
Italy 218 37.6 57.1 25.93 52.31 21.76 43.4 46.3 4.1 1307.8
Latvia 218 88.5 52 41.9 29.05 29.05 84.8 9.2 2.7 1698.1
Lithuania 225 11.5 51.2 85.07 9.05 5.88 29.9 37.1 3.8 1378
Luxembourg 78 36.8 49 14.47 36.84 48.68 38.2 37.2 2.9 3599.6
Malta 70 29 46.7 12.86 58.57 28.57 33.7 43 17.4 3243.8
Netherland 238 28 53 17.09 33.76 49.15 23.6 54.5 3.3 2417.3
Norway 198 39 45.6 33.85 36.41 29.74 0.4 81.3 14.1 1093.4
Poland 220 63.6 49.5 30 36.82 33.18 24.9 50.9 12.6 2420.6
Portugal 216 60.5 51.4 14.42 42.79 42.79 .. .. .. 1773.6
Romania 220 83.2 52 33.64 26.27 40.09 34.1 41.5 7.4 1840.3
Slovakia 220 67.9 52.6 18.52 47.22 34.26 93.8 3.1 1.8 1677.4
Slovenia 207 75.4 48.9 35.92 31.55 32.52 71.9 15.3 2.5 1950
Spain 428 63.2 49.7 46.35 36.47 17.18 4 76.9 18.7 1655
Sweden 97 54.6 52 15.46 53.61 30.93 0.9 84.9 6.2 4022.3
Switzerland 199 22.1 55 19.29 28.93 51.78 37.5 37.9 7.9 1678
Turkey 299 30.5 44 73.58 15.72 10.7 10.5 76.9 7.6 3712.3
England 171 37.9 46.6 15.88 44.12 40 5.7 82 5.2 4892.8
FYROM 143 83.9 45.7 54.93 29.58 15.49 34.9 35.4 13.2 1693.8
Source: QUALICOPC
De Rosis and Seghieri BMC Medical Informatics and Decision Making (2015) 15:70 Page 6 of 16

Latvia (13 %). A number of countries reported that 100 %of GPs use a computer in their practice: Denmark, Estonia,Finland, Germany, Hungary, Iceland, Italy, the Netherlands,Norway, Portugal, Spain, Sweden, Switzerland, England andFYROM (Table 3).In some countries, the percentage of practices with
computers markedly increased from 1993 to 2012 [41].Regarding countries with a lower computer adoption ratein 2012, we observe that the percentage of use dramatic-ally increased; for example, from 3 % in 1993 to 73 % in2012 in Poland, 59 to 82 % in Greece and 34 to 87 % inLatvia. Other examples include Estonia (from 55 % in1993 to 100 % in 2012), Lithuania (5 to 98 %) andRomania (from 9 to 92 %).Table 4 summarises the use of computers for all health
purposes by GPs across and within countries.
Use of appropriate ICT applications in primary careThe following computer uses could contribute to an im-provement of PC delivery and were analysed: (i) recordkeeping; (ii) drug prescriptions; (iii) storing of tests results;
(iv) making appointments; (v) communication with otherparties; and (vi) searching medical information [10]. Someof these computer uses are only based on the availability ofa computer, and others on the availability of an Internetconnection. The results of the analysis of the different com-puter uses are reported in Table 4.In 2012, European GPs mainly used their computers to
search for medical information on the Internet and to issuedrug prescriptions. In contrast, 1993 data show that themost reported computer use was for “administration” pur-poses (62 % of GPs) [53].The use of computers for “searching medical infor-
mation on the Internet” was reported by 82 % of GPsin Europe. Although this use is widely diffuse acrossEurope, there are still countries reporting low rates ofuse. Cyprus has the lowest percentage (46 %), withSlovakia (50 %), Lithuania (50. 5 %), Greece (59 %) andNorway (59 %) also scoring poorly. We found a low butsignificant variability among countries. This use was lessdiffuse in 1993, with an average of 37 % of European GPsstating they searched for medical information online. The
Fig. 1 Map of levels of computer use in primary care: comparison among 31 European countries from QUALICOPC survey. The % scales of GPsthat reported computer use in their practice range from 70 to 100 %: the first level in the lighter colour represents the range 0–70 %; the second71–80 %; the third 81–90 %; the fourth 91–95 %; the fifth in the darker colour 96–100 %; the countries in white were not included in theQUALICOPC survey, and for this reason, they have no data and were not assigned a level of computer use in the figure. Base: All GPs. Indicator:question “Computer use”. Source QUALICOPC, 2013
De Rosis and Seghieri BMC Medical Informatics and Decision Making (2015) 15:70 Page 7 of 16

highest values in 1993 were in the United Kingdom (93 %)and Portugal (77 %), with other European countries pre-senting values under 50 %. Among countries with lowerrates in 2012, it is worth pointing out the marked increasein this use type in Lithuania—in 1993 no GPs used com-puters to search for medical information.The second main computer use is “issuing drug prescrip-
tions” (the e-capture stage of e-prescribing). This use wasreported by 81 % of GPs and ranged from 1.5 % in Cyprus
to 100 % in the Netherlands. We found a huge differencebetween the 2012 data and the 1993 data. Indeed, theEuropean countries analysed in the TP study presentedless than 45 % for computerised prescriptions.Information systems can also be used to facilitate infor-
mation sharing and knowledge management with col-leagues and specialists. Two computer uses were analysedwith this regard: “sending referral letters to specialists” and“sending prescriptions to pharmacies”.A total of 70.5 % surveyed European GPs use a computer
for “sending referral letters to specialists”; in contrast, just31 % send prescriptions to pharmacies (the e-transfer stageof e-prescribing). Both these uses have high variabilityamong countries: just 3 % of GPs in Lithuania send referralletters to medical specialists via computer compared with99.5 % in Denmark. This variability also regards sendingprescriptions to pharmacies, starting at 0 % in Lithuaniaand Malta to 100 % in Iceland and Sweden. In these twocountries, and in Denmark, Estonia, the Netherlands andNorway, the implementation of a fully operational e-prescribing application appears more advanced. These twocomputer uses were not analysed in the TP study.Finally, almost 51 % of European GPs use computers for
“making appointments”. Overall, our data analysis showedhigh variability: the rate varies from 4.5 % in Greece to100 % in the Netherlands. Compared with the TP studydata, we found that in 20 years, the use of computers forthis purpose has increased by more than 25 % in Europe[53]. It is also worth highlighting the improvement overtime in some countries and the worsening in others. Forexample, the two countries with the highest and the lowestrates in 2012 had a similar value in 1993: the Netherlandsincreased from 12 to 100 %, while Greece decreased from11.5 to 4.5 %.Denmark, Iceland, the Netherlands, Norway and Sweden
emerge as good practices in terms of adoption and use ofappropriate ICTapplications in PC. In particular, more than86 % of GPs in Denmark and the Netherlands reported allsix appropriate computer uses, while the overall value forall QUALICOPC countries is 59 %. In contrast, we found10 countries with a rate under the overall average. Theycan be divided in two groups. The first is composed ofcountries that range from 40 to 59 %: Romania (39 %),Slovakia (40.8 %), Slovenia (43 %) and Bulgaria (54 %). Thesecond group is composed of countries with values of ap-propriate computer use under 40 %: Lithuania (14 %),Cyprus (20 %), Greece (28 %), Poland (29 %), and Latviaand Malta (30 %). These countries have considerable roomfor improvement.
Storage of data by general practitionersIn terms of patient data storage, two types of computeruse were studied: (i) storage of diagnostic test results;and (ii) recording of consultations.
Table 3 Situation regarding use of computers in primary care in31 European countries (QUALICOPC survey; indicator questionGP43: computer use)
Country Use of the computer in the PC practice Cases
freq perc Ci Freq
Austria 182 99.45 96.99 99.99 183
Belgium 387 95.09 92.51 96.97 407
Bulgaria 219 98.65 96.10 99.72 222
Cyprus 53 75.71 63.99 85.17 70
Czech Republic 206 94.06 90.06 96.80 219
Denmark 212 100 98.28 100a 212
Estonia 129 100 97.18 100a 129
Finland 285 100 98.71 100a 285
Germany 235 100 98.44 100a 235
Greece 180 82.19 76.47 87.02 219
Hungary 222 100 98.35 100a 222
Iceland 79 100 95.44 100a 79
Ireland 164 97.62 94.02 99.35 168
Italy 218 100 98.32 100a 218
Latvia 188 87.04 81.81 91.21 216
Lithuania 220 98.21 95.49 99.51 224
Luxembourg 76 97.44 91.04 99.69 78
Malta 67 95.71 87.98 99.11 70
Netherland 235 100 98.44 100a 235
Norway 198 100 98.15 100a 198
Poland 161 73.18 66.81 78.91 220
Portugal 215 100.00 98.30 100a 215
Romania 202 91.82 87.38 95.08 220
Slovakia 182 84.26 78.70 88.85 216
Slovenia 200 96.62 93.16 98.63 207
Spain 428 100 99.14 100a 428
Sweden 97 100 96.27 100a 97
Switzerland 199 100 98.16 100a 199
Turkey 297 99.33 97.60 99.92 299
England 169 100 97.84 100a 169
FYROM 142 100 97.44 100a 142
Total 6047 95.97 6301
Source: QUALICOPCaone-sided, 97.5 % confidence interval
De Rosis and Seghieri BMC Medical Informatics and Decision Making (2015) 15:70 Page 8 of 16

Table 4 Use of computers in primary care: comparison among 31 European countries (QUALICOPC survey; indicator question GP43: computer use)
Makingappointments
Issuing invoices Issuing drug prescr. Keeping records Sending ref.letters
Storing testresults
Searchingmed. info
Sending prescript.to phar.
Cases
Perc. c.i. Perc. c.i. Perc. c.i. Perc. c.i. Perc. c.i. Perc. c.i. Perc. c.i. Perc. c.i. freq
Austria 58.47 50.97 65.69 81.42 75.02 86.78 93.99 89.50 96.96 96.17 92.28 98.45 96.72 93.00 98.79 92.35 87.50 95.75 83.61 77.43 88.66 15.3 10.41 21.35 183
Belgium 44.72 39.82 49.69 17.20 13.66 21.22 74.45 69.92 78.62 85.01 81.39 88.53 62.9 58.00 67.61 88.94 85.49 91.82 87.47 83.86 90.53 13.02 9.91 16.69 407
Bulgaria 10.36 6.68 15.14 36.49 30.15 43.19 85.59 80.26 89.93 61.26 54.51 67.71 93.24 89.10 96.17 88.74 83.83 92.58 77.93 71.89 83.20 15.77 11.23 21.24 222
Cyprus 8.57 3.21 17.73 7.14 2.36 15.89 1.43 0.04 7.70 14.29 7.07 24.71 12.86 6.05 23.01 75.71 63.99 85.17 45.71 33.74 58.06 2.86 0.35 9.94 70
Czech Rep 39.27 32.76 46.08 76.26 70.06 81.73 87.21 82.05 91.33 84.47 78.99 89.00 65.30 58.59 71.58 62.1 55.32 68.55 84.02 78.48 88.61 9.13 5.67 13.75 219
Denmark 99.06 96.63 99.89 91.04 86.36 94.52 100 98.28 100a 99.53 97.40 99.99 99.53 97.40 99.99 99.53 97.40 99.99 98.58 95.92 99.71 99.53 97.40 99.99 212
Estonia 73.64 65.16 81.01 79.84 71.88 86.39 92.25 86.21 96.22 96.12 91.19 98.73 82.17 74.46 88.35 93.80 88.15 97.28 97.67 93.35 99.52 96.90 92.25 99.15 129
Finland 76.49 71.13 81.29 13.33 9.61 17.84 98.60 96.45 99.62 100 98.71 100a 98.95 96.95 99.78 97.19 94.54 98.78 96.84 94.09 98.55 38.95 33.25 44.88 285
Germany 55.32 48.72 61.79 93.62 89.69 96.38 99.15 96.96 99.90 87.66 82.76 91.58 99.15 96.96 99.90 88.94 84.21 92.64 71.49 65.26 77.17 16.17 11.70 21.51 235
Greece 4.57 2.21 8.24 0.46 0.01 2.52 75.80 69.57 81.32 26.48 20.77 32.85 24.66 19.10 30.92 26.94 21.19 33.33 58.90 52.08 65.49 9.13 5.67 13.75 219
Hungary 33.78 27.59 40.42 13.06 8.93 18.22 99.55 97.52 99.99 96.85 93.61 98.72 81.98 76.28 86.80 95.50 91.87 97.82 88.29 83.31 92.21 11.71 7.79 16.69 222
Iceland 94.94 87.54 98.60 37.97 27.28 49.59 98.73 93.15 99.97 100 95.44 100a 94.94 87.54 98.60 98.73 93.15 99.97 97.47 91.15 99.69 100 95.44 100a 79
Ireland 86.31 80.17 91.12 67.26 59.61 74.29 91.67 86.41 95.37 89.29 83.60 93.53 89.88 84.29 93.99 92.86 87.86 96.25 88.69 82.90 93.05 27.98 21.34 35.41 168
Italy 25.23 19.61 31.54 8.26 4.97 12.74 99.08 96.73 99.89 85.32 79.91 89.74 55.5 48.64 62.22 88.53 83.54 92.44 78.90 72.88 84.12 13.3 9.09 18.54 218
Latvia 24.07 18.53 30.34 26.85 21.07 33.29 56.48 49.59 63.19 20.83 15.62 26.87 37.96 31.47 44.80 24.54 18.95 30.83 73.61 67.20 79.36 1.39 0.29 4.01 216
Lithuania 27.23 21.52 33.56 1.79 0.49 4.51 4.46 2.16 8.06 10.71 6.99 15.52 3.13 1.27 6.33 18.75 13.86 24.49 50.45 43.71 57.17 0 0.00 0.02a 224
Luxembourg 48.72 37.23 60.31 89.74 80.79 95.47 88.46 79.22 94.59 78.21 67.41 86.76 79.49 68.84 87.80 70.51 59.11 80.30 84.62 74.67 91.79 24.36 15.35 35.40 78
Malta 28.57 18.40 40.62 4.29 0.89 12.02 2.86 0.35 9.94 38.57 27.17 50.97 15.71 8.11 26.38 67.14 54.88 77.91 87.14 76.99 93.95 0 0.00 0.05a 70
Netherland 100 98.44 100a 94.47 90.73 97.02 100 98.44 100a 100 98.44 100a 98.72 96.31 99.74 99.57 97.65 99.99 99.15 96.96 99.90 95.32 91.78 97.64 235
Norway 98.99 96.40 99.88 90.40 85.42 94.12 98.48 95.64 99.69 100 98.15 100a 99.49 97.22 99.99 98.99 96.40 99.88 97.47 94.21 99.18 90.40 85.42 94.12 198
Poland 25.45 19.84 31.75 27.73 21.92 34.14 50 43.20 56.80 44.09 37.42 50.92 21.36 16.14 27.38 30.45 24.45 37.00 59.09 52.28 65.65 4.09 1.89 7.62 220
Portugal 88.84 83.85 92.72 13.02 8.83 18.27 99.07 96.68 99.89 98.60 95.98 99.71 93.95 89.88 96.74 97.67 94.66 99.24 86.98 81.73 91.17 13.49 9.22 18.79 215
Romania 19.55 14.52 25.41 15.00 10.56 20.42 56.36 49.53 63.02 85 79.58 89.44 32.27 26.14 38.89 32.73 26.57 39.36 76.82 70.67 82.23 12.27 8.25 17.35 220
Slovakia 31.48 25.35 38.13 57.87 50.98 64.54 80.56 74.64 85.61 72.22 65.74 78.08 55.56 48.66 62.30 31.94 25.78 38.61 50 43.14 56.86 5.09 2.57 8.93 216
Slovenia 34.30 27.86 41.20 77.29 70.98 82.81 89.37 84.35 93.22 58.45 51.42 65.24 38.16 31.52 45.15 36.23 29.68 43.18 86.47 81.05 90.82 2.42 0.79 5.55 207
Spain 85.75 82.07 88.92 5.84 3.82 8.50 98.83 97.29 99.62 98.13 96.35 99.19 98.83 97.29 99.62 99.07 97.62 99.74 88.79 85.41 91.61 60.05 55.23 64.72 428
Sweden 95.88 89.78 98.87 23.71 15.66 33.42 80.41 71.11 87.78 96.91 91.23 99.36 95.88 89.78 98.87 95.88 89.78 98.87 98.97 94.39 99.97 100 96.27 100a 97
Switzerland 49.75 42.60 56.90 97.99 94.93 99.45 55.28 48.08 62.31 46.23 39.16 53.42 87.94 82.59 92.12 52.26 45.08 59.37 90.45 85.49 94.15 29.15 22.93 35.99 199
Turkey 13.38 9.73 17.77 4.01 2.09 6.91 69.90 64.35 75.05 91.30 87.52 94.24 51.51 45.68 57.30 83.28 78.56 87.33 79.93 74.94 84.32 43.14 37.46 48.97 299
England 98.82 95.79 99.86 60.95 53.16 68.35 99.41 96.75 99.99 99.41 96.75 99.99 98.22 94.90 99.63 98.22 94.90 99.63 98.82 95.79 99.86 44.97 37.32 52.80 169
FYR MO 14.08 8.82 20.91 90.85 84.85 95.03 97.89 93.95 99.56 70.42 62.19 77.78 78.87 71.23 85.27 45.07 36.72 53.64 83.10 75.90 88.86 30.99 23.50 39.28 142
DeRosis
andSeghieriBM
CMedicalInform
aticsand
Decision
Making
(2015) 15:70 Page
9of
16

Table 4 Use of computers in primary care: comparison among 31 European countries (QUALICOPC survey; indicator question GP43: computer use) (Continued)
Total 51.33 42.01 80.99 77.40 70.47 73.85 82.18 31.6 6301
Source: QUALICOPCaone-sided, 97.5 % confidence interval
DeRosis
andSeghieriBM
CMedicalInform
aticsand
Decision
Making
(2015) 15:70 Page
10of
16

Overall, 75.5 % of GP practices in the 31 Europeancountries stored both types of patient data. In particular,74 % of GPs stored diagnostic tests results and 77.4 %used the computer for keeping consultation records(Table 4).The Netherlands, Denmark, Spain, Norway, Iceland,
England (99 %), Portugal (98 %) and Finland (97 %)showed the highest percentages of computer use for“storing diagnostic test results”. In contrast, Lithuania(19 %), Latvia (24.5 %) and Greece (27 %) had the lowestpercentages.Regarding the storage of medical records, it seems that
the countries can be categorised into four groups. In thefirst group there are those countries where the rate ofGPs using computers for this purpose is lower than15 %: Lithuania 11 % and Cyprus 14 %. The secondgroup is composed by countries characterised by valuesranging from 15 to 49 %: Latvia 21 %, Greece 26.5 %,Malta 38.5 %, Poland 44 % and Switzerland 46 %. Thethird group presents 11 countries with percentages inthe range of 50–89 %: Slovenia 58.5 %, Bulgaria 61 %,FYRMO 70.5 %, Slovakia 72 %, Luxembourg 78 %,Czech Republic 84.5 %, Romania 85 %, Italy 85 %,Belgium 85 %, Germany 87.5 %, and Ireland 89 %. Thefinal 13 countries present the highest rates ranging from90 to 100 %: Austria, Denmark, Estonia, Finland,Hungary, Iceland, the Netherlands, Norway, Portugal,Spain, Sweden, Turkey and England. Thus, despite apresence of variability among countries, the majority ofthem widely use computers to store medical records.The mean value for the European QUALICOPC coun-
tries was significantly different from the results of 1993(almost 18 % higher, p < .001) [41].
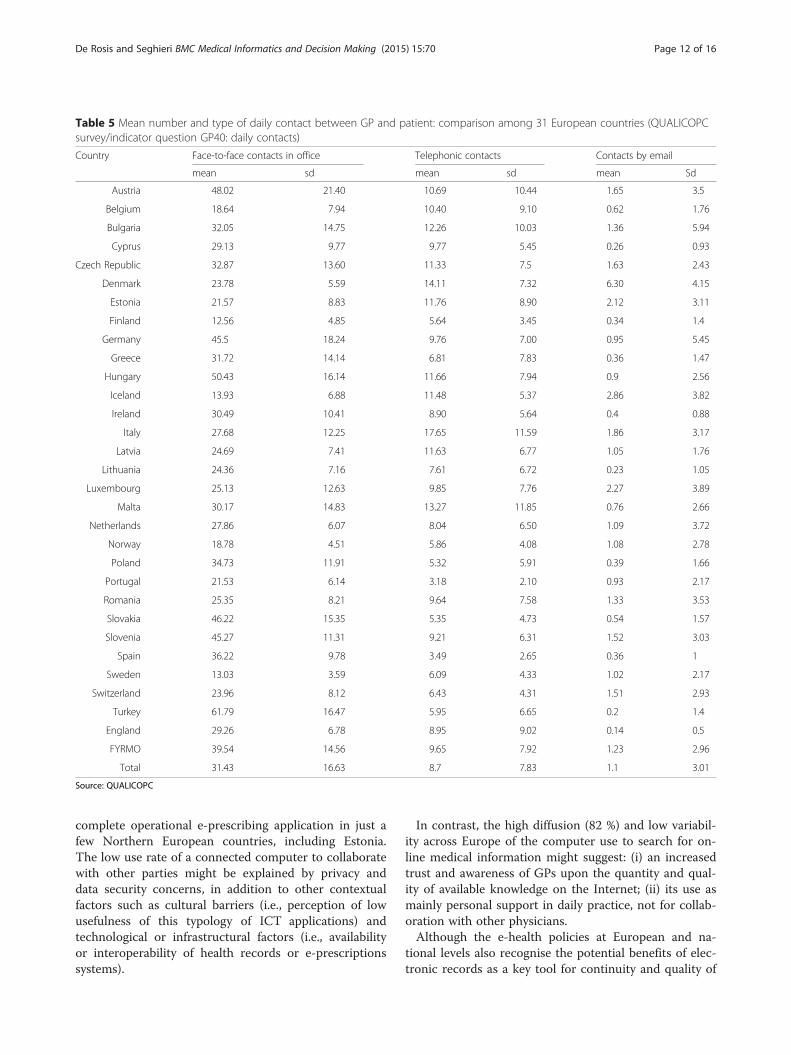
Communication with patients: use of emailThe computer can be a channel of communication be-tween GPs and patients if there is access to the Internet.The results of the analysis of the different communica-tion channels are reported in Table 5.The QUALICOPC survey collected data on the mean
number of patient contacts that GPs have on a normalworking day, either via face-to-face contact or by phonecalls or emails. A total of 34 % GPs reported close toone email communication per day. For all QUALICOPCcountries, the number of daily emails was very low (n = 1)compared with face-to-face (n = 31.5) and telephonic con-tact (n = 8.7).Looking closer at country-level data, a great variability
can be seen (Table 5). In particular, the high variabilitybetween countries in the number of daily contacts byemail (p < .001) is illustrated in Fig. 2: the average num-ber of daily email contacts ranged from 0.13 in Englandto 6.3 in Denmark. However, it seems that email ex-changes with patients were not highly diffused among
GPs. Furthermore, 66 % of European GPs have no emailcontact with patients on a normal working day.
DiscussionThe results of our research have extended the findingsof the TP study [53] by documenting the extent to whichPC physicians use ICT to provide patient care in 31European countries in 2012.The first finding of our study is that the computerisa-
tion of general practices has grown over the past two de-cades. A near-universal adoption of computers in PChas been achieved by all the sample countries. Only fivecountries show adoption rates below 90 %: Poland,Cyprus, Greece, Slovakia and Latvia. These findings con-firm the results of another recent survey [51].As revealed in previous studies [30, 51], our results
show that although computers are considered PC equip-ment, their use for clinical purposes is significantly dif-ferent across Europe. North European countries(Denmark, Iceland, the Netherlands, Norway andSweden) have the best results in terms of appropriateuse of ICT in PC. In contrast, several Eastern (CzechRepublic, Lithuania, Poland, Slovakia and Slovenia) andSouthern European countries (Cyprus, Greece, Maltaand Turkey) present a lower use of basic ICT, both in2012 and in 1993. However comparing QUALICOPCand TP data, we found that these countries have had agrowth in computer adoption and use in PC in the last20 years. In particular, ICT infrastructures and use in PCsystems of Estonia and Hungary has improved over time,achieving good results if compared with other Europeancountries.Several interesting explanations to the geographic vari-
ability in the ICT adoption have been found by analysingselected variables related to PC context.Similar to previous research [30, 33–38], our results
show that, in general, the size of the practice is associ-ated with ICT use: in single-GP practices the computeris used less than in offices shared with other GPs or spe-cialists. This association is significant for the storage oftest results (ρ = −.41, p = .02) and for sending prescrip-tions to pharmacies (ρ = −.56, p = .001). Although thesetwo uses has not achieved universal implementation,they seem to be favoured by an inter-professional or net-worked PC.EHR-like systems and e-prescription are priorities in
various EU e-Health Action Plan and in the policies ofseveral Member States (respectively, 27 and 22 EU coun-tries) [31, 66]. However, the general political commit-ment to these e-health fields is at different stages ofimplementation across countries [31]. While, e-captureis a widespread activity (reported by 81 % of GPs), witha significant variability among countries, the use of e-transfers by GPs is low (31 %). We only found a near-
De Rosis and Seghieri BMC Medical Informatics and Decision Making (2015) 15:70 Page 11 of 16
complete operational e-prescribing application in just afew Northern European countries, including Estonia.The low use rate of a connected computer to collaboratewith other parties might be explained by privacy anddata security concerns, in addition to other contextualfactors such as cultural barriers (i.e., perception of lowusefulness of this typology of ICT applications) andtechnological or infrastructural factors (i.e., availabilityor interoperability of health records or e-prescriptionssystems).
In contrast, the high diffusion (82 %) and low variabil-ity across Europe of the computer use to search for on-line medical information might suggest: (i) an increasedtrust and awareness of GPs upon the quantity and qual-ity of available knowledge on the Internet; (ii) its use asmainly personal support in daily practice, not for collab-oration with other physicians.Although the e-health policies at European and na-
tional levels also recognise the potential benefits of elec-tronic records as a key tool for continuity and quality of
Table 5 Mean number and type of daily contact between GP and patient: comparison among 31 European countries (QUALICOPCsurvey/indicator question GP40: daily contacts)
Country Face-to-face contacts in office Telephonic contacts Contacts by email
mean sd mean sd mean Sd
Austria 48.02 21.40 10.69 10.44 1.65 3.5
Belgium 18.64 7.94 10.40 9.10 0.62 1.76
Bulgaria 32.05 14.75 12.26 10.03 1.36 5.94
Cyprus 29.13 9.77 9.77 5.45 0.26 0.93
Czech Republic 32.87 13.60 11.33 7.5 1.63 2.43
Denmark 23.78 5.59 14.11 7.32 6.30 4.15
Estonia 21.57 8.83 11.76 8.90 2.12 3.11
Finland 12.56 4.85 5.64 3.45 0.34 1.4
Germany 45.5 18.24 9.76 7.00 0.95 5.45
Greece 31.72 14.14 6.81 7.83 0.36 1.47
Hungary 50.43 16.14 11.66 7.94 0.9 2.56
Iceland 13.93 6.88 11.48 5.37 2.86 3.82
Ireland 30.49 10.41 8.90 5.64 0.4 0.88
Italy 27.68 12.25 17.65 11.59 1.86 3.17
Latvia 24.69 7.41 11.63 6.77 1.05 1.76
Lithuania 24.36 7.16 7.61 6.72 0.23 1.05
Luxembourg 25.13 12.63 9.85 7.76 2.27 3.89
Malta 30.17 14.83 13.27 11.85 0.76 2.66
Netherlands 27.86 6.07 8.04 6.50 1.09 3.72
Norway 18.78 4.51 5.86 4.08 1.08 2.78
Poland 34.73 11.91 5.32 5.91 0.39 1.66
Portugal 21.53 6.14 3.18 2.10 0.93 2.17
Romania 25.35 8.21 9.64 7.58 1.33 3.53
Slovakia 46.22 15.35 5.35 4.73 0.54 1.57
Slovenia 45.27 11.31 9.21 6.31 1.52 3.03
Spain 36.22 9.78 3.49 2.65 0.36 1
Sweden 13.03 3.59 6.09 4.33 1.02 2.17
Switzerland 23.96 8.12 6.43 4.31 1.51 2.93
Turkey 61.79 16.47 5.95 6.65 0.2 1.4
England 29.26 6.78 8.95 9.02 0.14 0.5
FYRMO 39.54 14.56 9.65 7.92 1.23 2.96
Total 31.43 16.63 8.7 7.83 1.1 3.01
Source: QUALICOPC
De Rosis and Seghieri BMC Medical Informatics and Decision Making (2015) 15:70 Page 12 of 16

care, this electronic function has not achieved universalimplementation (77.4 % of the surveyed GPs use elec-tronic records, with a large variability between coun-tries). These results could be explained, again, by variousfactors at the country level, such as interoperabilityproblems, safety and privacy issues and the centralisa-tion or delocalisation of data control. In fact, standard-isation and legal and regulatory issues are among thekey applications of European e-health strategies [67].No statistically significant results were found for the
association between practice location (rural) and com-puter use. Whereas, considering the number of elderlypatients in the PCP population, we found that the pres-ence of elderly patients below the country average isnegatively associated with some computer uses in PC(ρ = −.43, p = .01). These results might be explained bythe fact that aged patients are the highest users ofhealthcare services, especially PC services, and also themost fragile patients owing to chronicity and multi-morbidity [37].Looking at country level, variations across European
countries could be partially explained by national pol-icies on e-health, as anticipated. All European countrieshave adopted policies on e-health, or participated inEuropean projects and discussions [31, 68]. Central andNorthern European countries (e.g., Scandinavian coun-tries, Germany and Denmark) enjoy mature e-healthstrategies. In contrast, Southern and Eastern EU coun-tries are mostly at the planning stage or only now imple-menting e-health applications. Among Eastern Europeancountries, Estonia represents a positive example also interms of strategic e-health applications [63].
Referring to World Information Technology and Ser-vices Alliance data [69] adjusted at current purchasingpower parities (PPPs) [64] we did not find a significantassociation between ICT expenditure in the health caresector and ICT adoption and use in PC. This might beexplained by the fact that computers have been widelyadopted in all QUALICOPC countries and do not re-quire large financial investment. Therefore, expenditureon ICT might have a significant impact on advanced e-health applications.Similar results were found by analysing 2012 OECD
data on the total expenditure on health care per capita[67] adjusted at current PPPs [64].It seems that some variations can be explained by the
size of the public resources spent on health care. Signifi-cant positive associations (ρ = .05) were found betweenthe public expenditure on health care and both thecomputerisation rate (p = .04) and several computeruses (p = .05). By analysing our results in associationwith health system typologies, we also found negativesignificant associations between ICT use and countrieswith a system in transition from the Semashko model(ρ = −.45, p = .05).Another finding of this study is that doctor–patient
communication via email is not a common practice.Face-to-face communication appears widely preferred toother forms of contact with GPs. We found a very lowrate and variability regarding email communication.Denmark is the exception with a mean value of 6.3 con-tacts per day. While Denmark is a leading country in theuse of health care technology, these results can be betterexplained by the innovations introduced in the Danish
Fig. 2 Box plot of the number of daily email contacts per country. Variability among the 31 European countries of the QUALICOPC survey: withincountries (dimension of the boxes, position of the median and upper and lower quartiles) and among countries (comparison among boxes).Base: All GPs. Indicator: question “Daily contacts”. Source QUALICOPC, 2013
De Rosis and Seghieri BMC Medical Informatics and Decision Making (2015) 15:70 Page 13 of 16

health care system, including payments to physicians foremail with designated call-in times [70].
ConclusionsThe findings of the present study reveal significant pro-gress in basic ICT adoption in European PC. Severalcountries have achieved a universal adoption of com-puter use in just a few years, and other countries are fol-lowing closely behind. Significant differences in the usesof computer as reported by GPs were found across andwithin countries. These variations might be partly ex-plained by differences in the organisation of health caresystems, the role of GPs, funding models, national andlocal policies and legislation on e-health.The requirement for appropriate technological
innovation in PC is growing, and is now seen as an im-portant contribution to the improvement of qualityand efficiency in health care. However, the variabilityand/or low use of computerised PC functions revealthat having a computer in a physician’s office is notsufficient.In addition, the increasing availability of ICT solutions
from external PC networks, such as laboratories andpharmacies, as well as the increase of expert patients,and their growing recourse to the Internet for healthpurposes [19, 71–75], are changing the context in whichphysicians operate. GPs must become increasingly awareof the opportunities provided by technological innova-tions in PC. In this sense, evidence-based education onthese topics for medical staff is crucial. Organisationalsupport in terms of culture and environment is alsofundamental.An appropriate and comprehensive use of ICT in PC
could be incentivised by specific policies aimed at build-ing a connected and collaborative health care system.The introduction of ICT in health care could changework tasks and boundaries. Public policies may be basedon a general agreement of health care workers on theprocesses of technology adoption.Technological innovation concerns not only technolo-
gies, but also behavioural, organisational and networkingaspects, becoming a disruptive innovation [1]. For thisreason, the results of this research emphasise the crucialrole in a successful innovation process of public author-ities, at European, national and regional levels.
AbbreviationsGP(s): General practitioner(s); ICT: Information and communicationtechnologies; QUALICOPC: Quality and costs of primary care in Europe;PC: Primary care; EU: European union; EU-27: European union of 27 memberstates (until 30 June 2013); EHR(s): Electronic health record(s); FYROM: FormerYugoslav Republic of Macedonia; TP: Task profiles; SSSA: Scuola SuperioreSant’Anna.
Competing interestsThe authors declare that they have no competing interests.
Authors’ contributionsSDR designed the study. SDR and CS contributed to the analysis andinterpretation of data. All authors wrote, read and approved the finalmanuscript.
AcknowledgementsWe want to thank the two reviewers for their constructive comments. Wethank the researchers at Laboratorio Managament e Sanità of ScuolaSuperiore Sant’Anna (Pisa), and in particular Giulia Capitani, for theircontribution to the design and collection of Italian data. We are also gratefulto Sabina Nuti for her support and suggestions. SDR is thankful to TelecomItalia for supporting her PhD research. We also thank our partners in theQUALICOPC project for their role throughout the study and theircoordination of the data collection: W Boerma, P Groenewegen, W Schäfer, FSchellevis, P Spreeuwenberg and D Kringos (the Netherlands, NIVEL,coordinator); J De Maeseneer, E De Ryck, L Hanssens, A Van Pottelberge andS Willems (Belgium); S Greß, S Heinemann (Germany); D Rotar Pavlič and IŠvab (Slovenia); and M Van den Berg and T Van Loenen (the Netherlands).We would like to thank the coordinators of the data collection in eachcountry: L Jorm and I McRae (Australia); K Hoffmann and M Maier (Austria); PSalchev (Bulgaria); W Wodchis (Canada); G Samoutis (Cyprus); B Seifert and NŠrámková (Czech Republic); J Reinholdt Jensen and P Vedsted (Denmark); MLember and K Põlluste (Estonia); E Kosunen (Finland); K Stavric (FYRMacedonia); C Lionis (Greece), I Rurik (Hungary); J Heimisdóttir and OThorgeirsson (Iceland); C Collins (Ireland); G Ticmane (Latvia); S Macinskas(Lithuania), M Aubart, J Leners and R Stein (Luxembourg); G Bezzina and PSciortino (Malta); T Ashton and R McNeill (New Zealand); T Bjerve Eide and HMelbye (Norway); M Oleszczyk and A Windak (Poland); L Pisco (Portugal); DFarcasanu (Romania); T Dedeu (Spain); E Jurgova (Slovakia); C Björkelund andT Faresjö (Sweden); T Bisschoff and N Senn (Switzerland); M Akman (Turkey);and C Sirdifield and N Siriwardena (United Kingdom). Finally, we would liketo thank everyone supported the national coordinators in the data collectionin their countries. This article is based on the QUALICOPC (Quality and Costsof Primary Care in Europe) project, co-funded by the European Commissionunder the Seventh Framework Programme (FP7/2007-2013) under grantagreement 242141.
Received: 4 November 2014 Accepted: 17 July 2015
References1. Christensen CM, Grossman JH, Hwang J. The Innovator’s prescription:
a disruptive solution to the health care. New York: McGraw Hill; 2009.2. ECHAlliance & Wragge & Co. Connected health - white paper. 2014.3. Westbrook JI, Braithwaite J. Will information and communication
technology disrupt the health system and deliver on its promise? Med JAust. 2010;193(7):399.
4. Westbrook JI, Coiera EW, Gosling AS. Do online information retrievalsystems help experienced clinicians answer clinical questions? J Am MedInform Assoc. 2005;12(3):315–21.
5. Christensen CM, Bohmer R, Kenagy J. Will disruptive innovations cure healthcare? Harv Bus Rev. 2000;78(5):102–12.
6. Bichel-Findlay J, Callen J, Sara A. An information system’s contribution towork satisfaction: differing perspectives between doctors and nurses. In:Health informatics society of Australia. 2008. p. 40.
7. McInnes DK, Saltman DC, Kidd MR. General practitioners’ use of computersfor prescribing and electronic health records: results from a national survey.Med J Aust. 2006;185:88–91.
8. Green A, Ross D, Mirzoev T. Primary health care and England: the coming ofage of Alma Ata? Health Policy. 2007;80:11–31.
9. Hogg W, Rowan M, Russell G, Geneau R, Muldoon L. Framework for primarycare organizations: the importance of a structural domain. Int J Qual HealthCare. 2008;20(5):308–13.
10. Kringos DS, Boerma WG, Hutchinson A, van der Zee J, Groenewegen PP.The breadth of primary care: a systematic literature review of its coredimensions. BMC Health Serv Res. 2010;10:65.
11. Blumenthal D. Stimulating the adoption of health information technology.N Engl J Med. 2009;360(15):1477–9.
12. Blumenthal D. Launching HITECH. N Engl J Med. 2010;362(5):382–5.
De Rosis and Seghieri BMC Medical Informatics and Decision Making (2015) 15:70 Page 14 of 16

13. Report of the Digital Innovation in Healthcare Working Group 2012. [http://xnet.kp.org/kpinternational/docs/The%20Digital%20Dimension%20of%20Healthcare.pdf].
14. Miller RA, Gardner RM, Johnson KB, Hripcsak G. Clinical decision support andelectronic prescribing systems: a time for responsible thought and action.JAMA. 2005;12(4):403–9.
15. Romano MJ, Stafford RS. Electronic health records and clinical decisionsupport systems: impact on national ambulatory care quality. Arch InternMed. 2011;171(10):897–903.
16. Fiks AG, Hunter KF, Localio AR, Grundmeier RV, Bryant-Stephens T, LubertiAA, et al. Impact of electronic health record-based alerts on influenzavaccination for children with asthma. Pediatrics. 2009;124(1):159–69.
17. Green LV, Savin S, Lu Y. Primary care physician shortages could beeliminated through use of teams, non-physicians, and electroniccommunication. Health Aff (Millwood). 2013;32(1):11–9.
18. DesRoches CM, Campbell EG, Rao SR, Donelan K, Ferris TG, Jha A, et al.Electronic health records in ambulatory care — A national survey ofphysicians. N Engl J Med. 2008;359:50–60.
19. Wald HS, Dube CE, Anthony DC. Untangling the Web—The impact ofInternet use on health care and the physician–patient relationship. PatientEduc Couns. 2007;68(3):218–24.
20. Schoen C, Osborn R, Squires D, Doty MM, Rasmussen P, Pierson R, et al.A survey of primary care doctors in ten countries shows progress in use ofhealth information technology, less in other areas. Health Aff. 2012;31:2805–16.
21. Starfield B, Shi L, Macinko J. Contribution of primary care to health systemsand health. Milbank Q. 2005;83:457–502.
22. Krishnan A, Nongkynrih B, Yadav K, Singh S, Gupta V. Evaluation ofcomputerized health management information system for primary healthcare in rural India. BMC Health Serv Res. 2010;10:310.
23. Øvretveit TS, Rundall TG, Shortell SM, Brommels M. Improving qualitythrough effective implementation of information technology in healthcare.Int J Qual Health Care. 2007;19(5):259–66.
24. Sidorov J. It ain’t necessarily so: the electronic health record and the unlikelyprospect of reducing health care costs. Health Aff. 2006;25(4):1079–85.
25. Greenblatt L, Kushinka JT. Evidence-based medicine and primary care:keeping up is hard to do. Mt Sinai J Med. 2012;79:545–54.
26. Yarbrough AK, Smith TB. Technology acceptance among physicians: a newtake on TAM. Med Care Res Rev. 2007;64:650–72.
27. OECD. Benchmarking adoption and Use of information and communicationtechnologies in The health sector: background document. Paris: OECD.Directorate for Employment. Labour and Social Affairs / Directorate forScience. Technology and Industry. COM/DELSA/DSTI; 2012. p. 1.
28. Bryan C, Boren SA. The use and effectiveness of electronic clinical decisionsupport tools in the ambulatory/primary care setting: a systematic review ofthe literature. Inform Prim Care. 2008;16:79–91.
29. Weiner JP, Yeh S, Blumenthal D. The impact of health informationtechnology and e-health on the future demand for physician services.Health Aff (Millwood). 2013;32(11):1998–2004.
30. Dobrev A, Haesner M, Hüsing T, Korte WB, Meyer I - Information Society andMedia Directorate General. Benchmarking ICT use among generalpractitioners in Europe. Final report for European commission. Bonn: Officefor Official Publications of the European Communities; 2008.
31. Stroetmann K, Artmann J, Stroetmann V, Protti D, Dumortier J, Giest S, et al.European countries on their journey towards national eHealthinfrastructures. Luxembourg: Office for Official Publications of the EuropeanCommunities; 2011.
32. Cohen J. Appropriate technology in primary health care. Evolution andmeaning of WHO’S concept. Int J Technol Assess Health Care. 1989;5:103–9.
33. Ullrich FA, MacKinney AC, Mueller KJ. Are primary care practices ready tobecome patient-centered medical homes? J Rural Health. 2013;29(2):180–7.
34. Ortega Egea JM, Roman Gonzalez MV, Menendez MR. eHealth usagepatterns of European general practitioners: A five-year (2002–2007)comparative study. Int J Med Inform. 2010;79:539–53.
35. Mannan R, Murphy J, Jones M. Is primary care ready to embrace e-health?A qualitative study of staff in a London primary care trust. Inform Prim Care.2006;14(2):121–31.
36. Fontaine P, Ross SE, Zink T, Schilling LM. Systematic review of healthinformation exchange in primary care practices. J Am Board Fam Med.2010;23(5):655–70.
37. Plomp MGA, Batenburg RS, Verheij RA. Adoption of interorganisational ICTin primary care. In: Bath PA, Mettler T, Raptis DA, Sen BA, editors.
Proceedings of the 15th International Symposium on Health InformationManagement Research. Zurich Switzerland, 8–9 September 2011. http://www.researchgate.net/profile/Robert_Verheij/publication/241864230_Adoption_of_interorganisational_ICT_in_primary_care/links/0deec531f521d28274000000.pdf.
38. Damiani G, Silvestrini G, Federico B, Cosentino M, Marvulli M, Tirabassi F, et al.A systematic review on the effectiveness of group versus single-handedpractice. Health Policy. 2013;113(1–2):180–7.
39. Pyne JM, Fortney JC, Tripathi SP, Maciejewski ML, Edlund MJ, Williams DK.Cost-effectiveness analysis of a rural telemedicine collaborative careintervention for depression. Arch Gen Psychiatry. 2010;67(8):812.
40. Davis MM, Currey JM, Howk S, DeSordi MR, Boise L, Fagnan LJ, et al.A qualitative study of rural primary care clinician views on remotemonitoring technologies. J Rural Health. 2014;30(1):69–78.
41. Sbarouni V, Tsimtsiou Z, Symvoulakis E, Kamekis A, Petelos E, Saridaki A, et al.Perceptions of primary care professionals on quality of services in rural Greece:a qualitative study. Rural Remote Health. 2012;12:2156.
42. Brooks RG, Menachemi N. Physician’s use of email with patients: factorsinfluencing electronic communication and adherence to best practices.J Med Internet Res. 2006;8(1):e2.
43. Chen C, Garrido T, Chock D, Okawa G, Liang L. The Kaiser Permanenteelectronic health record: transforming and streamlining modalities of care.Health Aff (Millwood). 2009;28(2):323–33.
44. Garrido T, Jamieson L, Zhou Y, Wiesenthal A, Liang L. Effect of electronichealth records in ambulatory care: retrospective, serial, cross sectional study.BMJ. 2005;330(7491):581.
45. Harris Interactive. U.S. trails other English speaking countries in use ofelectronic medical records and electronic prescribing. Harris InteractiveHealth Care News. 2001;1:28.
46. Interactive H. The future use of the Internet in 4 countries in relation toprescriptions, physician communication and health information. HarrisInteractive Health Care News. 2001;2:13.
47. Harris Interactive. European physicians especially in Sweden, Netherlandsand Denmark lead U.S. in use of electronic medical records. HarrisInteractive Health Care News. 2002;2:16.
48. OECD. Improving health sector efficiency: the role of information andcommunication technologies. Paris: OECD Health Policy Studies, OECD;2010.
49. Thomson S, Osborn R, Squires D, Jun M, editors. International profiles ofhealth care systems, 2013 (Australia, Canada, Denmark, England, France,Germany, Italy, Japan, the Netherlands, New Zealand, Norway, Sweden,Switzerland, and the United States). New York: CommonWealth Fund; 2013.
50. Davis K, Stremikis K, Squires D, Schoen C. Mirror, mirror on the wall. Howthe performance of the U.S. Health care system compares internationally.New York: CommonWealth Fund; 2014.
51. European Commission, Directorate-General for Communications Networks,Content and Technology. Benchmarking deployment of eHealth amonggeneral practitioners. 2013.
52. Schäfer WLA, Boerma WGW, Kringos DS, De Ryck E, Greß S, Heinemann S,et al. Measures of quality, costs and equity in primary health care:Instruments developed to analyse and compare primary health care in 35countries. Qual Prim Care. 2013;21(2):67–79.
53. Boerma WG, Van der Zee J, Fleming DM. Service profiles of generalpractitioners in Europe. European GP task profile study. Br J Gen Pract.1997;47(421):481–6.
54. Eysenbach G. What is e-health? J Med Internet Res. 2001;3(2):e20.55. Jequier N. Appropriate technology: problems and promises. Paris: OECD;
1976.56. Alma-Ata Declaration. [www.who.int/publications/
almaata_declaration_en.pdf].57. Goodyear L, Tsu V, Kaisel D, Lalwani T, GHEC. Appropriate health
technologies: concepts, criteria, and uses. Seattle, Washington: PATH; 2009.58. Papshev D, Peterson AM. Electronic prescribing in ambulatory practice:
promises, pitfalls, and potential solutions. Am J Manag Care.2001;7(7):725–36.
59. Tamblyn R, Huang A, Perreault R, Jacques A, Roy D, Hanley J, et al. Themedical office of the 21st century (MOXXI): effectiveness of computerizeddecision-making support in reducing inappropriate prescribing in primarycare. CMAJ. 2003;169:549–56.
60. Cueto M. The origins of primary health care and selective primary healthcare. Am J Public Health. 2004;22(94):1864–74.
De Rosis and Seghieri BMC Medical Informatics and Decision Making (2015) 15:70 Page 15 of 16

61. Vienonen MA, Wlodarczyk WC. Health care reforms on the European scene:evolution, revolution or seesaw? World Health Stat Q. 1993;46(3):166–9.
62. Grielen SJ, Boerma WGW, Groenewegen PP. Unit of diversity? Task profilesof general practitioners in Central and Eastern Europe. Eur J Public Health.2000;10:249–54.
63. Groenewegen PP, Dourgnon P, Greß S, Jurgutis A, Willems S. Strengtheningweak primary care systems: steps towards stronger primary care in selectedWestern and Eastern European countries. Health Policy. 2013;113(1–2):170–9.
64. OECD. Health data. Health care resources. Health Statistics 2014 (database).Disclaimer: http://oe.cd/disclaimer Available online: http://stats.oecd.org/.
65. Boerma WG. Profiles of general practice in Europe an international study ofvariation in the tasks of general practitioners. Utrecht, The Netherlands:NIVEL; 2003.
66. European Commission. eHealth action plan 2012–2020 - innovativehealthcare for the 21st century. COM(2012) 736 final. Brussels: EuropeanCommission; 2012.
67. OECD. Health data. Key Tables from OECD, No. 2: “Total expenditure onhealth per capita”. Health Statistics 2014. doi: 10.1787/hlthxp-cap-table2014-1-en . Disclaimer: http://oe.cd/disclaimer Available online:http://stats.oecd.org/.
68. Individual eHealth Strategies Country Reports. Available online:www.ehealth-strategies.eu/database/database.html.
69. WITSA. Digital planet - country tables: the world information technologyand services alliance. 2008.
70. Protti DJ, Widespread JbG. Adoption of information technology in primarycare physician offices in Denmark: a case study, vol. 1379. New York:Commonwealth Fund; 2010. p. 80.
71. Andreassen HK, Bujnowska-Fedak MM, Chronaki CE, Dumitru RC, Pudule I,Santana S, et al. European citizens’ use of E-health services: a study of sevencountries. BMC Public Health. 2007;7:53.
72. Kummervold PE, Chronaki CE, Lausen B, Prokosch HU, Rasmussen J, SantanaS, et al. eHealth trends in Europe 2005–2007: a population-based survey.J Med Internet Res. 2008;10(4):e42.
73. Ouschan R, Jillian S, Lester J. Customer empowerment and relationshipoutcomes in healthcare consultations. Eur J Mark. 2006;40(9/10):1068–86.
74. Lo B, Parham L. The impact of web 2.0 on the doctor-patient relationship.J Law Med Ethics. 2010;38(1):17–26.
75. Ricciardi L, Mostashari F, Murphy J, Daniel JG, Siminerio EP. A Nationalaction plan to support consumer engagement via e-health. Health Aff(Millwood). 2013;32(2):376–84.
Submit your next manuscript to BioMed Centraland take full advantage of:
• Convenient online submission
• Thorough peer review
• No space constraints or color figure charges
• Immediate publication on acceptance
• Inclusion in PubMed, CAS, Scopus and Google Scholar
• Research which is freely available for redistribution
Submit your manuscript at www.biomedcentral.com/submit
De Rosis and Seghieri BMC Medical Informatics and Decision Making (2015) 15:70 Page 16 of 16