Embed Size (px)
Citation preview
1
BASF Corporation
BASIC GUIDELINES FOR PLASTIC CONVERSION OF METAL AXIAL FLOW FANS
INTRODUCTION This guideline outlines in brief the basic steps recommended for the development of a plastic conversion of a metal fan. It is limited with respect to axial flow type fans, and does not necessarily address a single classification within that family. The field of fan design is quite extensive and complex, it is therefore impossible to address all aspects of axial fan design within the scope of this paper. It is suggested that these rules be utilized in general sense as a starting point in the development process especially when initial geometric data is lacking. It is also essential to integrate a testing program throughout the different development stages, to evaluate the performance of the various basic design changes and their impact on achieving the desired outcome.
TABLE OF CONTENTS Topic Page 1.DEVELOPMENT GUIDELINES 1 - 14 2. PLASTICS IN MAJOR FAN APPLICATIONS 14 - 15 3. TECHNICAL SUPPORT FROM BASF CORPORATION 15 - 18 4. SUMMARY OF AN ACTUAL DEVELOPMENT PROGRAM 18 - 28 5. APPENDIX
DOCUMENT STRUCTURE This document is structured around four main topics. The first one highlights basic rules that are recommended for developing baseline dimensions of axial flow in a metal to plastic conversion application. The second topic describes in summary the general methods used to optimize plastic fans. The third topic presents in brief BASF Corporationdesign support capabilities in this field, and finally the last topic goes over an actual fan development program at BASF facilities.
2
DEVELOPMENT GUIDELINES
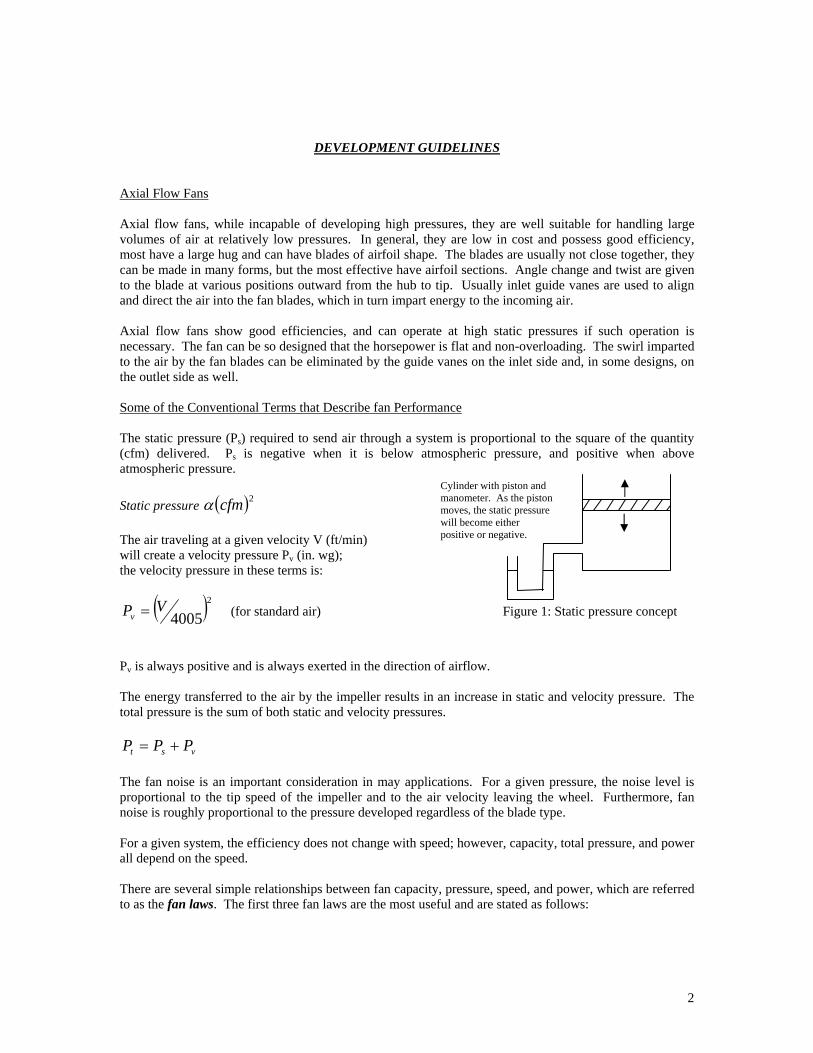
Axial Flow Fans Axial flow fans, while incapable of developing high pressures, they are well suitable for handling large volumes of air at relatively low pressures. In general, they are low in cost and possess good efficiency, most have a large hug and can have blades of airfoil shape. The blades are usually not close together, they can be made in many forms, but the most effective have airfoil sections. Angle change and twist are given to the blade at various positions outward from the hub to tip. Usually inlet guide vanes are used to align and direct the air into the fan blades, which in turn impart energy to the incoming air. Axial flow fans show good efficiencies, and can operate at high static pressures if such operation is necessary. The fan can be so designed that the horsepower is flat and non-overloading. The swirl imparted to the air by the fan blades can be eliminated by the guide vanes on the inlet side and, in some designs, on the outlet side as well. Some of the Conventional Terms that Describe fan Performance The static pressure (Ps) required to send air through a system is proportional to the square of the quantity (cfm) delivered. Ps is negative when it is below atmospheric pressure, and positive when above atmospheric pressure. Static pressure ( )2cfmα The air traveling at a given velocity V (ft/min) will create a velocity pressure Pv (in. wg); the velocity pressure in these terms is:
( )2
4005VPv = (for standard air) Figure 1: Static pressure concept
Pv is always positive and is always exerted in the direction of airflow. The energy transferred to the air by the impeller results in an increase in static and velocity pressure. The total pressure is the sum of both static and velocity pressures.
vst PPP += The fan noise is an important consideration in may applications. For a given pressure, the noise level is proportional to the tip speed of the impeller and to the air velocity leaving the wheel. Furthermore, fan noise is roughly proportional to the pressure developed regardless of the blade type. For a given system, the efficiency does not change with speed; however, capacity, total pressure, and power all depend on the speed. There are several simple relationships between fan capacity, pressure, speed, and power, which are referred to as the fan laws. The first three fan laws are the most useful and are stated as follows:
Cylinder with piston and manometer. As the piston moves, the static pressure will become either positive or negative.
3
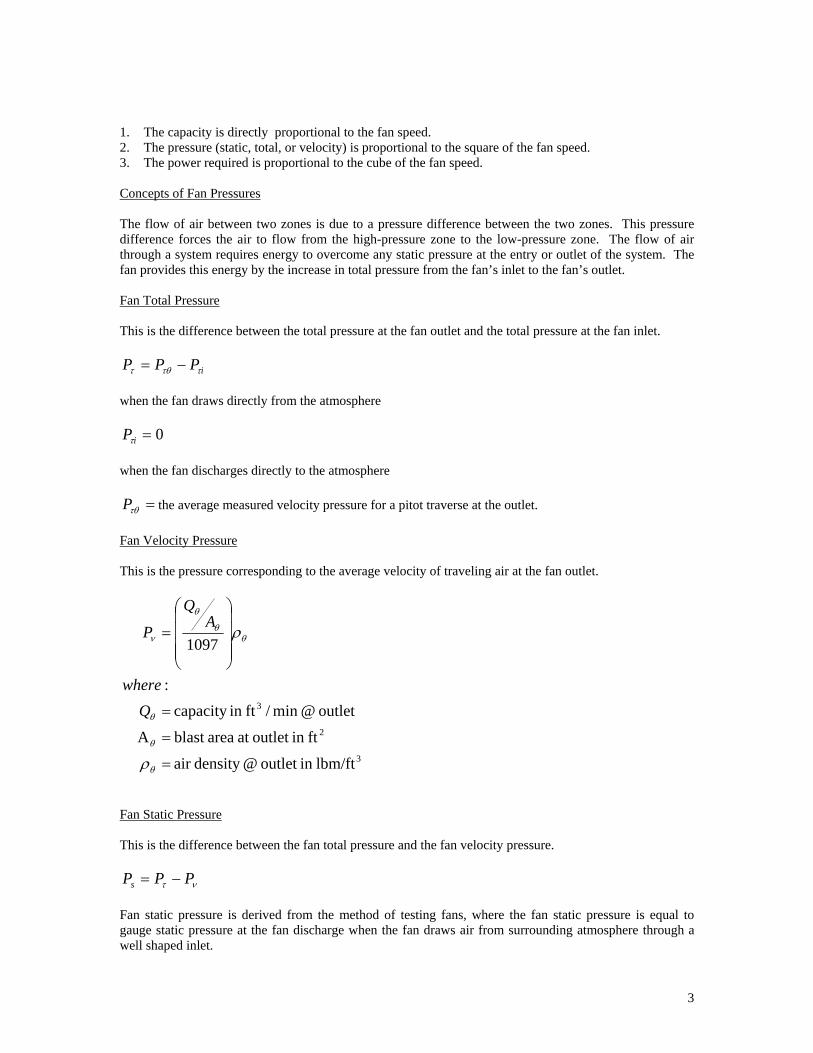
1. The capacity is directly proportional to the fan speed. 2. The pressure (static, total, or velocity) is proportional to the square of the fan speed. 3. The power required is proportional to the cube of the fan speed. Concepts of Fan Pressures The flow of air between two zones is due to a pressure difference between the two zones. This pressure difference forces the air to flow from the high-pressure zone to the low-pressure zone. The flow of air through a system requires energy to overcome any static pressure at the entry or outlet of the system. The fan provides this energy by the increase in total pressure from the fan’s inlet to the fan’s outlet. Fan Total Pressure This is the difference between the total pressure at the fan outlet and the total pressure at the fan inlet.
iPPP ττθτ −= when the fan draws directly from the atmosphere
0=iPτ when the fan discharges directly to the atmosphere
=τθP the average measured velocity pressure for a pitot traverse at the outlet. Fan Velocity Pressure This is the pressure corresponding to the average velocity of traveling air at the fan outlet.
3
2
3
lbm/ftin outlet @density air
ftin outlet at areablast A
outlet @ min/ftin capacity :
1097
=
=
=
⎟⎟⎟⎟
⎠
⎞
⎜⎜⎜⎜
⎝
⎛
=
θ
θ
θ
θθ
θ
ν
ρ
ρ
Qwhere
AQ
P
Fan Static Pressure This is the difference between the fan total pressure and the fan velocity pressure.
ντ PPPs −= Fan static pressure is derived from the method of testing fans, where the fan static pressure is equal to gauge static pressure at the fan discharge when the fan draws air from surrounding atmosphere through a well shaped inlet.
4
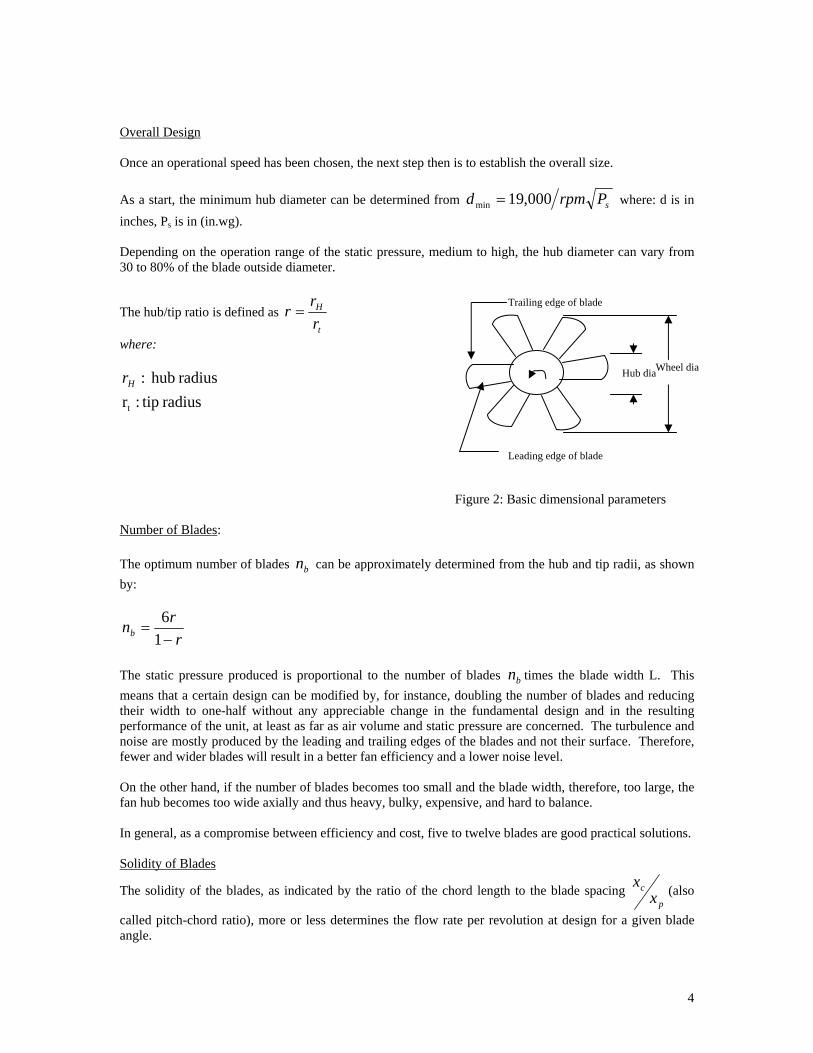
Overall Design Once an operational speed has been chosen, the next step then is to establish the overall size. As a start, the minimum hub diameter can be determined from sPrpmd 000,19min = where: d is in inches, Ps is in (in.wg). Depending on the operation range of the static pressure, medium to high, the hub diameter can vary from 30 to 80% of the blade outside diameter.
The hub/tip ratio is defined as t
H
rrr =
where:
radius tip:rradius hub :
t
Hr
Figure 2: Basic dimensional parameters Number of Blades: The optimum number of blades bn can be approximately determined from the hub and tip radii, as shown by:
rrnb −
=16
The static pressure produced is proportional to the number of blades bn times the blade width L. This means that a certain design can be modified by, for instance, doubling the number of blades and reducing their width to one-half without any appreciable change in the fundamental design and in the resulting performance of the unit, at least as far as air volume and static pressure are concerned. The turbulence and noise are mostly produced by the leading and trailing edges of the blades and not their surface. Therefore, fewer and wider blades will result in a better fan efficiency and a lower noise level. On the other hand, if the number of blades becomes too small and the blade width, therefore, too large, the fan hub becomes too wide axially and thus heavy, bulky, expensive, and hard to balance. In general, as a compromise between efficiency and cost, five to twelve blades are good practical solutions. Solidity of Blades
The solidity of the blades, as indicated by the ratio of the chord length to the blade spacing p
cx
x (also
called pitch-chord ratio), more or less determines the flow rate per revolution at design for a given blade angle.
Wheel diaHub dia
Leading edge of blade
Trailing edge of blade
5
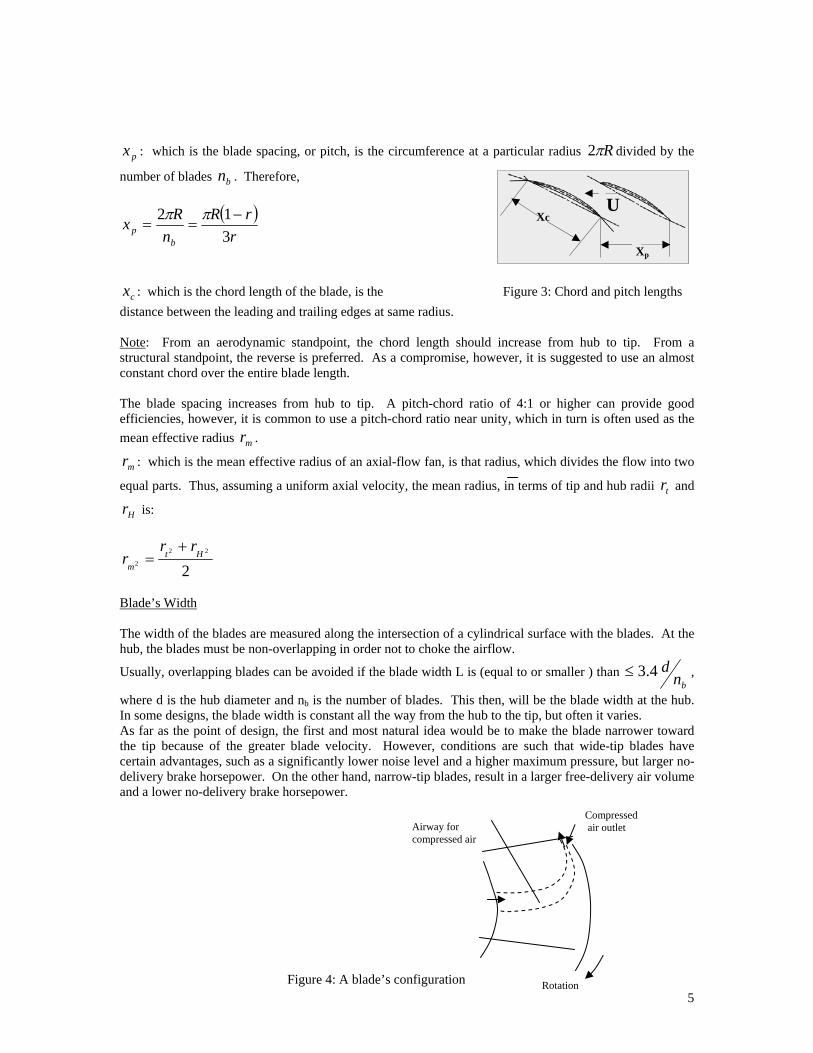
px : which is the blade spacing, or pitch, is the circumference at a particular radius Rπ2 divided by the
number of blades bn . Therefore,
( )r
rRn
Rxb
p 312 −
==ππ
cx : which is the chord length of the blade, is the Figure 3: Chord and pitch lengths distance between the leading and trailing edges at same radius. Note: From an aerodynamic standpoint, the chord length should increase from hub to tip. From a structural standpoint, the reverse is preferred. As a compromise, however, it is suggested to use an almost constant chord over the entire blade length. The blade spacing increases from hub to tip. A pitch-chord ratio of 4:1 or higher can provide good efficiencies, however, it is common to use a pitch-chord ratio near unity, which in turn is often used as the mean effective radius mr .
mr : which is the mean effective radius of an axial-flow fan, is that radius, which divides the flow into two
equal parts. Thus, assuming a uniform axial velocity, the mean radius, in terms of tip and hub radii tr and
Hr is:
222
2Ht
m
rrr
+=
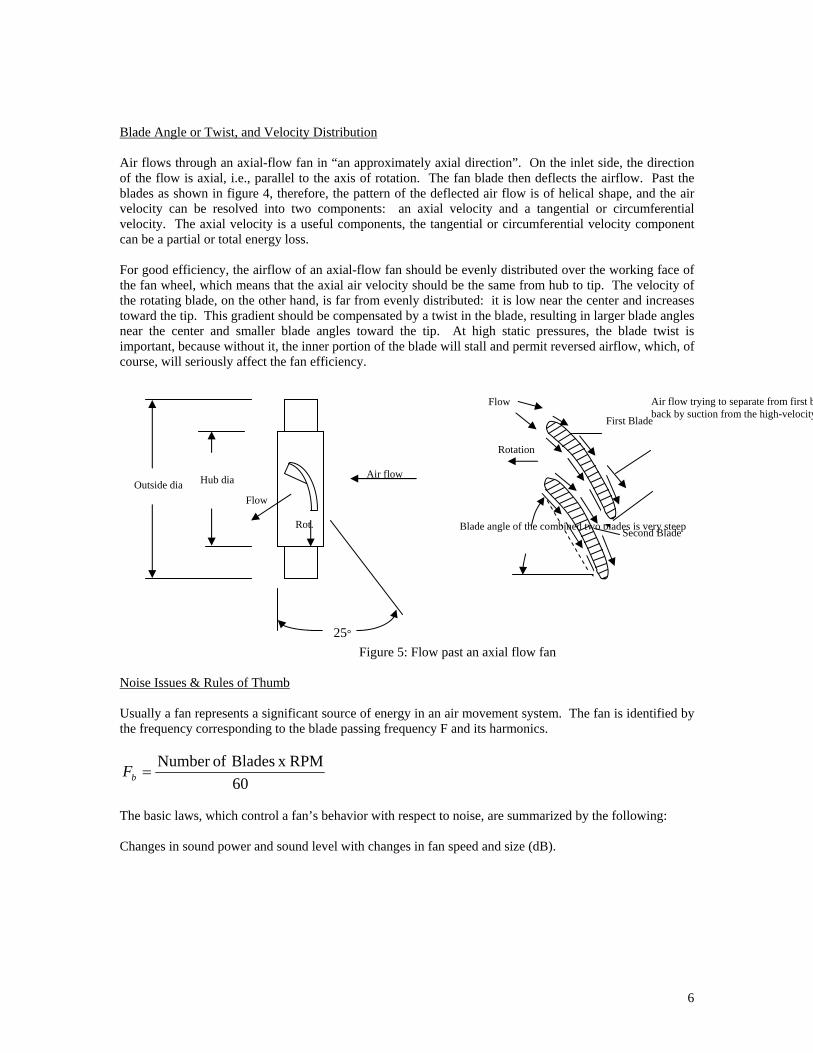
Blade’s Width The width of the blades are measured along the intersection of a cylindrical surface with the blades. At the hub, the blades must be non-overlapping in order not to choke the airflow.
Usually, overlapping blades can be avoided if the blade width L is (equal to or smaller ) than bn
d4.3≤ ,
where d is the hub diameter and nb is the number of blades. This then, will be the blade width at the hub. In some designs, the blade width is constant all the way from the hub to the tip, but often it varies. As far as the point of design, the first and most natural idea would be to make the blade narrower toward the tip because of the greater blade velocity. However, conditions are such that wide-tip blades have certain advantages, such as a significantly lower noise level and a higher maximum pressure, but larger no-delivery brake horsepower. On the other hand, narrow-tip blades, result in a larger free-delivery air volume and a lower no-delivery brake horsepower.
U
Xp
Xc
Airway for compressed air
Compressed air outlet
Rotation Figure 4: A blade’s configuration
6
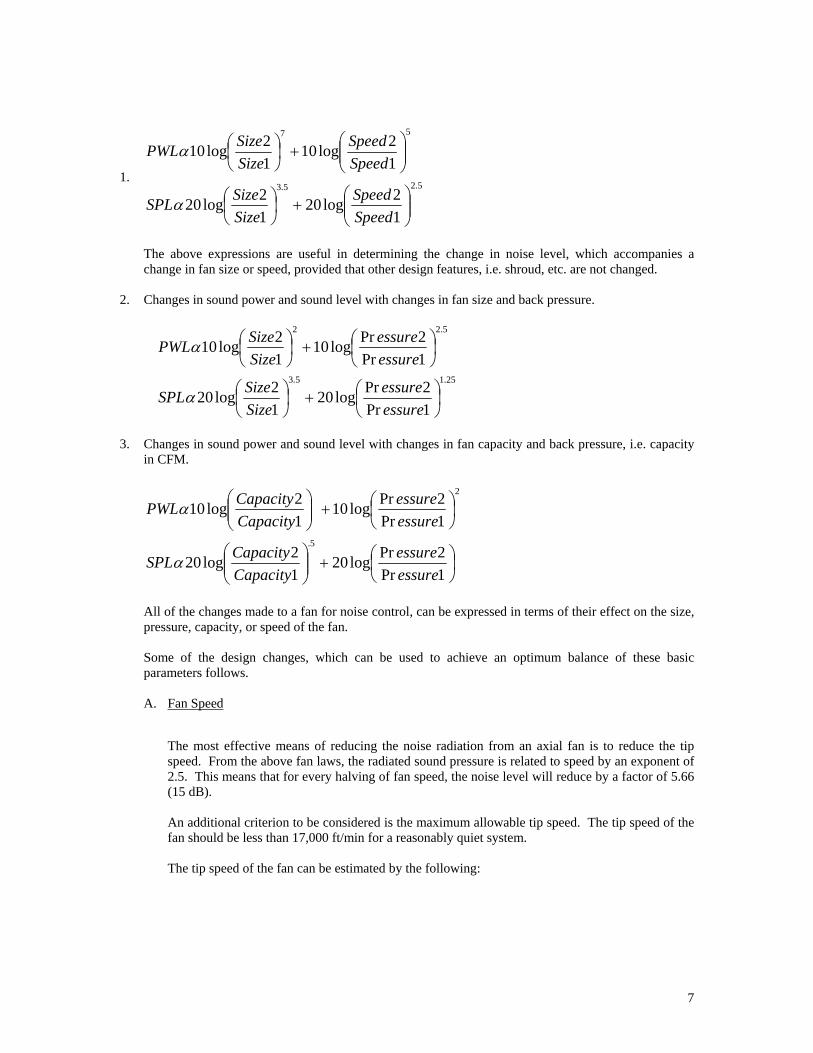
Blade Angle or Twist, and Velocity Distribution Air flows through an axial-flow fan in “an approximately axial direction”. On the inlet side, the direction of the flow is axial, i.e., parallel to the axis of rotation. The fan blade then deflects the airflow. Past the blades as shown in figure 4, therefore, the pattern of the deflected air flow is of helical shape, and the air velocity can be resolved into two components: an axial velocity and a tangential or circumferential velocity. The axial velocity is a useful components, the tangential or circumferential velocity component can be a partial or total energy loss. For good efficiency, the airflow of an axial-flow fan should be evenly distributed over the working face of the fan wheel, which means that the axial air velocity should be the same from hub to tip. The velocity of the rotating blade, on the other hand, is far from evenly distributed: it is low near the center and increases toward the tip. This gradient should be compensated by a twist in the blade, resulting in larger blade angles near the center and smaller blade angles toward the tip. At high static pressures, the blade twist is important, because without it, the inner portion of the blade will stall and permit reversed airflow, which, of course, will seriously affect the fan efficiency. Figure 5: Flow past an axial flow fan Noise Issues & Rules of Thumb Usually a fan represents a significant source of energy in an air movement system. The fan is identified by the frequency corresponding to the blade passing frequency F and its harmonics.
60RPM x Blades ofNumber
=bF
The basic laws, which control a fan’s behavior with respect to noise, are summarized by the following: Changes in sound power and sound level with changes in fan speed and size (dB).
Air flow
25°
Rot. Outside dia Hub dia
Flow
Flow
Rotation
First Blade
Blade angle of the combined two blades is very steepSecond Blade
Air flow trying to separate from first bback by suction from the high-velocity
7
1. 5.25.3
57
12log20
12log20
12log10
12log10
⎟⎟⎠
⎞⎜⎜⎝
⎛+⎟
⎠⎞
⎜⎝⎛
⎟⎟⎠
⎞⎜⎜⎝
⎛+⎟
⎠⎞
⎜⎝⎛
SpeedSpeed
SizeSizeSPL
SpeedSpeed
SizeSizePWL
α
α
The above expressions are useful in determining the change in noise level, which accompanies a change in fan size or speed, provided that other design features, i.e. shroud, etc. are not changed.
2. Changes in sound power and sound level with changes in fan size and back pressure.
25.15.3
5.22
1Pr2Prlog20
12log20
1Pr2Prlog10
12log10
⎟⎠⎞
⎜⎝⎛+⎟
⎠⎞
⎜⎝⎛
⎟⎠⎞
⎜⎝⎛+⎟
⎠⎞
⎜⎝⎛
essureessure
SizeSizeSPL
essureessure
SizeSizePWL
α
α
3. Changes in sound power and sound level with changes in fan capacity and back pressure, i.e. capacity
in CFM.
⎟⎠⎞
⎜⎝⎛+⎟⎟
⎠
⎞⎜⎜⎝
⎛
⎟⎠⎞
⎜⎝⎛+⎟⎟
⎠
⎞⎜⎜⎝
⎛
1Pr2Prlog20
12log20
1Pr2Prlog10
12log10
5.
2
essureessure
CapacityCapacitySPL
essureessure
CapacityCapacityPWL
α
α
All of the changes made to a fan for noise control, can be expressed in terms of their effect on the size, pressure, capacity, or speed of the fan. Some of the design changes, which can be used to achieve an optimum balance of these basic parameters follows. A. Fan Speed
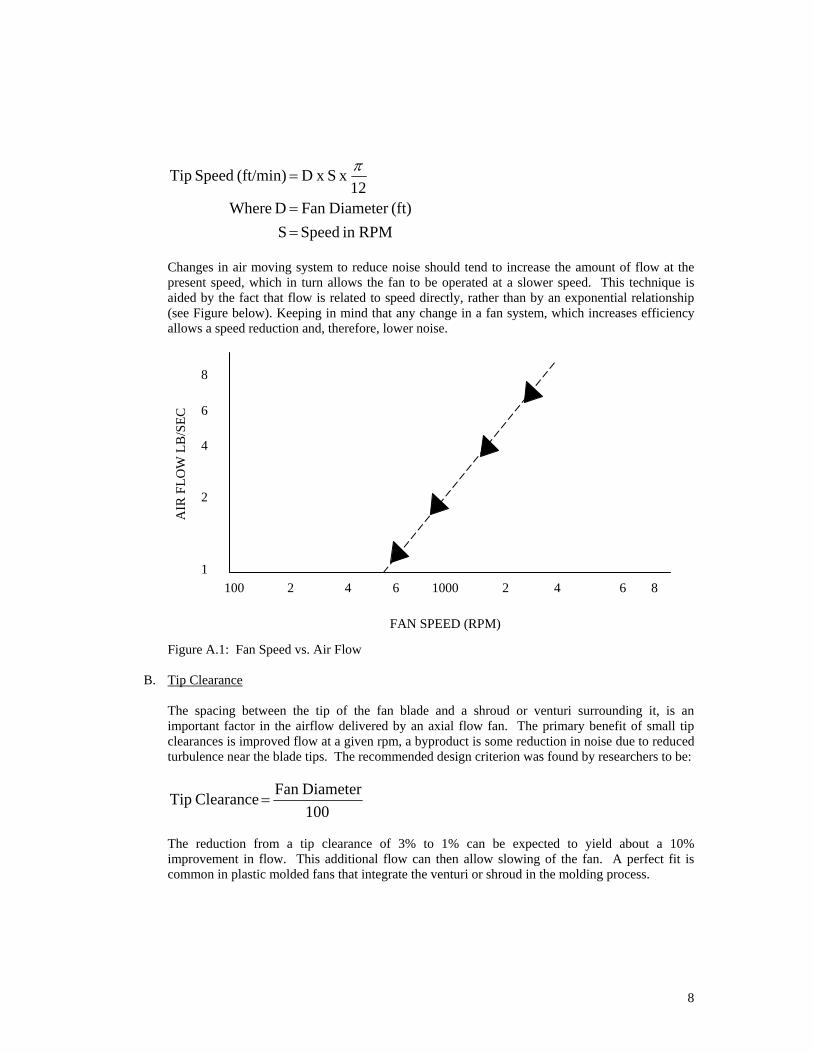
The most effective means of reducing the noise radiation from an axial fan is to reduce the tip speed. From the above fan laws, the radiated sound pressure is related to speed by an exponent of 2.5. This means that for every halving of fan speed, the noise level will reduce by a factor of 5.66 (15 dB). An additional criterion to be considered is the maximum allowable tip speed. The tip speed of the fan should be less than 17,000 ft/min for a reasonably quiet system. The tip speed of the fan can be estimated by the following:
8
RPMin Speed S(ft)Diameter Fan D Where
12 x S x D (ft/min) Speed Tip
==
=π
Changes in air moving system to reduce noise should tend to increase the amount of flow at the present speed, which in turn allows the fan to be operated at a slower speed. This technique is aided by the fact that flow is related to speed directly, rather than by an exponential relationship (see Figure below). Keeping in mind that any change in a fan system, which increases efficiency allows a speed reduction and, therefore, lower noise.
Figure A.1: Fan Speed vs. Air Flow
B. Tip Clearance
The spacing between the tip of the fan blade and a shroud or venturi surrounding it, is an important factor in the airflow delivered by an axial flow fan. The primary benefit of small tip clearances is improved flow at a given rpm, a byproduct is some reduction in noise due to reduced turbulence near the blade tips. The recommended design criterion was found by researchers to be:
100DiameterFan Clearance Tip =
The reduction from a tip clearance of 3% to 1% can be expected to yield about a 10% improvement in flow. This additional flow can then allow slowing of the fan. A perfect fit is common in plastic molded fans that integrate the venturi or shroud in the molding process.
8
6
4
2
1
AIR
FLO
W L
B/S
EC
FAN SPEED (RPM)
100 2 4 6 1000 2 4 6 8
9
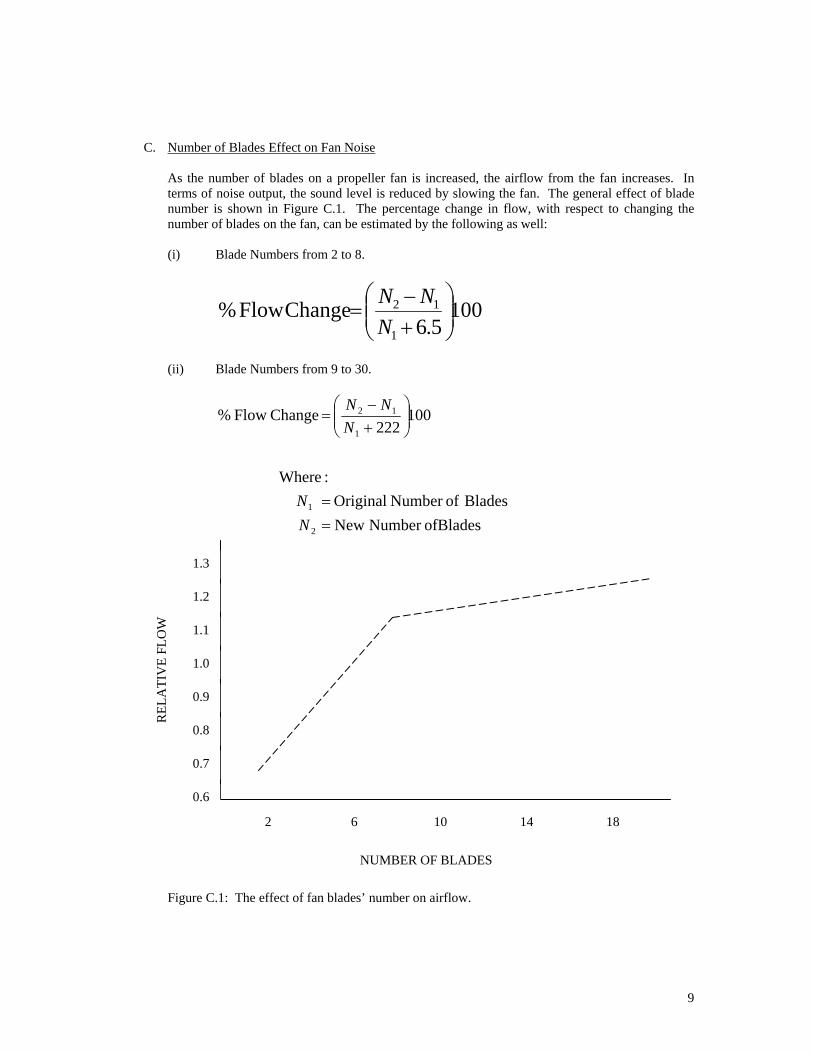
C. Number of Blades Effect on Fan Noise
As the number of blades on a propeller fan is increased, the airflow from the fan increases. In terms of noise output, the sound level is reduced by slowing the fan. The general effect of blade number is shown in Figure C.1. The percentage change in flow, with respect to changing the number of blades on the fan, can be estimated by the following as well: (i) Blade Numbers from 2 to 8.
1005.6
Change Flow %1
12⎟⎟⎠
⎞⎜⎜⎝
⎛+−
=N
NN
(ii) Blade Numbers from 9 to 30.
ofBladesNumber New Blades ofNumber Original
:Where
100222
Change Flow %
2
1
1
12
==
⎟⎟⎠
⎞⎜⎜⎝
⎛+−
=
N N
NNN
Figure C.1: The effect of fan blades’ number on airflow.
REL
ATI
VE
FLO
W
NUMBER OF BLADES
1.3
1.2
1.1
1.0
0.9
0.8
0.7
0.6
2 6 10 14 18
10
The airflow is approximately proportional to the fan speed. Thus, if an additional flow of 10% were achieved by adding to the number of blades, the speed can then be reduced by 10% and keep the same flow as in the original system.
D. Distance to Obstructions
Whenever an obstruction is placed near a fan, the noise level rises. If the blades are evenly spaced, a large portion of the noise energy will be at the blade passing rate and a clear whine will be generated. With unevenly spaced blades, the noise energy is dispersed among many frequencies and sound quality is more plausible even-though the total acoustic power may not be diminished. The spacing to obstructions on the pressure side of the fan (air exiting the fan) is not as critical as the spacing on the low pressure (entrance) side. As a rough guide, the minimum spacing can be reduced by about one-third without causing severe noise problems. 1. Minimum Distance to Obstructions on Exit Side of 10% of Fan Diameter. 2. Minimum Distance to Obstructions on Entrance Side of Fan = 15% of Fan Diameter
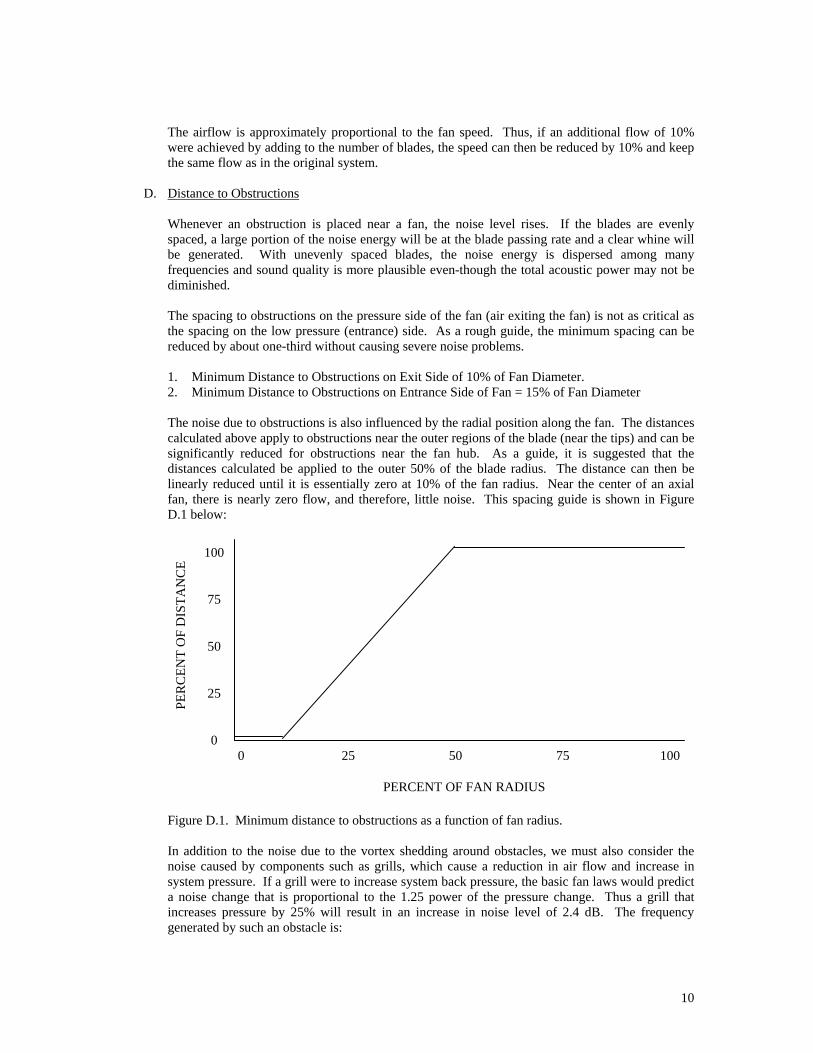
The noise due to obstructions is also influenced by the radial position along the fan. The distances calculated above apply to obstructions near the outer regions of the blade (near the tips) and can be significantly reduced for obstructions near the fan hub. As a guide, it is suggested that the distances calculated be applied to the outer 50% of the blade radius. The distance can then be linearly reduced until it is essentially zero at 10% of the fan radius. Near the center of an axial fan, there is nearly zero flow, and therefore, little noise. This spacing guide is shown in Figure D.1 below:
Figure D.1. Minimum distance to obstructions as a function of fan radius. In addition to the noise due to the vortex shedding around obstacles, we must also consider the noise caused by components such as grills, which cause a reduction in air flow and increase in system pressure. If a grill were to increase system back pressure, the basic fan laws would predict a noise change that is proportional to the 1.25 power of the pressure change. Thus a grill that increases pressure by 25% will result in an increase in noise level of 2.4 dB. The frequency generated by such an obstacle is:
PER
CEN
T O
F D
ISTA
NC
E
100
75
50
25
0 100 75 50 25 0
PERCENT OF FAN RADIUS
11
feetin grill) ain bar (one sizen Obstructiodft/sec.in Velocity Flow v
:Where
2.
==
=dvF
For Example:
Peak Noise ePredominat Hz 600.1
.2(300) F
ft) (.1 inches 1.2 n Obstructioft/second 300 Velocity Flow
==
==
Simple grill cylindrical bars can generate whistles, therefore, more complex shapes are recommended. Complex shapes can generate an equal amount of noise power, but it will be distributed throughout the frequency spectrum.
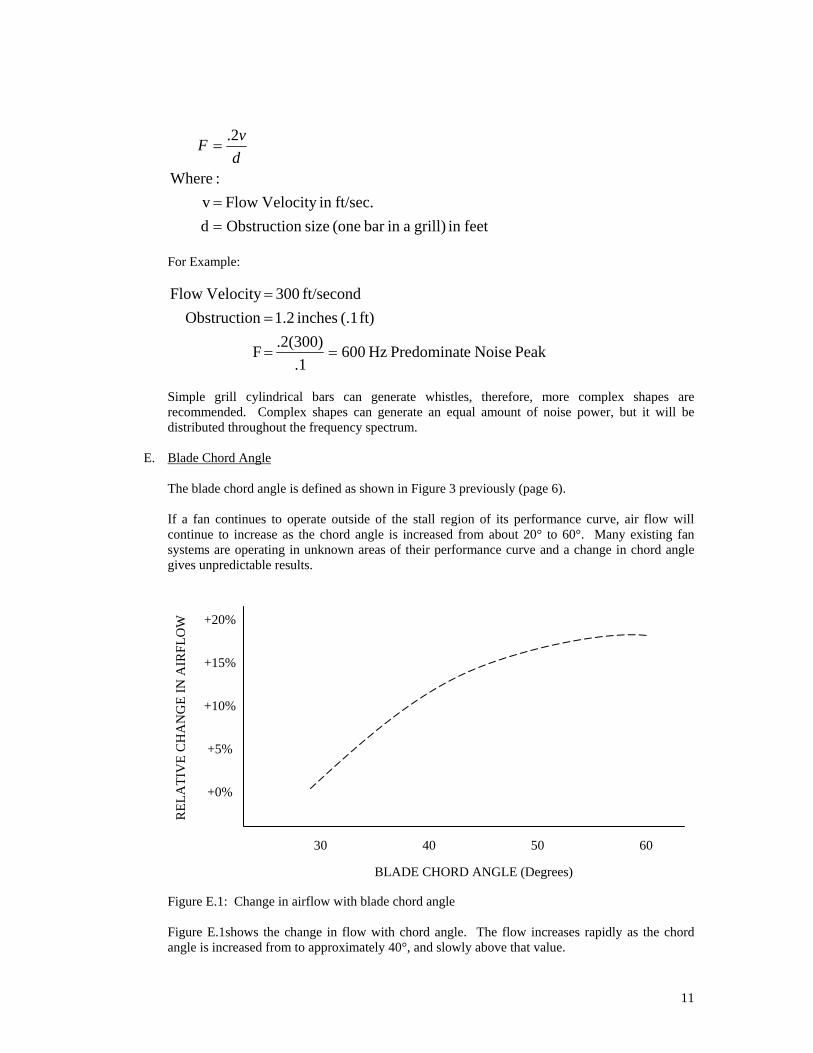
E. Blade Chord Angle The blade chord angle is defined as shown in Figure 3 previously (page 6). If a fan continues to operate outside of the stall region of its performance curve, air flow will continue to increase as the chord angle is increased from about 20° to 60°. Many existing fan systems are operating in unknown areas of their performance curve and a change in chord angle gives unpredictable results.
Figure E.1: Change in airflow with blade chord angle Figure E.1shows the change in flow with chord angle. The flow increases rapidly as the chord angle is increased from to approximately 40°, and slowly above that value.
+20%
+15%
+10%
+5%
+0%
REL
ATI
VE
CH
AN
GE
IN A
IRFL
OW
BLADE CHORD ANGLE (Degrees)
30 40 50 60
12
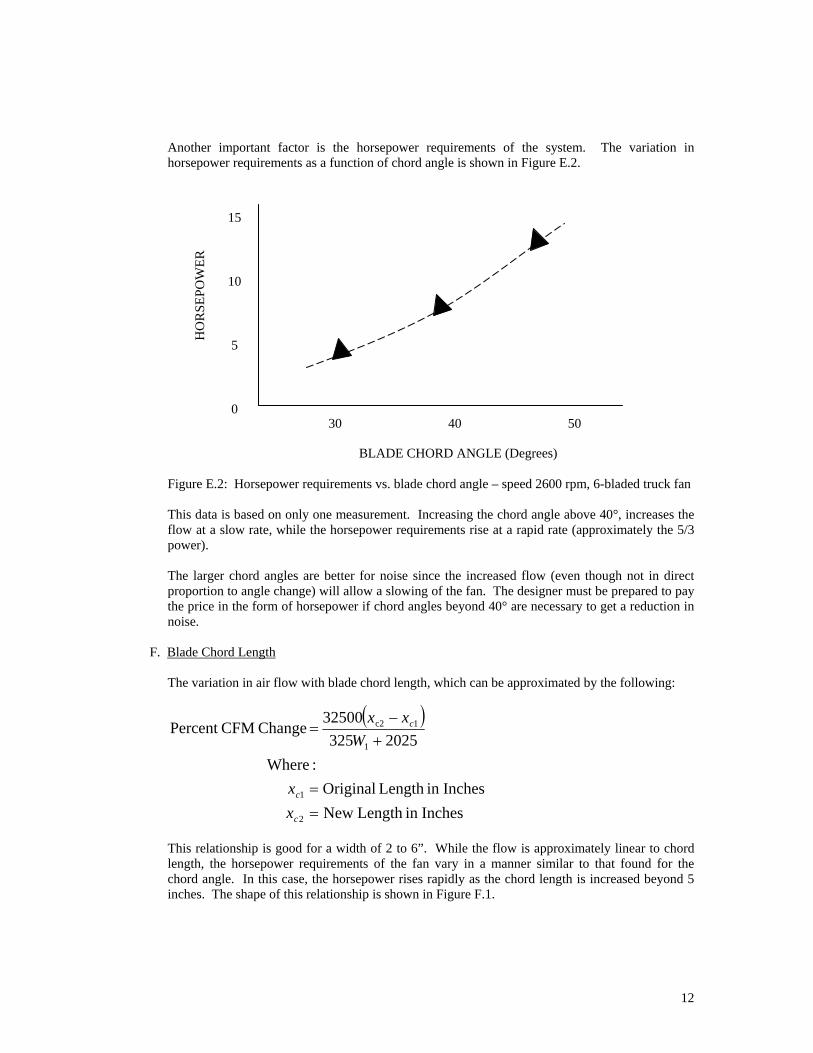
Another important factor is the horsepower requirements of the system. The variation in horsepower requirements as a function of chord angle is shown in Figure E.2.
Figure E.2: Horsepower requirements vs. blade chord angle – speed 2600 rpm, 6-bladed truck fan This data is based on only one measurement. Increasing the chord angle above 40°, increases the flow at a slow rate, while the horsepower requirements rise at a rapid rate (approximately the 5/3 power). The larger chord angles are better for noise since the increased flow (even though not in direct proportion to angle change) will allow a slowing of the fan. The designer must be prepared to pay the price in the form of horsepower if chord angles beyond 40° are necessary to get a reduction in noise.
F. Blade Chord Length The variation in air flow with blade chord length, which can be approximated by the following:
( )
Inchesin Length NewInchesin Length Original
:Where2025325
32500 Change CFMPercent
2
1
1
1c2
==
+−
=
c
c
c
xx
Wxx
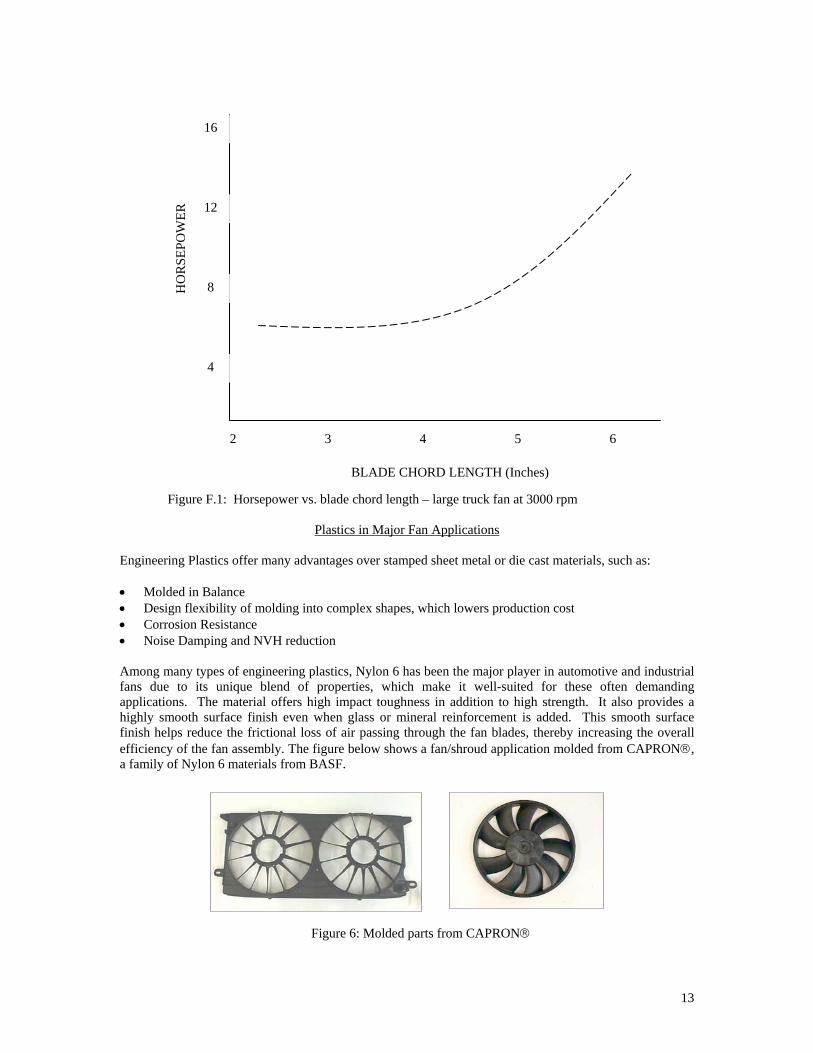
This relationship is good for a width of 2 to 6”. While the flow is approximately linear to chord length, the horsepower requirements of the fan vary in a manner similar to that found for the chord angle. In this case, the horsepower rises rapidly as the chord length is increased beyond 5 inches. The shape of this relationship is shown in Figure F.1.
HO
RSE
POW
ER
BLADE CHORD ANGLE (Degrees)
15
10
5
0 30 40 50
13
Figure F.1: Horsepower vs. blade chord length – large truck fan at 3000 rpm
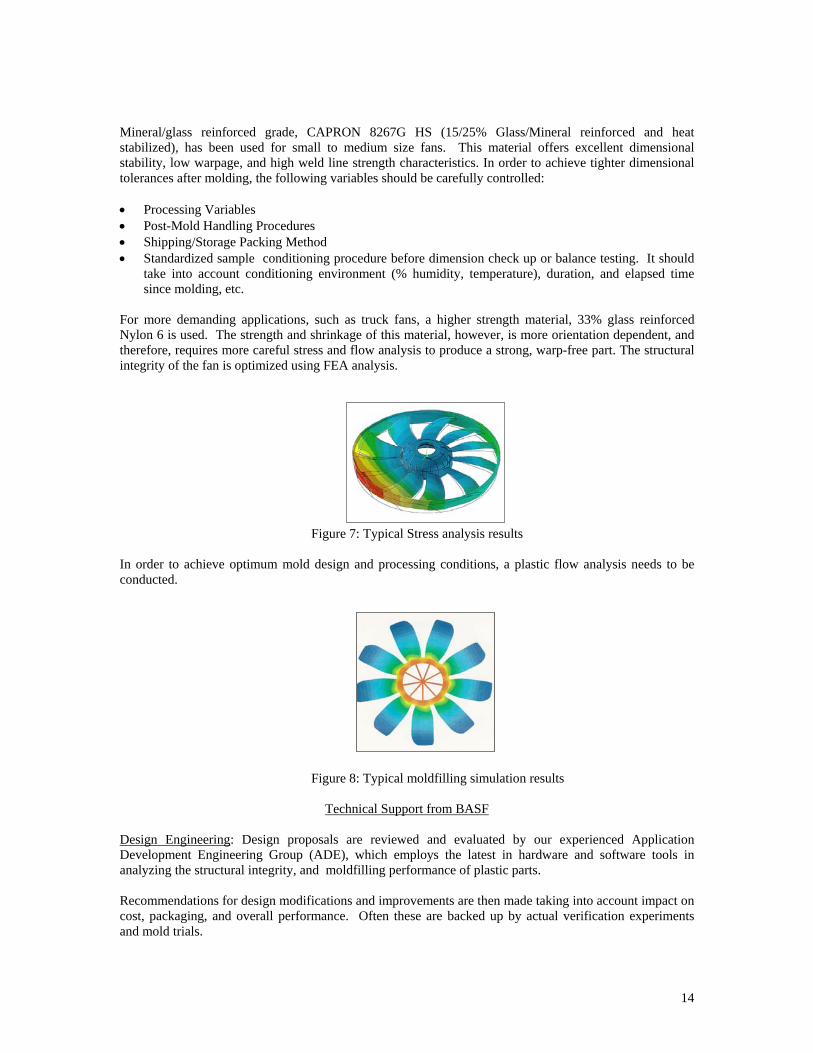
Plastics in Major Fan Applications Engineering Plastics offer many advantages over stamped sheet metal or die cast materials, such as: • Molded in Balance • Design flexibility of molding into complex shapes, which lowers production cost • Corrosion Resistance • Noise Damping and NVH reduction Among many types of engineering plastics, Nylon 6 has been the major player in automotive and industrial fans due to its unique blend of properties, which make it well-suited for these often demanding applications. The material offers high impact toughness in addition to high strength. It also provides a highly smooth surface finish even when glass or mineral reinforcement is added. This smooth surface finish helps reduce the frictional loss of air passing through the fan blades, thereby increasing the overall efficiency of the fan assembly. The figure below shows a fan/shroud application molded from CAPRON®, a family of Nylon 6 materials from BASF. Figure 6: Molded parts from CAPRON®
HO
RSE
POW
ER
BLADE CHORD LENGTH (Inches)
16
12
8
4
2 3 4 5 6
14
Mineral/glass reinforced grade, CAPRON 8267G HS (15/25% Glass/Mineral reinforced and heat stabilized), has been used for small to medium size fans. This material offers excellent dimensional stability, low warpage, and high weld line strength characteristics. In order to achieve tighter dimensional tolerances after molding, the following variables should be carefully controlled: • Processing Variables • Post-Mold Handling Procedures • Shipping/Storage Packing Method • Standardized sample conditioning procedure before dimension check up or balance testing. It should
take into account conditioning environment (% humidity, temperature), duration, and elapsed time since molding, etc.
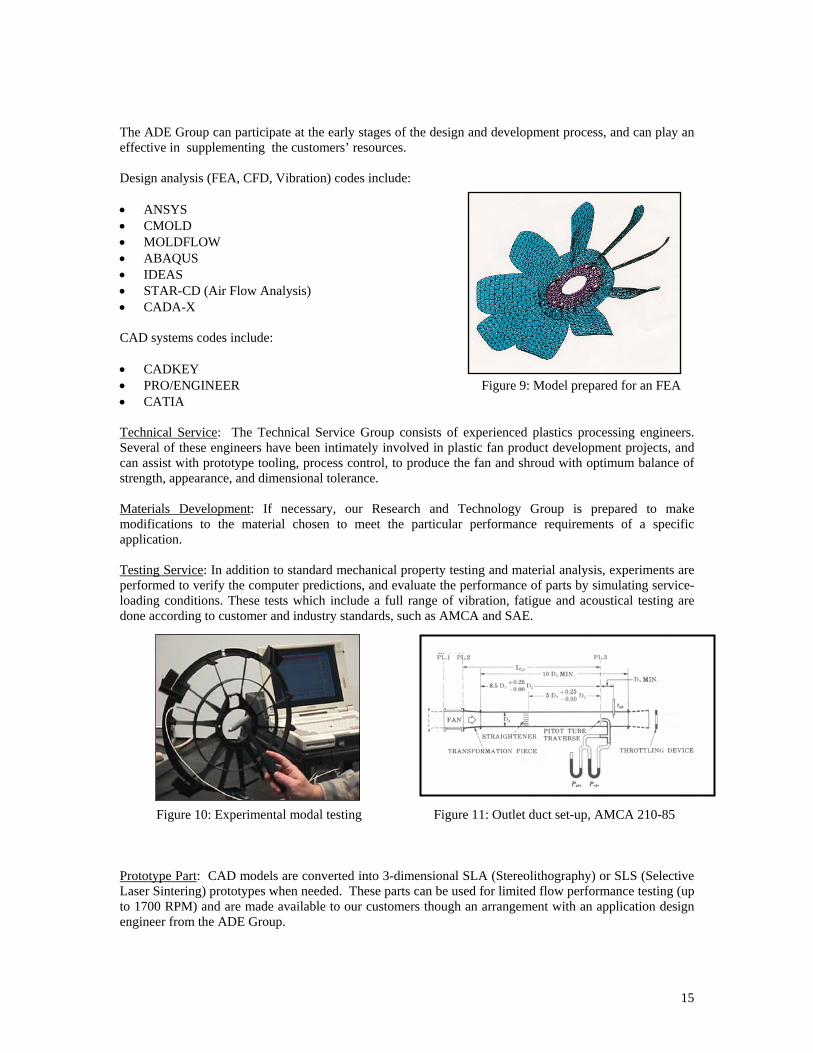
For more demanding applications, such as truck fans, a higher strength material, 33% glass reinforced Nylon 6 is used. The strength and shrinkage of this material, however, is more orientation dependent, and therefore, requires more careful stress and flow analysis to produce a strong, warp-free part. The structural integrity of the fan is optimized using FEA analysis.
Figure 7: Typical Stress analysis results In order to achieve optimum mold design and processing conditions, a plastic flow analysis needs to be conducted. Figure 8: Typical moldfilling simulation results
Technical Support from BASF Design Engineering: Design proposals are reviewed and evaluated by our experienced Application Development Engineering Group (ADE), which employs the latest in hardware and software tools in analyzing the structural integrity, and moldfilling performance of plastic parts. Recommendations for design modifications and improvements are then made taking into account impact on cost, packaging, and overall performance. Often these are backed up by actual verification experiments and mold trials.
15
The ADE Group can participate at the early stages of the design and development process, and can play an effective in supplementing the customers’ resources. Design analysis (FEA, CFD, Vibration) codes include: • ANSYS • CMOLD • MOLDFLOW • ABAQUS • IDEAS • STAR-CD (Air Flow Analysis) • CADA-X CAD systems codes include: • CADKEY • PRO/ENGINEER Figure 9: Model prepared for an FEA • CATIA Technical Service: The Technical Service Group consists of experienced plastics processing engineers. Several of these engineers have been intimately involved in plastic fan product development projects, and can assist with prototype tooling, process control, to produce the fan and shroud with optimum balance of strength, appearance, and dimensional tolerance. Materials Development: If necessary, our Research and Technology Group is prepared to make modifications to the material chosen to meet the particular performance requirements of a specific application. Testing Service: In addition to standard mechanical property testing and material analysis, experiments are performed to verify the computer predictions, and evaluate the performance of parts by simulating service-loading conditions. These tests which include a full range of vibration, fatigue and acoustical testing are done according to customer and industry standards, such as AMCA and SAE. Figure 10: Experimental modal testing Figure 11: Outlet duct set-up, AMCA 210-85 Prototype Part: CAD models are converted into 3-dimensional SLA (Stereolithography) or SLS (Selective Laser Sintering) prototypes when needed. These parts can be used for limited flow performance testing (up to 1700 RPM) and are made available to our customers though an arrangement with an application design engineer from the ADE Group.
16
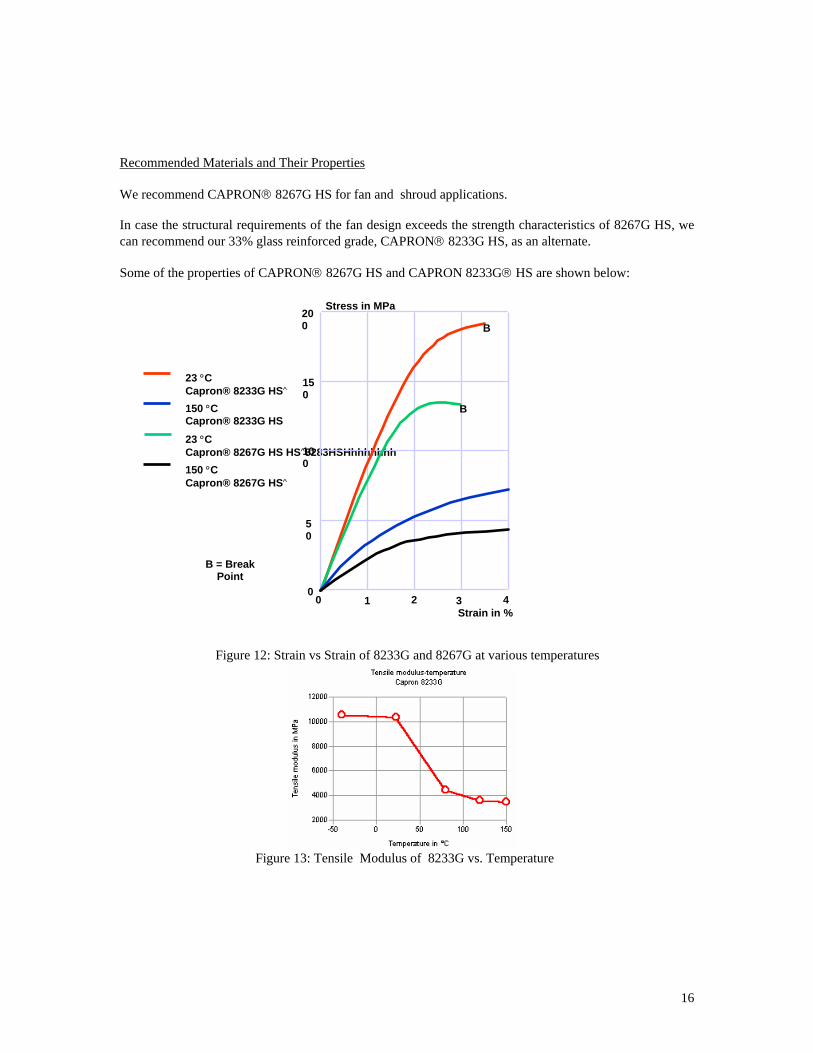
Recommended Materials and Their Properties We recommend CAPRON® 8267G HS for fan and shroud applications. In case the structural requirements of the fan design exceeds the strength characteristics of 8267G HS, we can recommend our 33% glass reinforced grade, CAPRON® 8233G HS, as an alternate. Some of the properties of CAPRON® 8267G HS and CAPRON 8233G® HS are shown below: Figure 12: Strain vs Strain of 8233G and 8267G at various temperatures
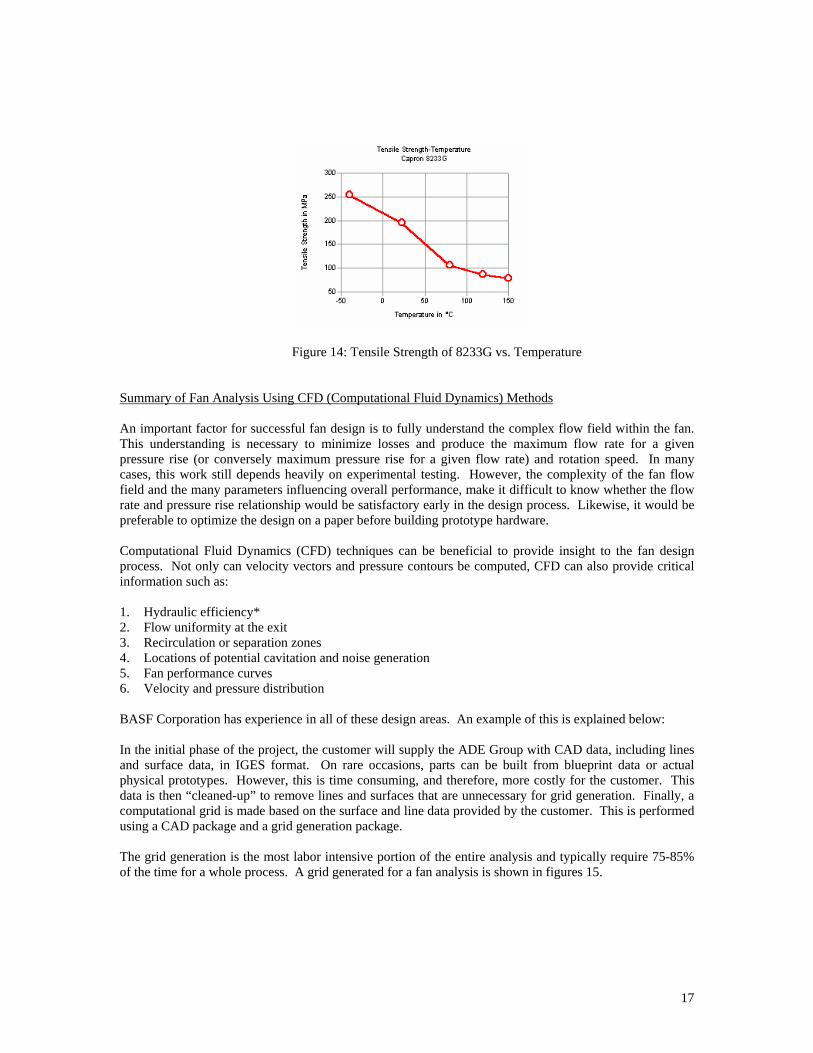
Figure 13: Tensile Modulus of 8233G vs. Temperature
23 °C Capron® 8233G HS∧
150 °C Capron® 8233G HS
23 °C Capron® 8267G HS HS∧8283HSHhhhhhhh
150 °C Capron® 8267G HS∧
Stress in MPa200
150
100
50
0 0 1 2 3 4
Strain in %
B
B
B = Break Point
17
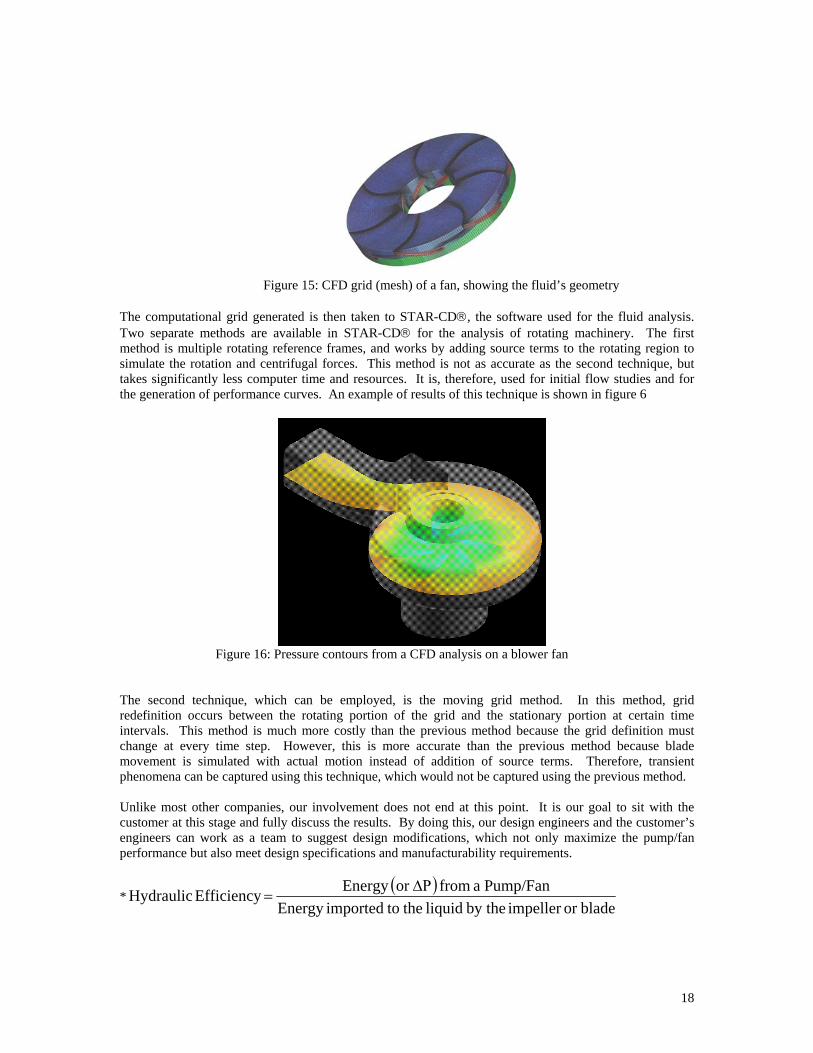
Figure 14: Tensile Strength of 8233G vs. Temperature
Summary of Fan Analysis Using CFD (Computational Fluid Dynamics) Methods An important factor for successful fan design is to fully understand the complex flow field within the fan. This understanding is necessary to minimize losses and produce the maximum flow rate for a given pressure rise (or conversely maximum pressure rise for a given flow rate) and rotation speed. In many cases, this work still depends heavily on experimental testing. However, the complexity of the fan flow field and the many parameters influencing overall performance, make it difficult to know whether the flow rate and pressure rise relationship would be satisfactory early in the design process. Likewise, it would be preferable to optimize the design on a paper before building prototype hardware. Computational Fluid Dynamics (CFD) techniques can be beneficial to provide insight to the fan design process. Not only can velocity vectors and pressure contours be computed, CFD can also provide critical information such as: 1. Hydraulic efficiency* 2. Flow uniformity at the exit 3. Recirculation or separation zones 4. Locations of potential cavitation and noise generation 5. Fan performance curves 6. Velocity and pressure distribution BASF Corporation has experience in all of these design areas. An example of this is explained below: In the initial phase of the project, the customer will supply the ADE Group with CAD data, including lines and surface data, in IGES format. On rare occasions, parts can be built from blueprint data or actual physical prototypes. However, this is time consuming, and therefore, more costly for the customer. This data is then “cleaned-up” to remove lines and surfaces that are unnecessary for grid generation. Finally, a computational grid is made based on the surface and line data provided by the customer. This is performed using a CAD package and a grid generation package. The grid generation is the most labor intensive portion of the entire analysis and typically require 75-85% of the time for a whole process. A grid generated for a fan analysis is shown in figures 15.
18
Figure 15: CFD grid (mesh) of a fan, showing the fluid’s geometry The computational grid generated is then taken to STAR-CD®, the software used for the fluid analysis. Two separate methods are available in STAR-CD® for the analysis of rotating machinery. The first method is multiple rotating reference frames, and works by adding source terms to the rotating region to simulate the rotation and centrifugal forces. This method is not as accurate as the second technique, but takes significantly less computer time and resources. It is, therefore, used for initial flow studies and for the generation of performance curves. An example of results of this technique is shown in figure 6 Figure 16: Pressure contours from a CFD analysis on a blower fan The second technique, which can be employed, is the moving grid method. In this method, grid redefinition occurs between the rotating portion of the grid and the stationary portion at certain time intervals. This method is much more costly than the previous method because the grid definition must change at every time step. However, this is more accurate than the previous method because blade movement is simulated with actual motion instead of addition of source terms. Therefore, transient phenomena can be captured using this technique, which would not be captured using the previous method. Unlike most other companies, our involvement does not end at this point. It is our goal to sit with the customer at this stage and fully discuss the results. By doing this, our design engineers and the customer’s engineers can work as a team to suggest design modifications, which not only maximize the pump/fan performance but also meet design specifications and manufacturability requirements.
*( )
bladeor impeller by the liquid the toimportedEnergy Pump/Fan a from or Energy Efficiency Hydraulic ∆Ρ
=
19
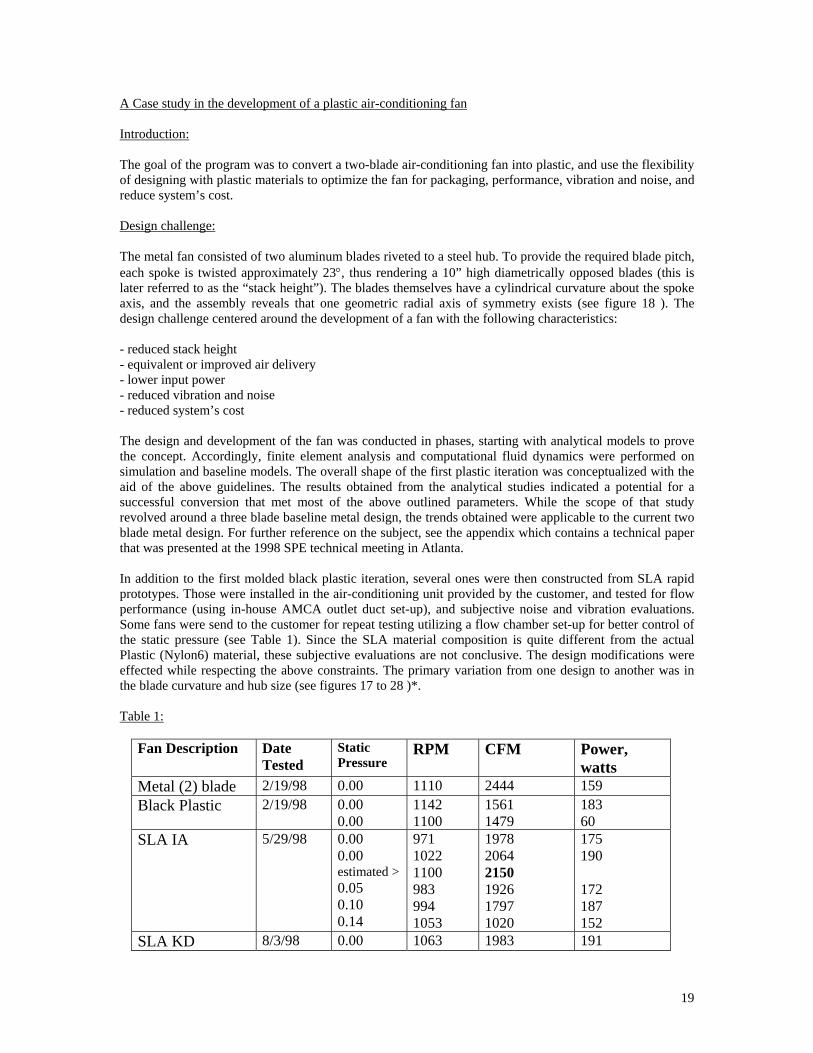
A Case study in the development of a plastic air-conditioning fan Introduction: The goal of the program was to convert a two-blade air-conditioning fan into plastic, and use the flexibility of designing with plastic materials to optimize the fan for packaging, performance, vibration and noise, and reduce system’s cost. Design challenge: The metal fan consisted of two aluminum blades riveted to a steel hub. To provide the required blade pitch, each spoke is twisted approximately 23°, thus rendering a 10” high diametrically opposed blades (this is later referred to as the “stack height”). The blades themselves have a cylindrical curvature about the spoke axis, and the assembly reveals that one geometric radial axis of symmetry exists (see figure 18 ). The design challenge centered around the development of a fan with the following characteristics: - reduced stack height - equivalent or improved air delivery - lower input power - reduced vibration and noise - reduced system’s cost The design and development of the fan was conducted in phases, starting with analytical models to prove the concept. Accordingly, finite element analysis and computational fluid dynamics were performed on simulation and baseline models. The overall shape of the first plastic iteration was conceptualized with the aid of the above guidelines. The results obtained from the analytical studies indicated a potential for a successful conversion that met most of the above outlined parameters. While the scope of that study revolved around a three blade baseline metal design, the trends obtained were applicable to the current two blade metal design. For further reference on the subject, see the appendix which contains a technical paper that was presented at the 1998 SPE technical meeting in Atlanta. In addition to the first molded black plastic iteration, several ones were then constructed from SLA rapid prototypes. Those were installed in the air-conditioning unit provided by the customer, and tested for flow performance (using in-house AMCA outlet duct set-up), and subjective noise and vibration evaluations. Some fans were send to the customer for repeat testing utilizing a flow chamber set-up for better control of the static pressure (see Table 1). Since the SLA material composition is quite different from the actual Plastic (Nylon6) material, these subjective evaluations are not conclusive. The design modifications were effected while respecting the above constraints. The primary variation from one design to another was in the blade curvature and hub size (see figures 17 to 28 )*. Table 1:
Fan Description Date Tested
Static Pressure
RPM CFM Power, watts
Metal (2) blade 2/19/98 0.00 1110 2444 159 Black Plastic 2/19/98 0.00
0.00 1142 1100
1561 1479
183 60
SLA IA
5/29/98 0.00 0.00 estimated > 0.05 0.10 0.14
971 1022 1100 983 994 1053
1978 2064 2150 1926 1797 1020
175 190 172 187 152
SLA KD 8/3/98 0.00 1063 1983 191
20
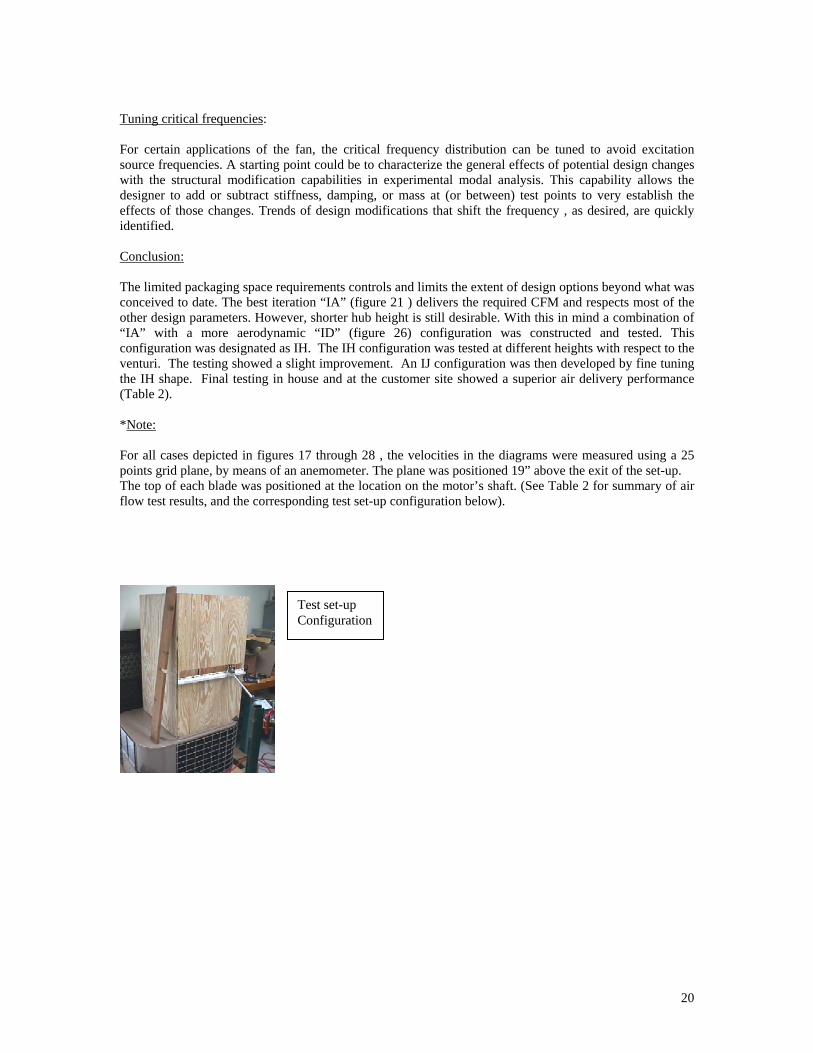
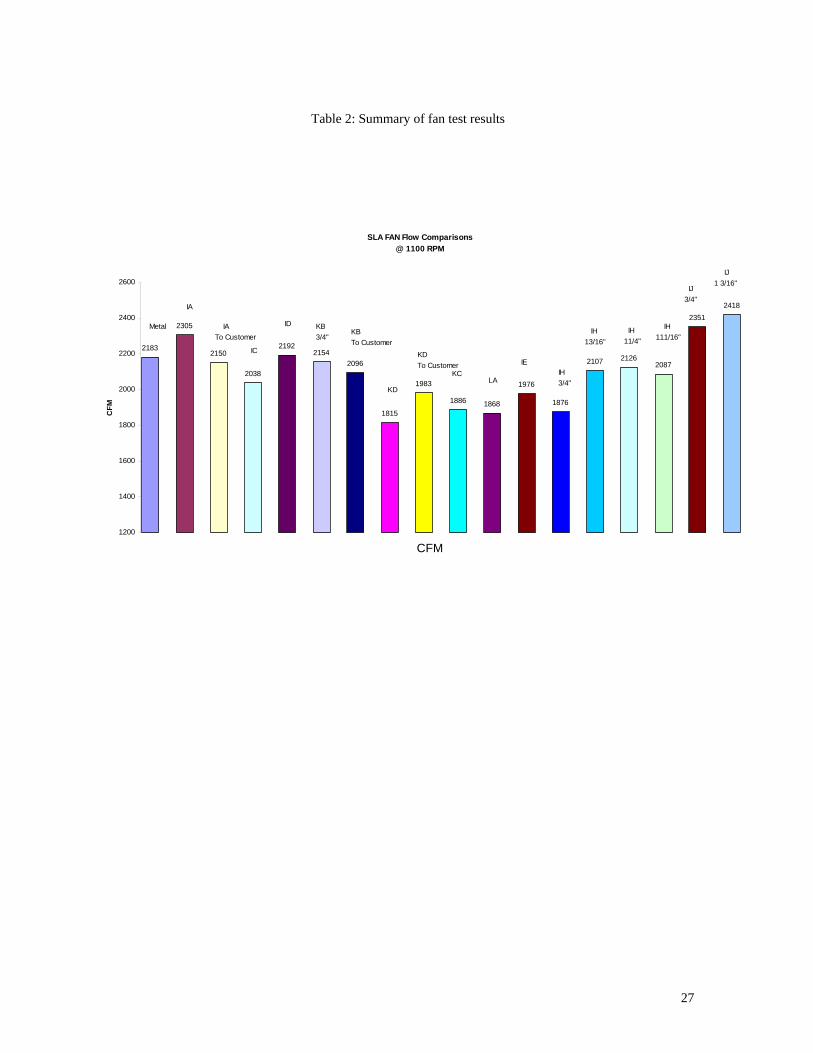
Tuning critical frequencies: For certain applications of the fan, the critical frequency distribution can be tuned to avoid excitation source frequencies. A starting point could be to characterize the general effects of potential design changes with the structural modification capabilities in experimental modal analysis. This capability allows the designer to add or subtract stiffness, damping, or mass at (or between) test points to very establish the effects of those changes. Trends of design modifications that shift the frequency , as desired, are quickly identified. Conclusion: The limited packaging space requirements controls and limits the extent of design options beyond what was conceived to date. The best iteration “IA” (figure 21 ) delivers the required CFM and respects most of the other design parameters. However, shorter hub height is still desirable. With this in mind a combination of “IA” with a more aerodynamic “ID” (figure 26) configuration was constructed and tested. This configuration was designated as IH. The IH configuration was tested at different heights with respect to the venturi. The testing showed a slight improvement. An IJ configuration was then developed by fine tuning the IH shape. Final testing in house and at the customer site showed a superior air delivery performance (Table 2). *Note: For all cases depicted in figures 17 through 28 , the velocities in the diagrams were measured using a 25 points grid plane, by means of an anemometer. The plane was positioned 19” above the exit of the set-up. The top of each blade was positioned at the location on the motor’s shaft. (See Table 2 for summary of air flow test results, and the corresponding test set-up configuration below).
Test set-up Configuration
21
Figure 17
1 2 3 4 5
1.156
R8.688R8.813
2.809 2.625
.600 2.625
.938
.938
.938
.938
65.419°R3.750
R3.500
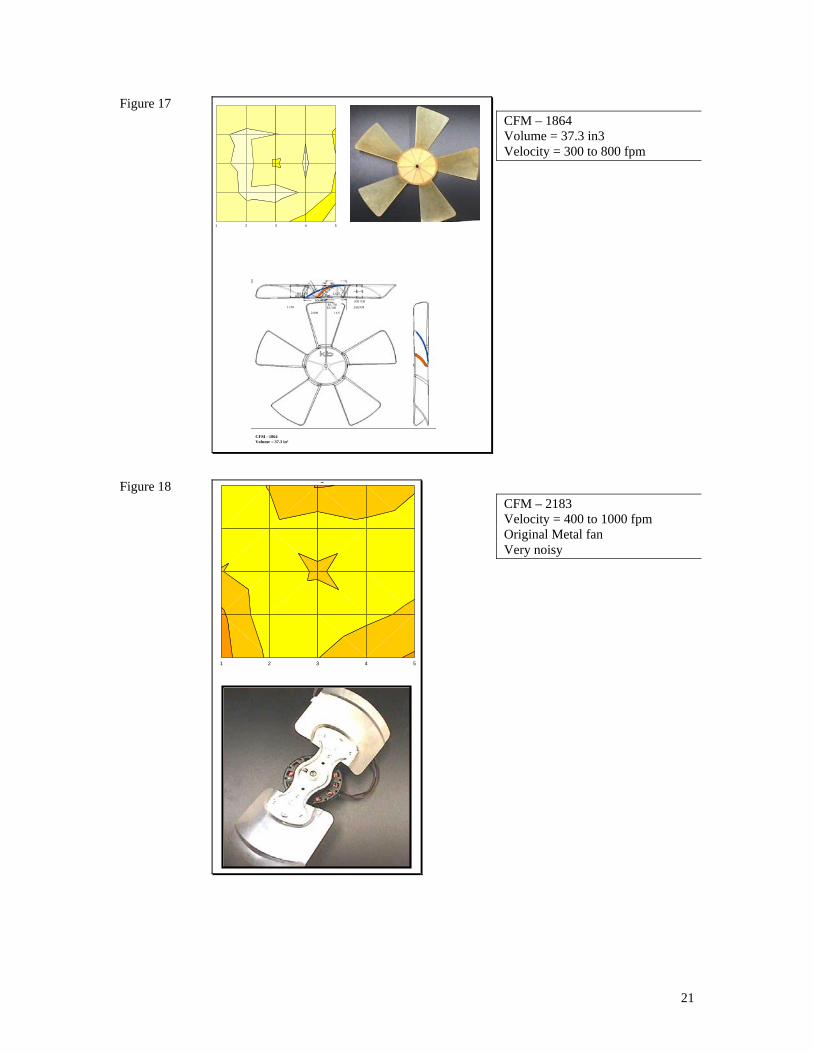
CFM - 1864Volume = 37.3 in3
CFM – 1864 Volume = 37.3 in3 Velocity = 300 to 800 fpm
Figure 18
1 2 3 4 5
g
CFM – 2183 Velocity = 400 to 1000 fpm Original Metal fan Very noisy
22
Figure 19
1 2 3 4 5
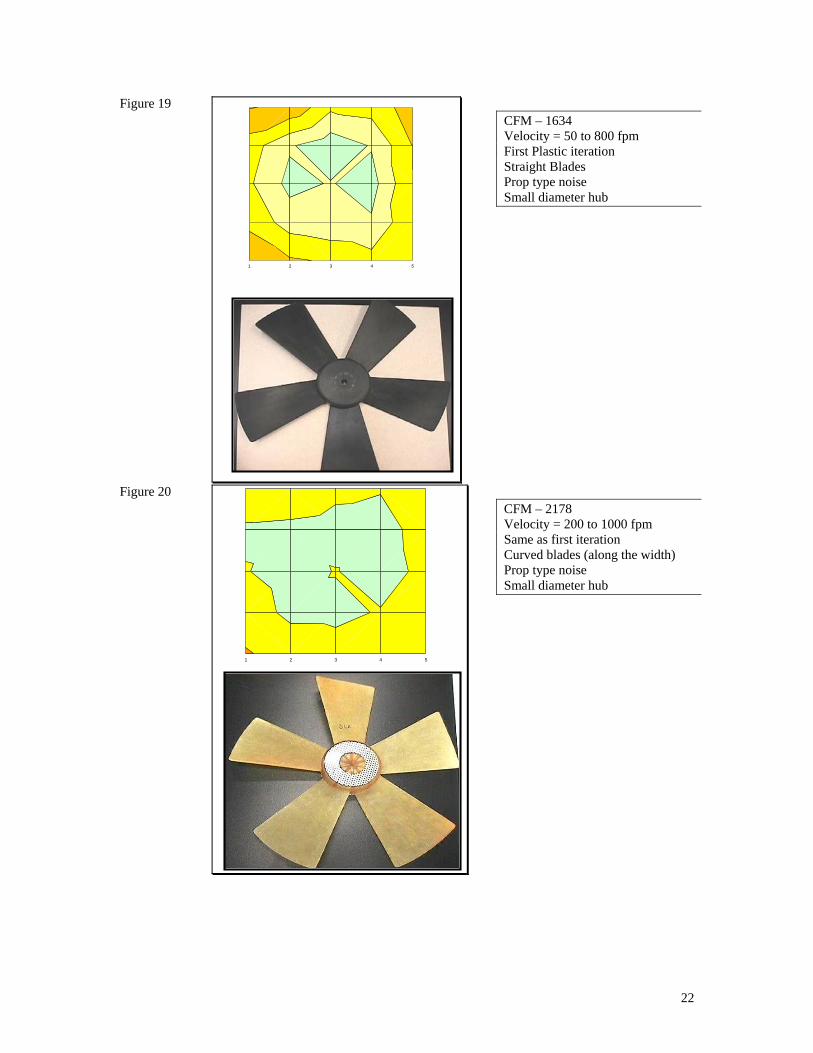
CFM – 1634 Velocity = 50 to 800 fpm First Plastic iteration Straight Blades Prop type noise Small diameter hub
Figure 20
1 2 3 4 5
CFM – 2178 Velocity = 200 to 1000 fpm Same as first iteration Curved blades (along the width) Prop type noise Small diameter hub
23
Figure 21
1 2 3 4 5
g
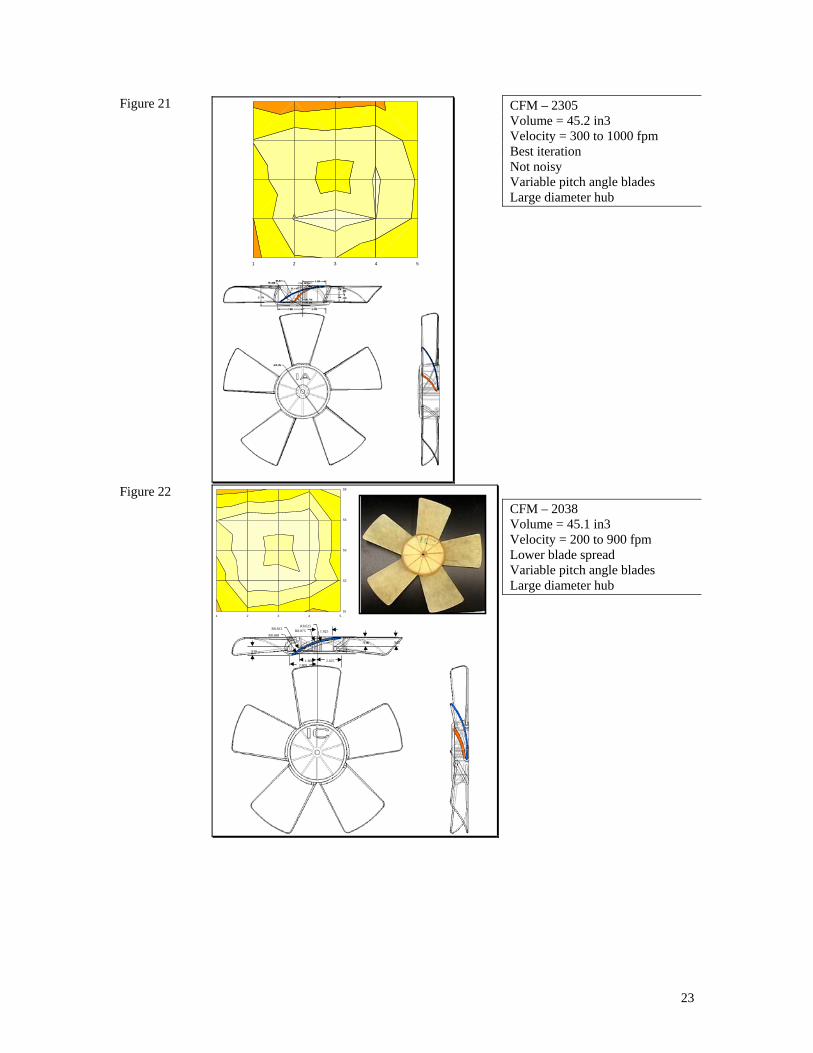
CFM – 2305 Volume = 45.2 in3 Velocity = 300 to 1000 fpm Best iteration Not noisy Variable pitch angle blades Large diameter hub
Figure 22
1 2 3 4 5S1
S2
S3
S4
S5
R8.813
R8.688R8.875
R8.6251.625
.938 .943
.938
2.8092.6251.800
CFM – 2038 Volume = 45.1 in3 Velocity = 200 to 900 fpm Lower blade spread Variable pitch angle blades Large diameter hub
24
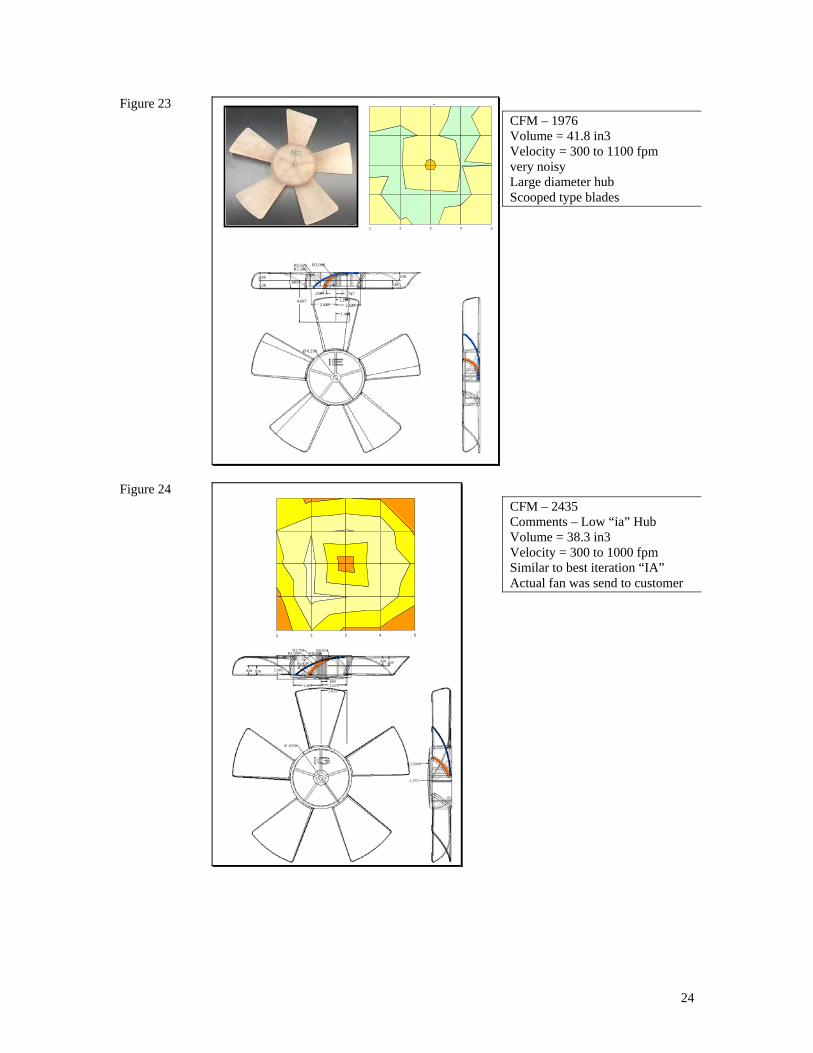
Figure 23
Ø 6.250
4.687
1.468
.2501.200
2.625
.747
.938
.938
R2.000R5.625R5.500
1.805.938
.938
2.648
1 2 3 4 5
g
CFM – 1976 Volume = 41.8 in3 Velocity = 300 to 1100 fpm very noisy Large diameter hub Scooped type blades
Figure 24
Ø .6250
R.15000
2.375
.938 .938
65.419°
R3.500 R8.688
2.8092.6252.625
R3.750 R8.813
.600
.938.938
2.905
1 2 3 4 5
g
CFM – 2435 Comments – Low “ia” Hub Volume = 38.3 in3 Velocity = 300 to 1000 fpm Similar to best iteration “IA” Actual fan was send to customer
25
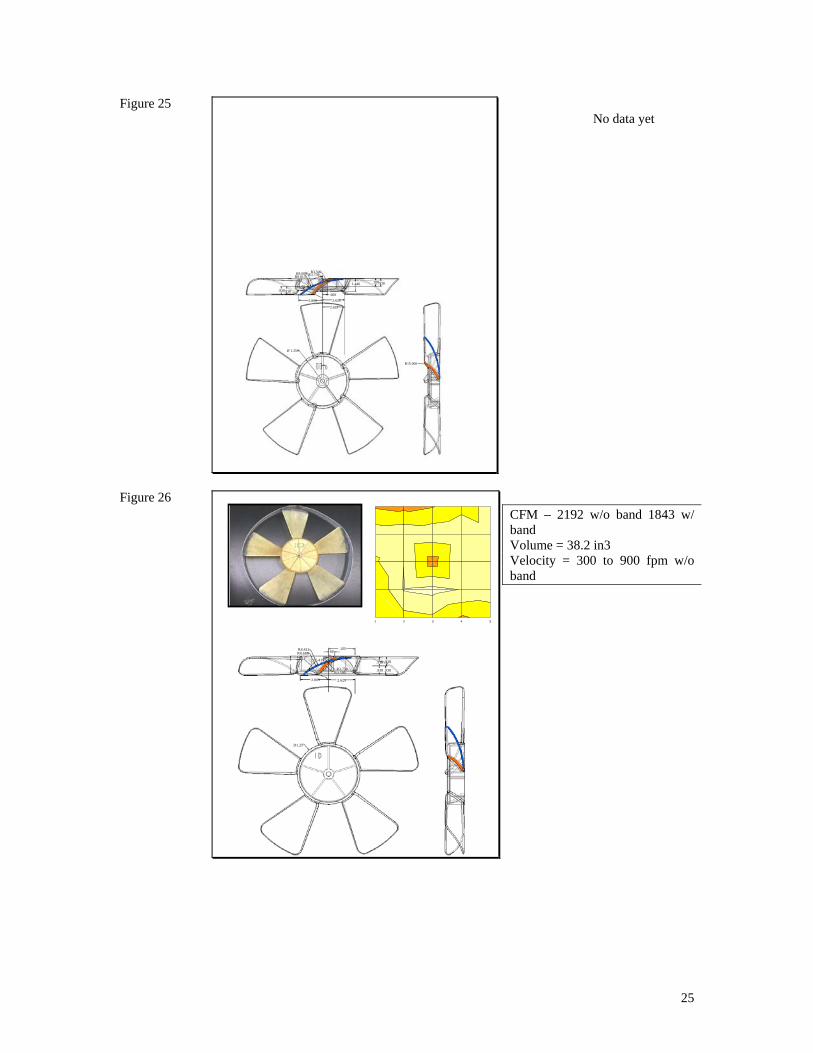
Figure 25
2.809
2.625
2.625.600
.938.93865.41°
R8.813R8.688 R3.750
R3.500
.938.9381.446
Ø 1.250
R15.000
No data yet
Figure 26
2.809 2.625
.938 .938
.938 .938
.265.600
R8.813R8.688
R3.500R3.750
65.419°
D1.25
1 2 3 4 5
g
CFM – 2192 w/o band 1843 w/ band Volume = 38.2 in3 Velocity = 300 to 900 fpm w/o band
26
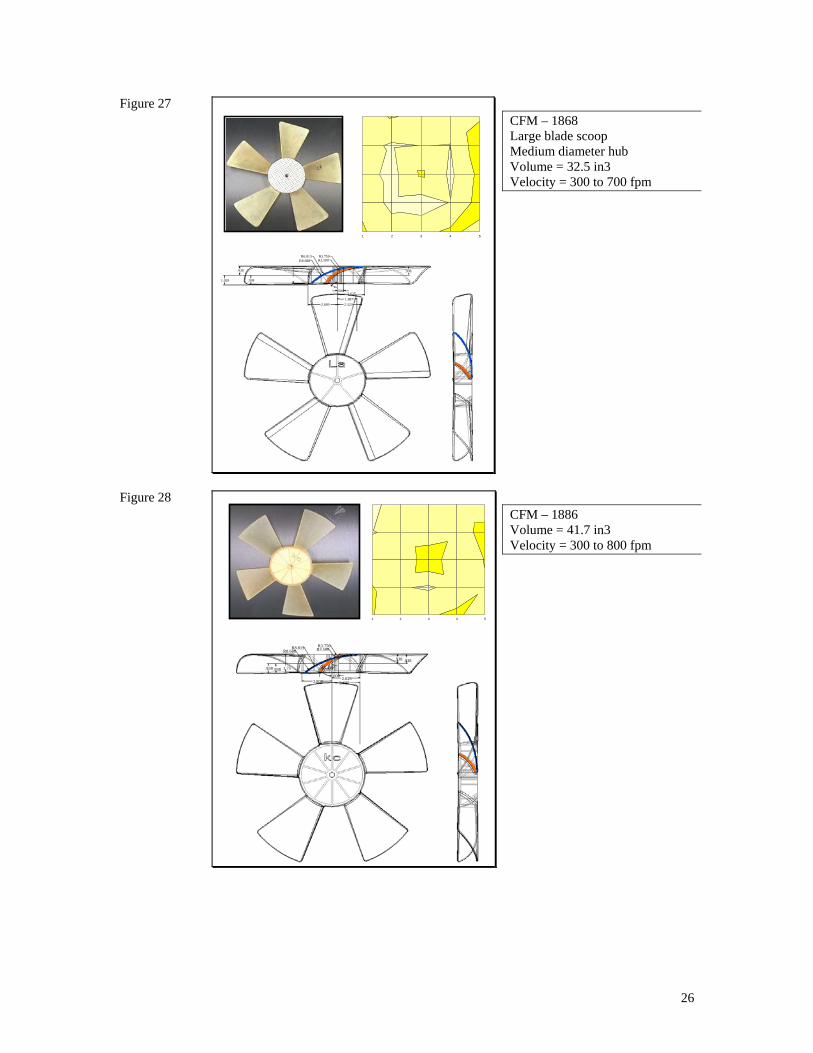
Figure 27
2.809 2.323
.600
1.8872.625
R6.688R6.813
R3.500R3.750
.938
1.029 .938
.938
1 2 3 4 5
CFM – 1868 Large blade scoop Medium diameter hub Volume = 32.5 in3 Velocity = 300 to 700 fpm
Figure 28
2.8092.625
2.625.600
65.419°
R3.500R3.750
R8.688R8.813
.938.938 1.75
.938 .938
1 2 3 4 5
CFM – 1886 Volume = 41.7 in3 Velocity = 300 to 800 fpm
27
Table 2: Summary of fan test results
SLA FAN Flow Comparisons@ 1100 RPM
2183
2305
2150
2038
21922154
2096
1815
1983
1886 1868
1976
1876
2107 21262087
23512418
1200
1400
1600
1800
2000
2200
2400
2600
CFM
CFM
Metal
IA
IATo Customer
IC
ID KB3/4"
KBTo Customer
KD
KDTo Customer
KCLA
IEIH3/4"
IH13/16"
IH11/4"
IH 111/16"
IJ 3/4"
IJ 1 3/16"
28
APPENDIX
29
COMPARING THE PERFORMANCE OF PLASTIC AND METAL HVAC FANS A. Dubin, BASF Corporation E. Homsi, BASF Corporation
Abstract
This paper compares the performance of two alternative HVAC fan designs: a five-blade injection molded thermoplastic design, against the more traditional three-blade stamped metal version. The study was conducted using computational fluid dynamics techniques, along with finite element structural analysis, in which we attempted to optimize the air movement characteristics of the fan, as well as its vibrational spectrum and structural integrity. Our objective was to maximize performance, increase efficiency, and reduce overall system cost.
Introduction
The first phase of our study focused on improving the air movement characteristics of the fan using Computation Fluid Dynamics (CFD) techniques. In the second phase, we verified the structural and vibrational characteristics of the fan using finite element analysis (FEA). The final phase, presently underway, will consist of prototyping and testing these designs.
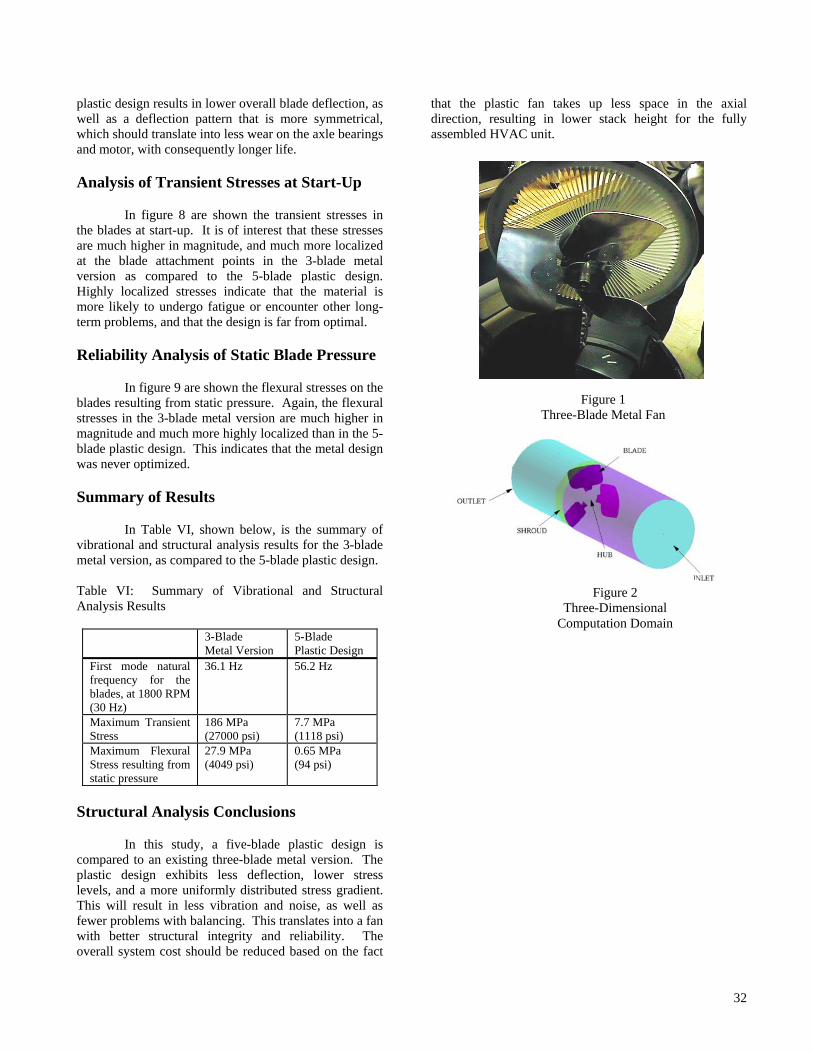
The traditional metal fan, presently in use by a number of HVAC manufacturers, consists of three stamped metal blades, riveted to a metal hub, Figure 1. Our proposal for a thermoplastic version consists of a one-piece injection molded fan, incorporating five aerodynamically contoured blades. By using thermoplastics, one is able to take fuller advantage of the increased design and styling freedom offered by the injection molding process, in order to develop an optimized part design. Our results show that it is possible to design a plastic fan having significantly better performance characteristics compared to the traditional metal version currently in use.
Fluid Flow Analysis
Our main objective was to design a plastic fan having higher efficiency, lower pressure loss, and less drive torque from the motor, compared to the traditional metal version currently in use. CFD is an extremely valuable technique for rapidly analyzing a proposed fan design and obtaining accurate performance data to compare against alternatives. Flow separation regions
can be graphically illustrated, in order to identify and reduce or eliminate them for increased efficiency. A major advantage of this technique is its ability to simulate variations in the design of the fan itself and also in the surrounding environment, and to obtain accurate results within a relatively short timeframe.
Air Flow Performance
In general, the performance of a fan depends upon the number and shape of the blades, and the operating characteristics of the system. It can be quantified in terms of efficiency, head rise, pressure loss, static force on the blades, and torque on the hub. To compare the performance it is important to use identical operating characteristics in each case. For this analysis we chose operating characteristics that are typical for many HVAC manufacturers, as summarized in Table I shown below.
Table I: Typical Operating Conditions Minimum Maximum Fan speed 1100 rpm 1800 rpm Air flow rate
85 m3/min. (3000 cfm)
113 m3/min. (4000 cfm)
Static pressure
0.062 kPa (0.25 inch water)
0.124 kPa (0.50 inch water)
Modeling and Analysis Technique
For this analysis, we assumed the flow of air to be steady-state, incompressible, isothermal and turbulent. We generated a volumetric mesh of the flow domain and performed the analysis using the multiple implicitly rotating frame-of-reference capability to simulate rotation of the blades. The three-dimensional computation domain, along with the shape of the blades and surrounding environment is shown in figures 2 and 3, for the three and five-blade designs, respectively. The mesh for each design is shown in figure 4. For the three-blade metal version, a wireframe model was created by measuring an actual fan, currently in use by a major HVAC manufacturer. For the five-blade plastic version, we generated a mesh directly from our design proposal.
To take advantage of symmetry, since all blades are assumed to have identical shape and flow is assumed to
30
be steady-state, only one blade was included in the analysis. Inlet and outlet sections were added upstream and downstream of the fan, at which locations the boundary conditions were imposed. The fan itself was represented by a two-dimensional baffle of zero thickness
Mesh Generation The particular module used for the mesh generation allows for interactive generation of hexahedral cells, which are six-sided three-dimensional volume elements that accurately simulate the operating characteristics and performance of the fan.
Mesh size and quality were monitored at all times and commonly-accepted standards for CFD meshes were maintained whenever possible. This is necessitated by the fact that an ill-defined mesh can result in poorly converged and/or inaccurate results. Numerical accuracy restricts such model characteristics as element aspect ratio, out-of-plane warpage and skewness (minimum acute angle). All portions of the mesh were developed to stay within these limits, while avoiding an unacceptably large model size.
Solution Technique
In this analysis, the air flow through the fan was assumed to be steady-state, incompressible and turbulent. The K-ε turbulence model was utilized. The flow domain in the region of the fan blade and shroud was solved in a rotational frame of reference and the flow upstream and downstream of the fan was solved in a stationary frame of reference. To obtain the 3D velocity and pressure fields, the continuity, momentum and turbulence equations had to be solved.
Boundary Conditions
The boundary conditions applied to the three-blade and five-blade fan models are summarized in Table II, shown below. Table II: Boundary Conditions Values Description Inlet Side Total Pressure =
1 atm (14.7 psi) Turbulence intensity = 7%
Assumed to be initial conditions
Outlet Side (pressure)
Flow rate = 0.0228 kg/sec (0.0502 lb/sec)
Calculation based on assumed geometry of
Values Description surrounding environmental package
Material Properties
Standard properties of air were used for this analysis:
Density = 1.205 kg/m3 (2.258 x 10⁻³ slug/ft3 ) Viscosity = 1.81 x 10⁻⁵ (3.81 x 10⁻⁷ lbf-hour/ft2)
Discussion of Air Flow Results
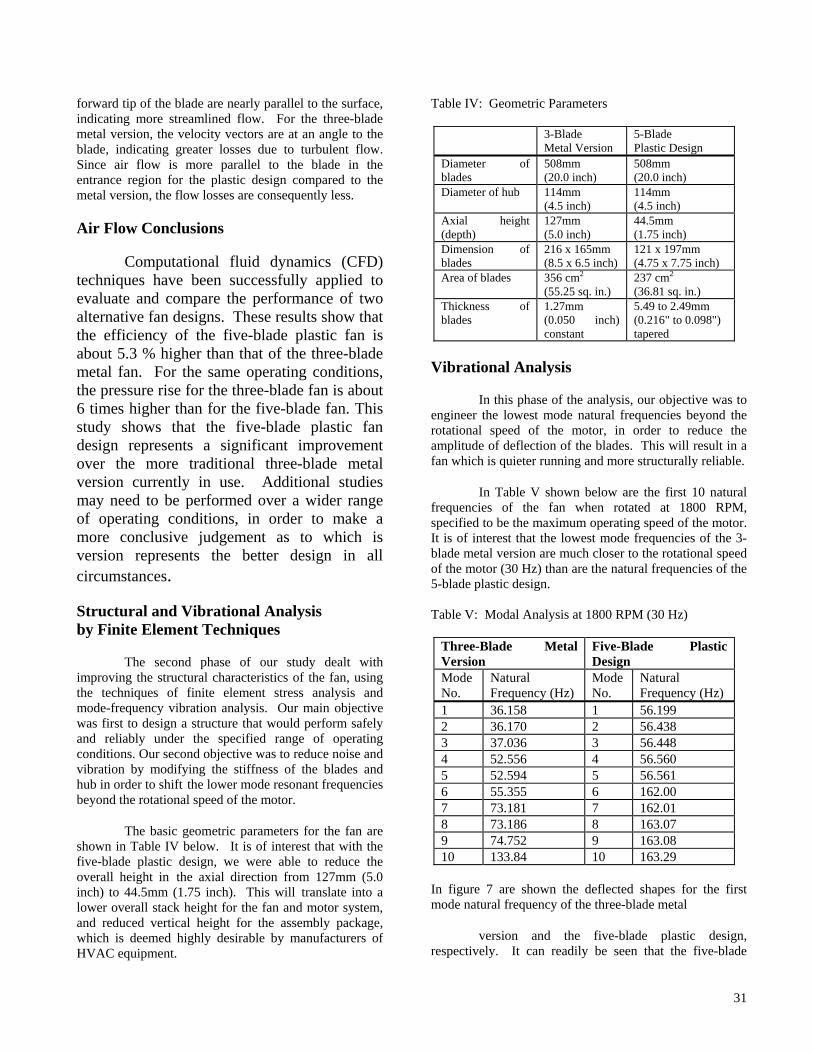
The performance data for the two fan designs that were compared in this study are summarized in Table III, shown below.
Table III: CFD Analysis Results, depict two different operating points and should not be construed as an A to B comparison.
Three-Blade Metal Version
Five-Blade Plastic Design
Efficiency (%) 64.71 68.17 Total pressure rise
0.371 kPa (7.76 psf)
0.056 kPa (1.17 psf)
Relative pressure drop
0.203 kPa (4.23 psf)
0.026 kPa (0.55 psf)
Torque on hub 5.42 N-m (4.0 ft-lb)
0.542 N-m (0.40 ft-lb)
Input power 1.02 kW (1.37 HP)
0.104 kW (0.14 HP)
Based on this analysis, the five-blade design is expected to result in higher operating efficiency than the three-blade design, under this set of operating conditions. The pressure rise (equivalent to head rise) for the three-blade fan is found to be significantly greater than that of the five-blade fan. The relative pressure drop is an indication of air flow losses around the blades and shroud. The pressure loss for the three-blade design is also found to be much higher than in the five-blade design. For the three-blade design, the difference between the static pressure at the outlet and the total pressure at the inlet was computed to be 0.113 kPa (2.36 psf). The pressure rise measured experimentally on this fan was 0.124 kPa (2.6 psf).
The absolute total pressure on the blades facing the inlet side is shown in figure 5. Figure 6 shows the velocity vectors around the blade for both the three-blade metal version and five-blade plastic design. In the case of the five-blade plastic design, the velocity vectors near the
31
forward tip of the blade are nearly parallel to the surface, indicating more streamlined flow. For the three-blade metal version, the velocity vectors are at an angle to the blade, indicating greater losses due to turbulent flow. Since air flow is more parallel to the blade in the entrance region for the plastic design compared to the metal version, the flow losses are consequently less.
Air Flow Conclusions Computational fluid dynamics (CFD) techniques have been successfully applied to evaluate and compare the performance of two alternative fan designs. These results show that the efficiency of the five-blade plastic fan is about 5.3 % higher than that of the three-blade metal fan. For the same operating conditions, the pressure rise for the three-blade fan is about 6 times higher than for the five-blade fan. This study shows that the five-blade plastic fan design represents a significant improvement over the more traditional three-blade metal version currently in use. Additional studies may need to be performed over a wider range of operating conditions, in order to make a more conclusive judgement as to which is version represents the better design in all circumstances.
Structural and Vibrational Analysis by Finite Element Techniques
The second phase of our study dealt with improving the structural characteristics of the fan, using the techniques of finite element stress analysis and mode-frequency vibration analysis. Our main objective was first to design a structure that would perform safely and reliably under the specified range of operating conditions. Our second objective was to reduce noise and vibration by modifying the stiffness of the blades and hub in order to shift the lower mode resonant frequencies beyond the rotational speed of the motor.
The basic geometric parameters for the fan are shown in Table IV below. It is of interest that with the five-blade plastic design, we were able to reduce the overall height in the axial direction from 127mm (5.0 inch) to 44.5mm (1.75 inch). This will translate into a lower overall stack height for the fan and motor system, and reduced vertical height for the assembly package, which is deemed highly desirable by manufacturers of HVAC equipment.
Table IV: Geometric Parameters
3-Blade Metal Version
5-Blade Plastic Design
Diameter of blades
508mm (20.0 inch)
508mm (20.0 inch)
Diameter of hub 114mm (4.5 inch)
114mm (4.5 inch)
Axial height (depth)
127mm (5.0 inch)
44.5mm (1.75 inch)
Dimension of blades
216 x 165mm (8.5 x 6.5 inch)
121 x 197mm (4.75 x 7.75 inch)
Area of blades 356 cm2 (55.25 sq. in.)
237 cm2 (36.81 sq. in.)
Thickness of blades
1.27mm (0.050 inch) constant
5.49 to 2.49mm (0.216" to 0.098") tapered
Vibrational Analysis
In this phase of the analysis, our objective was to engineer the lowest mode natural frequencies beyond the rotational speed of the motor, in order to reduce the amplitude of deflection of the blades. This will result in a fan which is quieter running and more structurally reliable.
In Table V shown below are the first 10 natural frequencies of the fan when rotated at 1800 RPM, specified to be the maximum operating speed of the motor. It is of interest that the lowest mode frequencies of the 3-blade metal version are much closer to the rotational speed of the motor (30 Hz) than are the natural frequencies of the 5-blade plastic design. Table V: Modal Analysis at 1800 RPM (30 Hz)
Three-Blade Metal Version
Five-Blade Plastic Design
Mode No.
Natural Frequency (Hz)
Mode No.
Natural Frequency (Hz)
1 36.158 1 56.199 2 36.170 2 56.438 3 37.036 3 56.448 4 52.556 4 56.560 5 52.594 5 56.561 6 55.355 6 162.00 7 73.181 7 162.01 8 73.186 8 163.07 9 74.752 9 163.08 10 133.84 10 163.29
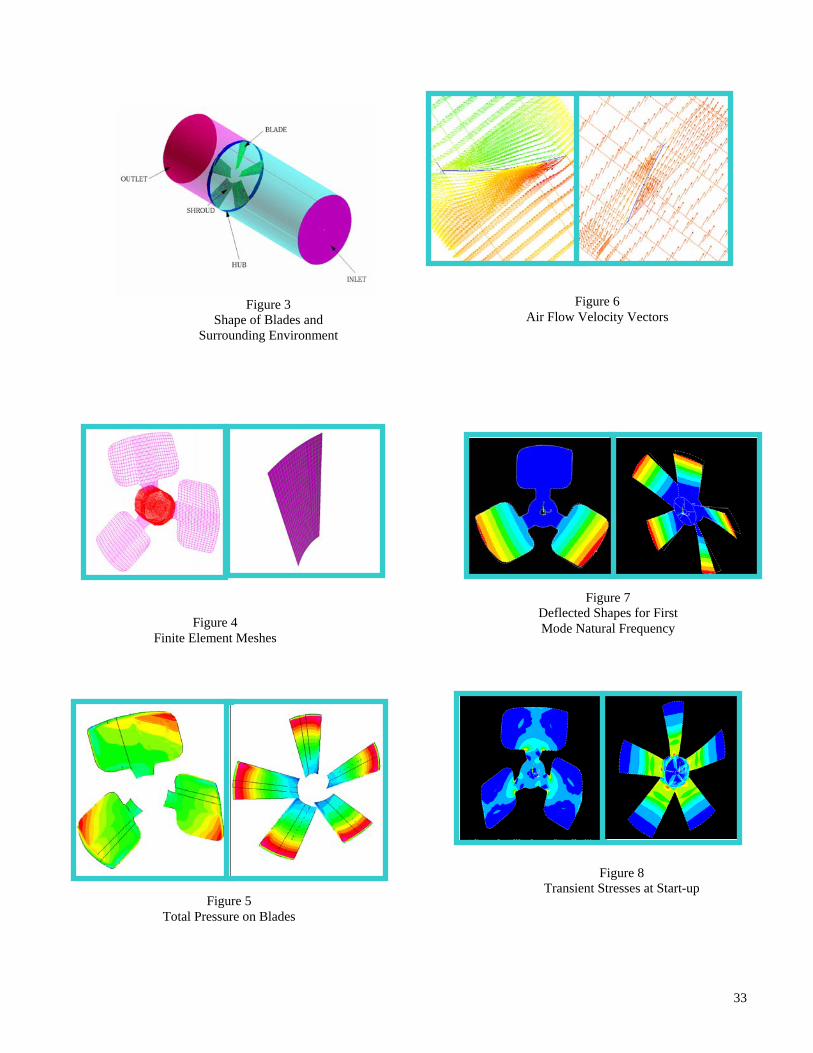
In figure 7 are shown the deflected shapes for the first mode natural frequency of the three-blade metal
version and the five-blade plastic design, respectively. It can readily be seen that the five-blade
32
plastic design results in lower overall blade deflection, as well as a deflection pattern that is more symmetrical, which should translate into less wear on the axle bearings and motor, with consequently longer life.
Analysis of Transient Stresses at Start-Up
In figure 8 are shown the transient stresses in the blades at start-up. It is of interest that these stresses are much higher in magnitude, and much more localized at the blade attachment points in the 3-blade metal version as compared to the 5-blade plastic design. Highly localized stresses indicate that the material is more likely to undergo fatigue or encounter other long-term problems, and that the design is far from optimal.
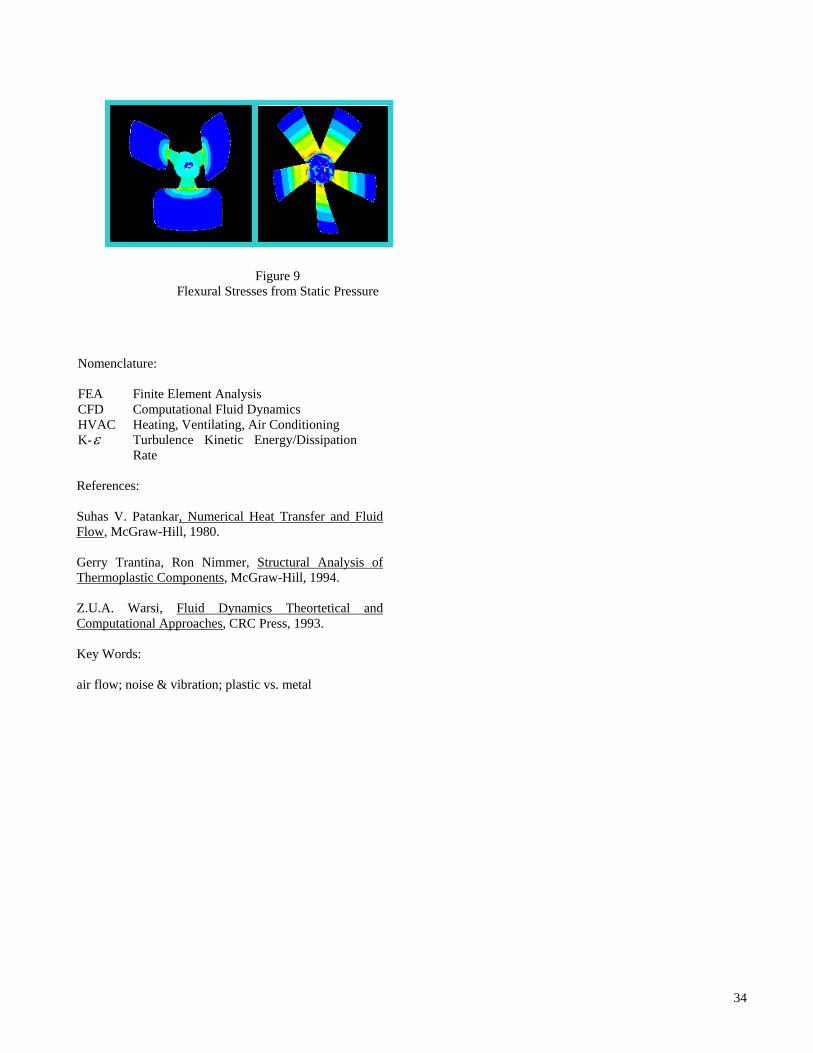
Reliability Analysis of Static Blade Pressure
In figure 9 are shown the flexural stresses on the blades resulting from static pressure. Again, the flexural stresses in the 3-blade metal version are much higher in magnitude and much more highly localized than in the 5-blade plastic design. This indicates that the metal design was never optimized.
Summary of Results
In Table VI, shown below, is the summary of vibrational and structural analysis results for the 3-blade metal version, as compared to the 5-blade plastic design. Table VI: Summary of Vibrational and Structural Analysis Results
3-Blade Metal Version
5-Blade Plastic Design
First mode natural frequency for the blades, at 1800 RPM (30 Hz)
36.1 Hz 56.2 Hz
Maximum Transient Stress
186 MPa (27000 psi)
7.7 MPa (1118 psi)
Maximum Flexural Stress resulting from static pressure
27.9 MPa (4049 psi)
0.65 MPa (94 psi)
Structural Analysis Conclusions
In this study, a five-blade plastic design is compared to an existing three-blade metal version. The plastic design exhibits less deflection, lower stress levels, and a more uniformly distributed stress gradient. This will result in less vibration and noise, as well as fewer problems with balancing. This translates into a fan with better structural integrity and reliability. The overall system cost should be reduced based on the fact
that the plastic fan takes up less space in the axial direction, resulting in lower stack height for the fully assembled HVAC unit.
Figure 1 Three-Blade Metal Fan
Figure 2 Three-Dimensional
Computation Domain
33
Figure 3 Shape of Blades and
Surrounding Environment
Figure 4 Finite Element Meshes
Figure 5 Total Pressure on Blades
Figure 6 Air Flow Velocity Vectors
Figure 8 Transient Stresses at Start-up
Figure 7 Deflected Shapes for First Mode Natural Frequency
34
Nomenclature: FEA Finite Element Analysis CFD Computational Fluid Dynamics HVAC Heating, Ventilating, Air Conditioning K-ε Turbulence Kinetic Energy/Dissipation
Rate References: Suhas V. Patankar, Numerical Heat Transfer and Fluid Flow, McGraw-Hill, 1980. Gerry Trantina, Ron Nimmer, Structural Analysis of Thermoplastic Components, McGraw-Hill, 1994. Z.U.A. Warsi, Fluid Dynamics Theortetical and Computational Approaches, CRC Press, 1993. Key Words: air flow; noise & vibration; plastic vs. metal
Figure 9 Flexural Stresses from Static Pressure

35
Capron® is a registered trademark of BASF Corporation. Copyright BASF Corporation 2003. This information is provided for your guidance only. We urge you to make all tests you deem appropriate prior to use. No warranties, either expressed or implied, including warranties of merchantability or fitness for a particular purpose, are made regarding products described or information set forth, or that such products or information may be used without infringing patents of others.
BASF Corporation 3000 Continental Drive - North Mount Olive, New Jersey 07828-1234 www.basf.com/usa www.plasticsportal.com ©Copyright BASF Corporation 2003 HELPING MAKE PRODUCTS BETTER™