Embed Size (px)
Citation preview

Baseline Summary Report 1st Annual Panel Survey 2013: Policy and Science of Health, Agriculture and Nutrition (PoSHAN) Community Studies

PoSHAN Community Studies Baseline Summary Report
2
FEED THE FUTURE INNOVATION LABORATORY FOR COLLABORATIVE RESEARCH ON NUTRITION
The Feed the Future Innovation Lab for Collaborative Research on Nutrition is a USAID funded project implemented by the Friedman School of Nutrition Science and Policy at Tufts University in close collaboration with numerous US and developing country partners. The mission of the Nutrition Innovation Lab is to discover how integrated interventions of agriculture, nutrition and health can achieve large-scale improvements in maternal and child nutrition in Asia and Africa and enhance institutional and human research capacity around agriculture, health and nutrition in Africa and Asia through graduate level training (MS and PhD) and support for short courses and conferences.
Suggested Citation: Manohar S, Klemm RDW, Rajbhandary R, Adhikari R, Gauchan D, Shrestha K, Webb P, Ghosh S, West KPW Jr. PoSHAN Community Studies Baseline Report. August 2014, Nutrition Innovation Lab, Johns Hopkins University, Baltimore, MD. This report is made possible by the generous support of the American people through the Feed the Future Innovation Lab for Collaborative Research on Nutrition is funded under grant contract AID-OAA-L-1-00005 and AID-OAA-L-1-00006 from the United States Agency for International Development (USAID). The contents are the responsibility of the Nutrition Innovation Lab-Asia and do not necessarily reflect the views of USAID or the United States Government).

PoSHAN Community Studies Baseline Summary Report
3
ACKNOWLEDGEMENTS
The Center for Human Nutrition and Department of International Health at Johns Hopkins Bloomberg School of Public Health (JHSPH) was contracted by Tufts University, under the US Agency for International Development (USAID)-supported Nutrition Innovation Lab, to design and carry out a national survey and sentinel site surveillance system in rural Nepal to examine and establish, where possible, pathways by which agricultural and rural empowerment policies and programs can achieve greater impact on nutritional well-being of mothers and children in the future. The co-authors of this report are Swetha Manohar, Rolf D.W. Klemm, Ruchita Rajbhandary, Raman Shrestha, Ramesh Adhikari, Devendra Gauchan, Kshitiz Shrestha and Keith P. West, Jr.
The Johns Hopkins team wishes to extend its sincere appreciation to the following institutions and individuals who contributed to the survey:
The Child Health Division, Department of Health Services, Ministry of Health and Population for their overall support of this project and assistance with facilitation of data collection at each of the 21 districts.
Rajkumar Pokharel (Chief, Nutrition Section, Child Health Division, Dept. of Health Services), for his initial and continued support of this project and for playing a crucial role in facilitating the initiation of this first round of data collection for the PoSHAN Community Studies.
Maura Mack (AOR, USAID-Washington), Vern Long (AOR, USAID – Washington), Pascasie Adedze (Activity Manager, USAID-Washington), Ahmed Kablan (Alternate AOR, USAID-Washington, D.C.) Shanda Holmes (Director of Health, USAID -Nepal), Beth Dunford (Mission Direction, USAID-Nepal) and Hari Koirala (Senior Nutrition Specialist, USAID- Nepal) for their support and commitment to the goals of the Nutrition Innovation Lab.
Eileen Kennedy and William Masters (Professors, Friedman School of Nutrition Science and Policy, Tufts University), Elizabeth Marino-Costello (Program Manager of the Nutrition Innovation Lab at Tufts University), Gerald Shively (Professor, Department of Agriculture Economics, Purdue University), Parul Christian (Professor, JHSPH), and Sucheta Mehra (Research Associate, JHSPH) for their valuable input during the design phases of the study and study instruments.
Sumit Karn (Nutrition Technical Coordinator, NuTEC) and Leela Thapa (DHO, Jumla) for support in the initial coordination phases of the survey
UNICEF and Sujay Bhattacharya (CMAM Program Officer, UNICEF/CHD) for assistance with procuring iodine testing kits.
Naresh Pratap KC (Chief, Logistics Supply Division) and Govinda Bista (PHO, LMD) for providing support in procuring supplies for the survey.
Raman Shrestha (Public Health Scientist, Nutrition Innovation Lab) for editorial support to this document.
Sudeep Shrestha (Post-doctoral Fellow, JHSPH) and Dev Narayan Mandal (Field Consultant, NNIPS) for his active involvement in planning and conducting the training of data collection teams and conducting quality control visits to the field.

PoSHAN Community Studies Baseline Summary Report
4
Steve LeClerq (Field Director, NNIPS) and Subarna Khatry (Director, NNIPS), Keshab Dhakhal and Dhruba Bdr. Khadka (Field Supervisors, NNIPS) for their support during the training, specifically the anthropometry exercises.
Fred Van Dyk (Programmer, JHSPH) and Maithilee Mithra (Programmer, JHSPH) for their valuable input on database structure and development.
Claire Fitch, Erin Biehl and Jamie Dorsey (JHSPH) for providing editorial support to this document.
Kenda Cunningham (Survey Consultant, IFPRI) , Suneetha Kadiyala (Senior Lecturer, LCIRAH/LHSTM), Purnima Menon (Senior Research Fellow, IFPRI) and Marie Ruel (Director of Poverty, Health and Nutrition Division, IFPRI) for sharing survey instruments, experience and for their active collaboration on this project.
Hari Krishna Shah (Senior Field Manager, Nutrition Innovation Lab/NTAG) and Abhigyna Bhattarai (Research Assistant, Nutrition Innovation Lab/NTAG) for their valuable contributions as lead trainers and for conducting ongoing quality control visits.
Sachin Shrestha, Deepak Dungol & Dhruba Thapa (Research Assistants, New ERA), Rabindra Udash, Durga Acharya, Tara Shrestha and Kamala Shrestha (Quality Controllers, New ERA), the 21 supervisors, 61 enumerators for their dedication and efforts in collecting data from the households included in the study.
Sarita Vaidya (Data Processing Officer, New ERA), Gehendra Man Pradhan and Babu Raja Dangol (Data Supervisors, New ERA) and the team of 10 data entry specialists for checking, managing, entering and cleaning the data.
The Word Processing Staff from New ERA who assisted with translations of the study’s manuals, questionnaires and other documents.
Administrative and logistics support staff at New ERA who provided support to the survey as needed throughout the survey period.
Kshitiz Shrestha (Team Leader, New ERA) for providing field level oversight of the movement of data collection teams, logistics and administrative needs.
Siddhartha Man Tuladhar (Executive Director, New ERA) for overall support and of the baseline survey.
The local leaders and district level officials of the 21 selected districts/VDCs (and 64 wards) for their support during the survey.
Finally, but most importantly, the 4287 households - their household heads, mothers and fathers and children - for providing us their valuable time and providing us information about their household and its members dynamics as it relates to agriculture, health and nutrition. We are sincerely grateful for your participation and patience.

PoSHAN Community Studies Baseline Summary Report
5
POLICY IMPLICATIONS OF THE POSHAN COMMUNITY STUDIES BASELINE FINDINGS
Baseline findings of this nationally representative study reveal variations in nutritional status,
household food security, agricultural production and practices, and sanitation between the agro ecological zones of Nepal. Undernutrition in under-five children and women was found to be consistently worse in the terai (with the exception of under-five stunting rates being approximately 36%). Household food insecurity was 40% across the PoSHAN sample during the May – July 2013 season; with terai households found to be least food insecure. The utilization of innovative agricultural practices were most common in the terai. Less than half of the overall sample owned toilets (48%) and only 14% of household in the terai owned one. Access to health and agriculture extension workers was noted to be low in the mountains, hills and terai (<10% and <6% respectively). These major findings highlight both a disconnect between increased production and access to food and undernutrition in women and children, as well as the significance of being specific when targeting communities to address the persistently high rates of undernutrition, food insecurity, hygiene and sanitation, access to decentralized healthcare and agricultural systems and overall promotion of innovative agricultural methods in Nepal.

PoSHAN Community Studies Baseline Summary Report
6
Table of Contents
FEED THE FUTURE INNOVATION LAB FOR COLLABORATIVE RESEARCH ON NUTRITION ..................... 2
ACKNOWLEDGEMENTS ................................................................................................ 3
POLICY IMPLICATIONS OF THE POSHAN COMMUNITY STUDIES BASELINE FINDINGS ……………………………...4
LIST OF TABLES ........................................................................................................ 9
LIST OF FIGURES ..................................................................................................... 13
ABBREVIATIONS ...................................................................................................... 14
EXECUTIVE SUMMARY ............................................................................................... 15
BACKGROUND ........................................................................................................ 24
GOAL OF POSHAN COMMUNITY STUDIES RESEARCH ............................................................ 25
SPECIFIC AIMS ........................................................................................................ 25
METHODS ............................................................................................................. 26
Survey Design and Population ..................................................................................... 26
Sampling of VDCs and Wards ...................................................................................... 26
Household Eligibility ................................................................................................ 26
Sample Size and Justification ..................................................................................... 26
Study Procedures .................................................................................................... 27
Personnel and Training ............................................................................................. 27
District Office Visits ................................................................................................. 27
Village Development Committee (VDC) Focus Group Discussion ............................................. 27
Survey Assessment of Households, Women and Children ..................................................... 28
Household Interviews ............................................................................................... 28
Household Observations ............................................................................................ 28
Women’s Interview .................................................................................................. 28
Child Assessment .................................................................................................... 28
Child and Maternal Anthropometry ............................................................................... 28
Child and Women Hemoglobin .................................................................................... 29
Quality Control ...................................................................................................... 29
DATA MANAGEMENT AND ANALYSIS ............................................................................... 29

PoSHAN Community Studies Baseline Summary Report
7
Database Management .............................................................................................. 30
Statistical Analysis .................................................................................................. 30
ETHICAL APPROVAL ................................................................................................. 30
RESULTS ............................................................................................................... 30
Sample Characteristics ............................................................................................. 30
Individual Characteristics: Women ............................................................................... 34
Nutritional Status ................................................................................................... 34
Dietary Intake and Patterns ....................................................................................... 36
Women’s Morbidity .................................................................................................. 39
Women’s Access and Utilization of Health Services ........................................................... 40
Receipt of Health Services among Pregnant Women .......................................................... 40
Family Planning ...................................................................................................... 46
Women and their Spouses’ Alcohol and Tobacco Use ......................................................... 47
Women’s Knowledge on Health and Nutrition .................................................................. 48
Women’s Employment and Decision-Making ................................................................... 501
Individual Characteristics: Children Under-five ................................................................ 53
Nutritional Status ................................................................................................... 53
Infant Feeding Practices and Under-five Child Dietary Patterns ............................................ 55
Child Care Among Children Under-five .......................................................................... 65
Children Under-five Morbidity ..................................................................................... 66
Immunization, Nutritional Supplementation & Deworming in Children Under-five....................... 66
Under- five Children’s Access and Utilization of Health Services ........................................... 67
Household Level Factors ........................................................................................... 73
Household Economic Factors ...................................................................................... 73
Household Income and Expenditure .............................................................................. 73
Wealth Index ......................................................................................................... 73
Household Food Security ........................................................................................... 78
Household Land Ownership, Land Use and Land Water Source .............................................. 80
Household Agricultural/ Homestead Food and Livestock Production ....................................... 83
Agricultural Inputs and Practices ................................................................................. 90
PoSHAN Community Studies Baseline Summary Report
8
Household Water and Sanitation .................................................................................. 96
Household Participation in Health, Nutrition, Agriculture, Micro credit and other social assistance programs .............................................................................................................. 98
Community Characteristics, Services & Infrastructure ........................................................ 99
Market Survey ....................................................................................................... 103
REFERENCES ......................................................................................................... 105
ANNEX ................................................................................................................ 106

PoSHAN Community Studies Baseline Summary Report
9
LIST OF TABLES
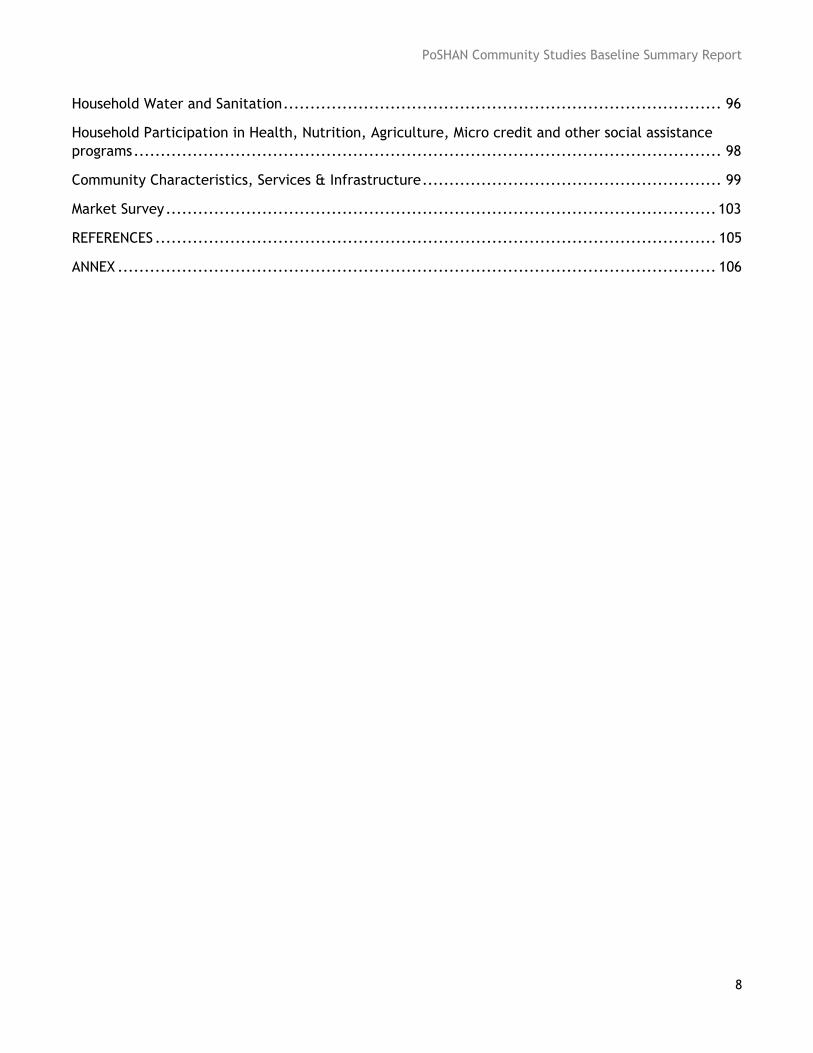
Table 1: Sample characteristics of households from the PoSHAN Community Studies 1st Annual Panel Survey……………………………………………………………………………………………………………………………………………………. 33
Table 2: Sample characteristics of PoSHAN Community Studies Sample, by agro ecological zone .... 33
Table 3: Age and sex of under-five children, by agro ecological zone ..................................... 33
Table 4: Prevalence of short stature in women of reproductive age, by agro ecological zone ........ 35
Table 5: Mean (SD) Mid Upper Arm Circumference (MUAC) in women reproductive age, by agro ecological zone and by pregnancy status ........................................................................ 35
Table 6: Mean (SD) hemoglobin levels and anemia prevalence in pregnant and non-pregnant women, by agro ecological zone ............................................................................................ 35
Table 7: Food group categorization for women’s dietary diversity score .................................. 37
Table 8: Women’s dietary diversity score, percent and mean number of times food items were consumed in the past 7 days, by agro ecological zone ........................................................ 37
Table 9: Dietary Diversity Score distribution, percent and mean number of times women consumed food items from food groups in the past 7 days ................................................................ 38
Table 10: Prevalence of women’s morbidity in the past 7 and 30 days, by agro ecological zone ..... 39
Table 11: Prevalence of experiencing listed symptoms in women during the previous 7 days, by agro ecological zone ...................................................................................................... 39
Table 12: Depressive symptoms experienced by women in the past 30 days, by agro ecological zone
......................................................................................................................... 40
Table 13: Health facilities accessed for treatment of select morbidities experienced by women in the past 7 days ........................................................................................................... 42
Table 14: Persons first sought by women for treatment of select morbidities among those women who experienced morbidities in the past 7 days, by agro ecological zone ...................................... 43
Table 15: Home visits by shamans and extension workers in the past 12 months to address women’s health, by agro ecological zone ................................................................................... 44
Table 16: Reasons for home visits by healthcare workers to women and by women to healthcare facilities in the past 12 months, by agro ecological zone .................................................... 44
Table 17: Receipt of antenatal services by women who were pregnant in the past 12 months, by agro ecological zone.......................................................................................................46
Table 18: Use of family planning methods used in the past 30 days, by agro ecological zone ......... 47
Table 19: Smoking, tobacco use and alcohol consumption amongst women and their partners in the PoSHAN sample ...................................................................................................... 47
Table 20: Women’s knowledge on maternal health and nutrition, by agro ecological zone ............ 48

PoSHAN Community Studies Baseline Summary Report
10
Table 21: Proportion of women with appropriate knowledge on child health and nutrition, by agro ecological zone ...................................................................................................... 49
Table 22: Women’s employment, by agro ecological zone .................................................. 50
Table 23: Women’s involvement in household-related decision-making, by agro ecological zone .... 51
Table 24: Under-five children nutritional status, by agro ecological zone ................................ 53
Table 25: Undernutrition status in children under-five by sex and age in the PoSHAN sample ........ 54
Table 26: Infant feeding practices among children under-five, by agro ecological zone................ 56
Table 27: Definitions on construction of infant and young child feeding indicators ..................... 57
Table 28: Breastfeeding practices in children 0-2 years of age, by agro ecological zone ............... 58
Table 29: Average daily frequency of breastfeeding in the past 7 days in children 0-2 years of age, by agro ecological zone ................................................................................................ 59
Table 30: Age and reasons for stopping breastfeeding in 0-2 year olds, by agro ecological zone ..... 59
Table 31: Types of food groups consumed by 0-2 year olds in the past week (percent and median consumed), by age and agro ecological zone ................................................................... 60
Table 32: Percent consumption of food groups among 0-2 year olds, by age and breastfeeding status in PoSHAN sample ................................................................................................... 62
Table 33: Average breastfeeding frequency in the past 7 days in 2-5 year olds, by age and agro ecological zone……………………………………………………………………………………………………………………………………….63
Table 34: Age and reasons for stopping breastfeeding in 2-5 year olds, by agro ecological zone ..... 63
Table 35: Types of food groups consumed by 2-5 year olds in the past week (percent and median consumed), by age and agro ecological zone ................................................................... 64
Table 36: Proportion of children cared for by individuals aside from mothers/primary caretakers, by agro ecological zone ................................................................................................ 65
Table 37: Prevalence of symptoms experienced among children under-five during the previous 7 days, by agro ecological zone ..................................................................................... 66
Table 38: Immunization history of children under 5, by agro ecological zone ............................ 66
Table 39: Receipt of supplements and deworming pills by children under-five in the past 12 months, by agro ecological zone ............................................................................................ 67
Table 40: Receipt of supplements by the household in the past 3 months, by agro ecological zone . 67
Table 41: Growth monitoring participation by children under-five in the past 12 months, by agro ecological zone ...................................................................................................... 68
Table 42: Reasons for health extension worker and health facility access by under-five children, by agro ecological zones ............................................................................................... 69

PoSHAN Community Studies Baseline Summary Report
11
Table 43: Facilities/persons accessed for treatment of select morbidities experienced by under-five children in the past 7 days ......................................................................................... 72
Table 44: Average income over the past 30 days for different income-generating activities, by agro ecological zone ...................................................................................................... 75
Table 45: Average HH expenditure (USD) in the previous month, by agro ecological zone ............. 76
Table 46: Mean remittances amount (USD) in and out of households that both received and sent money from a non-household member in the previous 12 months by agro ecological zone ............ 77
Table 47: Household food insecurity access scale (HFIAS), by wealth quintile ........................... 79
Table 48: Mean size of cultivatable land, by agro ecological zone ......................................... 81
Table 49: Household land ownership, land location, land use, main water source and primary irrigation, by agro ecological zone ............................................................................... 82
Table 50: Mean crop production by households who engage in crop production, by agro ecological zone ................................................................................................................... 85
Table 51: Mean fruit and vegetable production by households who engage in crop production, by agro ecological zone ...................................................................................................... 85
Table 52: Prevalence of households that own livestock among those households that report owning any livestock in the past 12 months, by agro ecological zone ............................................... 88
Table 53: Prevalence of households that own improved livestock among those households that report owning any livestock in the past 12 months, by agro ecological zone …………………………………….………….88
Table 54: Agricultural practices, by agro ecological zone .................................................... 90
Table 55: Education/Inputs provided to households visited by a Junior Technician (JT)/Junior Technician Assistant (JTA) in the past 12 months during the extension workers’ visit .................. 92
Table 56: Education/Inputs provided to households by a social mobilizer the past 12 months during each of their visits .................................................................................................. 93
Table 57: Education/Inputs provided to households by an agricultural NGO worker in the past 12 months during each of their visits ................................................................................ 94
Table 58: Time taken to fetch drinking water from household to water source and return home by household, by agro ecological zone .............................................................................. 96
Table 59: Household member responsible for collecting water by household, by agro ecological zone ................................................................................................................... 96
Table 60: Methods of treatment for water used by households, by agro ecological zone ............... 97
Table 61: Prevalence of household’s frequency of treated water consumption among under-five children in household that treat their water, by agro ecological zone ..................................... 98
Table 62: Prevalence of households’ utilized location for under-five defecation, by agro ecological zone ................................................................................................................... 98

PoSHAN Community Studies Baseline Summary Report
12
Table 63: Prevalence of households’ that keep animals inside their homes, by agro ecological zone.. ................................................................................................................. 98
Table 64: Prevalence of household participation in major program groups, by agro ecological zone ................................................................................................................. ..99
Table 65: Availability of key health, agriculture and livestock personnel in the VDC, by agro ecological zone ..................................................................................................... 100
Table 66: Availability of health, agriculture and veterinarian personnel, by agro ecological zone .. 101
Table 67: Presence of infrastructure of PoSHAN study sites ................................................ 102
Table 68: Average price (in USD) for food and personal items, by agro ecological zone ............... 103
Table 69: Average price (in USD) for agricultural items, by agro ecological zone.......................104
Table A1: List of PoSHAN Community Studies 21 VDC/District Sites.......................................106

PoSHAN Community Studies Baseline Summary Report
13
LIST OF FIGURES Figure 1: Consort Diagram for the PoSHAN Community Studies 1st Annual Panel Survey ............... 31
Figure 2: Prevalence of underweight, overweight and obesity in non-pregnant women of reproductive age, by agro ecological zone ...................................................................................... 34
Figure 3: Relative composition of maternal diet by lowest and highest wealth quintile ................ 38
Figure 4: Frequency of health facility visits by women in the past 12 months, by agro ecological zone ......................................................................................................................... 41
Figure 5: Women’s lack of decision-making power, by agro ecological zone ............................. 52
Figure 6: Anemia status of children under 5 by agro ecological zone ...................................... 55
Figure 7: Consumption of animal-source foods in the past 7 days in 2-5 year old children, by agro ecological zone ...................................................................................................... 65
Figure 8: Outreach health worker access of children under-five at their homes, by agro ecological zone ................................................................................................................... 68
Figure 9: Under-five children’s access to a health facility in the past 12 months ........................ 71
Figure 10: Average income over the past 30 days for different income-generating activities across the PoSHAN sample ...................................................................................................... 74
Figure 11: Proportion of households receiving and/or sending remittances in the past 12 months, by agro ecological zone ................................................................................................ 77
Figure 12: Wealth quintiles, by agro ecological zone ......................................................... 78
Figure 13: Household food insecurity access scale, by agro ecological zone .............................. 79
Figure 14: Proportion of households without adequate food provisioning, by month and agro ecological zone ...................................................................................................... 80
Figure 15: Household ownership of land, by agro ecological zone .......................................... 80
Figure 16: Household crop diversity, by agro ecological zone ............................................... 87
Figure 17: Household animal diversity, by agroecological zone ............................................ 89
Figure 18: Household production of animal-based products during the previous 12 months, by agro ecological zone ...................................................................................................... 90
Figure 19: Prevalence of household treatment of drinking water, by agro ecological zone ............ 97
Figure A1: Map of PoSHAN Community Studies 21 VDC sites ................................................ 106

PoSHAN Community Studies Baseline Summary Report
14
ABBREVIATIONS
BMI:
Body Mass Index
DGLV: Dark Green Leafy Vegetables
FCHV: Female Community Health Volunteers
HFIAS: Household Food Insecurity Access Scale
HH: Household
HHH: Head of Household
Hb: Hemoglobin
IFA: Iron and Folic Acid
IUD: Intrauterine Device
JHSPH: Johns Hopkins School of Public Health
JHU: Johns Hopkins University
MUAC: Mid-Upper Arm Circumference
NGO: Non-Governmental Organization
PoSHAN: Policy and Science, Health, Agriculture and Nutrition
VA: Vitamin A
VDC: Village Development Committee
USD: U.S. Dollar
WASH: Water, Sanitation and Hygiene
WDDS: Women’s Dietary Diversity Score
WHO: World Health Organization

PoSHAN Community Studies Baseline Summary Report
15
EXECUTIVE SUMMARY
Background The PoSHAN Community Studies is a public health research project of the Feed the Future
Innovation Lab for Collaborative Research on Nutrition (Nutrition Innovation Lab), funded by the US Agency for International Development (USAID).1 This study was designed and managed by a research team at the Johns Hopkins Bloomberg School of Public Health. Envisioned as a series of nationally representative annual surveys (panels) that seek to inform the design, targeting and content of nutrition-sensitive agricultural programs across the three ecological zones of Nepal (mountains, hills and terai), this report summarizes descriptive findings from the first panel, carried out from March-July 2013. Data collection activities of the first panel were conducted by New ERA Pvt. Ltd, Kathmandu. Subsequent rounds of panel data and more complex analyses will be shared in forthcoming reports.
The data reveal a country that varies by ecological zone in its agricultural resources, practices and productivity, diversity in marketed foods and their prices, food security, dietary patterns and nutritional status of children and mothers, and their participation in development programs. The zones are sufficiently distinct that “national” patterns must be disaggregated and understood for each zone to improve future nutrition-sensitive agriculture programs.
Study Goal The goal of the PoSHAN Community Studies is to present timely, nationally representative
data and interpretive policy and programming guidance on food security, diet and nutritional well-being of rural families with young children as may be influenced by agriculture, markets and a variety of interventions. Through periodic, standardized assessments of randomly selected communities across the mountains, hills and terai, coupled to an annual agriculture-to-nutrition symposium that provides a national platform for nutrition-sensitive research, PoSHAN seeks to suggest modifiable “causal pathways” to inform the content, guide targeting and sharpen the nutrition focus of agricultural policies and programs in the future.
1 The mission of the Nutrition Innovation Lab in Nepal is to reveal and integrate new empirical evidence that can guide agricultural policies and programs toward being more “nutrition-sensitive”; that is, better able and directed toward improving food security, dietary quality, health and nutritional well-being in rural society, especially among children and their mothers. In so doing, the initiative seeks to strengthen institutional research capacity in nutrition-sensitive agriculture in Nepal. The Nutrition Innovation Lab is being implemented in South Asia (Nepal) and Africa (Uganda) as part of a global network of Innovation Labs funded by the US Agency for International Development (USAID), Washington DC, USA. The Friedman School of Nutrition Science and Policy, Tufts University, Boston, USA serves as the lead agency of the Nutrition Innovation Lab, and is responsible for designing and implementing the PoSHAN Policy Study and a range of other related activities. The Center for Human Nutrition in the Department of International Health at the Johns Hopkins Bloomberg School of Public Health (Johns Hopkins), Baltimore, MD, USA, under subcontract with Tufts University, is responsible for designing and implementing the PoSHAN Community Studies in partnerships with the Nepali Technical Assistance Group (NTAG), New ERA Pvt. Ltd, Institute of Medicine (IOM), the Nepal Agriculture Research Council (NARC) and the Johns Hopkins Nepal Nutrition Intervention Project-Sarlahi (NNIPS) in Kathmandu, Nepal.

PoSHAN Community Studies Baseline Summary Report
16
The PoSHAN STUDY
Overall Study Design PoSHAN has three key components: The first is a series of three national, annual panel
surveys being carried out from May to July 2013, 2014 and 2015 to assess food security, diet, health and nutritional status of preschool aged children and mothers or other caretakers and link these aspects of well-being to local agricultural practices, markets and outreach programs.2 These panel surveys are carried out in the same households of a nationally representative sample of 21 Village Development Communities (VDC), each including 3 wards, in the mountains, hills and terai of Nepal, providing both annual cross-sectional data on status and multi-year, longitudinal data on national and zonal trends.
The second field activity is a multi-season surveillance, being conducted throughout the year in a subset of one “sentinel” VDC (each with three wards) in each of the sampled mountain, hill and terai zone VDCs to enable in-depth analyses of seasonal dynamics and interactions between food security, diet, health, nutritional status, markets and programs. The first and second components comprise what is called the “PoSHAN Community Studies”.
The third field activity involves research on the process of nutrition program and policy implementation. Collaborating closely with Johns Hopkins’ community studies, Tufts University, Patan Academy of Health Sciences and Helen Keller International are undertaking annual structured interviews with more than 750 policymakers and program implementers involved in decision making, resource allocation and management relating to the same 21 research sites noted above. These surveys provide multi-year, longitudinal data on the knowledge, attitudes and practices of individuals across multiple institutions charged with cross-sectoral collaboration for enhanced nutrition on the ground. This third activity is called the “PoSHAN Policy Study”.
This report summarizes descriptive data from the first of these three components: the first of the annual panel surveys from the PoSHAN Community Studies, conducted from May to July 2013. Findings from the completed 2014 survey, ongoing sentinel sites by seasons of the year, and the policy process surveys will be described in subsequent reports.
Survey Sampling Frame and Sample The sampling frame for the PoSHAN Community Studies comprised all districts and VDCs in
Nepal. The 75 districts in Nepal were stratified into three zones: (i) mountains, (ii) hills and (iii) terai, and districts within each zone were listed contiguously from west to east. Sample size estimation was based on the ability to assure high precision for basic estimates of nutritional status by region and nationally, the ability to explore and estimate associations between childhood and maternal malnutrition with common socioeconomic, dietary, morbidity and other risk factors, as well as costs and practicalities of completing field work within prescribed periods of time. These considerations led to an estimated national sample size of 5000 households with <5 year old children and their mothers or newly married women. Based on 2011 Census data, we anticipated approximately half of all households would meet these demographic criteria, requiring initial visits to 9000 households during the first survey from which we expected to enroll 4500 children under 5 years of age, and up to 5000 mothers or caretakers plus newlyweds (i.e., women married within the previous two years, expected to have children eligible in future survey rounds).
2 Additional rounds of panel data collection may extend beyond 2015 if future funding is made available by USAID for that purpose.

PoSHAN Community Studies Baseline Summary Report
17
Utilizing systematic random sampling, 7 VDCs from each zone were selected. Ward selection comprised the 2nd stage of sampling. Three of nine wards were selected using probability proportional to size (PPS) for the annual assessment, providing a total of 63 wards in the annual survey (21 per zone), intentionally sampled in proportion to the distribution of population size within each of the three agro-ecological zones. However, because numbers of VDCs and distribution of population size by VDC vary across zones, national estimates are weighted, as needed, by proportions of the population living in the mountains, hills and terai.
The actual sample size was 4287 households, 4509 women and 5401 children under the age of five years at the baseline survey. These numbers are expected to be approximately reached each year, albeit slightly inflated with newborn surviving children entering the survey and those enrolled in the first panel being followed up to 6 years of age at the time of the second panel survey. Previously enrolled children beyond 6 years of age will no longer be eligible for assessment in subsequent years.
Community Level and Special Group Eligibility As PoSHAN Community Studies seeks to assess local resources and aggregates at the district
level, officers from the district offices of public health, agriculture and livestock were also targeted for interview in the baseline survey. At the VDC level, focus group discussions with key informants such as female community health volunteers (FCHV), ward representatives and other service professionals (shopkeepers, post office attendants) were conducted to assess available community infrastructure and services.
Study Procedures & Data Collection Data collection was carried out by New ERA (21 field teams, one per district/VDC, each with 1
supervisor and 3 interviewers) who were hired, trained and standardized on the purpose of the survey, and who learned standardized procedures for obtaining informed consent, conducting interviews, performing anthropometry and hemoglobin measurements, and utilizing global positioning system procedures (GPS). All training, standardization and field work was conducted under the direction and supervision of JHU investigative faculty and Nutrition Innovation Lab/ JHU Kathmandu team.
Data was collected from multiple levels within the community (from the household to VDC) and with various respondents, as outlined below:
Household interview: Collected data on household socioeconomic, food security and dietary characteristics, including education and occupation of parents, asset ownership, income and expenditure, cropping, gardening and animal raising methods, food production and its disposition by type of food, level of perceived food security, participation in agricultural extension, microcredit and other programs, and health care and nutrition services.
Women’s interview: Obtained information on pregnancy history, pre- and post-natal care, diet via a 7-day food frequency questionnaire, recent morbidity, receipt of health and nutrition services, decision making roles, child care and feeding practices, and knowledge and practices related to maternal and child health and nutrition.
Under-five child interview: This included a 7-day food frequency questionnaire, receipt of child health and nutrition services (vitamin A, vaccinations, deworming, etc.), a 7-day history of morbidity symptoms and a recent child care history.
Child and Women Anthropometry and Hemoglobin Assessment: Weight, length or height, mid-upper arm circumference and hemoglobin measurements on women and children were taken.
Community and Market Assessment: Physical locations and health and agricultural service infrastructure in the community were recorded, and unit prices for foods and agricultural inputs from local whole- and retail sellers in local markets were obtained.

PoSHAN Community Studies Baseline Summary Report
18
Quality Control All questionnaires were pre-tested prior to finalization. During the survey, a team of quality
controllers, research assistants and a team leader from New ERA as well as a team from the Nutrition Innovation Lab/JHU team consistently conducted quality control visits throughout the duration of the survey conducting re-interviews and ensuring quality of interviewing technique, proper coding, confidentiality of interviews and field protocol adherence overall.
Data Management and Analysis Completed and checked data forms were transferred to the field team supervisor, who after
checking and collating and securely maintaining the forms, submitted them periodically to the data management center at New ERA where all data was double- entered on a real-time basis using Fox Pro (Version 2.6). JHSPH was responsible for all data analysis. Data underwent initial exploratory and descriptive analyses to quantify distributions of discreet and continuous variables. All data presented in this report are unadjusted. Analyses were performed using STATA v. 12.1 (StataCorp, College Station, TX, USA).
Ethical Approval Ethical approval for the study has been provided by the Nepal Health Research Council
(NHRC), a statutory and autonomous body under the Government of Nepal, and the Institutional Review Boards at the Johns Hopkins Bloomberg School of Public Health, Baltimore, MD, and Tufts University, Boston, MA.
Findings A summary of findings of the first annual panel survey follows, which reflects the status of
women (mothers and newlyweds), under five year old children and general household characteristics between May and July 2013. A detailed description of survey results can be found within the report.
Women Women surveyed included mothers/caretakers of preschool aged children (n= 4072) and
women married in the previous two years but without children (n= 437), for an approximate total of 4509 women providing the basis for these findings.
Nutritional Status Undernutrition is common among women, with 27% having a body mass index (BMI) below the
conventional cutoff of 18.5 weight/height2, reflecting thinness in adults, and 12% being short in stature, below 145 cm. Both conditions were most prevalent in the terai. Fewer than 11% of surveyed women were overweight (i.e., BMI 25- 29.9) across all agro-ecological zones, with the prevalence slightly higher in the hills (10.7%) than mountains (7.9%) and terai (6.6%). Overall, obesity rates were <2% overall.
Nationally, over half (54 %) of non-pregnant women were anemic (Hb <12.0 g/dL), with clear zonal differences, affecting 6%, 42% and 36% of women in the terai, mountains and hills, respectively.
Among all pregnant women, 59% had anemia (Hb <11.0g/dL), with differences by zone following the same pattern as seen in non-pregnant women: a prevalence of 65%, 53% and 48% in the terai, mountains and hills were found. While severe anemia was rare, 28% had moderate or worse anemia (Hb <7.0-9.9 g/dL).

PoSHAN Community Studies Baseline Summary Report
19
Dietary Patterns The main staple grains consumed by women throughout the country were rice, corn, wheat,
buckwheat, millet and potato. Staples (any item from this group) were reportedly eaten an average of 4.5 times/day.
Legumes, mainly in the form of dal (soup), were reportedly eaten by women on average 2 times/day. Importantly, these frequency data do not reveal the consistency of dal consumed, which affects nutritional value.
Vitamin A-rich fruits and vegetables (ripe mangoes & jackfruits, papayas, carrots, etc. and not
including dark green leafy vegetables - DGLV) intake varied between the agro ecological zones, revealing the terai to have both the highest prevalence of weekly intake (75%) and mean frequency of intake at 4.4 times/week. Overall, 58% of women consumed these Vitamin A-rich foods. DGLV was consumed by 76% of women overall but was most commonly consumed in the mountains (83%) and on average, 4.4 times/week.
Other fruits and vegetables were consumed by approximately 91% of women overall but most
commonly in the terai, followed by the hills and mountains (97%, 88%, 78%, respectively). The highest mean (SD) frequency of intake per week of other fruits and vegetables was 13.8 (11.2), noted in the hills.
Animal source foods - dairy products, meat, fish and eggs - were infrequently consumed and
intake low across each of the three zones (e.g., reported mean intakes among all women for eggs were 0.8 times/week, for meat & poultry 1.6 times/week, for fish 0.5 times/week). Dairy was consumed by 59% of women with mean intakes of 4.6 times/week. Except for dairy, animal source foods were least frequently consumed by women in the terai3.
Socio economic status played a role in the composition of women’s diets with the predominant
food item in the diet among those of lower socioeconomic status diet being staple foods with limited to no consumption of meat and VA-rich foods and vegetables.
A ‘Dietary Diversity score’ for women (WDDS) was calculated4, based on any reported intake of foods in the previous week classified into 8 groups, as a crude indicator of dietary quality. Nationally, the WDDS [mean (SD)] was 5.7 (1.4) out of a maximum of 8 food groups. Zone averages were close to this value and not significantly different. An apparent paradox of terai women of having relatively high WDDS (5.9) amidst the highest rates of undernutrition and anemia may reflect low frequency and portion sizes, and complex causes of undernutrition.
Mean WDDS among pregnant and non-pregnant women were not significantly different (5.9 and 5.7, respectively). Further, no significant differences in the frequency of intake of foods consumed between pregnant and non-pregnant women were noted, with the exception of other Vitamin A-rich fruits and vegetables which pregnant women, on average, consumed more (4.5 times/week vs. 2.9 times/ week in pregnant vs. non-pregnant women, respectively).
4 This infrequent intake of nutritious animal source foods reflects a chronic situation as reflected by Campbell et al. Seasonal Dietary Intakes and Socioeconomic Status among Women in the Terai of Nepal. J Popul Health Nutr. 2014 June; 32(2):198-216.

PoSHAN Community Studies Baseline Summary Report
20
Access to Health Services For home visits, few women (<10%) reported they were visited by a health extension worker for
any woman’s health issue in the past 12 months. Overall, the most frequent health care visitor was the FCHV, who visited 8% of surveyed women at home in the previous year.
Health facility visits, in contrast to home visits, were more prevalent, 74% of all women reporting visits to a health care facility in the previous 12 months to address their own health needs. Most often, women sought advice for illness symptoms from local pharmacists and ‘village doctors’ rather than trained government providers.
Receipt of Health Services among Pregnant Women Among all women who were pregnant in the previous 12 months, 82% received iron-folate
supplementation; receipt of iron-folate pills was lower in the mountains at 71% with 82% and 86% receiving iron-folate pills in the hills and terai, respectively.
Deworming pills were received by approximately 70% of all women and 96% of those who received pills, took them. Prevalence of women receiving deworming pills in the mountains and hills was similar (65%), but higher in the terai (75%).
Receipt of post-partum vitamin A supplementation in pregnant women was 44%, 49% and 51% in
the terai, mountains, and hills, respectively.
Standard prenatal services for pregnant women were noted to be lower in the mountains than in the hills and terai.
Women’s Knowledge on Health and Nutrition Maternal knowledge of health and nutrition messages - related to their children’s and their own
health - was varied and inconsistent across the agro ecological zones. For maternal health and nutrition, 88% of all women knew to use iodized salt all the time and the prevalence of women knowing that they needed to eat more during pregnancy was approximately 84% in both the hills and mountains but 68% in the terai.
Knowledge gaps related to maternal health and nutrition were seen most in the mountains in the
PoSHAN sample overall.
Overall, 62% of women knew that children needed to be exclusively breastfed for the first 6 months of their lives; only 52% of women in the terai were aware of the duration of exclusive breastfeeding compared to 72% and 76% in the mountains and hills, respectively.
Only 11% and 20% of women overall thought feeding their >6 month old children eggs and
fish/meat, respectively was appropriate.
For appropriate treatment of diarrhea in children, there was a variance in knowledge across the agro ecological zones with less than 50% of women knowing how to appropriately treat in the mountains and hills versus 72% in the terai.
Knowledge of all appropriate hand washing times was low across the zones. However, 90% of
women reported hands must be washed after going to the toilet with soap and water.
Women’s Employment and Decision-Making 25 % of women overall reported being engaged in paid employment.

PoSHAN Community Studies Baseline Summary Report
21
Decision making power over what agricultural products were grown by the household was held by
less than 26% of women in the terai and 61% and 51% of women took part in the decision in the mountains and hills, respectively.
Decision-making control as it related to a women’s own health and nutrition issues were revealed to be: 73% of women in the terai, 81% and 89% of women in the mountains and hills, respectively. For decisions on daily expenditures 63%, 59% and 41% of women in the mountains, hills and terai respectively, were involved.
Approximately 86% of women across the zones made decisions about family planning.
Children Children under five years of age were surveyed for a total sample of 5401 under-five children
providing the basis for these findings.
Under Five Children’s Nutritional Status Little variation in stunting rates was noted in under-five children across the agro ecological zones
(37%, 36% and 35% in the mountains, hills and terai, respectively).
Wasting prevalence was noted to be 8%, 11% and 23% in the mountains, hills and terai, respectively.
Underweight prevalence was highest in the terai at 39% among under-five children. In the
mountains and hills, it was revealed to be 26% and 29%, respectively.
The mean MUAC (SD) overall in children under five was noted to be 14.3 (1.2)
Anemia prevalence in children under-five exceeded 50% in all three agro ecological zones, with the highest prevalence (>70%) among children in the terai. Anemia prevalence was lowest in the hills yet still alarmingly high at 50.8% prevalence.
Under Five Children’s Infant and Young Child Feeding and Dietary Intake Overall, exclusivity of breastfeeding across the PoSHAN sample was low at 47% overall and 61%,
40% and 46% in the mountains, hills and terai, respectively.
The offer of pre-lacteals to an infant within the first 3 days of life was highest in the terai at 40% and 14% and 26% in the mountains and hills, respectively.
Almost all children 2-5 years of age were consuming staples and legumes (100% and 96%, respectively) across the sample in the previous 7 days; this pattern of consumption was similar across zones.
Vitamin A-rich fruit and vegetable (including DGLV) consumption in this age group was highest in
the terai (93%) and was approximately 76% in the mountains and hills. A similar pattern was seen for other fruit and vegetable consumption in this age group revealing a high pattern of consumption in the terai (94% in the terai, 82% in the hills and 70% in the mountains).

PoSHAN Community Studies Baseline Summary Report
22
The consumption of dairy products among children 2-5 years of age was 49%, 62% and 70% in the mountains, hills and terai, respectively.
Egg consumption in this age group was 36%, 40% and 25% in the mountains, hills and terai,
respectively.
Flesh foods consumption (meat, fish, poultry, and liver/organ meats) was 64% overall and intake was similar across the zones.
Under five child access to healthcare Overall, home visits by outreach health workers to provide care for under-five children were low.
FCHVs and Shamans provided the most frequent visits, reaching 13.6% and 8.3% of under-five children respectively 2-3 times/year.
Health facility access was 11% overall among children under-five. Frequency of access to health facilities for young children varied across the agro ecological zones. Reasons that under-five children accessed healthcare facilities included diarrhea management and respiratory illness, as well as other non-specified reasons.
Household Economics In the PoSHAN study sample, the monthly average cash income for a 30-day period between May –
July 2013 was USD 8, USD 8, USD 2, USD 55, USD 18, and USD 19 derived from food crop/farming, livestock, business activity, wage work and salary/pensions, respectively.
The reported annual average amount in remittances received by households in the mountains, hills and terai was USD 918, USD 1062 and USD 1120, respectively. The reported annual average outflow of remittance from a households to a non-household member in the mountains, hills and terai over the previous 12 month period was USD 2294, USD 708 and USD 707, respectively.
30-day average HH expenditure for food and non-food expenditure was highly variable. Overall,
average 30-day expenditure (in the previous month from the survey) was USD 178 with a higher average expenditure in the mountains.
Household Food Insecurity Nearly 60% of households experienced no household food insecurity in the past 30 days across the
PoSHAN sample. The months during which households within different agro ecological zones experienced inadequate amounts of food provisioning varied by zone—in the mountains and hills, food provisioning was inadequate April - May, compared with August-September for households in the terai.
Severe food insecurity was experienced by 9.7 %, 3.8 % and 6% of household in the mountains, hills and terai, respectively. 1 in 5 households in the mountains were moderately food insecure.
A higher proportion of households in the lowest quintiles for wealth experienced some level of
household food insecurity.
Land Ownership, Agricultural and Animal Production Over 80% of households in the terai and hills owned some amount of land and 73% of households
in the mountains owned land.
Household agricultural production was varied for crops, fruits and vegetables across the zones.

PoSHAN Community Studies Baseline Summary Report
23
67%, 49% and 38% of households in the terai, mountains and hills, respectively produced 0-5 different varieties of crops. Approximately 31%, 30% and 14% of households in the hills, mountains, and terai, respectively grew 11-20 different varieties of crops.
Overall, approximately 36% of all households who owned any livestock in the past 12 months
owned cattle/ buffalo/ oxen/ cow/yak; these were the most commonly owned livestock in the study sample followed by goats (28%) and poultry (11%). The quantity of different livestock owned varied across the zones.
Agricultural Practices and Inputs The most commonly applied ‘improved’ agricultural practices included caging poultry, food
processing, free range poultry, and improved drying methods. There was variation in the types of practices used across agro ecological zones, with the terai favoring the use of many of the practices listed.
A small proportion of households were visited by agricultural extension workers (<6%). Education on topics related to agriculture, as well as agricultural inputs to households visited by extension workers, varied across the zones – improved seeds/ sapling distribution, education on the use of agrochemicals and kitchen gardens were some of the common inputs.
Water and Sanitation 49% of households in the mountains and hills and 81% of households in the terai reported having a
water source within the household’s compound and 23% of the sample overall travelled less than 15 minutes to a water source.
A majority of households in the sample did not treat their drinking water prior to drinking (96%, 71%, and 67% in the terai, hills and mountains, respectively). Of the households that did treat their water, 48% overall boiled their water and 33% filtered their water.
Among those households that treated their water, 56% offered this water all the time to their under-five children.
Toilets were not owned by 48% of households in the PoSHAN sample. The most common place overall for under-five children to defecate was outdoors - outside of the house (24%) and in an open field (26%). Toilet use for children under-five was 35%, 32% and 14% in the mountains, hills and terai, respectively.
Steps Forward The PoSHAN Community Studies will continue to conduct these annual panel surveys in the 21
randomly VDC sample described between 2013- 2015. Additionally, the study will also conduct seasonal assessments in Jumla, Arghakanchi and Banke districts. These national and zone-representative findings will continue to provide a basis for reports to the Government of Nepal and USAID and other stakeholders in the agriculture, health and nutrition sectors in the Nepal. In the coming years, these results will also be analyzed to present trends over time in status, intake, household food security, household practices and will be able to measure and link, each year, program exposure to food security to diet to nutritional status of children and women.

PoSHAN Community Studies Baseline Summary Report
24
BACKGROUND Household food security, caring practices and the health environment are all recognized as
underlying determinants of nutrition. Yet, in developing countries, the causal pathways and interactions leading from food production through markets to households, and how dietary choices impact nutritional well-being are poorly understood. As a result, efforts to improve nutrition through investments in agriculture are inadequately guided and less than optimal. New approaches that identify, assess, link and modulate components of these pathways are needed to develop and monitor more effective interventions. Research that assesses rural exposure to agricultural innovation and extension outreach, food market dynamics, household food security, and dietary intake and nutritional status of high risk groups, annually and seasonally, may offer a systems approach to understanding causal pathways and nutrition-sensitive program elements that can improve food security and status among nutritionally vulnerable groups.
Agricultural interventions such as home gardening, use of hybrid seeds and fertilizer, and small livestock production have the potential to improve the diet and nutritional status of women and children in Nepal through multiple pathways. For example, increased agricultural productivity can raise income available for purchasing more and better quality foods [1]. The pathways that lead from food production to household food security to improved nutrition are complex, with many determinants [2]. Recent reviews assessing the evidence of agricultural intervention impact on improving child nutrition outcomes reveal inconclusive evidence due largely to inadequately designed studies [3, 4]. The few studies documenting a positive link between agricultural production and nutrition have usually included a nutrition education component, and focused on dietary improvement as the main outcome, without examining effects on nutritional status.
Nepal offers an important setting to measure, classify and understand pathways by which
actions in agriculture, alone or in combination with other health and nutrition actions can influence household food security, dietary intake and nutritional status of women and children. First, over 80 percent of the population works in the agricultural sector, mostly on subsistence family farms, and farming households account for ~3/4ths of Nepal’s poor [5, 6]. Second, improvements in food production have not kept pace with population growth, particularly among small landholders and female farmers, who constitute over 60% of the farming labor force [5]. Third, food insecurity is common: 43 of Nepal’s 75 districts faced a food deficit and 23 districts were chronically food insecure in a 2009 World Food Program assessment. Nationally, 23% of households face moderate and 16% severe food insecurity [7]. Fourth, child undernutrition remains high with 41%, 11% and 29% of preschoolers classified as stunted, wasted and underweight, respectively [7]. Poverty, low agricultural productivity and food insecurity are the likely factors contributing to such malnutrition. Finally, mounting concern from the Government of Nepal (GON) and development partners about these issues has led to intensified agricultural interventions, and in some cases, combining agricultural interventions with nutrition, health and sanitation interventions to yield a program that engages multiple development sectors [8].
While agriculture, nutrition and health may be interrelated, expected positive linkages between interventions implemented within each of these sectors are often not realized [9]. There is a need to further elucidate pathways by which agricultural practices, extension programs, and other local empowerment programs (e.g., microcredit, education, health and nutrition services) may lead to improved market access, household availability to food, dietary intakes and nutritional status in high risk areas and socio-economic groups. Knowing these pathways and their dynamic interactions over time represents an attempt to understand the systems that link agriculture-to-nutrition and find ways, in the future, to enhance the impact of interventions in rural Nepal.

PoSHAN Community Studies Baseline Summary Report
25
This report describes research based on a national panel survey in Nepal where marginal agricultural productivity, market diversity, food security and nutritional status co-exist with government and non-governmental programs addressing each of these domains, offering opportunity to establish conditional pathways that may help raise the nutritional impact of future rural agricultural and empowerment policies and programs. The report presents the findings of the first of three planned annual panels.
GOAL OF POSHAN COMMUNITY STUDIES RESEARCH The goal of this research is to research the determinants of household food security, dietary
intake and nutritional status of preschool aged children and their mothers in relation to changes in agriculture and exposure to agricultural and microeconomic extension, nutrition and health programs in Nepal. This is achieved by conducting: 1) annual surveys in a nationally representative sample of households, selected by village development community (VDC) and ward, across 21 districts in Nepal, and 2) surveillance of these indicators and their degrees of change by season in a nested sample of sentinel sites in the mountains, hills and terai of the country. The survey and surveillance data will be linked, in aggregate, to the presence and intensity of agricultural, development, health and nutrition programs as offered in each sampled district to identify ways by which national, regional and district programs can expect to influence food security, diet and the nutritional status of women and children. Within rural society, young children (< 5 years of age) and their mothers, and recently married women (within the previous two years) are considered vulnerable groups whose nutritional status, diet, health and well-being can be expected to reflect levels of food security and rural empowerment.
SPECIFIC AIMS The specific aims are to assess in a nationally representative sample of research sites from May to July each year for up to 3 years, and in three sentinel sites seasonally throughout each year:
a) anthropometric status of children under 5 years of age, their mothers, and recently married women
b) dietary intake of children under 5 years of age, their mothers, and recently married women
c) recent histories of morbidity and care seeking patterns in children under 5 years of age d) anemia status in a subset of children under 5, their mothers, and recently wed women e) household hygiene and sanitation practices f) indices of household food security g) landholdings by food production type and yield, and usual disposition of foods produced h) household food expenditures i) household participation in maternal and child nutrition and health services j) household participation in agricultural and microcredit extension programs k) household socioeconomic status l) community infrastructure m) community markets in terms of food diversity, quantity and prices

PoSHAN Community Studies Baseline Summary Report
26
METHODS
Survey Design and Population The PoSHAN surveillance and sentinel study has two design elements. The first is comprised
of a series of three national, annual, panel surveys (May-July 2013, 2014 and 2015) of preschool aged children and mothers/caretakers in communities (wards) located in the mountains, hills and terai of Nepal; the second is a year-round sentinel surveillance system in one representative VDC in each of the mountain, hill and terai zones to enable in-depth analysis of seasonal variation in markets, food security, diet and nutritional status. For the purpose of this report (which provides the findings from the first annual panel survey), only the design of the Annual Panel Survey will be described in detail.
The three annual panels constitute a mixed longitudinal assessment, as assessments are repeated each year in the same wards, with eligible immigrant households and members being enrolled, but emigrants from the area not followed following their departure from a study site.
Sampling of VDCs and Wards The first annual panel survey included twenty-one randomly selected VDCs in 21 different
districts (1 VDC per district), drawn equally from each of the three agro-ecological zones (N=7 in each) (Figure 1). The 75 districts in Nepal were stratified into three zones: (i) mountain, (ii) hill and (iii) terai zones, and districts within each zone were listed contiguously from west to east. Within each district, VDCs were listed by name in alphabetical order based on a national database. From each zone, a sample interval was obtained by dividing the total number of VDCs by the desired sample number of VDCs per zone (i.e., 7). Following a random start, every 7th VDC was systematically selected, assuring no more than one VDC selected per district. The 21 VDCs selected are given in Table 1.
Ward selection comprised the 2nd stage of sampling. Three of nine wards (numbered 1-9, representing the smallest administrative unit in each VDC) were selected using probability proportional to size (PPS) for the annual assessment, providing a total of 63 wards in the survey (21 per zone). These wards were assessed from May to July 2013. These same wards will be revisited during each of the two subsequent, annual surveys (May-July 2015 and 2016).
Data collection for the first annual panel survey occurred from May to July 2013.
Household Eligibility A ward screening procedure was used to identify eligible households by asking each household
whether a child under-five and/or newly married woman resided in the household. If neither existed within the household, the household was excluded from the survey. Participants included in the first annual panel survey were consenting households with women married in the past 2 years and/or with children under-five years of age.
At the district level, officers from the district offices of public health, agriculture and livestock were interviewed. At the VDC level, focus group discussions with key informants such as female community health volunteers (FCHV), ward representatives or members, community level health personnel, NGO workers and other service professionals (shopkeepers, post office attendants) were conducted to assess community services and infrastructure.
Sample Size and Justification Based on district, VDC and ward population census tables in each agro-ecological zone
(Department of Health Services 2011 HMIS 2067/87 (2010/2011), and cost, logistics and time-in-field considerations, we estimated a capacity to conduct the baseline and each follow-up annual survey in

PoSHAN Community Studies Baseline Summary Report
27
21 district sites (VDCs, 3 randomly selected wards per VDC). Based on 2011 Census data, we expected to visit 9000 households of which we expected 5000 households with a child < 5 or a newly married woman to be eligible for the survey. We expect this sampling plan to generate a total sample size of 4500 <5 year old children, 5000 mothers/caretakers of children under-five and/or newly married women for the annual survey and 5000 heads of household.
The zonal sampling distribution was expected to yield, on average, 800 (18% of the total sample), 1200 (27%) and 2500 (55%) households in the mountain, hill and terai zone sites, respectively (Figure 2). These were estimates based on 2001 Government of Nepal census data, adjusted at a 2.5% growth rate per year. The actual sample size was 4287 households, 4509 women and 5401 children under the age of five. The differences in sample sizes by zone, given the same number of sampled units, reflect variation in VDC population density, with least populated communities in the mountains, and the most populous areas in the Terai.
Study Procedures
Personnel and training All survey field work was carried out by 21 field teams (one per district/VDC, each with 1
supervisor and 3 interviewers) who were hired, trained, standardized and managed under a subcontract with a longstanding, local Nepalese field research firm, New ERA. New Era has conducted multiple Demographic and Health Surveys in Nepal and was competitively awarded the bid for these field activities. Training took place for a 5-week period prior to start-up, during which staff learned about the purpose of the survey, and learned standardized procedures for obtaining informed consent, conducting interviews, performing anthropometry and hemoglobin measurements, and utilizing global positioning system procedures (GPS).
Field staff were trained in the ethical conduct of research in accordance with standards described in “A Field Training Guide for Human Subjects Research Ethics”, a manual co-developed by the JHU investigative team [10]. All training, standardization and field work was conducted under the direction and supervision of JHU investigative faculty based in Kathmandu and Baltimore.
District Office Visits Prior to team arrivals, district administrators were informed of the survey activities through the offices of the Child Health Division of the Ministry of Health and Population in Kathmandu. Field teams carried assignment letters and project ID cards at all times, identifying them as trained, professional staff of the project. As teams enter their assigned districts for survey work, they met with district administrative, health and agricultural officials, presented their credentials to explain the survey, sites, procedures and timetables, and sought their assistance, as needed. Publically available data on selected VDC government staff strengths and registered multi-sectoral activities were collected with the assistance of certain district level officials, using a standardized script describing the purpose of the survey and this specific data collection activity. Exit interviews were also conducted with district officials at the close of the survey, reporting on general achievements and thanking them for their support.
Village Development Committee (VDC) Focus Group Discussion On arrival in study VDCs, each team presented their credentials and met with local leaders, including the chair, elected study ward members and local program officers to explain the purpose and all aspects of the survey, procedures, timetable and informed consent procedures and to seek their assistance. Information about locations of markets, government and program offices, community services, program offices, major agricultural and food vendors as well as outreach activities were collected to begin ascertaining the infrastructure and program dynamics within the study VDC and three selected wards. This information was gathered through a focus group discussion

PoSHAN Community Studies Baseline Summary Report
28
and all invited participants were read a standard introductory script explaining the purpose of the research and the infrastructure and services of the VDC that they were questioned about. Local markets were visited on “market days” to gather data on retail prices per unit on a standardized list of meats, fish, vegetables, fruit, oils and other food items.
Survey Assessment of Households, Women and Children After ascertaining eligibility, field interviewers returned to households who provided consent
to the team supervisor for interviewers to return and collect information on household, maternal and child characteristics. Staff also took anthropometric measurements, and, on a subset of respondents, conducted finger or heel sticks for hemoglobin assessments. Women and children found to be severely anemic or malnourished were referred to the local health post for further evaluation and treatment, as indicated. The following procedures were carried out:
Household Interview Field interviewers confirmed the name of the head of household and listed eligible
mothers/women and children. They collected data on household socioeconomic, food security and dietary characteristics, including education and occupation of parents, asset ownership, income and expenditure, cropping, gardening and animal raising methods, food production and its disposition by type of food, level of perceived food security, participation in agricultural extension, microcredit and other programs, and health care and nutrition services over periods of time ranging from the past week to year, depending on type of questions.
Household Observations Field interviewers conducted household observations and recorded their findings on various
characteristics and facilities of the household including roof, wall and floor material, presence of a toilet and its type as well as sanitary conditions of the household and its toilet. An iodine test of the household’s salt was also conducted to confirm the use of iodized salt by the household.
Women’s Interview Mothers/caretakers of <5 year old children or newly married women without a child were
interviewed to obtain information on pregnancy history, pre- and post-natal care, diet via a 7-day food frequency questionnaire, recent morbidity, decision making roles regarding the accrual or disposition of resources in the household (such as land, livestock and income), expenditures, child care and feeding practices, and leadership roles in the community). Among pregnant women, last menstrual period histories were obtained to estimate gestational age in order to assist in interpreting anthropometric, morbidity and dietary data. Non-pregnant women were asked about breast feeding practices and month post-partum of lactation, as indicated.
Child Assessment The child module included a 24-hour recall of breast feeding and complementary and usual
home food intake, recent receipt of semi-annual vitamin A supplements, a 7-day history of symptoms (acute lower respiratory infection, diarrhea, malaria, ear discharge and fever), a history of vaccination coverage, and a recent child care history.
Child and Maternal Anthropometry All anthropometric measurements were taken by trained and standardized staff, using
standard equipment. Infant/child and maternal weight was measured to the nearest 100 g on a digital scale (Seca Scales, Columbia MD), checked regularly for accuracy using standard weights. Supine length for infants 0-23 months, and standing height for children 24-59 months was measured to the 0.1 cm in triplicate using a Shorr length board. Maternal height was measured to the nearest 0.1 cm in triplicate by a portable stadiometer. Upper arm circumference was measured in triplicate

PoSHAN Community Studies Baseline Summary Report
29
on children and women using non-stretch insertion tapes. All measures were recorded and the median used for analysis. Standing height in pregnant and lactating women was measured to the nearest 0.1 cm using a portable stadiometer.
Child and Women Hemoglobin Hemoglobin was assessed from a spot of whole blood using heel-sticks in children < 6 months
of age and finger-sticks in children > 6 months of age, their mothers/caretakers and from newly married women, using the Hb 201 hemoglobinometer (HemoCue AB, Angelholm, Sweden). This is a field instrument used globally for measuring hemoglobin, with a measurement range of 0-25.6 g/dL (0-256 g/L or 0-15.9 mmol/L) and a consistently reported correlation (r) = 0.99 when tested against standard clinical tests. One in four households were sampled to be eligible for anemia testing and then, depending on the composition of the household, a child and its mother/caretaker or a newly married woman was sampled for a hemoglobin assessment. In households with more than one child under-five, only one child with his/her mother was randomly selected for anemia testing. In households comprising only a new couple, the newly married woman was measured for Hb if their household was randomly selected for the test. As anemia may be due to several causes, children and women identified as anemic, based on standard cutoffs for their life stage and pregnancy status and on WHO standards for altitude adjustments, were referred to the nearest, local health facility for evaluation and treatment, as indicated.
Quality Control All questionnaires were pre-tested prior to finalization. Pre-testing took place in the districts
of Dhading and Sunsari to ensure not only comprehension and contextual appropriateness of the questions, but also to ascertain time taken to administer interviews and to develop language lexicons for Bhojpuri and Maithilee speaking sites. Field procedures for identifying households were followed by a New ERA team of 10 enumerators who field tested the questionnaires. Supervision was conducted by New ERA’s 3 Research Assistants and 1 team leader and the Nutrition Innovation Lab/JHU technical team to ensure protocol of data collection procedures were being followed and to provide feedback on interviewing techniques. After modifying the questionnaires based on pre-test results, all questionnaires were back-translated into English and verified as correct.
During the survey, 4 quality controllers, 3 research assistants and 1 team leader from New ERA along with 1 Senior Field Manager, 2 Research Assistants and the Project Scientists from Nutrition Innovation Lab/JHU team consistently conducted quality control visits throughout the duration of the survey. Re-interviews were conducted by quality control staff and field supervisors also completed quality control checklists at least 3x/week to ensure quality of interviewing technique, proper coding, confidentiality of interviews and field protocol adherence overall. Supervisors conducted daily meetings with their teams to review questionnaires for completeness, consistency, and ensured skip patterns were followed. For missing fields and inconsistency, enumerators were scheduled to return to the household to verify responses with the respondents. If any corrections were made, standard procedures of crossing out incorrect values, initialing and documenting the correct values were followed. Data collectors, supervisors, quality control and data management staff all used different colored pens to be able to detect at which level changes were made and by whom.
Data Management and Analysis At the completion of interviews, forms were checked for completeness, legibility and
consistency, page by page during the interviews and then cross-checked by fellow team members. Where possible, errors were corrected. Completed and checked data forms were transferred to the field team supervisor, who also checked, collated and securely maintained forms until periodically transmitted, by road, via a study courier to the data management center at New ERA.

PoSHAN Community Studies Baseline Summary Report
30
Database management Data were double-entered on a real-time basis using Fox Pro (Version 2.6) as forms reached
the New ERA data management center in Kathmandu. Each database was regularly checked and was compiled for outliers through range checks, consistency and completeness. Meetings between the JHU team and New ERA data management center were held regularly to review and monitor progress with data entry, including any outstanding queries to resolve with JHU senior investigators. The database was frozen and submitted from New ERA analysis to the JHU project scientist after 15% of the data was entered to run frequency distributions and finally, a complete panel dataset was submitted to JHU within six weeks of completion of household data collection in the field.
Statistical analysis Data underwent initial exploratory and descriptive analyses to quantify distributions of
discrete and continuous variables. Data were analyzed to characterize maternal (e.g., body mass index, mid-upper arm circumference [MUAC]) and child (Z-scores for height-for age, weight-for-height, weight-for-age, MUAC; and hemoglobin) nutritional status and dietary intake (e.g., frequencies and diversity), indices of household food insecurity, agricultural productivity, income and expenditures, and participation in agricultural, health and nutrition interventions by agro-ecological zone. Analyses were performed using STATA v. 12.1 (StataCorp, College Station, TX, USA).
Ethical Approval Ethical approval for the study was provided by the Nepal Health Research Council (NHRC), a
statutory and autonomous body, under the Government of Nepal, and the Institutional Review Board at the Johns Hopkins Bloomberg School of Public Health, Baltimore, MD, and Tufts University, Boston.
RESULTS
Sample Characteristics The first annual panel survey of the PoSHAN Community Studies comprised a total of 4287
households across each of the three agro ecological zones who provided consent to be interviewed (Figure 1). This household count gave rise to 4509 and 5401 women of reproductive age and under-five children, respectively from whom information was collected (Figure 1). This section will describe this sample – the sex, education, occupation and caste of the household head and the socio-economic status and other characteristics of the households and its members.
The mean (SD) household size was 5.7 (±2.6) and the majority of households were headed by male versus females (73.6 vs. 26.4%). 46% of household heads had never attended school, with the highest proportion of household heads having attended 5th to 9th grades. Over a third of heads of households’ primary occupation is related to agriculture/aquaculture/ livestock/ poultry (35.7%) and 21% is related to business/self-employment activities.
The sex distribution of children under-five was almost equal, with a slightly higher proportion of male versus female children under-five across the mountains, hills and terai (52.7% versus 47.3%). The majority of the children under-five were between the ages of 2 – 5 years (61.4%).
36.8% of households reported having an improved water source (receiving water from a protected piped source), and 55% reported their water came from a tube well or borehole. Overall, 25% of the sample was Brahmin/Chhetri, 21% Janajati, 2.5% Newar, 17% Dalits and 29% from other terai castes. Approximately 4.5% of the sample was Muslim/Churaute and <1% from other non-specified caste groups. Among women in the sample, over half (64.3%) held a non-wage-earning occupation (which includes being a Female Community Healthy Volunteer (FCHV) or a housewife).

PoSHAN Community Studies Baseline Summary Report
31
Unavailable/Not met for the interview
N=33
Refused the Interview
N=59
Total number of eligible1 households
N=4380
Households not eligible
N=4937
Eligibility not known
N=3
Households consenting for interview
N=4288
Interviews completed
Total number of households in 21 sampled VDCs
N=9320
Interview not completed
N=1
Household
Roster (P1.03) N=4288
Interview (P1.04) N=4287
Observation (P1.05) N=4287
Women (P1.06) N=4509
Pregnant N=517
Not Pregnant N=3972
Unknown Pregnancy Status N=20
Hb Assessment N=1014
Child (P1.07) N=5401
<6m N=458
6-11m N=557
12-23m N=1068
24-59m N=3318
Hb Assessment N=899
1 Eligible households are those having 1 or more children <5 years of age or a recently married woman, within the past two years
Figure 1: Consort Diagram for the PoSHAN Community Studies 1st Annual Panel Survey
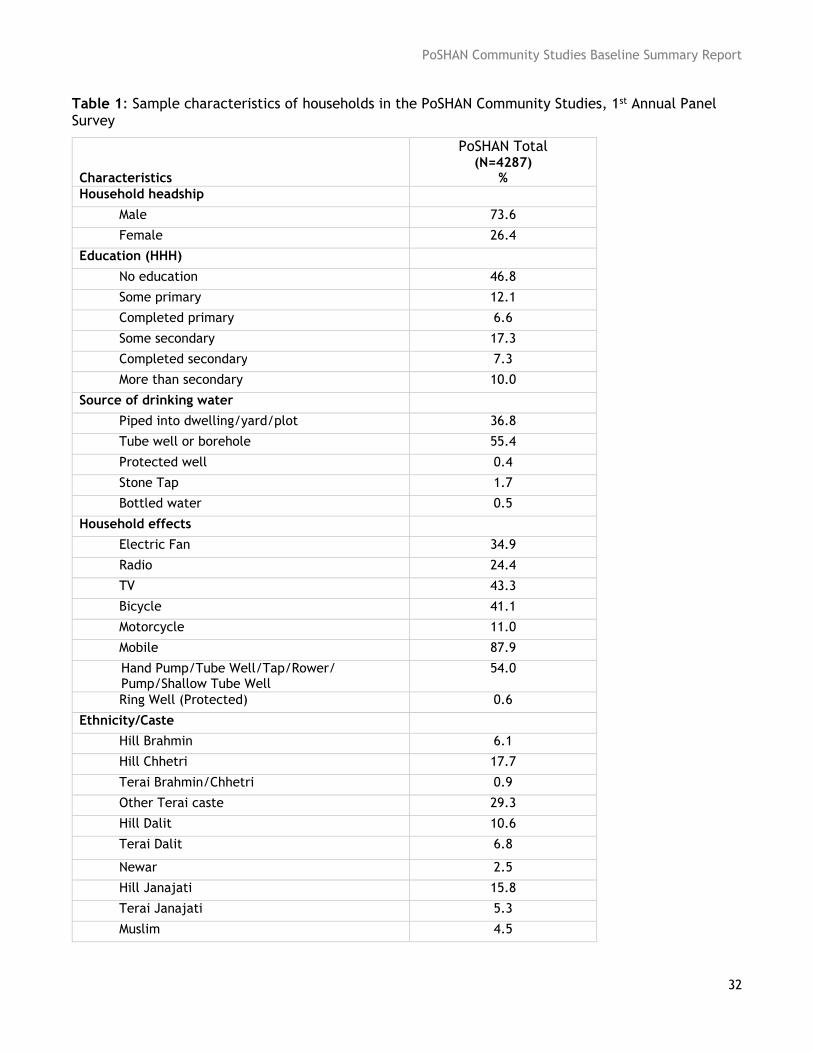
PoSHAN Community Studies Baseline Summary Report
32
Table 1: Sample characteristics of households in the PoSHAN Community Studies, 1st Annual Panel Survey
Characteristics
PoSHAN Total (N=4287)
% Household headship
Male 73.6
Female 26.4
Education (HHH)
No education 46.8
Some primary 12.1
Completed primary 6.6
Some secondary 17.3
Completed secondary 7.3
More than secondary 10.0
Source of drinking water
Piped into dwelling/yard/plot 36.8
Tube well or borehole 55.4
Protected well 0.4
Stone Tap 1.7
Bottled water 0.5
Household effects
Electric Fan 34.9
Radio 24.4
TV 43.3
Bicycle 41.1
Motorcycle 11.0
Mobile 87.9
Hand Pump/Tube Well/Tap/Rower/ Pump/Shallow Tube Well
54.0
Ring Well (Protected) 0.6
Ethnicity/Caste
Hill Brahmin 6.1
Hill Chhetri 17.7
Terai Brahmin/Chhetri 0.9
Other Terai caste 29.3
Hill Dalit 10.6
Terai Dalit 6.8
Newar 2.5
Hill Janajati 15.8
Terai Janajati 5.3
Muslim 4.5

PoSHAN Community Studies Baseline Summary Report
33
Other 0.6
Main Occupation of Women
Not working 0.1
Retired 0
Student 1.2
Non-earning occupation(ex: housewife/FCHV) 64.3
Wage employment 5.5
Business/trader/self-employment 7.0
Salaried worker 3.3
Agriculture/Livestock/Poultry/Aquaculture 18.6
Other 0
Main Occupation of Head of HH
Not working 2.4
Retired 0.7
Student 0.4
Non-earning occupation 11.4
Wage employment 18.2
Business/trader/self-employment 20.8
Salaried worker 9.8
Agriculture/Livestock/Poultry/Aquaculture 35.7
Other 0.6
Table 2: Sample characteristics of PoSHAN Community Studies Sample, by agro ecological zone
Mountains Hills Terai PoSHAN Total
No. Households (N) 793 1127 2367 4287
No. of Women (N) 788 1176 2545 4509
Household size, Mean (SD) 5.0 (1.9) 4.9 (2.0) 6.3 (2.8) 5.7 (2.6)
No. of Children <5 years (N) 947 1276 3178 5401
Table 3: Age and sex of children under-five, by agro ecological zone
Mountains N (%)
Hills N (%)
Terai N (%)
PoSHAN Total N (%)
Age of children
0-5.9 m 83 (8.8%) 116 (9.1%) 259 (8.2%) 458 (8.5%)
6-11.9 m 77(8.1%) 142(11.1%) 338(10.6%) 557(10.3%)
12-23.9 m 160(16.9%) 265 (20.8%) 643(20.2%) 1068(19.8%)
24-59.9 m 627(66.2%) 753 (59.0%) 1938 (61.0%) 3318(61.4%)
Sex of children
Male 500 (52.8%) 677 (53.1%) 1670 (52.6%) 2847 (52.7%)
Female 447(47.2%) 599(46.9%) 1508(47.5%) 2554 (47.3%)

PoSHAN Community Studies Baseline Summary Report
34
Individual Characteristics: Women
Nutritional Status Overall, underweight prevalence amongst women (defined by BMI < 18.5 kg/m2 in non-pregnant women) [11] was 27%. Underweight prevalence was concentrated in the terai, where nearly 40% of women (37%) had a BMI<18.5 (Figure 2). A similar pattern was seen with short stature (defined as height<145 cm), with 14% of women in the terai falling below this cutoff (Table 4). Overall overweight (defined by BMI > 25 kg/m2 in non-pregnant women) prevalence was low (<11%) across all agro ecological zones, but slightly higher in the hill zone relative to mountains and terai. Little variation was seen in mean MUAC (SD) measurements across the zones however differences were noted in the prevalence of low MUAC (<22.5 cm) between pregnant and non-pregnant women overall (35% versus 25%, respectively) and further, a higher prevalence of women with low MUAC being concentrated in the terai (30%) (Table 5).
Anemia prevalence among non-pregnant women was high at 53.5% overall and highest amongst women in the terai at 66%, relative to the mountains (42%) and hills (36%). A similar pattern was evident amongst pregnant women, with those in the terai exhibiting the highest prevalence of anemia with 64% and 32% of women mildly or moderately anemic (Table 6). Anemia cutoffs were determined using the WHO classifications for mild, moderate and severe anemia in pregnant and non-pregnant women and all values were altitude adjusted [12].
Figure 2: Prevalence of underweight, overweight and obesity in non-pregnant women of reproductive age, by agro ecological zone.
0
5
10
15
20
25
30
35
40
N=710 N=1075 N=2190
Mountains Hills Terai
%
Underweight (<18.5) Overweight (25-29.9) Obese (>30)

PoSHAN Community Studies Baseline Summary Report
35
Table 4: Prevalence of short stature in women of reproductive age, by agro ecological zone
Mountains (N=780)
Hills (N= 1174)
Terai (N=2537)
PoSHAN Total (N=4491)
Short stature* (<145 cm) 6.9 8.7 14.3 11.6 * Percent
Table 5: Prevalence of low Mid Upper Arm Circumference (MUAC) and Mean (SD) MUAC in women reproductive age, by agro ecological zone and by pregnancy status
Mountains Mean (SD)
Hills Mean (SD)
Terai Mean (SD)
PoSHAN Total Mean (SD)
All women* (N=4499) 24.2(2.6) 24.8(2.7) 24.0(2.7) 24.2(2.7)
% Low MUAC (< 22.5 cm) 26.7 18.2 30.0 26.4
Non-pregnant* (N=3964) 24.3(2.7) 24.8(2.7) 24.2(2.7) 24.4(2.7)
% Low MUAC (< 22.5 cm) 25.9 18.0 28.7 25.3
Pregnant* (N=515) 23.4(1.8) 24.2(2.2) 23.1(2.1) 23.2(2.1)
% Low MUAC (< 22.5 cm) 34.8 21.2 38.6 34.8
Lactating* (N=2849) 24.0(2.5) 24.5(2.6) 23.8(2.6) 24.0(2.6) *Unadjusted Mean (SD)
Table 6: Mean (SD) hemoglobin levels and anemia prevalence in pregnant and non-pregnant women, by agro ecological zone
Non-Pregnant
Mountains (N=163)
Hills (N= 246)
Terai (N= 478)
PoSHAN Total (N=887)
Mean (SD) hemoglobin*, g/dl 12.2(1.5) 12.3(1.5) 11.4(1.3) 11.7(1.5)
Anemia (%)
Any (<12.0 g/dl) 42.1 35.9 66.4 53.5
Mild (11.0- 11.9 g/dl) 22.7 17.5 30.5 25.5
Moderate (8.0 -10.9 g/dl) 18.4 17.5 34.5 26.8
Severe (<8.0 g/dl) 1.2 0.8 1.1 1.0
Pregnant
Mountains (N=19)
Hills (N=25)
Terai (N=76)
PoSHAN Total (N=120)
Mean (SD) hemoglobin*, g/dl 11.0(1.4) 11.0(1.5) 10.4(1.2) 10.6(1.3)
Anemia (%)
Any (<11.0 g/dl) 52.6 48.0 64.5 59.2
Mild (10.0- 10.9 g/dl) 31.6 28 32.9 31.7
Moderate (7.0 -9.9 g/dl) 21.1 20 31.6 27.5
Severe (<7.0 g/dl) 0 0 0 0 * Unadjusted Mean (SD) in a 23% subsample of non-pregnant and pregnant women selected for hemoglobin assessments

PoSHAN Community Studies Baseline Summary Report
36
Dietary Intake and Patterns The Woman’s Dietary Diversity Score (WDDS) was computed for each woman based on her
consumption of 8 food groups obtained from a 49-item weekly food frequency questionnaire (Table 7). This score was adapted from FAO’s 9 food group dietary diversity score [13]. The mean (SD) WDDS was 5.7 (1.4). Women in the terai reported the highest mean (SD) WDDS at 5.9 (1.4) but WDDS across the zones were not significantly different (Table 8).
Virtually all women in our sample consumed starch staples with an average staple consumption of 31.9 times/week (~4.5 times per day) and legume consumption of 10.5 times/week (~2 times/day). Legumes were consumed by a high proportion of women regardless of zonal residence (> 90%) or pregnancy status. However, differences in frequency of legume consumption across zones were noted with the highest frequency of mean intake in the mountains (12.0). The diet of almost all women, regardless of their zonal residence, relied heavily on starch staples, legumes, fruits & vegetables. Poorer women’s diets comprised of lesser amounts of lentils compared to richer women (median no. of time legumes were consumed: 7 versus 14 in poor vs. rich women, respectively) (Figure 3).
Overall weekly consumption frequency of animal source foods such as dairy, eggs, meat, fish and eggs was low and varied by agro ecological zone, with the lowest consumption of these foods among women in the terai with the exception of dairy foods (Table 8). Egg consumption in the terai was very low (0.5 times/week), and even in the other zones, only ~35% of women consumed any egg in the previous week. To provide greater detail, flesh foods were broken down into meat & poultry and fish in Table 8. Mean (SD) weekly frequency of meat & poultry consumption was highest in the hills at 2.2 times/week. Slightly more than half of women in the terai had consumed any meat & poultry in the week prior to the survey and approximately less than a quarter (23%) consumed fish in the previous 7 days.
Consumption of micronutrient rich foods such as DGLV and VA-rich fruits & vegetables (ripe mangoes & jackfruits, papayas, carrots, etc.) varied among the agro ecological zones. DGLV intake overall, as well as frequency of intake of DGLV, was highest among women in mountain areas (83% and 4.4 times/week, respectively). The terai had the lowest mean frequency of intake of DGLV (2.8). For VA–rich foods on the other hand, dietary patterns revealed the terai to have both the highest prevalence of intake (69%) and the highest mean frequency (4.1) of weekly intake.
Intake of other fruits and vegetables was highest in the terai, followed by the hills and mountains (97%, 88%, 78%) with the hills having the highest mean (SD) frequency of intake at 13.8 (11.2). Socio economic status plays a role in the composition of women’s diets, with the predominant food item in the diet of those of lower socioeconomic status diet being staple foods, with limited to no consumption of meat and VA-rich foods and vegetables (Figure 3).
WDDS between pregnant and non-pregnant women showed that while the proportion of women consuming each of the food groups was similar, a significantly greater proportion of pregnant women consumed other Vitamin A fruits and vegetables and dairy (93.2 % vs 90 % and 65% vs. 58% in pregnant vs. non-pregnant, respectively. It was noted that a significantly higher proportion of non-pregnant women (28% vs. 23% of non-pregnant women, respectively) consumed egg over the past 7 days. There were no significant differences in the frequency of intake of foods consumed between pregnant and non-pregnant women with the exception of other Vitamin A rich fruits and vegetables, which pregnant women, on average, consumed more often (4.5 vs. 2.9 in pregnant vs. non-pregnant women, respectively).

PoSHAN Community Studies Baseline Summary Report
37
Table 7: Food group categorization for women’s dietary diversity score
Food Group Food Items
Starchy Staples Rice, Corn, Wheat, Buckwheat, Millet and Potato
Dark green leafy vegetables (DGLV)
Dark green leafy vegetables (DGLV)
Other Vitamin A rich fruits and vegetables
DGLV, Carrots, Ripe Pumpkin, Drumstick, Ripe Mango, Ripe Jackfruit and Ripe Papaya
Other fruits and vegetables Green beans, Gundruk², Green peas, Gourd, Okra/Ladies finger/Bhindi, Eggplant, Tomato, Cauliflower, Cabbage, Green Jackfruit, Guava, Orange/Tangerine, Apple, Pineapple and Banana
Flesh Foods (meat, fish, poultry) Chicken/duck, Goat, Buff, Pork, fresh fish, dried fish and snail
Eggs Any eggs
Dairy (milk and milk products) Milk and Curd/Whey
Legume, nuts and seeds Lentils (any), Maseura¹, Other legumes (chickpeas, dried peas, lima beans and soy beans) and Peanuts
¹ Maseura: mixture of black lentils and vegetables ² Gundruk: mixture of sun dried green leaves
Table 8: Women’s dietary diversity score, percent and mean number of times food items were consumed in the past 7 days, by agro ecological zone
Mountains (N=787)
Hills (N=1,176)
Terai (N=2,545)
PoSHAN Total (N=4,508)
Women’s Dietary Diversity Score*
Mean (SD) Mean (SD) Mean (SD) Mean (SD)
5.3 (1.5) 5.6 (1.6) 5.9 (1.4) 5.7 (1.4) Food Group Any
Consumed (%)
Mean (SD)
Any Consumed
(%)
Mean (SD)
Any Consumed
(%)
Mean (SD)
Any Consumed
(%)
Mean (SD)
Starchy Staples 100 30.4 (8.7)
100 28.6 (7.8)
100 33.9 (8.8)
100 31.9 (8.8)
Legumes 92.9 12.0 (7.0)
93.7 9.8 (6.6)
97.8 10.4 (6.4)
95.9 10.5 (6.6)
Dairy 48.4 3.0 (5.4)
56.0 5.6 (8.4)
63.9 4.5 (5.8)
59.1 4.6 (6.6)
Eggs 35.0 1.4 (2.9)
35.2 1.2 (2.2)
20.7 0.5 (1.3)
27.0 0.8 (1.9)
Meat & Poultry 65.1 2.1 (3.4)
69.4 2.2 (3.2)
51.9 1.2 (1.8)
58.8 1.6 (2.6)
Fish 7.2 0.1 (0.6)
10.6 0.2 (1.1)
34.1 0.7 (1.4)
23.3 0.5 (1.3)
DGLV 82.9 4.4 (4.4)
74.0 3.1 (3.3)
74.5 2.8 (3.1)
75.8 3.1 (3.5)
Other fruits & vegetables
77.8 9 (9.5)
87.8 13.8 (11.2)
96.9 11.8 (8.2)
91.2 11.8 (9.5)
Other VA-rich fruits & vegetables
27.4 1.1 (2.7)
39.7 1.6 (3.2)
75.0 4.4 (5.2)
57.5 3.1 (4.6)
* Unadjusted Mean ± SD

PoSHAN Community Studies Baseline Summary Report
38
Table 9: Dietary Diversity Score distribution, percent and mean number of times women consumed food items from food groups in the past 7 days
Pregnant Non-Pregnant
Consuming Any (%)
Mean (SD)
Consuming Any (%)
Mean (SD)
Dietary Diversity Score* 5.9 (1.3) 5.7 (1.4)
Starchy Staples 100 32.6 (8.8) 100 31.8 (8.8)
Dark green leafy vegetables (DGLV)
74.3 3.1 (3.6) 76.1 3.2 (3.5)
Other Vitamin A rich fruits and vegetables
69^ 4.5^ (2.3) 56.1^ 2.9^ (4.5)
Other fruits and vegetables 93.2 12.5 (9.9) 91 11.8 (9.4)
Flesh Foods (meat, fish, poultry) 67.5 2.0 (2.6) 66 2.1 (3.0)
Eggs 22.8^ 0.8 (1.9) 27.5^ 0.8 (1.9)
Dairy (milk and milk products) 65.0^ 4.9 (6.6) 58.3^ 4.5 (6.6)
Legumes, nuts and seeds 96.9 10.3 (6.4) 95.8 10.5 (6.6) * Unadjusted Mean ± SD ^ p<0.05
Figure 3: Relative composition of maternal diet by lowest and highest wealth quintile
0 10 20 30 40 50 60 70 80
Lowest (N=879)Quintile
HighestQuintile (N = 909)
% CONSUMPTION
WEA
LTH
QU
INTIL
E
Staples Lentils Milk Eggs Meat Fish DGLV Other FV Other VA-FV

PoSHAN Community Studies Baseline Summary Report
39
Women’s morbidity Women were asked about whether they experienced a set of symptoms related to various
morbidities within the past 30 and 7 days. 7 in 10 women experienced symptoms of various morbidities in a 30-day period, whereas half of all women experienced symptoms within a 7-day period (Table 10). Women residing in the mountains appeared to have a high morbidity compared to their hill and terai counterparts, with nearly 60% of women in the mountains having experienced one of the 17 symptoms listed in Table 11, as compared to 40.6% and 45.2% in the hills and terai, respectively.
Women were asked whether they experienced depressive symptoms listed in Table 12 during the past 30 days. Similar to other morbidities, more women in the mountains experienced the symptoms asked about, with over a third feeling like they slept more and feeling sad all the time during the previous 30-day period.
Table 10: Prevalence of women’s morbidity in the past 7 and 30 days, by agro ecological zone
Table 11: Prevalence of experiencing listed symptoms in women during the past 7 days, by agro ecological zone
Mountains (N=788)
%
Hills (N=1176)
%
Terai (N=2545)
%
PoSHAN Total (N=4509)
% Convulsions 8.8 2.6 7.2 6.2 Swelling of hands/face 6.4 3.0 2.6 3.4 Severe headache 25.9 18.1 20.4 20.7 Blood in sputum 0.8 0.3 0.2 0.3 Painful/burning urination 12.8 6.6 6.6 7.7 Diarrhea 9.8 5.1 5.9 6.4 Productive cough 5.6 5.0 3.3 4.1 Rapid breathing 4.4 1.7 1.2 1.9 Grunting/wheezing 4.3 0.9 0.9 1.5 Chest in-drawing 3.2 3.2 1.9 2.4 Low-grade fever 17.5 10.0 11.8 12.3 High fever 3.1 1.4 2.7 2.4 Malaria 0.1 0 0.2 0.1 Lower abdominal pain 22.0 10.5 11.4 13.0 Nausea 11.3 5.2 5.2 6.3 Vomiting 4.1 1.6 2.9 2.8 Poor appetite 18.3 8.0 8.9 10.3
Mountains (N=788)
%
Hills (N=1176)
%
Terai (N=2545)
%
PoSHAN Total (N=4509)
% 30-day morbidity 77.2 65.3 69.1 69.5 7-day morbidity 56.9 40.6 45.2 46

PoSHAN Community Studies Baseline Summary Report
40
Table 12: Depressive symptoms experienced by women in the past 30 days, by agro ecological zone
Depressive Symptoms Mountains (N=788)
%
Hills (N=1176)
%
Terai (N=2545)
%
PoSHAN Total (N=4509)
% Sleeping more than before 38.6 23 28.5 28.8
Feeling sad all the time 35.2 16 13.6 18
Becoming more forgetful 35.3 14.7 19.1 20.8
Crying all the time 4.1 4.4 4.2 4.2
Having thoughts of hurting yourself 20.8 7.8 5.8 9
Women’s Access and Utilization of Health Services Women were asked about home visits made by health extension workers to their home as well as how often they accessed healthcare facilities over the past 12 month period to receive care for their own health and nutrition. Access to and utilization of health services at home and at health facilities over a 12-month period was then calculated for women of reproductive age (Figure 4). Home visits received by women by extension workers to address health issues, and types of health facilities women accessed for treatment of their morbidities over a 7-day period were additionally tabulated.
Overall, in the PoSHAN sample, less than 10% of women received a home visit by health extension workers (Table 15). Overall, 74% of women accessed a healthcare facility in the past 12 months with access to healthcare facilities across the mountains, hills and terai being similar (78.1%, 76%, and 71.6%, respectively). The frequency of visits by women to a healthcare facility is illustrated in Figure 4.
For the treatment of symptoms related to a variety of morbidities, pharmacies and outreach health facilities were used predominantly to seek treatment (Table 13). The majority of women did not seek treatment from any health provider for a variety of morbidities, with women in the terai having the lowest health seeking behavior from a health worker for treatment of these symptoms (Table 14). Home visits by FCHVs in the past 12 months were predominantly to provide antenatal and postnatal services (42% and 31% overall, respectively). Reasons women accessed healthcare facilities and/or were visited at home were varied across zones (Table 16).
Receipt of Health Services among Pregnant Women Questions about antenatal and postnatal care were asked to women who were pregnant during the past 12 months. The major indicators calculated were the receipt and intake of iron-folic acid and deworming pills, as well as whether key antenatal services such as blood pressure, a blood sample, a urine sample, and weight measurements were taken from the women during their pregnancy by a health worker.
Among women who were pregnant in the past 12 months, 82% received iron-folate supplementation, and 82% of those who received the supplement consumed all of the supplementation provided to them (Table 17). Both receipt and intake of iron-folate pills was lower in the mountains. Approximately 70% of all women received deworming pills and 90% of those who received them took them. Prevalence of women receiving deworming pills in the mountains and hills was similar (64%) but higher in the terai (75%). Receipt of Vitamin A supplementation in pregnant women was 49%, 51% and 43% in the mountains, hills, and terai, respectively. The prevalence of women who received a tetanus injection whilst pregnant was highly varied across the agro ecological
PoSHAN Community Studies Baseline Summary Report
41
zones with 69%, 77%, and 86% of women being injected in the mountains, hills, and terai, respectively. Standard prenatal services for pregnant women were noted to be low in the mountains (Table 17).
Figure 4: Frequency of health facility visits by women in the past 12 months, by agro ecological zone
0
5
10
15
20
25
30
35
40
45
50
None 1 visit 2-3 visits 4-9 visits >=10 visits
%
NO. OF VISITS
Mountains (N=769) Hills (N=1170) Terai (N=2539)

PoSHAN Community Studies Baseline Summary Report
42
Table 13: Health facilities accessed for treatment of select morbidities experienced by women in the past 7 days
Home %
Someone Else’s Home
%
Outreach Health Facility
%
Pharmacy %
Hospital %
Other %
Convulsions (N=239) 4.6 2.1 18.0 50.2 19.3 5.9 Swelling of hands/face (N=92) 2.2 3.3 26.1 34.8 26.1 7.6 Severe headache (N=607) 8.6 4.5 15.7 53.7 14.0 3.6 Blood in sputum (N=10) 10.0 20.0 30.0 40.0 0 0 Painful/burning urination (N=141) 6.4 0.7 20.6 42.6 28.4 1.4 Diarrhea (N=230) 10.9 3.9 24.4 52.6 7.0 1.3 Blood in stool (N=44) 9.1 4.6 18.2 56.8 11.4 0 Acute respiratory infection (N=144) 4.2 2.1 22.5 50 18.3 2.8 Low-grade fever (N=499) 8.2 2 18.3 61 7.9 2.6 High fever (N=223) 7.7 2.7 20.3 55 7.2 7.2 Malaria (N=13) 7.7 0 23.1 53.9 7.7 7.7 Lower abdominal pain (N=204) 5.4 2.0 24.5 38.7 24.1 4.9 Nausea (N=68) 8.8 2.9 27.9 41.2 14.7 4.4 Vomiting (N=53) 13.2 1.9 20.8 45.3 11.3 7.6 Poor appetite (N=112) 6.3 3.6 22.3 50.0 13.4 4.5

PoSHAN Community Studies Baseline Summary Report
43
Table 14: Persons first sought by women for treatment of select morbidities among those women who experienced morbidities in the past 7 days, by agro ecological zone
Mountains Hills Terai Convulsions
(N=115)
%
Loose watery stools, ≥4x/day (N=146)
%
ARI (N=115)
%
High Fever (N=57)
%
Convulsions (N=72)
%
Loose watery stools, ≥4x/day (N=146)
%
ARI (N=168)
%
High Fever (N=48)
%
Convulsions (N=330)
%
Loose watery stools, ≥4x/day (N=309)
%
ARI (N=261)
%
High Fever
(N=202)
%
Did not seek treatment
66.1 67.1 77.4 56.1 66.7 69.2 79.8 45.8 46.7 55.7 68.2 14.9
Relative/ Friend
0.9 2.1 0.0 0.0 0.0 2.1 0.6 0.0 0.3 2.6 0.0 1.0
Traditional healer/ Shaman
0.9 0.0 0.9 0.0 4.2 0.7 0.0 2.1 0.6 0.0 0.4 0.5
FCHV 0.0 0 0.0 3.5 0.0 4.1 0.6 2.1 0.0 0.3 0.0 0.0
Other govt. health worker
6.1 9.6 6.1 7.0 12.5 14.4 8.3 33.3 10.6 9.1 5.0 9.4
NGO health worker
0.0 1.4 0.0 0.0 0.0 0.0 0.0 2.1 0.0 0.0 0.0 0.0
Pharmacist/ Village doctor
19.0 19.9 9.6 28.1 12.5 8.9 7.7 12.5 30.6 30.1 21.5 61.4
Doctor/ MBBS 11.0 0.0 6.1 5.3 4.2 0.7 3.0 2.1 10.9 2.3 5.0 12.9
Don’t know 0.0 0.0 0.0 0.0 0.0 0.0 0.0 0.0 0.3 0.0 0.0 0.0

PoSHAN Community Studies Baseline Summary Report
44
Table 15: Home visits by shamans and extension workers in the past 12 months to address women’s health, by agro ecological zone
Mountains (N=788)
%
Hills (N=1176)
%
Terai (N=2545)
%
PoSHAN Total (N=3765)
% Shaman 17.5 18.4 15.8 16.5
FCHV 5.1 7.1 9.3 8
Other government health workers (Maternal Child Health Worker/Village Health Worker, Health Assistant, Nurse/Midwife)
2.4 1.2 1.1 1.3
NGO health worker 0.3 0.3 3 1.8
Doctor/ Pharmacist 1.1 0.7 8.1 5
Table 16: Reasons for home visits by healthcare workers to women and by women to healthcare facilities in the past 12 months, by agro ecological zone
Among those visited by Shaman/Traditional healer: reason for visiting
Mountain N=124
%
Hills N=217
%
Terai N=403
%
PoSHAN Total N=744
%
Antenatal Care 0.0 0.0 1.0 0.5
Postnatal Care 0.0 0.0 0.7 0.4
Family Planning 0.0 0.0 0.0 0.0
WASH messaging 0.0 0.0 0.0 0.0
Group recruitment 0.0 0.0 0.0 0.0
Immunizations 0.0 0.0 0.2 0.1
Other 99.2 99.5 97.8 98.5
Don't Know 0.0 1.8 0.7 0.9
Among those visited by FCHV: reason for visiting
Mountain N=40
%
Hills N=83
%
Terai N=238
%
PoSHAN Total N=361
% Antenatal Care 30.0 32.5 46.6 41.6
Postnatal Care 35.0 51.8 23.1 31.0
Family Planning 5.0 3.6 8.8 7.2
WASH messaging 0.0 1.2 4.2 3.0
Group recruitment 0.0 0.0 2.1 1.4
Immunizations 5.0 13.3 22.7 18.6
Other 52.5 37.3 42.0 42.1
Don't Know 0.0 2.4 1.3 1.4

PoSHAN Community Studies Baseline Summary Report
45
Among those visited by other government health worker: reason for visiting
Mountain N=19
%
Hills N=14
%
Terai N=28
%
PoSHAN Total N=61
% Antenatal Care 0.0 7.1 25.0 13.1
Postnatal Care 36.8 14.3 25.0 26.2
Family Planning 5.3 7.1 3.6 4.9
WASH messaging 0.0 0.0 0.0 0.0
Group recruitment 0.0 0.0 7.1 3.3
Immunizations 0.0 7.1 0.0 1.6
Other 63.2 64.3 57.1 60.7
Among those visited by NGO health workers: reason for visiting
Mountain N=1 %
Hills N=1 %
Terai N=77
%
PoSHAN Total N=79
% Antenatal Care 0.0 0.0 58.4 57.0
Postnatal Care 0.0 0.0 24.7 24.1
Family Planning 0.0 0.0 2.6 2.5
WASH messaging 0.0 100.0 6.5 7.6
Group recruitment 0.0 0.0 0.0 0.0
Immunizations 0.0 0.0 5.2 5.1
Other 100.0 100.0 50.6 51.9
Among those visited by Doctor/Pharmacist: reason for visiting
Mountain N=9 %
Hills N=8 %
Terai N=206
%
PoSHAN Total N=223
% Antenatal Care 0.0 0.0 3.9 3.6
Postnatal Care 0.0 12.5 10.2 9.9
Family Planning 0.0 0.0 0.0 0.0
WASH messaging 0.0 0.0 0.5 0.4
Group recruitment 0.0 0.0 0.0 0.0
Immunizations 11.1 0.0 3.4 3.6
Other 100.0 87.5 89.8 90.1
Among those visited health facility: reason for visiting
Mountain N=615
%
Hills N=893
%
Terai N=1823
%
PoSHAN Total N=3331
% Antenatal Care 23.3 25.1 30.9 27.9
Postnatal Care 10.7 13.5 9.1 10.6
Family Planning 14.0 9.2 6.7 8.7
Routine Checkup 2.6 3.5 9.3 6.5

PoSHAN Community Studies Baseline Summary Report
46
Respiratory Illness 4.4 4.6 3.5 3.9
Diarrhea 7.8 7.8 7.5 7.6
Immunizations 4.7 3.9 7.2 5.9
Other 68.6 69.9 65.4 67.2
Don't Know 0.0 0.2 0.4 0.3
Table 17: Receipt of antenatal services by women who were pregnant in the past 12 months, by agro ecological zone
Mountains (N=213)
%
Hills (N=294)
%
Terai (N=665)
%
PoSHAN Total (N=665)
% Fe-FA received 71.4 82.3 86.0 82.4
Fe- FA taken all 69.7 74.4 87.6 81.5
Fe- FA taken some 19.7 20.7 6.8 12.3
Tetanus injection received 68.5 76.5 86.3 80.6
Deworming pills received 64.5 64.7 74.7 69.7
(N=136) (N=187) (N=494) (N=817)
Deworming pills taken 95.6 97.9 95.3 96.0
(N=213) (N=294) (N=665) (N=1172)
Vitamin A received 49.3 51.4 43.91 46.8
Blood pressure measured 49.3 79.6 81.8 75.3
Blood sample 33.8 58.8 49.6 49.1
Urine sample 50.7 71.1 68.3 65.8
Weight taken 57.3 76.9 84.0 77.4
Family Planning 37% of all women reported to be using some form of family planning within the previous 30
days. Rates of family planning methods were highest in the mountains at 48% (Table 18). The most commonly reported method of family planning amongst women was an IUD injectable, such as Depoprovera and Sangani.

PoSHAN Community Studies Baseline Summary Report
47
Table 18: Use of family planning methods used in the past 30 days, by agro ecological zone
Mountains (N=719)
%
Hills (N=1076)
%
Terai (N=2195)
%
PoSHAN Total (N=3991)
% Use of family planning 47.8 33.7 35.3 37.1
Type of family planning method used (N=344) %
(N=362) %
(N=775) %
(N=1481) %
Withdrawal 2.9 8 4.3 4.9
Rhythm method 0.3 0.6 1.6 1
Condom 13.1 12.4 8.3 10.4
Female sterilization 3.2 6.9 42.2 24.5
Male Sterilization 17.4 2.8 0.7 5.1
IUD injectable 47.1 47.2 30.6 38.5
Contraceptive pill/Implant (patch) 15.7 22.1 12 15.4
Emergency contraceptive pills 0.3 0 0.3 0.2
Don't know 0 0 0.3 0.1
Women and their Spouses’ Alcohol and Tobacco Use Women were asked about theirs and their partners’ smoking habits as well as their alcohol
consumption. Overall, the prevalence of women smoking was low and the highest prevalence of women smoking was in the mountains (13%). A third of all women were exposed to second hand smoke via their husbands (those who actually lived in the same household as their wives) and again, it was seen that men in the mountains had a higher prevalence of cigarette smoking. Close to half of the female respondents’ partners drank alcohol (48%) but amongst women only 8% of women reported consuming alcohol (Table 19).
Table 19: Smoking, tobacco use, and alcohol consumption amongst women and their partners in the PoSHAN sample
Women Women’s Husbands
Mountains (N=788)
%
Hills (N=1176)
%
Terai (N=2545)
%
PoSHAN Total
(N=4509) %
Mountains (N=621)
%
Hills (N=635)
%
Terai (N=1723)
%
PoSHAN Total
(N=2979) %
Cigarettes 12.8 4.9 0.9 4.0 36.6 28.8 31.6 32.1 Beedi 4.8 4.8 1.4 2.9 7.6 8.0 9.1 8.6 Hookah 0.4 0 0.2 0.2 0.3 0.3 0.2 0.2 Pipe 0.3 0 0.1 0.1 0.5 0.5 0.8 0.6 Chew tobacco
3.3 3.7 3.1 3.3
Chew paan 0 0 2.0 1.1 Alcohol 10.9 18.8 2.2 8.1 51.7 54.3 44.2 47.9

PoSHAN Community Studies Baseline Summary Report
48
Women’s Knowledge on Health and Nutrition Women were asked various questions pertaining to knowledge of appropriate health and
nutrition behaviors for both optimal maternal and child health and nutrition. All women, with and without young children, were asked these questions.
Table 20 presents the proportion of women who described each of the listed health/nutrition practices as being appropriate. Maternal knowledge of health and nutrition messages was varied and inconsistent across the agro ecological zones. For maternal health and nutrition, 88% of all women knew to use iodized salt all the time, but only a third of women knew that mosquito nets should be used by pregnant women to prevent malaria. The proportion of women knowing that food intake should increase during pregnancy was approximately 84% in both the hills and mountains, but only 68% in the terai, representing on the main knowledge gaps in the terai. However, overall, more knowledge gaps related to maternal health and nutrition were seen in the mountains (Table 20).
Table 21 presents data on women’s knowledge of child health and nutrition by agro ecological zone. Overall, 62% of women knew that children needed to be exclusively breastfed for the first 6 months of their lives. This knowledge was lower in the terai, with only 50% of women aware of the duration of exclusive breastfeeding. Only 11% and 20% of women overall thought feeding children >6 month of age eggs and fish/meat, respectively, was appropriate. With regard to appropriate treatment of diarrhea in children, knowledge varied across the agro ecological zones, with less than 50% of women knowing how to appropriately treat diarrhea in the mountains and hills, as compared to 72% in the terai. Overall, knowledge of instances when it is appropriate to wash hands was low; however, 90% of women reported “after going to the toilet” as an activity after which hands must be washed with soap and water.
Table 20: Women’s knowledge on maternal health and nutrition, by agro ecological zone
Mountains (N=788)
%
Hills (N=1176)
%
Terai (N=2541)
%
PoSHAN Total
(N=4505) %
Appropriate use of iodized salt 82.2 86.5 91 88
Reasons pregnant women should use a mosquito bed net 11.6 20.3 41.7 30.9
Eating up during pregnancy 83.9 84.9 67.7 75.0
Reasons to take deworming pills during pregnancy 46.7 40.0 50.4 47.0
Reasons to take IFA pills during pregnancy
Prevent neural tube defects 2.7 4.3 5.1 4.5
Promotes mother and baby's health 50 60 70.2 64
Prevents anemia/makes mother’s blood healthy 47.7 51.8 29.9 38.7
Reasons to consume Vitamin A rich foods for pregnant and postpartum mothers
Promotes mother and baby’s health 70.2 79.5 71.1 73.1
To maintain adequate levels of Vitamin A in breast milk 16.4 29.5 20.2 19.0
Appropriate time-interval between pregnancies 14.5 11.9 26.8 20.8
* Difference in n’s +/- ≤ 2%

PoSHAN Community Studies Baseline Summary Report
49
Table 21: Proportion of women with appropriate knowledge on child health and nutrition, by agro ecological zone
Mountains (N=788)
%
Hills (N=1176)
%
Terai (N=2545)
%
PoSHAN Total (N=4509)
% Exclusive breastfeeding for 6 months 72.3 76.3 52.4 62.1
Appropriate treatment of child diarrhea
With zinc tablets 11.2 11.9 3.8 7.2
With Antibiotics 2.2 0.8 8.5 5.4
With Anti-diarrheal medication 36.4 35.8 59.3 49.2
Appropriate complementary foods to introduce at 6 months
Yellow fruits and vegetables 41 46.9 38.7 41.3
Dark green leafy vegetables 31 28.9 32.2 31.1
Egg 22.5 11.2 7.9 11.3
Dahl or beans 62.9 72.7 64.4 66.3
Fish or meat 32.9 19.3 16.9 20.3
Appropriate foods for a > 6 mos child with diarrhea
Breast milk 96.3 95.2 95.1 95.3
Other fluids 96.2 95.2 85.3 89.8
Sold/semi-solid foods 94.2 91 81.3 86
ORS 98.7 97.3 97.1 97.4
Appropriate times for hand washing
Before cooking 19.7 18.7 12.9 15.6
Before eating 57.2 57 27.2 40.2
Before feeding the child 10.3 14 12.9 12.7
After going to the toilet 86.4 89.2 92.1 90.3
After cleaning a child who has defecated 28.9 32.3 55.1 44.6
After handling chicken, cow, duck or other animal feces 36.4 61.3 55.3 53.5
* Difference in n’s +/- ≤ 2%

PoSHAN Community Studies Baseline Summary Report
50
Women’s Employment and Decision-Making Overall, a quarter of women in the PoSHAN sample reported participating in paid work. Across
zones, paid work was reported by 42%, 27%, and 19% of women in the mountains, hills, and terai, respectively (Table 22). When examining women’s decision-making power (either complete control or partial control) for activities related to the household and family, it was noted that the majority of women, 92% overall, had control over what to feed their children. Besides this activity, there was high variability across agro ecological zones in terms of what decisions women had control over. Only if the women had the option of making a decision about an activity (i.e. the household engaged in the activity enquired after) were the women included in this analysis.
Decision-making control as it related to a women’s own health and nutrition issues were revealed to be 73% in the terai, 81% in the mountains, and 89% in the hills. Overall, approximately 86% of women made decisions about family planning (Table 23). Women partook in joint decision making, with their husband and/or some other household member, as it related to their own health and nutrition as well, with 23%, 19% and 24% of women doing this in the mountains, hills and terai, respectively.
Agriculture-related decision-making power for women was generally low. Less than a quarter of women had sole decision-making for what agricultural products were grown by the household in the mountains and hills, and only 6.7% of women made this decision autonomously in the terai. 15.1%, 13.9%, and 11.1% of women in the mountains, hills, and terai, respectively, made this decision jointly with their spouse or some other household member. Overall, women in the terai had the least decision-making power when it came to what agricultural products household should produce, livestock raising, poultry raising, and selling crops to the market (Figure 5).
Table 22: Women’s employment, by agro ecological zone
Mountains (N=788)
%
Hills (N=1176)
%
Terai (N=2545)
%
PoSHAN Total (N=4509)
% No other work 58.5 73.5 80.8 74.96
Paid cash/ in-kind for work 41.5 26.5 19.3 25.02

PoSHAN Community Studies Baseline Summary Report
51
Table 23: Women’s involvement in household-related decision-making, by agro ecological zone
Household-related activities Mountains (N=788)
Hills (N=1176)
Terai (N=2545)
PoSHAN Total (N=4509)
Taking crops to the market N=246 N=445 N=1293 N=4509 % 55.3 46.3 23.7 70.4 Major durable household expenditures N=586 N=1060 N=2200 N=4509 % 50.3 46.7 31.8 47.6 Non-farm business activity N=617 N=909 N=1850 N=4509 % 51.1 42.5 25.7 51.3 Own health and nutrition N=788 N=1173 N=2540 N=4509 % 81.4 89.4 73.2 78.9 Livestock raising N=411 N=789 N=1943 N=4509 % 56.5 51.2 35.6 60 Poultry raising (chicken, duck, pigeons) N=323 N=733 N=1054 N=4509 % 63.8 53.9 40.3 76.1 Use of family planning products N=600 N=912 N=1838 N=4509 % 89 89 81.9 89.1 Personal wages or salary N=787 N=1170 N=2544 N=4509 % 34.6 22.1 15.9 95.9 Attend community group meetings N=619 N=986 N=1858 N=4509 % 63.8 52.8 40.4 60.3 Agricultural production N=518 N=868 N=1741 N=4509 % 60.8 50.6 26 57.5 To go to your mother's or friend's house N=779 N=1174 N=2526 N=4509 % 67.4 63 42.9 52.7 Daily household expenditures N=787 N=1175 N=2537 N=4509 % 63.3 59.3 41.3 50 Children’s health care N=742 N=1087 N=2362 N=4509 % 91.9 91.3 83.5 88 Feeding children N=741 N=1083 N=2360 N=4509 % 93.7 91.2 90.3 91.9

PoSHAN Community Studies Baseline Summary Report
52
Figure 5: Women’s lack of decision-making power, by agro ecological zone
0
10
20
30
40
50
60
70%
HOUSEHOLD RELATED ACTIVITIES
Mountains (n=788) Hills (n=1176) Terai (n=2545)

PoSHAN Community Studies Baseline Summary Report
53
Individual Characteristics: Children Under-five
Nutritional Status
Definitions for undernutrition (used to define stunting, wasting, and underweight in children under 5 years) were based on the WHO Child Growth Standards [14].
Stunting prevalence was high and did not differ significantly by agro ecological zone, with estimates of 37.1%, 36.2% and 34.8% in the mountains, hills, and terai, respectively (Table 24). By age, stunting was most prevalent in the 2-4 years age group, with a higher prevalence found among girls (43.1 %) compared to boys (40.2%). Stunting prevalence increased with age in both boys and girls, peaking at >40% among children over two years of age (Table 25). Wasting malnutrition was highest in both girls (21.6%) and boys (28.1%) between the ages of 12-23 months (Table 25). Moreover, overall wasting prevalence was 23.3% in the terai, 2-2.5 times higher than rates in the hills and mountains (Table 23). Underweight prevalence was 34% overall, with the highest prevalence found among children living in the terai, 39%, as compared to 26% in the mountains and 29% in the hills. Both severe and moderate acute malnutrition was less than 5% overall across the sample (Table 24).
The prevalence of anemia in children under-five exceeded 50% in all three agro ecological zones, with the highest prevalence, >70%, among children in the terai (Figure 6). Anemia prevalence was lowest in the hills, yet still alarmingly high at 50.8%.
Table 24: Under-five children nutritional status, by agro ecological zone
Indicator Mountains (N=932)
Hills (N=1264)
Terai (N=3111)
PoSHAN Total (N=5307)
Height-for-Age z-scores*, Mean (SD) -1.5 ± 1.4 -1.5 ± 1.4 -1.5 ± 1.4 -1.5 ± 1.4 % <-2 SD (Stunting)† 37.1 36.2 34.8 35.5 % <-2 to ≥-3 SD (moderate) 24.3 25.2 22.7 23.8 % <-3 SD (severe) 12.9 11 12.0 11.7 N=929 N=1266 N=3107 N=5302 Weight-for-height z-score*, Mean (SD) -0.6 ± 1.1 -0.7 ± 1.1 -1.3 ± 1.0 -1.0 ± 1.1 % <-2 SD (Wasting)§ 8.3 10.8 23.3 17.0 % <-2 to ≥-3 SD (moderate) 6.1 9.1 18.5 13.7 % <-3 SD (severe) 2.2 1.7 4.8 3.3 N=935 N=1268 N=3145 N=5348 Weight-for-age z-scores*, Mean (SD) -1.3 ± 1.1 -1.3 ±1.2 -1.7 ±1.1 -1.6 ± 1.2 % <-2 SD (Underweight) § 26.0 29.1 39.1 34.0 % <-2 to ≥-3 SD (moderate) 20.9 22.5 27.0 24.7 % <-3 SD (severe) 5.1 6.6 12.1 9.4 N=849 N=1153 N=2883 N=4885 MUAC (cm)*, Mean (SD) 14.4 ± 1.2 14.5 ± 1.3 14.2 ± 1.2 14.3± 1.2 MUAC-for-age z-scores*, Mean (SD) -1.0 ± 1.0 -0.8 ± 1.0 -1.0 ± 0.9 -1.0 ±1.0 % <11.5cm (SAM)† 0.9 0.5 1.1 1.0 % <12.5cm and ≥11.5cm (MAM) ‡ 5.0 3.0 4.8 4.4
* Mean ± SD † p-value > 0.05 ‡ p-value <0.05 § p-value < 0.001

PoSHAN Community Studies Baseline Summary Report
54
Table 25: Undernutrition status in under-five children by sex and age in the PoSHAN sample
*Unadjusted Mean ± SD
Indicators
Male Female Age Category (months)
0-5.9 6-11.9 12-23.9 24-59 PoSHAN Total
0-5.9 6-11.9 12-23.9 24-59 PoSHAN Total
Anthropometry N=244 N=296 N=547 N=1711 N=2798 N=210 N=260 N=505 N=1534 N=2509 Height-for-Age z-scores *
-0.1 ± 1.4 -0.9 ± 1.4 -1.6 ± 1.4 -1.7 ± 1.3 -1.4 ± 1.4 -0.2 ± 1.4 -0.8 ± 1.3
-1.5 ± 1.2 -1.8 ± 1.3 -1.5 ± 1.4
% <-2 SD (Stunting) 10.3 19.6 39.9 40.2 35.4 10 17.7 33.1 43.1 35.7 % <-2 to ≥ -3 SD (moderate)
8.2 15.2 26.1 26 23.3 8.1 13.1 24.4 27.6 23.8
% <-3 SD (severe) 2.1 4.4 13.7 14.2 12 1.9 4.6 8.7 15.5 11.8 Weight-for-height z-score *
-0.5 ± 1.3 -1.3 ± 1.1 -1.3 ± 1.1 -1.0 ± 1.0 -1.0 ±1.1 -0.7 ± 1.4 -1.1 ± 1.2
-1.3 ± 1.0 -1.0 ± 0.9 -1.0 ± 1.0
% <-2 SD (Wasting) 11.1 25.8 28.1 14.6 18.1 19.7 22.4 24 13.6 17.1 %<-2 to ≥-3 SD (moderate)
9.1 20 21.4 12.2 14.5 12 14.3 19.5 11.8 13.6
% <-3 SD (severe) 2.1 5.8 6.8 2.5 3.6 7.7 8.1 4.5 1.8 3.5 Weight-for-age z-scores *
-0.5 ±1.3 -1.5 ± 1.2 -1.7 ± 1.2 -1.6 ± 1.0 -1.5 ± 1.2 -0.6 ± 1.4 -1.4 ± 1.2
-1.7 ± 1.1 -1.7 ± 1.0
-1.6 ± 1.2
% <-2 SD (Underweight)
9.4 32.8 43.2 34.9 34.1 15.6 26.4 35.6 38.4 34.7
% <-2 to ≥-3 SD (moderate)
3.7 25 30.6 26.3 25 9.9 17.6 24.4 27.9 24.6
% <-3 SD (severe) 5.7 7.8 12.7 8.7 9.1 5.7 8.8 11.2 10.5 10.1

PoSHAN Community Studies Baseline Summary Report
55
Figure 6: Prevalence of anemia status of under-five children, by agro ecological zone*
* Prevalence in a 16% subsample of children under five selected for hemoglobin assessments
Infant Feeding Practices and Under- Five Child Dietary Patterns
Feeding practices in children 0-2 years of age Exclusive breastfeeding rates were calculated among children up to 6 months of age. Overall,
exclusive breastfeeding across the PoSHAN sample was low, 47%, with the mountains, hills and terai having rates of 61.4%, 39.7%, and 45.9%, respectively (Table 26). Early initiation of breastfeeding was seen in 42% of all children 12 months or younger. Colostrum was offered to 83.5% children overall, and to 91%, 90.2%, and 79% of children in the mountains, hills, and terai, respectively. Generally, animal milk was the most commonly offered prelacteal (Table 28). Across the PoSHAN sample, the median duration for breastfeeding was 18 months (among children 36 months and younger) (Table 26). Approximately 80% of the study sample was age-appropriately breastfed. Age appropriate breastfeeding is defined by WHO as the proportion of children 0-23.9 months of age who are either < 6 months of age and exclusively breastfed, or 6-23.9 month olds who are both breastfed and consuming foods. Close to 40% of all children under 2 years of age received a breast milk substitute within the first 6 months of life, with the hills having the largest proportion of children receiving these substitutes, 45% (Table 28).
Dietary intake in children under 5 years of age Dietary intake was examined using a 51- item food frequency questionnaire. Variations in
foods eaten by children 0-2 years of age were seen across zones, with a larger proportion of children from the hills consuming grains, roots, tubers, flesh foods (defined as meat, fish, poultry, and liver/organ meats) and other fruits and vegetables. A greater proportion of children from the terai consumed legumes and nuts, dairy, and Vitamin A rich fruits and vegetables (Table 31).
0
10
20
30
40
50
60
70
80
Mountains (n=170) Hills (n=238) Terai (n=491)
%
Anemia Mild Moderate Severe

PoSHAN Community Studies Baseline Summary Report
56
In children 2-5 years of age, almost all children were consuming grains, roots and tubers, 99.7%, as well as legumes and nuts, 95.9%, in the previous 7 days; this pattern of consumption was similar across zones. Fruit and vegetable consumption (both Vitamin A rich and other types of fruits and vegetables) was highest in the terai and lowest in the mountains (Table 35). The consumption of dairy products among children 2-5 years of age was 49%, 62%, and 70% in the mountains, hills, and terai, respectively. Egg consumption in this age group was lower, with prevalence estimates of 36%, 40%, and 25% in the mountains, hills, and terai, respectively. Overall consumption of flesh foods across the zones was 64%, with similar intake across zone.
Types of animal source food consumed varied by agro ecological zones in 2-5 year olds (Figure 7). The highest proportion of 2-5 year old children consuming milk in the previous 7 days was found in the terai, 48.5%. However, the highest proportion of children consuming eggs and meat in the previous 7 days was found in the mountains, 28% and 32%, respectively. Poultry consumption in this age group was 12.5%, 28.1%, and 20.1% in the mountains, hills, and terai, respectively (Figure 7).
Table 26: Infant feeding practices among children under-five, by agro ecological zone
1 among infants 0-5.9 m of age (Mountain=83, Hills=116, Terai=259, PoSHAN Total=458) 2 among children 0-23.9 m of age (Mountain=318, Hills=523, Terai=1235, PoSHAN Total=2076) 3 among children 12-14.9 m of age (Mountains=36, Hills=57, Terai=138, PoSHAN Total=231) 4 among children 20-23.9 m of age (Mountains=66, Hills=87, Terai=239, PoSHAN Total=392) 5among children < 36m of age (Mountains: 590, Hills: 110, Terai=398, PoSHAN Total=590)
Mountains N =320
Hills N = 523
Terai N = 1240
PoSHAN Total N = 2083
n (%) n (%) n (%) n (%)
Exclusive breast feeding1 51(61.4) 46(39.7) 118(45.9) 215(47.1)
Predominant breast feeding1 51(61.4) 47(40.5) 134(52.1) 232(50.88)
Age-appropriate breast feeding2 263(82.7) 431(82.4) 965(78.1) 1659 (79.9)
Continued breast feeding at 1 year of age3 33(91.7) 54 (94.7) 131(94.9) 218 (94.4) Continued breast feeding at 2 years of age4 54(81.8) 80(91.9) 184(76.9) 318(81.1)
Fed breast-milk substitute in first 6 mos of life2
110(34.4) 236(45.1) 433(34.9) 779(37.4)
Median Duration of Breastfeeding5 20 21 18 18

PoSHAN Community Studies Baseline Summary Report
on construction of infant and young child feeding indicators
me Definition Numerator Denominator
stfeeding Proportion of children born in the past 12 m who were put to the breast within 1 hour of birth
Infants who were put to breast within 1 hour of birth
Infants 0-11.9 m
g (0-5.9 m) Proportion of infants 0-5.9 m of age who are fed exclusively with breast milk
Infants 0-5.9 months who received only breast milk during the previous week
Infants 0-5.9 m
ng at 1 Proportion of children 12-14.9 m of age who are fed breast milk
Children 12-14.9 m of age who received breast milk during the previous week
Children 12-14.9 m
emi-solid
Proportion of infants 6-7.9 m of age who received solid, semi-solid or soft foods
Children 6-7.9 m of age who received solid, semi-solid or soft foods in the previous week
Children 6-7.9 m
uacy (≥4 )
Proportion of children 6-23.9 m of age who received food from 4 or more food groups per day in the past week
Children 6-23.9 m of age who received foods from ≥4 food groups per day in the past week
Children 6-23.9 m

PoSHAN Community Studies Baseline Summary Report
58
Table 28: Breastfeeding practices in children 0-2 years of age, by agro ecological zone
Feeding Practices
Mountains N=320
Hills N=523
Terai N=1240
PoSHAN Total N=2083
n (%) n (%) n (%) n (%)
Children fed prelacteals in the first 3 days of life1 23(14.4) 67(26.1) 239(40.0) 329(32.5)
Types of prelacteals given (among children fed prelacteals)¹
Honey 1 (4.3) 10 (14.9) 63 (26.4) 74(22.5)
Plain/Sugar Water 0(0) 2(3.0) 4(1.7) 6(1.8)
Animal milk 2(8.7) 11(16.4) 138(57.7) 151(45.9)
Infant formula 10(43.5) 18(26.9) 15(6.3) 43(13.07)
Other 10(43.5) 26(38.8) 17(7.1) 55(16.7)
Types of second prelacteals given (among children fed more than one type of prelacteal)¹
Honey 1 (100) 0 6(16.7) 7 (15.6)
Plain/Sugar Water 0 0 9(25) 9(20)
Animal milk 0 0 12(33.3) 12(26.7)
Infant formula 0 1(12.5) 4(11.1) 5(11.1)
Other 0 7(87.5) 5(13.9) 12(26.7)
Child ever breastfed1 158(100) 256(100) 596(99.8) 1010 (99.9)
Breastfeeding initiation time¹
≤1 hour 77 (48.7) 111 (43.3) 235 (39.4) 423 (41.9)
1-24 hours 62(39.2) 120(46.9) 251(42.1) 433(42.9)
2 or more days 19(12.03) 25(9.8) 110(18.5) 154(15.2)
Colostrum given1 144(91.1) 231(90.2) 469 (78.6) 844(83.5) 1 among children <12 m of age

PoSHAN Community Studies Baseline Summary Report
59
Table 29: Average daily frequency of breastfeeding in the past 7 days in children 0-2 years of age, by agro ecological zone
Mountains Hills Terai PoSHAN Total
0-5.9 m 6-11.9 m 12-23.9 m 0-5.9 m 6-11.9 m 12-23.9 m 0-5.9 m 6-11.9 m 12-23.9 m 0-5.9 m 6-11.9 m 12-23.9 m
n (%) n (%) n (%) n (%) n (%) n (%) n (%) n (%) n (%) n (%) n (%) n (%)
Average daily frequency of breastfeeding in the past 7 days
None 0 0 20(12.6) 1 (0.9) 2(1.4) 19(7.2) 0 5(1.5) 97(15.1) 1(0.2) 7(1.3) 136(12.8)
1-10 times 34 (41.5) 44(57.1) 109(68.6) 51(43.9) 95(66.9) 181(68.6) 42(16.3) 110(32.6) 336(52.3) 127 (27.9) 249(44.8) 626 (58.8)
11-20 times 34 (41.5) 32(41.6) 27(16.9) 46(39.7) 28(19.7) 49(18.6) 160(62.0) 176(52.2) 159(24.8) 240(52.6) 236(42.4) 235(22.1)
21 or more 14 (17.1) 1(1.3) 3(1.9) 18 (15.5) 17(12) 15(5.7) 56(21.7) 46(13.7) 50(7.8) 88(19.3) 64(11.5) 68(6.4)
Table 30: Age and reasons for stopping breastfeeding in 0-2 year olds, by agro ecological zone
Mountains Hills Terai PoSHAN Total
0-5.9 m 6-11.9 m 12-23.9 m 0-5.9 m 6-11.9 m 12-23.9 m 0-5.9 m 6-11.9 m 12-23.9 m 0-5.9 m 6-11.9 m 12-23.9 m
Mean age (SD) in months child stopped breast feeding 13.6(5.8) 9.4(6.5) 11.8(4.9) 11.6(5.4) n (%) n (%) n (%) n (%) n (%) n (%) n (%) n (%) n (%) n (%) n (%) n (%)
Reasons for stopping breast feeding
Mother ill or weak 0 0 2(10) 0 0 2(10.5) 0 1(20) 4(4.1) 0 1(14.3) 8(5.9)
Child ill or weak 0 0 1(5) 0 0 0 0 0 0 0 0 1(0.7)
Nipple/breast problem
0 0 1(5) 0 0 1(5.3) 0 0 5 (5.2) 0 0 7(5.2)
Insufficient milk 0 0 1(5) 1(100) 0 3(15.8) 0 1(20) 11(11.3) 1(100) 1(14.3) 15(11.0)
Mother working 0 0 3(15) 0 0 1(5.3) 0 0 0 0 0 4(2.9)
Child refused 0 0 1(5) 0 2(100) 1(5.3) 0 2(40) 7(7.2) 0 4(57.1) 9(6.6)
Other reason 0 0 11(55) 0 0 11(57.9) 0 1(20) 70(72.2) 0 1(14.3) 92(67.7)
Given animal, powdered/formula in first 6 months of life
20(24.1) 33(42.9) 57(35.6) 50(43.1) 71(50) 115(43.4) 72(27.9) 137(40.5) 224(34.8) 142(31.1) 241(43.2) 396(37.1)
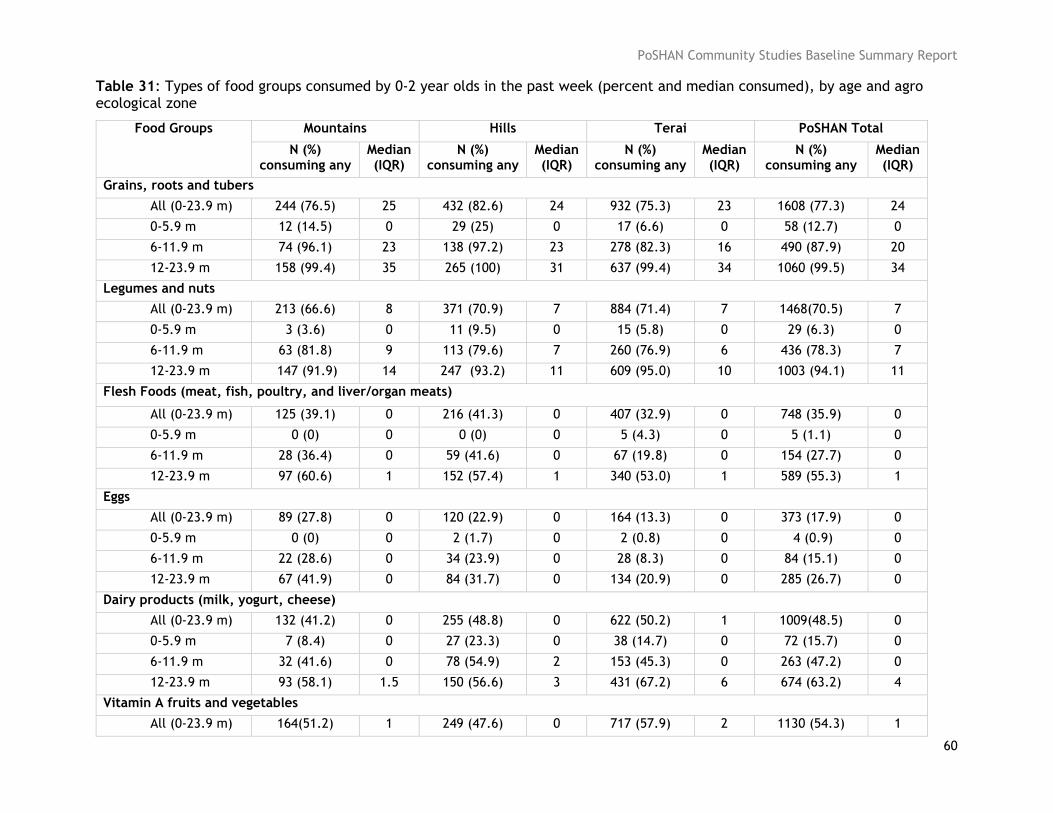
PoSHAN Community Studies Baseline Summary Report
60
Table 31: Types of food groups consumed by 0-2 year olds in the past week (percent and median consumed), by age and agro ecological zone
Food Groups Mountains Hills Terai PoSHAN Total
N (%) consuming any
Median (IQR)
N (%) consuming any
Median (IQR)
N (%) consuming any
Median (IQR)
N (%) consuming any
Median (IQR)
Grains, roots and tubers
All (0-23.9 m) 244 (76.5) 25 432 (82.6) 24 932 (75.3) 23 1608 (77.3) 24
0-5.9 m 12 (14.5) 0 29 (25) 0 17 (6.6) 0 58 (12.7) 0
6-11.9 m 74 (96.1) 23 138 (97.2) 23 278 (82.3) 16 490 (87.9) 20
12-23.9 m 158 (99.4) 35 265 (100) 31 637 (99.4) 34 1060 (99.5) 34
Legumes and nuts
All (0-23.9 m) 213 (66.6) 8 371 (70.9) 7 884 (71.4) 7 1468(70.5) 7
0-5.9 m 3 (3.6) 0 11 (9.5) 0 15 (5.8) 0 29 (6.3) 0
6-11.9 m 63 (81.8) 9 113 (79.6) 7 260 (76.9) 6 436 (78.3) 7
12-23.9 m 147 (91.9) 14 247 (93.2) 11 609 (95.0) 10 1003 (94.1) 11
Flesh Foods (meat, fish, poultry, and liver/organ meats)
All (0-23.9 m) 125 (39.1) 0 216 (41.3) 0 407 (32.9) 0 748 (35.9) 0
0-5.9 m 0 (0) 0 0 (0) 0 5 (4.3) 0 5 (1.1) 0
6-11.9 m 28 (36.4) 0 59 (41.6) 0 67 (19.8) 0 154 (27.7) 0
12-23.9 m 97 (60.6) 1 152 (57.4) 1 340 (53.0) 1 589 (55.3) 1
Eggs
All (0-23.9 m) 89 (27.8) 0 120 (22.9) 0 164 (13.3) 0 373 (17.9) 0
0-5.9 m 0 (0) 0 2 (1.7) 0 2 (0.8) 0 4 (0.9) 0
6-11.9 m 22 (28.6) 0 34 (23.9) 0 28 (8.3) 0 84 (15.1) 0
12-23.9 m 67 (41.9) 0 84 (31.7) 0 134 (20.9) 0 285 (26.7) 0
Dairy products (milk, yogurt, cheese)
All (0-23.9 m) 132 (41.2) 0 255 (48.8) 0 622 (50.2) 1 1009(48.5) 0
0-5.9 m 7 (8.4) 0 27 (23.3) 0 38 (14.7) 0 72 (15.7) 0
6-11.9 m 32 (41.6) 0 78 (54.9) 2 153 (45.3) 0 263 (47.2) 0
12-23.9 m 93 (58.1) 1.5 150 (56.6) 3 431 (67.2) 6 674 (63.2) 4
Vitamin A fruits and vegetables
All (0-23.9 m) 164(51.2) 1 249 (47.6) 0 717 (57.9) 2 1130 (54.3) 1

PoSHAN Community Studies Baseline Summary Report
61
0-5.9 m 2 (2.4) 0 6 (5.2) 0 10 (3.9) 0 18 (3.9) 0
6-11.9 m 46 (59.7) 1 60 (45.1) 0 155 (45.9) 0 261 (46.9) 0
12-23.9 m 116 (72.5) 3 183 (69.1) 3 552 (86.2) 2 851(79.9) 4
Other fruits and vegetables
All (0-23.9 m) 135 (42.3) 0 304(58.1) 2 646 (52.2) 1 1085(52.2) 1
0-5.9 m 0 (0) 0 8 (6.9) 0 3 (1.2) 0 11 (2.4) 0
6-11.9 m 30 (38.9) 0 89 (62.7) 2 112 (33.1) 0 231 (41.5) 0
12-23.9 m 105 (66.0) 3 207(78.1) 6 531 (82.8) 6 843 (79.1) 5

PoSHAN Community Studies Baseline Summary Report
62
Table 32: Percent consumption of food groups among 0-2 year olds, by age and breastfeeding status in PoSHAN sample
Food Groups Breast feeding N (%) consuming any
Non-Breastfeeding N (%) consuming any
Grains, roots and tubers
All (0-23.9 m) 1467(75.7) 141 (99.3)
0-5.9 m 57 (12.5) 1 (100)
6-11.9 m 484 (88.0) 6 (85.7)
12-23.9 m 926 (99.5) 134 (100)
Legumes and nuts
All (0-23.9 m) 1332 (68.7) 136 (95.8)
0-5.9 m 28 (6.1) 1 (100)
6-11.9 m 431 (78.4) 5 (71.4)
12-23.9 m 873 (93.7) 130 (97.0)
Flesh Foods (meat, fish, poultry, and liver/organ meats)
All (0-23.9 m) 656 (33.8) 92 (64.9)
0-5.9 m 5 (1.1) 0(0)
6-11.9 m 151 (27.5) 3 (42.9)
12-23.9 m 500 (53.7) 89(66.4)
Eggs
All (0-23.9 m) 329 (16.9) 44 (30.9)
0-5.9 m 4 (0.8) 0(0)
6-11.9 m 82 (14.9) 2 (28.6)
12-23.9 m 243 (26.1) 42 31.3)
Dairy products (milk, yogurt, cheese)
All (0-23.9 m) 895 (46.2) 114 (80.3)
0-5.9 m 71 (15.5) 1(100)
6-11.9 m 258 (46.9) 5 (71.4)
12-23.9 m 566 (60.7) 108 (80.6)
Vitamin A rich fruits and vegetables
All (0-23.9 m)l 1010 (52.1) 120 (84.5)
0-5.9 m 17 (3.7) 1(100)
6-11.9 m 257 (46.7) 4 (57.1)
12-23.9 m 736 (79.1) 115 (85.8)
Other fruits and vegetables
All (0-23.9 m) 970(50.0) 115(80.9)
0-5.9 m 10 (2.2) 1 (100)
6-11.9 m 229 (41.6) 2 (28.6)
12-23.9 m 731 (78.5) 112 (83.5)

PoSHAN Community Studies Baseline Summary Report
63
Table 33: Average breastfeeding frequency in the past 7 days in 2-5 year olds, by age and agro ecological zone.
Mountains Mean (SD)
Hills Mean (SD)
24-35.9m 36-47.9 48-59.9 m
All 24-35.9m 36-47.9 48-59.9 m All
None 68 (37.2) 169 (76.5)
205 (91.9)
442 (70.5) 91 (39.1) 194 (69.8)
219 (90.5) 504 (66.9)
1-10 times 94 (51.4) 43 (19.5) 15 (6.7) 152 (24.2) 117 (50.2)
79 (28.4) 18 (7.4) 214 (28.4)
11-20 times
16 (8.7) 6 (2.7) 3 (1.4) 25 (3.9) 18 (7.7) 4 (1.4) 5 (2.1) 27 (3.6)
21 or more 5 (2.7) 2 (0.9) 0 (0) 7 (1.1) 6 (2.6) 1 (0.4) 0 (0) 7 (0.9)
Terai Mean (SD)
PoSHAN Total Mean (SD)
24-35.9m 36-47.9 48-59.9 m
All 24-35.9m 36-47.9 48-59.9 m All
None 307 (48.0)
513 (77.4)
597 (93.9)
1417 (73.1)
466 (44.2)
876 (75.4)
1021 (92.7)
2363 (71.2)
1-10 times 250 (39.1)
133 (20.1)
36 (5.7) 419 (21.6) 461 (43.7)
255 (21.9)
69 (6.3) 785 (23.7)
11-20 times
57 (8.9) 9 (1.4) 0 (0) 66 (3.4) 91 (8.6) 19 (1.6) 8 (0.7) 118 (3.6)
21 or more 25 (3.9) 7 (1.1) 3 (0.5) 35 (1.8) 36 (3.4) 10 (0.9) 3 (6.1) 49 (1.5)
Table 34: Age and reasons for stopping breastfeeding in 2-5 year olds, by agro ecological zone
Mountains (N=639)
Hills (N=828)
Terai (N=2135)
PoSHAN Total (N=3602)
Mean age (SD) in months child stopped breast feeding
27.1 (10.7) 27.4 (9.8) 23.4 (10.0) 24.9 (10.3)
Reasons for stopping breast feeding
N (%) N (%) N (%) N (%)
Mother ill or weak 33 (7.5) 45 (8.9) 105 (7.4) 183 (7.8) Child ill or weak 5 (1.1) 3 (0.6) 17 (1.2) 25 (1.1) Nipple/breast problem 1 (0.2) 7 (1.4) 20 (1.4) 28 (1.2) Insufficient milk 36 (8.2) 30 (5.9) 167 (11.8) 233 (9.9) Mother working 40 (9.1) 18 (3.6) 32 (2.3) 90 (3.8) Child refused 73 (16.7) 122 (24.3) 240 (17.0) 435 (18.5) Other reason 249 (56.9) 278 (55.3) 828 (56.7) 1355 (57.6) Given animal, powdered/formula in first 6 months of life 202 (32.2) 325 (43.2) 726 (37.5) 1253 (37.8)

PoSHAN Community Studies Baseline Summary Report
64
Table 35: Types of food groups consumed by 2-5 year olds in the past week (percent and median consumed), by age and agro ecological zone
Food Groups Mountains (N=623)
Hills (N=752)
Terai (N=1931)
PoSHAN Total (N=3306)
N (% ) consuming
any
Median (IQR)
N (% ) consuming
any
Median (IQR)
N (% ) consuming
any
Median (IQR)
N (%) consuming
any
Median (IQR)
Grains, roots and tubers
All (24-59.9 m) 621 (99.8) 34 752 (100) 32 1929(100) 41 3302 (99.7) 36 24-35.9 m 181 (99.4) 34.5 232 (100) 31 636 (100) 40 1049 (99.9) 36 36-47.9 m 218 (100) 33 278 (100) 34 661 (100) 40 1157 (100) 36 48-59.9 m 222 (100) 33 242 (100) 33 632 (100) 42 1096 (100) 36
Legumes and nuts
All (24-59.9 m) 584 (93.7) 14 699 (92.9) 12.5 1883 (97.7) 11 3166 (95.9) 13
24-35.9 m 167 (91.8) 14 219 (94.4) 12.5 618 (97.2) 11 1004 (95.6) 13 36-47.9 m 208 (94.9) 15 257 (92.4) 11 646 (98.0) 11 1111 (96.1) 12.5 48-59.9 m 209 (94.1) 14 223 (92.2) 11.5 619 (97.8) 12 1051 (95.8) 13
Flesh Foods (meat, fish, poultry, and liver/organ meats)
All (24-59.9 m) 386 (62.1) 1 509 (67.7) 1 1220 (63.2) 1 2115 (63.9) 1 24-35.9 m 110 (60.4) 1 148 (63.8) 1 397 (62.3) 1 655 (62.3) 1 36-47.9 m 136 (62.4) 1 199 (71.6) 1.5 419 (63.4) 1 754 (65.2) 1 48-59.9 m 140 (63.1) 1 162 (66.9) 1 404 (63.8) 1 706 (64.4) 1
Eggs
All (24-59.9 m) 227 (36.4) 0 298 (39.7) 0 485 (25.1) 0 1010 (30.6) 0 24-35.9 m 65 (35.7) 0 99 (42.7) 0 155 (24.4) 0 319 (30.4) 0 36-47.9 m 92 (42.0) 0 109 (39.2) 0 160 (24.2) 0 361 (31.2) 0 48-59.9 m 70 (31.4) 0 90 (37.3) 0 170 (26.9) 0 330 (30.1) 0
Dairy products (milk, yogurt, cheese)
All (24-59.9 m) 306 (49.1) 0 463 (61.6) 3 1359 (70.4) 4.5 2128 (64.4) 3 24-35.9 m 89 (48.9) 0 151 (65.1) 4 460 (72.2) 6 700 (66.6) 3 36-47.9 m 115 (52.8) 1 165 (59.4) 3 465 (70.4) 4 745 (64.4) 3 48-59.9 m 102 (45.7) 0 147 (60.7) 3 434 (68.6) 4 683 (62.2) 3
Vitamin A fruits and vegetables
All (24-59.9 m) 569 (75.7) 3 479 (76.9) 3 1785 (92.5) 7 2833 (85.7) 5 24-35.9 m 134 (73.6) 3 169 (72.8) 3 578 (90.9) 6 881 (83.9) 4 36-47.9 m 170 (77.9) 3 216 (77.7) 3 612 (92.6) 6 998 (86.3) 5 48-59.9 m 175 (78.5) 3 184 (76.0) 3 595 (94.1) 7 954 (86.9) 5
Other fruits and vegetables
All (24-59.9 m) 432 (69.4) 4 618 (82.2) 7 1809 (93.7) 9 2859 (86.5) 8 24-35.9 m 119 (65.4) 2 180 (77.6) 7 586 (92.1) 8 885 (84.3) 7 36-47.9 m 154 (70.9) 4 234 (84.2) 7 626 (94.7) 9 1014 (87.7) 8 48-59.9 m 159 (71.3) 4 204 (84.3) 8 597 (94.3) 10 960 (87.4) 8

PoSHAN Community Studies Baseline Summary Report
65
Figure 7: Consumption of animal-source foods in the past 7 days in 2-5 year old children, by agro ecological zone
Child Care Among Children Under-five Mothers or the primary caretakers of under-five children were asked who predominantly cared
for the child other than themselves. Close to a third of all children were cared for their grandmothers in addition to their mothers/primary caretakers (Table 36). This is especially common in the terai, reinforcing known cultural norms of mothers- in-law playing an important role in child care [15, 16].
Table 36: Proportion of children cared for by individuals aside from mothers/primary caretakers, by agro ecological zone
Mountains (N=947)
%
Hills (N=1276)
%
Terai (N=3178)
%
PoSHAN Total (N=5401)
% Mother/primary caretaker 30.1 26.4 16.5 21.2
Husband 23.2 11.4 11.5 13.5
Mother-in-law 16.5 26.9 32.7 28.5
Sister-in-law 1.7 1.3 1.3 1.4
Older child 12.3 15.0 14.9 14.4
Maid/nanny 0.0 0.2 0.0 0.1
Neighbor/friend 3.5 4.6 2.8 3.4
Other family member 12.8 14.3 20.4 17.6
0
10
20
30
40
50
60
Milk Eggs Meat Poultry
%
Mountains (N=623) Hills (N=752) Terai (N=1931)

PoSHAN Community Studies Baseline Summary Report
66
Children Under-five Morbidity Mothers and primary caretakers were asked whether their under-five child experienced a set
of symptoms related to various morbidities within the past 30 and 7 days. 16% of children under-five in the study experienced a low-grade fever and 14% had loose watery stools (≥4 times/day) during the previous 7-days. Otherwise, 7-day child morbidity in the PoSHAN sample was relatively low (Table 37). Nevertheless, morbidities among under-five children were predominantly concentrated in the mountains.
Table 37: Prevalence of symptoms experienced among children under-five during the previous 7 days, by agro ecological zone
Mountains (N=947)
%
Hills (N=1276)
%
Terai (N=3178)
%
PoSHAN Total (N=5401)
% Diarrhea 41.82 28.37 26.12 29.4 Productive cough 9.71 5.72 10.32 9.13 Rapid breathing 13.62 6.11 6.23 7.5 Grunting/wheezing 16.79 8.93 9.88 10.87 Chest in-drawing 9.5 2.98 3.56 4.46 Low-grade fever 35.8 32.52 38.23 36.46 High fever 14.36 8.39 17.56 14.83 Malaria 0.1 0 0.25 0.17 Vomiting 14.36 11.83 10.1 11.26 Refuses to eat 17 18.26 11.23 13.9 Ear discharge 3.91 2.82 5.48 4.57 Eye infection 7.71 4.31 3.46 4.41
Immunization, Nutritional Supplementation & Deworming in Under- five Children
Immunization history was calculated based on mother’s recall and by referring to the child’s health card; however, it was noted that a high proportion of children did not have a health card (66%). Immunization coverage was high against BCG (tuberculosis), DPT (diphtheria, pertussis and tetanus) and polio. Three in four children received full coverage for WHO recommended major immunizations, which include one dose for BCG and measles and three doses for polio and DPT. Japanese Encephalitis coverage was low, with only a quarter all children receiving the vaccine. Of note, however, a large proportion of those children vaccinated resided in the terai (Table 38).
Table 38: Immunization history of children under 5, by agro ecological zone
Mountains (N=947)
%
Hills (N=1276)
%
Terai (N= 3178)
%
Total (N=5401)
% BCG 93.6 95.9 94.2 94.5 MMR 81.1 80.7 73.7 76.7 DPT 90.9 93.7 92.1 92.3 Polio 94.8 95.4 95.2 95.2 Japanese Encephalitis 2.6 6.4 39.1 25

PoSHAN Community Studies Baseline Summary Report
67
Approximately 3 out of 4 children (aged 6-59 months) received Vitamin A supplementation twice in the previous 12 months through the national Vitamin A campaigns, which in Nepal are conducted and distributed by the Female Community Health Volunteers (FCHVs). Through the same campaign, approximately 77% of children were dewormed, with the highest proportion of children receiving deworming pills residing in the mountains, 84%. The receipt of Vitamin A and deworming pills as a form of treatment, that is the receipt of these supplements by a health facility or health extension worker to treat an illness/deficiency, was low, only 1.5% and 11%, respectively, across the study sample (Table 39). In the previous 3 months, 0.7% and 1.4% of mothers reported that their household had received iron syrup and micronutrient powders, respectively, to provide their under-five child.
Table 39: Receipt of supplements and deworming pills by children under-five in the past 12 months, by agro ecological zone
Mountains (N=864)
%
Hills (N=1160)
%
Terai (N= 2919)
%
Total (N=4843)
% Vitamin A through national campaigns1 79.1 80.4 71.4 74.9 No Dose 9.5 9.1 16.6 13.6 One Dose 14.2 13.0 14.2 13.9 Two or more doses 76.0 77.9 68.7 72.2 Don’t know 0.2 0.0 0.5 0.3
Mountains (N=946) 4
%
Hills (N=1276) 4
%
Terai (N= 3178) 4
%
Total (N=5401) 4
% Vitamin A as treatment2 2.9 1.0 1.4 1.5 Deworming pills through national campaigns 84.2 80.4 73.3 76.9 Deworming as treatment3 14.3 4.6 12.6 11
1 In 6-59 month old children 2 In 0-59 month old children 3 In the past 3 months 4 Difference in n’s +/- ≤ 5%
Table 40: Receipt of supplements by the household in the past 3 months, by agro ecological zone
Mountains (N=946)
%
Hills (N=1276)
%
Terai (N= 3177)
%
Total (N=5399)
% Iron syrup 0.6 0.4 0.8 0.7 Micronutrient powders (Vita Mishran/ Bal Vita) 0.8 0.2 2.0 1.4
§ Difference in n’s +/- ≤ 5%
Under-five Children’s Access and Utilization of Health Services Mothers and primary caretakers were asked about home visits made by health extension
workers as well as how often they accessed health service facilities to receive care for their under-five children’s health and nutrition over the past 12 month period. The number of visits received at home by different categories of workers and the number of visits made to a health facility over a 12 month period was calculated for under-five children. Overall, home visits by outreach health workers to provide care for children under-five was low. Nevertheless, FCHVs and Shamans provided the most

PoSHAN Community Studies Baseline Summary Report
68
frequent visits, accessing 13.6% and 8.3% of children under-five 2-3 times a year. Other government health worker home visits were less frequent and reached very few children under-five (Figure 8).
Common reasons for home visits to children under-five by FCHVs were the provision of Vitamin A supplementation in the mountains, hills, and terai (62%, %2%, and 68%, respectively) and the provision of deworming tables in each of the zones (51%, 22% and 47%, respectively). Overall, pharmacies were most frequently accessed to assist with treatment of morbidities experienced by children under-five (Table 42). Participation by under-five children in growth monitoring programs was 33%, 34% and 14% in the mountains, hills, and terai, respectively. (Table 41)
Health facility access was more frequent; 11% of children under-five overall accessed a health facility at least once in the past 12 months and a little over a third accessed a health facility 2-3 times and 4-9 times. Frequency of access to health facilities for young children varied across the agro ecological zones (Figure 9). Reasons that under-five children accessed healthcare facilities was for diarrhea management, respiratory illness, as well as other non-specified reasons (Table 42).
Table 41: Growth monitoring participation by children under-five in the past 12 months, by agro ecological zone
Mountains (N=947)
%
Hills (N=1276)
%
Terai (N= 3178)
%
Total (N=5401)
% Growth monitoring program participation 33.1 34.0 13.8 21.9
Figure 8: Outreach health worker access of children under-five at their homes, by agro ecology

PoSHAN Community Studies Baseline Summary Report
69
Table 42: Reasons for health extension worker and health facility access by under-five children, by agro ecological zone
Among those children who were visited by Shaman/Traditional Healer: reason for visiting
Mountain (N=149)
%
Hills (N=283)
%
Terai (N=590)
%
PoSHAN Total (N=1022)
% Vitamin A distribution 0.0 0.0 0.0 0.0
Deworming treatment 0.0 0.0 0.2 0.1
Nutrition Management 0.0 0.0 0.2 0.1
Iron Supplementation 0.0 0.0 0.0 0.0
Immunization 0.7 0.0 0.0 0.1
Diarrhea Management 12.1 7.8 3.4 5.9
Respiratory Illness 4.0 4.2 3.1 3.5
Other 95.3 97.5 98.1 97.6
Don't Know 0.0 0.4 0.3 0.3
Among those children who were visited by FCHV: reason for visiting
0.0
5.0
10.0
15.0
20.0
25.0
1 2-3 3-9 > 10 1 2-3 3-9 > 10 1 2-3 3-9 > 10 1 2-3 3-9 > 10 1 2-3 3-9 > 10
Shaman FCHV Other govt. HealthWorker
NGO Health Worker Doctor/ Pharm
%
HEALTH EXTENSION WORKER TYPE
Mountains (N=947) Hills (N=1276) Terai (N=3178)

PoSHAN Community Studies Baseline Summary Report
70
Mountain (N=93)
%
Hills (N=102)
%
Terai (N=1033)
%
PoSHAN Total (N=1228)
% Vitamin A distribution 63.4 52.0 68.3 66.6
Deworming treatment 50.5 21.6 46.7 44.9
Nutrition Management 4.3 9.8 3.2 3.8
Iron Supplementation 0.0 0.0 0.2 0.2
Immunization 12.9 8.8 41.0 36.2
Diarrhea Management 6.5 12.7 3.0 4.1
Respiratory Illness 7.5 6.9 1.5 2.4
Other 23.7 41.2 10.7 14.3
Don't Know 0.0 0.0 0.1 0.1
Among those children who were visited by other government health worker: reason for visiting
Mountain (N=12)
%
Hills (N=6)
%
Terai (N=26)
%
PoSHAN Total (N=44)
% Vitamin A distribution 0.0 16.7 7.7 6.8
Deworming treatment 0.0 0.0 11.5 6.8
Nutrition Management 0.0 0.0 11.5 6.8
Iron Supplementation 0.0 0.0 0.0 0.0
Immunization 16.7 33.3 15.4 18.2
Diarrhea Management 8.3 0.0 3.8 4.5
Respiratory Illness 16.7 16.7 15.4 15.9
Other 75.0 33.3 53.8 56.8
Among those children who were visited by NGO health worker: reason for visiting Mountain
(N=12) %
Hills (N=6)
%
Terai (N=26)
%
PoSHAN Total (N=44)
% Vitamin A distribution 0.0 0.0 4.3 4.1
Deworming treatment 0.0 0.0 0.0 0.0
Nutrition Management 0.0 0.0 69.6 65.3
Iron Supplementation 0.0 0.0 0.0 0.0
Immunization 0.0 0.0 13.0 12.2
Diarrhea Management 0.0 0.0 2.2 2.0
Respiratory Illness 0.0 50.0 6.5 8.2
Other 100.0 100.0 34.8 38.8
Don't Know 0.0 0.0 2.2 2.0
Among those children who were visited by Doctor/Pharmacist: reason for visiting
Mountain (N=11)
%
Hills (N=11)
%
Terai (N=228)
%
PoSHAN Total (N=250)
% Vitamin A distribution 0.0 0.0 0.9 0.8

PoSHAN Community Studies Baseline Summary Report
71
Deworming treatment 0.0 0.0 0.4 0.4
Nutrition Management 0.0 0.0 0.4 0.4
Iron Supplementation 0.0 0.0 0.0 0.0
Immunizations 0.0 0.0 0.9 0.8
Diarrhea Management 27.3 27.3 25.4 25.6
Respiratory Illness 9.1 27.3 23.2 22.8
Other 54.5 63.6 89.5 86.8
Don't Know 0.0 9.1 0.0 0.4
Among those children who visited health facility: reason for visiting
Mountain (N=763)
%
Hills (N=1087)
%
Terai (N=2474)
%
PoSHAN Total (N=4324)
%
Vitamin A distribution 3.9 11.1 11.1 9.8
Deworming treatment 3.1 1.6 4.3 3.4
Nutrition Management 2.2 2.1 0.5 1.2
Iron Supplementation 0.4 0.2 0.2 0.2
Immunizations 14.5 24.2 19.8 20.0
Diarrhea Management 45.9 37.1 30.9 35.1
Respiratory Illness 31.5 33.3 35.6 34.3
Other 78.6 76.9 78.3 78.0
Don't Know 0.0 0.0 0.1 0.0
Figure 9: Under-five children’s access to a health facility in the past 12 months
0
5
10
15
20
25
30
35
40
None 1 visit 2-3 visits 4-9 visits >=10 visits
%
NUMBER OF VISITS TO A HEALTH FACILITY
Mountains (N=947) Hills (N=1276) Terai (N=3178)

PoSHAN Community Studies Baseline Summary Report
72
Table 43: Facilities/persons accessed for treatment of select morbidities experienced by under-five children in the past 7 days
Home
%
Someone else’s home
%
Outreach health facility
%
Pharmacy
%
Hospital
%
Other
% Diarrhea 4.4 3.1 20.5 56.6 12.1 3.2 Acute respiratory infection 3.8 4.5 15.1 55.3 16.1 4.9 Low-grade fever 5.3 2.5 14.7 64.0 10.1 3.4 High fever 4.1 2.0 14.2 64.5 9.2 6.1 Malaria 0.0 0.0 33.3 44.4 11.1 11.1 Vomiting 7.5 4.4 20.8 52.2 11.1 4.0 Refuses to eat 6.9 9.4 15.0 50.6 15.0 3.1 Ear discharge 1.5 0.8 21.4 55.7 18.3 2.3 Eye infection 9.1 3.0 23.2 45.5 15.2 4.0

PoSHAN Community Studies Baseline Summary Report
73
Household Level Factors
Household Economic Factors
Household Income and Expenditure In the PoSHAN study sample, the monthly average cash income for a 30-day period between
May – July 2013 was USD 8, USD 8, USD 2, USD 55, USD 18, and USD 19. derived from the following income- generating activities: food crop/farming, livestock, business activity, wage work and salary/pensions, respectively (Figure 10). In-kind income for these activities was relatively low ranging from USD 0.10 (business activities) to USD 3 (wage work). The average amount in remittances received by households in the mountains, hills and terai over the previous 12 month period was USD 918, USD 1062 and USD 1122, respectively (Table 46).
The 30-day average HH expenditure for food and non-food expenditure was highly variable at USD 83 and USD 59, respectively across the PoSHAN study sample and the standard deviations associated with these values were high. Overall, average 30-day expenditure (in the previous month from the survey) was USD 178.30 with higher average expenditure in the mountains (Table 45). The average amount sent by households to a non-household member in the mountains, hills and terai over the previous 12 month period was USD 2294, USD 708 and USD 707, respectively (Table 46). Close to 50% of the hills’ residents reported receiving remittance income over the past 12 months and 22% of those living in the mountains sent money to someone who lived outside their household over the same time period. A lower proportion of those living in the hills and terai reported receiving remittances (Figure 11).
Wealth Index A wealth index was created as a measure of socio-economic status. The following household
related variables were included in the construction of the wealth index: electricity, source of energy for cooking, source of drinking water, type of toilet facility, availability of cooking fuel, main material of wall, roof and floor. Household asset ownership was also included in construction of the wealth index which comprised of ownership of items such as a radio, television, electric fan, mobile phone, motorcycle or scooter and hand pump/tube well/tap/rower pump/shallow tube well. The wealth index was created using principle component analysis. Households were categorized into the following wealth index quintile (from poorest to richest): quintile 1 (lowest), quintile 2 (second), quintile 3 (middle), quintile 4 (fourth) and quintile 5 (highest).
In examining wealth distribution across agro ecological zones, the terai had a quarter of its population in the lowest wealth quintile while the mountains had only 5% in the lowest quintile (Figure 12). Almost a third (32%) of the hills’ population was in the highest quintile of wealth and only 9.2% of the mountains’ population was in this category. The proportion of those in the middle and fourth quintile of wealth predominantly was higher in the mountains (34% and 31%, respectively).

PoSHAN Community Studies Baseline Summary Report
74
Figure 10: Average income (USD) over the past 30 days for different income-generating activities across the PoSHAN sample
0 5 10 15 20 25 30 35 40 45
Food Crop/Farming
Livestock/Poultry/Fish/Bees
Timber/Non-timber/Forest Activities
Business
Wage work
Salary/Pension
INCOME
INCO
ME
GEN
EERATIN
G A
CTIV
ITIC
ES
CASH IN-KIND

PoSHAN Community Studies Baseline Summary Report
75
Table 44: Average income (USD) over the past 30 days for different income-generating activities, by agro ecological zone
Mountains (N=793)
Hills (N=1127)
Terai (N=2367)
Income Generating Activities Cash Mean (SD)
In-Kind Mean (SD
Cash Mean (SD)
In-Kind Mean (SD
Cash Mean (SD)
In-Kind Mean (SD
Food Crop/Farming 1.08 (10.7) 3.8 (25.4)) 0.9 (12.0) 1.2 (5.8) 13.8 (97.0) 3.3 (36.7) Livestock/Poultry/Fish/Bees 2.48 (24.1) 0.6 (8.0) 4.0 (25.1) 0.5 (9.2) 11.3 (59.2) 0.8 (10.3) Timber/Non-timber/Forest Activities 7.78 (87.5) 0.4 (5.8) 0.2 (3.7) 0.0 (0.1) 0.9 (19.2) 0.0 (1.2) Business 143.4 (1105.6) 0.3 (5.4) 35.6 (164.5) 0.0 (0.4) 33.8 (89.4) 0.0 (0.2) Wage work 23.7 (178.8) 2.7 (12.8) 12.0 (38.4) 1.1 (5.1) 19.0 (42.9) 4.3 (205.5) Salary/Pension 36.6 (97.0) 21.3 (66.8) 12.2 (5.3)

PoSHAN Community Studies Baseline Summary Report
76
Table 45: Reported average HH expenditure (USD) in the previous month, by agro ecological zone
Mountains (N=793)*
Hills (N=1127)*
Terai (N=2367)*
PoSHAN Total (N=4287)*
Mean (SD) HH Food expenditure $126.4 (144.6) $75.1 (64.1) $79.3 (63.9) $83.4 (87.3)
Mean (SD) HH Non-food expenditure $74.6 (141.7) $45.7 (73.7) $ 59.2 (151.4) $58.5 (133.7)
Mean (SD) HH Total expenditure $203.2 (331.9) $154.0 (373.0) 182.0 (394.9) 178.3 (378.5) * Difference in N’s +/- ≤ 1%

PoSHAN Community Studies Baseline Summary Report
77
Figure 11: Proportion of households receiving and/or sending remittances in the past 12 months, by agro ecological zone
* Difference in N’s +/- ≤ 1% between remittances received/sent
Table 46: Mean remittances amount (USD) in and out of households that both received and sent money from a non-household member in the previous 12 months by agro ecological zone
Mountains (N=125)
Hills (N=521)
Terai (N=839)
PoSHAN Total (N=1485)
Mean remittance received (USD) $ 917.7 $ 1061.8 $ 1121.5 $ 1083.4
N=167 N=71 N=107 N=345
Mean remittance sent (USD) $ 2293.9 $ 708.3 $ 707.1 $ 1475.5
0
5
10
15
20
25
30
35
40
45
50
Mountains (N=791)* Hills (N=1117)* Terai (N=2360)*
%
Remit received Remit Sent

PoSHAN Community Studies Baseline Summary Report
78
Figure 12: Wealth quintiles, by agro ecological zone
Household Food Security Household food security was examined by using two different methods – FANTA’s Household
Food Insecurity Access Scale (HFIAS) and Months of Adequate Household Food Provisioning (MAHFP). HFIAS, a validated instrument, comprises a set of 9 questions which address issues of anxiety and dietary quality and quantity as experienced by a household during the previous 30 days. Classifications of household food insecurity using the HFIAS scale are as follows: food secure, mildly food insecure, moderately food insecure and severely food insecure [17].The MAHP indicator allows the determination of how vulnerable a household is to food insecurity during a calendar year. It is ascertained by asking a household if they felt that had an adequate amount of food to meet the household’s needs for each month of the calendar year [18].
Severe food insecurity was experienced by 9.7 %, 3.8 % and 6% of household in the mountains, hills and terai, respectively. 1 in 5 households in the mountains were moderately food insecure. Close to 60% of households overall experienced no food insecurity over the past 30 days (Figure 13). A higher proportion of households in the lowest quintiles for wealth experienced some level of household food insecurity (Table 47). The months during which the households within the different agro ecological zones experienced inadequate amounts of food provisioning varied by zone – in the
0
5
10
15
20
25
30
35
40
Lowest Second Middle Fourth Highest
%
WEALTH QUINTILES
Mountains (N=792) Hills (N=1127) Terai (N=2366)
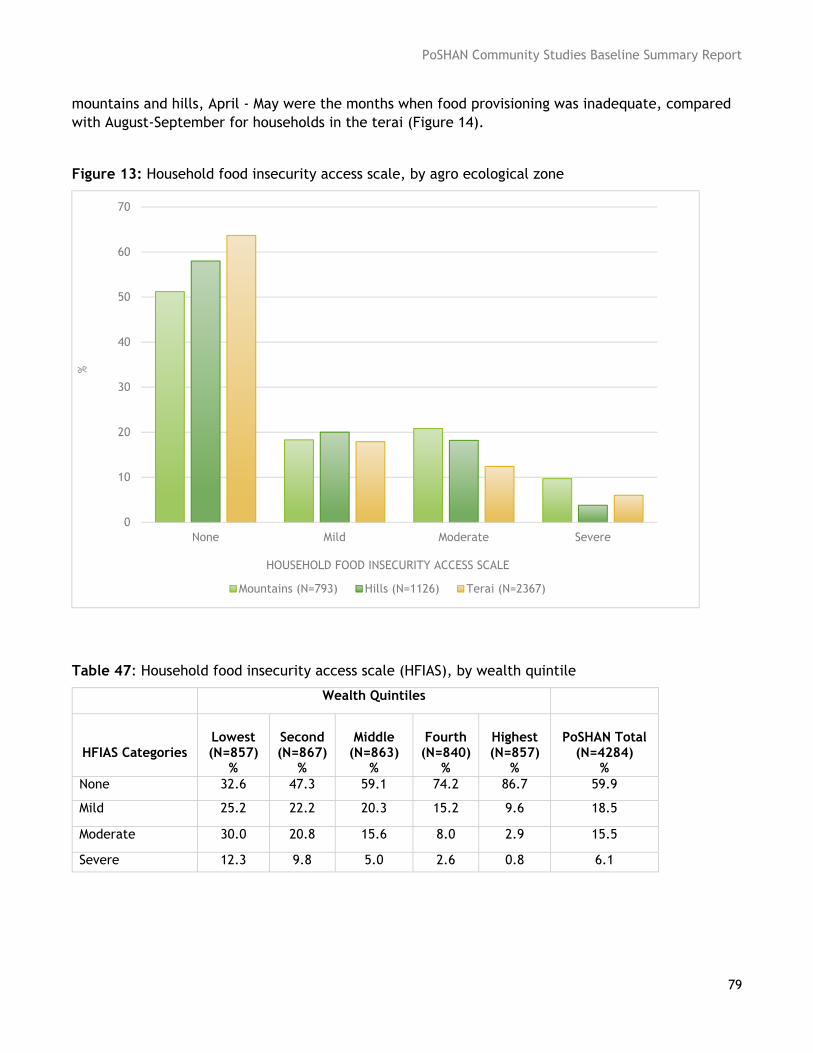
PoSHAN Community Studies Baseline Summary Report
79
mountains and hills, April - May were the months when food provisioning was inadequate, compared with August-September for households in the terai (Figure 14).
Figure 13: Household food insecurity access scale, by agro ecological zone
Table 47: Household food insecurity access scale (HFIAS), by wealth quintile
Wealth Quintiles
HFIAS Categories
Lowest (N=857)
%
Second (N=867)
%
Middle (N=863)
%
Fourth (N=840)
%
Highest (N=857)
%
PoSHAN Total (N=4284)
% None 32.6 47.3 59.1 74.2 86.7 59.9
Mild 25.2 22.2 20.3 15.2 9.6 18.5
Moderate 30.0 20.8 15.6 8.0 2.9 15.5
Severe 12.3 9.8 5.0 2.6 0.8 6.1
0
10
20
30
40
50
60
70
None Mild Moderate Severe
%
HOUSEHOLD FOOD INSECURITY ACCESS SCALE
Mountains (N=793) Hills (N=1126) Terai (N=2367)

PoSHAN Community Studies Baseline Summary Report
80
Figure 14: Proportion of households without adequate food, by month and agro ecological zone
Household Land Ownership, Land Use and Land Water Source Over 80% of households in the terai and hills owned some amount of land and 73% of
households in the mountains owned land (Figure 15). Sharing land was more common in the terai (16.5%) versus the mountains and hills (~9% approximately in both zones). In the terai, 14% of households reported that their land was allocated by a government authority. In the mountains and hills, this was very minimally reported (1.3 % in the mountains and 0.8% in the hills) (Table 49). A majority of households used land to cultivate crops during both the rainy and dry season and water from rains and dams/canals were the most common sources of water (Table 49).
Figure 15: Household ownership of land, by agro ecological zone
0
5
10
15
20
25
Jan Feb Mar Apr May Jun Jul Aug Sep Oct Nov Dec
% o
f ho
useh
olds
MonthMountains (%) Hills (%) Terai (%)
0
10
20
30
40
50
60
70
80
90
100
Land Ownership
%
Mountains (N=793) Hills (N=1127) Terai (N=2367)

PoSHAN Community Studies Baseline Summary Report
81
Table 48: Mean size of cultivatable land, by agro ecological zone
Mountains (N=793)
Hills (N=1126)
Terai (N=2365)
PoSHAN Total (N=4284)
Mean size in hectares (SD)* 0.33 (0.7) 0.51 (0.7) 0.58 (1.0) 1.63 (1.2)
*Unadjusted/unweighted
Table 49: Household land ownership, land location, land use, main water source and primary irrigation, by agro ecological zone
Mountains Hills Terai
(N=793) %
(N=1127) %
(N=2367) %
Land Ownership Status
Owns 73.8 81.3 80.9
Adiya/Share Cropping 9.9 9.1 16.5
Rented/Leased during one season 9.1 10.3 6.8
Rented/Leased during both season 0.1 0 0.3
Allocated by some authority 1.3 0.8 14.2
Other 12.9 10 10.2
Land Location
Homestead 70.9 79.1 92.6
Within VDC 65.8 75.7 70.4
Outside of VDC 20.9 12.6 15.1
Main Use of Land during rainy season
Cultivate Crops 59 69.7 58.5
Home Garden 21.3 12.9 15.4
Orchard/Tea Garden 0 0 0
Flower Garden 0.1 0 0.7
Adiya Out/Give for share cropping 6.2 4.1 4.4
Used for Livestock 0 0.1 1.2
Pasture/Meadow 0 14.6 0.8
Renting/Leasing out 0.4 1.9 1.9
Give it free of cost to someone else 9.3 4.2 0.5
Mortgaged out 0.3 0.3 0.3
Pond/Lake 0 0 0.5
Fallow 16.1 12.5 11.1
Virgin/Never used land 0.3 0.2 1.9
Only use for HH living 71.6 79.6 93
Other 2.3 4.3 12.3
Main Use of Land during dry season
Cultivate Crops 51.9 65.4 56.1
Home Garden 15.4 13.4 16.8

PoSHAN Community Studies Baseline Summary Report
82
Orchard/Tea Garden 0 0 0
Flower Garden 0.1 0 0.8
Adiya Out/Give for share cropping 5.7 3.8 4.4
Used for Livestock 0.1 0.1 1.2
Pasture/Meadow 0 14.6 0.8
Renting/Leasing out 0.4 1.9 1.9
Give it free of cost to someone else 9.2 4.3 0.5
Mortgaged out 0.3 0.3 0.3
Pond/Lake 0 0 0.5
Fallow 35.6 24.4 16.2
Virgin/Never used land 0.3 0.1 1.9
Only use for HH living 71.6 79.6 93
Other 1.9 4.3 12.5
Main Source of Water during rainy season
No Water Source 1.3 0.9 1.5
River/Stream 4.7 4.3 4.1
Well/Pond 1.3 2.5 5.9
Dam/Canal 30.8 17.7 4.6
Rain 57.4 69.3 35.1
Rain Harvesting 0 0 0.1
Deep Tube well/borehole 0 0.6 13.9
Shallow Tube well 0 0.1 14.6
Other 7.6 4.3 1.4
Main Source of Water during winter season
No Water Source 2.5 2.3 2.9
River/Stream 3 3 6.8
Well/Pond 0.8 2.1 10.0
Dam/Canal 25.5 16.9 5.4
Rain 44.3 60.2 15.3
Rain Harvesting 0 0 0.0
Deep Tube well/borehole 0 0.7 21.3
Shallow Tube well 0 0.4 19.5
Other 10.6 9.5 2.7
Land Irrigated during rainy season
Not Irrigated 57.8 69.3 34.7
Free flooding 33.5 22.4 7.1
Contour Laterals 2.8 2.2 0.8
Furrow Irrigation 0.4 0.4 0.5
Sprinkle/drip Irrigation 0.5 0.2 0.3
Lift irrigation (shallow tube well) 0 0 1.1
Lift irrigation (diesel pump) 0 0.1 21.8

PoSHAN Community Studies Baseline Summary Report
83
Lift irrigation (electric pump) 0.1 0.3 9.1
Lift irrigation (submersible) 0.1 0.3 0.3
Pipe based irrigation 5.3 1.5 0.8
Not used in this season 0 0.1 0
Other 2.8 1.5 4.1
Land Irrigated during winter season
Not Irrigated 45.8 60.9 17.8
Free flooding 26.6 18.1 5.2
Contour Laterals 2.8 0.6 0.9
Furrow Irrigation 0.8 0.3 1.6
Sprinkle/drip Irrigation 0.6 2.9 0.2
Lift irrigation (shallow tube well) 0 0 1.8
Lift irrigation (diesel pump) 0 0.1 35.6
Lift irrigation (electric pump) 0 0.3 10.6
Lift irrigation (submersible) 0.1 0.3 0.8
Pipe based irrigation 7.1 5.2 1.7
Not used in this season 0 0.2 0.3
Other 2.8 1.5 4.1
Household Agricultural/ Homestead Food and Livestock Production Household agricultural production was varied for crops, fruits and vegetables across the zones
(Table 50 & 51). Of those households with productive land who grew major field crops, crop variety was calculated. Crop variety was derived by calculating the total number of varieties of each crop grown per household. 67% of households in the terai produced 0-5 different varieties of crops and 49% and 38% of households in the mountains and hills, respectively produced the same crop variety. Approximately 30%, 31% and 14% of households in the mountains, hills and terai, respectively grew 11-20 different varieties of crops. In any of the zones, only a very small percentage of households produced >30 varieties.
Households were asked if they owned any livestock in the past 12 months. Overall, approximately 36% of all households who owned any livestock in the past 12 months owned cattle/ buffalo/ oxen/ cow/yak; these were the most commonly owned livestock in the study sample. Ownership of the number of different livestock varied across the agro ecological zones (Table 52 & 53). Animal diversity (calculated by tabulating the number of different animal products produced by a household) was higher in the terai, where a third of households had an animal diversity score of 1 and 2. However, 21% of households in the hills had an animal diversity score of 3, which for the mountains and terai were 12% and 10% of their households, respectively (Figure 18).
Animal and poultry meat, eggs and milk were the most common types of animal products produced in the past 12 months. The production of animal meat was 37%, 27% and 11% in the mountains, hills and terai, respectively. The production of poultry meat was 31%, 42% and 20% in the mountains, hills and terai, respectively. The production of eggs was 22%, 36% and 11% in the mountains, hills and terai, respectively. And finally, the production of milk was 26%, 33% and 24% in the mountains, hills and terai, respectively (Figure 19).

PoSHAN Community Studies Baseline Summary Report
84

PoSHAN Community Studies Baseline Summary Report
85
Table 50: Mean crop production by households who engage in crop production, by agro ecological zone
Mountains Hills Terai All
Mean (Kg)
Mean (Kg)
Mean (Kg)
Mean (Kg)
Barley(N=352-M, 12-H) 167.7 161.5 0 167.5
Beans(N=142-M,132-H) 60.4 18 0 40
Buckwheat(N=18-M, 2-T) 104.6 0 100 104.2
Chickpeas 0 0 0 0
Coffee 0 0 0 0
Cotton 0 0 0 0
Finger Millet(N=140-M, 292-H) 203.8 173.6 0 183.4
Groundnut(N=60-H, 26-T) 0 62.2 530.8 203.9
Lentil (N=54-M, 130-H, 112-T) 13.5 22 35.8 25.7
Maize(N=548-M, 1210-H, 326-T) 165.5 271.4 889.5 340.2
Oil Seed (N=8-H, 36-T) 0 23.4 74.8 65.4
Peas(N=8-M, 2-H, 2-T) 6.3 4 32.7 10.3
Potatoes (N=530-M, 132-H, 48-T) 298.2 165.1 1012.9 321.8
Rice(N=148-M, 186-H, 1040-T) 235.9 501.7 1630.6 1327.6
Sorghum 0 0 0 0
Soybeans(N=72-M, 190-H) 29.8 19.4 0 22.2
Sugarcane(N=30-T) 0 0 352.80 352.80
Sunflower 0 0 0 0
Sweet Potatoes 0 0 0 0
Tea(N=6-H) 0 5.8 0 5.8
Tobacco(N=2-M) 6 0 0 6
Wheat(N=422-M, 80-H, 34-T) 149.2 171.5 359.4 165.9
Legend: M – Mountain, H – Hills, T – Terai for N’s
Table 51: Mean fruit and vegetable production by households who engage in crop production, by agro ecological zone.
Mountains Hills Terai All
Mean (Kg)
Mean (Kg)
Mean (Kg)
Mean (Kg)
Apple(N=73-M, 6-H) 1263.7 12.5 0 1168.65
Avocado(N=1-M, 1-H) 10 2 0 6
Banana (N=24-M, 66-H, 128-T) 17.4 34.2 22.5 25.5
Beans(N=178-M, 565-H, 434-T) 17.2 15.1 30.3 21.0
Berries (N=3-H, 5-T) 0 18 41 32.4
Bitter gourd(N=85-M, 296-H, 228-M) 20.6 14.5 47.2 27.6
Bottle gourd (N=11-M, 128-H, 492-T) 25.5 20.3 146.5 118.8
Cabbage (N=82-M, 144-H, 92-T) 39.7 59.0 117.1 70.9

PoSHAN Community Studies Baseline Summary Report
86
Capsicum (N=6-M, 4-H, 8-T) 6.2 7.0 6.8 6.7
Carrots (N=30-M, 9-H, 8-T) 14.5 11.6 61.3 21.9
Cauliflower(N=123-M, 141-H, 203-T) 36.0 45.8 190.0 105.9
Chilli (N=269-M, 412-H, 286-T) 13.3 9.1 18.7 13.1
Cucumber(N=227-M, 448-H, 126-T) 40.7 52.3 89.9 54.9
Eggplant (N=113-M, 169-H, 169-T) 16.8 10.6 134.5 58.6
Green Garlic (N=183-M, 405-H, 418-T) 13.0 10.6 11.7 11.5
Green Leaves(N=493, 933-H, 687-T) 44.1 25.3 31.7 31.8
Ginger (N=21-M,104-H, 18-T) 20.8 56.7 132.3 60.9
Guava(N=1-M, 75-H, 113-T) 30.0 65.4 41.0 50.6
Lemon/Lime (N=25-M, 43-H, 33-T) 38.3 21.4 33.3 29.5
Lychee (N=1-M, 2-H, 31-T) 6.0 15.5 73.5 68.2
Mango(N=29-H,349-T) 0.0 120.2 198.7 192.7
Melon(N=1-M, 24-T) 50.0 0.0 863.6 831.1
Okra (N=10-M, 130-H, 389-T) 16.3 11.7 35.6 29.3
Onion(N=123-M,347-H,349-T) 17.8 26.8 98.6 56.0
Orange/Tangerine (N=23-M, 74-H, 1-T) 34.1 77.5 5.0 66.6
Papaya(N=40-H, 95-T) 0.0 43.9 27.4 32.3
Peach(N=107-M, 157-H, 4-T) 101.0 38.8 31.3 63.5
Pineapple (N=6-H, 18-T) 0.0 8.2 17.9 15.5
Plum(N=60-M, 68-H, 4-T) 69.3 45.8 168.8 60.2
Pumpkin/Zucchini (N=279-M, 580-H, 378-T) 40.9 53.0 66.7 54.4
Sponge gourd (N=10-M, 187-H, 461-T) 11.5 17.4 95.5 72.1
Tomato(N=181-M, 259-H, 182-T) 14.2 51.6 75.9 47.8
Radish (N=127-M, 300-H, 76-T) 37.6 29.0 65.6 36.7
Chayote Squash(N=55-M, 163-H) 98.3 114.1 0.0 110.1
Legend: M – Mountain, H – Hills, T – Terai for N’s

PoSHAN Community Studies Baseline Summary Report
87
Figure 16: Household crop variety produced by agro ecological zone
0
10
20
30
40
50
60
70
80
0-5 6-10 11-20 21-30 >30
% H
OU
SEH
OLD
S
CROP VARIETY
Mountains (N=793) Hills (N=1126) Terai (N=2365)

PoSHAN Community Studies Baseline Summary Report
88
Table 52: Prevalence of households that own livestock among those households that report owning any livestock in the past 12 months, by agro ecological zone
Mountain (N=461)
%
Hills (N=818)
%
Terai (N=1821)
%
PoSHAN Total (N=3100)
% 0 1 to 3 >3 0 1 to 3 >3 0 1 to 3 >3 0 1 to 3 >3
Beehives 95.0 4.5 0.5 89.0 9.9 1.1 99.2 0.8 0.0 95.7 3.9 0.4
Cattle/buffalo/oxen/cow/yak 59.5 19.9 20.6 41 40 18.6 49.9 38.6 11.5 49.3 35.6 15.1
Goat 78.4 9.1 12.5 53.7 24.0 22.3 46.8 35.7 17.5 54.5 27.7 17.9
Poultry 72 14.5 13.5 79.3 7.7 13.1 74.39 6.53 19.08 72 10.9 17.1
Guinea fowl/Pigeons 98.9 0.3 0.9 96 1.6 2.4 91.4 1.7 7.0 94 1.4 4.6 Sheep 98.4 0.9 0 99.1 0.6 0.3 100 0 0 99.5 0.3 0.2
Donkey/Mule 98.4 0 1.6 100 0 0 99.9 0.1 0 99.7 0.1 0.3
Horse 95.2 4.3 0.5 99.7 0.3 0 100 0 0 99 0.9 0.1
Pig 97 2.9 0.1 93 7 0.4 96.8 2.6 0.6 95.7 3.8 0.5
Rabbit 97.2 2.1 0.6 100.0 0.0 0.0 99.7 0.1 0.2 99.3 0.5 0.2
Fish Ponds 100 0 0 99.8 0.2 0 98.9 1 0.1 99.4 0.6 0.1
Table 53: Prevalence of households that own improved livestock among those households that report owning any livestock in the past 12 months, by agro ecological zone
Mountain (N=461)
%
Hills (N=818)
%
Terai (N=1821)
%
PoSHAN Total (N=3100)
% Not
improved Improved Don't
know Not
improved Improved Don't
know Not
improved Improved Don't
know Not
improved Improved Don't
know
Beehives 93.9 2.0 4.1 91.7 5.8 2.6 92.3 7.7 0.0 92.2 5.2 2.6
Cattle/buffalo/oxen/cow/yak
95.3 4.4 0.3 97.3 2.5 0.3 95.7 4.2 1.1 96.1 3.7 0.2
Goat 91.1 8.9 0.0 96.8 3.0 0.2 97.6 2.4 0.0 96.81 3.1 0.1
Poultry 88.4 9.5 2.1 93.0 6.1 0.9 94.1 5.8 0.2 92.5 7.1 0.4
Guinea fowl/Pigeons 93.3 6.7 0.0 92.9 1.8 5.4 97.6 2.4 0.0 96.5 2.5 1.0 Sheep 100.0 0.0 0.0 100.0 0.0 0.0 100.0 0.0 0.0 100.0 0.0 0.0
Donkey/Mule 66.7 33.3 0.0 0.0 0.0 0.0 100.0 0.0 0.0 66.7 33.3 0.0

PoSHAN Community Studies Baseline Summary Report
89
Figure 17: Household animal diversity, by agro ecological zone
0.0 10.0 20.0 30.0 40.0 50.0 60.0 70.0 80.0 90.0 100.0
Mountains (N=793)
Hills (N=1127)
Terai (N=2367)
% HOUSEHOLDS
0 1 2 3 4 5 6
Horse 88.4 9.3 2.3 100.0 0.0 0.0 100.0 0.0 0.0 89.4 8.5 2.1
Pig 85.2 14.8 0.0 93.3 6.7 0.0 93.8 6.3 0.0 92.6 7.4 0.0
Rabbit 97.0 3.0 0.0 66.7 0.0 33.3 81.8 18.2 0.0 91.5 6.4 2.1
Fish Ponds 0.0 0.0 0.0 0.0 100.0 0.0 29.4 70.6 0.0 27.8 72.2 0.0

PoSHAN Community Studies Baseline Summary Report
90
Figure 18: Household production of animal-based products during the previous 12 months, by agro ecological zone
Agricultural Inputs and Practices Households were asked whether they practiced a variety of agricultural practices within the
past 12 months. In the sample overall, the most common practices included caging poultry, food processing, free range poultry, and improved drying methods. There was variation in the types of practices used across agro ecological zones with the terai favoring the use of many of the practices listed (Table 54). A small proportion (<6%) of households were visited by agricultural extension workers. Improved seed/saplings appeared to be one of the more common inputs provided to households by these types of workers. Education on topics related to agriculture as well as agricultural inputs to households by extension workers varied across the zones (Table 55, 56, 57). Input 1, 2, and 3 in Tables 55, 56, 57 depict the number of different inputs provided if more than one input was provided by an agricultural extension worker.
Table 54: Agricultural practices, by agro ecological zone
Improved agricultural practices Mountain (N=793)
%
Hills (N=1127)
%
Terai (N=2367)
%
PoSHAN Total (N=4287)
% Use of agro chemicals (pesticide) 8.2 11.3 49.6 31.9
Caging poultry 49.4 67.6 68.4 64.7
Market prices checking 18.3 1.8 15.1 12.2
Composting 47.1 64.3 42.5 49.2
Crop rotation 35.2 36.3 33.1 34.3
0
5
10
15
20
25
30
35
40
45
AnimalMeat/Offal
PoultryMeat/Offal
Milk Egg Honey Leather Fish
%
Mountains (N=793) Hills (N=1127) Terai (N=2367)

PoSHAN Community Studies Baseline Summary Report
91
Free range poultry 47.3 59.7 57.6 56.2
Greenhouses 2.4 1.7 0.7 1.3
Improved feed 16.5 15.2 29.8 23.5
Improved seed 28.3 34.0 48.4 40.9
Improved drying methods/tools 48.9 59.3 52.9 53.8
Improved food storage methods 50.3 43.8 48.8 47.8
Inter-cropping 48.7 62.5 28.9 41.4
Integrated pest management 14.3 13.0 10.3 11.7
Improved marketing methods 1.8 1.1 10.4 6.4
Mechanized tools 1.9 3.0 52.5 30.1
Organic fertilizer 39.2 42.8 37.3 39.1
Planting in rows 20.4 24.7 34.2 29.2
Food processing 48.3 53.2 71.8 62.6
Raised beds 14.9 23.6 16.4 18.0
Storage equipment 6.3 3.6 8.3 6.7
Trellising 41.5 53.6 28.5 37.5
Livestock vaccination 3.8 14.5 23.2 16.5

PoSHAN Community Studies Baseline Summary Report
Inputs provided to households visited by a Junior Technician (JT)/Junior Technician Assistant (JTA) in the g the extension workers’ visit
Input 1 Input 2 Input 3
Mountains Hills Terai PoSHAN Total
Mountains Hills Terai PoSHAN Total
Mountains Hills Terai PoSHAN Total
N=68 %
N=76 %
N=128 %
N=272 %
N=27 %
N=47 %
N=77 %
N=151 %
N=11 %
N=26 %
N=31 %
N=68 %
0.0 0.0 0.8 0.4 0.0 0.0 1.3 0.7 - - - -
0.0 1.3 0.0 0.4 0.0 2.1 1.3 1.3 - - - -
0.0 0.0 0.8 0.4 0.0 4.3 2.6 2.7 - - - -
1.5 0.0 3.9 2.2 3.7 4.3 6.5 5.3 0.0 0.0 3.2 1.5
1.5 1.3 1.6 1.5 7.4 17.0 13.0 13.3 0.0 3.9 3.2 2.9
5.9 34.2 24.2 22.4 2.1 2.6 2.0 0.0 3.9 19.4 10.3
0.0 2.6 0.8 1.1 3.7 4.3 2.6 3.3 0.0 3.9 3.2 2.9
0.0 1.3 2.3 1.5 1.3 0.7 0.0 7.7 6.5 5.9
0.0 0.0 0.8 0.4 3.7 2.1 7.8 5.3 0.0 3.9 0.0 1.5
4.4 4.0 5.5 4.8 4.3 3.9 3.3 0.0 11.5 9.7 8.8
1.5 5.3 3.9 3.7 3.7 2.1 11.7 7.3 0.0 0.0 3.2 1.5
0.0 6.6 3.9 3.7 0.0 14.9 10.4 9.9 0.0 0.0 6.5 2.9
2.9 10.5 20.3 13.2 0.0 0.0 1.3 0.7 9.1 7.7 25.8 16.2
0.0 0.0 0.8 0.4 0.0 2.1 3.9 2.7 - - - -
0.0 4.0 0.0 1.1 0.0 2.1 0.0 0.7 - - - -
0.0 0.0 0.8 0.4 0.0 2.1 0.0 0.7 - - - -
52 9 6 6 19 5 24 3 37 0 2 1 3 9 9 3

PoSHAN Community Studies Baseline Summary Report
93
Free range poultry/livestock 1.5 0.0 0.0 0.0 7.4 2.1 0.0 2.0 - - - - Aquaculture 0.0 0.0 0.8 0.4 0.0 0.0 1.3 0.7 - - - - Other 26.5 18.4 8.6 15.8 33.3 29.8 24.7 27.8 - - - - Don’t know
0.0 1.3 0.0 0.4 - - - - - - - -
Table 56: Education/Inputs provided to households by a social mobilizer the past 12 months during each of their visits
Input 1 Input 2 Input 3
Mountains Hills Terai PoSHAN Total
Mountains Hills Terai PoSHAN Total
Mountains Hills Terai PoSHAN Total
Education on agricultural practices/inputs provided N=4 N=14 N=23 N=41 N=1 N=12 N=11 N=24 N=1 N=5 N=4 N=10
Crop rotation 0.0 7.1 0.0 2.4 - - - - - - - - Intercropping - - - - 0.0 0.0 9.1 4.2 - - - - Improved seeds/sapling/crops 25.0 7.1 17.4 14.6 0.0 8.3 18.2 12.5 - - - - Create raised beds - - - - - - - - - - - - Trellis plants 25.0 0.0 8.7 7.3 0.0 0.0 18.2 8.3 - - - - Nurseries - - - - - - - - - - - - Kitchen garden 0.0 0.0 17.4 9.8 - - - - - - - - Integrated Pest Management 0.0 7.1 0.0 2.4 0.0 8.3 9.1 8.3 - - - - Organic Fertilizer Use 0.0 0.0 4.4 2.4 0.0 0.0 9.1 4.2 - - - - Agrochemicals Use (Pesticides and herbicides) 0.0 0.0 4.4 2.4 - - - - 0.0 20 25 20.0
Improved drying methods(mats, tarpaulins, racks, concrete)
- - - - - - - - - - - -
Improved food storage techniques(granary, preserve fruits and vegetables)
- - - - - - - - - - - -
Information systems to check market prices 0.0 7.1 0.0 2.4 - - - - - - - -
Vaccination of livestock/poultry 0.0 0.0 8.7 4.9 0.0 0.0 9.1 4.2 0.0 0.0 25 10
Improved feed for livestock 0.0 0.0 4.4 2.4 - - - - - - - - Free range poultry/livestock 0.0 7.1 0.0 2.4 - - - - - - - -

PoSHAN Community Studies Baseline Summary Report
94
Aquaculture - - - - - - - - - - - - Other 50.0 64.3 34.8 46.3 100.0 83.3 27.3 58.3 100.0 80.0 25.0 60.0 Don’t know
- - - - - - - - - - - -
Table 57: Education/Inputs provided to households by an agricultural NGO worker in the past 12 months during each of their visits
Input 1 Input 2 Input 3
Mountains Hills Terai PoSHAN Total
Mountains Hills Terai PoSHAN Total
Mountains Hills Terai PoSHAN Total
Education on agricultural practices/inputs provided
N=14 %
N=41 %
N=41 %
N=96 %
N=6 %
N=27 %
N=20%
N=53 %
N=3 %
N=16%
N=7 %
N=26 %
Use mechanized tools to till your land 0.0 0.0 2.4 1.0 - - - - - - - -
Use ploughs to till your land - - - - - - - - 0.0 0.0 14.3 3.9 Use hand tools to till your land - - - - - - - - - - - -
Crop rotation 0.0 4.9 2.4 3.1 0.0 3.7 5.0 3.8 0.0 12.5 14.3 11.5 Intercropping 7.1 4.9 0.0 3.1 0.0 7.4 10.0 7.6 0.0 6.25 0.0 3.9 Improved seeds/sapling/crops 0.0 41.5 24.4 28.1 33.3 22.2 15.0 20.8 33.3 18.8 14.3 19.2 Create raised beds 0.0 2.4 0.0 1.0 0.0 7.4 0.0 3.8 0.0 6.3 0.0 3.9 Trellis plants 7.1 2.4 2.4 3.1 0.0 7.4 0.0 3.8 - - - - Nurseries - - - - - - - - - - - -
Maintain a greenhouse - - - - 0.0 3.7 0.0 1.9 - - - - Kitchen garden 14.3 0.0 7.3 5.2 33.3 3.7 5.0 7.6 33.3 28.6 11.5 Integrated Pest Management 0.0 12.2 4.9 7.3 0.0 14.8 0.0 7.6 0.0 6.3 0.0 3.9 Organic Fertilizer Use 14.3 4.9 7.3 7.3 0.0 20.0 7.6 0.0 12.5 0.0 7.7 Agrochemicals Use (Pesticides and herbicides) 7.1 9.8 24.4 15.6 0.0 7.4 10.0 7.6 0.0 18.8 14.3 15.4
Improved drying methods(mats, tarpaulins, racks, concrete)
- - - - 0.0 3.7 5.0 3.8 - - - -
Improved food storage techniques(granary, preserve fruits and vegetables)
0.0 0.0 7.3 3.1 - - - - - - - -

PoSHAN Community Studies Baseline Summary Report
95
Post-Harvest Infrastructure (aggregation facilities, packing, storing, storage and processing)
- - - - 0.0 3.7 0.0 1.9 0.0 6.3 0.0 3.9
Information systems to check market prices
- - - - - - - - - - - -
Vaccination of livestock/poultry 7.1 2.4 2.4 3.1 0.0 7.4 10.0 7.6 0.0 6.3 0.0 3.9
Improved feed for livestock 7.1 2.4 2.4 3.1 16.7 0.0 0.0 1.9 0.0 6.3 0.0 3.9 Free range poultry/livestock 7.1 2.4 2.1 0.0 3.7 0.0 1.9 - - - - Aquaculture - - - - 16.7 3.7 20.0 11.3 - - - - Other 28.6 12.2 9.8 13.5 0.0 7.4 10.0 7.6 33.3 0.0 14.3 7.7 Don’t know - - - - - - - - - - - -

PoSHAN Community Studies Baseline Summary Report
96
Household Water and Sanitation Households were asked about their water sources (see Table 1 ‘Sample characteristics of
households within the PoSHAN 1st Annual Surveillance Survey), including how long it took and who was most often responsible for fetching water for the household. 49%, 49% and 81% of households in the mountains, hills and terai, respectively reported having a water source within the household’s compound itself (Table 58). 23% of the sample overall travelled less than 15 minutes to a water source and 7% and 3% travelled for between 15-30 minutes and 30 minutes – 1 hour to fetch water, respectively. Greater amounts of time to fetch water and return to the household were negligible (Table 58). Overall, 86% of households in the study sample had an adult female fetch water for the household. The majority of households in the sample did not treat their drinking water prior to drinking (71%, 67%, and 96% in the mountains, hills and terai, respectively) (Figure 20). Of the households that did treat their water, overall close to half of them boiled their water (48%) and 33% of households used filtered water (Table 60). Among those households that treated their water, overall 56% of them offered this water all of the time to their under-five children (Table 61). The most common place for under-five children to defecate was outdoors - outside of the house (24%) and in an open field (26%) (Table 62). Toilet use for children under-five was 35%, 32% and 14% in the mountains, hills and terai, respectively. One third of households kept animals inside their homes and this was most common amongst households in the hills (44%) (Table 63).
Table 58: Time taken to fetch drinking water from household to water source and return home by household, by agro ecological zone
Mountains (N=793)
%
Hills (N=1127)
%
Terai (N=2367)
%
PoSHAN Total (N=4287)
% Within household compound 49.1 48.6 80.6 66.3
<15 minutes 31.4 25.7 19.1 23.1
15-30 minutes 12.9 16.6 0.0 6.9
31-60 minutes 6.1 6.8 0.3 2.9
61-120 minutes 0.5 2,2 0.0 0.7
>120 minutes 0.1 0.0 0.0 0.0
Table 59: Household member responsible for collecting water by household, by agro ecological zone*
Mountains (N=401)
%
Hills (N=575)
%
Terai (N=2367)
%
PoSHAN Total (N=3343)
%
Adult female 92.5 83.0 92.5 86.4
Adult male 2.2 5.2 2.2 4.8
Female child (<15 yrs) 4.0 9.7 4.0 7.1
Male child (<15 yrs) 0.0 2.1 0.0 1.3
Other 1.3 0.0 1.3 0.5
*Does not include households that had a water source within their HH compound

PoSHAN Community Studies Baseline Summary Report
97
Figure 19: Prevalence of household treatment of drinking water, by agro ecological zone
Table 60: Methods of treatment for water used by households, by agro ecological zone*
Mountains (N=229)
%
Hills (N=375)
%
Terai (N=86)
%
PoSHAN Total (N=690)
% Let it stand & settle sedimentation 0.4 0.0 18.6 2.5
Strain it through cloth 2.6 11.5 10.5 8.4
Boil 73.8 37.3 19.8 47.3
Boil and filter 3.9 8.5 2.3 6.2
Add bleach/chlorine 0.4 0.3 1.2 0.4
Use water filter 15.7 41.6 45.4 33.5
Solar disinfectant 2.6 0.8 0.0 1.3
Other 0.4 0.0 2.3 0.4
*Only among households who treat water
0
10
20
30
40
50
60
70
80
90
100
Do not treat Treat Sometimes treat
% H
OU
SEH
OLD
S
WATER TREATMENT
Mountains N=793 Hills N=1127 Terai N=2365

PoSHAN Community Studies Baseline Summary Report
98
Table 61: Prevalence of household’s frequency of treated water consumption among under-five children in household that treat their water, by agro ecological zone
Mountains (N=208)
%
Hills (N=333)
%
Terai (N=77)
%
PoSHAN Total (N=618)
% Never 4.8 4.8 7.8 6.5
Sometimes 14.1 14.1 19.5 18.0
Most of the times 18.3 18.3 28.6 19.3
All of the time 62.8 62.8 44.2 56.3
Table 62: Prevalence of households’ utilized location for under-five defecation, by agro ecological zone
Mountains N=737
%
Hills N=1021
%
Terai N=2718
%
PoSHAN Total (N=3936)
% Own toilet 34.7 31.6 14.0 22.5 Neighbor’s toilet 1.8 0.4 0.2 0.6 Outdoor near the house 16.4 17.8 29.8 24.2 Open field 15.2 14.4 35.2 26.0 River Pool 1.4 0.1 0.8 0.5 Bush/jungle 21.9 3.2 0.7 1.5 Diaper 8.7 18.1 13.4 16.2 Other 34.7 14.3 5.9 8.6
Table 63: Prevalence of households that keep animals inside their homes, by agro ecological zone
Mountains (N=792)
%
Hills (N=1127)
%
Terai (N=2367)
%
PoSHAN Total (N=4286)
% Animals kept inside the home 38.6 44.8 25.5 33.0
Household Participation in Health, Nutrition, Agriculture, Micro credit and other social assistance programs
Households were asked whether anyone in their household belonged to groups related to health, nutrition, agriculture, micro credit and social assistance programs over the past 12 months; women household members’ participation in these groups was also assessed. A quarter of all households had a member who was part of a women’s group in their community; this was the group with the highest household participation. Approximately 21% of households had a member who was part of a microcredit group (Table 64). Program group participation was varied by zone and with agriculture-focused groups (farmer’s groups, famer’s schools, village model farms & marketing groups): 19%, 27% and only 5% of households in the mountain, hills and terai, respectively participated in these types of groups. Overall, it appeared that with the exception of microcredit groups, participation of households in the terai of such program groups was low.

PoSHAN Community Studies Baseline Summary Report
99
Table 64: Prevalence of household participation in major program groups, by agro ecological zone
Mountains (N=793)
%
Hills (N=1127)
%
Terai (N=2367)
%
PoSHAN Total (N=4287)
%
Farmers’ groups 9.3 9.4 3.8 6.3
Female participation n(%) 74 (74.3) 106 (63.2) 90 (50) 270(61.9)
Farmers’ Schools 0.1 0 0.04 0.02
Female participation n(%) 1(100) No observation 1(100) 2(100)
Village Model Farms 0.1 0.1 0.1 0.1
Female participation n(%) 1(100) 1(100) 4(50) 6(50)
Marketing groups 2.1 0.4 1.2 1.2
Female participation n(%) 17(53) 5(0) 28(3.6) 50 (20)
Water users’ group 10.7 18.5 0.5 7.1
Female participation n(%) 86(47.7) 208(37.5) 12(41.7) 306(40.5)
Community forestry groups 11.6 22.5 1.1 8.6
Female participation n(%) 92 (52.2) 254(41) 25 (40) 371 (43.7)
Cash transfer other than Bal Samrakshan/Anudan
0.3 0.3 0.1 0.2
Female participation n(%) 2(100) 3(66.7) 3(66.7) 8(75)
Food for work programs 8.5 0.1 0 1.6
Female participation n(%) 67(76.2) 1(100) No observation 68(75)
Cash for work programs 0.8 0.2 0 0.2
Female participation n(%) 6(66.7) 2(0) No observation 8(50)
Trade and business association 9.2 0.8 1.7 2.9
Female participation n(%) 73(8.2) 10(100) 41(0) 124(4.8)
Civic group (improving community)
3.5 3.5 2.1 3
Female participation n(%) 28(42.9) 50(30) 50(44) 128(38.3)
Religious group 4 3.3 8.4 6.2
Female participation n(%) 33(48.5) 37(59.5) 100(60) 268(57.8)
Mothers’/ Women’s groups 28.6 41.7 16.4 25.4
Female participation n(%) 228(99) 470(99.8) 390(99) 1088(99.5)
Cooperative 25.4 14.4 13.2 15.8
Female participation 199(70.9) 163(60.1) 313(75.1) 675(70.2)
Credit or microfinance group 5.4 13.2 29 20.5
Female participation n(%) 43(79.1) 149 (87.25) 688 (92) 880(91)
Community Characteristics, Services & Infrastructure The PoSHAN study sites were surveyed for their infrastructure, essential health, agriculture
and veterinary services as well several other social services. This section provides information on the

PoSHAN Community Studies Baseline Summary Report
100
availability of key staff that provide health, agricultural or veterinary services, and the existence of a variety of infrastructure including roads, schools, market places and banks.
Of the health personnel available to the PoSHAN study sample, the type of health service provider found across all agro ecological zones was female community health volunteers (FCHVs), with at least one FCHV in each selected VDC. Most VDCs also had a staff nurse/auxiliary nurse midwife (ANM) (91%) and auxiliary health workers (AHW) (76%) (Table 65). Only 19% of the 21 VDCs had a doctor, with the lowest proportion of doctors in the hill VDCs.
Within PoSHAN VDCs, 71.4% had the presence of an Agricultural ‘Junior Technician’ (JT), also known as an ‘Agricultural Extension Officer’, and less than half had an Agricultural ‘Junior Technician Assistant’ (JTA) present who typically assists Junior Technicians with providing technical assistance on agricultural practices and inputs. However, for the provision of veterinary services, less than half of the VDCs had Veterinary Junior Technicians (JT) (42.9%) but over 85% had the presence of Veterinary Junior Technician Assistants. The highest proportion of veterinary service providers is held in the terai. A high number of model farmers was noted in one of the VDCs in the terai thus providing a very varied number of model farmers across zones (Table 66).
Table 65: Availability of key health, agriculture and livestock personnel in the VDC, by agro ecological zone
Mountains (N=7)
%
Hills (N=7)
%
Terai (N=7)
%
PoSHAN Total (N= 21)
% Health Personnel
Doctor 28.6 14.3 14.3 19.1
Health Assistant/Senior Auxiliary Health Workers 57.1 57.1 42.9 52.4
Staff Nurse/Auxiliary Nurse Midwife (ANM) 85.7 100 85.7 90.5
Auxiliary Health Worker (AHW) 57.1 85.7 85.7 76.2
Maternal Child Health Worker (MCHW) 28.6 0 28.6 19.1
Female Community Health Volunteer (FCHV) 100 100 100 100
Village Health Worker (VHW) 0 14.3 71.4 28.6
NGO workers (health sector) 42.9 14.3 0 14.3
Social Mobilizer (health sector) 14.3 14.3 0 9.5
Community Mobilizer (health sector) 14.3 0 14.3 9.5
Agricultural Personnel
Junior Technician (JT)/ Ag Extension Officer 85.7 100 71.4 85.7
Junior Technical Assistant (JTA)/ Ag Extension Worker
42.9 42.9 57.1 47.6
Model Farmers* 16.7 14.3 57.1 30
Livestock Personnel
Veterinary Junior Technician (JT) 100 85.7 42.9 76.2
Veterinary Junior Technical Assistant (JTA)^ 33.3 71.4 85.7 65 * National N= 20, Mountains n = 6, Hills n = 7, Terai n= 7
^ National N= 20, Mountains n = 6, Hills n = 7, Terai n= 7

PoSHAN Community Studies Baseline Summary Report
101
Table 66: Availability of health, agriculture and veterinarian personnel, by agro ecological zone
Mountains Hills Terai PoSHAN Total
Health Personnel N Median N Median N Median N Median
Doctor 7 0 7 21 0 0 7 0
Health Assistant (HA)/Senior Auxiliary Health Workers (SAHW)
7 1 7 21 1 1 7 0
Staff Nurse/Auxiliary Nurse Midwife (ANM)
7 1 7 21 1 1 7 1
Auxiliary Health Worker (AHW) 7 1 7 21 1 1 7 1
Maternal Child Health Worker (MCHW)
7 0 7 21 0 0 7 0
Female Community Health Volunteer (FCHV)
7 9 7 21 9 12 7 9
Village Health Worker (VHW) 7 0 7 21 0 0 7 1
NGO workers (health sector) 7 0 7 21 0 0 7 0
Social Mobilizer (health sector) 7 0 7 21 0 0 7 0
Community Mobilizer (health sector) 7 0 7 21 0 0 7 0
Agricultural Personnel
Junior Technician (JT)/ Ag Extension Officer
7 1 7 21 1 2 7 1
Junior Technical Assistant (JTA)/Ag Extension Worker
7 0 7 21 0 0 7 1
Model Farmers 6 0 7 20 0 0 7 1
Livestock Personnel Veterinary Junior Technician (JT) 7 1 7 21 1 1 7 0
Veterinary Junior Technical Assistant (JTA)
6 0 7 20 1 1 7 1

PoSHAN Community Studies Baseline Summary Report
102
Table 67: Presence of infrastructure of PoSHAN study sites
Infrastructure/service
PoSHAN Study VDCs (N=21)
% Primary School 71.4
Middle School 47.6
High School 38.1
Sub-health post 0
Health post 19.1
PHC Center 9.5
Govt District Hospital 0
Private hosp/clinic 23.8
NGO Health Center 0
Government banks 9.5
Private banks 9.5
Bus stop 14.3
All weather road/paved 42.9
Electricity supply from main grid 0
Rice mill 14.3
Irrigation canal 42.9
Govt./semi govt. offices 61.9
Medicine shops/pharmacies 52.4
Permanent bazaar 61.9
Haat bazaar 23.8

PoSHAN Community Studies Baseline Summary Report
103
Market Survey Market surveys were conducted in the most commonly used permanent market or haat bazaar in each of the study wards for food items. Where there was a common market area for 2 or more wards, the most commonly used market area was surveyed. Information on the most commonly used market area was attained from a community focus group discussion. For agricultural items, market areas were identified similarly and agrovets were surveyed. Prices for food and personal items varied across the zones and overall were more expensive in the mountains versus the terai (Table 68). A similar price pattern across zones was seen for agricultural items, with the mountains versus terai experiencing higher prices, with the exception of hi-yield rice, adult oxen, and cows (Table 69).
Table 68: Average price (in USD) for food and personal items, by agro ecological zone
Food Items N Mountains N Hills N Terai
Maize (Flour) (1 kg) 3 $ 0.28 2 $ 0.27 3 $ 0.29
Maize (whole) (1 kg) 5 $ 0.32 5 $ 0.23 7 $ 0.39
Rice (1 kg) 7 $ 0.59 7 $ 0.38 7 $ 0.34
Wheat (1 kg) 7 $ 0.42 5 $ 0.32 7 $ 0.26
Buckwheat (1 kg) 2 $ 0.86 1 $ 0.40 0 N/A
Millet (1 kg) 6 $ 0.47 4 $ 0.27 1 $ 0.19
Onions (1 kg) 7 $ 0.68 7 $ 0.38 7 $ 0.34
Tomatoes (1 kg) 7 $ 0.89 7 $ 0.39 7 $ 0.51
Ghee (1 liter) 6 $ 5.67 7 $ 5.11 7 $ 6.88
Mustard Oil (1 liter) 7 $ 1.96 7 $ 1.61 7 $ 1.56
Noodles (Ruchi, 1 pkt) 6 $ 0.13 7 $ 0.13 5 $ 0.11
Saag (Rayo) (1 kg) 5 $ 1.07 5 $ 0.23 6 $ 0.28
Bananas (ripe small, 1 kg) 7 $ 1.14 7 $ 0.59 7 $ 0.55
Dry fish (small) (1 kg) 3 $ 3.70 2 $ 1.83 7 $ 2.56
Goat meat (1 kg) 7 $ 4.68 7 $ 4.18 7 $ 5.19
Chicken (local) (1 kg) 4 $ 6.66 6 $ 4.39 6 $ 3.94
Chicken (broiler) (1 kg) 6 $ 3.82 6 $ 2.75 7 $ 2.62
Local Eggs (1 dozen) 6 $ 2.55 7 $ 1.49 6 $ 1.53
Broiler Eggs (1 dozen) 6 $ 1.72 7 $ 1.17 7 $ 1.20
Buffalo Milk (1 liter) 5 $ 0.64 7 $ 0.47 7 $ 0.43
Potato (1 kg) 7 $ 0.33 7 $ 0.30 7 $ 0.24
Dal (Musooro) (1 kg) 7 $ 1.31 7 $ 1.12 7 $ 1.04
Yogurt (1 liter) 4 $ 0.77 5 $ 0.45 7 $ 0.62

PoSHAN Community Studies Baseline Summary Report
104
Infant Formula (Lactogen) (45g) 3 $ 3.91 2 $ 4.22 6 $ 3.86
Tea Leaves (100 g) 7 $ 0.42 7 $ 0.35 7 $ 0.27
Cooking Oil (1 liter) 6 $ 1.77 7 $ 1.55 7 $ 1.45
Sugar (White) (1 kg) 7 $ 1.04 7 $ 0.79 7 $ 0.71
Iodized Table Salt (1 kg) 7 $ 0.38 7 $ 0.21 7 $ 0.16
Non-Imported Beer (1 bottle) 7 $ 2.74 7 $ 1.54 7 $ 1.73
Local Rakshi/Jaard (1 bottle) 6 $ 0.98 6 $ 0.44 7 $ 0.54
Cigarettes (1 packet) 7 $ 0.51 7 $ 0.34 7 $ 0.42
Toilet Soap (Lux) (1 bar, 85g) 7 $ 0.32 7 $ 0.26 6 $ 0.25
Kerosene (1 liter) 5 $ 1.48 5 $ 1.20 7 $ 0.97
Table 69: Average price (in USD) for agricultural items, by agro ecological zone
Agriculture Items N Mountains N Hills N Terai
Local Rice Seeds 5 $ 0.53 5 $ 0.41 7 $ 0.35
Hi-Yield Rice Seeds 2 $ 1.60 3 $ 3.52 7 $ 2.05
Urea (Fertilizer) 6 $ 0.44 7 $ 0.36 7 $ 0.25
DAP (Fertilizer) 4 $ 0.77 6 $ 0.56 7 $ 0.49
Potas (Fertilizer) 1 $ 0.56 5 $ 0.44 7 $ 0.39
Land Rental for Cultivation/ day
0 N/A 1 $ 0.49 7 $ 0.35
Ox-Plough rental 6 $ 8.31 5 $ 4.08 7 $ 4.98
Tractor rental 0 N/A 4 $ 11.02 7 $ 9.11
Local Chicken 7 $ 8.08 7 $ 4.53 6 $ 3.42
Broiler Chicken 6 $ 3.22 6 $ 2.15 7 $ 1.97
He Adult Goat (Castrated) 7 $ 4.15 7 $ 3.35 7 $ 3.69
He Adult Goat 7 $ 3.90 7 $ 3.23 5 $ 3.09
She Adult Goat 6 $ 3.28 7 $ 2.35 6 $ 2.61
Adult Local Cow 7 $ 117.62 7 $ 109.89 7 $ 147.29
Adult Hybrid Cow 3 $ 516.11 4 $ 504.51 6 $ 497.11
Adult Local Buffalo 5 $ 392.33 7 $ 500.40 7 $ 395.67
Adult Hybrid Buffalo 2 $ 841.67 5 $ 737.78 6 $ 747.50
Adult Ox 7 $ 136.79 7 $ 161.79 7 $ 163.62

PoSHAN Community Studies Baseline Summary Report
105
REFERENCES
1. J, H., Agriculture, Health and Nutrition: Toward Conceptualizing the Linkages. In Reshaping agriculture for nutrition and health, S.F.a.R. Pandya-Lorch, Editor 2012, International Food Policy Research Institute.
2. Hawkesworth, S., et al., Feeding the world healthily: the challenge of measuring the effects of agriculture on health. Philos Trans R Soc Lond B Biol Sci, 2010. 365(1554): p. 3083-97.
3. Masset, E., et al., Effectiveness of agricultural interventions that aim to improve nutritional status of children: systematic review. BMJ, 2012. 344: p. d8222.
4. Girard, A.W., et al., The effects of household food production strategies on the health and nutrition outcomes of women and young children: a systematic review. Paediatr Perinat Epidemiol, 2012. 26 Suppl 1: p. 205-22.
5. M, K., Nepal Economic Growth Assessment-Agriculture, 2008, USAID/Nepal. 6. KL, J.N.a.M., Assessment of Food Self-sufficiency and Food Security in Nepal. Journal of International
Development and Cooperation 2007, 2007. 7. Ministry of Health and Population (MOHP) [Nepal], N.E., and ICF International Inc, Nepal Demographic
and Health Survey 2011, 2012: Calverton, Maryland. 8. National Planning Commission, G.o.N., Multi-sectoral Nutrition Plan-For Accelerating the Reduction of
Maternal and Child Under-nutrition in Nepal, 2012: Kathmandu. 9. P., P.-A., The Food System and Its Interaction with Human Health and Nutrition. In Reshaping
agriculture for nutrition and health, S.F.a.R. Pandya-Lorch, Editor 2012, International Food Policy Research Institute.
10. Merritt, M.W., et al., A field training guide for human subjects research ethics. PLoS Med, 2010. 7(10). 11. WHO, Global Database on Body Mass Index, 2000. 12. WHO Haemoglobin concentrations for the diagnosis of anaemia and assessment of severity. Vitamin
and Mineral Nutrition Information System. (WHO/NMH/NHD/MNM/11.1), 2011. 13. FAO, Guidelines for Measuring Household and Individual Dietary Diversity, 2011. 14. Group, W.M.G.R.S. WHO Child Growth Standards: Length/height-for-age, weight-for-age, weight-for-
length, weight-for-height and body mass index-for-age: Methods and development. Geneva: World Health Organization. 2006.
15. Madhu, K., S. Chowdary, and R. Masthi, Breast feeding practices and newborn care in rural areas: a descriptive cross-sectional study. Indian J Community Med, 2009. 34(3): p. 243-6.
16. Simkhada, B., M.A. Porter, and E.R. van Teijlingen, The role of mothers-in-law in antenatal care decision-making in Nepal: a qualitative study. BMC Pregnancy Childbirth, 2010. 10: p. 34.
17. Coates J, S.A., Bilinsky P, Household Food Insecurity Access Scale (HFIAS) for Measurement of Food Access: Indicator Guide, 2007, Food and Nutrition Technical Assistance II Project (FANTA-2), AED: Washington DC.
18. Bilinsky, P., Swindale A, Months of Adequate Household Food Provisioning (MAHFP) for Measurement of Household Food Access: Indicator Guide, 2010, Food and Nutrition Technical Assistance II Project (FANTA-2), AED Washington DC

PoSHAN Community Studies Baseline Summary Report
106
ANNEX
Table A1: List of PoSHAN Community Studies 21 VDC/District Sites
Mountain Districts Hill Districts Terai Districts
District VDC District VDC District VDC
Bajhang Kalukhe Doti Kalikasthan Banke Saigaun
Mugu Shreenagar Rolpa Korchawang Nawalparasi Amraut
Jumla Mahatgaun Arghakhanchi Sitapur Bara Badaki Fulbariya
Rasuwa Thuman Lamjung Udipur Sarlahi Barahathawa
Sindhupalchowk Thulopakhar Kathmandu Gokarneswor Dhanusa Dhanusadham
Solukhumbu Namche Ramechapp Saipu Saptari Bhutahi
Taplejung Sadewa Terathum Eseebu Morang Sijuwa
Figure A1: Map of PoSHAN Community Studies 21 study sites