Embed Size (px)
Citation preview

P O S I V A O Y
O l k i l u o t o
F I -27160 EURAJOKI , F INLAND
Te l +358-2-8372 31
Fax +358-2-8372 3709
Pau l i i na Aa l to , ed .
Jan i He l i n , Susanna L indgren
Pet te r i P i tkänen , M ia Y lä -Me l l a
Henry Ahokas , Ee ro He ikk inen
Joonas K lockars , Anne -Ma j Lahdenperä
Juhan i Korkea laakso
T i i na Lamminmäk i
Kars ten Pedersen
Tuomo Karvonen
Apr i l 2011
Work ing Repor t 2011 -25
Baseline Report for Infiltration Experiment

Apr i l 2011
Base maps: ©National Land Survey, permission 41/MML/11
Working Reports contain information on work in progress
or pending completion.
The conclusions and viewpoints presented in the report
are those of author(s) and do not necessarily
coincide with those of Posiva.
Work ing Report 2011 -25
Baseline Report for Infiltration Experiment
Pau l i i na Aa l to , ed . , Jan i He l i n , Susanna L i ndg ren ,
P e t t e r i P i t k ä n e n , M i a Y l ä - M e l l a
P o s i v a O y
H e n r y A h o k a s , E e r o H e i k k i n e n ,
A n n e - M a j L a h d e n p e r ä , J o o n a s K l o c k a r s
Pöy ry F i n l and Oy
J u h a n i K o r k e a l a a k s o
V T T
T i i n a L a m m i n m ä k i
T e o l l i s u u d e n V o i m a O y j
K a r s t e n P e d e r s e n
M i c r o b i a l A n a l y t i c s S w e d e n A B
T u o m o K a r v o n e n
W a t e r h o p e

ABSTRACT An infiltration experiment to investigate potential changes in pH and redox conditions and in buffering capacity as well as the hydrogeochemical processes related to groundwater infiltration was started in late 2008 near ONKALO. The purpose of the experiment is to monitor the major infiltration flow path from ground surface into the upper part of ONKALO at a depth of about 50 to 100 m depending on the observations made during the experiment. Infiltration is activated by pumping a highly transmissive fracture zone (13–18.2 m) in drillhole OL-KR14, which is a part of the site scale hydrogeological feature. The influence of pumping is then monitored in drillholes, groundwater observation tubes and lysimeters through water, groundwater and microbiological samplings and hydrogeological measurements. Before the experiment was started, four new monitoring drillholes, nine groundwater observation tubes and nine lysimeters were installed in the test area and very detailed baseline field investigations were performed. In addition, information of existing investigation data from the area of interest was collected in together. The baseline field investigations included geological logging of the cores of new shallow drillholes, flow and transverse flow measurements in new shallow drillholes, SLUG measurements in groundwater observation tubes, head monitoring, groundwater and microbiological sampling and analysis from observation tubes, shallow drillholes and the pumping section in OL-KR14, water sampling and analysis from lysimeters and resistivity measurements of the overburden. The results of previously performed soil pit investigations and hydrogeological measurements carried out in the area of interest were also added to the investigation data. A detailed hydrogeological model of the experiment area was updated simultaneously with baseline field investigations; the previous version was presented in Pitkänen et al. (2008). Apart from the field investigations, predictive reactive transport calculations and flow simulations were performed. The main objective of the predictive reactive transport calculations was to successfully integrate hydrodynamic processes and chemical reactions. The calculations were carried out using the TOUGHREACT code and with the EQ3/6-database implemented in the code. A detailed surface hydrological model version was also developed in order to study water balance components at the experiment area site and to evaluate the effects of the pumping of OL-KR14 on groundwater level in overburden soils and in shallow bedrock drillholes. This Report describes the objectives of the Infiltration Experiment, the experimental site and setup, and the results of the aforesaid baseline field investigations. In addition, an updated hydrogeological model of the area of interest as well as the results of predictive flow simulations and reactive transport calculations are presented. Keywords: Infiltration experiment, baseline results, experiment setup, monitoring, predictions.

Suotautumiskoealueen perustilan kuvaus TIIVISTELMÄ Tutkimus, jonka tavoitteena on tutkia mahdollisia muutoksia pohjaveden suotau-tumiseen liittyvissä pH- ja redox-olosuhteissa, kallion puskurointikyvyssä, sekä hydro-geokemiallisissa prosesseissa, aloitettiin ONKALOn läheisyydessä loppuvuonna 2008. Kokeen tavoitteena on tarkastella merkittävää virtaavien vesien suotautumisreittiä maan pinnalta ONKALOn yläosaan 50–100 metrin syvyydelle, riippuen tutkimuksen aikana saatavista tuloksista. Kokeessa veden suotautumista tehostetaan pumppaamalla hyvin vettä johtavaa kalliorakoa kairareiässä OL-KR14. Kalliorako on osa alueellista hyvin vettä johtavaa hydrogeologista rakennetta HZ19A. Pumppauksen vaikutuksia seurataan hydrogeologisin kenttämittauksin sekä kairarei’istä, pohjavesiputkista ja lysimetreistä tehtävin geokemiallisin ja mikrobinäytteenotoin. Ennen kokeen aloitusta alueelle kairattiin neljä uutta matalaa kalliokairareikää, asen-nettiin yhdeksän pohjavesiputkea ja yhdeksän lysimetriä sekä tehtiin yksityiskohtaisia kenttätutkimuksia. Myös tutkimusalueen ympäristössä aiemmin tehtyjen tutkimusten aineistoja käytiin uudelleen läpi. Kenttätutkimukset käsittivät matalien kairareikien kairasydännäytteiden tutkimuksia sekä virtaus- ja poikkivirtausmittauksia kyseisissä rei’issä. Lisäksi tehtiin SLUG-mit-tauksia uusissa pohjaesiputkissa, veden painekorkeuden mittauksia, pohjavesi- ja mikro-binäytteenottoa pohjavesiputkista, matalista kalliorei’istä sekä pumppausvälistä reiässä OL-KR14, vesinäytteenottoa lysimetreistä ja resistiivisyysmittauksia maakerroksesta. Tutkimusaineistoon lisättiin myös alueella tehtyjen koekuoppatutkimusten tulokset sekä hydrogeologiset mittaukset lähialueen kairarei’istä. Samanaikaisesti kenttätutkimusten kanssa tutkimusalueelta aiemmin laadittu yksityiskohtainen hydrogeologinen malli päivitettiin. Kenttätutkimusten lisäksi laadittiin reaktiivisen kulkeutumisen ja virtauksen ennuste-mallit. Reaktiivisen kulkeutumismallinnuksen tavoitteena oli yhdistää onnistuneesti maaperässä ja kallioperän hyvin vettä johtavassa rakovyöhykkeessä pumppauksen vai-kutuksesta tapahtuvat hydrodynaamiset prosessit ja kemialliset reaktiot. Laskelmat tehtiin TOUGHREACT ohjelmistolla hyväksikäyttäen EQ3/6 tietokantatyökalua. Lisäksi, OL-KR14 pumppauksen pohjavesivaikutusten arvioimista ja tutkimusalueen vesitaseen määrittämistä varten laadittiin yksityiskohtainen pintahydrologinen malli. Tässä raportissa esitetään suotaumakokeen tavoitteet, koejärjestelyt ja perustilan tut-kimusaineisto tuloksineen. Lisäksi esitetään tutkimusalueen päivitetty hydrogeologinen malli sekä virtaus- ja reaktiivisen mallinnuksen ennustelaskelmat tuloksineen. Avainsanat: Suotautumiskoe, perustilan tulokset, koejärjestely, monitorointi, ennusteet.

1
TABLE OF CONTENTS ABSTRACT TIIVISTELMÄ 1� INTRODUCTION .................................................................................................... 3�
2� EXPERIMENTAL SITE AND SETUP ...................................................................... 5�
3� RESULTS OF EXPERIMENTAL SITE CHARACTERIZATION ............................ 11�
3.1� Overburden investigation ............................................................................ 11�
3.2� Thickness of overburden and elevation of bedrock surface ........................ 13�
3.3� Geological investigations ............................................................................ 15�
3.3.1� Core logging of drillholes OL-PP66-PP69 ....................................... 15�
3.3.2� Optical imaging and compilation of database of transmissive fractures .......................................................................................... 16�
3.4� Electrical tomography .................................................................................. 21�
3.5� Hydrogeological measurements .................................................................. 28�
3.5.1� Difference flow measurements........................................................ 28�
3.5.2� Head and water table level monitoring ............................................ 34�
3.5.3� Transverse flow measurements ...................................................... 43�
3.5.4� Slug measurements ........................................................................ 44�
3.6� Hydrogeochemical samplings and analysis results ..................................... 45�
3.6.1� Groundwater sampling .................................................................... 45�
3.6.2� Lysimeters ....................................................................................... 45�
3.6.3� Groundwater observation tubes ...................................................... 46�
3.6.4� Shallow drillholes ............................................................................ 48�
3.6.5� Deep Drillhole OL-KR14 ................................................................. 51�
3.6.6� Comparison with existing hydrogeochemical data .......................... 53�
3.7� Microbiological sampling and analysis ........................................................ 58�
4� UPDATED HYDROGEOLOGICAL MODEL OF THE EXPERIMENT SITE .......... 61�
5� PREDICTIONS OF HYDROGEOCHEMICAL AND HYDROLOGICAL CONDITIONS ....................................................................................................... 63�
5.1� Reactive transport calculations ................................................................... 63�
5.1.1� Water compositions and reactive minerals ..................................... 63�
5.1.2� Kinetic mineral dissolution and precipitation ................................... 65�
5.1.3� Cation exhange ............................................................................... 67�
5.1.4� Results - Influence of pumping on kinetic calculations .................. 68�
5.2� Results of flow simulations .......................................................................... 79�
5.2.1� Model and data ............................................................................... 79�
5.2.2� Drawdown of groundwater level ...................................................... 81�
5.2.3� Drawdown of hydraulic head at pumping level ................................ 82�
2
5.2.4� Drawdown of hydraulic head at depth 8 m below soil surface ........ 85�
5.2.5� Thickness of unsaturated bedrock layer ......................................... 85�
5.2.6� Recharge through overburden-bedrock interface ........................... 85�
6� SUMMARY ........................................................................................................... 89�
REFERENCES ............................................................................................................. 93�
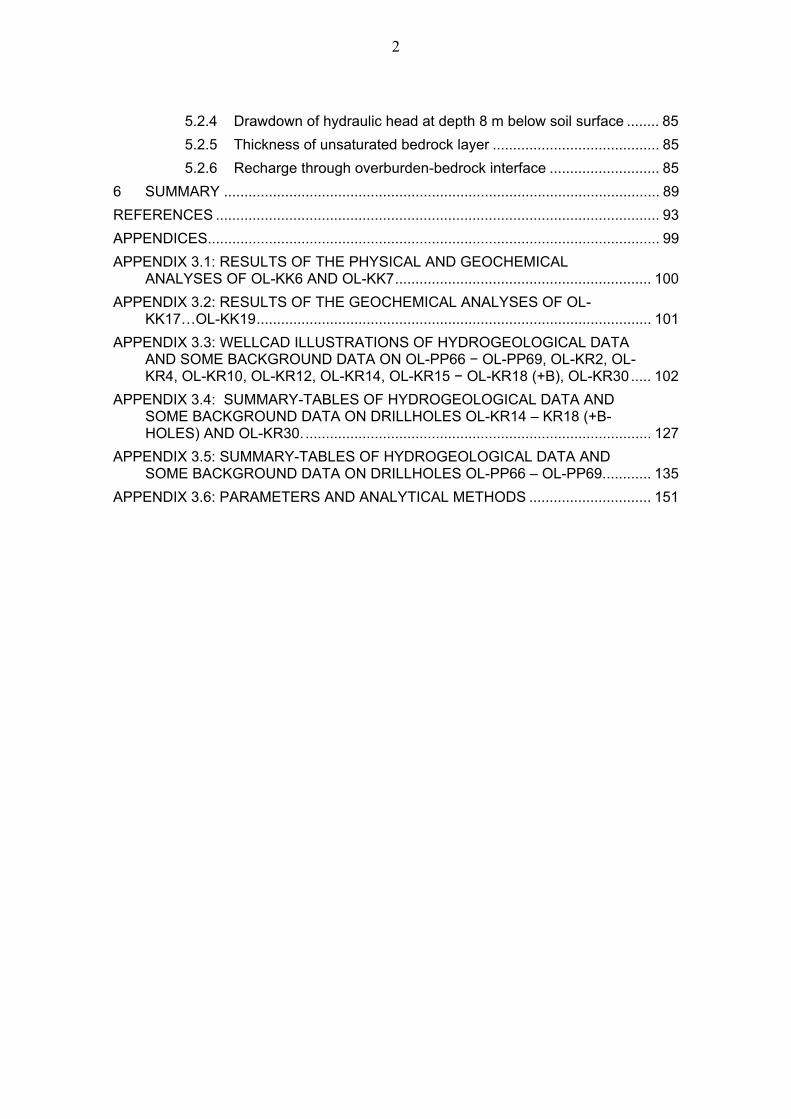
APPENDICES ............................................................................................................... 99�
APPENDIX 3.1: RESULTS OF THE PHYSICAL AND GEOCHEMICAL ANALYSES OF OL-KK6 AND OL-KK7 ............................................................... 100�
APPENDIX 3.2: RESULTS OF THE GEOCHEMICAL ANALYSES OF OL-KK17…OL-KK19 ................................................................................................. 101�
APPENDIX 3.3: WELLCAD ILLUSTRATIONS OF HYDROGEOLOGICAL DATA AND SOME BACKGROUND DATA ON OL-PP66 � OL-PP69, OL-KR2, OL-KR4, OL-KR10, OL-KR12, OL-KR14, OL-KR15 � OL-KR18 (+B), OL-KR30 ..... 102�
APPENDIX 3.4: SUMMARY-TABLES OF HYDROGEOLOGICAL DATA AND SOME BACKGROUND DATA ON DRILLHOLES OL-KR14 – KR18 (+B-HOLES) AND OL-KR30. ..................................................................................... 127�
APPENDIX 3.5: SUMMARY-TABLES OF HYDROGEOLOGICAL DATA AND SOME BACKGROUND DATA ON DRILLHOLES OL-PP66 – OL-PP69. ........... 135�
APPENDIX 3.6: PARAMETERS AND ANALYTICAL METHODS .............................. 151�

3
1 INTRODUCTION
The geochemical evolution of groundwater is strongly affected by infiltration from the surface. In natural conditions in Olkiluoto most of the geochemical reactions occur along the first few tens of metres of the flow path, in an interface between aerobic and anaerobic conditions. The volume and activity of the geochemical reactions is very high at this depth compared with deeper groundwater conditions. The dissolved aggressive agents, CO2 and O2, of the infiltrating water are consumed and hydrogeochemistry stabilizes on neutral and anaerobic conditions due to weathering and biogeochemical processes. Carbon dioxide is mainly generated in the soil layer by the aerobic respiration of organic carbon, which is an effective oxygen consumer in natural conditions (Chapter 7 in Posiva 2009). Microbial activity dominates in oxygen consumption and in activating anaerobic buffering processes using dissolved organic carbon (DOC) as an energy source. The dissolution and the precipitation of fracture minerals such as calcite, sulphides and silicates are the major buffering processes consuming CO2 and O2 (if not consumed in overburden) in the bedrock. As a consequence of this evolution, reaction fronts are formed in the flow channels between acid-neutral and aerobic-anaerobic interfaces. The reaction fronts may gradually move along the flow direction depending on the flow rate, the mass fluxes and the buffering capacity of the flow path, which correlates with the amount of buffering minerals, but depends also on the specific dissolution rates of minerals (see Luukkonen 2006). The possible intrusion of seawater also changes the redox chemistry of groundwater. In natural state these fronts seem to exist very near the surface in Olkiluoto, usually even in the overburden, partly in organic-rich soil and below it in the till layer. The construction of ONKALO may, however, increase the hydraulic gradient and flow into the bedrock, which can move these fronts to greater depths and decrease the buffering capacity of the rock fractures against surficial water infiltration. The loss of the buffering capacity may be harmful to long-term repository safety, because hydrogeochemical conditions will not be stabilized near the surface. Particularly during strong environmental transients such as deglaciation, a high edge of retreating continental ice sheet may cause infiltration of oxygenated glacial melt water to a great depth. A field experiment, an infiltration experiment to investigate potential changes in pH and redox conditions and in buffering capacity as well as the hydrogeochemical processes related to groundwater infiltration was started in late 2008 near ONKALO according to the plan presented in Pitkänen et al. (2008). The idea is to monitor the major infiltration flow path from the ground surface into the upper part of ONKALO at a depth of about 50 to 100 m depending on the observations made during the experiment. Infiltration is activated by pumping a highly transmissive fracture zone in drillhole OL-KR14. The pumping interval is part of site scale hydrogeological feature HZ19A (Posiva 2009). The influence of pumping is followed in the nearest drillholes and groundwater observation tubes through hydrogeological measurements, groundwater and microbiological samplings.

4
Before the test was started new monitoring drillholes and groundwater observation tubes were installed in the test area and very detailed baseline investigations were carried out in the test area. Baseline investigations include flow and transverse flow measurements in shallow drillholes, SLUG measurements in groundwater observation tubes, head monitoring, groundwater and microbiological sampling and analysis, resistivity measurements of the overburden layer and installation of lysimeters, and water sampling. This report presents the experimental setup and the results of these baseline investigations. The Report also updates the detailed hydrogeological structural model of the test area. The first hydrogeochemical and hydrogeological predictions of the experiment are also reported here.

5
2 EXPERIMENTAL SITE AND SETUP
The infiltration experiment was set up in the area of deep drillholes OL-KR14 � OL-KR18 (Figure 2-1). Pumping started in OL-KR14 from a packered off section at a depth of 13 – 18.2 m on December 9, 2008. A shallow pumping depth was chosen in order to follow the first metres of infiltration, which are known to be hydrogeochemically the most active along flow paths, and to be critical in stabilizing chemical conditions in groundwater (see Chapter 7 in Posiva 2009, Pitkänen et al. 1999a). The pumping section has high transmissivity (> 10-5 m2/s) and is in direct hydraulic connection to the core of the HZ19A system (see Chapter 3.5). The pumping rate was set to maximum level, 2.8 L/min. Groundwater is pumped from the sampling section to the pumping tank and from the tank to the surface. Water level in the tank is monitored daily with manual groundwater table measurements. On the surface the water is led to the field monitoring system, where pH, electrical conductivity, Eh and dissolved oxygen are measured continuously. After the measurements water is pumped to a ditch that flows away from the test area to prevent the infiltration of the pumped water in the test area. The pumping setup is presented in Figure 2-2.
Figure 2-1. A map of infiltration experiment area with the holes, which will be monitored during the test. Holes L3, L8, PA2 and PVP2, which are monitoring holes in the Olkiluoto Monitoring –program, are also shown (Posiva 2003). Outcrop areas are shown in orange colour. (Map updated by Henry Ahokas Pöyry Environment).

6
water level in tank
13.0 m
18.2 m
most conductive fracture at 13.4 m
casing 9.5 m
ground surface
overburden 6.2 m
packers
bedrock
rods (5.2 m)
4 hoses, diameter 12/10 mm
pump
gw-sampling tool
water level betweencasing and pump tank cannot be monitored
pump tank
hole for water levelmeasurement
head below samplingsection is not measured
Figure 2-2. Pumping setup in drillhole OL-KR14 (Figure by Henry Ahokas, Pöyry Environment).
The experiment is monitored with an intensive monitoring network, which consists of on-line monitoring of groundwater (volume, t, EC, pH, O2, Eh) pumped from OL-KR14, and groundwater head and groundwater table monitoring in numerous drillholes and observation tubes (Table 2-1) at the site. Flow measurements and transverse flow measurements in shallow drillholes as well as periodic groundwater sampling and near surface resistivity measurements are also included in monitoring programme. All deep drillholes in the vicinity of the experiment site and the B-holes of OL-KR15 � OL-KR18 are packered off for online hydraulic head monitoring (Table 2-1). The packers were installed to isolate the hydraulically conductive features in the drillholes. Before pumping started in OL-KR14, the baseline pressure values were measured and the results are presented in Chapter 3.5. The surface monitoring network of the experiment was expanded with four shallow drillholes (OL-PP66 – OL-PP69), nine new groundwater observation tubes (OL-PVP21 � OL-PVP29), and nine plate type lysimeters (LP01 – LP09) around pumping well OL-
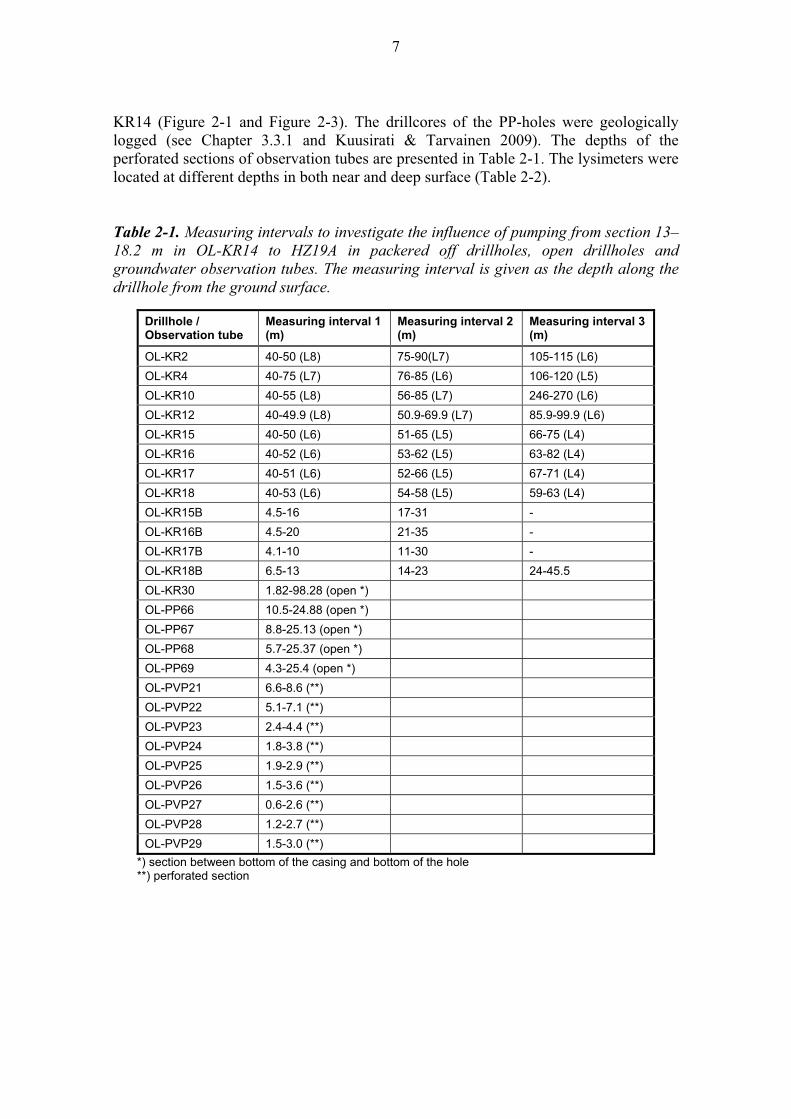
7
KR14 (Figure 2-1 and Figure 2-3). The drillcores of the PP-holes were geologically logged (see Chapter 3.3.1 and Kuusirati & Tarvainen 2009). The depths of the perforated sections of observation tubes are presented in Table 2-1. The lysimeters were located at different depths in both near and deep surface (Table 2-2). Table 2-1. Measuring intervals to investigate the influence of pumping from section 13–18.2 m in OL-KR14 to HZ19A in packered off drillholes, open drillholes and groundwater observation tubes. The measuring interval is given as the depth along the drillhole from the ground surface.
Drillhole / Observation tube
Measuring interval 1 (m)
Measuring interval 2 (m)
Measuring interval 3 (m)
OL-KR2 40-50 (L8) 75-90(L7) 105-115 (L6) OL-KR4 40-75 (L7) 76-85 (L6) 106-120 (L5) OL-KR10 40-55 (L8) 56-85 (L7) 246-270 (L6) OL-KR12 40-49.9 (L8) 50.9-69.9 (L7) 85.9-99.9 (L6) OL-KR15 40-50 (L6) 51-65 (L5) 66-75 (L4) OL-KR16 40-52 (L6) 53-62 (L5) 63-82 (L4) OL-KR17 40-51 (L6) 52-66 (L5) 67-71 (L4) OL-KR18 40-53 (L6) 54-58 (L5) 59-63 (L4) OL-KR15B 4.5-16 17-31 - OL-KR16B 4.5-20 21-35 - OL-KR17B 4.1-10 11-30 - OL-KR18B 6.5-13 14-23 24-45.5 OL-KR30 1.82-98.28 (open *) OL-PP66 10.5-24.88 (open *) OL-PP67 8.8-25.13 (open *) OL-PP68 5.7-25.37 (open *) OL-PP69 4.3-25.4 (open *) OL-PVP21 6.6-8.6 (**) OL-PVP22 5.1-7.1 (**) OL-PVP23 2.4-4.4 (**) OL-PVP24 1.8-3.8 (**) OL-PVP25 1.9-2.9 (**) OL-PVP26 1.5-3.6 (**) OL-PVP27 0.6-2.6 (**) OL-PVP28 1.2-2.7 (**) OL-PVP29 1.5-3.0 (**)
*) section between bottom of the casing and bottom of the hole **) perforated section
8
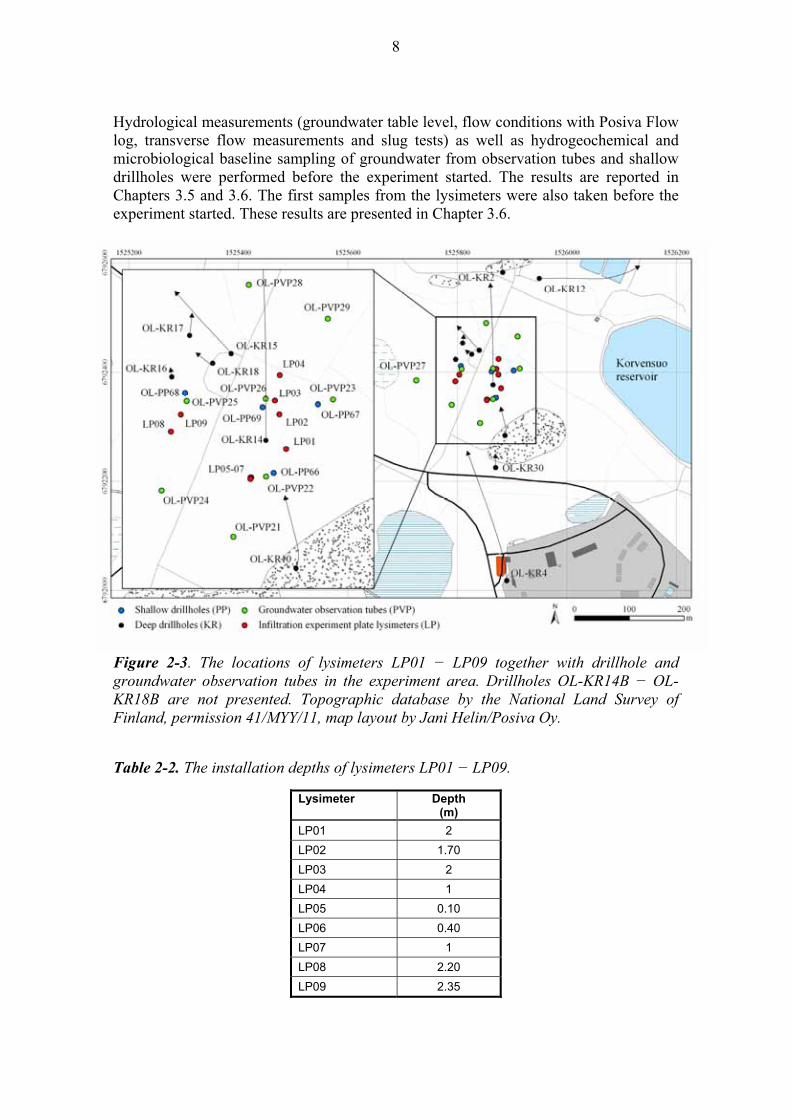
Hydrological measurements (groundwater table level, flow conditions with Posiva Flow log, transverse flow measurements and slug tests) as well as hydrogeochemical and microbiological baseline sampling of groundwater from observation tubes and shallow drillholes were performed before the experiment started. The results are reported in Chapters 3.5 and 3.6. The first samples from the lysimeters were also taken before the experiment started. These results are presented in Chapter 3.6.
Figure 2-3. The locations of lysimeters LP01 � LP09 together with drillhole and groundwater observation tubes in the experiment area. Drillholes OL-KR14B � OL-KR18B are not presented. Topographic database by the National Land Survey of Finland, permission 41/MYY/11, map layout by Jani Helin/Posiva Oy.
Table 2-2. The installation depths of lysimeters LP01 � LP09.
Lysimeter Depth(m)
LP01 2 LP02 1.70 LP03 2 LP04 1 LP05 0.10 LP06 0.40 LP07 1 LP08 2.20 LP09 2.35

9
The experiment area was also monitored by means of resistivity measurements. Baseline measurements were carried out in the autumn of 2008 and the results are reported in Chapter 3.4. The aim is to monitor potential changes in resistivity in the overburden to see how humidity changes around pumped drillhole OL-KR14. Repeated measurements may give accurate information about the drainage and movement of the groundwater to show infiltration paths from overburden to bedrock.

10

11
3 RESULTS OF EXPERIMENTAL SITE CHARACTERIZATION
3.1 Overburden investigation
Overburden investigations of the infiltration area cover five deep soil pits; OL-KK6 and OL-KK7 sampled in 2002 and OL-KK17, OL-KK18 and OL-KK19 sampled in 2008. The locations of the test pits are shown in Figure 3-1. Samples were taken in the vertical profiles of the soil pits from humus and from two to three different mineral soil layers down to bedrock, if possible. The pedogenic soil horizons were poorly developed due to the short time span of land uplift (Mäkiaho 2005; Haapanen et al. 2009). The sampling depth of OL-KK6 was 4 m and the groundwater level was at 1 m. Unoxidised conditions started at a depth of 2 m. The depth of OL-KK7 was 2 m and the groundwater level was at 1.7 m. No observations on oxidising or unoxidising conditions were made. The geotechnical analysis of the mineral soil layers in OL-KK6 and OL-KK7 included grain size distribution, moisture, compactness, stone content and size, specific area, particle density, humus and water content. The mineralogical composition was determined from grain size fractions < 2 mm and < 0.002 mm by XRD. Two chemical digestions were used to emulate different environmental conditions. The easily soluble/bioavailable element concentrations were analysed by “synthetic rainwater” leach (deionised water and HNO3, pH 4.5). The total concentrations were established by strong HNO3 digestion. Electric conductivity and anions were analysed by water leach, pH using both water and CaCl2-leaches and cation exchange capacity (CEC) by BaCl2-leach (Lintinen et al. 2003). The overburden of OL-KK6 and OL-KK7 was sandy till. The pH varied from surface to subsoil from 6.3 to 8.0. Water-leached pH values were 0.5 – 1.0 units higher than those measured in a saline solution. CEC was somewhat higher in OL-KK7 than in OL-KK6. Calcium was the dominant cation. Sodium concentration was clearly higher in OL-KK7 than in OL-KK6. Chlorine concentrations varied from 2.0 to 3.8 mg/kg and SO4 from 11 to 61 mg/kg (Lintinen et al. 2003). The results of the physical and geochemical analyses of OL-KK6 and OL-KK7 are shown in Appendix 3.1. The sampling depths of OL-KK17 – OL-KK19 varied from 110 to 235 cm. The groundwater level was not obtained and bedrock was not reached, due to the overburden thickness. The lysimeters (LP05 � LP07) were installed in OL-KK17 at 10, 40 and 100 cm depths, in OL-KK18 (LP08) at 220 cm and in OL-KK19 (LP09) at 235 cm depth. The samples of OL-KK17 – OL-KK19 were collected from the humus and two mineral soil layers. The thickness of the humus layers varied from 20 to 30 cm. The soil type was sandy till in OL-KK17 and fine-grained till with some silt and clay layers in OL-KK18 and OL-KK19. Clay and silt are the most active fractions in till soils due to their large active reactive surface area (Birkeland 1974). Stones were also common, some up to ca. 0.5 – 1 m in diameter. Multi-element analyses of the bioavailable/easily leachable concentrations were made with partial dissolution using buffered ammonium acetate at pH 4.5 and total concentrations by hydrofluoric acid-perchloric acid digestion. In addition, grain size

12
distribution, pH, dry weight, moisture, organic matter content, total N and C, TOC, Se and I were determined. Exchangeable cations were measured with cation exchange capacity and base saturation calculations. The pH values of OL-KK17 – OL-KK19 varied from 3.3 to 7.7, increasing with the soil depth, which is typical of Finnish soil profiles. The organic matter, carbon and nitrogen contents in the humus horizon varied between the soil pits, although these sites are situated close to each other. Cation exchange capacity and base saturation also varied between different soil pits and layers. The most nutrient-rich soil was in OL-KK17, while OL-KK19 was nutrient-poor. Calcium and magnesium were the dominant cations. Selenium and iodine levels were much higher in OL-KK17 than in OL-KK19. Sulphur, phosphorus, iron, zinc and sodium were enriched in the humus horizon, and aluminium and iron in the mineral soil layers (Lahdenperä 2009). The results of the geochemical analyses of OL-KK17 – OL-KK19 are shown in Appendix 3.2.
Figure 3-1. Soil investigation sites on Olkiluoto Island. Topographic database by the National Land Survey of Finland, permission 41/MYY/11, map layout by Jani Helin/Posiva Oy.

13
3.2 Thickness of overburden and elevation of bedrock surface
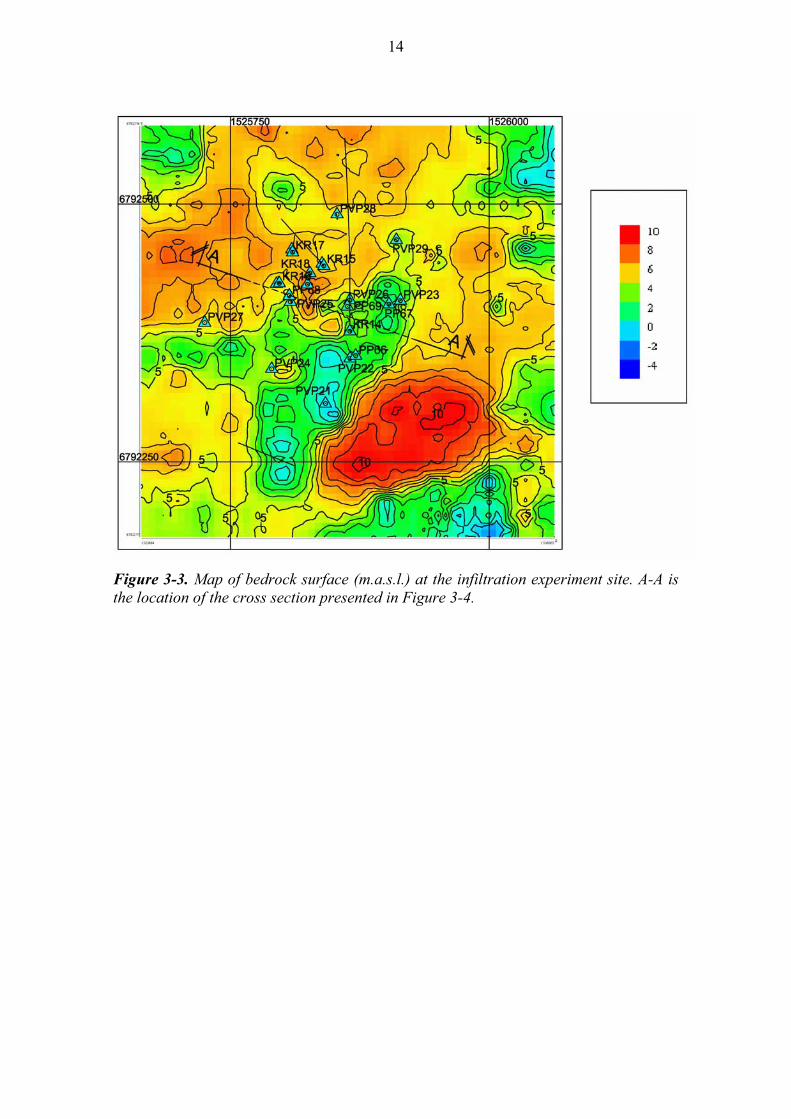
The maps of overburden thickness and bedrock surface elevation were reported in the plan of the infiltration experiment (Pitkänen et al. 2008). These models have been updated with new data from drillholes OL-PP66 – OL-PP69 and observation tubes OL-PVP21 – OL-PVP29. The map and the contours of the thickness of the overburden are shown in Figure 3-2 and the elevation of the bedrock surface (m.a.s.l.) is shown in Figure 3-3. Vertical cross-section A-A with the holes and the thickness of the overburden is shown in Figure 3-4. Figure 3-4 also shows the core of site-scale zone HZ19A according to Posiva (2009), Vaittinen et al. (2009), which deviates slightly from the model of Andersson et al. (2007). A more detailed description of the character of zone HZ19A and the possible hydraulic connections between drillholes and observation tubes is shown in Chapter 4.
Figure 3-2. Map of overburden thickness (m) at the infiltration experiment site. A-A is the location of the cross section presented in Figure 3-4.
14
Figure 3-3. Map of bedrock surface (m.a.s.l.) at the infiltration experiment site. A-A is the location of the cross section presented in Figure 3-4.

15
A A
Figure 3-4. Vertical cross section (A-A in Figures 3-2 and 3-3) of overburden thickness, rock surface and the core of HZ19A (Posiva 2009, Vaittinen et al. 2009) at the infiltration experiment site for the uppermost 50 m.
3.3 Geological investigations
3.3.1 Core logging of drillholes OL-PP66-PP69
Four shallow investigation holes (about 25 m each) were drilled at the infiltration experiment site in June 2008. The identification numbers of the holes are OL-PP66, OL-PP67, OL-PP68 and OL-PP69 (Figure 2-1). The drillholes are 76 mm in diameter (Kuusirati & Tarvainen 2009). The following parameters were logged in drill core mapping: lithology, foliation, fracture parameters, fractured zones, core loss, weathering, fracture frequency, RQD and rock quality. Drill cores OL-PP66 � OL-PP69 consist mostly of diatexitic gneiss (48.9 %), veined gneiss (39.2 %), pegmatitic granite (10.3 %) and mica gneiss (1.6 %) (Kuusirati & Tarvainen 2009). The average fracture frequency in different holes varied from 3.9 pcs/m to 5.8 pcs/m. The majority of the fractures were only thinly filled with kaolinite. Other commonly appearing minerals were calcite, pyrite, clay minerals and chlorite. The results of core logging are reported by Kuusirati & Tarvainen (2009). A detailed analysis of fracture coating minerals and their volumetric abundances will be reported later.

16
3.3.2 Optical imaging and compilation of database of transmissive fractures
Optical imaging (OBI) of drillholes OL-PP66 – OL-PP69 was carried out with an optical televiewer (Kuusirati & Tarvainen 2009). The fracture orientations of drillholes OL-PP66 – OL-PP69 were interpreted and mapped from OBI images. The interpretation of fractures is performed in two phases: first, all clear fractures were identified from the OBI images, and next, these results were compared with the fracture data listed in drill core logging (Kuusirati & Tarvainen 2009) and hydraulic data from difference flow measurements, PFL DIFF (Pöllänen 2009). The input data include:
1. depth corrected optical images (OBI 40; resolution 720 pix horizontal, 0.5 mm vertical) directed to site North (KKJ1),
2. positions and cutting angles of natural fractures interpreted from drill core samples and,
3. positions and transmissivity values of hydraulically conductive fractures according to Flow Log measurements (10 cm point interval with 50 cm packer distance).
All the fractures listed in drill core logging were found in OBI images. Interpretation from OBI images, on the other hand, identified eleven additional transmissive fractures, of which two were found in a core loss section and four were possible leakages in the contact of the casing and the bedrock. Some of the transmissive fractures were not listed in drill core logging (Figure 3-5). These fractures are not very clear in OBI images either. Transmissivity may concentrate in very small aperture channels or there are uncertainties in flow measurements.

17
Figure 3-5. Summary of oriented core fractures and transmissive (conductive) fractures in OL-PP66. The transmissivity at a depth of 7.3 m is leakage in the casing. Fractures deeper than 21.5 m could not be oriented due to lack of TV-image.

18
Table 3-1. Transmissive fractures with their orientation based on interpretation of optical televiewer images and core logging. Some open fractures in images are not transmissive. Transmissivities are from Pöllänen (2009). a) Drillholes OL-PP66 and OL-PP67, b) Drillholes OL-PP68 and OL-PP69.
a)
Fracture depth in core
(m)
Fracture depth in
image (m) DIP DIRECTION (°) DIP (°)
Depth in PFL
(m) T (m2/s) APERTURE CLASS*
OL-PP66 7.3 3.3E-08
10.44 10.27 52.6 78.2 10.4 1.7E-06 2 core loss 12.78 133.4 75.3 13.1 5.6E-08 2 core loss 13.49 73.8 45.7 13.7 2.8E-08 5
14.21 14.24 114.3 40.1 14.4 7.6E-09 4 16.15 16.1 327.8 28.8 16.2 1.0E-07 3 16.72 16.74 141.9 31.6 16.8 9.5E-09 2
18.01 169.7 37.9 18.1 3.1E-09 2 18.67 18.66 140.6 36.5 18.7 1.8E-08 2 20.75 20.74 126.9 39.6 20.8 1.0E-08 3 21.22 21.2 127.4 45.2 21.3 5.6E-06 4
OL-PP67 8.72 125.96 54.19 8.8 1.5E-06 3
10.01 10 302.6 28.7 10 8.7E-08 2 11.08 11.01 91.3 78.9 11 4.6E-08 2
11.23 127.7 66.3 11.4 6.5E-08 2 11.97 11.95 141.5 48.3 12 2.5E-06 5 13.82 13.81 55.8 10.5 13.8 1.1E-08 2 14.18 14.16 343.3 69.1 14.1 5.0E-07 3 14.93 14.9 300.2 41.8 14.9 4.1E-07 3 15.58 15.55 162.3 42.9 15.6 1.9E-08 2 16.68 16.65 124.3 17.7 16.7 3.1E-08 2 17.53 17.51 128.2 27.8 17.5 6.3E-08 3 18.3 18.26 156.4 20.6 18.3 5.9E-08 2
19.25 19.23 65.2 31.9 19.3 1.0E-08 2 20.2 73.2 15.6 20.2 2.0E-08 2
20.61 20.55 203.9 26.2 20.6 4.9E-06 5 21.22 21.16 133.8 41.4 21.2 4.5E-09 1
22.09 109.5 29.3 22.1 2.5E-08 1 * 1: below detection limit (LOD) 2: LOD - 1 mm 3: 1-5 mm 4: 5-10 mm 5: >10 mm

19
b) Fracture depth in core (m)
Fracture depth in
image (m) DIP DIRECTION
(°) DIP (°)Depth in PFL
(m) T (m2/s) APERTURE
CLASS*
OL-PP68 6.55 6.59 115.81 37.8 6.55 1.1E-08 2
10.66 10.69 135.6 1.5 10.64 1.2E-06 2 11.68 329.6 39.3 11.54 3.0E-09 2
12.6 12.65 347.9 54.1 12.54 6.9E-08 2 12.98 13.41 205.8 82.0 13.04 3.8E-07 3 13.66 13.67 72.1 25.2 13.64 1.1E-06 2 14.72 14.7 99.2 11.5 14.74 2.6E-09 1 15.77 15.76 254.0 10.8 15.63 1.9E-07 2
16.56 144.9 27.0 16.43 7.7E-09 2 17.12 16.99 131.6 80.9 17.03 8.1E-08 2 18.86 18.75 84.0 69.8 18.43 2.4E-07 3 19.26 19.21 115.1 47.6 19.03 1.5E-07 1 19.54 19.47 121.5 73.5 19.53 1.3E-07 3 20.94 20.87 194.1 7.8 20.73 1.0E-07 2 23.46 23.46 113.7 35.2 23.5 7.0E-08 5
OL-PP69 7.08 7.07 130.91 29.51 7 3.3E-07 3 7.55 7.53 94.5 65.3 7.3 3.6E-08 4 8.51 8.49 136.5 49.3 8.4 8.3E-08 2 9.73 9.71 110.1 19.4 9.6 1.8E-06 4 9.97 9.98 124.9 66.6 9.9 8.9E-08 2
10.58 10.57 131.2 14.7 10.5 8.4E-08 2 11.38 11.36 158.4 37.0 11.2 9.3E-08 2 11.86 11.83 107.1 22.7 11.8 9.7E-08 2
12.47 127.7 21.2 12.4 3.9E-07 2 13.66 13.66 147.3 46.5 13.5 1.9E-09 1
14.82 158.2 21.1 14.8 5.9E-09 2 16.24 16.24 170.1 79.1 16.1 1.1E-07 2 18.14 18.13 73.0 13.4 18.1 2.2E-08 2 18.34 18.33 74.3 60.2 18.4 3.5E-08 2 19.01 19 92.0 23.3 18.9 5.0E-08 2
19.55 84.0 13.2 19.4 8.1E-08 3 20.39 20.18 201.6 20.0 20.2 3.1E-07 2 20.76 20.62 105.4 18.9 20.6 2.1E-07 1 21.17 21.09 73.3 65.9 21.1 8.8E-08 3
23 23.02 159.4 3.5 22.9 7.0E-07 2 * 1: below detection limit (LOD) 2: LOD - 1 mm 3: 1-5 mm 4: 5-10 mm 5: >10 mm

20
An example of the summary of oriented core fractures and transmissive (conductive) fractures (in OL-PP66) is presented in Figure 3-6. Transmissive fractures with their orientation are listed in Table 3-1.
Figure 3-6. The orientation of all core fractures and transmissive (conductive) fractures in OL-PP66 – OL-PP69.

21
3.4 Electrical tomography
Near-surface resistivity and time-domain induced polarization (IP) baseline surveys have been carried out in the area above the assumed location of the intersection of the rock surface and hydrological zone HZ19A along three parallel surface measurement lines (profiles RES1, RES2 and RES3 in Figure 3-7). The objective of these measurements is to obtain background information about the natural water-content changes in the overburden layers. In the near future the results of these measurements will be compared with corresponding results of repeated time-lapse measurements (monitoring) carried out during the experiment and they will also be used as reference models to constrain the inversion of later-time data sets. The basic interpretive assumption is that the time-lapse changes in resistivities and chargeabilities are mainly
Figure 3-7. Resistivity profiles during baseline measurements in 2007 (black) and 2008 (red) at the infiltration experiment site. Vertical resistivity measurement tubes (OL-VMP1 – OL-VMP3) are also used in measurements.

22
due to water-content changes. Resistivities and chargeabilities will decrease in relation to increasing water-content and in relation to the resistivity background, although spatial and partly temporal variability in resistivities and chargeabilities is caused by many different physical and chemical factors (porosity, salinity, CEC, temperature, water-content, mineral content, electrical disturbances etc.). Baseline measurements were carried out in two time intervals (26.–28.10.2008 and 8.–10.12.2008) using a computer controlled multi-electrode system. Resistivity and IP measurements were carried out using electrodes both on the surface and in overburden. Surface electrodes were spread at 1-metre spacing between electrodes and overburden electrodes were fixed on the outer surfaces of three vertical plastic tubes (OL-VMP1, OL-VPM2, OL-VPM3) at a vertical spacing of 0.2 metres (Figure 3-7). The resistivity measurement tubes were installed permanently in overburden and their depths are 4.4 metres in OL-VMP1, 3.2 metres in OL-VMP2 and 3.2 metres in OL-VMP3. The applied Wenner-Sclumberger measurement protocol provided 10 different spacings, ranging from 1 to 12 metres for surface electrodes and from 0.2 to 2.4 metres for electrodes in the resistivity measurement tubes. Surface measurements were carried out in 40-metre long profile sections and a 20-metre overlap was used between consecutive profile sections along the RES-lines. Each individual 40-metre profile section included 460 independent tomographic, four-electrode measurements with varying distances between current and potential electrodes as well as between potential electrodes. Resistivity and IP measurements are most sensitive to resistivity/conductivity and chargeability changes in the volumes around electrodes and in the centre of the profile and the resolution becomes worse towards the sides and with depth. The approximate depth penetration is from 4 to 5 metres along the lines. The neasured continuous, vertical sounding data were inverted using automatic 2.5D optimization without any hydrogeological assumptions/constraints. In these interpretations each 40-metre long profile section is analysed separately. The inverted resistivity and chargeability distributions are presented as half-overlapping depth sections (See Figure 3-8, Figure 3-9, Figure 3-10, Figure 3-11, Figure 3-12 and Figure 3-13). The horizontal scale in these figures is the distance in metres from the south-eastern starting point of each profile and the vertical scale is the depth in metres from the surface level. During the time of the first baseline measurements the groundwater table was at 1.25 metres depth in OL-PVP23 (21.10.2009), at 2.06 metres depth in OL-PVP25 and at 1.67 metres depth in OL-PVP26. Correspondingly, during the second measurements (8.–10.12.2009) the depths were 1.35 – 1.42 metres in OL-PVP23, 1.64 – 1.87 metres in OL-PVP25 and 1.52 – 1.63 metres in OL-PVP26. It can be expected that water-content changes due to natural inputs and due to pumping in OL-KR14 will affect above and around depths of 2 to 2.5 metres. These are also soil/bedrock volumes where surface imaging with the selected measurement protocol has the highest sensitivity and resolution. The 1.70–metre level is marked as a blue horizontal line in each resistivity and chargeability section in Figure 3-8, Figure 3-9, Figure 3-10, Figure 3-11, Figure 3-12 and Figure 3-13 in order to facilitate the comparison of the results.
23
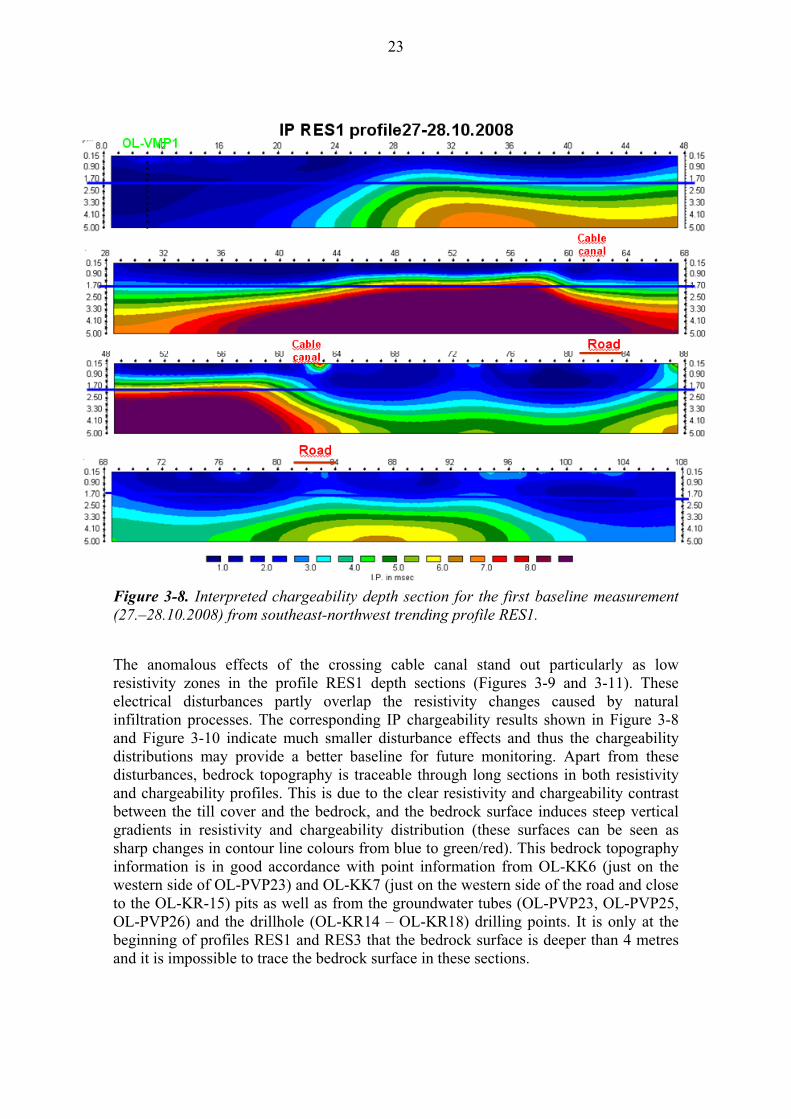
Figure 3-8. Interpreted chargeability depth section for the first baseline measurement (27.–28.10.2008) from southeast-northwest trending profile RES1.
The anomalous effects of the crossing cable canal stand out particularly as low resistivity zones in the profile RES1 depth sections (Figures 3-9 and 3-11). These electrical disturbances partly overlap the resistivity changes caused by natural infiltration processes. The corresponding IP chargeability results shown in Figure 3-8 and Figure 3-10 indicate much smaller disturbance effects and thus the chargeability distributions may provide a better baseline for future monitoring. Apart from these disturbances, bedrock topography is traceable through long sections in both resistivity and chargeability profiles. This is due to the clear resistivity and chargeability contrast between the till cover and the bedrock, and the bedrock surface induces steep vertical gradients in resistivity and chargeability distribution (these surfaces can be seen as sharp changes in contour line colours from blue to green/red). This bedrock topography information is in good accordance with point information from OL-KK6 (just on the western side of OL-PVP23) and OL-KK7 (just on the western side of the road and close to the OL-KR-15) pits as well as from the groundwater tubes (OL-PVP23, OL-PVP25, OL-PVP26) and the drillhole (OL-KR14 – OL-KR18) drilling points. It is only at the beginning of profiles RES1 and RES3 that the bedrock surface is deeper than 4 metres and it is impossible to trace the bedrock surface in these sections.

24
Figure 3-9. Interpreted resistivity depth section for the first baseline measurement (27.–28.10.2008) from southeast-northwest trending profile RES1.
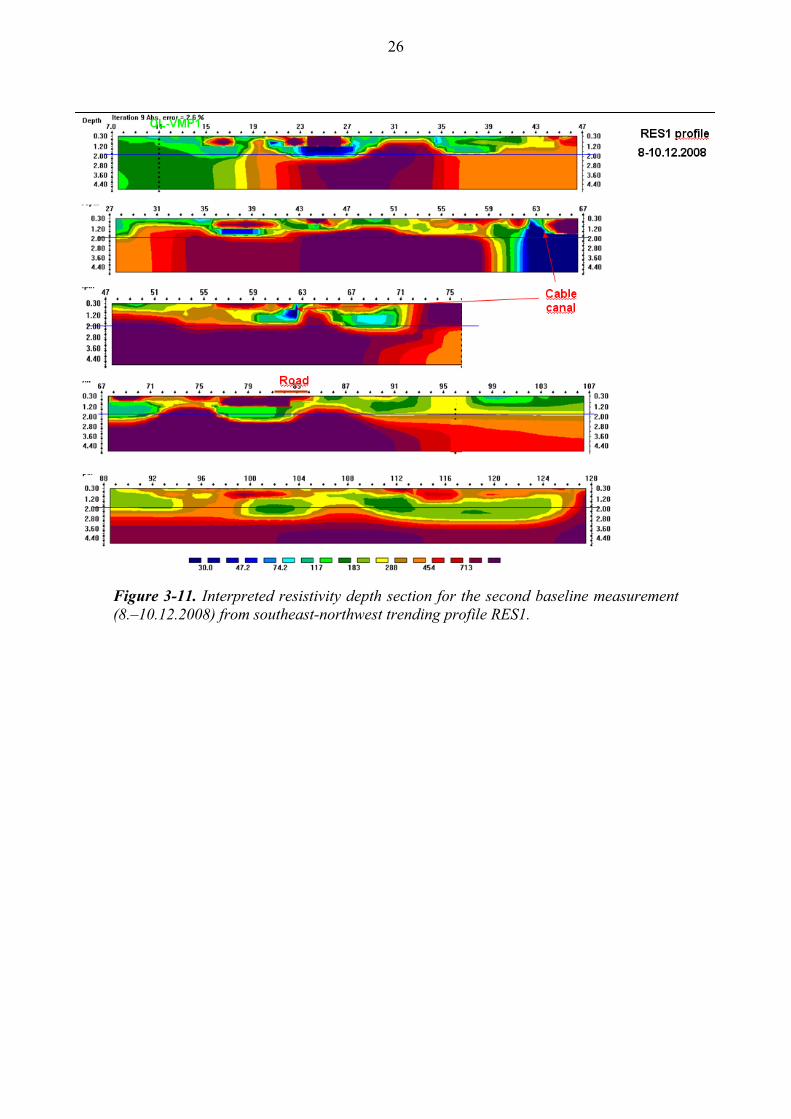
The lower groundwater table in the north-western part of the area compared to the profile sections on the eastern side of the road is distinguishable for example from profile RES1 results (Figure 3-9 and Figure 3-11), where time-lapse changes occur in thicker overburden sections on the western side of the road. There are clearly time-lapse changes in resistivities and chargeabilities also on deeper bedrock levels of the sections, but they are mostly imaging artefacts. Data inversions are strongly affected by data and modelling noise levels and these effects are higher in the deeper and in the margins of the sounding sections where tomographic current coverage is poor.

25
Figure 3-10. Interpreted chargeability depth section for the second baseline measurement (8.–10.12.2008) from southeast-northwest trending profile RES1.
26
Figure 3-11. Interpreted resistivity depth section for the second baseline measurement (8.–10.12.2008) from southeast-northwest trending profile RES1.

27
Figure 3-12. Interpreted chargeability depth profiles for the first and second (the second and fourth images) baseline measurements (27.–28.10.2008 and 8.–10.12.2008) from southeast-northwest trending profile RES2.
. Figure 3-13. Interpreted chargeability depth section for the first (upper) and second baseline measurements (27.–28.10.2008 and 8.–10.12.2008) from southeast-northwest trending profile RES3.
28
3.5 Hydrogeological measurements
The locations of the drillholes and observation tubes where measurements have been carried out and which are included in monitoring programme of the experiment are shown in Figure 2-1.
3.5.1 Difference flow measurements
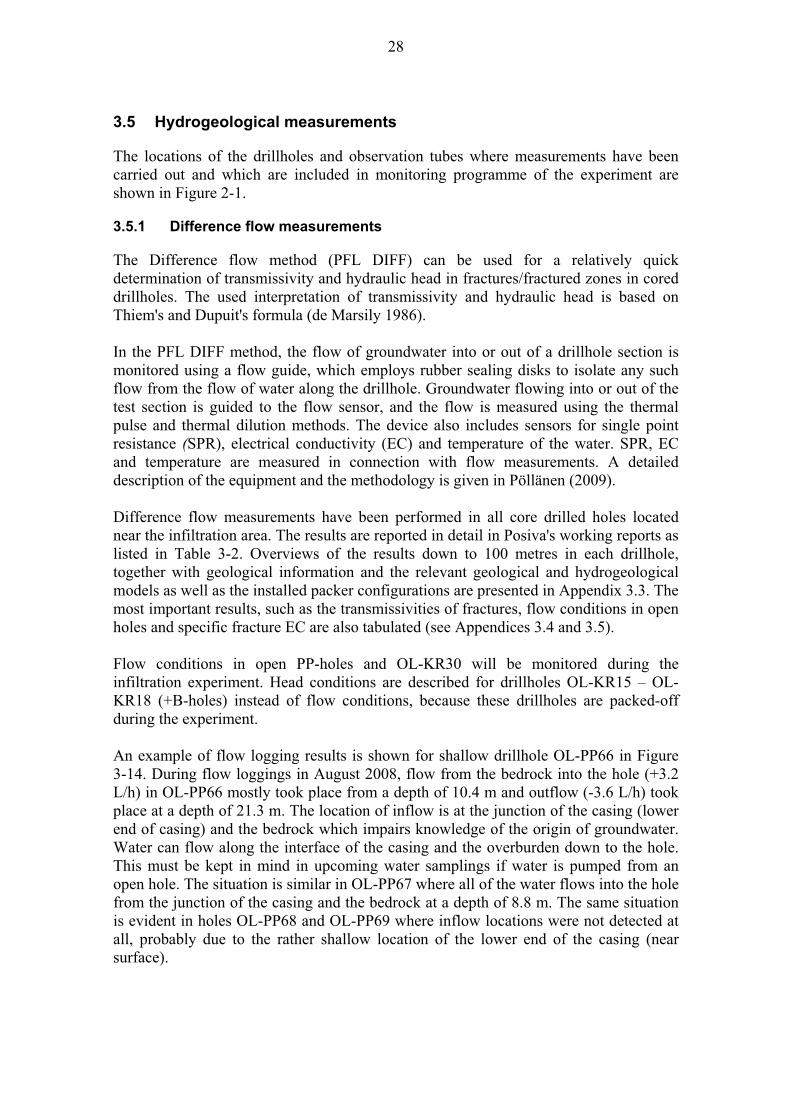
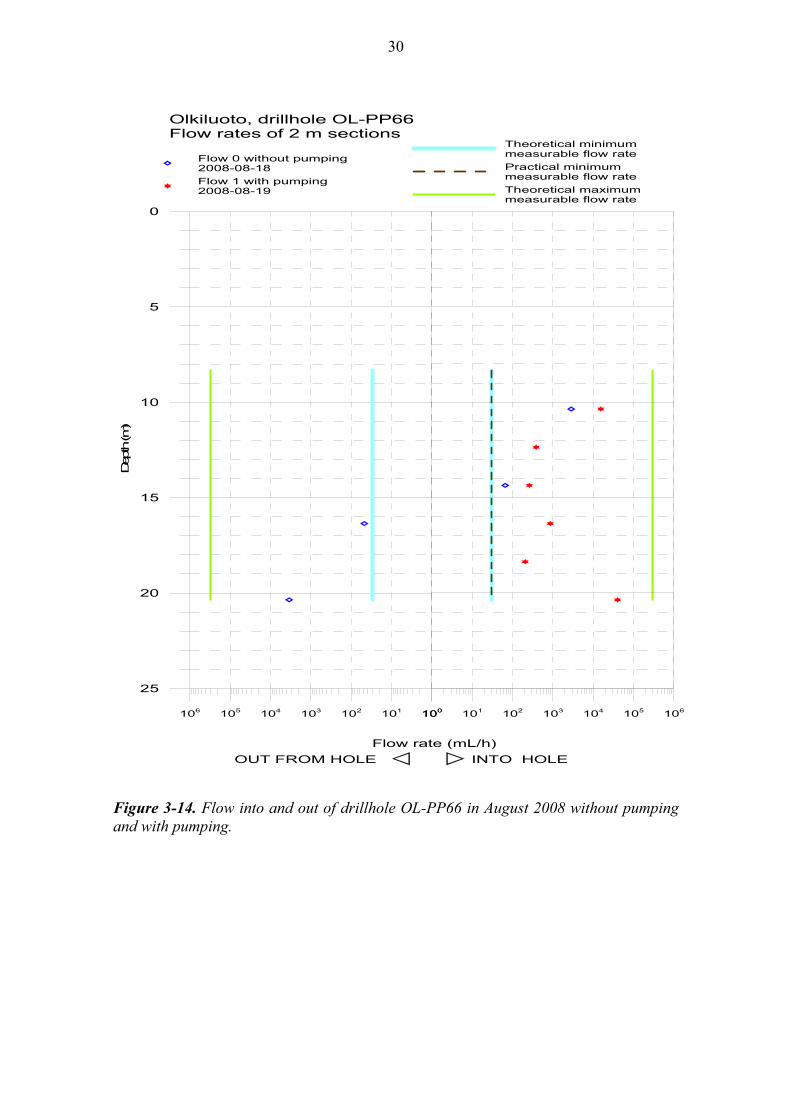
The Difference flow method (PFL DIFF) can be used for a relatively quick determination of transmissivity and hydraulic head in fractures/fractured zones in cored drillholes. The used interpretation of transmissivity and hydraulic head is based on Thiem's and Dupuit's formula (de Marsily 1986). In the PFL DIFF method, the flow of groundwater into or out of a drillhole section is monitored using a flow guide, which employs rubber sealing disks to isolate any such flow from the flow of water along the drillhole. Groundwater flowing into or out of the test section is guided to the flow sensor, and the flow is measured using the thermal pulse and thermal dilution methods. The device also includes sensors for single point resistance (SPR), electrical conductivity (EC) and temperature of the water. SPR, EC and temperature are measured in connection with flow measurements. A detailed description of the equipment and the methodology is given in Pöllänen (2009). Difference flow measurements have been performed in all core drilled holes located near the infiltration area. The results are reported in detail in Posiva's working reports as listed in Table 3-2. Overviews of the results down to 100 metres in each drillhole, together with geological information and the relevant geological and hydrogeological models as well as the installed packer configurations are presented in Appendix 3.3. The most important results, such as the transmissivities of fractures, flow conditions in open holes and specific fracture EC are also tabulated (see Appendices 3.4 and 3.5). Flow conditions in open PP-holes and OL-KR30 will be monitored during the infiltration experiment. Head conditions are described for drillholes OL-KR15 – OL-KR18 (+B-holes) instead of flow conditions, because these drillholes are packed-off during the experiment. An example of flow logging results is shown for shallow drillhole OL-PP66 in Figure 3-14. During flow loggings in August 2008, flow from the bedrock into the hole (+3.2 L/h) in OL-PP66 mostly took place from a depth of 10.4 m and outflow (-3.6 L/h) took place at a depth of 21.3 m. The location of inflow is at the junction of the casing (lower end of casing) and the bedrock which impairs knowledge of the origin of groundwater. Water can flow along the interface of the casing and the overburden down to the hole. This must be kept in mind in upcoming water samplings if water is pumped from an open hole. The situation is similar in OL-PP67 where all of the water flows into the hole from the junction of the casing and the bedrock at a depth of 8.8 m. The same situation is evident in holes OL-PP68 and OL-PP69 where inflow locations were not detected at all, probably due to the rather shallow location of the lower end of the casing (near surface).
29
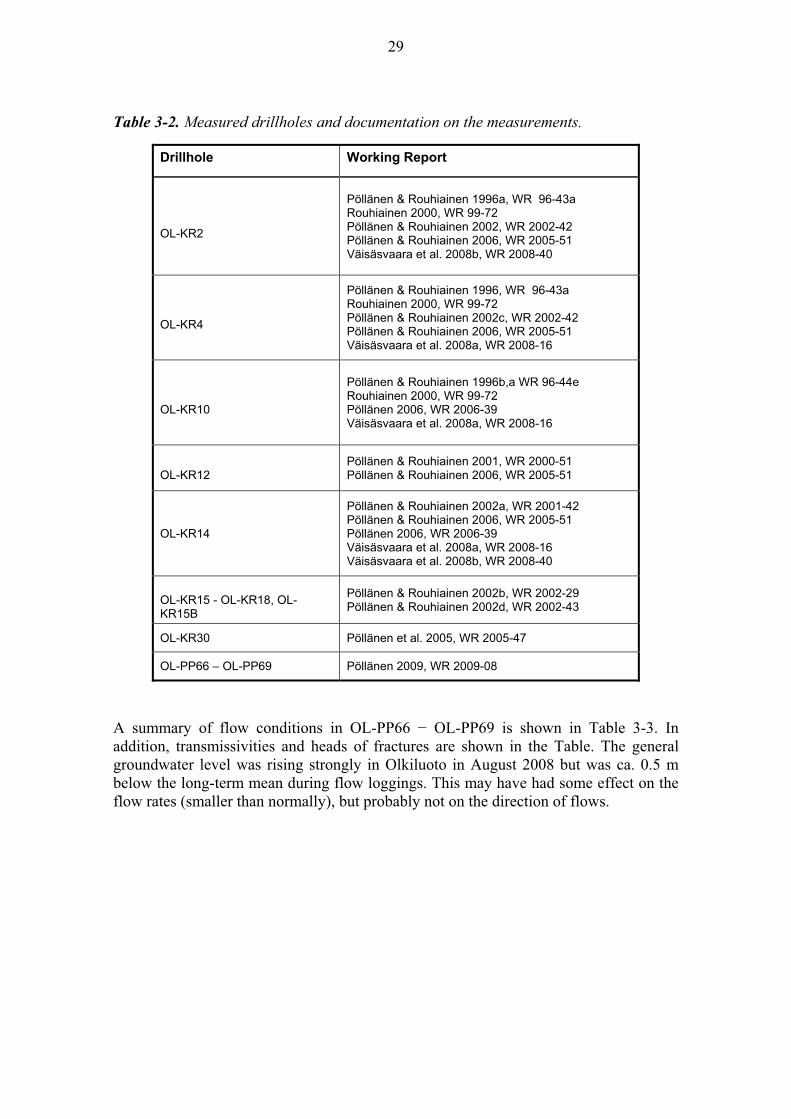
Table 3-2. Measured drillholes and documentation on the measurements.
Drillhole Working Report
OL-KR2
Pöllänen & Rouhiainen 1996a, WR 96-43a Rouhiainen 2000, WR 99-72 Pöllänen & Rouhiainen 2002, WR 2002-42 Pöllänen & Rouhiainen 2006, WR 2005-51 Väisäsvaara et al. 2008b, WR 2008-40
OL-KR4
Pöllänen & Rouhiainen 1996, WR 96-43a Rouhiainen 2000, WR 99-72 Pöllänen & Rouhiainen 2002c, WR 2002-42 Pöllänen & Rouhiainen 2006, WR 2005-51 Väisäsvaara et al. 2008a, WR 2008-16
OL-KR10
Pöllänen & Rouhiainen 1996b,a WR 96-44e Rouhiainen 2000, WR 99-72 Pöllänen 2006, WR 2006-39 Väisäsvaara et al. 2008a, WR 2008-16
OL-KR12
Pöllänen & Rouhiainen 2001, WR 2000-51 Pöllänen & Rouhiainen 2006, WR 2005-51
OL-KR14
Pöllänen & Rouhiainen 2002a, WR 2001-42 Pöllänen & Rouhiainen 2006, WR 2005-51 Pöllänen 2006, WR 2006-39 Väisäsvaara et al. 2008a, WR 2008-16 Väisäsvaara et al. 2008b, WR 2008-40
OL-KR15 - OL-KR18, OL-KR15B
Pöllänen & Rouhiainen 2002b, WR 2002-29 Pöllänen & Rouhiainen 2002d, WR 2002-43
OL-KR30 Pöllänen et al. 2005, WR 2005-47
OL-PP66 – OL-PP69 Pöllänen 2009, WR 2009-08
A summary of flow conditions in OL-PP66 � OL-PP69 is shown in Table 3-3. In addition, transmissivities and heads of fractures are shown in the Table. The general groundwater level was rising strongly in Olkiluoto in August 2008 but was ca. 0.5 m below the long-term mean during flow loggings. This may have had some effect on the flow rates (smaller than normally), but probably not on the direction of flows.
30
100 101 102 103 104 105 106
25
20
15
10
5
0
Dep
th (m
)
106 105 104 103 102 101 100
Olkiluoto, drillhole OL-PP66Flow rates of 2 m sections
Flow rate (mL/h)OUT FROM HOLE INTO HOLE
Flow 0 without pumping2008-08-18Flow 1 with pumping2008-08-19
Theoretical minimummeasurable flow ratePractical minimummeasurable flow rateTheoretical maximummeasurable flow rate
Figure 3-14. Flow into and out of drillhole OL-PP66 in August 2008 without pumping and with pumping.

31
Table 3-3. Summary of flow conditions (Flow0, +=flow into a hole, -=flow out of a hole) in OL-PP66 – OL-PP69 in August 2008. In addition, transmissivities and heads of fractures are shown.
Drillhole PFL Depth (m)
Flow0 (mL/h)
T (m2/s) FW Head of fracture (m.a.s.l)
Comments
OL-PP66 7.3 108 3.27E-08 7.16 *. ** OL-PP66 10.4 3150 1.72E-06 6.77 OL-PP66 16.2 -48 1.04E-07 6.23 OL-PP66 21.3 -3610 6.00E-06 6.26
OL-PP67 8.8 2620 1.50E-06 6.78 OL-PP67 12 -917 2.47E-06 6.23 OL-PP67 14.1 -112 4.95E-07 6.28 OL-PP67 14.9 -95 4.08E-07 6.29 OL-PP67 18.3 -20 5.88E-08 6.36 OL-PP67 20.6 -1740 4.85E-06 6.53
OL-PP68 11.7 -1200 1.17E-06 6.21 OL-PP68 14.7 -630 1.12E-06 6.37 OL-PP68 16.7 -133 1.92E-07 6.36
OL-PP69 9.5 -2330 1.80E-06 6.29 OL-PP69 12.3 -798 3.87E-07 6.12 OL-PP69 16 -186 1.09E-07 6.24 OL-PP69 20.1 -670 3.09E-07 6.14
* Uncertain fracture. The flow rate is less than 30 mL/h or the flow anomalies are overlapping or they are unclear because of noise. ** Fracture in casing tube
Fracture transmissivities are presented for drillholes OL-KR2, OL-KR10, OL-KR12, OL-KR14 � OL-KR18, OL-KR30 and OL-PP66 � OL-69 in Figure 3-15. (Tammisto et al. 2008). A compilation of transmissivities in all drillholes with depth is shown in Figure 3-16. A clear decrease is observed in maximum values at 70 m depth. The transmissivities of new PP-holes at the experimental site correspond well with the larger area data.

32
PVP29PVP28
PVP26PVP25
PVP24 PVP23PVP22
PVP21
PVP2PP69
PP68 PP67PP66
PA2L3
KR30
KR18B
KR18
KR17
KR17B
KR16B
KR16
KR15B
KR15KR14
KR10
T>1E-7 m2/s
KR2
KR12
PVP29PVP28
PVP26PVP25
PVP24 PVP23PVP22
PVP21
PVP2PP69
PP68 PP67PP66
PA2L3
KR30
KR18B
KR18
KR17
KR17B
KR16B
KR16
KR15B
KR15KR14
KR10
T>1E-7 m2/s
KR2
KR12
Figure 3-15. 3D view of fracture specific transmissivities higher than 10-7 m2/s in drillholes OL-KR2, OL-KR10, OL-KR12, OL-KR14 � KR18, OL-KR30 and OL-PP66 � OL-69. The locations of pumping sections in OL-KR14 are indicated with an open circle. Transmissivities are classified by colours (red/dark brown = T >10-5 m2/s, light brown = 10-5 m2/s > T >10-6 m2/s, green= 10-6 m2/s > T > 10-7 m2/s). Unoriented fractures are shown as horizontal discs.
Fracture specific EC (in situ EC) was measured in connection with flow loggings. The corresponding results are shown as TDS-values in Figure 3-17. A factor of 5.4, which is based on the correlation between the measured EC and TDS in other holes in Olkiluoto, was used for conversion of in situ EC values into TDS in holes OL-PP66 – OL-PP67. The converted TDS values increase significantly below the 50 m depth in OL-KR15 – OL-KR18 indicating an increased dominance of Littorina derived water component in groundwater.

33
-100
-90
-80
-70
-60
-50
-40
-30
-20
-10
0
10-9 -8 -7 -6 -5 -4
log Tmax
z (m
.a.s
.l.)
KR02KR04KR10KR12KR14KR15KR15BKR16KR16BKR17KR17BKR18KR18BKR30PP66PP67PP68PP69
Figure 3-16. Transmissivities along depth (m.a.s.l.) in drillholes OL-KR2, OL-KR4, OL-KR10, OL-KR14 � OL-KR18, OL-KR30 and OL-PP66 � OL-PP69. The transmissive fracture to be pumped in OL-KR14 is shown as filled squares in depth range -4 � -8 (m.a.s.l.).

34
-100
-90
-80
-70
-60
-50
-40
-30
-20
-10
0
100.01 0.1 1 10
TDS (g/l)Z
(m.a
.s.l.
)
OL-KR2OL-KR4OL-KR10OL-KR12OL-KR14OL-KR15OL-KR15BOL-KR16OL-KR17OL-KR17BOL-KR18OL-KR18BOL-PP66OL-PP67
Figure 3-17. Depth dependence of TDS-values calculated from fracture specific EC-values measured in connection with flow loggings.
3.5.2 Head and water table level monitoring
Heads before the start of pumping in different drillholes and PVP-tubes are illustrated as time series in Figure 3-18, where the effect of the testing of the flow logging tool for groundwater sampling in OL-KR30 in November 2008 (Väisäsvaara 2010) can be seen

35
clearly in several packed-off drillholes. Drawdown was 3.5 m in OL-KR30 and pumping rate varied between 12 � 22 L/min. The observed hydraulic connections showed clearly how well connected the fracture network is within this area along HZ19-zones. The “baseline” heads determined before the start of pumping in OL-KR14 are shown in Figure 3-19 and in more detail in Figure 3-20, where also baseline heads at most transmissive depths in KR14 are shown (Ahokas et al. 2008). Heads in OL-KR14 represent the long-term mean, i.e. a situation when the general groundwater level is on the same level as the measured long-term mean. In November and beginning of December the general groundwater level in Olkiluoto was close to the long-term mean and therefore the “baseline” heads shown in Figure 3-19 and Figure 3-20 are well comparable to the determined baseline heads in OL-KR14. Baseline head data from packed-off drillholes on 6.12.2008 are also listed in Table 3-4. The uppermost baseline head in OL-KR14 (z = -4.35 m.a.s.l.) represents the fracture at a depth of 13.4 m, which is the most transmissive fracture of the packed-off section to be pumped in connection with the infiltration experiment. Heads in Figures 3-19 and 3-20 represent sieved sections in PVP-tubes and packed-off sections in drillholes, where zone HZ19A intersects the drillhole. Heads are in PP-holes and in open hole OL-KR30 illustrated for the whole drillhole between the casing and the bottom of the drillhole (line) but as a rule represent the most transmissive fracture(s), which are shown in the figures as blue open circles. In OL-KR30, the open circle is the same as the depth of the HZ19A intersection. The results are shown on different scales to see the effect of ONKALO along zone HZ19A (Figure 3-19) and the details of the uppermost depth (Figure 3-20). The lowest head is measured in KR4 L6 (76 � 85 m), which is also the section closest to ONKALO as can be seen in Figure 3-21, where roughly equal head level contours for 5 and 6 m are shown. The hydraulic gradient (as a linear approximation) between the ONKALO intersections and the OL-KR14 area is in the order of 0.5 % (2 m/400 m). The main conclusions from Figures 3-19 and 3-20 are:
� Heads are in most PVP-tubes higher than in zone HZ19A and fractures in good connection to it (like the fracture at a depth of 13.4 m in OL-KR14), which indicates recharge conditions from overburden to bedrock.
� The head is in packed-off section OL-KR17B(L2) and in drillhole OL-PP69 clearly higher than in other sections and holes, which indicates that they are not directly connected to HZ19A or its area of influence– the most transmissive fractures are in these holes on a higher level than in other holes, which strengthens the explanation for head differences.
� The head is also in OL-PP66 and OL-KR17B(L1) a bit higher than in other sections and PP-holes – whether they are not directly connected to zone HZ19A or they are within a recharge route from the overburden to zone HZ19A, is unknown.
Based on head differences between adjacent pairs of a PVP-tube and a PP-hole possible recharge or discharge routes were studied and are shown in Figure 3-22. Local recharge from overburden to bedrock is possible from OL-PVP22 to OL-PP66 and from OL-PVP25 to OL-PP68. Local discharge conditions from bedrock to overburden are

36
possible from OL-PP67 to OL-PVP23 and from OL-PP69 to OL-PVP26. Topographical factors (decreasing level of ground surface towards northeast and north) support the possibility of discharge conditions in these areas. The heads are in the northern PVP-tubes (OL-PVP28 and OL-PVP29) also among the lowest values within the test area.
2
3
4
5
6
7
8
9
19.11.08 24.11.08 29.11.08 4.12.08 9.12.08Date
Hea
d, m
.a.s
.l.
0
50
100
150
200
250
prec
ipita
tion,
mm
KR02 L8 40-50 KR02 L7 76-90 KR04 L6 76-85 KR10 L7 56-85 KR10 L8 40-55KR12 L7 50.6-69.6 KR12 L8 40-49.6 KR14 Open KR15 L4 66-75 KR15 L5 51-65KR15 L6 40-50 KR15B L1 17-31 KR15B L2 4.5-16 KR16 L1 143-170 KR16 L4 63-82KR16 L5 53-62 KR16 L6 40-52 KR16B L1 21-35 KR16B L2 4.5-20 KR17 L4 67-71KR17 L5 52-66 KR17 L6 40-51 KR17B L1 11-30 KR17B L2 4.1-10 KR17B OpenKR18 L2 74-83 KR18 L3 59-63 KR18 L4 54-58 KR18 L5 40-53 KR18B L1 24-45.5KR18B L2 14-23 KR18B L3 6.5-13 PP1 PP10 PP66PP67 PP68 PP69 KR30 PVP21PVP22 PVP23 PVP24 PVP25 PVP26PVP27 PVP28 PVP29 KR30 pump test Precipitation
Figure 3-18. Time series of head observations in autumn 2008 in different holes and packed-off sections and in PVP-tubes before, during and after test pumping in OL-KR30.

37
Table 3-4. Baseline head data on 5.12.2008 or 6.12.2008 from packed-off drillholes OL-KR15 – OL-KR18 (+B-holes) and other drillholes and observations tubes. The packer combinations presented are visualized in Appendix 3.3.
Drillhole Observation interval Head 6.12.2008
KR15 Packer comb. 1 (16.8.04�16.4.07 and 4.5.08�) casing 0�39.98 m Code of obs. interval Sec. up Sec. down
KR15 L6 40 50 6.50 KR15 L5 51 65 6.38 KR15 L4 66 75 6.39
KR15B Packer comb. 2 (27.6.08�) casing 0�4.48 m Code of obs. interval Sec. up Sec. down
KR15B L2 4.5 16 6.64 *) KR15B L1 17 31 6.63 KR16 Packer comb. 1 (2.9.04�12.4.07 and 25.6.08�)
casing 0�40.23 m Code of obs. interval Sec. up Sec. down KR16 L6 40 52 6.41 KR16 L5 53 62 6.26 KR16 L4 63 82 6.18
KR16B Packer comb. 2 (26.6.08�) casing 0�4.48 m Code of obs. interval Sec. up Sec. down
KR16B L2 4.5 20 6.60 KR16B L1 21 35 6.61 KR17 Packer comb. 1 (23.8.04�9.11.04; 6.11.2008�)
casing 0�39.92 m Code of obs. interval Sec. up Sec. down KR17 L6 40 51 6.48 KR17 L5 52 66 6.54 KR17 L4 67 71 6.55
KR17B Packer comb. 2 (6.7.08�) casing 0�4.1 m Code of obs. interval Sec. up Sec. down
KR17B L2 4.1 10 8.37 KR17B L1 11 30 6.81
KR18 Packer comb. 1 (18.8.04�27.9.04; 10.11.04 �10.4.07 and 1.4.08�)
casing 0�39.81 m Code of obs. interval Sec. up Sec. down KR18 L5 40 53 6.37 KR18 L4 54 58 6.34 KR18 L3 59 63 6.36
KR18B Packer comb. 2 (8.4.08�) casing 0�6.51 m Code of obs. interval Sec. up Sec. down
KR18B L3 6.5 13 6.64 KR18B L2 14 23 6.70 KR18B L1 24 45.5 6.59
KR2 Packer comb. 4 (30.11.07�) casing 0�39.85 m Code of obs. interval Sec. up Sec. down
KR2 L8 40 50 4.66 KR2 L7 76 90 427 KR2 L6 106 115 3.74 KR12 Packer comb. 1 (19.1.04�)
casing 0�40.02 m Code of obs. interval Sec. up Sec. down KR12 L8 40 49.6 7.08 KR12 L7 50.6 69.6 6.20 KR12 L6 85.6 99.6 4.73
*) interpolated from data before and after 6.12.2008

38
Table 3-4. (continued)
Drillhole/Observation tube
Code of observation
interval
Packed-off section
Head 5.12.2008
KR04 L6 76�85 4.71 KR22 L4 96�120 5.32 KR25 L7 51�65 5.10 KR27 L5 126�135 6.22 KR28 L6 126�145 5.11 KR29 L8 40�65 5.06 KR37 L4 116�140 5.05 KR10 L8 40�55 5.64 KR10 L7 56�85 6.06 KR30 Open 5.51 PP66 Open 6.93 PP67 Open 6.67 PP68 Open 6.65 PP69 Open 7.39
PVP21 7.99 PVP22 7.63 PVP23 6.21 PVP24 7.65 PVP25 7.52 PVP26 7.05 PVP27 7.74 PVP28 6.82 PVP29 6.52 KR14 13.4 m 6.60

39
KR12
KR12
KR2
KR2
PVP29 PVP28 PVP27PVP26
PVP25
PVP24PVP23
PVP22 PVP21
PP69PP68
PP67 PP66
KR30
KR10
KR37
KR29
KR28
KR27
KR25
KR22
KR18B
KR17BL2
KR17BL1KR16B
KR15B
KR04
-110
-100
-90
-80
-70
-60
-50
-40
-30
-20
-10
0
103 4 5 6 7 8 9
Head (m.a.s.l.)z
(m.a
.s.l.
)
section headmost transmissive fractureKR14 baseline head
Figure 3-19. Heads before the start of pumping (beginning of December 2008) in different drillholes and PVP-tubes. Section heads represent packed-off or open hole intervals. Locations of the most transmissive fractures are also shown. Baseline heads at different depths in KR14 are from Ahokas et al. (2008).

40
KR12
KR15B
KR16B
KR17BL1
KR17BL2
KR18B
PP66
PP67
PP68
PP69
PVP21
PVP22
PVP23
PVP24PVP25PVP26PVP27PVP28
PVP29
-30
-20
-10
0
106.0 6.5 7.0 7.5 8.0 8.5
Head (m.a.s.l.)z
(m.a
.s.l.
)
section headmost transmissive fractureKR14 baseline head
Figure 3-20. Heads before the start of pumping (beginning of December 2008) in different drillholes and PVP-tubes. Section heads represent packed-off or open hole intervals. Locations of the most transmissive fractures are also shown. Baseline heads at different depths in KR14 are from Ahokas et al. (2008).

41
6.66.526.65
6.67
6.93
5.51
5.64
5.05
5.06
5.10
6.22
5.105.32
6.58
6.79
6.58
6.62
4.71
6791700
6791800
6791900
6792000
6792100
6792200
6792300
6792400
6792500
6792600
6792700
1525500 1525600 1525700 1525800 1525900 1526000 1526100 1526200 1526300 1526400 1526500
Easting (m)
Nor
thin
g (m
)
KR4
KR14
5 m
6 m
ONKALO vs HZ19Aintersections
Figure 3-21. Heads within zone HZ19A and in PP-holes before the start of pumping in KR14. Intersections of ONKALO and HZ19A are shown as red open circles. Equal head level contours for 5 and 6 m are also illustrated. View from top.

42
KR12
PVP29PVP28 PVP27
PVP26 PVP25 PVP24
PVP23
PVP22
PVP21
PP69
PP68
PP67
PP66
KR18B
KR17BL2
KR17BL1
KR16B
KR15B
-30
-20
-10
0
106.0 6.5 7.0 7.5 8.0 8.5
Head (m.a.s.l.)z
(m.a
.s.l.
)
section headmost transmissive fractureKR14 baseline head
Figure 3-22. Possible recharge or discharge routes between adjacent pairs of PVP-tube and PP-hole based on head differences (marked as blue arrows).
The correlation between ground surface elevation and observed head in shallow holes at the beginning of December 2009 is shown in Figure 3-23. Correlation between head (groundwater level) in the observation tubes (OL-PVP21 � OL-PVP29) and ground surface elevation is good. In bedrock holes, correlation is poor, which indicates that different holes or actually their most transmissive fractures are hydraulically connected to different zones or topographical areas. E.g. OL-PP68 and packed-off KR-sections are probably connected or are within the influence zone of HZ19A because heads are clearly lower than in other holes. Heads are in these holes ca. 2 – 2.5 m below the ground surface, whereas in other holes heads (gw-level) they are clearly closer (0 – 0.8 m) to the ground surface.

43
KR18B L3
KR17B L2
KR16B L2
KR15B L2
PVP29
PVP28
PVP27
PVP26
PVP25
PVP24
PVP23
PVP22
PVP21
PP69
PP68PP67
PP66
6
7
8
9
10
6 7 8 9 10
z ground surface, m.a.s.l.
head
, m.a
.s.l.
PVP21-29PP66-69KR15B-18Bz ground=head
Figure 3-23. Correlation between ground surface elevation and observed head in shallow holes.
3.5.3 Transverse flow measurements
The Transverse Flow method (PFL TRANS) measures the flow of groundwater across a drillhole. The device isolates a section from the rest of the drillhole and the flow across this section and the approximate direction of the flow is measured. Additionally, the single point resistance (SPR) of the drillhole wall, the drillhole water temperature and the local magnetic field can be measured with the method. A detailed description of the methodology is given in Väisäsvaara (2009). Transverse flow measurements were performed in selected drillhole sections in drillholes OL-PP66 � OL-PP69 between 29.9.2008 – 17.10.2008. All in all 11 conducting fractures were measured. Due to technical problems and uncertainties in results, the measurements are to be repeated in 2009 with an updated tool and all the results will be reported after these measurements.

44
3.5.4 Slug measurements
Slug tests were carried out in new observation tubes, OL-PVP21 – OL-PVP29, in summer 2008 (Keskitalo 2009). A summary of all SLUG-results (Hellä & Heikkinen 2004, Tammisto et al. 2005, Tammisto & Lehtinen 2006, Keskitalo & Lindgren 2007, Keskitalo 2008) and the results from new PVP-holes are illustrated as hydraulic conductivities in Figure 3-24. The highest values are found in OL-PVP21, OL-PVP23 and OL-PVP25. Slug tests
0
5
10
15
20
25
1.E-11 1.E-10 1.E-09 1.E-08 1.E-07 1.E-06 1.E-05 1.E-04 1.E-03
Hydraulic conductivity (m/s)
Dep
th (m
)
K1m (OL-PP-holes)K (OL-PVP-holes)OL-PVP21OL-PVP22OL-PVP23OL-PVP24OL-PVP25OL-PVP26OL-PVP27OL-PVP28OL-PVP29
Figure 3-24. Hydraulic conductivities measured by SLUG-tests in Olkiluoto. Results from OL-PVP21 – OL-PVP29 are highlighted separately.

45
3.6 Hydrogeochemical samplings and analysis results
Samplings of the infiltration experiment started in summer 2008 with baseline samplings from thirteen groundwater observation tubes as well as four shallow drillholes near OL-KR14. A groundwater sample was also collected from pumping hole OL-KR14 at a depth of 13 � 18.2 m in December 2008. The most extensive analysing programme was applied in all samplings. The first samples from lysimeters were taken in December 2009.
3.6.1 Groundwater sampling
The groundwater observation tube samples as well as the shallow drillhole samples were collected into a 0.5 L Duran-bottle, a 1 L Duran-bottle pre-washed with nitric acid, three 0.1 L Winkler-bottles and a 10 L plastic canister as well as into a 0.1 L Plastex-bottle for the Rn-222 analysis. The groundwater sample from deep drillhole OL-KR14 was collected in the field according to the Posiva water sampling guide (Paaso et al. 2003). The samples for ferrous iron and metal analyses were collected with a groundwater sampler (0.45 μm membrane) under nitrogen atmosphere and the bottles were pre-washed with nitric acid. The samples for sulphide and DIC/DOC analyses were collected with a groundwater sampler in a similar way as the samples for metal analyses, but the bottles were not acid-washed before sampling. The samples for alkalinity and acidity were collected with a titration sampler under nitrogen atmosphere. The sample for other analyses was collected in 5-L bottle. The samples were filtered with a membrane filter (0.45 μm), if needed, and bottled in the laboratory. Some of the water samples (metals, sulphide, C-13/C-14, S-34(SO4), O-18(SO4)) required preserving chemicals after filtration. Polyethylene bottles, Duran bottles with a ground joint cap, glass and measuring bottles, Nalgene bottles and Ultimagold solution bottles were used as sample containers. The exact sample preparation is described in the Posiva water sampling guide (Paaso et al. 2003). Most water analyses were carried out in TVO's laboratory in Olkiluoto according to the Posiva water sampling guide (Paaso et al. 2003) or TVO's instructions. All the laboratory methods are based on standard methods or other commonly accepted methods (Appendix 3.6). Some metal analyses, nitrogen, nitrate and nitrite analyses as well as isotope analyses were performed in subcontractor laboratories.
3.6.2 Lysimeters
The first samples from lysimeters were taken in December 2008. The results are listed in Table 3-5. The samples were taken only few months after the installation of the lysimeters so the results do not present even the baseline situation on the surface. It is quite certain that installation still influences the results.

46
Table 3-5. Results of the first lysimeter samples taken in December 2008 (9.12.2008). The installation depths of the lysimeters are given in Table 2-2.
Lysimeter EC (μS/cm)
pH Alkalinity (mmol/l)
Cl (mg/l)
PO4-P (mg/l)
NO3-N (mg/l)
SO4-S (mg/l)
NH4-N (mg/l)
N-tot (mg/l)
DOC (mg/l)
OL-LP1 2317 7.3 --- 50.6 <0.130 <0.040 1.5 3.72 6.70 220 OL-LP2 1290 6.9 9.78 37.5 <0.130 <0.040 57.4 7.82 10.3 167 OL-LP3 1368 6.7 14.0 23.0 <0.130 <0.040 10.1 15.1 19.7 51.1 OL-LP4 369 6.8 2.50 3.3 <0.130 0.130 10.6 3.27 4.44 69.4 OL-LP5 137 6.0 0.39 6.7 <0.130 <0.040 5.0 0.163 3.04 122 OL-LP6 458 6.6 3.01 13.2 <0.130 <0.040 12.9 0.247 4.50 163 OL-LP7 824 7.5 7.01 15.9 <0.130 0.050 21.1 0.090 0.635 80.2 OL-LP8 699 7.3 6.41 1.2 <0.130 <0.040 13.5 0.070 0.456 76.7 OL-LP9 763 7.6 7.26 1.0 <0.130 0.070 12.3 < 0.030 0.384 74.6
3.6.3 Groundwater observation tubes
Water was neutral in the groundwater observation tube samples with pH values ranging from 6.5 to 7.5. The conductivity of the samples was between 20 and 94 mS/m. The water types (Davis and De Wiest 1967) and the salinities (TDS) are presented in Table 3-6. The water type was Ca-Mg-Na-HCO3 in samples OL-PVP23 and OL-PVP29. The other samples were of water type Ca-HCO3. Salinity ranged from 183 mg/L to 843 mg/L and all samples from the groundwater observation tubes were fresh HCO3 type water (TDS < 1000 mg/L). Table 3-6. Water types and salinities (TDS; mg/L) in groundwater observation tubes.
Sample Water type TDS (mg/L) OL-PVP21 Ca-HCO3 422 OL-PVP22 Ca-HCO3 475 OL-PVP23 Ca-Mg-Na-HCO3 843 OL-PVP24 Ca-HCO3 385 OL-PVP25 Ca-HCO3 183 OL-PVP26 Ca-HCO3 629 OL-PVP27 Ca-HCO3 630 OL-PVP28 Ca-HCO3 309 OL-PVP29 Ca-Mg-Na-HCO3 668
The results of the laboratory analyses of the groundwater observation tube samples together with the calculated TDS value and charge balance, are presented in Table 3-7. The isotope results are presented in Table 3-8. The composition of sample OL-PVP25 shows the most limited chemical interaction (e.g. low salinity, pH, DIC) and probably represents the shortest mean residence time of the overburden samples. Hydrostatic pressure was so low in OL-PVP22 that uranium isotope samples were not collected. The sample-specific analysis reports are stored in Posiva's archives.
All charge balances for samples from the groundwater observation tubes were acceptable according to the guidelines presented in Pitkänen et al. (2007).

47
Table 3-7. Analysis results of groundwater observation tubes. The RSD value is mentioned under the Table, if it was more than 5 %. The pumping level is given as the depth from the ground surface. The perforated sections of the observation tubes are presented in Table 2-1.
Parameter Unit OL-
PVP21 OL-
PVP22 OL-
PVP23 OL-
PVP24 OL-
PVP25 OL-
PVP26 OL-
PVP27 OL-
PVP28 OL-
PVP29 Pumping level m 5.15 5.42 5.33 4.21 3.51 4.17 3.59 3.92 3.19 Sampling date 8.7.2008 30.6.2008 9.7.2008 10.7.2008 3.7.2008 8.7.2008 1.7.2008 1.7.2008 7.7.2008 Water temperature in sampling °C 9.4–14.4 9.8–11.9 12.1�12.4 13.5�14.6 15.8�23.6 14�15.7 12.7�24.5 13�19.0 10.4�18.1
TDS mg/L 422 475 843 385 183 629 630 309 668 Charge balance % +2.92 -3.05 +5.12 +5.42 +1.40 +6.84 -3.55 +1.00 +4.77 pH 7.5 7.4 7.0 7.0 6.6 6.8 7.1 6.5 6.9 Conductivity mS/m 48 51 94 41 20 67 67 33 71 Sodium fluorescein μg/L <1 <1 9.7 <1 3.6 4.0 2.1 1.8 1.0 Total alkalinity, HCl uptake
mmol/L 4.0 5.05 7.0 3.6 1.4 6.4 6.87 2.7 7.0
Carbonate alkalinity, HCl uptake
mmol/L <0.05 <0.05 <0.05 <0.05 <0.05 <0.05 <0.05 <0.05 <0.05
Total acidity, NaOH uptake
mmol/L 0.17 0.29 0.50 0.19 0.31(3 1.3 0.40 0.49 0.58
Hydrocarbonate, HCO3
mg/L 240 310 430 220 84 390 420 160 430
Dissolved inorg. carbon
mg/L 45 60 83 42 16 84 81 30 90
Dissolved org. carbon mg/L 9.8 13 26 7.7 15 20 24 63 27 Ammonium, NH4 mg/L 0.057(2 0.11 0.211 0.043 0.045 0.112 0.06 0.055 0.088 Arsenic, As μg/L <5 <5 <5 <5 <5 <5 <5 <5 <5 Barium, Ba μg/L 28 28 27 15 7 38 28 8 42 Boron, Btotal mg/L 0.05 0.04 0.19 0.07 0.03 0.07 0.06 0.04 0.14 Bromide, Br mg/L 0.2 <0.1 0.2 0.2 0.2 0.2 0.2 <0.1 0.2 Cadmium, Cd μg/L <2 <2 <2 <2 <2 <2 <2 <2 <2 Calcium, Ca mg/L 68 82 100 70 33 110 98 52 75 Chloride, Cl mg/L 21 6.0 23 3.7 8.8 8.5 8.6 4.0 7.3 Cobalt, Co μg/L <0.5 1 <0.5 3 2 2 4 3 2 Copper, Cu μg/L <2 <2 <2 <2 9 <2 <2 3 <2 Fluoride, F mg/L 0.7 0.7(3 0.3 0.6 0.5 0.6 1.0 0.4 0.3 Iron, Fe2+ * mg/L 0.12 0.82 2.3 1.3 0.42 5.8 0.01(3 2.9 2.1 Iron, Fetotal
** mg/L 0.33 0.43 2.3 1.2 0.47 8.6 0.02 4.7 3.6 Lead, Pb μg/L <0.5 0.5 <0.5 <0.5 <0.5 <0.5 <0.5 4 <0.5 Magnesium, Mg mg/L 16 10 42 11 3.4 22 19 7.6 28 Manganese, Mn mg/L 1.0 1.8 2.1 1.3 0.25 2.5 2.5 0.76 1.4 Mercury, Hg μg/L <0.05 <0.05 <0.05 <0.05 <0.05 <0.05 <0.05 <0.05 <0.05 Nickel, Ni μg/L <5 <5 <5 <5 <5 <5 <5 <5 <5 Nitrate, NO3 mg/L <0.02 0.048 <0.02 0.03 <0.02 0.02 <0.02 <0.02 <0.02 Nitrite, NO2 mg/L <0.010 <0.010 <0.010 <0.010 <0.010 <0.010 <0.010 <0.010 <0.010 Nitrogen, Ntotal mg/L 0.26 0.32 0.85 0.17 0.40 0.91 0.29 1.3 0.66 Phosphate, PO4 mg/L <0.1 <0.1 <0.1 <0.1 <0.1 <0.1 <0.1 <0.1 <0.1 Potassium, K mg/L 6.6 6.1 15 5.4 2.9 10 8.6 4.1 13 Silica, SiO2 mg/L 21 19 26 26 18 28 16 17 23 Sodium, Na mg/L 14 9 62 8.9 5 15 16 7 51 Strontium, Sr mg/L 0.16 0.11 0.31 0.10 0.03 0.20 0.17 0.06 0.22 Sulphate, SO4 mg/L 31 32 140 36 27 38 41 47 35 Sulphide, S2- mg/L 0.02(1 0.14(1 - - - - - - - Sulphur, Stotal mg/L 10 9.5 47 12 9.0 13 13 15 12 Uranium, U μg/L 0.7 0.2 4.4 1.0 2.2 6.2 24 12 1.5 Zinc, Zn μg/L <5 <5 <5 7 6 7 10 13 <5
* = analysed with spectrophotometer - = sulphide determination was erroneous ** = analysed with ICP-OES (1 = sulphide was re-measured in December 2008 (2 = RSD was 13% (3 = RSD was 6%

48
Table 3-8. Results of isotope analyses of groundwater observation tube samples.
Parameter Unit OL-PVP21
Ol-PVP22
OL-PVP23
OL-PVP24
OL-PVP25
OL-PVP26
Ol-PVP27
OL-PVP28
OL-PVP29
Carbon, C-13 ‰ PDB -13.62 -15.04 -10.99 -13.2 -8.92 -14.16 -13.19 -8.65 -14.08
Carbon, C-14 %(PM) 72.34 75.65 77.70 71.72 90.26 94.22 85.58 70.15 92.03
Deuterium, H-2 ‰ SMOW -78.8 -80.0 -77.9 -81.9 -77.4 -82.8 -78.9 -84.8 -82.2
Oxygen, O-18 ‰ SMOW -11.10 -11.33 -11.05 -11.38 -10.47 -11.53 -11.19 -11.54 -11.62
Oxygen, O-18 (SO4)
‰ SMOW 7.23 7.67 7.92 -1.49 3.39 6.00 0.70 5.80 9.58
Radon, Rn-222 Bq/L 33 3.6 28 21 12 61 10.5 219 45
Strontium, Sr-87/Sr-86 0.729676 0.738950 0.729744 0.726911 0.747886 0.734974 0.735961 0.730218 0.722088
Sulphur, S-34 (SO4)
‰ CDT 8.61 9.20 2.74 4.07 4.00 6.74 8.90 5.17 15.91
Tritium, H-3 TU 9.85 10.55 3.25 10.40 10.35 10.15 10.95 10.85 10.30 Uranium, U-238 mBq/L 11 5.5 58 13 28 88 - 154 26
Uranium, U-238 �g/L 0.9 0.4 4.7 1.1 2.2 7.1 - 12.4 2.1
Uranium, U-234/ U-238
1.3 1.4 1.7 1.4 1.0 1.3 - 2.1 1.8
Uranium, U-238, membrane
mBq/L 0.5 2.0 3.5 8.0 1.8 5.0 - 5.1 33
Uranium, U-238, membrane
�g/L 0.04 0.2 0.3 0.6 0.1 0.4 - 0.4 2.6
Uranium, U-234/ U-238, membrane
1.6 1.3 1.3 1.3 1.2 1.5 - 2.2 1.1
- = not collected, because water amount in pumping was too small
3.6.4 Shallow drillholes
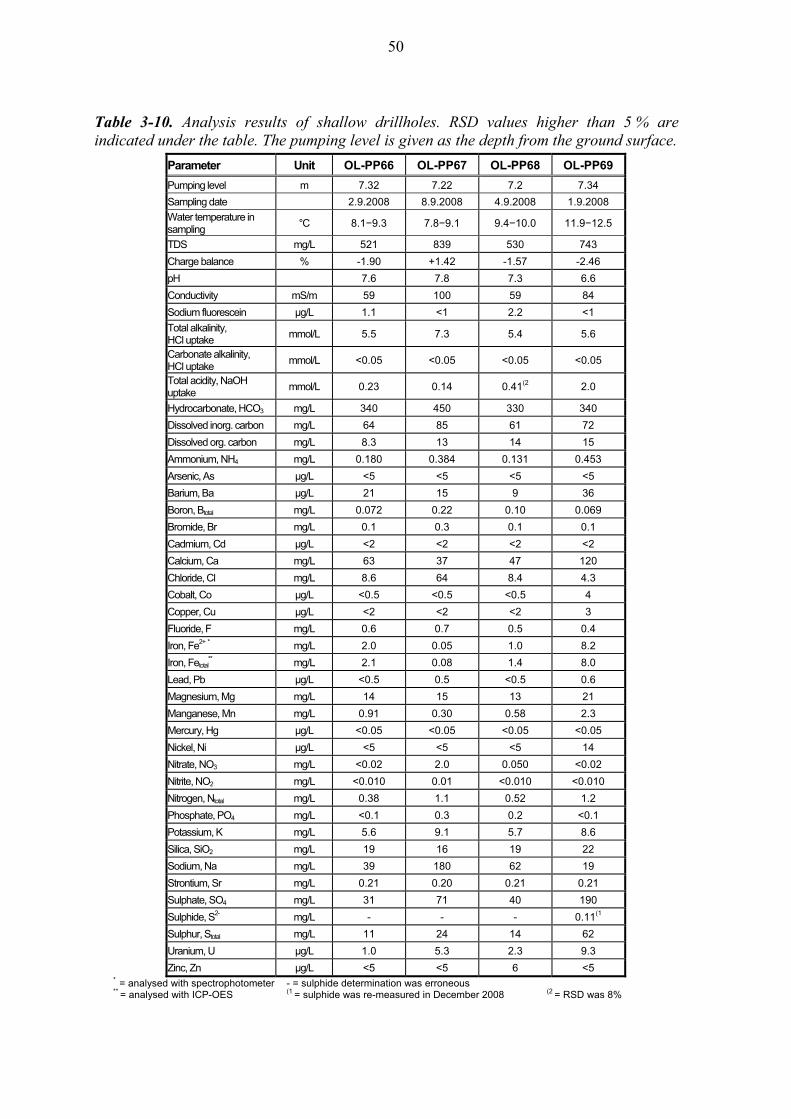
Water was neutral in the shallow drillhole samples with pH values ranging from 6.6 to 7.8. The conductivity of the samples was between 59 and 100 mS/m. The water types (Davis and De Wiest 1967) and the salinities (TDS) are presented in Table 3-9. Salinity ranged from 521 mg/L to 839 mg/L and all samples from the shallow drillholes were fresh water (TDS < 1000 mg/L). Table 3-9. Water types and salinities (TDS; mg/L) in shallow groundwaters.
Sample Water type TDS (mg/L) OL-PP66 Ca-Na-HCO3 521 OL-PP67 Na-HCO3 839 OL-PP68 Na-Ca-HCO3 530 OL-PP69 Ca-HCO3-SO4 743

49
The results of the laboratory analyses of the groundwater observation tube samples, the calculated TDS value and charge balance are presented in Table 3-10. The isotope results are presented in Table 3-11. No systematic deviation between groundwater samples from overburden and shallow bedrock can be observed. The sample-specific analysis reports are stored in the Posiva's archives. All charge balances for samples from shallow drillholes were acceptable according to the guidelines presented by Pitkänen et al. (2007).
50
Table 3-10. Analysis results of shallow drillholes. RSD values higher than 5 % are indicated under the table. The pumping level is given as the depth from the ground surface.
Parameter Unit OL-PP66 OL-PP67 OL-PP68 OL-PP69 Pumping level m 7.32 7.22 7.2 7.34 Sampling date 2.9.2008 8.9.2008 4.9.2008 1.9.2008 Water temperature in sampling °C 8.1�9.3 7.8�9.1 9.4�10.0 11.9�12.5
TDS mg/L 521 839 530 743 Charge balance % -1.90 +1.42 -1.57 -2.46 pH 7.6 7.8 7.3 6.6 Conductivity mS/m 59 100 59 84 Sodium fluorescein μg/L 1.1 <1 2.2 <1 Total alkalinity, HCl uptake mmol/L 5.5 7.3 5.4 5.6
Carbonate alkalinity, HCl uptake mmol/L <0.05 <0.05 <0.05 <0.05
Total acidity, NaOH uptake mmol/L 0.23 0.14 0.41(2 2.0
Hydrocarbonate, HCO3 mg/L 340 450 330 340 Dissolved inorg. carbon mg/L 64 85 61 72 Dissolved org. carbon mg/L 8.3 13 14 15 Ammonium, NH4 mg/L 0.180 0.384 0.131 0.453 Arsenic, As μg/L <5 <5 <5 <5 Barium, Ba μg/L 21 15 9 36 Boron, Btotal mg/L 0.072 0.22 0.10 0.069 Bromide, Br mg/L 0.1 0.3 0.1 0.1 Cadmium, Cd μg/L <2 <2 <2 <2 Calcium, Ca mg/L 63 37 47 120 Chloride, Cl mg/L 8.6 64 8.4 4.3 Cobalt, Co μg/L <0.5 <0.5 <0.5 4 Copper, Cu μg/L <2 <2 <2 3 Fluoride, F mg/L 0.6 0.7 0.5 0.4 Iron, Fe2+ * mg/L 2.0 0.05 1.0 8.2 Iron, Fetotal
** mg/L 2.1 0.08 1.4 8.0 Lead, Pb μg/L <0.5 0.5 <0.5 0.6 Magnesium, Mg mg/L 14 15 13 21 Manganese, Mn mg/L 0.91 0.30 0.58 2.3 Mercury, Hg μg/L <0.05 <0.05 <0.05 <0.05 Nickel, Ni μg/L <5 <5 <5 14 Nitrate, NO3 mg/L <0.02 2.0 0.050 <0.02 Nitrite, NO2 mg/L <0.010 0.01 <0.010 <0.010 Nitrogen, Ntotal mg/L 0.38 1.1 0.52 1.2 Phosphate, PO4 mg/L <0.1 0.3 0.2 <0.1 Potassium, K mg/L 5.6 9.1 5.7 8.6 Silica, SiO2 mg/L 19 16 19 22 Sodium, Na mg/L 39 180 62 19 Strontium, Sr mg/L 0.21 0.20 0.21 0.21 Sulphate, SO4 mg/L 31 71 40 190 Sulphide, S2- mg/L - - - 0.11(1
Sulphur, Stotal mg/L 11 24 14 62 Uranium, U μg/L 1.0 5.3 2.3 9.3 Zinc, Zn μg/L <5 <5 6 <5
* = analysed with spectrophotometer - = sulphide determination was erroneous ** = analysed with ICP-OES (1 = sulphide was re-measured in December 2008 (2 = RSD was 8%

51
Table 3-11. Results of isotope analyses of shallow drillholes.
Parameter Unit OL-PP66 OL-PP67 OL-PP68 OL-PP69
Carbon, C-13 ‰ PDB -16.08 -15.28 -17.07 -10.32
Carbon, C-14 %(PM) 73.93 73.02 73.68 93.84 Deuterium, H-2 ‰ SMOW -79.8 -80.4 -81.9 -82.8 Oxygen, O-18 ‰ SMOW -11.21 -11.14 -11.33 -11.63 Oxygen, O-18 (SO4) ‰ SMOW 5.89 6.21 2.21 -7.11 Radon, Rn-222 Bq/L 232 450 330 122 Strontium, Sr-87/Sr-86 0.728993 0.725676 0.723768 0.732600
Sulphur,S-34 (SO4) ‰ CDT 11.34 12.65 5.95 -0.04 Tritium, H-3 TU 9.65 7.80 9.25 9.89 Uranium, U-238 mBq/L 11 64 24 110 Uranium, U-238 �g/L 0.9 5.2 2.0 8.8 Uranium, U-234/U-238 3.8 3.3 2.6 1.3 Uranium, U-238, membrane mBq/L 1.1 5.7 0.3 5.6
Uranium, U-238, membrane �g/L 0.09 0.5 0.02 0.5
Uranium, U-234/U-238, membrane 3.6 2.4 1.7 1.3
empty cell = result not available yet
3.6.5 Deep Drillhole OL-KR14
Water was neutral with a pH value of 7.1. The conductivity of the sample was 82 mS/m. The water type was Na-Ca-HCO3. Salinity was 742 mg/L and the sample was fresh water (TDS < 1000 mg/L). The results of the laboratory analyses of the sample from OL-KR14, the calculated TDS value, charge balance and isotope results are presented in Table 3-12. The sample-specific analysis reports are stored in Posiva's archives. The RSD value was under 5 % for all analyses.

52
Table 3-12. Analysis results of OL-KR14/13�18.2 m. Sampling date 10.12.2008 and temperature of water at sampling 8.0 °C.
Parameter Unit Parameter Unit
TDS mg/L 742 Carbon, C-13 ‰ PDB -13.33 Charge balance % +0.89 Carbon, C-14 years BP 1212 pH 7.1 (7.2) Carbon, C-14 %(PM) 85.99 Conductivity mS/m 82 (79) Deuterium, H-2 ‰ SMOW -82.5 Sodium fluorescein μg/L <1 Oxygen, O-18 ‰ SMOW -11.52 Total alkalinity, HCl uptake mmol/L 7.31 Oxygen, O-18 (SO4) ‰ SMOW 5.67
Carbonate alkalinity, HCl uptake mmol/L <0.05 Radon, Rn-222 Bq/L 260
Total acidity, NaOH uptake mmol/L 0.40 Strontium, Sr-87/Sr-86 0.722944
Hydrocarbonate, HCO3
mg/L 450 Sulphur,S-34 (SO4) ‰ CDT 11.24
Dissolved inorg. carbon mg/L 92 Tritium, H-3 TU 7.3
Dissolved org. carbon mg/L 16 Uranium, U-238 mBq/L 23 Ammonium, NH4 mg/L 0.24 Uranium, U-238 �g/L 1.9 Arsenic, As μg/L <5 Uranium, U-234/U-238 2.5 Barium, Ba μg/L 16 Uranium, U-238, membrane mBq/L <3.9 Boron, Btotal mg/L 0.15 Uranium, U-238, membrane �g/L <0.3
Bromide, Br mg/L 0.4 Uranium, U-234/U-238, membrane 6.0
Cadmium, Cd μg/L <2 Calcium, Ca mg/L 67 Chloride, Cl mg/L 23 Cobalt, Co μg/L 0.3 Copper, Cu μg/L <2 Fluoride, F mg/L 0.4 Iron, Fe2+ * mg/L 3.2 Iron, Fetotal
** mg/L 3.0 Lead, Pb μg/L <0.5 Magnesium, Mg mg/L 20 Manganese, Mn mg/L 1.1 Mercury, Hg μg/L <0.05 Nickel, Ni μg/L <2 Nitrate, NO3 mg/L <0.02 Nitrite, NO2 mg/L <0.010 Nitrogen, Ntotal mg/L 0.65 Phosphate, PO4 mg/L 0.4 Potassium, K mg/L 8.6 Silica, SiO2 mg/L 21 Sodium, Na mg/L 93 Strontium, Sr mg/L 0.32 Sulphate, SO4 mg/L 58 Sulphide, S2- mg/L 0.05 Sulphur, Stotal mg/L 19 Uranium, U μg/L 2.2 Zinc, Zn μg/L <5
* = analysed with spectrophotometer ** = analysed with ICP-OES empty cell = result not available yet
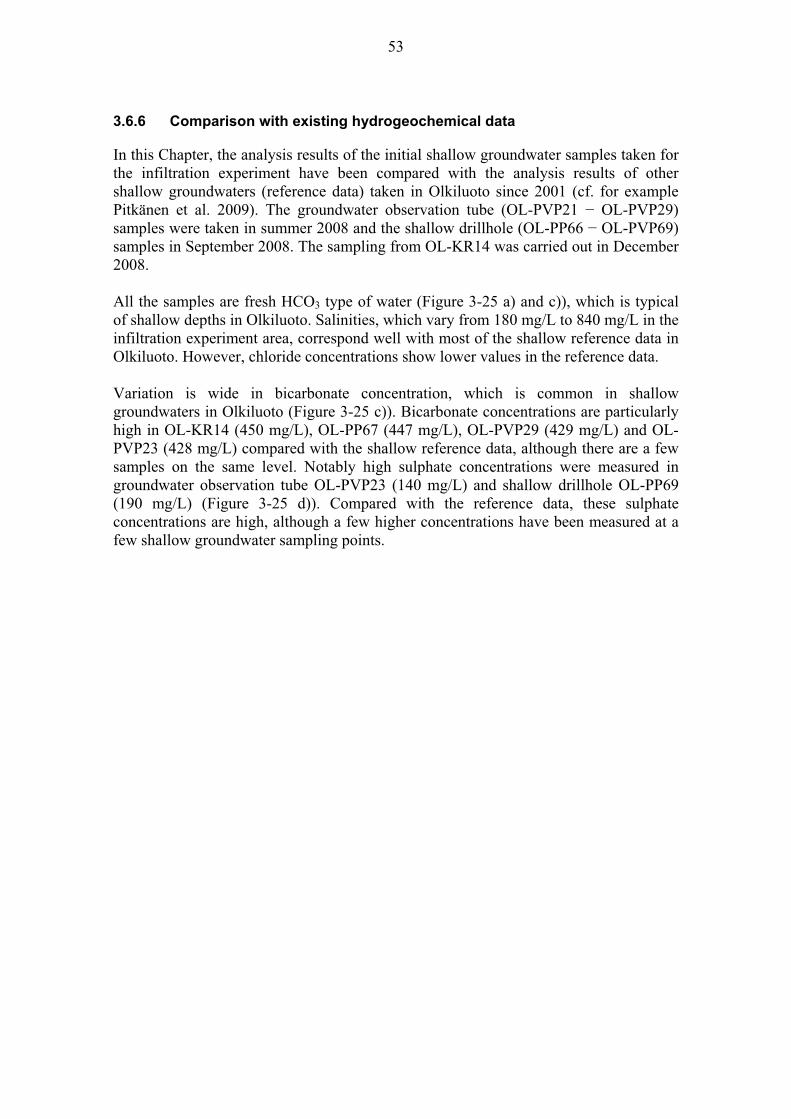
53
3.6.6 Comparison with existing hydrogeochemical data
In this Chapter, the analysis results of the initial shallow groundwater samples taken for the infiltration experiment have been compared with the analysis results of other shallow groundwaters (reference data) taken in Olkiluoto since 2001 (cf. for example Pitkänen et al. 2009). The groundwater observation tube (OL-PVP21 � OL-PVP29) samples were taken in summer 2008 and the shallow drillhole (OL-PP66 � OL-PVP69) samples in September 2008. The sampling from OL-KR14 was carried out in December 2008. All the samples are fresh HCO3 type of water (Figure 3-25 a) and c)), which is typical of shallow depths in Olkiluoto. Salinities, which vary from 180 mg/L to 840 mg/L in the infiltration experiment area, correspond well with most of the shallow reference data in Olkiluoto. However, chloride concentrations show lower values in the reference data. Variation is wide in bicarbonate concentration, which is common in shallow groundwaters in Olkiluoto (Figure 3-25 c)). Bicarbonate concentrations are particularly high in OL-KR14 (450 mg/L), OL-PP67 (447 mg/L), OL-PVP29 (429 mg/L) and OL-PVP23 (428 mg/L) compared with the shallow reference data, although there are a few samples on the same level. Notably high sulphate concentrations were measured in groundwater observation tube OL-PVP23 (140 mg/L) and shallow drillhole OL-PP69 (190 mg/L) (Figure 3-25 d)). Compared with the reference data, these sulphate concentrations are high, although a few higher concentrations have been measured at a few shallow groundwater sampling points.

54
a) b)
c) d) OL-KR14 Infiltration PVP Infiltration PP
Overburden PVP Shallow drillhole PP/PR
Figure 3-25. a) TDS, b) chloride, c) bicarbonate and d) sulphate concentrations as a function of date in shallow groundwater samples in Olkiluoto.
The cation contents in the initial groundwater samples from the experimental site mostly correspond with the reference data (Figure 3-26). An anomalous high sodium concentration (180 mg/L) is observed in OL-PP67. Higher sodium concentrations as well TDS and Cl (Figure 3-25) have been measured in general in the reference data on OL-PP7 than in other data during samplings in 2001 � 2008 (cf. hydrogeochemical monitoring reports, e.g. Pitkänen et al. 2008). This shallow monitoring point is situated about 1 km west of the experimental site. The highest potassium concentration in 2008 was observed in OL-PVP23 (15 mg/L). The highest calcium concentration in the infiltration experiment data (120 mg/L) was measured in OL-PP69. This result deviates notably from the other initial shallow drillhole (PP) samples (37 � 63 mg/L). A notably high magnesium concentration (42 mg/L) was measured in OL-PVP23. This is the highest magnesium concentration measured in Olkiluoto at shallow depths.

55
a) b)
c) d) OL-KR14 Infiltration PVP Infiltration PP
Overburden PVP Shallow drillhole PP/PR Figure 3-26. a) Sodium, b) potassium, c) calcium and d) magnesium concentrations as a function of date in shallow groundwater samples in Olkiluoto.
Chloride concentrations are relatively low in the initial groundwater samples from the experimental site (Figure 3-25 and Figure 3-27). However, similar low Cl concentrations have been typical of shallow groundwater samples taken in the central and northern parts of Olkiluoto Island during hydrogeochemical monitoring (e.g. Pitkänen et al. 2008). The highest chloride concentration was measured in shallow drillhole OL-PP67, where chloride was 64 mg/L. In plots against chloride concentration (Figure 3-27 and Figure 3-28), the same samples as above come up from the other data. In sample OL-PVP23, magnesium, potassium and sulphate concentrations are high compared with other shallow groundwaters with the same chloride amount. The magnesium and potassium concentrations were relatively high also in sample OL-PVP29. In sample OL-PP69, the ammonium concentration was high and the sulphate concentration was also high compared with other shallow groundwaters with the same

56
chloride amount. High sodium and ammonium concentrations, compared with other shallow waters with the same chloride concentrations were measured in the OL-PP67 sample. Dissolved inorganic carbon (DIC) results were high in OL-KR14 and at a few other sample points in the infiltration experiment area compared with other shallow groundwaters. Some high silicate concentrations were also found near OL-KR14, compared with other shallow water samples with the same chloride concentrations. All the main anion and cation results of the initial groundwater samples from the experimental area are enriched compared with the seawater dilution line. This indicates that salinity enrichment and anomalous high values of SO4, Mg, K, Na and NH4 in groundwater samples result mainly from chemical interaction during infiltration, not from seawater mixing. Conservative mixing of older groundwater components is minor and this also excludes any significant discharge at the site.

57
a) b)
c) d)
e) f) Overburden baseline Fresh/Brakc HCO3 baseline OL-KR14
Overburden PVP Shallow drillhole PP/PR Infiltration PVP Infiltration PP
Figure 3-27. a) pH, b) calcium, c) magnesium, d) sodium, e) potassium and f) ammonium concentrations as a function of chloride concentration in shallow groundwater samples in Olkiluoto. The line shown represents seawater dilution.

58
a) b)
c) d) Overburden baseline Fresh/Brakc HCO3 baseline OL-KR14
Overburden PVP Shallow drillhole PP/PR Infiltration PVP Infiltration PP
Figure 3-28. a) Sulphate, b) dissolved inorganic carbon, c) silicate, and d) dissolved organic carbon concentrations as a function of chloride concentration in shallow groundwater samples in Olkiluoto. The line shown represents seawater dilution.
3.7 Microbiological sampling and analysis
Detailed microbiological studies are essential for a successful experiment, because consumption of O2 and production of CO2 in meteoric recharge is mostly controlled by microbial processes. The experiment makes it possible to extend the understanding of microbiology in the upper part of the bedrock, which will also help in future predictions. The research programme in Olkiluoto has so far included investigations and monitoring of microbiological populations and their activity in overburden and at shallow depths in the bedrock (Pedersen 2008, Posiva 2009). These microbiological analyses have been carried out with a cultivation method while in the infiltration experiment they are based on molecular biology (DNA methods). However, previous information of cultivable microorganisms forms valuable reference data for the

59
microbiological studies carried out during the Infiltration experiment despite differences in analysis methods. The microbial part of the Infiltration experiment was performed to be able to track and classify groundwaters from three different drillholes over time as groundwater from deep drillhole OL-KR14 was pumped, hence studying the effect of water intrusion into the tunnel on the basis of DNA signatures. The shallow bedrock drillhole groundwater chosen was OL-PP69. OL-PVP21 and OL-PVP22 were the overburden drillholes chosen for this study and OL-KR14 was the deep drillhole that was pumped during the experiment. Samples have been taken on two different dates in December 2008 and January 2009 just after the start of the experiment (Table 3-13). 4 L of groundwater was collected from each sampling hole. Two litres were used both for DNA extraction and for RNA extraction. The methods used in the analysis of the samples were quantitative PCR (qPCR), total number of cells (TNC), Cloning and Phylochip analysis. Cloning was only performed with samples taken on the first sampling date (Table 3-13). Table 3-13. Samples, dates of sampling and analyses on the samples collected in December 2008 and January 2009.
Sampling hole
Sampling date
Analysis Total number of cells (TNC)
qPCR Cloning Phylochip
OL-PP69 2.12.2008 + + + + OL-PVP21 2.12.2008 + + + + OL-PVP22 3.12.2008 + + + + OL-KR14 12.1.2009 + - - - OL-PP69 13.1.2009 + + - + OL-PVP21 13.1.2009 + + - + OL-PVP22 12.1.2009 + + - +
A detailed description of the analysis results with the first interpretations as well as a presentation of the analytical approaches of the analysis methods will be given in forthcoming reports of the Infiltration experiment and Jägevall & Pedersen (2011).

60

61
4 UPDATED HYDROGEOLOGICAL MODEL OF THE EXPERIMENT SITE
The locations of determistic hydrogeological zones HZ19A and HZ19C are shown in Figure 4-1 as they are modelled in Vaittinen et al. (2009). The illustrations represent the interpreted core of these zones and do not describe their whole influence zone. Transmissivities higher than 1·10-7 m2/s and conceptualized hydraulic connections based on these high transmissivities and the observed hydraulic connections (such as between OL-PP66 and OL-PP67 and the pumping section in OL-KR14 and OL-PP68) are shown as thin broken lines. The idea is to just illustrate and describe the general pattern of possible main flow connections within and above zone HZ19A in the upper part of the bedrock.
PVP29PVP28
PVP26PVP25
PVP24 PVP23PVP22
PVP21
PVP2PP69
PP68 PP67PP66
PA2L3
KR30
KR18B
KR18
KR17
KR17B
KR16B
KR16
KR15B
KR15KR14
KR10
T>1E-7 m2/s
KR2
KR12
PVP29PVP28
PVP26PVP25
PVP24 PVP23PVP22
PVP21
PVP2PP69
PP68 PP67PP66
PA2L3
KR30
KR18B
KR18
KR17
KR17B
KR16B
KR16
KR15B
KR15KR14
KR10
T>1E-7 m2/s
KR2
KR12
HZ19C
HZ19A
PVP29PVP28
PVP26PVP25
PVP24 PVP23PVP22
PVP21
PVP2PP69
PP68 PP67PP66
PA2L3
KR30
KR18B
KR18
KR17
KR17B
KR16B
KR16
KR15B
KR15KR14
KR10
T>1E-7 m2/s
KR2
KR12
PVP29PVP28
PVP26PVP25
PVP24 PVP23PVP22
PVP21
PVP2PP69
PP68 PP67PP66
PA2L3
KR30
KR18B
KR18
KR17
KR17B
KR16B
KR16
KR15B
KR15KR14
KR10
T>1E-7 m2/s
KR2
KR12
HZ19C
HZ19A
Figure 4-1. The location of deterministic zones HZ19A and HZ19C (thick broken lines) as modelled in Vaittinen et al. (2009). The real nature of zone HZ19A as conceptualized “fractures” based on visual fit of oriented fractures with transmissivities higher than 10-7 m2/s and the observed hydraulic connections between the PP-holes are shown as thin broken lines. Transmissivities are classified by colours (red/dark brown = T >10-5 m2/s, light brown = 10-5 m2/s > T > 10-6 m2/s, green = 10-6 m2/s > T >10-7 m2/s). Unoriented fractures are shown as horizontal discs.

62
It seems that the pumping section in OL-KR14 is well connected to the near surface parts of drillholes OL-KR15B – OL-KR18B and shallow drillholes OL-PP67 and OL-PP68. The fracture system appears to be rather horizontal, but may have connections to the overburden – bedrock interface around observation tubes OL-PVP28 and OL-PVP29. Further information in order to update the hydrogeological model is gathered from the hydraulic and resistivity monitoring programme during the experiment.

63
5 PREDICTIONS OF HYDROGEOCHEMICAL AND HYDROLOGICAL CONDITIONS
5.1 Reactive transport calculations
In the preliminary reactive transport simulations of the infiltration experiment, the coupling of the hydraulic flow and the water-rock interaction has been carried out with the TOUGHREACT code and with the EQ3/6-database implemented in the code (Xu et al. 2005). The main objective of these preliminary simulations is the successful integration of hydrodynamic processes and chemical reactions. The intention is that the presented base model will develop gradually with the progress of the infiltration experiment.
5.1.1 Water compositions and reactive minerals
The waters considered in the infiltration experiment simulation are presented in Table 5-1. The subhorizontal hydrogeological zone HZ19 is initially filled with the water composition detected at a depth of 50–54 metres in drillhole OL-KR30 sampling (Pitkänen et al. 2008). The ground surface is an indefinite boundary for dilute meteoric water that has already undergone some organic reactions, i.e. aerobic respiration of organic matter and microbial sulphide oxidation. The surface water presented in Table 5-1 is the water composition sampled from OL-PVP25 (date July 3rd, 2008). OL-PVP25 sampling did not include O2 and aluminium analyses, which have been judged in the tabulation. Mineral reactions within soil and bedrock fractures are functions of their amounts and reactivity. Reactivity in turn is a function of several factors, which include e.g. intrinsic kinetic rate parameters, water compositions, temperature, and reactive surface areas. There are no mineral quantity analyses available from Olkiluoto soil. Therefore, it is assumed that the soil composition follows mostly the average mineral abundances found in Olkiluoto bedrock. An estimate of the average mineralogical composition of Olkiluoto bedrock has been presented in Vuorinen et al. (2003). According to mineral identification analyses of soil samples (Lintinen et al. 2003), Olkiluoto soil contains quartz, albite, potassium feldspar, illite, chlorite and hornblende. The relative quantities (coverage % and volume fraction) of these minerals are presented in Table 5-2. The percentages of Table 5-2 otherwise follow Vuorinen et al. (2003), but the sum of mica abundances (i.e. 24 %) has been revised and distributed to illite and chlorite in accordance with the observations of Lintinen et al. (2003). Without further knowledge, it is judged that the illite and chlorite concentrations in the soil are 16 % and 8 %, respectively. The total amount of tabulated minerals rises to 84.9 %. The rest of the soil minerals are considered to be non-reactive. Based on the soil sample grain size analyses (Lintinen et al. 2003), the average grain size (ø) of the soil minerals is interpreted to be around 0.1 mm. By assuming that the grains are spherical, the total reactive surface areas of the minerals can be calculated. By dividing the total reactive surface areas with the mineral volumes, the specific surface areas related to mineral phases are evaluated.

64
Table 5-1. Water compositions considered in the calculations. pH is a dimensionless parameter. Otherwise concentrations are in mg/L.
pH O2 Ca Fe Al SiO2 Na K Mg HCO3 SO4 ClSurface water OL-PVP25 6.6 6.0 33 0.5 0.10 18 5.0 2.9 3.4 84 27 8.8
Fracture water OL-KR30 7.9 0.0 24 0.3 0.02 15 158 6.3 9.7 342 55 87
In the current simulation, the specific surface areas for soil minerals are 60 000 m2/m3 (Table 5-2). However, the estimation is likely to be conservative for soil, because below the grain size median the finer fractions possess much higher reactive surface areas than the coarser fractions above the grain size median. Therefore, real reactive surface areas can be even significantly higher than the estimated 60 000 m2/m3. Within hydrogeological zone HZ19, the main fracture minerals are calcite, pyrite and clay minerals. The average observed coating areas, the thicknesses, and the volumes of these minerals are tabulated in Pitkänen et al. (2008). According to the tabulations, about 44 % of the fracture surfaces are covered with these fracture minerals (cf. Table 5-2). By taking into account the observed mineral volumes and the amount of total discovered fracture surfaces, the volume fractions of the main fracture minerals can be calculated. Neither grain size nor surface area analyses are available on Olkiluoto fracture minerals. Therefore, it is simply assumed that the grain size (ø) of the fracture minerals is around 0.2 mm. Again, by assuming that the grains are spherical, the total reactive surface areas can be calculated, and by dividing the surface areas with the observed mineral volumes, the specific surface areas are evaluated. The specific surface areas for bedrock fracture minerals are 30 000 m2/m3 (Table 5-2). In the hydrogeological HZ19 zone, 44 % of the fracture surfaces are covered with fracture minerals. Consequently, 56 % of the fracture surfaces are uncovered and the minerals of the bedrock are exposed to fracture groundwater. Table 5-2 lists five silicate phases (quartz, albite, potassium feldspar, cordierite, and hornblende) that are considered potentially reactive on the uncovered fracture surfaces. The coverage of silicate minerals has been evaluated on the basis of the uncovered 56% by weighting the five silicate phases with the average Olkiluoto bedrock composition (Vuorinen et al. 2003). The available volumes of silicates have been estimated. It is assumed that silicates form equally thick covers as fracture minerals (cf. Pitkänen et al. 2008). Volume fractions are calculated by weighting the mineral volumes with coverage percentages. The calculation of reactive surface areas assumes that silicates form continuous plain surfaces on the fracture surfaces (i.e. silicates are not in granular form). With the aid of the calculated total reactive surface areas and the silicate volumes, specific surface areas can be calculated. It turns out that the specific surface area for each fracture silicate phase is 700 m2/m3 (Table 5-2). The total amount of potentially reactive minerals within the fracture zones sums up to 82.9 %. The rest of the fracture surfaces are considered to be non-reactive.

65
Table 5-2. Coverage, volume fractions and specific surface areas of minerals considered reactive in the simulation. Characteristic values of soil minerals refer to calculation cells located in the soil layer. Values assigned for bedrock fractures refer to calculation cells located in hydrogeological zone HZ19.
SOILMin. Formula Coverage % V/Tot. solid V Specific Surf. m2/m3
Quartz SiO2 23.2 0.232 60000Albite NaAlSi3O8 19.2 0.192 60000K-feldspar KAlSi3O8 17.1 0.171 60000illite KAl2Si4O10(OH)2 16.0 0.160 60000Chlorite Fe6(Si,Al)4O10(OH)8 8.0 0.080 60000Hornblende NaCa2Mg4Al(Si6Al2O22)(OH)2 1.4 0.014 60000
� 84.9BEDROCK fractures
Min. Formula Coverage % V/Tot. solid V Specific Surf. m2/m3
Calcite CaCO3 14.4 0.051 30000Pyrite FeS2 4.2 0.010 30000Kaolinite Al2Si2O5(OH)4 25.4 0.379 30000Quartz SiO2 13.0 0.130 700Albite NaAlSi3O8 10.7 0.107 700K-feldspar KAlSi3O8 9.6 0.096 700Cordierite hydr Mg2Si5Al4O18*9H2O 4.8 0.048 700Hornblende NaCa2Mg4Al(Si6Al2O22)(OH)2 0.8 0.008 700
� 82.9
5.1.2 Kinetic mineral dissolution and precipitation
The present simulation considers kinetic mineral reactions in the ground surface soil and within bedrock fractures. Kinetic phases that are allowed to dissolve include pyrite, quartz, albite, potassium feldspar, cordierite, hornblende, chlorite, kaolinite, amorphous silica, goethite, and illite. Kinetic precipitation is only allowed for kaolinite, illite, goethite and amorphous silica. Calcite is expected to follow equilibrium thermodynamics. The rate parameters for kinetic minerals are tabulated in Table 5-3. Only acid and neutral mechanisms are tabulated, since high pH conditions are not reached in the calculations. In addition to kinetic parameterisation, precipitation is also controlled with a supersaturation gap of 0.5 (cf. Xu et al. 2005). The specific reaction rates considered, far from equilibrium, are presented in Figure 5-1. The presented pyrite reaction rate assumes that there is 1.88·10-4 mol/L O2 available in the solvent. The concentration equals to the infiltrating surface water concentration presented in Table 5-1. The simulations will concentrate approximately in a pH range of 6.0 to 8.0. In this area the highest specific rates are attributed to pyrite and goethite. The most reactive silicates are then cordierite, hornblende, and albite. Potassium feldspar and crystalline quartz are clearly less reactive minerals. Of the silica polymorphs, amorphous silica is clearly more soluble in water than crystalline quartz. Also, kinetic rates related to amorphous silica are higher than that of crystalline quartz (Figure 5-1). The reaction rates illustrated for sheet silicates (chlorite, kaolinite, illite) are low.

66
Table 5-3. A compilation of mineral kinetic rate parameters. Values are after Palandri & Kharaka (2004) unless noted otherwise.
log k E n(1 n(2 log k E n(2 � �Quartz -- -- -- -- -13.99 87.7 -- 1.0 1.0Albite -10.16 65.0 0.457 -- -12.56 69.8 -- 1.0 1.0K-feldspar -10.06 51.7 0.500 -- -12.41 38.0 -- 1.0 1.0Chlorite(3 -11.11 88.0 0.500 -- -12.52 88.0 -- 1.0 1.0Cordierite -3.80 113.3 1.000 -- -11.20 28.3 -- 1.0 1.0Hornblende -7.00 75.5 0.600 -- -10.30 94.4 -- 1.0 1.0SiO2(am.) diss. -- -- -- -- -12.13 62.9 -- 1.0 1.0SiO2(am.) prec.(4,(5 -- -- -- -- -10.00 0.0 -- 1.0 4.4Kaolinite diss. -11.31 65.9 0.780 -- -13.18 22.2 -- 1.0 1.0Kaolinite prec.(5 -- -- -- -- -13.18 22.2 -- 1.0 1.0Illite diss. -10.98 23.6 0.340 -- -12.78 35.0 -- 1.0 1.0Illite prec.(5 -- -- -- -- -12.78 35.0 -- 1.0 1.0Pyrite(6 -8.19 56.9 -0.110 0.500 -4.55 56.9 0.500 1.0 1.0Goethite diss./prec.(5 -- -- -- -- -7.94 86.5 -- 1.0 1.01)Reaction order n with respect to H+
2)Reaction order n with respect to O23)Clinochlore 14Å4)Precipitation kinetics as in Spycher et al. (2003)5)Supersaturation gap 0.5 (log(�)K) used for controlling the precipitation (cf. Xu et al. 2005)6)Reaction rate is valid over the pH range 2-10 in presence of O2 (Williamson & Rimstidt 1994)
Acid Mechanism Neutral Mechanism Saturation Const.

67
Figure 5-1. Specific reaction rates of minerals as a function of pH and far from thermodynamic equilibrium. With the exception of amorphous silica precipitation, all specific rates illustrate dissolution rates. The pyrite rate presentation assumes a dissolved O2 concentration of 6.0 mg/L in water at 25 °C.
5.1.3 Cation exhange
There are no quantitative soil composition estimates available for Olkiluoto. It was judged above that about 16 % and 8 % of the soil volume are illite and chlorite, respectively. According to Appelo & Postma (2006), the cation exchange capacity (CEC) of illite and chlorite is perhaps 20 meq/100g and 10 meq/100g, respectively, for common soil and sediment materials. Based on the judged mutual abundance of illite and chlorite and their estimated total mount (20 %) in the soil, it is estimated that CEC in the Olkiluoto soil is around 3.3 meq/100g solid. In the case of bedrock fractures, it is assumed that the cation exchange capacity is 1.27 meq/100g solid. The value is based on the fact that 25.4 % of the fracture wall area is

68
covered with clay minerals that are mostly interpreted to be kaolinite (Pitkänen et al. 2008, cf. also Table 5-2). According to Deer et al. (1995), pure kaolinite has CEC. Usually, kaolinite CEC is around 1 meq/100g solid, but may rise up to 10 meq/100g. In the current work it is assumed that CEC in the bedrock fracture clay mineral cover is around 5.0 meq/100g. The selectivity coefficients related to cation exchange are presented in Table 5-4 (after Xu et al. 2005, p.56). The Gaines-Thomas convention was used for cation exchange.
5.1.4 Results - Influence of pumping on kinetic calculations
The hydrological modelling part of the infiltration experiment can be understood as a problem of water table drawdown caused by constant-rate pumping in a well in an unconfined aquifer. The modelled fracture flowpath of a subzone of HZ19A has been conceptualized to intersect ground surface around the OL-KR15 � OL-KR18 area and pumping takes place in the OL-KR14 drillhole at the depth of 13.4 metres (Figure 5-2). The intersection of the centre line of the fracture zone and OL-KR14 is 70 metres from the ground surface and this centre line is presented as a black vector line in Figure 5-2. Table 5-4. The selectivity coefficients for cation exchange reactions.
Cation Exchange Selectivity (in terms of Na+)
0.39810.50120.1995
3.10E-06*) After Xu et al. (2005). Otherwise after Appelo (1994)
Na+ + 0.5CaX2 = 0.5Ca+2 + NaXNa+ + 0.5MgX2 = 0.5Mg+2 + NaXNa+ + KX = K+ + NaXNa+ + HX = K+ + HX(*
Figure 5-2. The TOUGHREACT conceptualization of the HZ19A subzone.

69
The first 2 metres from the ground surface have been modelled as a soil zone/layer. The initial groundwater table has been assumed to be completely flat and this water table is modelled using van Genuchten parameterisation to be approximately at 0.5 metre depth. The drawdown field was calculated with a pumping rate of 3 L/min. A transmissivity of 6.0·10-5 m2/s and a porosity of 0.5 has been used for the HZ19A subzone. This pumping causes an approximately 1 metre drawdown in the KR15-KR18 area, where the modelled HZ19A fracture intersects the soil zone. The 0.5 porosity given for the fracture zone is only an estimate. Changes in porosity and permeability originating from dissolution and precipitation of minerals were monitored during the simulation. In these preliminary reactive calculations, however, porosity and permeability changes are only monitored without feedback on fluid flow. The output from the ToughReact simulations consists of information in three categories:
1. composition of the aqueous phase, 2. distribution of primary and secondary minerals, 3. physical properties of the system, e.g., porosity.
The data presented in the figures are for 2 time periods, 1 year and 2 years of pumping over a distance of 70 metres on the centre line in the modelled fracture from the surface of the 2 metre thick soil cover through to the pumping section in drillhole KR14 (this centre line is presented as a black vector line in Figure 5-2). The pH distribution along the distance is shown in Figure 5-3. The pH remains almost constant during the first two years and only increases a little in the uppermost bedrock from the baseline value of 7.9. Over time the peak of this increase moves downward towards the pumping point. The pH of the initial soil water was 6.6.
pH
6,60E+00
6,80E+00
7,00E+00
7,20E+00
7,40E+00
7,60E+00
7,80E+00
8,00E+00
8,20E+00
8,40E+00
1 5 9 13 17 21 25 29 33 37 41 45 49 53 57 61 65 69
Distance (m)
pH
1 yr2 yr
Figure 5-3. Simulated pH evolution in soil cover (the first two metres) and fracture zone as a function of distance from the surface to the pumping point during two time intervals after initiation of pumping.

70
HCO3- in the aqueous phase
1,00E-03
1,50E-03
2,00E-03
2,50E-03
3,00E-03
3,50E-03
4,00E-03
4,50E-03
5,00E-03
1 5 9 13 17 21 25 29 33 37 41 45 49 53 57 61 65 69
Distance (m)
HC
O3- in
wat
er (m
ol/k
g)
1 yr2 yr
Figure 5-4. Simulated HCO3 concentration in soil cover (the first two metres) and fracture zone as a function of distance from the surface to the pumping point after initiation of pumping.
Figure 5-4 shows corresponding concentrations of bicarbonate (in moles/kg of water) as a function of distance. The initial concentration of bicarbonate in the bedrock water is 0.0054 moles/kg of water. After two years, the concentration of bicarbonate in the water of the fracture zone decreases to ~ 0.00155 moles/kg of water at a distance of 13 m from the surface and thus comes close to soil water concentration, which is 0.0013 moles/kg of water. These changes in predictions are mostly caused by soil water, which replaces original groundwater in fracture zone. The small increase in bicarbonate content compared with the initial soil water concentration results primarily from calcite dissolution in the fracture (Figure 5-5), which releases HCO3 and Ca in the water and consumes protons and increases pH. Initially the volume fraction of calcite in the bedrock fractures was 0.051. After two years calcite dissolution reaches to a distance of slightly over 35 metres. However, the dissolved fraction is minor and indicates a long lifetime to the fracture calcite buffer in this experiment. The drop at a 3-metre distance after the first year is less than 2 per mill of total fraction, which suggests a 500 year duration for calcite at this most disturbed point in the system. Further in the fracture calcite consumption seems to be about 1 per mill at up to 20metre distance during 2 years, which corresponds to a 2000 year lifetime. It has to be realised that the result is very preliminary and the lifetime of calcite buffer to discharge point above all depends on the actual distribution of fracture calcite coat, flow channelling, flow velocity and CO2 load in infiltrating groundwater.

71
Calcite
-1,40E-04
-1,20E-04
-1,00E-04
-8,00E-05
-6,00E-05
-4,00E-05
-2,00E-05
0,00E+00
2,00E-05
1 5 9 13 17 21 25 29 33 37 41 45 49 53 57 61 65 69
Distance (m)
Chan
ge o
f vol
ume
fract
ion
1 yr2 yr
Figure 5-5. Simulated change in volume fraction of calcite (due to dissolution when the change is negative and precipitation when the change is positive) in the soil cover (the first two metres) and the fracture zone as a function of distance from the surface to the pumping point after initiation of pumping.
Figures 5-6, 5-7, 5-8 and 5-9 show the simulated concentrations of major cations. Both Ca and Mg concentrations increase from the initial bedrock water values of 5.4·10-4 moles/kg of water and 3.6·10-4 moles/kg of water, respectively, in the upper part of the fracture zone and these increased concentration levels for both species are slightly higher than in the baseline soil water. The enrichment of Ca reflects minor dissolution of calcite, however; cation exchange with the water type change mostly dominates cation variation along the flow path. Simulations indicate direct consumption of O2 in the bedrock caused by pyrite oxidation (Figures 5-10 and 5-11). The pyrite fraction decreases slightly (original fraction is 0.01) in the uppermost part of the fracture zone due to the dissolution. The loss of the pyrite fraction is only 1 per mill at a 3metre distance after two years of pumping. Pyrite oxidation and dissolution only takes place in the topmost grid blocks of the fracture zone. This dissolution consumes aqueous oxygen completely and acidifies the groundwater. Acidification causes an anomalous higher dissolution of calcite buffer in the same topmost bedrock grid blocks (Figure 5-5). Figure 5-12 and 5-13 show the changes in the volume fraction of kaolinite and quartz as a function of distance and time. Initially the volume fraction of kaolinite and quartz was 0.379 and 0.130 in the bedrock fractures; thus precipitation is a very minor process. Kaolinite and quartz show an opposite trend to calcite and pyrite, i.e. kaolinite has precipitated due to the reactive transport of surface waters in the topmost fracture grid

72
blocks. This initial precipitation results from minor dissolution of fracture silicates (weathering), such as K-feldspar, cordierite and chlorite. The uniform precipitation of both calcite and kaolinite in the lower parts of the fracture zone is due to the slight non-equilibrium between baseline mineral and water analysis inputs. The significant effect of cation exchange on exchangeable cation concentrations is observed in Figures 5-14, 5-15, 5-16 and 5-17. The figures show the simulated results of cation concentrations in groundwater both with and without cation exchange processes. The change in porosity as a function of distance and time is shown in Figure 5-18. These changes are very small. After two years porosity has increased slightly in the forepart of the flowpath (approximately to a distance of 25 m) due to the dissolution of fracture fillings (weathering). Beyond this extremely small decrease results mostly from minor precipitation of calcite, which is actually caused by slight oversaturation of bedrock groundwater at the initial stage.
Ca2+ in the aqueous phase
0,00E+00
5,00E-04
1,00E-03
1,50E-03
1 5 9 13 17 21 25 29 33 37 41 45 49 53 57 61 65 69
Distance (m)
Ca2
+ in
wat
er (m
ol/k
g)
1 yr2 yr
Figure 5-6. Simulated Ca concentration in the soil cover (the first two metres) and the fracture zone as a function of distance from the surface to the pumping point after initiation of pumping.

73
Mg2+ in the aqueous phase
1,00E-04
1,50E-04
2,00E-04
2,50E-04
3,00E-04
3,50E-04
4,00E-04
4,50E-04
5,00E-04
5,50E-04
6,00E-04
1 5 9 13 17 21 25 29 33 37 41 45 49 53 57 61 65 69
Distance (m)
Mg2+
in w
ater
(mol
/kg)
1 yr2 yr
Figure 5-7. Simulated Mg concentration in the soil cover (the first two metres) and the fracture zone as a function of distance from the surface to the pumping point after initiation of pumping.
K+ in the aqueous phase
0,00E+00
5,00E-05
1,00E-04
1,50E-04
2,00E-04
1 5 9 13 17 21 25 29 33 37 41 45 49 53 57 61 65 69
Distance (m)
K+ in w
ater
(mol
/kg)
1 yr2 yr
Figure 5-8. Simulated K concentration in the soil cover (the first two metres) and the fracture zone as a function of distance from the surface to the pumping point after initiation of pumping.

74
Na+ in the aqueous phase
0,00E+005,00E-041,00E-031,50E-032,00E-032,50E-033,00E-033,50E-034,00E-034,50E-035,00E-035,50E-036,00E-036,50E-03
1 5 9 13 17 21 25 29 33 37 41 45 49 53 57 61 65 69
Distance (m)
Na+
in w
ater
(mol
/kg)
1 yr2 yr
Figure 5-9. Simulated Na concentration in the soil cover (the first two metres) and the fracture zone as a function of distance from the surface to the pumping point after initiation of pumping.
O2 in the aqueous phase
0,00E+00
5,00E-05
1,00E-04
1,50E-04
2,00E-04
1 5 9 13 17 21 25 29 33 37 41 45 49 53 57 61 65 69
Distance (m)
O2
in w
ater
(mol
/kg)
1 yr2 yr
Figure 5-10. Simulated O2 content in the soil cover (the first two metres) and the fracture zone as a function of distance from the surface to the pumping point after initiation of pumping.

75
Figure 5-11. Simulated change in volume fraction of pyrite (due to dissolution) in the soil cover (the first two metres) and the fracture zone as a function of distance from the surface to the pumping point after initiation of pumping.
Figure 5-12. Simulated change in volume fraction of kaolinite (due to precipitation) in the soil cover (the first two metres) and the fracture zone as a function of distance from the surface to the pumping point after initiation of pumping.
Pyrite
-1,10E-05
-1,00E-05
-9,00E-06
-8,00E-06
-7,00E-06
-6,00E-06
-5,00E-06
-4,00E-06
-3,00E-06
-2,00E-06
-1,00E-06
0,00E+00
1,00E-06
1 5 9 13
17
21
25
29
33
37
41
45
49
53
57
61
65 69
Distance (m)
Cha
nge
of v
olum
e fr
actio
n
1 yr2 yr
Kaolinite
5,00E-08
5,50E-07
1,05E-06
1,55E-06
2,05E-06
2,55E-06
1 5 9 13
17
21 25
29
33
37 41 45 49 53 57 61 65 69
Distance (m)
Cha
nge
of v
olum
e fr
actio
n
1 yr2 yr

76
Figure 5-13. Simulated change in volume fraction of quartz (due to precipitation) in the soil cover (the first two metres) and the fracture zone as a function of distance from the surface to the pumping point after initiation of pumping.
Na+ in the aqueous phase with and without fracture CEC
0,00E+005,00E-041,00E-031,50E-032,00E-032,50E-033,00E-033,50E-034,00E-034,50E-035,00E-035,50E-036,00E-036,50E-037,00E-03
1 5 9 13 17 21 25 29 33 37 41 45 49 53 57 61 65 69
Distance (m)
Na+
in w
ater
(mol
/kg)
1 yr CEC2 yr CEC1 yr2 yr
Figure 5-14. Simulated Na concentration with and without the cation exchange process in the soil cover (the first two metres) and the fracture zone as a function of distance from the surface to the pumping point after initiation of pumping.
Quartz
1,00E-10
2,01E-08
4,01E-08
6,01E-08
8,01E-08
1,00E-07
1,20E-07
1,40E-07
1,60E-07
1,80E-072 6 10 14 18 22 26 30 34 38 42 46 50 54 58 62 66 70
Distance (m)
Cha
nge
of v
olum
e fr
actio
n
1 yr2 yr

77
Ca2+ in the aqueous phase with and without fracture CEC
0,00E+00
5,00E-04
1,00E-03
1,50E-03
1 5 9 13 17 21 25 29 33 37 41 45 49 53 57 61 65 69
Distance (m)
Ca2
+ in
wat
er (m
ol/k
g)
1 yr CEC2 yr CEC1 yr2 yr
Figure 5-15. Simulated Ca concentration with and without the cation exchange process in the soil cover (the first two metres) and the fracture zone as a function of distance from the surface to the pumping point after initiation of pumping.
Mg2+ in the aqueous phase with and without fracture CEC
1,00E-04
1,50E-04
2,00E-04
2,50E-04
3,00E-04
3,50E-04
4,00E-04
4,50E-04
5,00E-04
5,50E-04
6,00E-04
1 5 9 13 17 21 25 29 33 37 41 45 49 53 57 61 65 69
Distance (m)
Mg2+
in w
ater
(mol
/kg)
1 yr CEC2 yr CEC1 yr2 yr
Figure 5-16. Simulated Mg concentration with and without the cation exchange process in the soil cover (the first two metres) and the fracture zone as a function of distance from the surface to the pumping point after initiation of pumping.
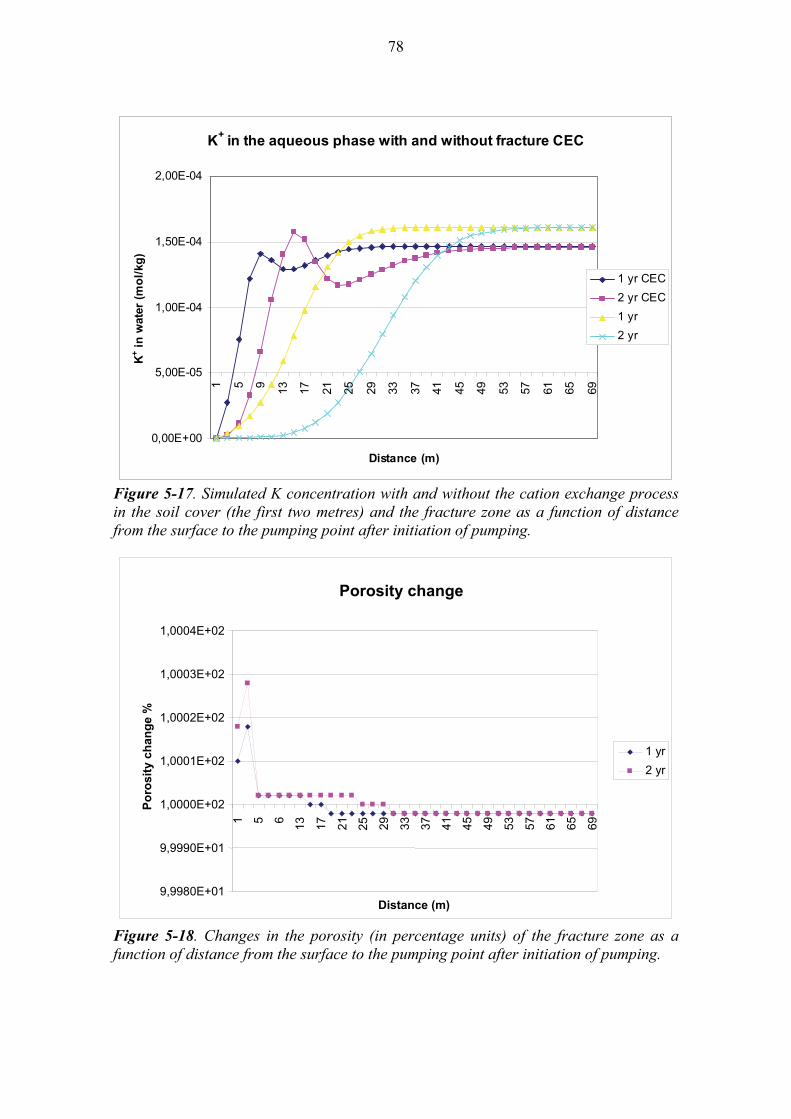
78
K+ in the aqueous phase with and without fracture CEC
0,00E+00
5,00E-05
1,00E-04
1,50E-04
2,00E-04
1 5 9 13 17 21 25 29 33 37 41 45 49 53 57 61 65 69
Distance (m)
K+ in
wat
er (m
ol/k
g)
1 yr CEC2 yr CEC1 yr2 yr
Figure 5-17. Simulated K concentration with and without the cation exchange process in the soil cover (the first two metres) and the fracture zone as a function of distance from the surface to the pumping point after initiation of pumping.
Figure 5-18. Changes in the porosity (in percentage units) of the fracture zone as a function of distance from the surface to the pumping point after initiation of pumping.
Porosity change
9,9980E+01
9,9990E+01
1,0000E+02
1,0001E+02
1,0002E+02
1,0003E+02
1,0004E+02
1 5 9
13 17 21 25
29 33 37 41 45 49 53 57 61 65 69
Distance (m)
Poro
sity
cha
nge
%
1 yr2 yr

79
In the case of Olkiluoto, the important pH and redox buffers are based on calcite and pyrite in the bedrock fractures. Geochemical equilibrium calculations using ordinary compositions for recharging waters have indicated that meteoric recharge is the main risk to the stability of these fracture minerals. The carbon dioxide leached from the organic soil layer may form the most significant agent dissolving calcite in fractures (Luukkonen et al. 2004). Acidification resulting from pyrite oxidation seems to pose rather a small threat to calcite and pyrite buffers according to these simulations in the Infiltration Experiment. The very preliminary, predictive modelling presented shows some promise as a basis for more “realistic”, more detailed and complex future conceptualizations. These more or less “black box” simulations certainly cannot reveal complexities introduced by reactive transport. It should be pointed out that the calculations presented contain significant sources of uncertainty. Weathering reactions with much higher reactive surface areas may have important contributions to the problem. Known inorganic processes not considered here include the retarded pyrite oxidation rates originating from the armouring of pyrite by ferric hydroxide precipitates. Bacterial activity may catalyse many of the inorganic reactions, e.g. pyrite dissolution, or it may produce complete process chains that regulate pH/redox conditions, but are not considered here. Further improvement of the simulator is naturally required in the near future, such as the incorporation of organic matter and its reactions in the soil cover, the incorporation of more detailed conceptualization using 3D fracture network with fracture-matrix interactions at least in the densely fractured upper parts of the bedrock as well as further refinement of all kinetic and thermodynamic parameters. Sensitivity studies are also a must for the coming simulations. The validation of the model setup and the modelling tool become increasingly complicated as the transport problem becomes more complex. As more structures and especially reaction mechanisms are added, the traceability and verification of results becomes increasingly cumbersome. Each added mechanism adds its own thermodynamic parameters into the calculation and each parameter usually is only an experimental estimate. Thus reactive transport modelling must necessarily be used as a basis for comparison with field observations.
5.2 Results of flow simulations
5.2.1 Model and data
Olkiluoto surface hydrological model (Karvonen 2008 and 2009) is a tool that can be used to study the water balance components at the Olkiluoto site and to evaluate the effect of pumping on groundwater level in overburden soils and in shallow bedrock drillholes. In the most recent version of the model (Karvonen 2009), overburden and bedrock were combined into one single numerical solution and the overburden-bedrock interface can be seen as the layer where hydraulic properties change from soil values to bedrock data. The model links unsaturated and saturated soil water in the overburden and groundwater in the bedrock into one continuous pressure system. Flux at the interface between overburden and bedrock can be calculated since the location of the first bedrock node in vertical direction can be obtained from bedrock elevation data.

80
The surface hydrological model version described by Karvonen (2008 and 2009) is a site scale model, which computes water fluxes for the whole Olkiluoto Island. A more detailed version of the model was developed for the area around the infiltration experiment (see Figure 5-19). The resolution of the computational grid is around 40x40 m2 for the whole island and 4x4 m2 in the denser grid around the infiltration experiment. The overburden hydraulic conductivities were compiled from data shown in Tammisto et al. (2005), Tammisto and Lehtinen (2006), Keskitalo and Lindgren (2007) and Keskitalo (2008). The results of the slug-tests carried out in overburden tubes OL-PVP21 � OL-PVP29 (Keskitalo 2009) were used to define the horizontal hydraulic conductivities in the infiltration experiment area. Soil water retention curves were taken from Karvonen (2009).
Figure 5-19. Computational areas of the Olkiluoto surface hydrological model in flow simulations of the infiltration experiment. The larger grid provides boundary conditions for the smaller grid around the area of the infiltration experiment.
Hydraulic conductivities in the bedrock system and in the hydrogeological zones have been described in Ahokas et al. (2008) and these data were used as such to indicate that horizontal hydraulic conductivity in the uppermost 50 m of the bedrock was 10-7 m/s for the denser grid and vertical conductivity was 10 times smaller in this layer. The surface hydrological model uses the site scale hydrogeological zones defined by Vaittinen et al. (2009). The most transmissive zones inside the denser grid area are HZ19A and HZ19C (see Figure 5-20), which are located much deeper than the pumping depth (13�17 m below soil surface). The detailed data of the local hydrogeological zones described in Chapter 4 were not yet available in the present version of the model. Since these local connections probably do have a big influence on drawdown caused by pumping from OL-KR14, a small additional local zone was added connecting zone HZ19A, pumping hole OL-KR14 and shallow bedrock holes OL-PP66, OL-PP68 and OL-PP69 (Figure

81
5-20). Simulation results will be shown both with and without this additional local zone. The transmissivities of the hydrogeological zones were 2.6·10-5 m2/s (HZ19A) and 6.3·10-5 m2/s (HZ19C) (Ahokas et al. 2008). The transmissivity of the local additional zone was assumed to be 6.0·10-6 m2/s. Leakage to ONKALO was assumed to be 30 l/min (44 m3/d) during the simulation period 01.10.2008�31.12.2009. Pumping started on December 9th, 2008. Measured meteorological variables were available for the period 01.10�31.12.2008, and for the year 2009 values from a previous average year were used. Precipitation was 550 mm/a, which is the long-term average value at the Olkiluoto site. Pumping rate from OL-KR14 was 2.8 l/min during the whole computation period. Additional runs were carried out assuming that there is no pumping. The simulation results are shown as the difference between the no pumping and 2.8 l/min pumping cases.
Figure 5-20. Hydrogeological zones HZ19A (blue) and HZ19C (green), and additional local zone (brown), which provides connections between HZ19A, OL-KR14, OL-PP66, OL-PP68 and OL-PP69.
5.2.2 Drawdown of groundwater level
The results of predicted drawdown in overburden groundwater level caused by pumping from OL-KR14 are shown in Figure 5-21 for two different cases. The first case included only site scale hydrogeological zones HZ19A and HZ19C (upper graph) while in the other case an additional local zone was added (lower graph). The drawdown caused by pumping is the highest in those areas where zones HZ19A and HZ19C intersect the

82
overburden layers. The drawdown is around 0.18 � 0.23 m when the site scale zones are included and slightly bigger, 0.2 � 0.27 m, when the influence of the additional local zone is taken into account. The local zone connects HZ19A with pumping hole OL-KR14 and therefore drawdown in the groundwater level is bigger in the area where HZ19A is close to soil surface. The drawdown maps are shown for the summer months when the effect of pumping was at its highest during the one year simulation period. The maximum drawdown was around 0.1 m after autumn rains indicating that the influence of pumping on the groundwater level is seasonal and partly reversible. The response of drawdown to pumping was relatively linear from the beginning of the pumping (December 9th, 2008) and the maximum drawdown value was reached in August 2009. The drawdown predicted at the location of the new OL-PVP-tubes (OL-PVP21 � OL-PVP29) is smaller than in the areas where HZ19A and HZ19C intersect the overburden layers. The inclusion of local hydrogeological zones that provide more connections between different holes inside the experiment area would probably change the estimated drawdown also outside the areas where HZ19A and HZ19C are close to soil surface.
5.2.3 Drawdown of hydraulic head at pumping level
OL-KR14 was pumped from a packered off section at a depth of 13 � 18.2 m. The predicted drawdown of hydraulic head at a depth of 15 m below soil surface caused by pumping is shown in Figure 5-22. The simulated drawdown is very big, around 10 m, if only site scale hydrogeological zones are included (Figure 5-22a) and much smaller (around 3.7 m), if the effect of the additional local zone is included (Figure 5-22b). The local zone distributes the effect of pumping over larger areas. According to the model results, the response of the drawdown of hydraulic head in bedrock to pumping is very fast when compared with the drawdown rate in the overburden groundwater level. The fast drawdown period in bedrock lasts only 5 � 7 weeks and then a slow continuous decline in pressure heads takes place. At this depth the maximum drawdown is not reversible and reaches its maximum values shown in Figure 5-22 at the end of the simulation period.
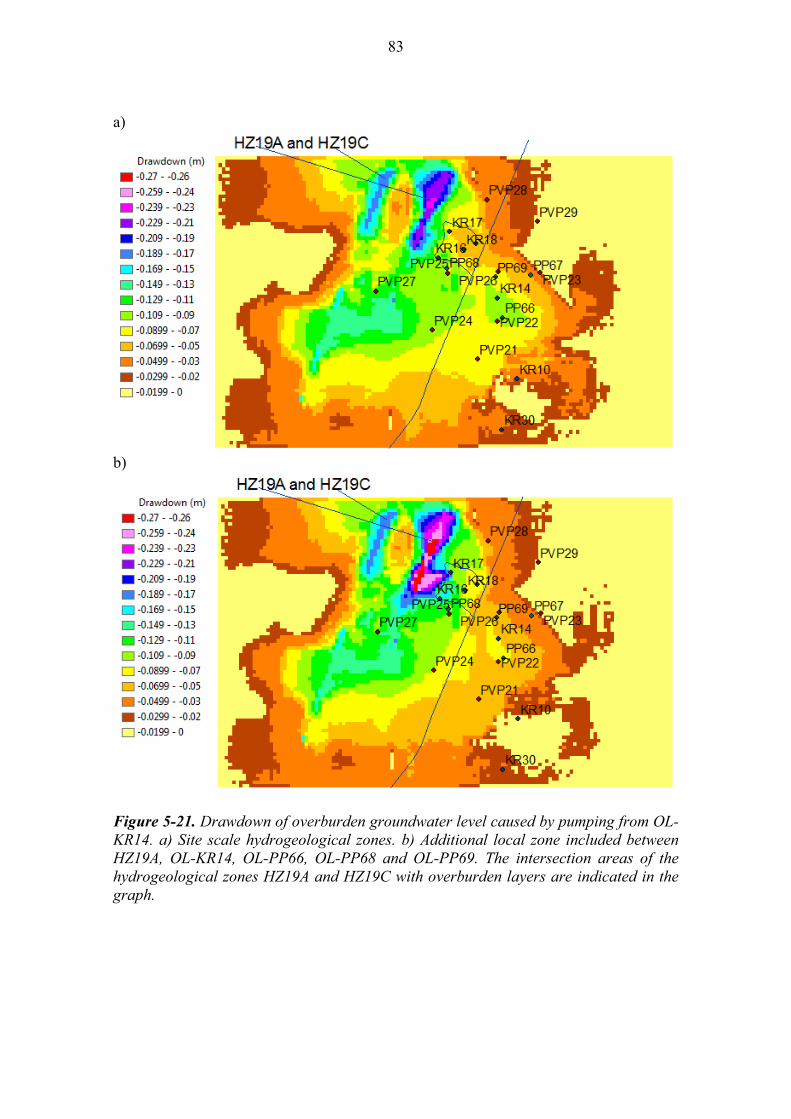
83
a)
b)
Figure 5-21. Drawdown of overburden groundwater level caused by pumping from OL-KR14. a) Site scale hydrogeological zones. b) Additional local zone included between HZ19A, OL-KR14, OL-PP66, OL-PP68 and OL-PP69. The intersection areas of the hydrogeological zones HZ19A and HZ19C with overburden layers are indicated in the graph.
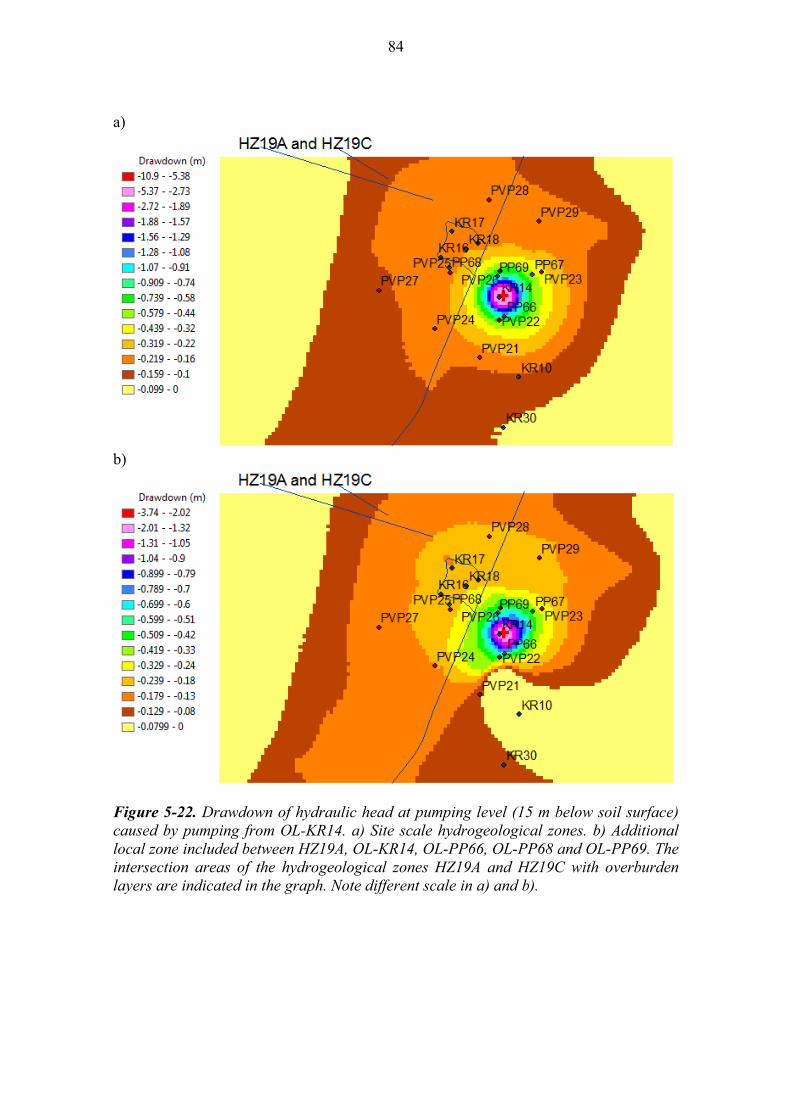
84
a)
b)
Figure 5-22. Drawdown of hydraulic head at pumping level (15 m below soil surface) caused by pumping from OL-KR14. a) Site scale hydrogeological zones. b) Additional local zone included between HZ19A, OL-KR14, OL-PP66, OL-PP68 and OL-PP69. The intersection areas of the hydrogeological zones HZ19A and HZ19C with overburden layers are indicated in the graph. Note different scale in a) and b).

85
5.2.4 Drawdown of hydraulic head at depth 8 m below soil surface
The influence of pumping on the drawdown in hydraulic head at a depth of 8 m below soil surface is shown in Figure 5-23. At this depth the effect of pumping is the highest close to pumping hole OL-KR14, if only site scale hydrogeological zones HZ19A and HZ19C are included (Figure 5-23a). The drawdown is almost radial around the pumping hole due to the fact that the bedrock layer is homogenous and zones HZ19A and 19C do not intersect bedrock at this depth in the area where pumping takes place. When the additional local zone is included in the computation the biggest drawdown can be seen in the areas, which have a connection to OL-KR14 along the additional local zone and where bedrock is close to soil surface (OL-KR16 and OLKR17). The local zone transmits the effect of pumping horizontally more effectively to areas where overburden depths are small.
5.2.5 Thickness of unsaturated bedrock layer
The Olkiluoto surface hydrological model calculates the groundwater level by locating the elevation, where matric potential h is zero (H=h+z, H is total hydraulic head and z is elevation). Matric potential is negative in the unsaturated zone and positive in the saturated zone. The thickness of the unsaturated bedrock areas can be computed as the difference GWL-ZB (GWL is the elevation of groundwater level and ZB is bedrock elevation). A negative value for GWL-ZB indicates those areas where the uppermost part of the bedrock is unsaturated allowing e.g. more efficient oxygen diffusion through partly open pores. The thickness of the unsaturated bedrock is shown in Figure 5-24 at two different times during the computation period: at high groundwater level (autumn, upper graph) when the thickness of the unsaturated bedrock areas is the smallest and at low groundwater level (summer) when the extent of the unsaturated bedrock areas is the biggest. The computations shown in Figure 5-24 were carried out without the additional local zone. Seasonal variation in the difference GWL-ZB is much bigger than the difference between the cases with and without the additional local zone.
5.2.6 Recharge through overburden-bedrock interface
The computed recharge through the overburden-bedrock interface is shown in Figure 5-25 for two cases: with pumping from OL-KR14 not included and with 2.8 l/min pumping without the influence of the additional local zone. The flux is positive in recharge areas (downward flux) and negative in discharge areas (upward flux). The biggest discharge areas are located in the eastern part of the computational area close to the Korvensuo reservoir. The extent of the discharge areas is quite small partly due to the relatively small elevation changes in the computational area (lowest elevation is around 6 m and highest is about 11 m) and partly due to the water leaking to the ONKALO tunnel. ONKALO influences recharge especially in the south-eastern corner of the computational area. The addition of more detailed local hydrogeological zones is needed in future computations to increase the reliability of the recharge/discharge computations.

86
a)
b)
Figure 5-23. Drawdown of hydraulic head at 8 m depth below soil surface caused by pumping from OL-KR14. a) Site scale hydrogeological zones. b) Additional local zone included between HZ19A, OL-KR14, OL-PP66, OL-PP68 and OL-PP69. The intersection areas of hydrogeological zones HZ19A and HZ19C with overburden layers are indicated in the graph.

87
a)
b)
Figure 5-24. Thickness of unsaturated bedrock layer (groundwater level elevation minus bedrock elevation; negative values indicate unsaturated bedrock areas). a) Highest groundwater level during the simulation period. b) Lowest groundwater level during the simulation period. The additional local hydrogeological zone was not included in these simulations. The intersection areas of hydrogeological zones HZ19A and HZ19C with overburden layers are indicated in the graph. Note different scale in a) and b).

88
a)
b)
Figure 5-25. Recharge through overburden-bedrock interface. Negative values indicate discharge areas. a) No pumping from OL-KR14. b) 2.8 l/min pumping from OL-KR14. The additional local hydrogeological zone was not included in these simulations. The intersection areas of hydrogeological zones HZ19A and HZ19C with overburden layers are indicated in the graph.

89
6 SUMMARY
An infiltration experiment to investigate potential changes in pH and redox conditions and in buffering capacity as well as the hydrogeochemical processes related to groundwater infiltration was started in late 2008 near ONKALO. The purpose of the experiment is to monitor the major infiltration flow path from ground surface into the upper part of ONKALO at a depth of about 50 to 100 m depending on the observations made during the experiment. Infiltration is activated by pumping a highly transmissive fracture zone (13 � 18.2 m) in drillhole OL-KR14, which is a part of site scale hydrogeological feature HZ19A (Posiva 2009). The influence of pumping is then monitored in drillholes, groundwater observation tubes and lysimeters through water, groundwater and microbiological samplings as well as hydrogeological measurements. Before the experiment was started, four new monitoring drillholes, nine groundwater observation tubes and nine lysimeters were installed in the test area and very detailed baseline field investigations were carried out. Also, some predictive flow and reactive transport modelling was performed. In addition, information was collected of existing investigation data, such as hydrogeological and overburden investigation data, on the area of interest. The baseline field investigations included geological logging of the cores of new shallow drillholes, flow and transverse flow measurements in shallow drillholes, SLUG measurements in new groundwater observation tubes, head monitoring, groundwater and microbiological sampling and analysis from observation tubes, shallow drillholes and pumping section in OL-KR14, water sampling and analysis from lysimeters and resistivity measurements of the overburden. A detailed hydrogeological model of the experiment area was updated simultaneously with the baseline field investigations; the previous version had been presented in Pitkänen et al. (2008). The existing overburden investigation data from the area of interest cover five deep soil pits (OL-KK6 and OL-KK7, OL-KK17, OL-KK18 and OL-KK19). Soil samples were taken in vertical profiles from humus and from two to three different mineral soils layers down to bedrock, if possible. The dataset from soil samples comprises geotechnical properties, soil types and physical and geochemical analyses of the soil samples (see Chapter 3.1 for details). The observed soil types were sandy till and fine grained till with some silt and clay layers. After investigations in OL-KK17 � OL-KK19, five lysimeters were installed at various depths. The maps of the overburden thickness and bedrock surface elevation were updated from the previous versions presented in Pitkänen et al. (2008). The overburden thickness varies from 0 metres to some 10 metres in the experiment area. The thickest soil layer is found just south of drillhole OL-KR14. The level of the bedrock surface varies from some 0 m.a.s.l to some 10 m.a.s.l. Four shallow investigation holes (OL-PP66 � OL-PP69) were drilled in the area. The drill core mapping of these drillholes included logging of lithology, foliation, fracture parameters, fractured zones, core loss, weathering, fracture frequency, RQD and rock

90
quality. The dominant rock types were diatexitic gneiss, veined gneiss, pegmatitic granite and mica gneiss. The average fracture frequency in different holes varied from 3.9 pcs/m to 5.8 pcs/m. The majority of the fractures were only thinly filled with kaolinite. Furthermore, optical imaging of the drillholes was performed and data were interpreted against the fracture data listed in drill core logging and the hydraulic data from the difference flow measurements; these are discussed in detail in Chapter 3.3. Near-surface resistivity and time-domain induced polarization (IP) baseline surveys were carried out in the vicinity of the assumed location of the intersection of the rock surface and hydrological zone HZ19A along three parallel surface measurement lines. The objective of these measurements was to obtain background information about natural water-content changes in the overburden layers. The resistivity and IP measurements were carried out using electrodes both the surface and in the overburden. The results were plotted as inverted resistivity and chargeability distributions. Based on the results, the bedrock topography is traceable in both resistivity and chargeability results and in good accordance with point information from soil pits, groundwater tubes and drillholes located in the vicinity of the measurement area. Correspondingly, references of noticeable changes in the water-content can be seen in the results, especially in the overburden sections. Difference flow measurements have been performed in all core drilled holes located in the vicinity of the infiltration area. The information provided in the available reports of the measurements is collected and listed in this Report and also, an overview of the results down to 100 metres in each drillhole, complete with geological information and relevant geological and hydrogeological models as well as installed packer configurations, is presented. The most important results, such as transmissivities of fractures, flow conditions in open holes and specific fracture EC are also shown. The transmissivities of the drillholes down to 100 metres vary from 10-9 to 10-5 m2/s in magnitude and the TDS values from some 0.2 to 6 g/l in magnitude. Slug tests were carried out in new nine observation tubes before the start of the experiment. The obtained hydraulic conductivities varied from 10-6 to 10-5 m/s in magnitude. Head data have been collected for years in the surrounding deep drillholes, mainly by automatic data collectors. For the experiment, systematic head measurements were started also in the new shallow drillholes and PVP-tubes. The hydraulic head data were collected and presented as time series for the drillholes and PVP-tubes of interest. Baseline head values were defined, as well. The baseline heads vary in shallow drillholes as well as in the observed drillhole sections of interest in deep drillholes from 3.74 m.a.s.l to 8.37 m.a.s.l. In PVP-tubes, correspondingly, the variation is from 6.21 up to 7.99 m.a.s.l. Based on the baseline heads defined in this work, preliminary predictions of the possible connections and the recharge and discharge routes were made. Based on the head data and topographical factors, recharge conditions are possible from overburden to bedrock. Data from shallow drillholes and packed off sections in deep drillholes indicate that connections are poor between some sections/fractures. Baseline geochemical sampling for the infiltration experiment started in summer 2008 in thirteen groundwater observation tubes and in four shallow drillholes near OL-KR14.
91
A groundwater sample was also collected from pumping hole OL-KR14 at a depth of 13�18.2 m in December 2008. Additionally, nine water samples were collected from lysimeters. The sampling from lysimeters was carried out just after the installation of the lysimeters, and therefore the results do not present even the baseline situation at the surface. The most extensive analysing programme was used for all samplings from the observation tubes and shallow drillholes and the results are presented in this Report (see Chapter 3.6). All samples are fresh HCO3 type of water. Salinities vary from 180 mg/L to 840 mg/L. Variation in bicarbonate concentration is wide (84 mg/L � 450 mg/L). Sulphate concentrations vary from 27 mg/L to 190 mg/L. An anomalous high sodium concentration (180 mg/L) is observed in OL-PP67, otherwise the concentrations vary from 5 to 93 mg/L in the observation tubes and drillholes. Potassium concentration varied from 2.9 mg/L to 15 mg/L, the highest potassium concentration was observed in OL-PVP23. The highest calcium concentration in the infiltration experiment data (120 mg/L) was measured in OL-PP69. This result deviates notably from the other initial observation tube (PVP) and shallow drillhole samples (37 � 110 mg/L). A notably high magnesium concentration (42 mg/L) was measured in OL-PVP23. Chloride concentrations were relatively low (3.7 � 64 mg/L). Dissolved inorganic carbon (DIC) results were high in OL-KR14 and at a few other sample points in the infiltration experiment area compared with other shallow groundwaters. A few high silicate concentrations were also found near OL-KR14, when compared with other shallow waters with the same chloride concentrations. Two microbiological sampling campaigns were performed, in December 2008 and January 2009 just after the start of the experiment and in total 7 samples were collected from four different drillholes or observation tubes. Samples have been analysed using four different methods, quantitative PCR (qPCR), total number of cells (TNC), Cloning and Phylochip analysis. The results and the analytical approaches of sampling and analysis will be reported in the forthcoming Report of Infiltration experiment and Jägevall 2010. The hydrogeological model of the site was updated from the previous version presented in Pitkänen et al. (2008). The data from the latest hydrogeological model of the site (Vaittinen et al. 2009) were used as background data in this work. The basic idea was to illustrate and describe the general pattern of possible main flow connections within and above zone HZ19A in the upper part of the bedrock. The fracture system appears to be rather horizontal, but may have connections to the overburden. The preliminary reactive transport simulations of the infiltration experiment were executed with the TOUGHREACT code and with the EQ3/6-database implemented in the code. The main objective of these preliminary simulations was to successfully integrate hydrodynamic processes and chemical reactions. As initial data for the simulations, water compositions for the surficial and fracture waters were identified. Also, reactive minerals in soil and bedrock fractures, complete with their properties such as coverage, volume fractions and specific surface areas, were defined. The simulation considered kinetic mineral reactions in ground surface soil and within bedrock fractures. The kinetic phases that were allowed to dissolve include pyrite,

92
quartz, albite, potassium feldspar, cordierite, hornblende, chlorite, kaolinite, amorphous silica, goethite, and illite. Kinetic precipitation was only allowed for kaolinite, illite, goethite and amorphous silica. Rate parameters and specific reaction rates were defined for these minerals. Cation exchange capacity was defined for illite and chlorite in soil volume and for kaolinite in bedrock fracture. The simulations were carried out as constant rate pumping in a well in an unconfined aquifer. The modelled fracture flowpath of a subzone of HZ19A was conceptualized to intersect the ground surface around the OL-KR15 � OL-KR18 area and pumping took place in the OL-KR14 drillhole at a depth of 13.4 metres. The dimensions of the fracture flowpath in the modelled volume were 600 m x 0.002 m x 200 m. The output from the simulations included information on the composition of the aqueous phase, the distribution of primary and secondary minerals and the physical properties of the system (porosity). The results are discussed in detail in Chapter 5.1.4 in this Report. This predictive modelling was the first attempt to explain and understand reactive transport, but it includes uncertainties. The intention is that the presented base model will develop gradually with the progress of the infiltration experiment. A more detailed version of the Olkiluoto surface hydrological model was developed for the area around the infiltration experiment using a 4x4 m2 grid size. Local soil surface, bedrock elevation and soil hydraulic conductivity data were utilized in constructing the model. However, only site scale data were available for the location of the most transmissive hydrogeological zones. The analysis of hydraulic responses has shown (see Chapters 3 and 4 in this Report) that there are local connections between different areas around pumping drillhole OL-KR14. The addition of a small local zone connecting HZ19A, OL-KR14, OL-PP66, OL-PP68 and OL-PP69 was implemented to show the importance of local connections in estimating the drawdown caused by pumping from OL-KR14. In future simulations it is necessary to describe these local zones explicitly in the model to allow more realistic flow simulations.
93
REFERENCES
Ahokas, H., Tammisto, E. & Lehtimäki T. 2008. Baseline Head in Olkiluoto. Olkiluoto, Finland: Posiva Oy. Working Report 2008-69. 191 p. http://www.posiva.fi/ Andersson, J., Ahokas, H, Hudson, J., Koskinen, L., Luukkonen, A., Löfman, J., Keto, V., Pitkänen, P, Mattila, J., Ikonen, A.T.K & Ylä-Mella, M. 2007a. Posiva site description. Olkiluoto, Finland: Posiva Oy. Posiva Report 2007-03. 229 p. http://www.posiva.fi/ Andersson, J., Ahokas, H, Hudson, J., Koskinen, L., Luukkonen, A., Löfman, J., Keto, V., Pitkänen, P, Mattila, J., Ikonen, A.T.K, Ylä-Mella, M. 2007b. Posiva site description. Olkiluoto, Finland: Posiva Oy. Posiva Report 2007-03. 313 p. http://www.posiva.fi/ Appelo, C.A.J., 1994. Cation and proton exchange, pH variations and carbonate reactions in a freshening aquifer. Water Resources Research 30, 2793–2805. Appelo, C.A.J. & Postma, D. 1996. Geochemistry, groundwater and pollution. A.A. Balkema, Rotterdam, Netherlands. 536 p. Birkeland, P.W. 1974. Pedology, weathering and geomorphological research. New York, Oxford University Press, 285 p. Davis, S.N. & De Wiest, R.J.M. 1967. Hydrogeology, 2. ed., Wiley, New York. Deer, W.A., Howie, R.A. & Zussman, J. (1995) An introduction to the rock forming minerals, 2nd edition. Longman, Harlow, England. 698 p. Haapanen, R., Aro, L., Helin, J., Hjerpe, T., Ikonen, A.T.K, Kirkkala, T., Koivunen, S., Lahdenperä, A-M., Puhakka, L., Rinne, M. & Salo, T. 2009. Olkiluoto Biosphere Description 2009. Posiva Oy. Posiva Report 2009–02. 416 p. http://www.posiva.fi/ Hellä, P. & Heikkinen, P. 2004. Slug Tests in Shallow Holes at Olkiluoto 2002. Eurajoki, Finland: Posiva Oy. 201 p. Working Report 2004-13. 201 p. http://www.posiva.fi/ Hämäläinen, H. 2006. Hydraulic crosshole interference tests at Olkiluoto, Eurajoki in 2004 HTU-measurements in boreholes KR14, KR17 and KR18. Eurajoki, Finland: Posiva Oy. Working Report 2006-02. 17 p. Hämäläinen, H. 2006. Hydraulic conductivity measurements with HTU at Eurajoki Olkiluoto, borehole OL-KR14 Volumes 1 and 2. Olkiluoto, Finland: Posiva Oy. Working Report 2004-42. 24 p + Appendices. Hämäläinen, H. 2005. Hydraulic conductivity measurements with HTU at Eurajoki Olkiluoto, borehole OL-KR15 Volumes 1 and 2. Olkiluoto, Finland: Posiva Oy. Working Report 2005-23. 24 p + Appendices.

94
Jägevall, S.& Pedersen, K. 2010. Infiltration, Classification of Infiltration groundwater using DNAfingerprinting. Olkiluoto, Finland: Posiva Oy. Working Report (in preparation). xx p. Karvonen, T. 2008. Surface and near-surface hydrological model of Olkiluoto Island. Olkiluoto, Finland: Posiva Oy. Posiva Working Report 2008-17. 88 p. http://www.posiva.fi/ Karvonen, T. 2009. Increasing the reliability of the Olkiluoto surface and near-surface hydrological model. Olkiluoto, Finland; Posiva Working Report 2009-07. 77 p. http://www.posiva.fi/ Keskitalo, K. & Lindgren, S. 2007. Slug Tests in PP- and PVP-Holes at Olkiluoto in 2006. Eurajoki, Finland: Posiva Oy. Working Report 2007-93. 81 p. http://www.posiva.fi/ Keskitalo, K. 2008. Slug-tests in PP- and PVP-holes at Olkiluoto in 2007. Olkiluoto, Finland: Posiva Oy. Working Report 2008-21. 111 p. http://www.posiva.fi/ Keskitalo, K. 2009. Slug-tests in PP- and PVP-holes at Olkiluoto in 2008. Olkiluoto, Finland: Posiva Oy. Working Report 2009-05. 96 p. http://www.posiva.fi/ Keskitalo, K. & Lindgren, S. 2007. Slug-tests in PP- and PVP-holes at Olkiluoto in 2006. Olkiluoto, Finland: Posiva Oy. Working Report 2007-93. 81 p. http://www.posiva.fi/ Klockars, J., Vaittinen, T. & Ahokas, H. 2006. Hydraulic crosshole interference tests at Olkiluoto, Eurajoki in 2004 boreholes KR14-KR18 and KR15B-KR18B. Eurajoki, Finland: Posiva Oy. Working Report 2006-01. 61 p. Kuusirati, J. & Tarvainen A-M. 2009. Core drilling of drillholes OL-PP66-69 at Olkiluoto in 2008. Olkiluoto, Finland: Posiva Oy. Working Report 2009-13. http://www.posiva.fi/ Lahdenperä, A-M. 2009. Summary of overburden studies of the soil pits OL-KK14, OL-KK15, OL-KK16, OL-KK17, OL-KK18 and OL-KK19 at Olkiluoto, Eurajoki in 2008. Olkiluoto, Finland: Posiva Oy. Working Report 2009-109. http://www.posiva.fi/ Lintinen, P., Kahelin, H., Lindqvist, K. and Kaija, J. 2003 Soil sample analyses of Olkiluoto. Olkiluoto, Finland: Posiva Oy. Working Report 2003-01. 123 p. Luukkonen, A., Pitkänen, P. and Partamies, S., 2004. Significance and estimations of lifetime of natural mineral buffers in the Olkiluoto bedrock. Posiva Oy. Working Report 2004-08. 38 p Luukkonen, A. 2006. Estimations of Durability of Fracture Mineral Buffers in the Olkiluoto Bedrock. Posiva Oy. Working Report 2006-107. 38 p. http://www.posiva.fi/

95
de Marsily, G. 1986.Qantitative Hydrogeology. Groundwater Hydrology for Engineers. Academic Press, Inc. New York. Mäkiaho, J-P. 2005. Development of shoreline and topography in the Olkiluoto area, western Finland, 2000 BP – 8000 AP. Olkiluoto, Finland: Posiva Oy, Working Report 2005-70. 47 p. http://www.posiva.fi/ Paaso, N. (toim.), Mäntynen, M., Vepsäläinen, A. and Laakso, T. 2003. Posivan vesi-näytteenoton kenttätyöohje, rev.3, Helsinki: Posiva Oy. Posiva Työraportti 2003-02. (in Finnish with an English abstract) 209 s. Palandri, J.L. & Kharaka, Y.K., 2004. A compilation of rate parameters of water-mineral interaction kinetics for application to geochemical modelling. U.S. Geological Survey, Denver, Colorado, U.S.A., Open File Report 2004-1068, 64 p. Pedersen, K. 2008. Microbiology of Olkiluoto Groundwater 2004-2006. Olkiluoto, Finland: Posiva Oy. Posiva Report 2008-02. 156 p. http://www.posiva.fi/. Pitkänen, P., Löfman, J., Koskinen, L., Leino-Forsman, H. & Snellman, M. 1999a. Application of mass-balance and flow simulation calculations to interpretation of mixing at Äspö, Sweden. Applied Geochemistry 7, 893-906. Pitkänen, P., Ahokas, H., Ylä-Mella, M., Partamies, S., Snellman, M. and Hellä, P. (ed.) 2007. Quality Review of Hydrochemical Baseline Data from the Olkiluoto Site. Olkiluoto, Finland: Posiva Oy. Posiva Report 2007-05. 134 p. ISBN: 978-951-652-153-7. Pitkänen, P., Korkealaakso, J., Löfman, J., Keto, V., Lehtinen, A., Lindgren, S., Ikonen, A., Aaltonen, I., Koskinen, L., Ahokas, H., Ahokas, T. & Karvonen, T. 2008. Investigation Plan for Infiltration Experiment in Olkiluoto. Olkiluoto, Finland: Posiva Oy. Working Report 2008-53. 38 p. http://www.posiva.fi/ Pitkänen, P., Partamies, S., Lahdenperä A-M., Ahokas, T. & Lamminmäki, T. 2009. Results of Monitoring at Olkiluoto in 2008; Hydrogeochemistry. Olkiluoto, Finland: Posiva Oy. Working Report 2009-44. 236 p. http://www.posiva.fi/ Posiva Oy. 2003. Programme of monitoring at Olkiluoto during construction and operation of the ONKALO. Olkiluoto, Finland: Posiva Oy, Posiva Report 2003-5. 92 p. http://www.posiva.fi/. ISBN 951-652-119-3 Posiva Oy. 2009. Posiva Site Description 2008, Part 1. Olkiluoto, Finland: Posiva Oy, Posiva Report 2009-1. 390 p. http://www.posiva.fi/. ISBN: 978-951-652-169-8 Posiva Oy. 2009. Posiva Site Description 2008, Part 2. Olkiluoto, Finland: Posiva Oy, Posiva Report 2009-1. 324 p. http://www.posiva.fi/. ISBN: 978-951-652-169-8 Pöllänen, J. 2009. Difference Flow and Electrical Conductivity measurements at the Olkiluoto Site in Eurajoki, Drillholes OL-PP66 - OL-PP69. Olkiluoto, Finland: Posiva Oy. Working Report 2009-08. 74 p. http://www.posiva.fi/

96
Pöllänen, J., Pekkanen, J. and Rouhiainen, P. 2005b. Difference flow and electric conductivity measurements at the Olkiluoto site in Eurajoki, boreholes KR29, KR29B, KR30, KR31, KR31B, KR32, KR33 and KR33B. Eurajoki, Finland: Posiva Oy. Working Report 2005-47. 30 p + Appendices. Pöllänen, J., Pekkanen, J., Rouhiainen, P. 2005. Difference flow and electric conductivity measurements at the Olkiluoto site in Eurajoki, boreholes KR29, KR29B, KR30, KR31, KR31B, KR32, KR33 and KR33B. Eurajoki, Finland: Posiva Oy. Working Report 2005-47. 30 p + Appendices. Pöllänen, J. & Rouhiainen, P. 1996a. Difference Flow Measurements at the Olkiluoto Site in Eurajoki, Boreholes KR1-KR4, KR7 AND KR8. Helsinki, Finland: Posiva Oy. Work Report PATU-96-43e.. Pöllänen, J. & Rouhiainen, P. 1996b. Difference flow measurements at the Olkiluoto site in Eurajoki, boreholes KR9 and KR10. Helsinki, Finland: Posiva Oy. Work Report PATU-96-44e. Pöllänen, J. & Rouhiainen, P. 2002a. Difference flow and electric conductivity measurements at the Olkiluoto site in Eurajoki, boreholes KR13 and KR14. Helsinki, Finland: Posiva Oy. Working Report 2001-42. 100 p. Pöllänen, J. & Rouhiainen, P. 2002b. Difference flow and electric conductivity measurements at the Olkiluoto site in Eurajoki, boreholes KR15-KR18 and KR15B-KR18B. Helsinki, Finland: Posiva Oy. Working Report 2002-29. 134 p. Pöllänen, J. & Rouhiainen, P. 2002d. Difference flow and electric conductivity measurements at the Olkiluoto site in Eurajoki, extended part of borehole KR15. 31 p. Helsinki, Finland: Posiva Oy. Working Report 2002-43. 57 p. Pöllänen, J. & Rouhiainen, P. 2005. Difference flow and electric conductivity measurements at the Olkiluoto site in Eurajoki, boreholes KR1, KR2, KR4, KR7, KR8, KR12 and KR14. Eurajoki, Finland: Posiva Oy. Working Report 2005-51. 30 p + Appendices. Pöllänen, J. & Rouhiainen, P. 2006. Monitoring measurements by difference flow method during the year 2005, boreholes KR2, KR4, KR7, KR8, KR10, KR14, KR22, KR22B, KR27 and KR28. Olkiluoto, Finland: Posiva Oy.. Working Report 2006-39. 40 p. Rouhiainen, P. 2000. Electrical conductivity and detailed flow logging at the Olkiluoto site in Eurajoki, boreholes KR1-KR11. Helsinki, Finland: Posiva Oy. Working Report 99-72. 202 p. Rouhiainen, P. & Pöllänen, J. 2003. Hydraulic crosshole interference tests at the Olkiluoto site in Eurajoki, boreholes KR14 - KR18 and KR15B - KR18B. Eurajoki, Finland: Posiva Oy. Working Report 2003-30. 234 p.

97
Tammisto, E. & Lehtinen, A. 2006. Slug-Tests in PP- and PVP-Holes at Olkiluoto in 2005. Eurajoki, Finland: Posiva Oy. Working Report 2006-100. 93 p. http://www.posiva.fi/ Tammisto, E., Hellä, P. & Lahdenperä, J. 2005. Slug-tests in PP- and PVP-holes at Olkiluoto in 2004. Olkiluoto, Finland: Posiva Oy. Working Report 2005-76. 87 p. http://www.posiva.fi/ Tammisto, E., Palmén, J. & Ahokas, H. 2008. Database for hydraulically conductive fractures. Eurajoki, Finland: Posiva Oy. Working Report 2009-30. 110 p. http://www.posiva.fi/ Tammisto, E. & Lehtinen, A. 2006. Slug-tests in PP- and PVP-holes at Olkiluoto in 2005. Olkiluoto, Finland: Posiva Oy. Working Report 2006-100. 93 p. http://www.posiva.fi/ Vaittinen, T., Ahokas, H. & Nummela, J. 2009. Hydrogeological structure model of the Olkiluoto Site – update in 2008. Olkiluoto, Finland: Posiva Oy. Working Report 2009-15. 275 p. http://www.posiva.fi/ Vuorinen, U., Lehikoinen, J., Luukkonen, A. and Ervanne, H. (2003) Effects of salinity and high pH in crushed rock and bentonite – Experimental work and modelling in 2001 and 2002. Olkiluoto, Finland: Posiva Oy. Working Report 2003-22. 33 p. Väisäsvaara, J., Pöllänen, J. & Sokolnicki, M. 2008a. Monitoring measurements by difference flow method during the year 2006, drillholes OL-KR1, OL-KR4, OL-KR7, OL-KR8, OL-KR10, OL-KR14, OL-KR22, OL-KR22B, OL-KR27 and OL-KR28. Eurajoki, Finland: Posiva Oy. Working Report 2008-16. 394 p. http://www.posiva.fi/ Väisäsvaara, J., Pöllänen, J. & Sokolnicki, M. 2008b. Monitoring measurements by difference flow method during the year 2007, drillholes OL-KR2, -KR7, OL-KR8, -KR8, OL-KR14, OL-KR22, OL-KR22B, OL-KR27 and OL-KR28. Eurajoki, Finland: Posiva Oy. WR 2008-40. 288 p. http://www.posiva.fi/ Väisäsvaara, J. 2009. Transverse Flow Measurements at the Olkiluoto Site in Eurajoki, Drillholes OL-KR15, -KR15B, -KR16B, -KR17B, and -KR18. Olkiluoto, Finland: Posiva Oy, Working Report 2009-23. 310 p. http://www.posiva.fi/ Väisäsvaara, J. 2010. Electrical Conductivity and Water Sampling Measurements at the Olkiluoto Site in Eurajoki, Drillholes OL-KR30 and OL-KR47. Eurajoki, Finland; Posiva Oy. Working Report 2010-15. 62 p. http://www.posiva.fi/ Xu, T., Sonnenthal, E., Spycher, N., and Pruess, K. (2005) TOUGHREACT user's guide: A simulation program for nonisothermal multiphase reactive geochemical transport in variably saturated media. Ernest Orlando Lawrence Berkeley National Laboratory, Berkeley, California. LBNL-55460. 192 p.

98

99
APPENDICES

APP
END
IX 3
.1: R
ESU
LTS
OF
THE
PHYS
ICA
L A
ND
GEO
CH
EMIC
AL
AN
ALY
SES
OF
OL-
KK
6 A
ND
OL-
KK
7
Lab
orat
ory
num
ber
Sam
ple
code
Sam
plin
g de
pth
m
Spec
ific
area
m
²/g
Part
icle
de
nsity
M
g/cm
3
Hum
us
cont
ent
%
H2O
-co
nten
t %
Wat
er
leac
hed
pH
CaC
l 2-le
ache
d pH
Wat
er le
ache
d E
xcha
ngab
le
acid
ity
cmol
+/kg
E
l.con
d.
mS/
m
25°C
Br
mg/
kg
Cl
mg/
kg
F mg/
kg
SO4
mg/
kg
NO
3 m
g/kg
L028
0998
7 O
L-K
K6/
1 0.
5 4.
20
2.85
0.
96
18.6
6.
1 6.
3 2.
3 <1
3.
8 5.
6 11
<2
0.
050
L028
0998
8 O
L-K
K6/
2 2
4.80
2.
87
1.01
12
.1
8.6
8.0
4.5
<1
2.8
1.9
37
<2
0.02
0 L0
2809
989
OL-
KK
6/3
4 3.
24
2.89
0.
84
10.7
8.
9 8.
0 4.
9 <1
2.
2 1.
5 61
<2
0.
013
L028
0999
0 O
L-K
K7/
1 0.
5 6.
37
2.87
0.
96
7.64
7.
1 6.
9 1.
6 <1
2.
0 5.
2 12
2.
6 0.
003
L028
0999
1 O
L-K
K7/
2 1
5.45
2.
85
1.00
9.
64
6.6
6.2
1.5
<1
2.8
3.5
14
4.6
0.02
0 L0
2809
992
OL-
KK
7/3
2 5.
40
2.85
0.
85
12.4
8.
1 7.
5 3.
3 <1
2.
0 4.
0 15
<2
0.
010
Lab
orat
ory
num
ber
Sam
ple
code
Sam
plin
g de
pth
m
Exc
hang
eabl
e ca
tions
and
cat
ion
exch
ange
cap
acity
A
l+++
cm
ol+/
kg
Ca+
+ cm
ol+/
kg
K+
cmol
+/kg
M
g++
cmol
+/kg
N
a+
cmol
+/kg
C
EC
cm
ol+/
kg
Al
mg/
kg
Ca
mg/
kg
K
mg/
kg
Mg
mg/
kg
Na
mg/
kg
L028
0998
7 O
L-K
K6/
1 0.
5 0.
01
1.33
0 0.
316
0.10
9 0.
152
1.96
1
266
124
13.0
34
.9
L028
0998
8 O
L-K
K6/
2 2
<0.0
1 1.
100
0.63
2 0.
142
0.18
7 2.
08
<1
219
247
17.1
42
.9
L028
0998
9 O
L-K
K6/
3 4
<0.0
1 1.
210
0.58
1 0.
099
0.14
2 2.
05
<1
243
227
11.9
32
.6
L028
0999
0 O
L-K
K7/
1 0.
5 <0
.01
1.52
0 0.
395
0.08
0 1.
220
3.22
<1
30
4 15
4 9.
6 28
0
L0
2809
991
OL-
KK
7/2
1 <0
.01
1.40
0 0.
411
0.08
2 1.
200
3.11
<1
28
0 �
61
9.8
275
L028
0999
2 O
L-K
K7/
3 2
<0.0
1 1.
600
0.43
9 0.
004
1.19
0 3.
24
<1
320
172
<1
274
Lab
orat
ory
num
ber
Sam
ple
code
Sam
plin
g de
pth
m
Met
als f
rom
synt
hetic
rai
nwat
er le
ach
Ca
mg/
kg
Mg
mg/
kg
Na
mg/
kg
K
mg/
kg
Fe
mg/
kg
Al
mg/
kg
Sr
mg/
kg
U
mg/
kg
Cs
mg/
kg
L028
0998
7 O
L-K
K6/
1 0.
5 19
.0
4.58
9.
68
8.36
20
.2
10.1
0.
04
0.03
7 <0
.05
L028
0998
8 O
L-K
K6/
2 2
42.3
10
.3
14
27.0
3.
2 4.
72
0.13
0.
005
<0.0
5
L0
2809
989
OL-
KK
6/3
4 56
.4
12.5
9.
44
28.2
8.
16
10.8
0.
16
0.01
5 <0
.05
L028
0999
0 O
L-K
K7/
1 0.
5 18
.0
4.2
5.21
11
.3
14.4
10
.2
0.03
0.
002
<0.0
5
L0
2809
991
OL-
KK
7/2
1 19
.0
3.29
4.
71
10.8
5.
67
3.36
0.
03
0.01
7 <0
.05
L028
0999
2 O
L-K
K7/
3 2
59.0
6.
55
7.19
16
.6
20.3
14
.4
0.06
0.
003
<0.0
5
Lab
orat
ory
num
ber
Sam
ple
code
Sam
plin
g de
pth
m
Met
als f
rom
nitr
ic a
cid
leac
h
Ca
mg/
kg
Mg
mg/
kg
Na
mg/
kg
K
mg/
kg
Fe
%
Al
mg/
kg
Sr
mg/
kg
U
mg/
kg
Cs
mg/
kg
L028
0998
7 O
L-K
K6/
1 0.
5 25
90
3450
12
7 21
60
1.31
71
50
12.0
2.
94
2.01
L0
2809
988
OL-
KK
6/2
2 34
60
3480
11
2 24
80
1.24
65
30
8.06
1.
76
2.35
L0
2809
989
OL-
KK
6/3
4 39
20
3100
13
4 21
60
1.16
62
10
12.2
1.
64
2.01
L0
2809
990
OL-
KK
7/1
0.5
2170
34
40
104
2590
1.
27
7120
8.
76
1.81
2.
33
L028
0999
1 O
L-K
K7/
2 1
2130
32
70
94.2
25
20
1.23
67
40
7.49
1.
61
2.31
L0
2809
992
OL-
KK
7/3
2 25
60
3330
11
0 24
60
1.22
66
70
8.28
1.
51
2.37
(Lin
tinen
et a
l. 20
03)
100

APP
END
IX 3
.2: R
ESU
LTS
OF
THE
GEO
CH
EMIC
AL
AN
ALY
SES
OF
OL-
KK
17…
OL-
KK
19
L
abor
ator
y nu
mbe
r Sa
mpl
e co
de
Sam
plin
g de
pth
cm
pH
Car
bon
mas
s-%
dw
Nitr
ogen
m
ass-
%dw
C
/N
Moi
stur
e m
ass-
%
Dry
mat
ter
m
ass-
%dw
L
OI
mas
s-%
dw
Sedw
m
g/kg
I d
w
mg/
kg
L081
6167
0 O
L-K
K17
Hum
us
0-30
5.
40
26.3
0.
98
26.8
49
.2
50.8
45
.7
0.74
2 20
.1
L081
6167
2 O
L-K
K17
30
-46
5.90
0.
41
0.05
8.
20
3.80
96
.2
1.16
0.
100
0.49
1
L0
8161
671
OL-
KK
17
46-8
2 6.
56
0.12
<0
.03
- 5.
60
94.4
0.
68
0.06
8 0.
475
L081
6167
3 O
L-K
K18
Hum
us
0-20
3.
47
31.9
1.
17
27.3
50
.2
49.8
49
.7
0.40
1 5.
91
L081
6167
4 O
L-K
K18
20
-200
6.
03
0.07
<0
.03
- 8.
10
91.9
0.
54
0.05
0 0.
11
L081
6167
5 O
L-K
K18
20
0-22
0 7.
22
0.18
<0
.03
- 9.
50
90.5
0.
45
0.07
4 0.
19
L081
6167
6 O
L-K
K19
Hum
us
0-20
3.
33
9.89
0.
29
34.1
30
.9
69.1
15
.8
0.15
8 2.
86
L081
6167
7 O
L-K
K19
20
-200
7.
42
0.11
<0
.03
- 7.
80
92.2
0.
42
0.04
7 0.
17
L081
6167
8 O
L-K
K19
20
0-23
5 7.
67
0.14
<0
.03
- 8.
40
91.6
0.
43
0.10
1 0.
08
A
mm
oniu
m a
ceta
te d
iges
tion
(pH
4.5
)
Lab
orat
ory
num
ber
Sam
ple
code
Sa
mpl
ing
dept
h cm
Al
mg/
kg
As
mg/
kg
B
mg/
kg
Ba
mg/
kg
Ca
mg/
kg
Cd
mg/
kg
Co
mg/
kg
Cr
mg/
kg
Cu
mg/
kg
Fe
mg/
kg
K
mg/
kg
Li
mg/
kg
Mg
mg/
kg
L081
6167
0 O
L-K
K17
Hum
us
0-30
10
8 0.
09
0.82
5.
38
1380
0 0.
73
1.07
0.
16
0.51
19
.7
253
0.16
86
6 L0
8161
672
OL-
KK
17
30-4
6 32
.2
<0.0
3 <0
.5
1.77
68
2 <0
.1
<0.1
<0
.1
0.37
9.
36
17.2
0.
10
29.7
L0
8161
671
OL-
KK
17
46-8
2 20
.3
0.09
<0
.5
3.79
51
8 <0
.1
<0.1
<0
.1
1.16
52
.7
28.5
0.
12
31.6
L0
8161
673
OL-
KK
18 H
umus
0-
20
55.5
0.
09
<0.5
23
.8
2880
0.
50
0.36
0.
19
0.37
18
.7
583
0.06
47
2 L0
8161
674
OL-
KK
18
20-2
00
19.4
0.
06
<0.5
4.
07
403
<0.1
<0
.1
<0.1
0.
53
40.2
26
.5
0.08
23
.6
L081
6167
5 O
L-K
K18
20
0-22
0 31
.9
0.13
<0
.5
4.34
20
60
<0.1
0.
44
<0.1
2.
02
123
48.0
0.
09
90.9
L0
8161
676
OL-
KK
19 H
umus
0-
20
250
0.12
<0
.5
7.59
61
6 0.
16
0.39
0.
66
0.53
34
5 81
.2
0.06
14
6 L0
8161
677
OL-
KK
19
20-2
00
20.0
0.
05
<0.5
3.
46
1510
<0
.1
0.11
<0
.1
0.71
44
.7
27.6
0.
06
26.2
L0
8161
678
OL-
KK
19
200-
235
17.3
0.
03
<0.5
3.
29
1610
<0
.1
0.21
<0
.1
1.69
52
.8
36.7
0.
06
53.4
Am
mon
ium
ace
tate
dig
estio
n (p
H 4
.5)
Lab
orat
ory
num
ber
Sam
ple
code
Sa
mpl
ing
dept
h cm
Mn
mg/
kg
Mo
mg/
kg
Na
mg/
kg
Ni
mg/
kg
P mg/
kg
Pb
mg/
kg
S mg/
kg
Sb
mg/
kg
Sr
mg/
kg
Ti
mg/
kg
V
mg/
kg
Zn
mg/
kg
L081
6167
0 O
L-K
K17
Hum
us
0-30
61
.6
<0.0
3 46
.6
0.97
16
.5
3.20
56
.0
0.01
20
.5
<0.1
0.
10
12.2
0
L081
6167
2 O
L-K
K17
30
-46
1.70
<0
.03
<3
<0.5
9.
26
<0.1
11
.1
<0.0
1 1.
02
0.18
<0
.1
0.13
L081
6167
1 O
L-K
K17
46
-82
2.56
<0
.03
6.01
<0
.5
19.8
0.
25
7.87
<0
.01
0.95
0.
21
<0.1
0.
21
L0
8161
673
OL-
KK
18 H
umus
0-
20
153
<0.0
3 19
.1
1.01
73
.0
17.5
68
.2
0.01
8.
57
1.00
0.
19
43.0
L081
6167
4 O
L-K
K18
20
-200
2.
99
<0.0
3 3.
44
<0.5
28
.5
0.32
3.
31
<0.0
1 0.
71
0.24
<0
.1
0.38
L081
6167
5 O
L-K
K18
20
0-22
0 43
.3
0.03
4.
33
0.59
12
.3
0.78
36
.9
<0.0
1 1.
59
0.23
0.
38
0.76
L081
6167
6 O
L-K
K19
Hum
us
0-20
7.
51
<0.0
3 10
.8
1.17
25
.7
5.68
17
.5
<0.0
1 3.
10
2.18
0.
23
8.00
L081
6167
7 O
L-K
K19
20
-200
14
.5
<0.0
3 <3
<0
.5
11.2
0.
48
<2
<0.0
1 1.
09
0.31
<0
.1
0.79
L081
6167
8 O
L-K
K19
20
0-23
5 23
.8
0.03
<3
<0
.5
10.7
0.
36
31.9
<0
.01
1.37
0.
25
0.10
0.
38
(L
ahde
nper
ä 20
09)
101

APPENDIX 3.3: 102 WELLCAD ILLUSTRATIONS OF HYDROGEOLOGICAL DATA AND SOME BACKGROUND DATA ON OL-PP66 − OL-PP69, OL-KR2, OL-KR4, OL-KR10, OL-KR12, OL-KR14, OL-KR15 − OL-KR18 (+B), OL-KR30

Depth
1:250
Lth. Fr. freq.
0 20
RiOriented fract.
0 90
OL-PP66 GEOLOGY
IntoOut
Flow direction ml/h
1E+5 1 1E+5
Cond. fract.
0 90
FR EC
0 1S/m
Fracture T
-10 -3m2/s
HYDROLOGY
HZ2006Geol v.1
HZ2008
MODELS
Core loss
0
5
10
15
20
25
APPENDIX 3.3103

Depth
1:250
RiLth. Fr. freq.
0 20
Oriented fract.
0 90
OL-PP67 GEOLOGY
IntoOut
Flow direction ml/h
1E+5 1 1E+5
FR EC
0 1S/m
Cond. fract.
0 90
Fracture T
-10 -3m2/s
HYDROLOGY
HZ2006Geol v.1
HZ2008
MODELS
0
5
10
15
20
25
APPENDIX 3.3104

Depth
1:250
RiFr. freq.
0 20
Lth. Fractures image
0 90
OL-PP68 GEOLOGY
IntoOut
Flow direction ml/h
1E+5 1 1E+5
FR EC
0 1S/m
Fracture T
-10 -3m2/s
Cond. fract.
0 90
HYDROLOGY
HZ2006Geol v.1
HZ2008
MODELS
0
5
10
15
20
25
APPENDIX 3.3105

Depth
1:250
Rioriented fract.
0 90
Lth. Fr freq.
0 20
OL-PP69 GEOLOGY
IntoOut
Flow direction ml/h
1E+5 1 1E+5
FR EC
0 1S/m
Fracture T
-10 -3m2/s
Cond. fract.
0 90
HYDROLOGY
HZ2006Geol v.1
HZ2008
MODELS
0
5
10
15
20
25
APPENDIX 3.3106
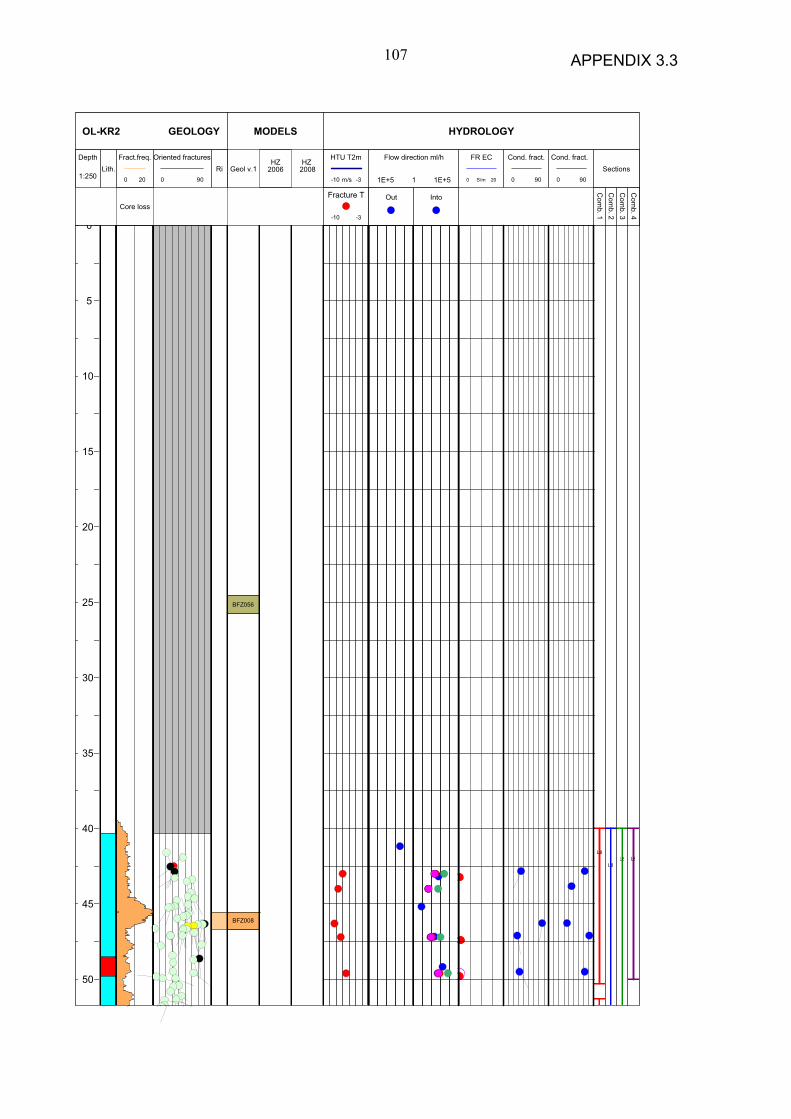
Depth
1:250Lith. Ri
Fract.freq.
0 20
Core loss
Oriented fractures
0 90
OL-KR2 GEOLOGY
Com
b. 1C
omb. 2
Com
b. 3C
omb. 4
Sections
Out Into
Flow direction ml/h
1E+5 1 1E+5
Cond. fract.
0 90
HTU T2m
-10 -3 m/s
FR EC
0 20S/m
Fracture T
-10 -3
Cond. fract.
0 90
HYDROLOGY
HZ2006Geol v.1
HZ2008
MODELS
0
5
10
15
20
25
30
35
40
45
50
L8L8
L8
BFZ056
BFZ008
L8
APPENDIX 3.3107

55
60
65
70
75
80
85
90
95
100
L7
L6
HZ002
L7
L6
HZ002
L7
APPENDIX 3.3108
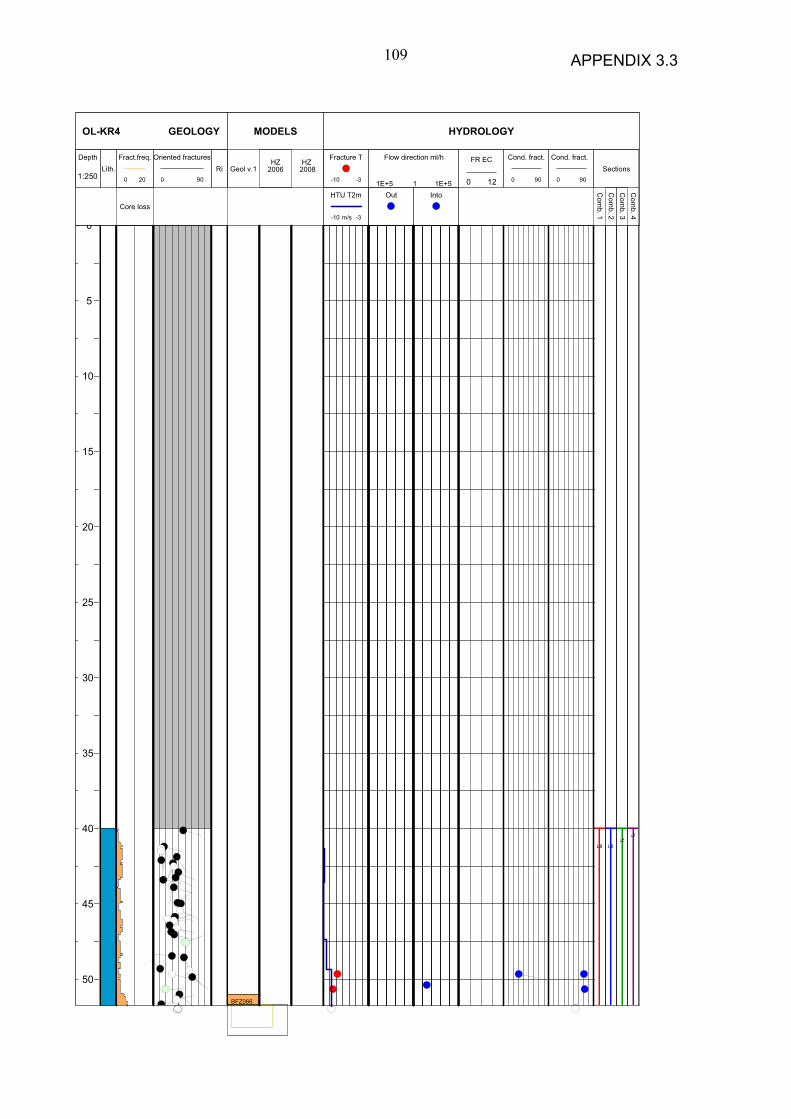
Out Into
Flow direction ml/h
1E+5 1 1E+5C
omb. 1
Com
b. 2C
omb. 3
Com
b. 4Sections
Cond. fract.
0 90
FR EC
0 12
Fracture T
-10 -3
HTU T2m
-10 -3 m/s
Cond. fract.
0 90
HYDROLOGY
Depth
1:250RiLith.
Oriented fractures
0 90
Fract.freq.
0 20
Core loss
OL-KR4 GEOLOGY
HZ2006
HZ2008Geol v.1
MODELS
0
5
10
15
20
25
30
35
40
45
50
L8 L8L8
L7
BFZ066
APPENDIX 3.3109

55
60
65
70
75
80
85
90
95
100
L7
L7
HZ19A
HZ19A
L6
BFZ097
BFZ018
APPENDIX 3.3110
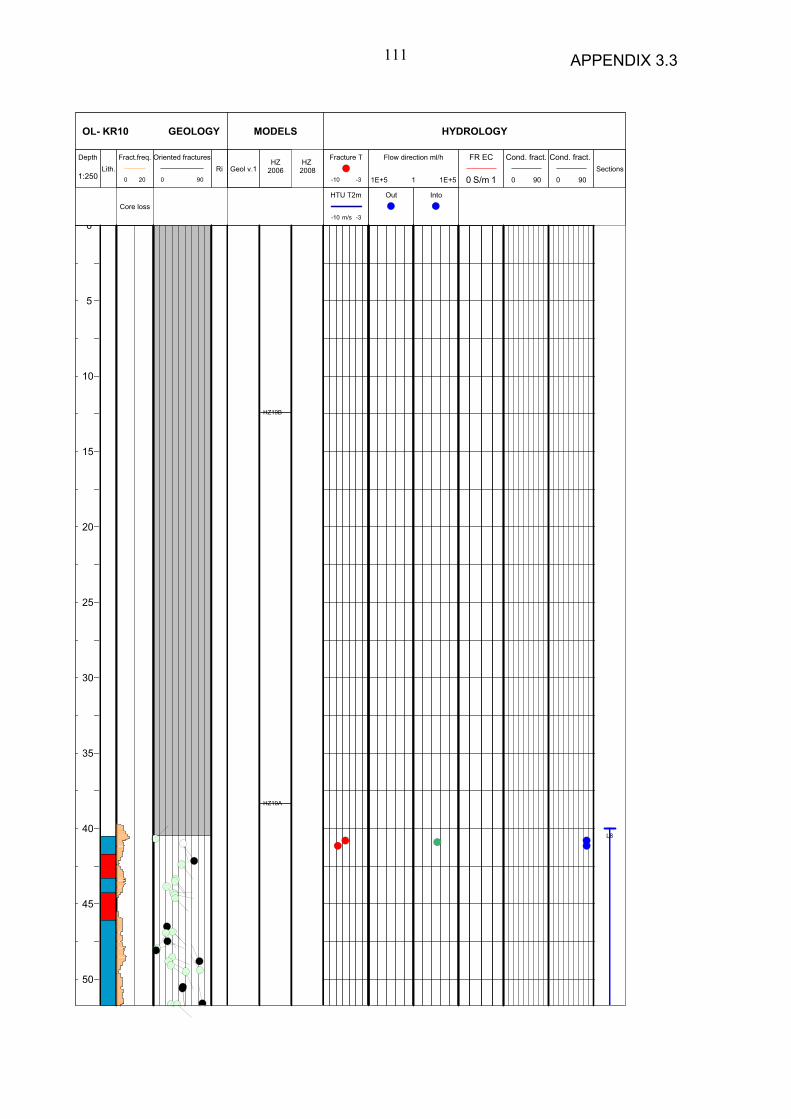
Out Into
Flow direction ml/h
1E+5 1 1E+5Sections
Fracture T
-10 -3
HTU T2m
-10 -3 m/s
FR EC
0 1S/m
Cond. fract.
0 90
Cond. fract.
0 90
HYDROLOGY
Depth
1:250RiLith.
Oriented fractures
0 90
Fract.freq.
0 20
Core loss
OL- KR10 GEOLOGY
HZ2006
HZ2008Geol v.1
MODELS
0
5
10
15
20
25
30
35
40
45
50
HZ19B
HZ19A
L8
APPENDIX 3.3111

55
60
65
70
75
80
85
90
95
100
HZ19C
HZ002
L7
BFZ056
APPENDIX 3.3112
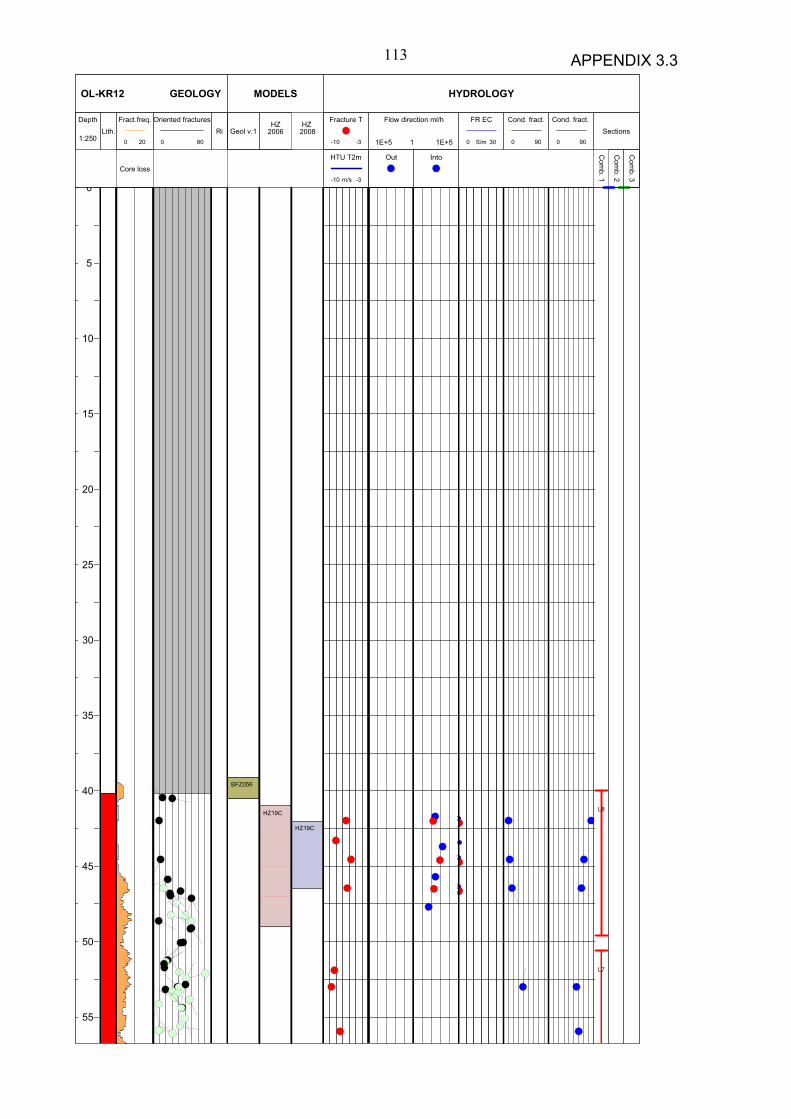
Depth
1:250Lith. Ri
Fract.freq.
0 20
Core loss
Oriented fractures
0 90
OL-KR12 GEOLOGY
IntoOut
Flow direction ml/h
1E+5 1 1E+5
Com
b. 1
Com
b. 2
Com
b. 3
SectionsCond. fract.
0 90
FR EC
0 30S/m
Fracture T
-10 -3
HTU T2m
-10 -3 m/s
Cond. fract.
0 90
HYDROLOGY
HZ2006
HZ2008Geol v.1
MODELS
0
5
10
15
20
25
30
35
40
45
50
55
L8
L7
HZ19C
HZ19C
BFZ056
APPENDIX 3.3113

60
65
70
75
80
85
90
95
100
L6
BFZ067
APPENDIX 3.3114

IntoOut
Flow direction ml/h
1E+5 1 1E+5Sections
Fracture T
-10 -3
HTU T2m
-10 -3 m/s
FR EC
0 1S/m
Cond. fract.
0 90
Cond. fract.
0 90
HYDROLOGY
Depth
1:250RiLith.
Fract.freq.
0 20
Core loss
Oriented fractures
0 90
OL-KR14 GEOLOGY
HZ2006
HZ2008Geol v.1
MODELS
0
5
10
15
20
25
30
35
40
45
50
HZ19A
HZ19C HZ19A
BFZ018
BFZ056
APPENDIX 3.3115

55
60
65
70
75
80
85
90
95
100
HZ002 HZ19C
HZ002
APPENDIX 3.3116

IntoOut
Flow direction ml/h
1E+5 1 1E+5Sections
Fracture T
-10 -3
HTU T2m
-10 -3 m/s
FR EC
0 1S/m
Cond. fract.
0 90
Cond. fract.
0 90
HYDROLOGY
Depth
1:250Lith. Ri
Fract.freq.
0 20
Core loss
Oriented fractures
0 90
OL-KR15 (+B) GEOLOGY
HZ2006Geol v.1
HZ2008
MODELS
0
5
10
15
20
25
30
35
40
45
50
L6
L5
HZ19C
L2
L1
HZ19A
APPENDIX 3.3117

55
60
65
70
75
80
85
90
95
100
L5
L4
HZ002
HZ19C
HZ002
APPENDIX 3.3118
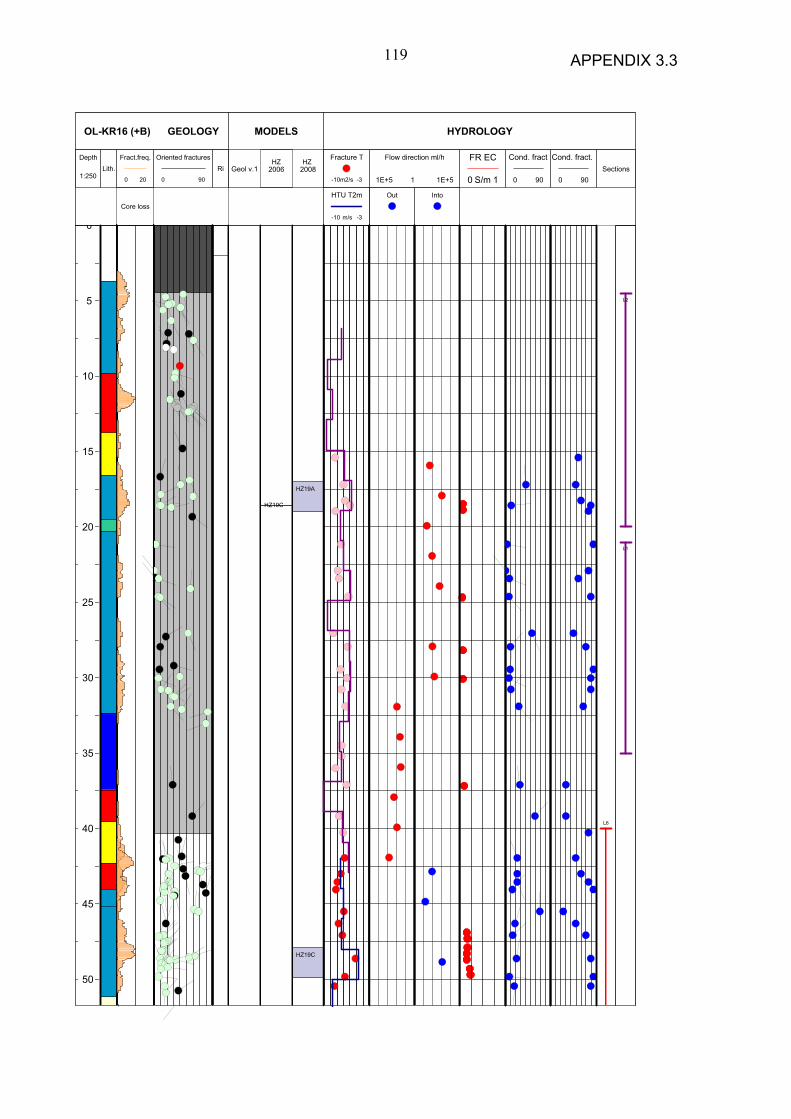
Depth
1:250Lith. Ri
Fract.freq.
0 20
Core loss
Oriented fractures
0 90
OL-KR16 (+B) GEOLOGY
IntoOut
Flow direction ml/h
1E+5 1 1E+5Sections
Fracture T
-10 -3m2/s
HTU T2m
-10 -3 m/s
FR EC
0 1S/m
Cond. fract
0 90
Cond. fract.
0 90
HYDROLOGY
HZ2006Geol v.1
HZ2008
MODELS
0
5
10
15
20
25
30
35
40
45
50
L6
HZ19C
L2
L1
HZ19A
HZ19C
APPENDIX 3.3119

55
60
65
70
75
80
85
90
95
100
L5
L4
L3
HZ002
HZ002
APPENDIX 3.3120
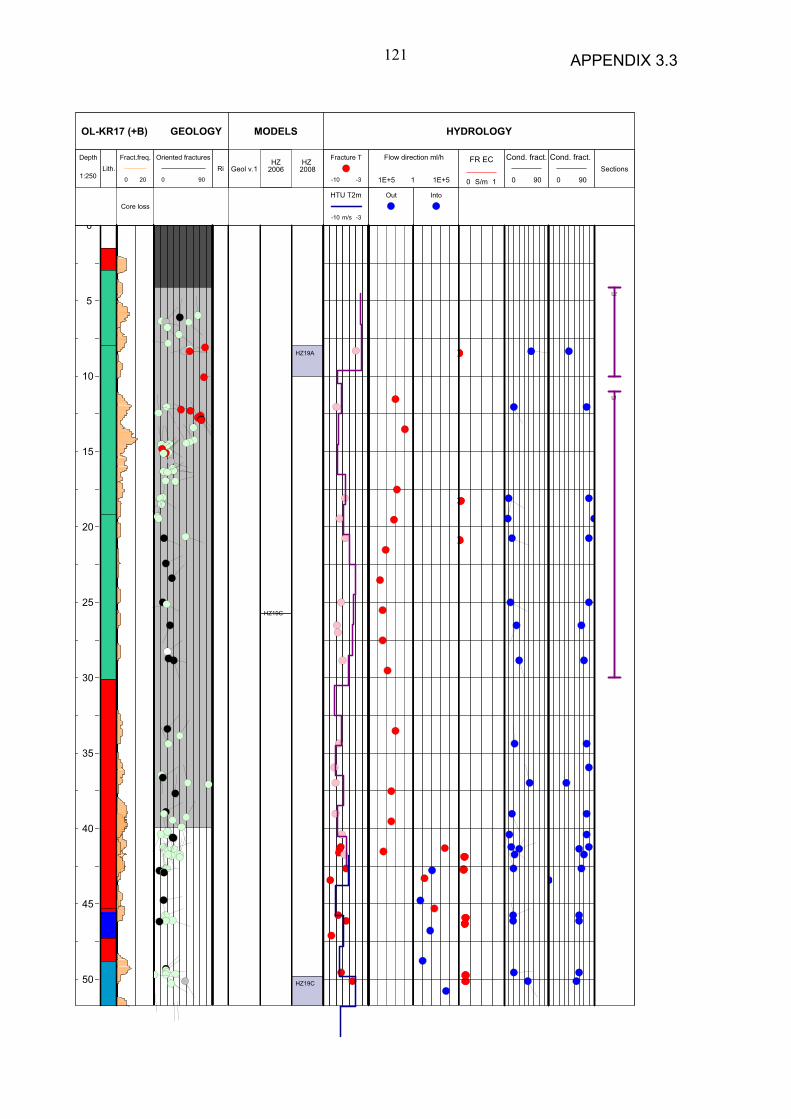
Depth
1:250RiLith.
Fract.freq.
0 20
Core loss
Oriented fractures
0 90
OL-KR17 (+B) GEOLOGY
IntoOut
Flow direction ml/h
1E+5 1 1E+5Sections
Fracture T
-10 -3
HTU T2m
-10 -3 m/s
FR EC
0 1S/m
Cond. fract.
0 90
Cond. fract.
0 90
HYDROLOGY
HZ2006Geol v.1
HZ2008
MODELS
0
5
10
15
20
25
30
35
40
45
50
HZ19C
L2
L1
HZ19A
HZ19C
APPENDIX 3.3121

55
60
65
70
75
80
85
90
95
100
HZ002
HZ002
APPENDIX 3.3122

Depth
1:250Lith. Ri
Fract.freq.
0 20
Core loss
Oriented fractures
0 90
OL-KR18 (+B) GEOLOGY
IntoOut
Flow direction ml/h
1E+5 1 1E+5Sections
HTU T2m
-10 -3 m/s
Fracture T
-10 -3
FR EC
0 1S/m
Cond. fract.
0 90
Cond. fract.
0 90
HYDROLOGY
Geol v.0HZ
2006HZ
2008
MODELS
0
5
10
15
20
25
30
35
40
45
50
L5
HZ19C
L3
L2
L1
HZ19A
HZ19C
APPENDIX 3.3123
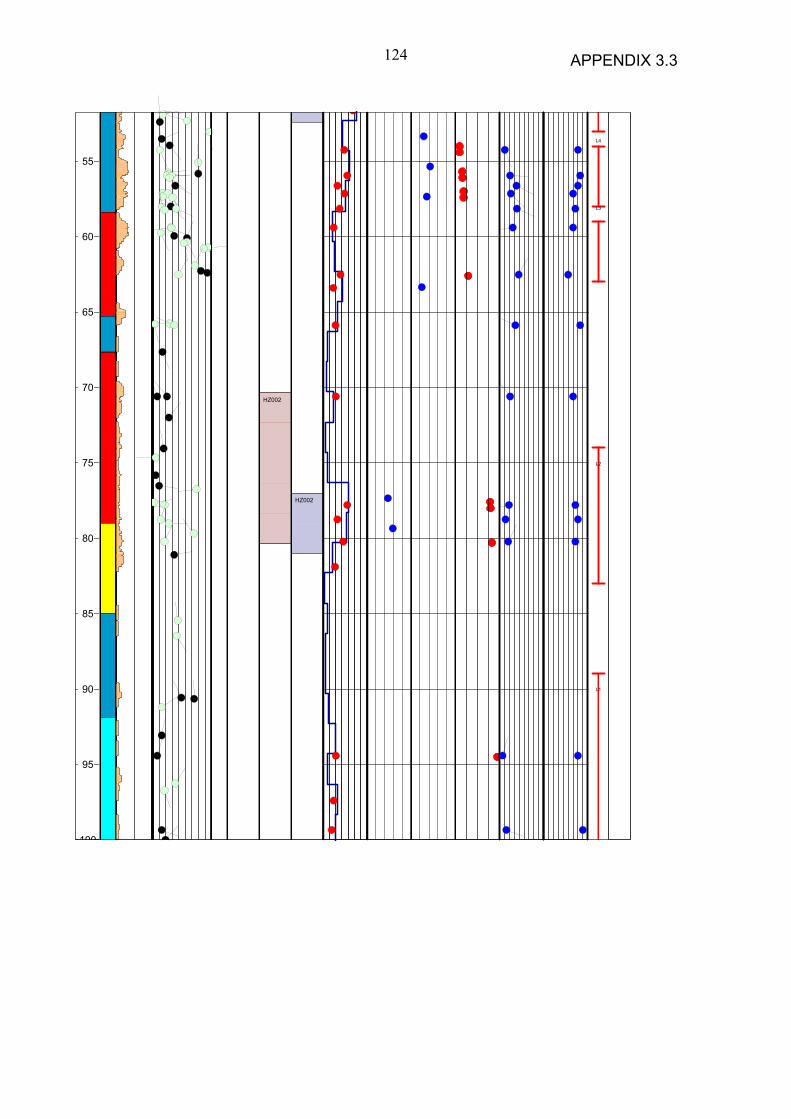
55
60
65
70
75
80
85
90
95
100
L4
L3
L2
L1
HZ002
HZ002
APPENDIX 3.3124

Depth
1:250Lith. Ri
Fract.freq.
0 20
Oriented fractures
0 90
OL-KR30 GEOLOGY
IntoOut
Flow direction ml/h
1E+5 1 1E+5Sections
Cond. fract.
0 90
Fracture T
-10 -3m2/s
FR EC
0 1S/m
Cond. fract.
0 90
HYDROLOGY
HZ2006Geol v.1
HZ2008
MODELS
0
5
10
15
20
25
30
35
40
45
50
HZ19B
HZ19A
HZ19A
APPENDIX 3.3125

55
60
65
70
75
80
85
90
95
HZ19CBFZ056
HZ19C
APPENDIX 3.3126

HO
LE_I
DM
_FR
OM
DIR
DIP
FRA
CTU
RE
TYP
EC
ALC
ITE
PY
RIT
EP
FLde
pth
T m
inT
max
Flow
HY
D_Z
ON
EG
EO
_ZO
NE
Pum
ping
or
pack
ed-o
ff se
ctio
nFr
actu
re E
C S
/mO
L-K
R2
42.8
220
3.7
34.4
fiS
K43
5.0E
-08
5.0E
-08
inK
R2-
L80.
15, 0
.41
OL-
KR
243
.82
fiS
K44
4.3E
-09
4.3E
-09
inK
R2-
L8O
L-K
R2
46.2
818
7.1
76.4
fi46
.34.
1E-0
94.
1E-0
9B
FZ00
8K
R2-
L8O
L-K
R2
47.1
116
9.2
26.9
fiC
C47
.22.
8E-0
82.
8E-0
8in
KR
2-L8
0.79
OL-
KR
249
.51
151.
831
.3fi
49.6
2.6E
-07
2.6E
-07
inK
R2-
L80.
23, 0
.28,
0.2
1, 0
.24,
0.2
0O
L-K
R2
56.5
712
7.3
58fi
56.6
2.5E
-09
2.5E
-09
OL-
KR
273
.77
199.
750
.6fi
CC
SK
743.
6E-0
93.
6E-0
9in
OL-
KR
279
.92
220.
334
.3fi
CC
SK
801.
2E-0
81.
2E-0
8in
KR
2-L7
OL-
KR
282
.83
207.
921
.7fi
CC
82.9
2.1E
-09
2.1E
-09
KR
2-L7
OL-
KR
286
.623
513
fiS
K86
.71.
8E-0
71.
8E-0
7in
KR
2-L7
0.09
, 0.1
6, 0
.09,
0.0
8O
L-K
R2
97.9
614
7.4
43.8
fiC
CS
K98
.13.
2E-0
83.
2E-0
8in
0.50
OL-
KR
449
.64
101
30C
CS
K49
.71.
65E
-09
1.41
E-0
8K
R4-
L8O
L-K
R4
50.6
5fi
CC
SK
50.8
2.14
E-0
92.
98E
-09
inK
R4-
L8O
L-K
R4
51.9
2ti
CC
51.9
1.02
E-0
91.
82E
-09
BFZ
066
KR
4-L8
OL-
KR
461
.23
107
15fi
SK
61.4
1.53
E-0
81.
8E-0
6in
/out
KR
4-L8
0.19
, 0.2
9O
L-K
R4
66.7
768
64ti
CC
SK
66.9
1.10
E-0
92.
29E
-09
KR
4-L8
OL-
KR
472
.82
fiC
CS
K72
.84.
97E
-09
4.97
E-0
9K
R4-
L8O
L-K
R4
82.2
295
36fi
82.3
4.2E
-06
1.7E
-05
inH
Z19A
BFZ
018
KR
4-L7
0.15
, 0.2
0, 0
.13,
0.2
7, 0
.21
OL-
KR
483
.211
031
fi83
.23.
96E
-09
4.90
E-0
9H
Z19A
KR
4-L7
OL-
KR
1040
.8fi
SK
2.0E
-07
2.5E
-07
inK
R10
-L8
-O
L-K
R10
41.1
5fi
CC
1.4E
-08
1.6E
-08
KR
10-L
8-
OL-
KR
1061
.56
3050
fiC
C1.
2E-0
81.
4E-0
8K
R10
-L7
-O
L-K
R10
63.8
165
14ti
1.1E
-08
1.1E
-08
inK
R10
-L7
-O
L-K
R12
41.9
824
6.2
9.44
tiC
C42
2.75
E-0
73.
2E-0
7in
KR
12-L
80.
12, 0
.12
OL-
KR
1243
.33.
80E
-09
8.58
E-0
9H
Z19C
KR
12-L
80.
45O
L-K
R12
44.5
620
5.4
11.9
tiC
C44
.61.
32E
-06
1.8E
-06
inH
Z19C
KR
12-L
80.
11, 0
.11
OL-
KR
1246
.44
156.
116
.5fi
CC
46.5
3.63
E-0
74.
7E-0
7in
HZ1
9CK
R12
-L8
0.16
OL-
KR
1251
.93.
18E
-09
5.18
E-0
9K
R12
-L7
OL-
KR
1252
.99
7.72
38ti
CC
SK
52.9
1.64
E-0
91.
71E
-09
KR
12-L
7O
L-K
R12
55.9
4ti
562.
92E
-08
3.55
E-0
8K
R12
-L7
OL-
KR
1257
.223
8.1
21.3
tiC
C57
.28.
51E
-09
1.71
E-0
8K
R12
-L7
1.58
OL-
KR
1258
.85
342.
433
fiC
C58
.89.
77E
-09
3.82
E-0
8K
R12
-L7
1.73
OL-
KR
1259
.525
1.2
79fi
59.6
5.62
E-0
81.
6E-0
7K
R12
-L7
0.37
, 0.3
1O
L-K
R12
60.4
714
716
.1fi
CC
60.4
1.25
E-0
91.
59E
-09
KR
12-L
7O
L-K
R12
61.2
513
4.9
21.9
fiC
CS
K61
.28.
32E
-09
1.07
E-0
8K
R12
-L7
OL-
KR
1264
.14
3.45
26.1
fiC
CS
K64
.26.
80E
-09
7.69
E-0
9K
R12
-L7
OL-
KR
1264
.81
fiC
C64
.81.
13E
-09
3.47
E-0
9K
R12
-L7
OL-
KR
1265
.72
130.
341
.7fi
CC
SK
65.8
2.19
E-0
73.
8E-0
7ou
tK
R12
-L7
0.57
, 0.3
6O
L-K
R12
66.0
730
6.7
49.7
tiC
CS
K66
.13.
82E
-09
4.28
E-0
9K
R12
-L7
OL-
KR
1268
.55
fiC
CS
K68
.61.
23E
-08
3.14
E-0
8K
R12
-L7
2.85
OL-
KR
1269
.33
224.
718
.7fi
CC
69.3
9.59
E-1
05.
13E
-09
KR
12-L
72.
9O
L-K
R12
71.3
610
0.1
42.3
fiC
C71
.41.
66E
-09
2E-0
9O
L-K
R12
75.2
114
4.4
28.8
fiC
CS
K75
.23.
69E
-09
5.30
E-0
93.
06O
L-K
R12
75.5
619
0.7
48.6
fiC
CS
K75
.66.
15E
-09
7.44
E-0
93.
08
APP
END
IX 3
.4:
SUM
MA
RY-
TAB
LES
OF
HYD
RO
GEO
LOG
ICA
L D
ATA
AN
D S
OM
E B
AC
KG
RO
UN
D
DA
TA O
N D
RIL
LHO
LES
OL-
KR
14 –
KR
18 (+
B-H
OLE
S) A
ND
OL-
KR
30
127

HO
LE_I
DM
_FR
OM
DIR
DIP
FRA
CTU
RE
TYP
EC
ALC
ITE
PY
RIT
EP
FLde
pth
T m
inT
max
Flow
HY
D_Z
ON
EG
EO
_ZO
NE
Pum
ping
or
pack
ed-o
ff se
ctio
nFr
actu
re E
C S
/mO
L-K
R12
77.7
144.
662
.9fi
CC
SK
77.4
8.43
E-1
01.
16E
-09
OL-
KR
1279
.29
344.
277
.2fi
CC
79.3
1.86
E-0
92.
88E
-09
OL-
KR
1280
.71
251.
820
fiC
C80
.76.
32E
-09
1E-0
8O
L-K
R12
83.3
132
.95
51.8
fi83
.38.
17E
-09
9.44
E-0
9O
L-K
R12
83.7
926
4.7
75.8
fi83
.85.
37E
-09
8.54
E-0
9O
L-K
R12
86.1
112.
439
.4fi
SK
86.1
4.68
E-0
95.
05E
-09
KR
12-L
6O
L-K
R12
86.9
929
2.4
62ti
CC
SK
871.
35E
-09
2.69
E-0
9K
R12
-L6
OL-
KR
1287
.81
78.8
584
.3ti
CC
SK
87.8
1.29
E-0
91.
89E
-09
KR
12-L
6O
L-K
R12
88.9
6.75
E-1
01.
30E
-09
KR
12-L
6O
L-K
R12
91.0
313
4.9
52.5
fiC
CS
K91
.27.
76E
-09
1.45
E-0
8K
R12
-L6
OL-
KR
1292
.16.
78E
-09
2.04
E-0
8K
R12
-L6
OL-
KR
1295
.18
358.
780
.2fi
CC
SK
95.2
2E-0
72.
4E-0
7ou
tK
R12
-L6
3.34
, 0.5
7O
L-K
R12
95.5
616
2.6
26fi
CC
95.6
1.93
E-0
82.
25E
-08
out
KR
12-L
6O
L-K
R14
10.9
512
614
fiC
CS
K10
.91.
2E-0
82.
4E-0
8O
L-K
R14
12.1
416
67
fi12
.25.
2E-0
89.
8E-0
8in
BFZ
018
OL-
KR
1412
.92
113
32fi
CC
132.
4E-0
78.
8E-0
7B
FZ01
80.
08, 0
,10,
0.1
0, 0
.09
OL-
KR
1413
.417
119
13.4
1.4E
-06
1.1E
-05
inB
FZ01
8P
0.09
, 0.0
9O
L-K
R14
13.5
835
736
fiS
K13
.51.
0E-0
61.
0E-0
6B
FZ01
8P
OL-
KR
1414
.12
8236
fiC
C14
.29.
3E-0
99.
3E-0
9in
BFZ
018
PO
L-K
R14
14.8
78
34ti
CC
SK
151.
9E-0
75.
0E-0
7in
BFZ
018
PO
L-K
R14
15.3
712
213
fiS
K15
.42.
2E-0
78.
5E-0
7B
FZ01
8P
OL-
KR
1415
.81
211
15fi
CC
SK
15.9
6.8E
-08
2.4E
-07
inB
FZ01
8P
OL-
KR
1416
.71
136
49fi
CC
SK
16.8
3.0E
-08
6.6E
-08
PO
L-K
R14
17.0
413
159
fiS
K17
.11.
7E-0
84.
1E-0
8P
OL-
KR
1417
.27
358
50fi
CC
17.3
2.0E
-09
2.0E
-09
PO
L-K
R14
18.1
172
13fi
SK
18.2
1.9E
-08
6.9E
-08
inP
OL-
KR
1418
.52
202
3718
.69.
3E-0
93.
2E-0
8O
L-K
R14
19.3
913
916
fiC
C19
.52.
0E-0
92.
0E-0
9O
L-K
R14
19.8
524
819
fi19
.97.
1E-0
92.
2E-0
8in
OL-
KR
1421
.51
202
2021
.61.
1E-0
83.
4E-0
8O
L-K
R14
22.4
810
713
fi22
.61.
1E-0
73.
7E-0
7in
OL-
KR
1423
.724
113
fiC
CS
K23
.71.
0E-0
81.
0E-0
8O
L-K
R14
23.8
514
519
fiC
CS
K23
.91.
3E-0
74.
6E-0
7in
OL-
KR
1424
.33
135
25fi
SK
24.4
2.5E
-08
7.3E
-08
OL-
KR
1425
.52
236
54fi
CC
SK
25.6
4.7E
-08
1.2E
-07
inO
L-K
R14
26.0
410
782
fiC
C26
.13.
0E-0
83.
0E-0
8O
L-K
R14
27.0
310
339
tiC
C27
.11.
4E-0
98.
5E-0
9O
L-K
R14
2828
620
fiC
C28
2.1E
-07
1.4E
-06
in0.
09, 0
.09
OL-
KR
1428
.24
184
13fi
28.2
9.8E
-08
2.0E
-06
in0.
09, 0
.08,
0.0
8O
L-K
R14
29.0
910
126
fiC
CS
K29
.22.
3E-0
86.
5E-0
8O
L-K
R14
30.1
213
634
fiC
C30
.31.
1E-0
66.
3E-0
6in
0.08
, 0.0
8, 0
.07,
0.0
7, 0
.07
OL-
KR
1430
.94
112
26fi
CC
318.
4E-0
91.
7E-0
8O
L-K
R14
31.6
931
99
tiC
CS
K31
.85.
5E-0
81.
3E-0
7O
L-K
R14
32.9
537
3fi
CC
SK
32.9
9.1E
-08
2.4E
-07
in
AP
PE
ND
IX 3
.4128

HO
LE_I
DM
_FR
OM
DIR
DIP
FRA
CTU
RE
TYP
EC
ALC
ITE
PY
RIT
EP
FLde
pth
T m
inT
max
Flow
HY
D_Z
ON
EG
EO
_ZO
NE
Pum
ping
or
pack
ed-o
ff se
ctio
nFr
actu
re E
C S
/mO
L-K
R14
33.8
311
764
fiC
CS
K33
.82.
3E-0
82.
3E-0
8O
L-K
R14
34.4
626
631
fiC
CS
K34
.51.
6E-0
61.
5E-0
5in
0.07
, 0.0
8, 0
.08,
0.0
8, 0
.08
OL-
KR
1436
.36
306
61fi
CC
SK
36.3
2.9E
-09
9.1E
-09
OL-
KR
1437
.77
8459
fiC
C37
.81.
0E-0
81.
0E-0
8O
L-K
R14
38.0
318
17
fi38
1.4E
-07
3.6E
-07
out/i
nO
L-K
R14
39.3
715
242
fiC
CS
K39
.45.
7E-0
91.
8E-0
8O
L-K
R14
4011
622
fiC
C40
2.0E
-09
5.0E
-09
OL-
KR
1441
.729
622
fiC
C41
.78.
0E-0
78.
0E-0
70.
10, 0
.12,
0.1
0O
L-K
R14
41.7
829
228
fiC
C41
.85.
4E-0
71.
9E-0
6ou
t/in
OL-
KR
1443
.14
118
46ti
432.
0E-0
9O
L-K
R14
43.1
710
436
fiC
C43
2.0E
-09
OL-
KR
1443
.71
117
32fi
43.6
2.9E
-09
3.2E
-08
OL-
KR
1444
.68
151
46fi
44.6
6.1E
-09
2.3E
-08
OL-
KR
1450
.36
144
46ti
50.3
51.
0E-0
71.
0E-0
6H
Z19A
BFZ
056
0.14
, 0.1
6, 0
.10,
0.0
8O
L-K
R14
50.4
216
829
fiS
K50
.59.
0E-0
61.
6E-0
4ou
tH
Z19A
BFZ
056
0.06
OL-
KR
1455
.25
155
9fi
CC
55.2
5.0E
-09
5.0E
-09
OL-
KR
1455
.44
5312
fiC
C55
.41.
1E-0
83.
1E-0
8O
L-K
R14
62.8
994
23fi
SK
62.8
2.0E
-09
2.0E
-09
OL-
KR
1465
.67
137
20ti
SK
65.6
2.0E
-09
2.0E
-09
OL-
KR
1475
.889
32fi
SK
75.8
3.8E
-09
2.8E
-08
out
OL-
KR
1479
.98
9325
fi80
.17.
8E-0
74.
6E-0
6ou
t0.
19, 0
.38,
0.2
1, 0
.11,
0.0
4, 0
.11
OL-
KR
1484
.59
3114
fiC
CS
K84
.63.
5E-0
93.
5E-0
9O
L-K
R14
94.3
335
149
tiC
C94
.31.
5E-0
91.
5E-0
9ou
tO
L-K
R14
95.1
13
40fi
95.1
1.8E
-08
4.6E
-08
out
OL-
KR
1496
.65
272
8ti
CC
96.6
2.0E
-09
7.7E
-09
out
OL-
KR
1497
.19
315
6fi
97.2
5.1E
-09
1.6E
-08
out
OL-
KR
1498
.34
2711
fiC
C98
.32.
0E-0
92.
0E-0
9O
L-K
R14
99.6
724
381
fiC
CS
K99
.61.
5E-0
93.
8E-0
9O
L-K
R15
B10
.76
70.7
318
.8ti
CC
10.8
5.6E
-07
5.6E
-07
inK
R15
B-L
2O
L-K
R15
B11
.56
fi11
.61.
7E-0
61.
7E-0
6K
R15
B-L
20.
06O
L-K
R15
B12
.4ti
12.4
9.2E
-09
9.2E
-09
inK
R15
B-L
2O
L-K
R15
B13
.41
359
23.9
fiC
CS
K13
.43.
2E-0
73.
2E-0
7K
R15
B-L
2O
L-K
R15
B13
.91
66.7
16ti
13.9
4.7E
-08
4.7E
-08
KR
15B
-L2
OL-
KR
15B
14.6
635
9.3
33.8
tiS
K14
.71.
1E-0
71.
1E-0
7in
KR
15B
-L2
OL-
KR
15B
15.1
114
2.6
20.2
clfi
15.2
2.0E
-06
2.0E
-06
KR
15B
-L2
0.06
OL-
KR
15B
17.3
15.8
848
.3ti
CC
SK
17.3
1.2E
-08
1.2E
-08
inK
R15
B-L
1O
L-K
R15
B19
.83
172.
938
.6fi
SK
19.8
2.1E
-06
2.1E
-06
HZ1
9AK
R15
B-L
1O
L-K
R15
B20
.64
31.2
525
.1fi
CC
20.7
1.5E
-08
1.5E
-08
inH
Z19A
KR
15B
-L1
OL-
KR
15B
21.5
626
0.4
59.5
fi21
.61.
4E-0
51.
4E-0
5H
Z19A
KR
15B
-L1
0.06
OL-
KR
15B
22.6
745
.54
45.8
fiC
C22
.76.
4E-0
86.
4E-0
8in
HZ1
9AK
R15
B-L
1O
L-K
R15
B23
.07
0.83
32.5
clfi
SK
23.2
1.2E
-06
1.2E
-06
HZ1
9AK
R15
B-L
1O
L-K
R15
B25
305.
867
.2fi
CC
SK
24.9
1.3E
-07
1.3E
-07
inH
Z19A
KR
15B
-L1
OL-
KR
15B
25.3
786
.37
50.1
fi25
.51.
2E-0
71.
2E-0
7K
R15
B-L
1O
L-K
R15
B25
.91
65.8
15.6
fiC
CS
K25
.93.
2E-0
83.
2E-0
8K
R15
B-L
1
AP
PE
ND
IX 3
.4129

HO
LE_I
DM
_FR
OM
DIR
DIP
FRA
CTU
RE
TYP
EC
ALC
ITE
PY
RIT
EP
FLde
pth
T m
inT
max
Flow
HY
D_Z
ON
EG
EO
_ZO
NE
Pum
ping
or
pack
ed-o
ff se
ctio
nFr
actu
re E
C S
/mO
L-K
R15
B26
.62.
1319
.2fi
CC
26.7
3.9E
-08
3.9E
-08
KR
15B
-L1
OL-
KR
15B
29.9
910
639
.1fi
CC
SK
306.
2E-0
96.
2E-0
9K
R15
B-L
1O
L-K
R15
B31
.831
.84.
6E-0
94.
6E-0
9O
L-K
R15
B34
.65
253.
113
.9fi
CC
34.6
2.1E
-06
2.1E
-06
out
0.09
OL-
KR
15B
35.0
432
9.5
16.8
fi35
.13.
1E-0
63.
1E-0
6O
L-K
R15
B39
.09
125.
530
.2fi
39.1
8.9E
-08
8.9E
-08
out
OL-
KR
15B
41.4
661
.21
24fi
CC
SK
41.5
1.5E
-08
1.5E
-08
out
OL-
KR
15B
42.1
856
.77
26.7
fiC
C42
.23.
3E-0
63.
3E-0
6ou
t0.
16O
L-K
R15
41.1
135
3.7
47.7
fiC
C41
.11.
0E-0
81.
4E-0
8in
KR
15-L
60.
06O
L-K
R15
41.9
334
.26
25.5
fiC
CS
K42
2.0E
-06
4.1E
-06
KR
15-L
60.
06O
L-K
R15
43.0
79.
6842
.9fi
CC
SK
43.1
1.3E
-08
1.3E
-08
inK
R15
-L6
OL-
KR
1544
.983
.59
72.1
fisl
CC
SK
453.
8E-0
85.
6E-0
8in
KR
15-L
6O
L-K
R15
46.9
327.
529
.3fi
CC
46.9
6.7E
-09
8.8E
-09
KR
15-L
6O
L-K
R15
48.5
125
.98
21fi
CC
48.6
1.6E
-08
2.2E
-08
KR
15-L
6O
L-K
R15
49.1
12.4
141
.6fi
CC
SK
49.1
4.4E
-09
8.3E
-09
out
KR
15-L
6O
L-K
R15
50.9
2.9E
-09
4.5E
-09
KR
15-L
5O
L-K
R15
51.8
810
.31
38.6
tiC
CS
K51
.91.
3E-0
92.
2E-0
9K
R15
-L5
OL-
KR
1554
.49
286.
948
.3fi
SK
54.6
5.3E
-08
5.3E
-08
KR
15-L
5O
L-K
R15
55.6
343.
743
.3fi
CC
55.6
1.0E
-08
1.5E
-08
out
KR
15-L
50.
17O
L-K
R15
56.7
112
8.6
43.3
fi56
.76.
1E-0
79.
1E-0
7K
R15
-L5
0.16
OL-
KR
1557
.64
322
5057
.71.
2E-0
91.
4E-0
9ou
tK
R15
-L5
0.16
OL-
KR
1558
.57
122.
930
.8fi
SK
58.6
5.8E
-07
5.2E
-06
HZ1
9CK
R15
-L5
0.17
, 0.1
6O
L-K
R15
60.2
211
6.5
52.9
fisl
SK
60.4
4.1E
-08
4.1E
-08
HZ1
9CK
R15
-L5
OL-
KR
1561
.66
98.5
28.
97fi
SK
61.7
3.9E
-09
1.5E
-07
out
KR
15-L
5O
L-K
R15
62.4
102.
215
.7fi
62.4
5.5E
-09
7.8E
-09
KR
15-L
5O
L-K
R15
63.4
617
.87
21.3
fiC
CS
K63
.53.
0E-0
75.
1E-0
7ou
tK
R15
-L5
0.28
OL-
KR
1564
.21.
9E-0
93.
0E-0
9K
R15
-L5
OL-
KR
1564
.72
19.1
56.
21fi
CC
64.7
3.3E
-08
4.8E
-08
out
KR
15-L
5O
L-K
R15
682.
6E-0
94.
5E-0
9K
R15
-L4
OL-
KR
1568
.798
268
.86.
7E-0
97.
9E-0
9K
R15
-L4
OL-
KR
1571
.49
tiC
C71
.54.
5E-0
94.
5E-0
9K
R15
-L4
OL-
KR
1572
.36
34.8
211
.2fi
72.4
6.9E
-08
7.9E
-08
KR
15-L
40.
54O
L-K
R15
74.2
621
428
74.4
2.4E
-08
3.0E
-08
KR
15-L
4O
L-K
R15
78.5
824
7.6
17.4
fiC
C78
.64.
7E-0
96.
0E-0
9O
L-K
R15
81.6
333
732
fiC
CS
K81
.75.
0E-0
96.
9E-0
9O
L-K
R15
83.1
5.0E
-09
5.0E
-09
OL-
KR
1591
.29
30.5
916
.8fi
SK
91.3
3.9E
-09
3.9E
-09
OL-
KR
16B
15.3
9fi
CC
15.4
5.3E
-09
5.3E
-09
inK
R16
B-L
2O
L-K
R16
B17
.21
354.
540
.9fi
CC
SK
17.2
1.0E
-07
1.0E
-07
inH
Z19A
KR
16B
-L2
OL-
KR
16B
18.2
4fi
CC
SK
18.2
1.7E
-07
1.7E
-07
HZ1
9AK
R16
B-L
20.
07O
L-K
R16
B18
.58
83.2
711
.3fi
CC
SK
18.6
1.2E
-06
1.2E
-06
HZ1
9AK
R16
B-L
20.
06O
L-K
R16
B18
.94
fiS
K19
6.3E
-09
6.3E
-09
inH
Z19A
KR
16B
-L2
OL-
KR
16B
21.1
410
03.
38fi
SK
214.
1E-0
84.
1E-0
8in
KR
16B
-L1
OL-
KR
16B
22.9
321.
30.
67fi
CC
SK
22.6
1.4E
-08
1.4E
-08
KR
16B
-L1
AP
PE
ND
IX 3
.4130

HO
LE_I
DM
_FR
OM
DIR
DIP
FRA
CTU
RE
TYP
EC
ALC
ITE
PY
RIT
EP
FLde
pth
T m
inT
max
Flow
HY
D_Z
ON
EG
EO
_ZO
NE
Pum
ping
or
pack
ed-o
ff se
ctio
nFr
actu
re E
C S
/mO
L-K
R16
B23
.42
112.
28.
09fi
CC
23.4
2.1E
-08
2.1E
-08
inK
R16
B-L
1O
L-K
R16
B24
.62
138.
77.
13fi
SK
24.6
5.7E
-07
5.7E
-07
KR
16B
-L1
0.05
OL-
KR
16B
27.0
415
753
fiC
C27
2.9E
-09
2.9E
-09
KR
16B
-L1
OL-
KR
16B
27.9
638
.58
10.3
ti28
.14.
7E-0
74.
7E-0
7in
KR
16B
-L1
0.06
OL-
KR
16B
29.4
65.
719.
2ti
29.4
3.7E
-08
3.7E
-08
inK
R16
B-L
1O
L-K
R16
B30
.02
114.
87.
08fi
CC
303.
3E-0
73.
3E-0
7K
R16
B-L
10.
07O
L-K
R16
B30
.78
36.2
210
.6fi
31.1
5.0E
-08
5.0E
-08
KR
16B
-L1
OL-
KR
16B
31.8
913
6.7
26.5
fiC
CS
K32
2.0E
-07
2.0E
-07
out
KR
16B
-L1
OL-
KR
16B
34.6
3112
34.5
5.0E
-08
5.0E
-08
out
KR
16B
-L1
OL-
KR
16B
35.2
633
312
35.2
5.4E
-08
5.4E
-08
OL-
KR
16B
3636
6.3E
-09
6.3E
-09
out
OL-
KR
16B
37.1
353.
628
.9ti
37.1
3.2E
-07
3.2E
-07
out
0.09
OL-
KR
16B
39.1
742
.36
59.1
ti39
.92.
2E-0
82.
2E-0
8ou
tO
L-K
R16
41.9
433
7.9
23.3
fiS
K41
.91.
5E-0
71.
5E-0
7K
R16
-L6
OL-
KR
1642
.99
197
23.5
fiC
C42
.93.
9E-0
83.
9E-0
8in
KR
16-L
6O
L-K
R16
43.5
515
6.7
23.8
fi43
.51.
2E-0
81.
2E-0
8K
R16
-L6
OL-
KR
1644
.04
38.8
713
.6fi
CC
447.
0E-0
97.
0E-0
9K
R16
-L6
OL-
KR
1645
.49
0.07
68.8
fiC
C45
.51.
2E-0
71.
2E-0
7in
KR
16-L
6O
L-K
R16
46.3
117
.94
18.8
ti46
.21.
8E-0
81.
8E-0
8K
R16
-L6
0.15
OL-
KR
1647
.07
46.9
414
.6fi
47.1
6.4E
-08
6.4E
-08
KR
16-L
60.
16O
L-K
R16
48.6
27.
7522
fi48
.66.
8E-0
66.
8E-0
6in
HZ1
9CK
R16
-L6
0.15
OL-
KR
1649
.83
95.0
17.
8fi
SK
49.8
1.7E
-07
1.7E
-07
HZ1
9CK
R16
-L6
0.23
OL-
KR
1650
.46
181.
317
.4fi
SK
50.4
4.4E
-09
4.4E
-09
KR
16-L
60.
23O
L-K
R16
53.0
435
4.6
20.2
ti53
4.5E
-09
4.5E
-09
KR
16-L
5O
L-K
R16
55.3
55.3
1.9E
-08
1.9E
-08
KR
16-L
5O
L-K
R16
5713
7.5
30.8
fiS
K57
1.8E
-08
1.8E
-08
out
KR
16-L
50.
47O
L-K
R16
57.2
912
3.1
22fi
CC
SK
57.3
1.2E
-07
1.2E
-07
KR
16-L
50.
52O
L-K
R16
57.7
517
6.1
27.7
fiS
K57
.86.
6E-0
76.
6E-0
7K
R16
-L5
OL-
KR
1662
.97
316.
77.
38fi
63.1
1.2E
-08
1.2E
-08
KR
16-L
4O
L-K
R16
64.4
270.
59.
83fi
CC
64.4
7.4E
-09
7.4E
-09
KR
16-L
4O
L-K
R16
66.2
630
2.2
10.7
tiS
K66
.21.
2E-0
81.
2E-0
8K
R16
-L4
OL-
KR
1667
.21
10.0
611
.4fi
SK
67.4
6.7E
-09
6.7E
-09
KR
16-L
4O
L-K
R16
69.7
68.
7732
.8ti
SK
69.7
6.8E
-09
6.8E
-09
KR
16-L
41.
05O
L-K
R16
70.1
415
0.9
20.9
fiS
K70
2.8E
-08
2.8E
-08
KR
16-L
4O
L-K
R16
71.4
920
5.3
48.3
ti71
.67.
0E-0
97.
0E-0
9K
R16
-L4
OL-
KR
1673
.24
89.0
818
.7fi
CC
SK
731.
7E-0
81.
7E-0
8K
R16
-L4
0.9
OL-
KR
1673
.75
0.73
20.6
fiC
C73
.84.
3E-0
84.
3E-0
8K
R16
-L4
OL-
KR
1674
.774
.76.
2E-0
96.
2E-0
9K
R16
-L4
OL-
KR
1675
.18
71.0
168
.9fis
lS
K75
.28.
1E-0
98.
1E-0
9K
R16
-L4
OL-
KR
1676
.01
199
776
1.3E
-09
1.3E
-09
KR
16-L
4O
L-K
R16
77.2
244.
86.
65fi
CC
77.3
9.8E
-09
9.8E
-09
KR
16-L
4O
L-K
R16
77.9
777
.12
77.1
fiC
CS
K77
.92.
8E-0
92.
8E-0
9K
R16
-L4
OL-
KR
1679
.64
tiC
CS
K79
.71.
9E-0
71.
9E-0
7ou
tK
R16
-L4
0.65
OL-
KR
1682
.69
5950
82.7
2.4E
-09
2.4E
-09
KR
16-L
3
AP
PE
ND
IX 3
.4131

HO
LE_I
DM
_FR
OM
DIR
DIP
FRA
CTU
RE
TYP
EC
ALC
ITE
PY
RIT
EP
FLde
pth
T m
inT
max
Flow
HY
D_Z
ON
EG
EO
_ZO
NE
Pum
ping
or
pack
ed-o
ff se
ctio
nFr
actu
re E
C S
/mO
L-K
R16
84.2
116
1.8
71.7
fisl
CC
SK
84.4
1.8E
-09
1.8E
-09
KR
16-L
3O
L-K
R16
85.4
130
0.4
11.7
fiC
C85
.47.
5E-0
97.
5E-0
9K
R16
-L3
OL-
KR
1686
.17
54.9
261
fisl
CC
SK
86.2
1.4E
-08
1.4E
-08
KR
16-L
31.
02O
L-K
R16
86.4
2fis
lS
K86
.53.
1E-0
83.
1E-0
8K
R16
-L3
OL-
KR
1692
.74
233.
418
ti92
.81.
3E-0
81.
3E-0
8K
R16
-L3
OL-
KR
1693
.34
8576
.1fi
CC
93.4
6.2E
-09
6.2E
-09
KR
16-L
3O
L-K
R16
96.1
825
9.2
11.7
fiC
C96
.22.
4E-0
82.
4E-0
8K
R16
-L3
0.98
OL-
KR
17B
8.36
93.9
555
.2fis
lS
K8.
41.
0E-0
51.
0E-0
5H
Z19A
KR
17B
-L2
0.01
OL-
KR
17B
12.0
515
2.8
19.7
fiC
C12
1.0E
-08
1.0E
-08
out
KR
17B
-L1
0.04
OL-
KR
17B
18.0
912
1.3
9.53
fiC
C18
.22.
2E-0
72.
2E-0
7ou
tK
R17
B-L
1O
L-K
R17
B19
.45
12.8
87.
96fi
SK
19.6
3.2E
-08
3.2E
-08
out
KR
17B
-L1
OL-
KR
17B
20.7
511
0.4
16.3
tiS
K20
.82.
5E-0
72.
5E-0
7ou
tK
R17
B-L
10.
02O
L-K
R17
B24
.99
117.
513
.6ti
25.2
5.6E
-08
5.6E
-08
out
KR
17B
-L1
OL-
KR
17B
26.5
220
1.6
25.5
ti26
.61.
2E-0
81.
2E-0
8ou
tK
R17
B-L
1O
L-K
R17
B26
.97
300
3227
1.6E
-08
1.6E
-08
KR
17B
-L1
OL-
KR
17B
28.8
416
3.5
30.7
ti28
.99.
5E-0
89.
5E-0
8ou
tK
R17
B-L
1O
L-K
R17
B34
.38
357.
321
.6fi
CC
34.4
2.3E
-08
2.3E
-08
out
OL-
KR
17B
35.9
5fi
CC
SK
365.
0E-0
95.
0E-0
9O
L-K
R17
B36
.97
347.
351
.9fi
CC
SK
377.
7E-0
97.
7E-0
9ou
tO
L-K
R17
B39
.02
156.
516
.2fi
SK
397.
1E-0
97.
1E-0
9ou
tO
L-K
R17
B40
.41
206.
710
.7fi
SK
40.4
7.1E
-08
7.1E
-08
OL-
KR
17B
41.7
329
.77
21.7
fiC
C41
.81.
7E-0
71.
7E-0
7ou
t0.
13O
L-K
R17
41.2
213
0.5
14.7
fiC
CS
K41
.24.
6E-0
84.
6E-0
8K
R17
-L6
OL-
KR
1741
.36
70.9
130
.8fi
CC
SK
41.4
3.5E
-08
3.5E
-08
KR
17-L
6O
L-K
R17
41.6
633
432
41.6
2.3E
-08
2.3E
-08
KR
17-L
6O
L-K
R17
42.6
634
6.5
19.1
fiC
C42
.63.
4E-0
73.
4E-0
7in
KR
17-L
60.
1O
L-K
R17
43.4
2fi
CC
43.3
1.1E
-09
1.1E
-09
KR
17-L
6O
L-K
R17
45.7
668
.66
18.5
fiS
K45
.72.
0E-0
82.
0E-0
8in
KR
17-L
60.
15O
L-K
R17
46.1
235
4.9
18.7
fiS
K46
.13.
4E-0
73.
4E-0
7in
KR
17-L
60.
13O
L-K
R17
47.1
47.1
1.7E
-09
1.7E
-09
inK
R17
-L6
OL-
KR
1749
.55
86.6
120
.2fi
CC
SK
49.5
5.5E
-08
5.5E
-08
KR
17-L
60.
15O
L-K
R17
50.1
314
8.4
48.4
clfi
SK
50.1
3.0E
-06
3.0E
-06
inH
Z19C
KR
17-L
60.
15O
L-K
R17
52.2
810
4.2
23.1
fiS
K52
.32.
2E-0
92.
2E-0
9in
KR
17-L
5O
L-K
R17
53.4
332
0.8
1.28
fiS
K53
.46.
1E-0
86.
1E-0
8K
R17
-L5
OL-
KR
1755
.83
93.2
124
.7fi
CC
55.8
4.6E
-09
4.6E
-09
KR
17-L
5O
L-K
R17
56.6
810
.08
21.6
tiC
CS
K56
.71.
4E-0
91.
4E-0
9K
R17
-L5
OL-
KR
1760
.46
341.
119
fiC
C60
.57.
3E-0
97.
3E-0
9K
R17
-L5
OL-
KR
1762
.27
321.
632
.2fi
CC
SK
62.3
4.8E
-09
4.8E
-09
inK
R17
-L5
0.44
OL-
KR
1763
.16
2.97
47fi
63.2
2.5E
-07
2.5E
-07
KR
17-L
50.
46O
L-K
R17
67.4
67.4
1.2E
-07
1.2E
-07
inK
R17
-L4
0.22
OL-
KR
1767
.86
110.
214
.7fi
CC
SK
67.9
5.6E
-06
5.6E
-06
KR
17-L
40.
22O
L-K
R17
68.8
854
2668
.94.
2E-0
74.
2E-0
7in
KR
17-L
40.
3O
L-K
R17
69.0
826
6.9
8.78
fiC
CS
K69
.16.
8E-0
76.
8E-0
7K
R17
-L4
0.3
OL-
KR
1791
.28
36.8
52.
49ti
91.3
1.2E
-08
1.2E
-08
out
KR
17-L
3
AP
PE
ND
IX 3
.4132

HO
LE_I
DM
_FR
OM
DIR
DIP
FRA
CTU
RE
TYP
EC
ALC
ITE
PY
RIT
EP
FLde
pth
T m
inT
max
Flow
HY
D_Z
ON
EG
EO
_ZO
NE
Pum
ping
or
pack
ed-o
ff se
ctio
nFr
actu
re E
C S
/mO
L-K
R17
93.0
58.
3716
.8ti
SK
93.1
7.6E
-09
7.6E
-09
out
KR
17-L
3O
L-K
R17
98.9
219
.718
.2ti
999.
5E-0
99.
5E-0
9ou
tK
R17
-L2
OL-
KR
18B
9.75
45.1
324
fiC
CS
K9.
87.
0E-0
77.
0E-0
7in
KR
18B
-L3
OL-
KR
18B
12.1
810
1.9
36.1
fiS
K12
.11.
1E-0
81.
1E-0
8in
KR
18B
-L3
OL-
KR
18B
12.6
529
043
12.6
2.1E
-08
2.1E
-08
KR
18B
-L3
OL-
KR
18B
15.0
864
.76
23.4
fiC
CS
K15
.11.
5E-0
71.
5E-0
7in
KR
18B
-L2
OL-
KR
18B
16.9
242
.89
34.7
fisl
CC
SK
16.9
1.7E
-06
1.7E
-06
inK
R18
B-L
2O
L-K
R18
B17
.76
243
3217
.81.
5E-0
81.
5E-0
8K
R18
B-L
2O
L-K
R18
B19
.34
122.
526
.8fi
CC
SK
19.3
1.7E
-06
1.7E
-06
inK
R18
B-L
2O
L-K
R18
B21
.46
186.
120
.8fi
21.4
6.4E
-06
6.4E
-06
KR
18B
-L2
0.06
OL-
KR
18B
22.4
732
3.6
8.4
ti22
.44.
1E-0
84.
1E-0
8K
R18
B-L
2O
L-K
R18
B24
.83
ti24
.81.
1E-0
71.
1E-0
7in
KR
18B
-L1
OL-
KR
18B
26.1
612
4.6
14.9
tiS
K26
.29.
5E-0
99.
5E-0
9in
KR
18B
-L1
OL-
KR
18B
26.7
60.0
117
.1ti
SK
26.7
3.7E
-07
3.7E
-07
KR
18B
-L1
OL-
KR
18B
27.4
526
5.9
36.1
fiC
C27
.51.
4E-0
71.
4E-0
7K
R18
B-L
10.
07O
L-K
R18
B27
.99
8164
281.
9E-0
61.
9E-0
6K
R18
B-L
1O
L-K
R18
B28
.67
131.
239
.7ti
28.7
8.7E
-08
8.7E
-08
out
KR
18B
-L1
OL-
KR
18B
29.1
8fi
CC
SK
29.2
1.6E
-06
1.6E
-06
KR
18B
-L1
OL-
KR
18B
29.6
821
9.2
22.5
ti29
.73.
8E-0
73.
8E-0
7ou
tK
R18
B-L
1O
L-K
R18
B31
.81
94.2
346
ti31
.81.
7E-0
51.
7E-0
5ou
tH
Z19A
KR
18B
-L1
0.09
OL-
KR
18B
33.2
886
.54
44.3
fiC
CS
K33
.34.
6E-0
84.
6E-0
8H
Z19A
KR
18B
-L1
OL-
KR
18B
33.7
611
6.6
36.8
fiC
CS
K33
.82.
8E-0
72.
8E-0
7K
R18
B-L
1O
L-K
R18
B34
.56
104.
333
.9ti
CC
SK
34.5
6.2E
-09
6.2E
-09
out
KR
18B
-L1
OL-
KR
18B
37.4
130.
459
.4fis
l37
.69.
5E-0
99.
5E-0
9K
R18
B-L
1O
L-K
R18
B40
.19
108.
623
.5fi
40.2
6.6E
-09
6.6E
-09
KR
18B
-L1
OL-
KR
18B
41.1
163.
865
.5cl
fiS
K41
.23.
1E-0
83.
1E-0
8K
R18
B-L
1O
L-K
R18
40.6
96.2
837
.8fi
CC
40.6
9.4E
-09
9.4E
-09
KR
18-L
5O
L-K
R18
42.3
924
.18
24.1
fiC
C42
.43.
1E-0
93.
1E-0
9in
KR
18-L
5O
L-K
R18
43.8
841
2643
.71.
9E-0
91.
9E-0
9K
R18
-L5
OL-
KR
1845
.85
24.0
613
.3fi
CC
SK
45.9
3.0E
-09
3.0E
-09
KR
18-L
5O
L-K
R18
49.4
534
1.7
36.3
fiC
C49
.55.
2E-0
95.
2E-0
9K
R18
-L5
OL-
KR
1850
.63
176.
98.
98fi
CC
SK
50.7
2.8E
-09
2.8E
-09
HZ1
9CK
R18
-L5
0.28
OL-
KR
1851
.24
197
5951
6.2E
-08
6.2E
-08
inH
Z19C
KR
18-L
50.
14O
L-K
R18
51.6
495
.58
14.8
fiC
C51
.76.
0E-0
66.
0E-0
6H
Z19C
KR
18-L
50.
14O
L-K
R18
54.2
515
7.1
11.3
fi54
.22.
3E-0
72.
3E-0
7in
KR
18-L
40.
09O
L-K
R18
55.9
491
.49
21.6
fiS
K55
.97.
1E-0
77.
1E-0
7in
KR
18-L
40.
15O
L-K
R18
56.6
211
8.4
35.3
tiS
K56
.61.
8E-0
81.
8E-0
8K
R18
-L4
0.19
OL-
KR
1857
.15
135.
723
.3fi
57.1
2.7E
-07
2.7E
-07
inK
R18
-L4
0.18
OL-
KR
1858
.15
114.
335
.6fi
CC
58.1
4.2E
-08
4.2E
-08
KR
18-L
3O
L-K
R18
59.4
126
2.1
27.6
fi59
.44.
9E-0
94.
9E-0
9K
R18
-L3
OL-
KR
1862
.53
28.2
739
.7fi
SK
62.6
5.6E
-08
5.6E
-08
KR
18-L
30.
29O
L-K
R18
63.6
133
934
63.4
4.0E
-09
4.0E
-09
inO
L-K
R18
65.8
729
5.3
32.5
fi65
.99.
4E-0
99.
4E-0
9O
L-K
R18
70.6
132
1.3
22ti
70.7
1.1E
-08
1.1E
-08
AP
PE
ND
IX 3
.4133

HO
LE_I
DM
_FR
OM
DIR
DIP
FRA
CTU
RE
TYP
EC
ALC
ITE
PY
RIT
EP
FLde
pth
T m
inT
max
Flow
HY
D_Z
ON
EG
EO
_ZO
NE
Pum
ping
or
pack
ed-o
ff se
ctio
nFr
actu
re E
C S
/mO
L-K
R18
77.7
925
8.5
19.5
fiS
K77
.86.
5E-0
76.
5E-0
7ou
tK
R18
-L2
0.79
OL-
KR
1878
.75
18.4
212
.9fi
78.8
1.9E
-08
1.9E
-08
out
KR
18-L
2O
L-K
R18
80.2
225
.17
17.8
fiS
K80
.31.
5E-0
71.
5E-0
7K
R18
-L2
0.83
OL-
KR
1881
.9ti
CC
SK
81.9
8.3E
-09
8.3E
-09
KR
18-L
2O
L-K
R18
94.4
215
.91
6.66
tiS
K94
.51.
1E-0
81.
1E-0
8K
R18
-L1
0.95
OL-
KR
1897
.4ti
SK
97.4
4.7E
-09
4.7E
-09
KR
18-L
1O
L-K
R18
99.3
410
9.3
14ti
99.4
2.5E
-09
2.5E
-09
KR
18-L
1O
L-K
R30
14.1
114
31.2
fi14
.33.
1E-0
73.
1E-0
7in
OL-
KR
3016
.41.
5E-0
71.
5E-0
7in
OL-
KR
3019
.22
338.
610
.5fi
CC
SK
19.3
1.3E
-06
1.3E
-06
inO
L-K
R30
22.5
635
2.1
52.5
fiC
CS
K22
.82.
8E-0
72.
8E-0
7in
OL-
KR
3025
.47
335
27.4
ti25
.73.
7E-0
73.
7E-0
7in
OL-
KR
3026
.09
320.
519
.4ti
26.2
1.8E
-08
1.8E
-08
OL-
KR
3027
.07
342.
341
.4fi
27.3
3.7E
-08
3.7E
-08
inO
L-K
R30
30.0
530
1.2
19.2
fi30
.21.
7E-0
81.
7E-0
8O
L-K
R30
31.9
1.3E
-08
1.3E
-08
OL-
KR
3032
.64
297.
717
.1fi
SK
32.9
4.6E
-09
4.6E
-09
OL-
KR
3036
.62
339.
119
.2fi
CC
36.8
5.9E
-06
5.9E
-06
inO
L-K
R30
37.6
114
9.5
39.1
fi37
.82.
1E-0
82.
1E-0
8O
L-K
R30
39.4
692
.25
17.1
fiC
CS
K39
.73.
6E-0
93.
6E-0
9O
L-K
R30
42.6
432
9.3
27.5
tiC
CS
K42
.81.
6E-0
91.
6E-0
9O
L-K
R30
45.9
715
2.5
43.1
fiS
K46
.21.
4E-0
71.
4E-0
7O
L-K
R30
48.4
826
6.1
54.2
fiC
C48
.77.
0E-0
87.
0E-0
8O
L-K
R30
50.7
812
440
.1fi
SK
51.1
7.9E
-08
7.9E
-08
HZ1
9AO
L-K
R30
52.3
413
5.7
31.5
fi52
.61.
1E-0
51.
1E-0
5ou
tH
Z19A
OL-
KR
3053
.17
fiS
K53
.43.
0E-0
53.
0E-0
5ou
tH
Z19A
OL-
KR
3056
.18
131.
917
.9fi
CC
SK
56.4
8.1E
-08
8.1E
-08
OL-
KR
3059
.42
150.
745
.5fi
CC
SK
59.7
5.6E
-08
5.6E
-08
OL-
KR
3062
4.2E
-09
4.2E
-09
OL-
KR
3064
.912
2.6
25.6
fi65
.15.
7E-0
85.
7E-0
8O
L-K
R30
67.7
511
641
.3fi
681.
6E-0
81.
6E-0
8O
L-K
R30
70.4
4.2E
-09
4.2E
-09
OL-
KR
3073
.77
14.6
822
.9fi
CC
SK
743.
1E-0
83.
1E-0
8O
L-K
R30
82.6
332
4.5
33.8
ti82
.93.
9E-0
63.
9E-0
6ou
tB
FZ05
6O
L-K
R30
85.2
724
612
.5fi
85.5
2.8E
-09
2.8E
-09
OL-
KR
3091
.224
.97
31.6
fi91
.51.
6E-0
81.
6E-0
8
AP
PE
ND
IX 3
.4134

Hol
e-ID
FRA
CT.
N
O.
DE
PTH
C
OR
EC
OR
E
ALP
HA
CO
LOU
RFR
AC
T.
FILL
ING
THIC
KN
ES
S
OF
FILL
ING
TYP
ED
EP
TH
IMA
GE
DIP
D
IRE
CTI
ON
DIP
DE
PTH
PFL
(m)
T (m
2 /s)
Ape
rture
cla
ss
7.3
3.3E
-08
OL-
PP
661
9.07
80op
OL-
PP
662
9.17
80re
dH
E0.
2fi
OL-
PP
663
9.27
50re
d, g
reen
HE
, KL
0.1
fiO
L-P
P66
49.
460
red,
gre
enH
E, K
L0.
1fi
OL-
PP
665
9.5
42gr
een
KL
0.2
fiO
L-P
P66
69.
5882
red
HE
0.1
fiO
L-P
P66
79.
6152
red
HE
0.1
fiO
L-P
P66
89.
7275
whi
te, g
reen
KA
, KL
0.1
fiO
L-P
P66
99.
8320
light
gre
enM
U, K
A0.
1fi
OL-
PP
6610
9.87
75w
hite
, gre
enK
A, K
L0.
2fi
OL-
PP
6611
10.0
148
whi
te, g
reen
KA
, KL
0.2
fiO
L-P
P66
1210
.33
60w
hite
, gre
enK
A, K
L0.
4fi
OL-
PP
6613
10.4
415
whi
te, g
reen
KA
, KL
0.1
fi10
.27
52.6
178
.17
10.4
1.7E
-06
LOD
-1 m
mO
L-P
P66
1410
.58
35w
hite
, gre
enK
A, K
L0.
2fi
11.5
912
7.44
62.4
2O
L-P
P66
1510
.81
70w
hite
KA
0.2
fi10
.82
359.
1223
.4O
L-P
P66
1611
.13
35w
hite
KA
0.1
fi11
.14
147.
5447
.3O
L-P
P66
1711
.34
27w
hite
KA
0.1
fi11
.36
55.7
861
.36
OL-
PP
6618
11.4
440
whi
te, g
reen
KA
, KL
0.1
fi11
.44
108.
9647
.32
OL-
PP
6619
11.5
940
whi
teK
A0.
1fi
11.5
912
7.44
62.4
2O
L-P
P66
2012
.15
70w
hite
, gre
enK
A, K
L0.
1fi
12.1
511
7.95
34.6
9O
L-P
P66
2112
.37
15w
hite
, gre
enK
A, K
L0.
1fi
12.3
275
.27
67.4
9O
L-P
P66
2212
.48
0w
hite
, gre
enK
A, K
L0.
1fi
12.4
710
8.19
37.2
6O
L-P
P66
2312
.57
38w
hite
, gre
enK
A, K
L0.
2fi
12.6
310
4.24
55.3
3O
L-P
P66
2412
.630
whi
te, g
reen
KA
, KL
0.2
fi12
.65
110.
857
.66
OL-
PP
6625
12.7
475
whi
te, g
reen
KA
, KL
0.2
fi12
.76
137.
7718
.59
OL-
PP
6612
.78
133.
3575
.31
13.1
5.6E
-08
LOD
-1 m
mO
L-P
P66
13.4
264
.59
27O
L-P
P66
13.4
973
.83
45.7
13.7
2.8E
-08
>10
mm
OL-
PP
6613
.79
152.
0937
.35
OL-
PP
6614
120.
138
.36
OL-
PP
6614
.05
111.
6651
.31
OL-
PP
6614
.16
216.
6858
.03
APP
END
IX 3
.5: S
UM
MA
RY-
TAB
LES
OF
HYD
RO
GEO
LOG
ICA
L D
ATA
AN
D S
OM
EB
AC
KG
RO
UN
D D
ATA
ON
DR
ILLH
OLE
S O
L-PP
66 –
OL-
PP69
.
135

Hol
e-ID
FRA
CT.
N
O.
DE
PTH
C
OR
EC
OR
E
ALP
HA
CO
LOU
RFR
AC
T.
FILL
ING
THIC
KN
ES
S
OF
FILL
ING
TYP
ED
EP
TH
IMA
GE
DIP
D
IRE
CTI
ON
DIP
DE
PTH
PFL
(m)
T (m
2 /s)
Ape
rture
cla
ss
OL-
PP
6626
14.2
158
whi
teK
A0.
1fi
14.2
411
4.26
40.1
114
.47.
6E-0
95-
10 m
mO
L-P
P66
2714
.55
25w
hite
KA
0.2
fi14
.53
130.
0446
.08
OL-
PP
6628
14.6
52gr
een
KL
0.2
fi14
.56
122.
9731
.74
OL-
PP
6629
14.6
458
whi
te, g
reen
KA
, KL
0.2
fi14
.61
106.
5921
.84
OL-
PP
6630
14.7
457
whi
teK
A0.
1fi
14.7
611
2.85
40.0
9O
L-P
P66
3114
.94
50w
hite
KA
0.1
fi14
.91
80.5
135
.86
OL-
PP
6614
.97
127.
9129
.17
OL-
PP
6615
.03
167.
4548
.65
OL-
PP
6632
15.8
242
light
bro
wn
SK
0.1
fi15
.79
353.
2859
.1O
L-P
P66
3315
.86
60fi
15.7
997
.85
24.7
3O
L-P
P66
3416
.15
58br
own
SV
0.1
fi16
.132
7.77
28.7
916
.21.
0E-0
71-
5 m
mO
L-P
P66
3516
.33
50gr
eyK
A0.
1fi
16.3
135.
3650
.7O
L-P
P66
3616
.72
70op
16.7
414
1.9
31.6
116
.89.
5E-0
9LO
D-1
mm
OL-
PP
6637
16.7
765
whi
te, l
ight
bro
wn
KA
, SK
0.1
fi16
.79
148.
543
.97
OL-
PP
6616
.85
131.
9839
.9O
L-P
P66
18.0
116
9.68
37.9
418
.13.
1E-0
9LO
D-1
mm
OL-
PP
6638
18.5
615
whi
teK
A0.
1fi
18.2
617
1.56
74.0
8O
L-P
P66
3918
.67
50w
hite
KA
0.1
fi18
.66
140.
5836
.518
.71.
8E-0
8LO
D-1
mm
OL-
PP
6640
18.9
110
whi
te, l
ight
bro
wn
KA
, SK
0.1
fi18
.78
330.
3182
.97
OL-
PP
6641
19.1
288
whi
te, l
ight
bro
wn
KA
, SK
0.2
fi19
.12
66.1
87.
87O
L-P
P66
4219
.17
68w
hite
KA
0.1
fi19
.17
174.
3621
.04
OL-
PP
6643
19.4
775
whi
te, l
ight
bro
wn
KA
, SK
0.1
fi19
.44
62.8
624
.64
OL-
PP
6644
19.5
568
whi
te, l
ight
bro
wn
KA
, SK
0.1
fi19
.53
166.
9247
.69
OL-
PP
6645
19.6
380
whi
teK
A0.
1fi
19.6
513
4.03
11.8
2O
L-P
P66
4619
.72
85w
hite
KA
0.1
fi19
.66
164.
0619
.59
OL-
PP
6647
19.9
3w
hite
, gre
enK
A, K
L0.
1fi
19.8
912
1.93
43.3
1O
L-P
P66
4820
.04
70lig
ht b
row
nS
K0.
1fi
20.0
714
6.71
32.6
3O
L-P
P66
4920
.08
60lig
ht b
row
nS
K0.
1fi
20.1
211
9.88
47.7
4O
L-P
P66
5020
.350
whi
te, g
reen
KA
, KL
0.1
fi20
.314
9.41
39.3
9O
L-P
P66
5120
.56
34w
hite
, lig
ht b
row
nK
A, S
K0.
1fi
20.5
814
5.47
62.4
2O
L-P
P66
5220
.63
25gr
ey, l
ight
bro
wn
SV
, SK
0.1
fi20
.63
150.
9355
.94
OL-
PP
6653
20.7
550
whi
te, g
rey
KA
, CC
, KL
0.3
fi20
.74
126.
9339
.55
20.8
1.0E
-08
1-5
mm
OL-
PP
6620
.78
282.
3228
.3
AP
PE
ND
IX 3
.5136
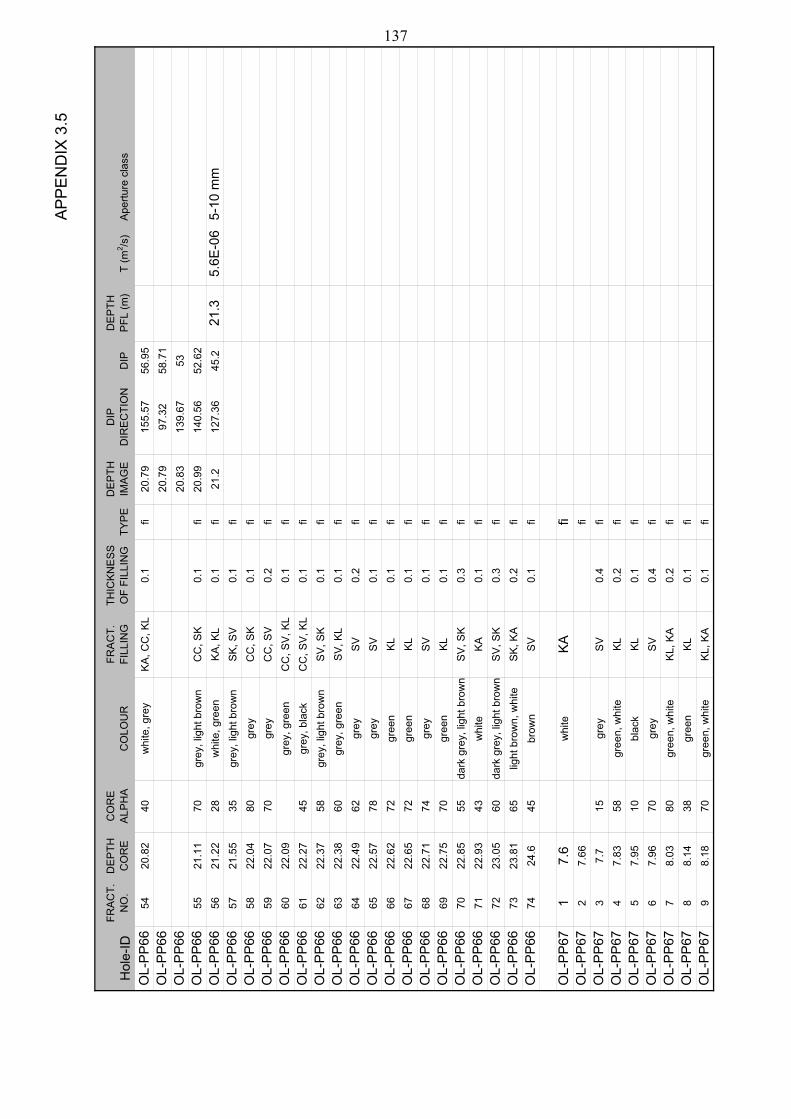
Hol
e-ID
FRA
CT.
N
O.
DE
PTH
C
OR
EC
OR
E
ALP
HA
CO
LOU
RFR
AC
T.
FILL
ING
THIC
KN
ES
S
OF
FILL
ING
TYP
ED
EP
TH
IMA
GE
DIP
D
IRE
CTI
ON
DIP
DE
PTH
PFL
(m)
T (m
2 /s)
Ape
rture
cla
ss
OL-
PP
6654
20.8
240
whi
te, g
rey
KA
, CC
, KL
0.1
fi20
.79
155.
5756
.95
OL-
PP
6620
.79
97.3
258
.71
OL-
PP
6620
.83
139.
6753
OL-
PP
6655
21.1
170
grey
, lig
ht b
row
nC
C, S
K0.
1fi
20.9
914
0.56
52.6
2O
L-P
P66
5621
.22
28w
hite
, gre
enK
A, K
L0.
1fi
21.2
127.
3645
.221
.35.
6E-0
65-
10 m
mO
L-P
P66
5721
.55
35gr
ey, l
ight
bro
wn
SK
, SV
0.1
fiO
L-P
P66
5822
.04
80gr
eyC
C, S
K0.
1fi
OL-
PP
6659
22.0
770
grey
CC
, SV
0.2
fiO
L-P
P66
6022
.09
grey
, gre
enC
C, S
V, K
L0.
1fi
OL-
PP
6661
22.2
745
grey
, bla
ckC
C, S
V, K
L0.
1fi
OL-
PP
6662
22.3
758
grey
, lig
ht b
row
nS
V, S
K0.
1fi
OL-
PP
6663
22.3
860
grey
, gre
enS
V, K
L0.
1fi
OL-
PP
6664
22.4
962
grey
SV
0.2
fiO
L-P
P66
6522
.57
78gr
eyS
V0.
1fi
OL-
PP
6666
22.6
272
gree
nK
L0.
1fi
OL-
PP
6667
22.6
572
gree
nK
L0.
1fi
OL-
PP
6668
22.7
174
grey
SV
0.1
fiO
L-P
P66
6922
.75
70gr
een
KL
0.1
fiO
L-P
P66
7022
.85
55da
rk g
rey,
ligh
t bro
wn
SV
, SK
0.3
fiO
L-P
P66
7122
.93
43w
hite
KA
0.1
fiO
L-P
P66
7223
.05
60da
rk g
rey,
ligh
t bro
wn
SV
, SK
0.3
fiO
L-P
P66
7323
.81
65lig
ht b
row
n, w
hite
SK
, KA
0.2
fiO
L-P
P66
7424
.645
brow
nS
V0.
1fi
OL-
PP
671
7.6
whi
teK
Afi
OL-
PP
672
7.66
fiO
L-P
P67
37.
715
grey
SV
0.4
fiO
L-P
P67
47.
8358
gree
n, w
hite
KL
0.2
fiO
L-P
P67
57.
9510
blac
kK
L0.
1fi
OL-
PP
676
7.96
70gr
eyS
V0.
4fi
OL-
PP
677
8.03
80gr
een,
whi
teK
L, K
A0.
2fi
OL-
PP
678
8.14
38gr
een
KL
0.1
fiO
L-P
P67
98.
1870
gree
n, w
hite
KL,
KA
0.1
fi
AP
PE
ND
IX 3
.5137
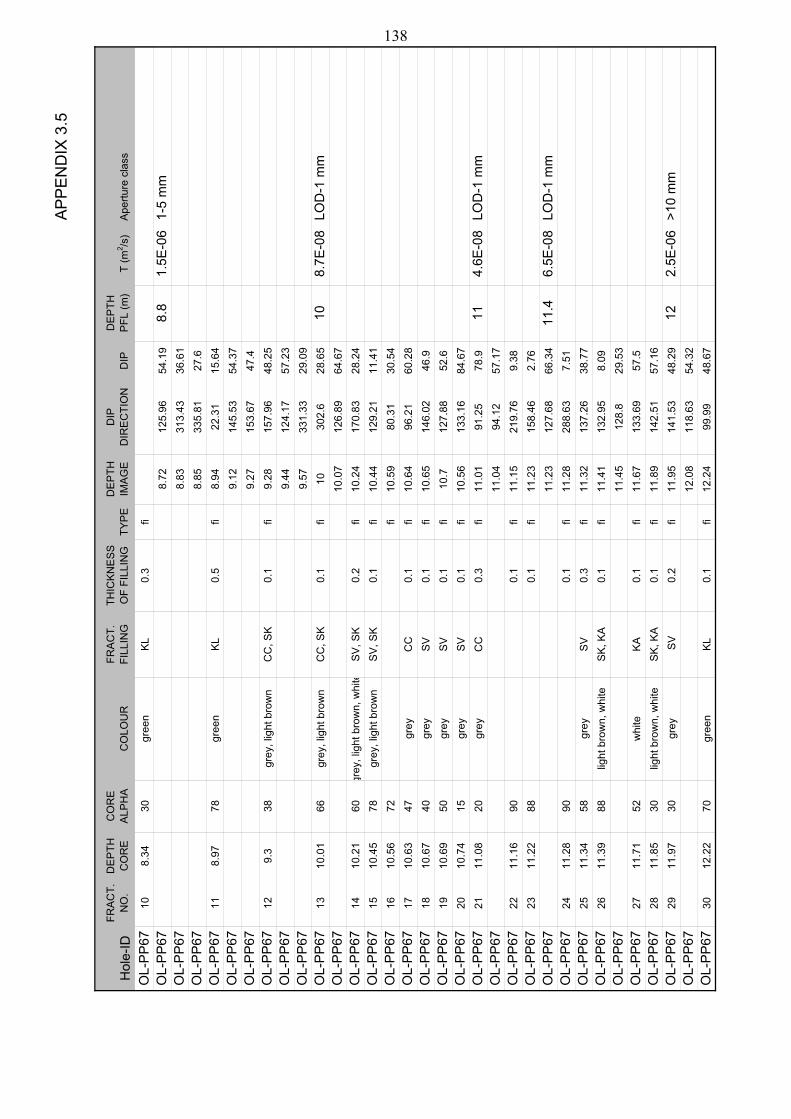
Hol
e-ID
FRA
CT.
N
O.
DE
PTH
C
OR
EC
OR
E
ALP
HA
CO
LOU
RFR
AC
T.
FILL
ING
THIC
KN
ES
S
OF
FILL
ING
TYP
ED
EP
TH
IMA
GE
DIP
D
IRE
CTI
ON
DIP
DE
PTH
PFL
(m)
T (m
2 /s)
Ape
rture
cla
ss
OL-
PP
6710
8.34
30gr
een
KL
0.3
fiO
L-P
P67
8.72
125.
9654
.19
8.8
1.5E
-06
1-5
mm
OL-
PP
678.
8331
3.43
36.6
1O
L-P
P67
8.85
335.
8127
.6O
L-P
P67
118.
9778
gree
nK
L0.
5fi
8.94
22.3
115
.64
OL-
PP
679.
1214
5.53
54.3
7O
L-P
P67
9.27
153.
6747
.4O
L-P
P67
129.
338
grey
, lig
ht b
row
nC
C, S
K0.
1fi
9.28
157.
9648
.25
OL-
PP
679.
4412
4.17
57.2
3O
L-P
P67
9.57
331.
3329
.09
OL-
PP
6713
10.0
166
grey
, lig
ht b
row
nC
C, S
K0.
1fi
1030
2.6
28.6
510
8.7E
-08
LOD
-1 m
mO
L-P
P67
10.0
712
6.89
64.6
7O
L-P
P67
1410
.21
60gr
ey, l
ight
bro
wn,
whi
teS
V, S
K0.
2fi
10.2
417
0.83
28.2
4O
L-P
P67
1510
.45
78gr
ey, l
ight
bro
wn
SV
, SK
0.1
fi10
.44
129.
2111
.41
OL-
PP
6716
10.5
672
fi10
.59
80.3
130
.54
OL-
PP
6717
10.6
347
grey
CC
0.1
fi10
.64
96.2
160
.28
OL-
PP
6718
10.6
740
grey
SV
0.1
fi10
.65
146.
0246
.9O
L-P
P67
1910
.69
50gr
eyS
V0.
1fi
10.7
127.
8852
.6O
L-P
P67
2010
.74
15gr
eyS
V0.
1fi
10.5
613
3.16
84.6
7O
L-P
P67
2111
.08
20gr
eyC
C0.
3fi
11.0
191
.25
78.9
114.
6E-0
8LO
D-1
mm
OL-
PP
6711
.04
94.1
257
.17
OL-
PP
6722
11.1
690
0.1
fi11
.15
219.
769.
38O
L-P
P67
2311
.22
880.
1fi
11.2
315
8.46
2.76
OL-
PP
6711
.23
127.
6866
.34
11.4
6.5E
-08
LOD
-1 m
mO
L-P
P67
2411
.28
900.
1fi
11.2
828
8.63
7.51
OL-
PP
6725
11.3
458
grey
SV
0.3
fi11
.32
137.
2638
.77
OL-
PP
6726
11.3
988
light
bro
wn,
whi
teS
K, K
A0.
1fi
11.4
113
2.95
8.09
OL-
PP
6711
.45
128.
829
.53
OL-
PP
6727
11.7
152
whi
teK
A0.
1fi
11.6
713
3.69
57.5
OL-
PP
6728
11.8
530
light
bro
wn,
whi
teS
K, K
A0.
1fi
11.8
914
2.51
57.1
6O
L-P
P67
2911
.97
30gr
ey S
V0.
2fi
11.9
514
1.53
48.2
912
2.5E
-06
>10
mm
OL-
PP
6712
.08
118.
6354
.32
OL-
PP
6730
12.2
270
gree
nK
L0.
1fi
12.2
499
.99
48.6
7
AP
PE
ND
IX 3
.5138

Hol
e-ID
FRA
CT.
N
O.
DE
PTH
C
OR
EC
OR
E
ALP
HA
CO
LOU
RFR
AC
T.
FILL
ING
THIC
KN
ES
S
OF
FILL
ING
TYP
ED
EP
TH
IMA
GE
DIP
D
IRE
CTI
ON
DIP
DE
PTH
PFL
(m)
T (m
2 /s)
Ape
rture
cla
ss
OL-
PP
6731
12.3
69gr
ey, w
hite
KS
0.2
fi12
.370
.96
27.8
9O
L-P
P67
3212
.39
68gr
een
KL
0.1
fi12
.426
.44
15.7
3O
L-P
P67
3312
.46
68gr
een
KL
0.1
fi12
.46
99.7
822
.94
OL-
PP
6734
12.4
768
gree
nK
L0.
1fi
12.4
793
.33
21.8
OL-
PP
6735
12.5
160
gree
nK
L0.
1fi
12.4
515
8.49
54.5
6O
L-P
P67
3612
.54
68gr
een
KL
0.1
fi12
.53
102.
1823
.81
OL-
PP
6737
12.6
242
ight
bro
wn,
gre
en, g
reS
K, C
C, K
L0.
1fi
12.6
162.
5344
.77
OL-
PP
6738
12.6
772
0.1
fi12
.63
160.
2630
.55
OL-
PP
6712
.926
8.27
87O
L-P
P67
3912
.99
36gr
een,
ligh
t bro
wn
KL,
SK
0.1
fi13
.04
101.
583
.33
OL-
PP
6740
13.1
825
whi
teK
A0.
1fi
13.1
910
6.76
73.8
2O
L-P
P67
4113
.33
28gr
eyC
C0.
1fi
13.3
210
6.1
72.7
9O
L-P
P67
4213
.82
72w
hite
KA
0.1
fi13
.81
55.8
110
.52
13.8
1.1E
-08
LOD
-1 m
mO
L-P
P67
4313
.85
28gr
een
KL
0.1
fi13
.85
354.
7267
.26
OL-
PP
6744
14.1
182
whi
teK
A0.
1fi
14.1
106.
7813
.78
OL-
PP
6745
14.1
370
grey
SV
0.1
fi14
.11
132.
3618
.07
OL-
PP
6746
14.1
826
grey
SV
0.2
fi14
.16
343.
2869
.13
14.1
5.0E
-07
1-5
mm
OL-
PP
6714
.19
333.
0667
.42
OL-
PP
6747
14.2
968
whi
teK
A0.
2fi
14.2
949
.77
29.3
7O
L-P
P67
14.3
426
9.98
86.4
8O
L-P
P67
14.4
173
.99
31.4
4O
L-P
P67
14.5
397
.45
8.04
OL-
PP
6748
14.6
680
grey
SV
0.1
fi14
.65
186.
487.
31O
L-P
P67
4914
.73
88gr
eyS
V0.
2fi
14.7
145
.99.
48O
L-P
P67
5014
.76
68gr
eyS
V0.
1fi
14.7
431
9.29
19.4
6O
L-P
P67
5114
.93
40br
own
SV
0.1
fi14
.930
0.17
41.7
614
.94.
1E-0
71-
5 m
mO
L-P
P67
5215
.49
30gr
ey, l
ight
bro
wn
CC
, SK
0.1
fi15
.47
116.
6959
.23
OL-
PP
6753
15.5
850
grey
SV
0.1
fi15
.55
162.
3242
.93
15.6
1.9E
-08
LOD
-1 m
mO
L-P
P67
5415
.64
35gr
ey, l
ight
bro
wn
CC
, SK
0.2
fi15
.63
142.
7548
.43
OL-
PP
6755
15.7
510
grey
, lig
ht b
row
nC
C, S
K0.
1fi
15.6
225
4.47
84.8
OL-
PP
6756
16.0
850
whi
teK
A0.
1fi
16.0
513
8.21
57.6
4O
L-P
P67
5716
.37
50gr
eyS
V0.
1fi
16.3
810
0.62
40.7
8O
L-P
P67
5816
.43
60gr
eyS
V0.
1fi
16.4
712
0.98
35.8
AP
PE
ND
IX 3
.5139

Hol
e-ID
FRA
CT.
N
O.
DE
PTH
C
OR
EC
OR
E
ALP
HA
CO
LOU
RFR
AC
T.
FILL
ING
THIC
KN
ES
S
OF
FILL
ING
TYP
ED
EP
TH
IMA
GE
DIP
D
IRE
CTI
ON
DIP
DE
PTH
PFL
(m)
T (m
2 /s)
Ape
rture
cla
ss
OL-
PP
6716
.62
99.1
87.0
5O
L-P
P67
5916
.68
50gr
ey, l
ight
bro
wn
SV
, SK
0.1
fi16
.65
124.
3217
.72
16.7
3.1E
-08
LOD
-1 m
mO
L-P
P67
6016
.78
60gr
ey, l
ight
bro
wn
CC
, SK
0.1
fi16
.77
119.
4241
.83
OL-
PP
6761
16.9
270
grey
, lig
ht b
row
nC
C, S
K0.
1fi
16.9
88.5
417
.69
OL-
PP
6762
17.0
140
grey
, lig
ht b
row
nC
C, S
K0.
1fi
16.9
794
.85
44.2
1O
L-P
P67
6317
.16
80w
hite
, lig
ht b
row
nS
K, K
A0.
1fi
17.1
711
4.71
36.9
7O
L-P
P67
6417
.31
80gr
ey, w
hite
CC
, KA
0.3
fi17
.29
142.
5114
.55
OL-
PP
6765
17.4
880
whi
teK
A0.
1fi
17.4
914
5.81
15.0
3O
L-P
P67
6617
.49
85w
hite
KA
0.1
fi17
.51
128.
1727
.79
17.5
6.3E
-08
1-5
mm
OL-
PP
6767
17.5
360
grey
CC
0.1
fi17
.51
128.
1727
.79
OL-
PP
6768
17.6
515
grey
, whi
te, l
ight
bro
wn
CC
, KA
, SK
0.1
fi17
.58
255.
4784
.08
OL-
PP
6717
.68
113.
1837
.95
OL-
PP
6769
17.8
740
gree
n, li
ght b
row
nS
V, S
K0.
1fi
17.8
215
8.65
60.1
4O
L-P
P67
7018
.360
grey
CC
0.4
fi18
.26
156.
4320
.59
18.3
5.9E
-08
LOD
-1 m
mO
L-P
P67
7118
.43
58gr
eyC
C, S
V0.
3fi
18.4
550
.94
13.6
1O
L-P
P67
7218
.575
18.3
712
0.78
56.7
8O
L-P
P67
7318
.738
grey
, lig
ht b
row
nC
C, S
K0.
4fi
18.6
510
9.33
57.7
3O
L-P
P67
18.7
625
8.7
82.9
8O
L-P
P67
7418
.84
30gr
ey, l
ight
bro
wn
CC
, SV
, SK
0.3
fi18
.85
129.
5753
.29
OL-
PP
6775
18.8
828
grey
, lig
ht b
row
nC
C, S
V, S
K0.
3fi
18.8
612
9.89
51.1
9O
L-P
P67
7619
.19
48lig
ht b
row
n, g
rey
SK
, CC
0.1
fi19
.19
146.
7216
.44
OL-
PP
6777
19.2
362
gree
nK
L0.
1fi
19.2
410
6.65
44.3
4O
L-P
P67
7819
.25
68lig
ht b
row
n, g
rey
SK
, CC
0.1
fi19
.23
65.1
931
.919
.31.
0E-0
8LO
D-1
mm
OL-
PP
6779
19.3
10gr
ey, l
ight
bro
wn
SV
, SK
0.1
fi19
.29
89.9
380
.31
OL-
PP
6780
19.3
160
grey
CC
0.1
fi19
.24
120.
2869
.17
OL-
PP
6781
19.3
7gr
eyC
C0.
1fi
19.3
211
6.93
70.0
1O
L-P
P67
8219
.66
38gr
ey, l
ight
bro
wn
CC
, SK
0.1
fi19
.59
105.
1863
.24
OL-
PP
6783
19.7
75
0.1
fi19
.11
144.
0286
.83
OL-
PP
6784
19.9
358
grey
, lig
ht b
row
nC
C, S
K0.
1fi
19.9
115
0.37
57.4
4O
L-P
P67
8519
.98
30gr
ey C
C0.
3fi
19.9
817
8.16
45.9
5O
L-P
P67
8620
.11
48gr
eyC
C0.
3fi
20.1
120
4.95
52.1
1O
L-P
P67
20.2
73.1
615
.62
20.2
2.0E
-08
LOD
-1 m
mO
L-P
P67
8720
.358
grey
, lig
ht b
row
nC
C, S
K0.
1fi
20.2
717
9.2
11.8
6
AP
PE
ND
IX 3
.5140

Hol
e-ID
FRA
CT.
N
O.
DE
PTH
C
OR
EC
OR
E
ALP
HA
CO
LOU
RFR
AC
T.
FILL
ING
THIC
KN
ES
S
OF
FILL
ING
TYP
ED
EP
TH
IMA
GE
DIP
D
IRE
CTI
ON
DIP
DE
PTH
PFL
(m)
T (m
2 /s)
Ape
rture
cla
ss
OL-
PP
6788
20.3
870
grey
, lig
ht b
row
nC
C, S
K0.
1fi
20.4
214
3.14
60.4
3O
L-P
P67
8920
.53
30gr
eyC
C0.
4fi
20.4
714
5.54
15.6
OL-
PP
6790
20.5
880
grey
SV
, CC
0.1
fi20
.51
122.
0615
.46
OL-
PP
6791
20.6
170
grey
, lig
ht b
row
nC
C, S
K0.
1fi
20.5
520
3.92
26.1
820
.64.
9E-0
6>1
0 m
mO
L-P
P67
9220
.73
72w
hite
KA
0.1
fi20
.68
190.
9422
.24
OL-
PP
6720
.71
131.
4119
.01
OL-
PP
6793
20.8
722
light
bro
wn
SK
0.1
fi20
.814
1.19
67.5
4O
L-P
P67
9420
.96
72gr
eyS
V0.
1fi
20.8
919
6.69
1.81
OL-
PP
6795
21.0
388
0.1
fi21
.01
20.6
44.
21O
L-P
P67
21.0
914
0.39
35.3
4O
L-P
P67
9621
.22
850.
1fi
21.1
613
3.76
41.4
21.2
4.5E
-09
belo
w d
etec
tion
limit
(LO
D)
OL-
PP
6797
21.5
50lig
ht b
row
nS
K0.
1fi
21.4
414
0.39
34.5
OL-
PP
6722
.09
109.
5329
.322
.12.
5E-0
8be
low
det
ectio
n lim
it (L
OD
)O
L-P
P67
9822
.17
50w
hite
KA
0.1
fi22
.15
104.
3442
.63
OL-
PP
6799
22.2
659
grey
CC
, KA
0.1
fi22
.211
3.26
47.0
6O
L-P
P67
100
22.7
760
grey
CC
, SK
0.1
fi22
.77
139.
3151
.59
OL-
PP
6710
122
.81
28w
hite
, gre
enK
A, K
L, C
C0.
1fi
22.8
913
5.8
51.4
1O
L-P
P67
102
22.9
922
grey
, bla
ck, l
ight
bro
wn
KL,
SK
, CC
0.1
fi22
.99
145.
2353
.56
OL-
PP
6710
323
.07
780.
1fi
23.0
512
.37
20.2
6O
L-P
P67
104
23.8
530
light
bro
wn
SK
0.1
fi23
.85
118.
6262
OL-
PP
6710
524
.15
0w
hite
KA
0.1
fi24
.32
178.
0881
.57
OL-
PP
681
3.37
40gr
eysv
0.1
fiO
L-P
P68
23.
875
grey
ka0.
1fi
OL-
PP
683
3.88
25gn
, gre
ykl
, sv
0.2
fiO
L-P
P68
44
5gn
, gre
ykl
, sv
0.2
fiO
L-P
P68
54.
3260
grey
ks0.
1fi
OL-
PP
686
5.06
76gr
eyks
0.1
fi5.
0211
8.98
29.2
4O
L-P
P68
75.
0878
grey
ks0.
1fi
5.04
117.
0527
.15
OL-
PP
688
5.11
78gn
, wh
kl, k
s0.
2fi
5.09
103.
1824
.74
OL-
PP
685.
2191
.52
64.8
4O
L-P
P68
5.22
120.
9243
.95
OL-
PP
689
5.25
50gn
, wh
kl, k
s0.
1fi
5.25
136.
6545
.97
AP
PE
ND
IX 3
.5141

Hol
e-ID
FRA
CT.
N
O.
DE
PTH
C
OR
EC
OR
E
ALP
HA
CO
LOU
RFR
AC
T.
FILL
ING
THIC
KN
ES
S
OF
FILL
ING
TYP
ED
EP
TH
IMA
GE
DIP
D
IRE
CTI
ON
DIP
DE
PTH
PFL
(m)
T (m
2 /s)
Ape
rture
cla
ss
OL-
PP
685.
2616
0.6
68.2
3O
L-P
P68
105.
3445
bl, g
rey
kl, k
s0.
1fi
5.34
127.
9953
.51
OL-
PP
6811
5.37
58gr
, gre
ykl
, ks
0.3
fi5.
414
9.75
38.2
7O
L-P
P68
125.
4572
gn, y
ekl
, ka
0.1
fi5.
4515
2.13
20.1
6O
L-P
P68
5.49
156
27.9
6O
L-P
P68
5.52
85.6
25.
99O
L-P
P68
5.55
198.
8619
.46
OL-
PP
685.
5615
0.58
72.0
1O
L-P
P68
135.
7180
wh
ka0.
1fi
5.68
166.
737.
52O
L-P
P68
145.
7848
grey
cc1
fi5.
7812
9.63
14.3
OL-
PP
6815
5.8
55w
hka
0.1
fi5.
811
5.49
49.0
9O
L-P
P68
165.
8840
gnkl
0.1
fi5.
8791
.51
45.9
6O
L-P
P68
176.
0468
grey
cc0.
1fi
5.95
114.
8828
.7O
L-P
P68
186.
0880
wh
ka0.
1fi
612
7.68
44.9
5O
L-P
P68
6.01
128.
0845
.47
OL-
PP
686.
1810
4.58
27.5
6O
L-P
P68
6.2
228.
5613
.99
OL-
PP
686.
2229
5.2
21.0
1O
L-P
P68
196.
3480
wh,
gre
ycc
, ka
0.3
fi6.
2833
6.37
6.07
5-10
mm
OL-
PP
6820
6.4
65gr
ey, l
bcc
, ka,
sk
0.2
fi6.
3799
.47
27.9
7O
L-P
P68
216.
5170
wh,
gre
ycc
v, k
a0.
2fi
6.39
14.9
623
.87
OL-
PP
686.
4335
5.34
32.1
9O
L-P
P68
226.
5550
bl, w
hkl
, ka
0.1
fi6.
5911
5.81
37.8
7.6
1.1E
-08
LOD
- 1
mm
OL-
PP
686.
6533
.53
14.9
9O
L-P
P68
236.
7560
wh
ka0.
1fi
6.75
113.
737
.99
OL-
PP
6824
6.79
74w
hka
0.1
fi6.
8319
3.02
11.3
7O
L-P
P68
256.
9480
gn, w
hka
, kl
0.1
fi6.
9510
4.03
37.8
4O
L-P
P68
267.
08w
hka
0.1
fi7.
0910
8.23
32.6
5O
L-P
P68
277.
18w
hka
0.1
fi7.
1814
4.11
47.9
5O
L-P
P68
7.32
210.
625.
93O
L-P
P68
7.37
79.6
844
.82
OL-
PP
6828
7.5
60w
hka
0.1
fi7.
5211
0.94
36.3
3O
L-P
P68
297.
5160
wh
ka0.
1fi
7.55
117.
8533
.47
AP
PE
ND
IX 3
.5142

Hol
e-ID
FRA
CT.
N
O.
DE
PTH
C
OR
EC
OR
E
ALP
HA
CO
LOU
RFR
AC
T.
FILL
ING
THIC
KN
ES
S
OF
FILL
ING
TYP
ED
EP
TH
IMA
GE
DIP
D
IRE
CTI
ON
DIP
DE
PTH
PFL
(m)
T (m
2 /s)
Ape
rture
cla
ss
OL-
PP
687.
6311
2.29
44.5
3O
L-P
P68
7.68
122.
8529
.92
OL-
PP
6830
7.73
80w
hka
op7.
7726
6.01
11.9
2O
L-P
P68
318.
2837
0.1
fi8.
3235
9.63
53.8
8O
L-P
P68
8.32
65.3
783
.92
OL-
PP
688.
4512
8.42
44.5
OL-
PP
689.
1313
9.69
78.7
3O
L-P
P68
9.93
298.
2211
.12
OL-
PP
6810
.58
122.
8856
.93
OL-
PP
6810
.67
121.
3449
.44
OL-
PP
6832
10.6
684
wh
ka0.
3fi
10.6
913
5.57
1.48
11.7
1.2E
-06
LOD
- 1
mm
OL-
PP
6833
10.6
9w
hka
0.1
fi10
.725
9.24
5.04
OL-
PP
6834
10.7
1w
hka
0.1
fi10
.713
2.55
45.9
9O
L-P
P68
10.7
211
3.77
19.9
1O
L-P
P68
10.7
426
9.39
2.47
OL-
PP
6810
.74
142.
4546
.93
OL-
PP
6810
.81
159.
0954
.58
OL-
PP
6811
.43
133.
1957
.53
OL-
PP
6811
.68
329.
5539
.32
12.6
3.1E
-09
LOD
- 1
mm
OL-
PP
6811
.76
132.
0350
.82
OL-
PP
6811
.87
142.
3357
.67
OL-
PP
6812
.07
115.
0562
.77
OL-
PP
6812
.23
106.
6551
.54
OL-
PP
6835
12.2
988
wh
ka0.
1fi
12.3
231
7.01
10.2
5O
L-P
P68
12.3
333
4.11
8.58
OL-
PP
6812
.38
109.
3366
.07
OL-
PP
6836
12.6
40w
hka
0.1
fi12
.65
347.
9354
.07
13.6
7.0E
-08
LOD
- 1
mm
OL-
PP
6837
12.6
728
wh
ka0.
1fi
12.7
420
0.68
71.6
3O
L-P
P68
3812
.98
10w
h, g
rey,
lbcc
, ka,
sk
3fi
13.4
120
5.82
81.9
814
.13.
8E-0
7LO
D -
1 m
mO
L-P
P68
3913
.17
80w
hka
0.1
fi13
.21
295.
96.
15O
L-P
P68
4013
.530
wh
ka0.
1fi
13.5
341.
5766
.46
OL-
PP
6841
13.6
540
wh
ka0.
2fi
13.5
835
2.41
53.5
4O
L-P
P68
4213
.63
78w
hka
0.1
fi13
.51.
4851
.95
AP
PE
ND
IX 3
.5143

Hol
e-ID
FRA
CT.
N
O.
DE
PTH
C
OR
EC
OR
E
ALP
HA
CO
LOU
RFR
AC
T.
FILL
ING
THIC
KN
ES
S
OF
FILL
ING
TYP
ED
EP
TH
IMA
GE
DIP
D
IRE
CTI
ON
DIP
DE
PTH
PFL
(m)
T (m
2 /s)
Ape
rture
cla
ss
OL-
PP
6843
13.6
680
wh
ka0.
1fi
13.6
772
.08
25.2
314
.71.
1E-0
6LO
D -
1 m
mO
L-P
P68
13.7
428
3.27
19.1
6O
L-P
P68
13.7
510
9.52
47.4
OL-
PP
6813
.76
45.6
612
.59
OL-
PP
6844
13.8
472
grey
cc, k
a3
fi13
.83
270.
4623
.83
OL-
PP
6845
13.8
978
grey
ks0.
1fi
13.8
989
.67
13.0
4O
L-P
P68
4614
.01
64w
h, lb
ka, s
k0.
1fi
1430
0.28
29.0
1O
L-P
P68
4714
.14
75gr
eycc
0.1
fi14
.11
325.
4621
.18
OL-
PP
6814
.210
7.84
35.1
8O
L-P
P68
4814
.28
70w
h, lb
ka, s
k0.
1fi
14.2
631
9.68
17.7
4O
L-P
P68
14.5
719
7.69
73.4
8O
L-P
P68
4914
.72
74gr
ey, l
bcc
, sk
0.1
fi14
.799
.15
11.5
15.8
2.6E
-09
LOD
- 1
mm
OL-
PP
6850
14.7
880
grey
, lb
cc, s
k0.
1fi
14.7
631
9.07
11.1
OL-
PP
6814
.96
234.
4968
.67
OL-
PP
6851
14.9
876
grey
, lb
cc, s
k0.
1fi
14.9
622
6.8
22.0
4O
L-P
P68
15.1
411
8.77
51.0
5O
L-P
P68
5215
.26
800.
1op
15.2
511
2.61
33.2
8O
L-P
P68
5315
.76
75w
hka
0.1
fi15
.74
272.
5213
.79
OL-
PP
6854
15.7
775
wh
ka0.
1fi
15.7
625
3.99
10.8
116
.71.
9E-0
7be
low
det
ectio
n lim
it (L
OD
)O
L-P
P68
15.9
311
2.73
49.0
7O
L-P
P68
5516
.02
64gr
ey, l
bcc
, sk
0.1
fi16
.02
91.5
32.0
4O
L-P
P68
16.5
614
4.88
27.0
417
.57.
7E-0
9be
low
det
ectio
n lim
it (L
OD
)O
L-P
P68
5616
.775
grey
, lb
cc, s
k0.
1fi
16.6
714
0.03
26.4
5O
L-P
P68
5716
.76
77w
hka
0.3
fi16
.76
127.
428
.06
OL-
PP
6858
17.1
220
grey
, lb
ks, s
k0.
1fi
16.9
913
1.58
80.9
218
.18.
2E-0
8LO
D -
1 m
mO
L-P
P68
5917
.31
800.
1fi
17.2
890
.91
36.2
4O
L-P
P68
6017
.43
42bl
, lb,
gre
ykl
, sk,
cc
0.1
fi17
.36
97.1
653
.69
OL-
PP
6817
.48
102
74.1
8O
L-P
P68
6117
.59
10bl
, lb,
gre
ykl
, sk
0.2
fi17
.52
265.
2579
.46
OL-
PP
6817
.64
17.3
615
.66
OL-
PP
6862
17.9
780
grey
, lb
cc, s
k0.
1fi
17.9
625
7.45
17.2
1O
L-P
P68
6318
.02
80w
hka
0.3
fi18
216.
297.
42O
L-P
P68
6418
.03
78w
hka
0.1
fi18
.01
11.9
818
.1
AP
PE
ND
IX 3
.5144

Hol
e-ID
FRA
CT.
N
O.
DE
PTH
C
OR
EC
OR
E
ALP
HA
CO
LOU
RFR
AC
T.
FILL
ING
THIC
KN
ES
S
OF
FILL
ING
TYP
ED
EP
TH
IMA
GE
DIP
D
IRE
CTI
ON
DIP
DE
PTH
PFL
(m)
T (m
2 /s)
Ape
rture
cla
ss
OL-
PP
6865
18.0
578
wh,
lbka
, sk
0.1
fi18
.04
67.0
229
.22
OL-
PP
6866
18.1
670
bl, w
hkl
, ka
0.2
fi18
.09
112.
7421
.84
OL-
PP
6867
18.3
867
grey
cc0.
1fi
18.3
129
2.87
21.9
8O
L-P
P68
6818
.51
84gr
eycc
0.3
fi18
.44
333.
684.
37O
L-P
P68
6818
.665
wh
ka0.
1fi
18.5
211
4.7
60.0
3O
L-P
P68
6918
.72
30bl
, lb
kl, s
k0.
1fi
18.6
294
.52
73.6
1O
L-P
P68
7018
.86
18lb
sk0.
1fi
18.7
583
.99
69.8
119
.52.
4E-0
71-
>5 m
mO
L-P
P68
18.8
911
4.29
52.1
OL-
PP
6871
18.9
778
grey
, lb
cc, s
k0.
1fi
18.9
396
.79
17.5
4O
L-P
P68
19.1
93.1
835
.87
OL-
PP
6819
.11
70.1
87.8
9O
L-P
P68
7219
.26
48gr
ey, b
lcc
, gr
0.1
fi19
.21
115.
0647
.62
20.1
1.5E
-07
belo
w d
etec
tion
limit
(LO
D)
OL-
PP
6819
.24
96.3
446
.83
OL-
PP
6873
19.5
410
bl, g
rey
kl, c
c0.
1fi
19.4
712
1.52
73.5
220
.61.
3E-0
7LO
D -
1 m
mO
L-P
P68
7419
.58
30bl
, cc,
sk
kl, c
c, s
k0.
1fi
19.4
712
1.52
75.4
9O
L-P
P68
7519
.68
52gr
eycc
0.2
fi19
.63
125.
4354
.18
OL-
PP
6876
19.7
860
grey
cc0.
4fi
19.7
332
1.36
36.7
4O
L-P
P68
7719
.85
30gr
ey, b
l, lb
cc, k
l, sk
0.1
fi19
.78
103.
7160
.14
OL-
PP
6878
19.8
770
grey
, lb
cc, s
k0.
1fi
19.7
961
.31
10.3
4O
L-P
P68
7919
.91
42lb
, wh
sk, k
a0.
1fi
19.8
110
3.42
15.9
6O
L-P
P68
8019
.97
50bl
, lb
gr, s
k, k
l0.
1fi
19.9
125.
3637
.89
OL-
PP
6819
.92
127.
9542
.74
OL-
PP
6819
.96
120.
2560
.34
OL-
PP
6820
.03
122.
5855
.37
OL-
PP
6881
20.1
928
lbsk
, gr
0.1
fi20
.11
123.
5265
.05
OL-
PP
6882
20.6
823
lb, w
hka
, sk
0.1
fi20
.63
108.
7368
.84
OL-
PP
6883
20.9
486
grey
, wh
cc, s
k0.
5fi
20.8
719
4.12
7.83
21.8
9.8E
-08
1->5
mm
OL-
PP
6884
21.0
780
wh
cc, k
a0.
4fi
2130
5.87
16.7
7O
L-P
P68
21.2
434
9.52
62.0
5O
L-P
P68
21.7
599
.82
67.2
5O
L-P
P68
8522
.31
68gr
eycc
, sk
0.3
fi22
.24
145.
8722
.99
OL-
PP
6886
22.5
60bl
, gre
ykl
, ka
0.1
fi22
.46
113.
1722
.16
OL-
PP
6887
22.6
680
grey
cc, k
a0.
1fi
22.6
195.
510
.42
23.5
7.0E
-08
LOD
- 1
mm
AP
PE
ND
IX 3
.5145
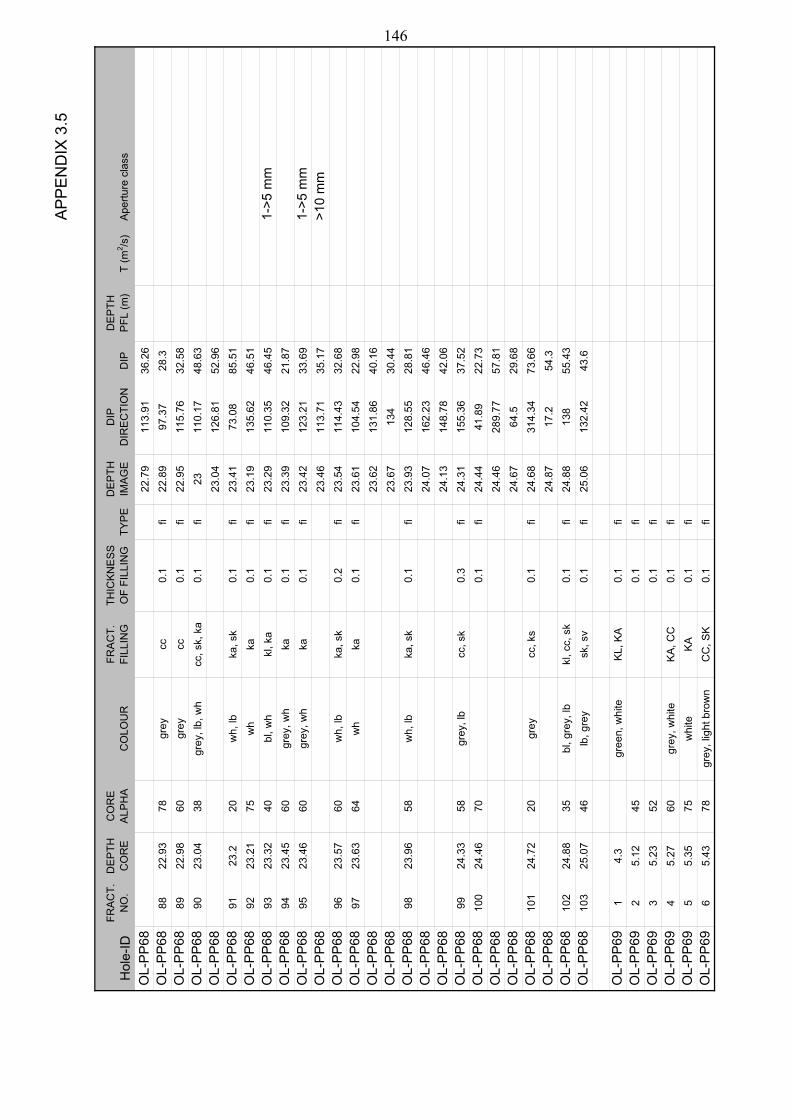
Hol
e-ID
FRA
CT.
N
O.
DE
PTH
C
OR
EC
OR
E
ALP
HA
CO
LOU
RFR
AC
T.
FILL
ING
THIC
KN
ES
S
OF
FILL
ING
TYP
ED
EP
TH
IMA
GE
DIP
D
IRE
CTI
ON
DIP
DE
PTH
PFL
(m)
T (m
2 /s)
Ape
rture
cla
ss
OL-
PP
6822
.79
113.
9136
.26
OL-
PP
6888
22.9
378
grey
cc0.
1fi
22.8
997
.37
28.3
OL-
PP
6889
22.9
860
grey
cc0.
1fi
22.9
511
5.76
32.5
8O
L-P
P68
9023
.04
38gr
ey, l
b, w
hcc
, sk,
ka
0.1
fi23
110.
1748
.63
OL-
PP
6823
.04
126.
8152
.96
OL-
PP
6891
23.2
20w
h, lb
ka, s
k0.
1fi
23.4
173
.08
85.5
1O
L-P
P68
9223
.21
75w
hka
0.1
fi23
.19
135.
6246
.51
OL-
PP
6893
23.3
240
bl, w
hkl
, ka
0.1
fi23
.29
110.
3546
.45
1->5
mm
OL-
PP
6894
23.4
560
grey
, wh
ka0.
1fi
23.3
910
9.32
21.8
7O
L-P
P68
9523
.46
60gr
ey, w
hka
0.1
fi23
.42
123.
2133
.69
1->5
mm
OL-
PP
6823
.46
113.
7135
.17
>10
mm
OL-
PP
6896
23.5
760
wh,
lbka
, sk
0.2
fi23
.54
114.
4332
.68
OL-
PP
6897
23.6
364
wh
ka0.
1fi
23.6
110
4.54
22.9
8O
L-P
P68
23.6
213
1.86
40.1
6O
L-P
P68
23.6
713
430
.44
OL-
PP
6898
23.9
658
wh,
lbka
, sk
0.1
fi23
.93
128.
5528
.81
OL-
PP
6824
.07
162.
2346
.46
OL-
PP
6824
.13
148.
7842
.06
OL-
PP
6899
24.3
358
grey
, lb
cc, s
k0.
3fi
24.3
115
5.36
37.5
2O
L-P
P68
100
24.4
670
0.1
fi24
.44
41.8
922
.73
OL-
PP
6824
.46
289.
7757
.81
OL-
PP
6824
.67
64.5
29.6
8O
L-P
P68
101
24.7
220
grey
cc, k
s0.
1fi
24.6
831
4.34
73.6
6O
L-P
P68
24.8
717
.254
.3O
L-P
P68
102
24.8
835
bl, g
rey,
lbkl
, cc,
sk
0.1
fi24
.88
138
55.4
3O
L-P
P68
103
25.0
746
lb, g
rey
sk, s
v0.
1fi
25.0
613
2.42
43.6
OL-
PP
691
4.3
gree
n, w
hite
KL,
KA
0.1
fiO
L-P
P69
25.
1245
0.1
fiO
L-P
P69
35.
2352
0.1
fiO
L-P
P69
45.
2760
grey
, whi
teK
A, C
C0.
1fi
OL-
PP
695
5.35
75w
hite
KA
0.1
fiO
L-P
P69
65.
4378
grey
, lig
ht b
row
nC
C, S
K0.
1fi
AP
PE
ND
IX 3
.5146

Hol
e-ID
FRA
CT.
N
O.
DE
PTH
C
OR
EC
OR
E
ALP
HA
CO
LOU
RFR
AC
T.
FILL
ING
THIC
KN
ES
S
OF
FILL
ING
TYP
ED
EP
TH
IMA
GE
DIP
D
IRE
CTI
ON
DIP
DE
PTH
PFL
(m)
T (m
2 /s)
Ape
rture
cla
ss
OL-
PP
695.
8313
4.2
21.6
4O
L-P
P69
75.
9177
whi
te, l
ight
bro
wn
KA
, SK
0.1
fi5.
8925
.11
31.7
9O
L-P
P69
5.94
130.
9725
.95
OL-
PP
698
6.03
56lig
ht b
row
n, g
rey
SK
, SV
0.1
fi6.
0310
8.02
30.7
9O
L-P
P69
6.19
147.
1377
.61
OL-
PP
699
6.24
42w
hite
, lig
ht b
row
nK
A, S
K0.
1fi
6.24
140.
3738
.24
OL-
PP
6910
6.4
60w
hite
, gre
yK
A, C
C0.
1fi
6.4
165.
2726
.38
OL-
PP
6911
6.53
72w
hite
KA
0.1
fi6.
5312
1.08
28.7
4O
L-P
P69
126.
7152
whi
teK
A0.
1fi
6.72
158.
1937
.51
OL-
PP
6913
6.83
50gr
ey, l
ight
bro
wn
CC
, SK
0.1
fi6.
8314
7.74
38.9
3O
L-P
P69
6.87
121.
5644
.61
OL-
PP
6914
6.93
58w
hite
KA
0.1
fi6.
9313
9.44
34.9
4O
L-P
P69
156.
9772
light
bro
wn,
gre
yS
K, C
C0.
1fi
6.96
138.
6127
.36
OL-
PP
697.
0317
5.86
36.9
1O
L-P
P69
167.
0869
whi
te, g
rey
KS
0.1
fi7.
0713
0.91
29.5
16.
93.
3E-0
71-
5 m
mO
L-P
P69
7.07
317.
0638
.99
OL-
PP
6917
7.14
88w
hite
KA
0.1
fi7.
1423
0.32
21.5
2O
L-P
P69
187.
1842
ight
bro
wn,
bla
ck, g
rey
SK
, KL,
CC
0.1
fi7.
1813
0.91
39.5
1O
L-P
P69
197.
2425
blac
k, li
ght b
row
n, g
rey
KL,
SK
, SV
0.1
fi7.
2610
9.54
66.0
2O
L-P
P69
207.
2844
grey
, lig
ht b
row
nC
C, S
K0.
1fi
7.26
155.
2139
.21
OL-
PP
6921
7.38
48bl
ack,
gre
yK
L, S
V0.
1fi
7.39
135.
1214
.18
OL-
PP
6922
7.48
60w
hite
KA
0.1
fi7.
4810
2.13
20.5
8O
L-P
P69
7.5
95.4
77.7
15-
10 m
mO
L-P
P69
237.
5525
grey
SV
0.4
grfi
7.53
94.4
865
.34
7.2
3.6E
-08
5-10
mm
OL-
PP
6924
7.68
30gr
eyS
V0.
2fi
7.72
9472
.42
OL-
PP
6925
7.89
30bl
ack,
ligh
t bro
wn
KL,
SK
, SV
0.1
fi7.
8695
.69
70.6
6O
L-P
P69
268.
0785
whi
teK
A0.
1fi
8.07
134.
9113
.03
OL-
PP
6927
8.12
88w
hite
KA
0.1
fi8.
1133
3.27
2.79
OL-
PP
6928
8.17
62gr
een,
gre
yS
K, S
V0.
1fi
8.17
126.
6227
.28
OL-
PP
6929
8.25
25lig
ht b
row
n, g
rey
SK
, CC
0.1
fi8.
2313
7.76
56.2
3O
L-P
P69
308.
3172
grey
, lig
ht b
row
nS
V, S
K0.
1fi
8.3
151.
726
.29
OL-
PP
6931
8.42
80gr
ey, w
hite
KS
0.1
fi8.
4119
7.94
3.61
OL-
PP
6932
8.51
50gr
ey, w
hite
KS
0.1
fi8.
4913
6.52
49.2
88.
38.
3E-0
8LO
D -
1 m
m
AP
PE
ND
IX 3
.5147

Hol
e-ID
FRA
CT.
N
O.
DE
PTH
C
OR
EC
OR
E
ALP
HA
CO
LOU
RFR
AC
T.
FILL
ING
THIC
KN
ES
S
OF
FILL
ING
TYP
ED
EP
TH
IMA
GE
DIP
D
IRE
CTI
ON
DIP
DE
PTH
PFL
(m)
T (m
2 /s)
Ape
rture
cla
ss
OL-
PP
698.
5420
7.51
10.5
2O
L-P
P69
8.55
172.
6422
.77
OL-
PP
698.
6314
7.11
33.8
8O
L-P
P69
339.
0888
whi
teK
A0.
1fi
9.06
81.2
5.11
OL-
PP
6934
9.15
86w
hite
KA
0.1
fi9.
1214
9.71
7.28
OL-
PP
699.
3911
4.79
21.8
1O
L-P
P69
359.
6165
whi
te, l
ight
bro
wn
KA
, SK
0.1
fi9.
5926
8.62
21.4
9O
L-P
P69
369.
785
grey
, sv
KS
0.3
fi9.
6827
2.82
11.6
3O
L-P
P69
379.
7385
whi
te, g
rey,
gre
enK
S0.
1fi
9.71
110.
1419
.44
9.5
1.8E
-06
5-10
mm
OL-
PP
6938
9.77
70w
hite
, lig
ht b
row
nK
A, S
K0.
1fi
9.74
254.
48.
43O
L-P
P69
399.
9780
whi
te, l
ight
bro
wn
KA
, SK
0.1
fi9.
9812
4.92
66.6
39.
88.
9E-0
8LO
D -
1 m
mO
L-P
P69
10.0
312
1.75
43.1
9O
L-P
P69
10.1
511
6.63
14.1
1O
L-P
P69
10.3
310
1.4
54.7
6O
L-P
P69
4010
.45
80w
hite
KA
0.1
fi10
.47
191.
2215
.07
OL-
PP
6941
10.5
678
whi
teK
A0.
1fi
10.5
514
1.75
9.78
OL-
PP
6942
10.5
878
whi
teK
A0.
2fi
10.5
713
1.23
14.6
610
.48.
4E-0
8LO
D -
1 m
mO
L-P
P69
4310
.61
82w
hite
KA
0.1
fi10
.59
67.6
78.
29O
L-P
P69
4410
.768
whi
teK
A0.
1fi
10.6
815
7.26
29.0
7O
L-P
P69
4510
.76
68w
hite
KA
0.4
fi10
.75
163.
3418
.83
OL-
PP
6910
.89
204.
1819
.29
OL-
PP
6911
.03
125.
9258
.31
OL-
PP
6911
.22
138.
0442
.11
OL-
PP
6911
.23
94.3
611
.9O
L-P
P69
4611
.38
48w
hite
KA
0.1
fi11
.36
158.
3937
.04
11.1
9.3E
-08
LOD
- 1
mm
OL-
PP
6911
.614
3.43
78.5
5O
L-P
P69
4711
.77
55lig
ht b
row
n, g
rey
SK
, CC
0.2
fi11
.75
138.
2436
.23
OL-
PP
6948
11.8
660
whi
teK
A0.
1fi
11.8
310
7.12
22.7
211
.79.
7E-0
8LO
D -
1 m
mO
L-P
P69
4912
.09
46gr
ey, l
ight
bro
wn
GR
, SK
0.1
fi12
.05
180.
4547
.11
OL-
PP
6912
.17
93.5
824
.11
OL-
PP
6950
12.2
168
whi
teK
A0.
1fi
12.1
911
0.99
28.4
8O
L-P
P69
12.3
232
1.51
19.5
5O
L-P
P69
12.4
712
7.71
21.1
912
.33.
9E-0
7LO
D -
1 m
m
AP
PE
ND
IX 3
.5148

Hol
e-ID
FRA
CT.
N
O.
DE
PTH
C
OR
EC
OR
E
ALP
HA
CO
LOU
RFR
AC
T.
FILL
ING
THIC
KN
ES
S
OF
FILL
ING
TYP
ED
EP
TH
IMA
GE
DIP
D
IRE
CTI
ON
DIP
DE
PTH
PFL
(m)
T (m
2 /s)
Ape
rture
cla
ss
OL-
PP
6951
12.8
745
whi
teK
A0.
1fi
12.8
413
2.28
43.2
8O
L-P
P69
13.1
315
0.06
88.7
1O
L-P
P69
13.3
511
0.47
59.3
8O
L-P
P69
13.5
417
7.66
43.6
2O
L-P
P69
5213
.66
45w
hite
KA
0.1
fi13
.66
147.
2746
.45
13.4
1.9E
-09
belo
w d
etec
tion
limit
(LO
D)
OL-
PP
6953
13.8
950
grey
, lig
ht b
row
nC
C, S
K0.
1fi
13.8
719
5.63
31.7
8O
L-P
P69
14.1
919
5.74
76.7
5O
L-P
P69
14.6
114
6.74
8.58
OL-
PP
6914
.82
158.
2221
.114
.75.
9E-0
9LO
D -
1 m
mO
L-P
P69
15.3
316
6.34
37.4
2O
L-P
P69
15.8
717
2.52
18.3
3O
L-P
P69
15.9
214
0.6
34.3
9O
L-P
P69
15.9
233
7.89
57.5
6O
L-P
P69
5416
.17
50w
hite
KA
0.1
fi16
.13
111.
2422
.53
OL-
PP
6955
16.2
420
whi
teK
A0.
3fi
16.2
417
0.12
79.0
616
1.1E
-07
LOD
- 1
mm
OL-
PP
6956
16.5
7w
hite
KA
0.1
fi16
.52
134.
4646
.01
OL-
PP
6957
16.6
480
whi
teK
A0.
1fi
16.6
315
2.73
24.3
3O
L-P
P69
16.7
410
5.67
15.1
8O
L-P
P69
5816
.95
whi
teK
A0.
1fi
16.8
935
8.22
83.3
5O
L-P
P69
17.1
415
9.11
29.4
9O
L-P
P69
17.3
910
6.46
28.1
7O
L-P
P69
17.5
890
.16
59.6
3O
L-P
P69
5917
.72
20gr
ey, l
ight
bro
wn
SK
, SV
0.1
fi17
.711
4.02
66.2
7O
L-P
P69
6017
.86
80w
hite
KA
0.1
fi17
.86
138.
1339
.35
OL-
PP
6961
17.9
650
grey
SV
0.1
fi17
.94
157.
5940
.99
OL-
PP
6962
18.0
972
whi
teK
A0.
1fi
18.1
101.
312
.46
OL-
PP
6963
18.1
478
light
bro
wn,
whi
teS
K, K
A0.
1fi
18.1
373
.03
13.4
218
2.2E
-08
LOD
- 1
mm
OL-
PP
6964
18.3
435
ight
bro
wn,
bla
ck, g
rey
SK
, KL
0.1
fi18
.33
74.2
560
.22
18.3
3.5E
-08
LOD
- 1
mm
OL-
PP
6965
18.8
88gr
eyK
S0.
1fi
18.8
234.
518.
76O
L-P
P69
18.9
100.
0534
.07
OL-
PP
6966
19.0
168
whi
te, l
ight
bro
wn
KA
, SK
0.1
fi19
92.0
323
.34
18.8
5.0E
-08
LOD
- 1
mm
OL-
PP
6919
.29
352.
0452
.63
OL-
PP
6919
.55
83.9
913
.18
19.3
8.1E
-08
1-5
mm
AP
PE
ND
IX 3
.5149

Hol
e-ID
FRA
CT.
N
O.
DE
PTH
C
OR
EC
OR
E
ALP
HA
CO
LOU
RFR
AC
T.
FILL
ING
THIC
KN
ES
S
OF
FILL
ING
TYP
ED
EP
TH
IMA
GE
DIP
D
IRE
CTI
ON
DIP
DE
PTH
PFL
(m)
T (m
2 /s)
Ape
rture
cla
ss
OL-
PP
6920
.03
139.
5239
.74
OL-
PP
6920
.18
201.
619
.97
20.1
3.1E
-07
LOD
- 1
mm
OL-
PP
6967
20.3
978
grey
, lig
ht b
row
nS
K, S
V0.
1fi
20.4
114
1.49
28.2
5O
L-P
P69
20.5
615
2.23
16.8
8O
L-P
P69
20.5
914
2.67
16.0
9O
L-P
P69
20.6
210
5.37
18.8
5O
L-P
P69
6820
.76
88w
hite
KA
0.1
fi20
.713
0.42
41.6
220
.52.
1E-0
7LO
D -
1 m
mO
L-P
P69
6920
.84
50bl
ack,
gre
yK
L, C
C0.
1fi
20.8
212
4.43
45.2
5O
L-P
P69
7020
.91
70gr
ey, l
ight
bro
wn
CC
, SK
0.1
fi20
.92
132.
8340
.98
OL-
PP
6971
21.1
150
blac
k, g
rey
KL,
GR
0.2
fi21
.03
106.
0333
.89
OL-
PP
6972
21.1
728
blac
k, g
rey
KL,
SV
0.1
fi21
.09
73.3
165
.86
218.
8E-0
81-
5 m
mO
L-P
P69
21.3
699
.68
65.8
15-
10 m
mO
L-P
P69
21.4
211
9.16
59.9
9O
L-P
P69
21.7
212
0.96
7.11
OL-
PP
6973
22.0
878
whi
teK
A0.
1fi
22.1
137.
7618
.55
OL-
PP
6974
22.2
70w
hite
, gre
yK
A, C
C0.
1fi
22.1
617
7.44
30.7
8O
L-P
P69
7522
.27
84w
hite
, lig
ht b
row
nK
A, S
K0.
1fi
22.2
811
0.74
13.6
7O
L-P
P69
7622
.32
64w
hite
KA
0.1
fi22
.31
62.8
530
.12
OL-
PP
6922
.413
4.37
20.8
5O
L-P
P69
22.5
910
5.23
16.3
OL-
PP
6922
.95
80.9
781
.09
OL-
PP
6977
2378
gree
nK
L0.
1fi
23.0
215
9.39
3.54
22.9
7.00
E-0
7LO
D -
1 m
mO
L-P
P69
7823
.01
80gr
een
KL
0.1
fi23
.03
355.
564.
51O
L-P
P69
7923
.41
48gr
eyS
V0.
2fi
23.3
992
.79
40.5
5O
L-P
P69
8023
.49
68lig
ht b
row
nS
K0.
1fi
23.4
610
0.37
25.9
4O
L-P
P69
8123
.93
45gr
ey, l
ight
bro
wn
SV
, SK
0.1
fi23
.95
93.7
751
.81
OL-
PP
6982
24.4
156
whi
teK
A0.
1fi
24.4
411
5.63
36.7
OL-
PP
6924
.62
271.
7423
.57
OL-
PP
6925
.01
211.
067.
34
AP
PE
ND
IX 3
.5150
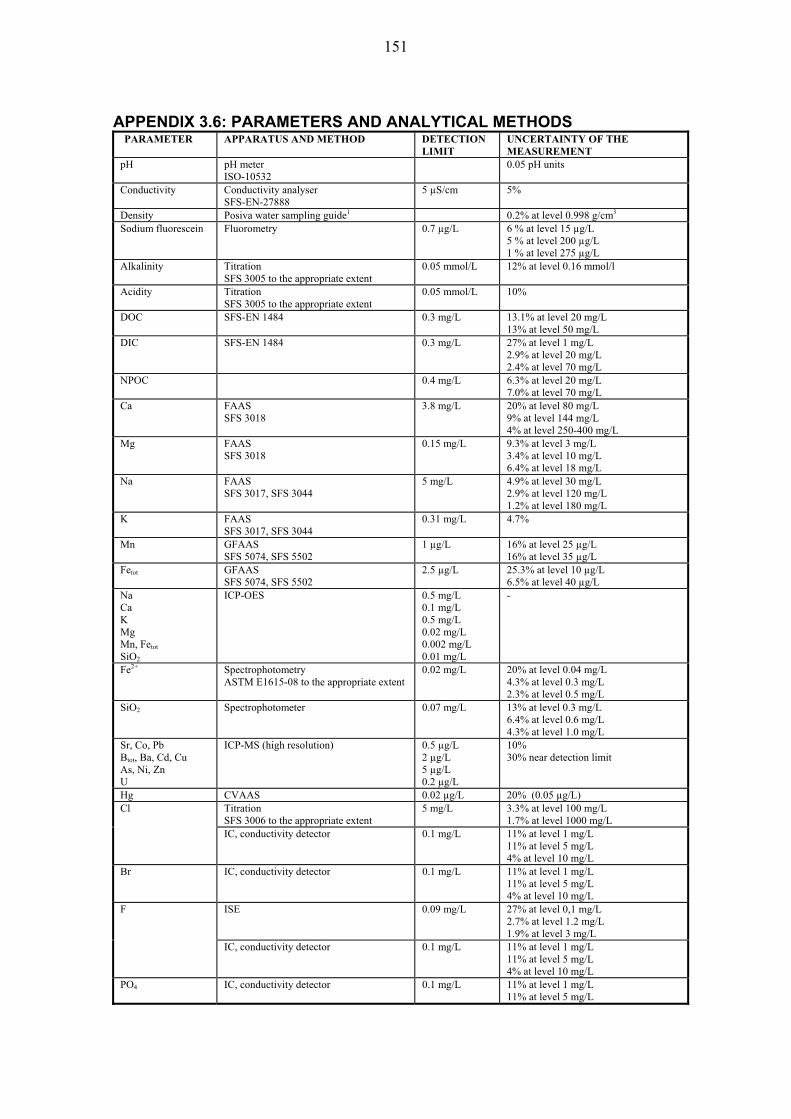
151
APPENDIX 3.6: PARAMETERS AND ANALYTICAL METHODS PARAMETER APPARATUS AND METHOD DETECTION
LIMIT UNCERTAINTY OF THE MEASUREMENT
pH pH meter ISO-10532
0.05 pH units
Conductivity Conductivity analyser SFS-EN-27888
5 μS/cm 5%
Density Posiva water sampling guide1 0.2% at level 0.998 g/cm3
Sodium fluorescein Fluorometry 0.7 μg/L 6 % at level 15 μg/L 5 % at level 200 μg/L 1 % at level 275 μg/L
Alkalinity Titration SFS 3005 to the appropriate extent
0.05 mmol/L 12% at level 0.16 mmol/l
Acidity Titration SFS 3005 to the appropriate extent
0.05 mmol/L 10%
DOC SFS-EN 1484 0.3 mg/L
13.1% at level 20 mg/L 13% at level 50 mg/L
DIC SFS-EN 1484 0.3 mg/L 27% at level 1 mg/L 2.9% at level 20 mg/L 2.4% at level 70 mg/L
NPOC 0.4 mg/L 6.3% at level 20 mg/L 7.0% at level 70 mg/L
Ca FAAS SFS 3018
3.8 mg/L
20% at level 80 mg/L 9% at level 144 mg/L 4% at level 250-400 mg/L
Mg FAAS SFS 3018
0.15 mg/L 9.3% at level 3 mg/L 3.4% at level 10 mg/L 6.4% at level 18 mg/L
Na
FAAS SFS 3017, SFS 3044
5 mg/L
4.9% at level 30 mg/L 2.9% at level 120 mg/L 1.2% at level 180 mg/L
K FAAS SFS 3017, SFS 3044
0.31 mg/L 4.7%
Mn GFAAS SFS 5074, SFS 5502
1 μg/L 16% at level 25 μg/L 16% at level 35 μg/L
Fetot GFAAS SFS 5074, SFS 5502
2.5 μg/L 25.3% at level 10 μg/L 6.5% at level 40 μg/L
Na Ca K Mg Mn, Fetot
SiO2
ICP-OES 0.5 mg/L 0.1 mg/L 0.5 mg/L 0.02 mg/L 0.002 mg/L 0.01 mg/L
-
Fe2+ Spectrophotometry ASTM E1615-08 to the appropriate extent
0.02 mg/L 20% at level 0.04 mg/L 4.3% at level 0.3 mg/L 2.3% at level 0.5 mg/L
SiO2 Spectrophotometer 0.07 mg/L 13% at level 0.3 mg/L 6.4% at level 0.6 mg/L 4.3% at level 1.0 mg/L
Sr, Co, Pb Btot, Ba, Cd, Cu As, Ni, Zn U
ICP-MS (high resolution) 0.5 μg/L 2 μg/L 5 μg/L 0.2 μg/L
10% 30% near detection limit
Hg CVAAS 0.02 μg/L 20% (0.05 μg/L) Cl Titration
SFS 3006 to the appropriate extent 5 mg/L 3.3% at level 100 mg/L
1.7% at level 1000 mg/L IC, conductivity detector 0.1 mg/L 11% at level 1 mg/L
11% at level 5 mg/L 4% at level 10 mg/L
Br IC, conductivity detector 0.1 mg/L 11% at level 1 mg/L 11% at level 5 mg/L 4% at level 10 mg/L
F ISE 0.09 mg/L 27% at level 0,1 mg/L 2.7% at level 1.2 mg/L 1.9% at level 3 mg/L
IC, conductivity detector 0.1 mg/L 11% at level 1 mg/L 11% at level 5 mg/L 4% at level 10 mg/L
PO4 IC, conductivity detector 0.1 mg/L 11% at level 1 mg/L 11% at level 5 mg/L

152
PARAMETER APPARATUS AND METHOD DETECTION LIMIT
UNCERTAINTY OF THE MEASUREMENT 4% at level 10 mg/L
S2- Spectrophotometer SFS 3038
0.02 mg/L 40% at level 0.04 mg/L 11% at level 0.15 mg/L 7.8% at level 0.5 mg/L
SO4 IC, conductivity detector 0.1 mg/L 11% at level 1 mg/L 11% at level 5 mg/L 4% at level 10 mg/L
Stot H2O2 oxidation + IC 0.2 mg/L 20% at level 1 mg/L 6.8% at level 3 mg/L
NH4
Spectrophotometer SFS 3032
0.02 mg/L 16% at level 0.1 mg/L 4.7% at level 0.5 mg/L
Total nitrogen, Ntot FIA method SFS-EN ISO 11905-1
0.05 mg/L
10%
Nitrate nitrogen, NO3-N
FIA method SFS-EN ISO 13395
0.02 mg/L 10%
Nitrite nitrogen, NO2-N
FIA method SFS-EN ISO 13395
0.010 mg/L 10%
18O MS < 0.1‰ 18O (SO4) MS 0.5‰ 3H Fluid scintillation spectrometry (LSC)
after electrolytic enrichment, measured in Tritium units (TU)
0.2 TU ~ 0.3-1.0 TU
2H MS 1‰ 13C (DIC) MS Precision is � 0.1‰ 14C (DIC) AMS Precision is � 0.5% 87Sr/86Sr MS 0.003‰ 34S (SO4) MS 0.1 mBq/L 0.2‰
![LA GUERRA DE LOS “CALCIANTI” fileduw fxowxuh wkh fdofldqwl zdu ;ol whzzpvuz puzwpylk i` [ol nhtl iljhtl zv z[yvun [oh[ pu [ol wsh`lyz l]lu \zlk [ol myvalu z\ymhjl vm [ol 9p]ly](https://img.pdfslide.us/doc/110x75/5cd5f82588c993eb0d8d0f25/la-guerra-de-los-calcianti-fxowxuh-wkh-fdofldqwl-zdu-ol-whzzpvuz-puzwpylk.jpg)