Embed Size (px)
Citation preview
Baseline on Belonging: Equity, Diversity, and Inclusion in Architecture Licensing
Examination Report
©2021 National Council of Architectural Registration Boards (NCARB) and National Organization of Minority Architects (NOMA)

Baseline on Belonging: Examination Report
2Baseline on Belonging: Examination Report
Report StructureNCARB and NOMA are releasing the full Baseline on Belonging report in seven phases. This is the second phase, featuring data related to the Architecture Registration Examination® (ARE®). The following reports will be released individually over the coming months, ending with the full report, which will compile and summarize the previous sections.
1
2
3
4
5
6
7 Full Report
Career Development
Firm Culture
Education
Examination
Experience
Overview

3Baseline on Belonging: Examination Report
Baseline on Belonging: Examination Report
Table of ContentsExecutive Summary 4
Key Findings 6
Introduction 10
Setting the Scene: NCARB Data Regarding ARE Completions 12
Setting the Scene: ARE 5.0 Pass Rates 25
Survey Respondent Progress Toward ARE Completion 31
Amount Spent on Study Resources 41
Firm’s Provision of Study Resources 46
Candidates’ Confidence in Affording the ARE 51
Impacts on ARE Affordability 56
Expected Contributors Toward ARE Costs 61
Firm Contribution Toward ARE Costs 66
Difficulty Affording the ARE 71
Next Steps 76
Appendix: Baseline on Belonging Survey 78

4Baseline on Belonging: Examination Report
Baseline on Belonging: Examination Report
Executive SummaryThe Architect Registration Examination® (ARE®) is a national licensing examination for architects. Passing all six divisions of the exam is required by all 55 U.S. states and territories as a qualification for becoming an architect. Completing the ARE requires significant investments of both time and money, and while some firms offer support to candidates taking the exam, others do not. The Baseline on Belonging survey included a number of questions exploring how respondents prepared and paid for the ARE, with a goal of better identifying where cost, firm support, and exam preparation may create unintended impediments on the path to licensure.
The majority of survey respondents had either passed the ARE, taken at least one division, or were preparing to take a division of the exam; just 22 percent of respondents reported they had not yet begun preparing for the ARE. Viewed as a whole, responses from the 78 percent who had experience either preparing for or taking the exam reveal significant impediments to affordability, regardless of demographic. In addition, only 46 percent of individuals preparing for the exam and 66 percent of individuals who have begun or finished testing reported that their firm contributed to the cost of the exam—indicating that candidates may receive less ARE support from their firms than anecdotal claims would suggest.
As with the Baseline on Belonging experience report, survey findings were filtered primarily by race, ethnicity, and gender, with additional demographic characteristics such as age and firm size taken into consideration. Where appropriate, NCARB provided supplemental data from ARE candidates to offer additional insight and background information. This includes the first-ever release of national ARE 5.0 pass rates filtered by race and ethnicity, gender, and age. The pass rates indicate significant disparities for people of color, women, and older candidates. An independent bias audit concluded that the individual items on the ARE exhibit no pattern of bias, suggesting that these disparities are not caused by the exam itself, but by outside factors—such as those highlighted throughout the entire Baseline on Belonging study. Some key factors that are likely impacting pass rates include access to the necessary education and experience opportunities, as well as factors related to cost and firm support explored in this report.
For example, viewing the Baseline on Belonging survey responses by race and ethnicity reveals slight disparities when it comes to firm support for the exam and barriers to the exam’s affordability, with Hispanic or Latino respondents the most consistently impacted. For example, Latino respondents are the least likely of all races/ethnicities to report that their firm has or will pay for the exam and the most likely to spend over $500 on study materials.
The disparities grow when gender is factored in along with race and ethnicity, with women of color more likely to report that their firm did not contribute to the cost of the ARE. In addition, African American and Asian women were 5-6 percent more likely to report that their income was a significant factor impacting their ability to afford the exam compared to their male peers.
5Baseline on Belonging: Examination Report
Baseline on Belonging: Examination Report
African American women were also the most likely of all groups to cite college debt as a barrier to affording the exam. Likewise, Latina women for the least likely of all groups to report receiving study materials from their firm.
Although the Baseline on Belonging study is primarily focused on the impacts of race, ethnicity, and gender, two additional demographic factors also had a strong impact on exam-related responses: age and firm size. Firm support for the ARE—including free study materials and contributions toward the cost of the exam—drops significantly for candidates aged 40 or older. Despite this disparity, older candidates are more likely to feel confident they can afford the exam compared to their younger peers.
Viewing the survey responses by firm size also revealed significant disparities in the amount of support firms provided to their candidates, with large firms more likely to provide free study resources or pay for the cost of the exam than small firms. However, although employees at large firms were more than twice as likely to say their firm would pay for the cost of the exam compared to those at small firms, this did not make them more confident in their ability to afford the ARE or impact the factors that prevented them from feeling they could afford the ARE.
While NCARB does not have Record holder data regarding firm size, data regarding ARE completions underscores the disparities revealed by the survey findings. The disparities seen in ARE pass rates naturally lead to disparities in ARE completions. White candidates—especially white men—make up a disproportionately large percentage of ARE completions when compared to the total population of candidates’ testing. In addition, white candidates complete the ARE an average of 7-8 months sooner than their African American and Latino peers. Candidates in their 20s and 30s are also more likely to complete the ARE than their older peers, and do so in significantly less time.
As with key findings related to experience, additional study is needed to better understand the core causes of disparities related to exam progress and support. For more information about NCARB and NOMA’s planned follow-up surveys and additional research, see page page 76. For more details on key findings related to the ARE, see page 6. For more information about how NCARB will address pass rate disparities, please visit ncarb.org.

6Baseline on Belonging: Examination Report
Baseline on Belonging: Examination Report
Key Findings
Cost of the Exam is a Financial Burden for Many Candidates
When it comes to the cost of the ARE, many candidates reported facing significant difficulties in affording the exam.
• Of respondents who have completed the exam, roughly one third reported receiving no firm support toward the cost of the exam.
• 80 percent of respondents personally purchased study materials—42 percent of which reported spending $500 or more.
• Only 26 percent of candidates who have taken a division were confident in their ability to afford the ARE.
• Nearly two-thirds of individuals who have completed the exam reported facing difficulty paying for the exam.
• 74 percent of candidates reported income/compensation as a factor impacting their ability to afford the ARE.
African American and Latino Candidates Less Likely to Receive Firm Support for the Exam
When it comes to receiving financial support for the ARE, African American and Latino candidates are less likely to report that their firm will contribute to the cost of the exam.
• African American and Latino candidates were 7 and 9 percentage points less likely, respectively, to report their firm would contribute to the cost of the exam than their counterparts.
• Of those who have completed the exam, African Americans and Latinos were 5 and 6 percentage points more likely, respectively, to report they had received no firm support than their counterparts.

7Baseline on Belonging: Examination Report
Baseline on Belonging: Examination Report
African American and Latino Candidates More Likely to Report Financial Burdens Impacting Exam Affordability
When it comes to issues like college debt, personal debt, and family obligations, African American and Latino candidates are more likely to report that these factors impact their ability to afford the ARE.
• African American candidates were 17 percentage points more likely to report college debt as a factor impacting their ability to afford the ARE compared to their Asian counterparts.
• African American candidates were 14 percentage points more likely to report personal debt as a factor impacting their ability to afford the ARE than white candidates.
• Latino candidates were 17 percentage points more likely to report family obligations as a factor impacting their ability to afford the ARE than white candidates.
• Latino candidates were 8 percentage points more likely to spend $500 or more on study materials compared to their white and Asian counterparts.
Candidates of Color and Women Less Likely to Pass the Exam
NCARB’s Record holder data shows that candidates of color and women are less likely to both pass individual exam divisions and complete the entire exam.
• White candidates are much more likely to pass than candidates of color. The Programming & Analysis division has the largest disparity: white candidates’ pass rate is 38 percentage points higher than their Black or African American peers.
• In general, men outperform women on five of the six divisions. A similar trend can be seen when factoring race and ethnicity, although Black or African American women generally outperform Black or African American men.
• Candidates between the ages of 18-29 have the highest pass rates, outperforming those who are 40 or older by 9-14 percentage points, depending on the division.
• In addition, NCARB’s data regarding exam completions shows that pass rates impact representation in the pool of candidates passing the exam:
○ Women make up 42 percent of active testers but only 36 percent of 2019 ARE completions.
○ African Americans make up 5 percent of active testers but only 2 percent of 2019 ARE completions.
○ Latino candidates make up 14 percent of active testers but only 6 percent of 2019 ARE completions.
○ In contrast, white candidates make up 53 percent of active testers and 68 percent of 2019 ARE completions.

8Baseline on Belonging: Examination Report
Baseline on Belonging: Examination Report
African American and Latina Women Experience Disproportionate Barriers Related to Exam Affordability
African American and Latina women are more likely to experience barriers related to ARE support and affordability.
• African American and Latina women were 10 and 11 percentage points less likely, respectively, to report that they would receive firm support toward the cost of the exam compared to white women.
• African American and Latina women reported more barriers in affording the exam and study materials compared to white peers of both genders:
○ Latinas were the most likely group to purchase their own study materials—8 percentage points higher than white men.
○ Latinas were the most likely group to spend $500 or more on study materials—11 percentage points higher than white men.
○ African American women were most likely to report college debt as a factor impacting their ability to afford the exam—10 percentage points higher than white women.
○ Latinas who completed the exam were 20 percentage points more likely to report experiencing difficulty paying for the exam compared to white women.
Older Candidates Less Likely to Receive Firm Support
Age is a significant factor when it comes to the amount of support ARE candidates receive, with older candidates receiving less firm support and spending more toward ARE costs than their younger counterparts.
• Respondents aged 40+ who completed the ARE were 24 percentage points less likely to report receiving full firm support toward the exam cost compared to candidates aged 18-29.
• Candidates aged 40+ were 23 percentage points less likely to receive free study materials from their firm compared to those aged 18-29.
• Candidates aged 40+ were 22 percentage points more likely spend $500 or more on study materials than those aged 18-29.

9Baseline on Belonging: Examination Report
Baseline on Belonging: Examination Report
Large Firms More Likely to Provide Candidates with Support
Firm size has a significant effect on the amount of support candidates receive, with large firms more likely to assist with the cost of the ARE and study materials.
• Candidates at large firms were more likely to report that their firm had or would assist with the cost of the exam:
○ Candidates at large firms were 26 percentage points more likely to report that they would receive firm support toward the cost of the exam compared to candidates at small firms.
○ Of those who completed the exam, respondents at small firms were 34 percentage points more likely to report that they did not receive firm support toward the cost of the exam compared to those at large firms.
• Candidates at large firms were 41 percentage points more likely to report receiving free study materials than those employed by small firms.

10Baseline on Belonging: Examination Report
Baseline on Belonging: Examination Report
Introduction In early 2020 the National Council of Architectural Registration Boards (NCARB) and the National Organization of Minority Architects (NOMA) launched a joint survey to identify and understand areas where minority professionals and other underrepresented groups experience obstacles on the path to licensure.
This report features findings related to the ARE and firm support for candidates taking the exam. To offer additional context for the survey findings, the Baseline on Belonging: Examination Report also includes related data from NCARB’s own Record holders, including pass rates by demographics and exam completion information.
For more information regarding the survey structure, target audience, response rate, and respondent demographics, see the Appendix.
Examination Survey Structure
The examination section of the survey asked questions related to study materials and firm support for candidates completing the exam. Survey questions in the examination section of the survey include:
ARE Progress:
• Which of the following best represents your ARE progress?1 Options included:
○ I have not prepared for the ARE
○ I am currently preparing to take an ARE division
○ I have taken at least one ARE division
○ I have passed the ARE
Currently Testing—Respondents Preparing for or Taking the ARE:
• Do you feel confident in your ability to afford taking the ARE?
• Select all the parties that will contribute to the cost of taking the ARE. Select all that apply.
• What factors impact your ability to afford the ARE? Select all that apply.
1 This question was used to qualify respondents to receive additional questions related to the examination. Those who responded that they were preparing for, had taken, or had passed the ARE were given additional questions related to the exam, and those who responded “I have not prepared for the ARE” were advanced to the next section of the survey.

11Baseline on Belonging: Examination Report
Baseline on Belonging: Examination Report
Finished Testing—Respondents Who Passed the ARE:
• Did your firm contribute to the cost of the ARE?
• Select all the parties that contributed to the cost of taking the ARE. Select all that apply.2
• Did you personally experience difficulty paying for the cost of the ARE?
Study Materials:
• In what ways did you prepare for the ARE? Select all that apply.
• Have you personally purchased any materials to prepare for the ARE?
• Roughly how much have you spent on ARE study materials?
• Did your firm provide you with free ARE study materials?
The report provides a breakdown on candidates’ responses for each question, segmented by a variety of filters. Due to the survey’s focus on understanding attrition rates for minority professionals, most charts include a filter for race and ethnicity. Segments used in the examination report include:
• Race/ethnicity
• Race/ethnicity and gender
• Age*
• Race/ethnicity and Age*
• Firm Size*
• Firm Size and Age*
*For these segments, the data was filtered so that only respondents who indicated being an active candidate working toward licensure were included. Segments without this filter could also include recently licensed architects or those who’ve left the path. For this reason, respondents filtered by the segments marked with an * are sometimes referred to as “candidates.
2 This question was asked only of individuals who indicated that their firm did not pay for the entire exam.

12Baseline on Belonging: Examination Report
Baseline on Belonging: Examination Report
Setting the Scene: NCARB Data Regarding ARE Completions
Overview
NCARB gathers data regarding ARE completions from its customers through their NCARB Records, along with self-reported demographic information such as race, ethnicity, gender, and age. This data provides additional context regarding ARE completions, the average time candidates take to complete the program, and the average age of candidates when starting and finishing the ARE.
NCARB’s data reveals that white candidates make up a disproportionately high percentage of ARE completions compared to the overall pool of testing candidates, a result of the disparate pass rates seen in the next section of this report. In addition, slightly more men complete the exam than women, and most candidates finishing the exam are in the 30-39 age group. While diversity at the point of ARE completion has increased over time, it is increasing slower than diversity at the point of AXP completion.
NCARB’s data also shows that white and Asian candidates take less time on average to complete the exam, when compared to African American and Latino candidates. Asian candidates also begin testing at a younger age, making them younger than a majority of candidates at the point of ARE completion.

13Baseline on Belonging: Examination Report
Baseline on Belonging: Examination Report
Exam Candidate Demographics
CE
Other
Black or African American
Asian
Pacific Islander or Native Hawaiian
Hispanic or Latino
Native American or Alaskan Native
White
No Data Available0%
10%
20%
30%
40%
50%
60%
70%
80%
90%
100%
54.7%
13.2% 14.8%7.8%
17.5%4.4%
0.5% 0.2%
CE
Women
Men
No Data Available
CE
55+
40-54
30-39
18-29
No Data Available0%
10%
20%
30%
40%
50%
60%
70%
80%
90%
100%
0%
10%
20%
30%
40%
50%
60%
70%
80%
90%
100%
52%
41%
7.9%
32%
45%
19%3% 1%
CE
Women
Men
No Data Available
CE
55+
40-54
30-39
18-29
No Data Available0%
10%
20%
30%
40%
50%
60%
70%
80%
90%
100%
0%
10%
20%
30%
40%
50%
60%
70%
80%
90%
100%
52%
41%
7.9%
32%
45%
19%3% 1%
Over 50 percent of all candidates who took an ARE division in 2019 were white. Of the remaining candidates, 15 percent were Asian, 13 percent were Latino, 4 percent were African American, and less than one percent were Native American or Pacific Islander.
In addition, genders were represented nearly equally, with men making up a slight majority of active testers in 2019 at 51 percent. While almost half of ARE candidates fall in the 30-39 age group, candidates aged 18-29 and 40-54 make up 32 and 19 percent of 2019 test takers, respectively. Only 3 percent of active testers are 55 or older.

14Baseline on Belonging: Examination Report
Baseline on Belonging: Examination Report
Most Candidates Completing the ARE in 2019 Were White
Perc
ent
0%
10%
20%
30%
40%
50%
60%
70%
80%
90%
100%
White Black orAfrican
American
Hispanicor Latino
OtherAsian PacificIslander or
Native Hawaiian
No DataAvailable
Native American or Alaskan
Native
67.7%
6.1%1.9% 10.3%
4.3%0.3% 0.2%
15.5%
Of the candidates who completed the ARE in 2019, 68 percent were white, and just 23 percent identified as a race or ethnicity other than white. This indicates that white candidates, who make up 55 percent of the active testing population, account for a disproportionately high percentage of ARE completions.
Most of the candidates of color completing the ARE in 2019 were Asian, making up 10 percent of ARE completions. An additional 6 percent were Hispanic or Latino, and 2 percent were Black or African American.

15Baseline on Belonging: Examination Report
Baseline on Belonging: Examination Report
Diversity at ARE Completion Slowly Improving Over Time
0%
10%
20%
30%
40%
50%
60%
70%
80%
90%
100%
Perc
ent
Other, not Hispanic or Latino
Black or African American, not Hispanic or Latino
White, Hispanic or Latino
Native Hawaiian or Other Pacific Islander, not Hispanic or Latino
Asian, not Hispanic or Latino
White, not Hispanic or Latino
Other, Hispanic or Latino
2010 2011 2012 2013 2014 2015 2016 2017 2018 2019
When viewed over time, NCARB’s data shows that diversity at the point of exam completion has been improving slightly, though at a slower pace than diversity at the point of experience program completion. While diversity at the point of experience completion has improved 16 percentage points over the past decade, diversity at the point of exam completion has only improved 3 percentage points.

16Baseline on Belonging: Examination Report
Baseline on Belonging: Examination Report
Men Make Up Larger Proportion of ARE Completions
0%
10%
20%
30%
40%
50%
60%
70%
80%
90%
100%
WhiteMen
Black orAfrican
AmericanMen
Hispanicor Latino
Men
PacificIslander
or NativeHawaiian
Men
Native American
orAlaskan NativeMen
OtherMen
WhiteWomen
AsianMen
Black orAfrican
AmericanWomen
Hispanicor LatinaWomen
PacificIslander
or NativeHawaiianWomen
Native American
orAlaskan Native
Women
OtherWomen
AsianWomen
42.1%
1.2%3.7% 5%
0.3% 0.1%2.8%
25.6%
0.7%2.4%
5.4%
Perc
ent
0.1% 0.1% 1.5%
Of candidates completing the ARE in 2019, approximately 56 percent were men—despite men making up only 51 percent of the active ARE candidate population. White men alone made up 42 percent of ARE completions, with Black or African American men making up 1 percent, Asian men making up 5 percent, and Hispanic or Latino men making up 4 percent.
White women comprised 26 percent of ARE completions, with Black or African American women making up less than 1 percent, Hispanic or Latina women making up 2 percent, and Asian women making up just over 5 percent.
Asian women are the only group of candidates who completed the exam in 2019 at a higher proportion than men in the same demographic group.

17Baseline on Belonging: Examination Report
Baseline on Belonging: Examination Report
Candidates Between 30-39 Make Up Most ARE Completions
0%
10%
20%
30%
40%
50%
60%
70%
100%
80%
90%
30-3918-29 40-54 55+
0.4%
36%
1.1%3.4%
6%10.5%
0.3% 1.1% 1.3% 0.9%0% 0.1% 0.1%
Perc
ent
AsianHispanic or Latino
Black or African American
White
20%
2.8%1.5%
Just over 25 percent (27.9 percent) of candidates who completed the ARE in 2019 were between the ages of 18-29—despite making up 32 percent of the total ARE candidate population. The majority (53 percent) were between 30-39 years old, with only 17 percent between 40-54 and less than 1 percent at age 55 or older.
Most candidates in all age groups were white, with white candidates between the ages of 30-39 making up 36 percent of all ARE completions in 2019.

18Baseline on Belonging: Examination Report
Baseline on Belonging: Examination Report
White Candidates Complete the ARE Soonest
0
0.5
1
1.5
2
2.5
3
3.5
White Black or AfricanAmerican
Hispanic or Latino Asian Other
Year
s to
Com
plet
e Ex
peri
ence
2.3
2.83.0
2.4 2.5
Of those who completed the exam in 2019, the median testing time from start to finish for white candidates was 2.3 years; this is approximately six months less time than their Black or African American peers, and eight months sooner than their Latino peers. Asian candidates take approximately one month longer to complete the ARE on average than their white peers.

19Baseline on Belonging: Examination Report
Baseline on Belonging: Examination Report
African American Men Take Longest Time to Complete ARE
0
0.5
1
1.5
2
2.5
3
3.5
4
WhiteMen
Black orAfrican
AmericanMen
Hispanicor Latino
Men
AsianMen
OtherMen
WhiteWomen
Black orAfrican
AmericanWomen
Hispanicor LatinaWomen
AsianWomen
OtherWomen
2.62.6
3.0
2.1
2.4
3.0
3.3
2.32.2 2.3
Year
s to
Com
plet
e Ex
peri
ence
When split by race/ethnicity and gender, women of most demographics complete the exam in the same amount of time as their male counterparts. For white and Latino candidates, for example, there is no difference in time to complete the ARE for men and women. Asian women, however, take approximately five months longer on average to complete the program than Asian men.
And for African American candidates, men take over one year longer on average to complete the program compared to women. African American men take one year longer to complete the exam compared to white men.

20Baseline on Belonging: Examination Report
Baseline on Belonging: Examination Report
Time to Complete the ARE Increases with Age
0
1
2
3
4
5
6
18-29 30-39 40+
AsianHispanic or Latino
Black or African American
White
4.3
4.9
2.8
3.8
2.8
3.33.4
2.6
1.51.8
1.61.7
Year
s to
Com
plet
e Ex
peri
ence
On average, candidates between 18-29 years old of all races and ethnicities took less time to complete the ARE than candidates in older age groups. The median time it takes to complete the exam increased at least 10 months for each race between the ages of 18-29 and 30-39, and at least another 14 months between 30-39 and 40+, with the exception of Black or African American candidates—the only 40+ group that reports a decrease in time to complete the ARE. However, it is worth noting that individuals older than 40 make up less than 25 percent of ARE candidates; the average candidate starts testing in their late-20s and finishes in their early-30s.
In most age groups, white candidates complete the ARE in the shortest average time span. In addition, when comparing white candidates to candidates of other races/ethnicities, the gaps in time to complete the exam widens as candidates age.

21Baseline on Belonging: Examination Report
Baseline on Belonging: Examination Report
Race/Ethnicity Has Little Effect on Age of ARE Start
28.9
29
29.1
29.2
29.3
29.4
29.5
White
Age
at E
xper
ienc
e St
art
Black or AfricanAmerican
Hispanic orLatino
Asian Other
29.2 29.2
29.4
29
29.4
In 2019, candidates of all races/ethnicities started testing for the ARE between the age of 29 to 29.4 years old. Asian candidates started just slightly younger (approximately two months) than most of their peers.
22Baseline on Belonging: Examination Report
Baseline on Belonging: Examination Report
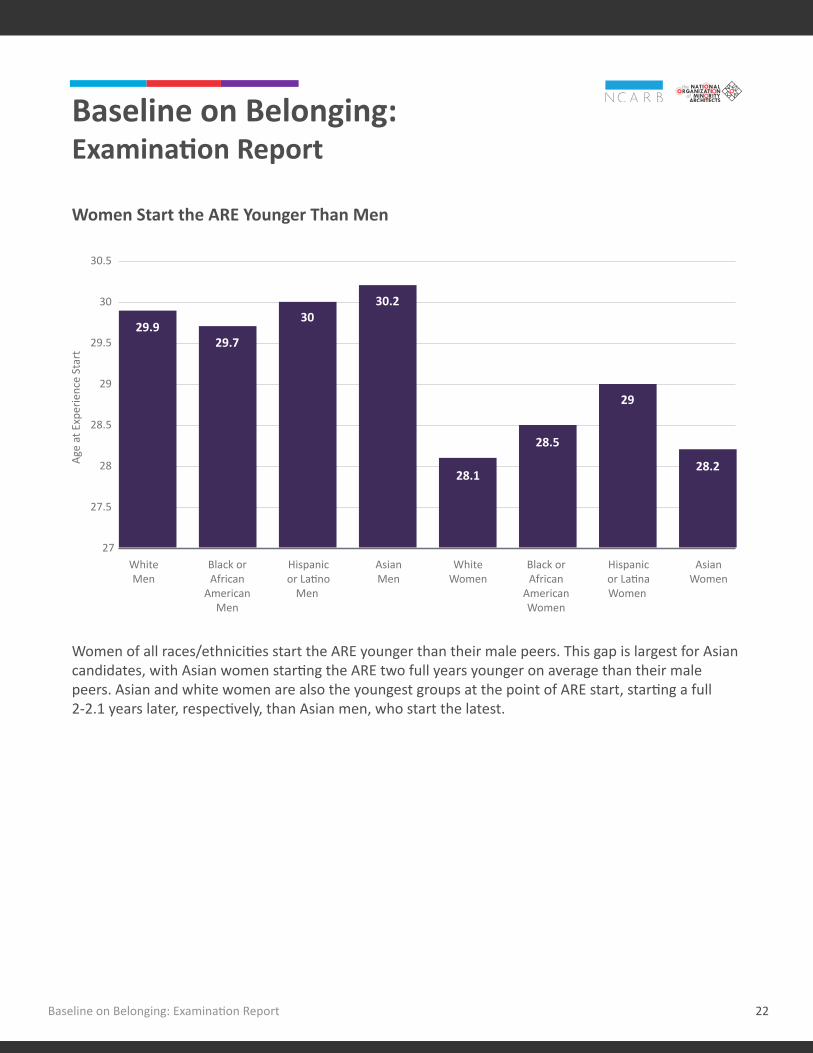
Women Start the ARE Younger Than Men
27
27.5
28
28.5
29
29.5
30
30.5
WhiteMen
Black orAfrican
AmericanMen
Hispanicor Latino
Men
AsianMen
WhiteWomen
Black orAfrican
AmericanWomen
Hispanicor LatinaWomen
AsianWomen
Age
at E
xper
ienc
e St
art
28.2
29
28.5
28.1
30.230
29.729.9
Women of all races/ethnicities start the ARE younger than their male peers. This gap is largest for Asian candidates, with Asian women starting the ARE two full years younger on average than their male peers. Asian and white women are also the youngest groups at the point of ARE start, starting a full 2-2.1 years later, respectively, than Asian men, who start the latest.

23Baseline on Belonging: Examination Report
Baseline on Belonging: Examination Report
Asian Candidates Finish the ARE Younger
30.5
31.5
31
32
32.5
33
33.5
34
31.5
32.732.7
33.3
32.2
White Black or AfricanAmerican
Hispanic orLatino
Asian Other
Age
at E
xper
ienc
e Co
mpl
ete
On average, Asian candidates are 31.5 years old when they finish testing, compared to 32.2 years for white candidates, 32.7 for Hispanic or Latino candidates, and 33.3 years for Black or African American candidates.

24Baseline on Belonging: Examination Report
Baseline on Belonging: Examination Report
Women Finish the ARE Younger Than Men
29
30
31
32
33
34
35
WhiteMen
Black orAfrican
AmericanMen
Hispanicor Latino
Men
AsianMen
WhiteWomen
Black orAfrican
AmericanWomen
Hispanicor LatinaWomen
AsianWomen
Age
at E
xper
ienc
e Co
mpl
ete
31.2
32.1
31.1
31.7
34.3
33.5
32.8
31.4
Women of all races/ethnicities who finished the ARE in 2019 did so younger than their male peers. This gap is largest for Hispanic or Latino candidates, with Latinas finishing the exam 2.9 years younger on average than their male peers. White women were the youngest of all groups at the point of ARE complete, with Latino men the oldest on average.

25Baseline on Belonging: Examination Report
Baseline on Belonging: Examination Report
Setting the Scene: ARE 5.0 Pass RatesIn addition to data regarding the time to complete the program, NCARB also gathers data regarding ARE pass rates* from candidates.
The following section features pass rates from ARE 5.0’s launch in November 2016 through December 2020. The expanded timeframe allows for a more statistically valid sample size compared to only showing pass rates for candidates who tested in 2019.
Thanks to enhanced data science capabilities, NCARB has been able to segmentand analyze pass rates by demographic information, including race and ethnicity, gender, and age. NCARB’s data reveals that white candidates were much more likely to pass the ARE than candidates of color, while Black or African American candidates had the lowest pass rates across all six divisions.
Men were also more likely to pass than women on most ARE 5.0 divisions, with some differences seen between various races and ethnicities. For example, white, male candidates hadthe highest pass rate among all demographics on five of the six ARE divisions.
In addition, candidates between 18-29 years old had the highest pass rates on all divisions, although candidates between 30-39 years old made up the majority of the candidate pool.
Understanding the cause of these pass rate disparities and how to best address them is a key area of focus for both NCARB and NOMA. Recommended next steps for further areas of study are included at the end of this report.
*The pass rate on an ARE 5.0 division is the proportion of test administrations where the candidate scores at or above the cut score compared to the total number of attempts on that division.

26Baseline on Belonging: Examination Report
Baseline on Belonging: Examination Report
Pass Rates for All ARE 5.0 Candidates
Perc
ent
0%
10%
20%
30%
40%
50%
60%
70%
80%
90%
100%
Construction &Evaluation
Programming& Analysis
PraciceManagement
ProjectDevelopment &Documentation
ProjectManagement
Project Planning& Design
68%
52% 50%53%
62%
45%
Construction & Evaluation (CE) had the highest pass rate of all ARE 5.0 divisions: of all candidates who took CE between November 2016 and December 2020, nearly 68 percent passed. Project Management (PjM) was the second highest at 62 percent.
Project Planning & Design (PPD) had the lowest pass rate at 45 percent. The remaining divisions had pass rates in the low 50s, with Project Development & Documentation (PDD) at 53 percent, Programming & Analysis (PA) at 52 percent, and Practice Management (PcM) at 50 percent.
Because the exam plays an essential role in protecting the public, the passing standard is fixed and doesn't change based on candidates’ relative performance. While current pass rates might seem low, NCARB’s testing experts and consultants constantly evaluate the exam to ensure it remains fair and legally defensible for state licensing boards.
Note: Pass rates reflect the percent of candidates who successfully receive a passing score on a specific ARE division.

27Baseline on Belonging: Examination Report
Baseline on Belonging: Examination Report
African Americans Least Likely to Pass All ARE 5.0 Divisions
0%
10%
20%
30%
40%
50%
60%
70%
80%
90%
100%
PPDPJMPDDPMPACE
Pass
Rat
e
Other
Black or African American
Asian
Hispanic or Latino
American Indian or Alaskan Native
White
Native Hawaiian orPacific Islander
Constru
ction &
Evalu
ation
Practi
ce M
anag
emen
t
Projec
t Man
agem
ent
Projec
t Plan
ning
& Des
ign
Progra
mming &
Ana
lysis
Projec
t Dev
elopmen
t &
Documen
tation
For each ARE 5.0 division, white candidates had the highest pass rates, while Black or African American candidates had the lowest. This disparity is largest for the Programming & Analysis division, where white candidates’ pass rate is 38 percentage points higher than their African American peers. The smallest range is seen with the Practice Management (PcM) division, where white candidates’ pass rate is 27 percentage points higher.
On average, Asian candidates had the second highest pass rates of all races/ethnicities; however, the gap between white and Asian candidates is also large, ranging between 16-27 percentage points. Hispanic or Latino candidates performed slightly better than their African American peers; for comparison, the gap between white and Hispanic or Latino candidates ranged from 24-32 percentage points across the six divisions.
The gap in pass rates between white candidates and candidates of color highlights a key area of difficulty in achieving a more diverse profession, and NCARB and NOMA will work together to identify ways to address this disparity.

28Baseline on Belonging: Examination Report
Baseline on Belonging: Examination Report
For Most Races/Ethnicities, Men More Likely to Pass the ARE Than Women
Mal
e Pa
ss R
ate
Other
Black or African American
Asian
Hispanic or Latino
White
Constru
ction &
Evalu
ation
Practi
ce M
anag
emen
t
Projec
t Man
agem
ent
Projec
t Plan
ning
& Des
ign
Progra
mming &
Ana
lysis
Projec
t Dev
elopmen
t &
Documen
tation
0%
10%
20%
30%
40%
50%
60%
70%
80%
90%
100%
0
10
Fem
ale
Pass
Rat
e
Other
Black or African American
Asian
Hispanic or Latino
White
Constru
ction &
Evalu
ation
Practi
ce M
anag
emen
t
Projec
t Man
agem
ent
Projec
t Plan
ning
& Des
ign
Progra
mming &
Ana
lysis
Projec
t Dev
elopmen
t &
Documen
tation
0%
10%
20%
30%
40%
50%
60%
70%
80%
90%
100%

29Baseline on Belonging: Examination Report
Baseline on Belonging: Examination Report
When looking at all candidates (regardless of race/ethnicity), men outperformed women on all ARE 5.0 divisions, with the exception of PcM, where men and women performed equally. The disparity between men and women was greatest on the PPD and PDD divisions, where men performed 12 and 15 percentage points higher, respectively.
For most races/ethnicities, the same trend of men outperforming women was seen across most exam divisions. The exception was candidates who identify as Black or African American: African American women had higher pass rates than their male counterparts on four of the six ARE 5.0 divisions.
Hispanic or Latino candidates were the only race/ethnicity where women perform worse than men on all divisions, and experienced the greatest overall disparity in pass rates between men and women.

30Baseline on Belonging: Examination Report
Baseline on Belonging: Examination Report
Younger Candidates More Likely to Pass All ARE 5.0 Divisions
05
10%
20%
30%
40%
50%
60%
70%
80%
90%
100%
PPDPJMPDDPMPACE
Pass
Rat
e
30-39
40+
18-29
Constru
ction &
Evalu
ation
Practi
ce M
anag
emen
t
Projec
t Man
agem
ent
Projec
t Plan
ning
& Des
ign
Progra
mming &
Ana
lysis
Projec
t Dev
elopmen
t &
Documen
tation
For all divisions of ARE 5.0, candidates between the ages of 18-29 had the highest pass rates, while candidates who were 40 or older had the lowest.
This gap is the largest on the Programming & Analysis and Project Management divisions, where 18-29-year-olds outperform candidates who were 40-plus by 14 percentage points. Compared to 18-29-year-olds, candidates who were 30-39 had slightly lower pass rates on all ARE 5.0 divisions, ranging between 3-4 percentage points lower.
31Baseline on Belonging: Examination Report
Baseline on Belonging: Examination Report
Survey Respondent Progress Toward ARE CompletionThe majority of survey respondents have made some progress toward completing the ARE, with only 22 percent of all respondents reporting that they have not passed the entire ARE, taken an ARE division, or begun preparing to take an ARE division.
To better understand factors that could impact ARE progress, the data was segmented by a variety of respondent characteristics, including race/ethnicity, firm size, age, and gender.
Race/ethnicity, age, and firm size each have an impact on respondents’ likelihood to report they had passed the ARE, with gender compounding the impact for respondents of certain races and ethnicities.

32Baseline on Belonging: Examination Report
Baseline on Belonging: Examination Report
African Americans and Latinos Less Likely to Have Passed the ARE
0%
10%
20%
30%
40%
50%
60%
100%
80%
90%
70%
White Hispanic orLatino
Other
I have passedthe ARE
I have not preparedfor the ARE
I have taken atleast one ARE division
I am currentlypreparing for anARE division
17%
Perc
ent
36%
21%
25%23%
41%
21%
15%
26%
35%
24%
15%
21%
33%
21%25% 26%
37%
21%
16%
Black or AfricanAmerican
Asian
Most survey respondents indicated they had made progress toward completing the ARE. When segmented by race and ethnicity, Latinos were the most likely to indicate they had not prepared for the ARE at 24 percent—3 percentage points higher than respondents of all other races and ethnicities.
At 25 percent, white and Asian respondents were the most likely to indicate they had passed the ARE, compared to 15 percent of Black or African American and Latinos respondents.
In contrast, African American respondents were the most likely to indicate they had taken at least one ARE division at 41 percent—5, 6, and 8 percentage points higher than their white, Latino, and Asian peers, respectively.

33Baseline on Belonging: Examination Report
Baseline on Belonging: Examination Report
Asian Men Most Likely to Have Passed the ARE
0%
10%
20%
30%
40%
50%
60%
100%
80%
90%
70%
I have passedfor the ARE
I have not preparedfor the ARE
I have taken atleast one ARE division
I am currentlypreparing for anARE division
21%
29%
33%
17%
21%
14%
42%
23% 24%
17%
34%
25%
18%
31%31%
20%22%22%
39%
17%20%
15%
42%
23% 23%
14%
36%
27%
23%21%
35%
21%
White Men
Hispanic orLatino Men
Perc
ent
Black or African American
Men
Asian Men
White Women
Hispanic orLatina
Women
Black or African American
Women
Asian Women
Women respondents of most races and ethnicities were less likely to have passed the ARE than their male counterparts. The largest difference between men and women of the same race was seen in Asian candidates, with Asian men 10 percentage points more likely to have passed the ARE than Asian women. At 31 percent, respondents who identified as Asian men were also the most likely of all race/ethnicities and gender groups to have passed the ARE.
African American women were 1 percentage point more likely to have passed the ARE than African American men—the only race/ethnicity where women respondents were more likely to have passed than their male counterpart.

34Baseline on Belonging: Examination Report
Baseline on Belonging: Examination Report
Candidates Aged 30-39 Most Likely to Have Passed the ARE
Perc
ent
0%
10%
20%
30%
40%
50%
60%
70%
80%
90%
100%
18-29 30-39 40-54 55+
I am currently preparing for an ARE division
I have taken at least one ARE division
I have passed the ARE
I have not prepared for the ARE
22%
15%
33%30%
21%
28%
16%
36%
20% 20%16%
44%
25%
10%
18%
47%
Candidates between the ages of 30-39 were the most likely to have passed the ARE at 28 percent; this is 8 percentage points higher than those in the 40-54 age group and 13 percentage points higher than those in the 18-29 age group. Candidates aged 55 or older were the least likely to have passed the ARE at just 10 percent. However, candidates in the 55+ age group were the most likely to have taken at least one ARE division at 47 percent.

35Baseline on Belonging: Examination Report
Baseline on Belonging: Examination Report
Candidates at Large Firms Most Likely to Have Passed the ARE
Perc
ent
0%
10%
20%
30%
40%
50%
60%
70%
80%
90%
100%
Small Firm Mid-Sized Firm Large Firm
I am currently preparing for an ARE division
I have taken at least one ARE division
I have passed the ARE
I have not prepared for the ARE
23% 22% 22%20% 20%
24%
18%
38%36%
34%
18%
25%
When segmented by firm size, candidates employed by large firms were the most likely to have passed the ARE at 24 percent—2 and 6 percentage points higher than those at mid-size and small firms, respectively.
Similarly, candidates employed by small firms were more likely to indicate they have not prepared for the ARE at 25 percent—5 and 7 percentage points higher than those at mid-size and large firms, respectively.

36Baseline on Belonging: Examination Report
Baseline on Belonging: Examination Report
Personally Purchased Study ResourcesRespondents who indicated they had prepared, were preparing, or had completed the ARE were asked if they had personally purchased study materials to assist with their exam preparation.
The vast majority of respondents, regardless of segment, indicated that they had purchased their own materials. While only slight differences were seen by race/ethnicity, the results showed that women—especially women of color—are more likely to have purchased their own materials than men.
Similarly, age and firm size can impact candidates’ likelihood to purchase their own study materials, with older candidates and candidates employed by small firms both more likely to report having personally purchased materials. On the other hand, young candidates employed by large firms are the least likely of all groups to have purchased their own study materials.

37Baseline on Belonging: Examination Report
Baseline on Belonging: Examination Report
White Respondents Slightly Less Likely to Purchase Study Materials
Perc
ent
0%
10%
20%
30%
40%
50%
60%
70%
80%
90%
100%
White Black or AfricanAmerican
Hispanic orLatino
OtherAsian
79%81% 82%
21%
79%
21%19%
81%
19%18%
Yes No
Most survey respondents purchased their own study materials for the ARE. But when separated by race/ethnicity, white respondents were slightly less likely than their peers to have purchased study materials at 79 percent—2 percentage points less likely than African American and Asian respondents and 3 percentage points less likely than Latino respondents.

38Baseline on Belonging: Examination Report
Baseline on Belonging: Examination Report
White Men Least Likely to Purchase Study Materials
0%
10%
20%
30%
40%
50%
60%
70%
80%
90%
100%
76%
24%
80%
20%
80%
20%
79%
21%
81%
19%
83%
17%
83%
17%
84%
16%
Yes No
WhiteMen
Black or African
AmericanMen
Hispanicor Latino
Men
AsianMen
WhiteWomen
Black or African
AmericanWomen
Hispanicor LatinaWomen
AsianWomen
Perc
ent
Viewing the responses by both race/ethnicity and gender reveals a slight difference in study material purchases, with women of all races/ethnicities more likely to have purchased their own ARE study materials than men. When compared to men of the same race/ethnicity, women were 3-5 percentage points more likely to have purchased their own materials.
At 84 percent, Latinas were the most likely to have purchased their own study materials—8 percentage points more likely than white men, who were the least likely. For both genders, candidates of color were more likely to have purchased their own study materials than white candidates.

39Baseline on Belonging: Examination Report
Baseline on Belonging: Examination Report
Older Candidates More Likely to Purchase Study Materials
Perc
ent
0%
10%
20%
30%
40%
50%
60%
70%
80%
90%
100%
18-29 30-39 40-54 55+
74%
26%
81%
19%
85%
15%
89%
11%
Yes No
Candidates’ likelihood to have purchased their own study materials increased with age, with 55+ candidates 15 percentage points more likely to have purchased their own study materials than those aged 18-29.

40Baseline on Belonging: Examination Report
Baseline on Belonging: Examination Report
Candidates at Large Firms Less Likely to Purchase Study Materials
Perc
ent
0%
10%
20%
30%
40%
50%
60%
70%
80%
90%
100%
Small Firm Mid-Sized Firm Large Firm
83%80%
77%
17%20%
23%
81%
Yes No
When segmented by firm size, candidates employed by large firms were the least likely to have purchased their own ARE study materials at 77 percent—6 percentage points less than those at small firms and 3 percentage points less than those at mid-sized firms.

41Baseline on Belonging: Examination Report
Baseline on Belonging: Examination Report
Amount Spent on Study ResourcesRespondents who indicated they had personally purchased their own study materials were also asked to indicate roughly how much money they had spent on study materials.
Almost half of all respondents indicated they had spent $500 or more on study materials. Age, race and ethnicity, and gender all impacted a respondent’s likelihood of spending $500 or more, with Hispanic or Latino respondents—especially Latina women—most likely to select this option.
Candidates in the 18-29 age group were far less likely to report having spent $500 or more on study materials compared to their older counterparts.

42Baseline on Belonging: Examination Report
Baseline on Belonging: Examination Report
Latino Respondents More Likely to Spend $500 or More on Study Materials
Perc
ent
0%
10%
20%
30%
40%
50%
60%
70%
80%
90%
100%
White Black or AfricanAmerican
Hispanic or Latino Asian Other
$0-$100 $100-$300 $300-$500 $500 or More
10% 10%6%
9%3%
31% 31%
40%
25%
47%
22%19%
30%
21% 21%24%
18%
39% 39%
55%
When asked roughly how much money they had spent on study materials, 47 percent of Latino respondents reported having spent $500 or more—this is 8 percentage points more likely than their white and Asian peers and 7 percentage points more likely than their African American peers.

43Baseline on Belonging: Examination Report
Baseline on Belonging: Examination Report
Latinas Most Likely to Spend $500 or More on Study Materials
Perc
ent
0%
10%
20%
30%
40%
50%
60%
70%
80%
90%
100%
White Black or AfricanAmerican
Hispanic or Latino Asian Other
$0-$100 $100-$300 $300-$500 $500 or More
10% 10%6%
9%3%
31% 31%
40%
25%
47%
22%19%
30%
21% 21%24%
18%
39% 39%
55%
When viewed by both race/ethnicity and gender, women of all races/ethnicities were more likely to spend $500 or more on study materials than their male peers. This gap is largest, however, for African Americans—where African American women are 7 percentage points more likely to spend $500 or more than African American men.
Latinas were the most likely of all demographic groups to spend $500 or more on ARE study materials at 48 percent, followed by Latino men at 45 percent.

44Baseline on Belonging: Examination Report
Baseline on Belonging: Examination Report
Candidates Aged 40-54 More Likely to Spend $500 or More on Study Materials
Perc
ent
0%
10%
20%
30%
40%
50%
60%
70%
80%
90%
100%
18-29 30-39 40-54 55+
$0-$100 $100-$300 $300-$500 $500 or More
58%
13%
8% 6% 4%
36%
22%
29% 28%
43%
52%49%
21% 21% 21%
26%
21%
When viewed by age, younger candidates were significantly less likely to spend $500 or more on study materials; they were also the only group where the majority of respondents selected an option other than $500 or more when asked how much they spent on study materials.
Candidates aged 40-54 were the most likely to report having spent $500 or more at 52 percent, with candidates 55+ just slightly lower at 49 percent.

45Baseline on Belonging: Examination Report
Baseline on Belonging: Examination Report
Candidates at Mid-Size Firms Less Likely to Spend $500 or More on Study Materials
Perc
ent
0%
10%
20%
30%
40%
50%
60%
70%
80%
90%
100%
Small Firm Mid-Sized Firm Large Firm
$0-$100 $100-$300 $300-$500 $500 or More
7%11%
9%
28%
44%
33%36%
21% 21%
26%22%
45%
Viewing the data by firm size revealed only slight differences in the amount spent on study materials. Candidates employed at small firms were just 1 percentage point more likely to report having spent $500 or more on study materials than those employed by large firms, but 9 percentage points more likely than those employed at mid-size firms.
Candidates employed by mid-size firms were slightly more likely to indicate they had spent $100 or less, compared to candidates at other firm sizes.

46Baseline on Belonging: Examination Report
Baseline on Belonging: Examination Report
Firm’s Provision of Study ResourcesWhen asked if their firm provided free study materials for the ARE, slightly more than half of all respondents indicated that their firm did supply free study materials.
Viewing responses by race/ethnicity reveals very slight disparities, which grow larger when gender is considered in conjunction with race/ethnicity. Unlike previous exam-related questions, however, women of almost every racial group were more likely to report receiving resources from their firm than their male counterparts.
The most significant impacts on the likelihood to receive free study materials, however, are seen when the data is viewed by age and by firm size, with younger candidates employed by large firms the most likely of all groups to receive free study materials.

47Baseline on Belonging: Examination Report
Baseline on Belonging: Examination Report
Asians Slightly More Likely to Receive Free Study Materials
Perc
ent
0%
10%
20%
30%
40%
50%
60%
70%
80%
90%
100%
White Black or AfricanAmerican
Hispanic orLatino
OtherAsian
55%
45%
57%54%
59%
46%
41%44%
56%
43%
Yes No
Compared to respondents of other races/ethnicities, Asian respondents were slightly more likely to report that their firm provided them with free study materials for the ARE. In contrast, Latino respondents were the least likely to report being provided with free study materials at 54 percent— 5 percentage points less likely than their Asian peers.

48Baseline on Belonging: Examination Report
Baseline on Belonging: Examination Report
Latino Men Least Likely to Receive Free Study Materials
0%
10%
20%
30%
40%
50%
60%
70%
80%
90%
100%
55%
45%
54%
46%
52%48%
56%
44%
54%
46%
60%
40%
62%
38%
56%
44%
Yes No
WhiteMen
Black or African
AmericanMen
Hispanicor Latino
Men
AsianMen
WhiteWomen
Black or African
AmericanWomen
Hispanicor LatinaWomen
AsianWomen
Perc
ent
Viewing the responses by both race/ethnicity and gender reveals a larger gap in respondents’ likelihood to receive free study materials from their firm. Women of most races/ethnicities were more likely to have received free study materials, with the exclusion of white women, who were just one percentage point less likely to receive free study materials compared to white men.
Asian women were the most likely of all groups to receive free study materials from their firm at 62 percent—10 percentage points higher than Latino men.

49Baseline on Belonging: Examination Report
Baseline on Belonging: Examination Report
Older Candidates Less Likely to Receive Free Study Materials
Perc
ent
0%
10%
20%
30%
40%
50%
60%
70%
80%
90%
100%
18-29 30-39 40-54 55+
64%
57% 58%
65%
42%
35%
43%
36%
81%
19%
Yes No
The likelihood that a candidate’s firm provides them with free ARE study materials decreases steadily with age. Candidates aged 55+ were nearly 30 percentage points less likely to report receiving free study materials compared to those aged 18-29.
Even candidates in the 30-39 age group—the age group of the majority of ARE testers, according to NCARB’s data—were 7 percentage points less likely to receive free study materials than their younger peers.

50Baseline on Belonging: Examination Report
Baseline on Belonging: Examination Report
Large Firms More Likely to Provide Free Study Materials
Perc
ent
0%
10%
20%
30%
40%
50%
60%
70%
80%
90%
100%
Small Firm Mid-Sized Firm Large Firm
32%
68%66%
73%
27%
34%
81%
Yes No
Segmenting the responses by firm size revealed that candidates working at large firms were more than twice as likely to report being provided with free study materials. Nearly 75 percent of candidates at large firms received free study materials, compared to 66 percent of candidates at mid-sized firms and almost a third of candidates at small firms.
51Baseline on Belonging: Examination Report
Baseline on Belonging: Examination Report
Candidates’ Confidence in Affording the ARE Note: This question was asked only of respondents who were active ARE candidates.
Many survey respondents across all demographics indicated the cost of the exam was a significant challenge to practice; however, viewing the data by race and gender reveals that Latino respondents—especially Latina women—may be disproportionately impacted by the cost of the exam.
Unlike previous exam-related questions, candidates’ confidence in their ability to afford the ARE showed little change when filtered by firm size and positive change with age.

52Baseline on Belonging: Examination Report
Baseline on Belonging: Examination Report
Latinos Least Likely to Feel Confident in Affording the ARE
Perc
ent
0%
10%
20%
30%
40%
50%
60%
70%
80%
90%
100%
White Black or AfricanAmerican
Hispanic orLatino
OtherAsian
27%
35%38% 38%
40% 40%38%
22%22%25%
36%39%
28%31%
41%
Yes No Somewhat
When asked whether they feel confident in their ability to afford the ARE, just 22 percent of Hispanic or Latino respondents said yes—6 fewer percentage points than Black or African American respondents.
For most races/ethnicities, the largest proportion of respondents selected “somewhat.” Hispanic or Latino respondents represent the only ethnicity where candidates were slightly more likely to select “no” when asked if they were confident in their ability to afford taking the ARE.

53Baseline on Belonging: Examination Report
Baseline on Belonging: Examination Report
Latinas Least Likely to Feel Confident in Affording the ARE
Perc
ent
0%
10%
20%
30%
40%
50%
60%
70%
80%
90%
100%
WhiteMen
Black or African
AmericanMen
Hispanicor Latino
Men
AsianMen
WhiteWomen
Black or African
AmericanWomen
Hispanicor LatinaWomen
AsianWomen
34% 33%
42%
25%
35% 35%38%
27%
21% 21% 22%18%
43% 43%
36% 36%39% 39% 39%
27%
33%
40%43%
31%
Yes No Somewhat
Apart from Asian women, women of most races/ethnicities were less likely to feel confident that they could afford the ARE than their male peers. Latinas, for example, were the least likely of all groups to report feeling confident in affording the ARE at just 18 percent. This is compared to 34 percent of white men—who were the most likely to feel confident affording the exam.
Asian men were the least likely of all male groups to indicate they were confident affording the ARE at just 21 percent. This contrasts with Asian women, who were the most likely of all female groups to feel confident affording the exam.
54Baseline on Belonging: Examination Report
Baseline on Belonging: Examination Report
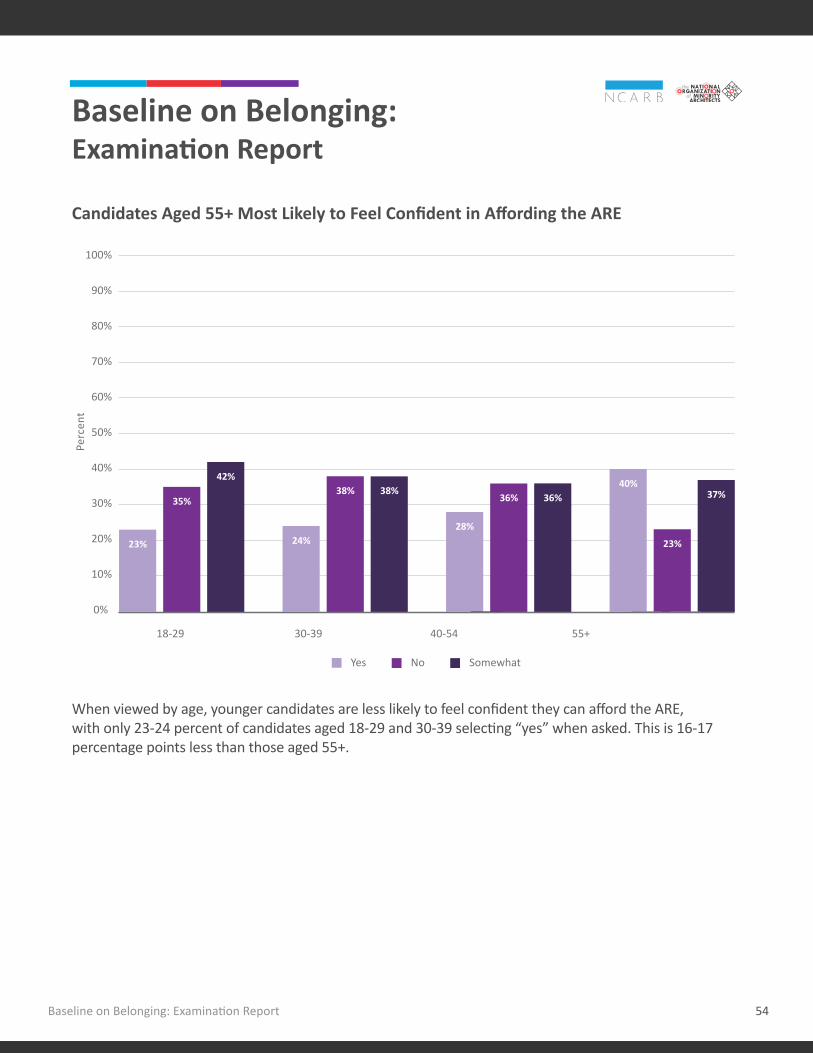
Candidates Aged 55+ Most Likely to Feel Confident in Affording the ARE
Perc
ent
0%
10%
20%
30%
40%
50%
60%
70%
80%
90%
100%
18-29 30-39 40-54 55+
23% 24%28%
36% 36%40%
23%
37%35%
42%38% 38%
Yes No Somewhat
When viewed by age, younger candidates are less likely to feel confident they can afford the ARE, with only 23-24 percent of candidates aged 18-29 and 30-39 selecting “yes” when asked. This is 16-17 percentage points less than those aged 55+.
55Baseline on Belonging: Examination Report
Baseline on Belonging: Examination Report
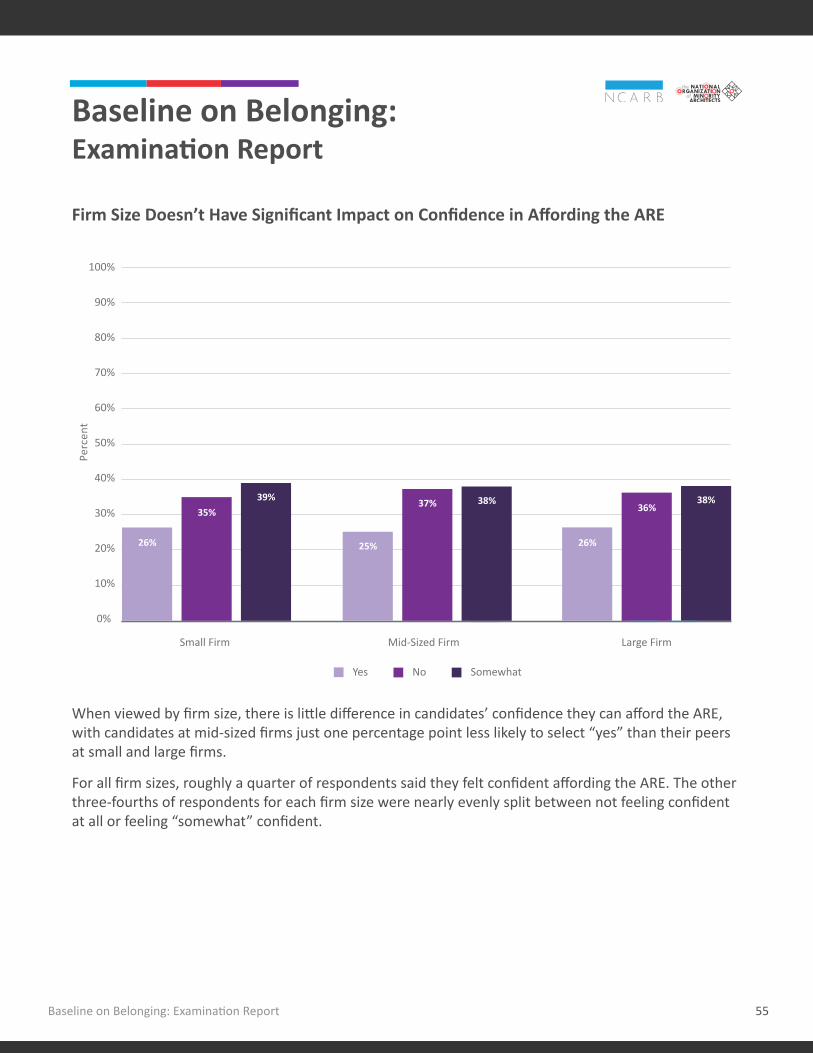
Firm Size Doesn’t Have Significant Impact on Confidence in Affording the ARE
Perc
ent
0%
10%
20%
30%
40%
50%
60%
70%
80%
90%
100%
Small Firm Mid-Sized Firm Large Firm
26% 25% 26%
36%38%
35%
39%37% 38%
81%
Yes No Somewhat
When viewed by firm size, there is little difference in candidates’ confidence they can afford the ARE, with candidates at mid-sized firms just one percentage point less likely to select “yes” than their peers at small and large firms.
For all firm sizes, roughly a quarter of respondents said they felt confident affording the ARE. The other three-fourths of respondents for each firm size were nearly evenly split between not feeling confident at all or feeling “somewhat” confident.

56Baseline on Belonging: Examination Report
Baseline on Belonging: Examination Report
Impacts on ARE AffordabilityNote: This question was asked only of respondents who were active ARE candidates.
When asked to indicate all the factors impacting their ability to afford the exam, nearly 75 percent of all candidates selected income and/or compensation. In addition, 54 percent selected college debt, 47 percent selected family obligations, and 42 percent selected personal debt.
The likelihood of selecting these factors varied slightly by demographic, with candidates of color more likely to select personal debt and family obligations compared to their white peers.
Firm size, however, did not have as large of an impact on these responses as it did on other aspects of exam affordability.

57Baseline on Belonging: Examination Report
Baseline on Belonging: Examination Report
\Black and Latino Candidates More Likely to Indicate Personal and Family Expenses Impacting Exam Affordability
Perc
ent
0%
10%
20%
30%
40%
50%
60%
70%
80%
90%
100%
White Black or AfricanAmerican
Hispanic or Latino Asian Other
College Debt Personal Debt Family Obligations Income and/orCompensation
60%
56%
63%
56%
46%49%50%
41%
74%
46%
71%
56%
47%
35%39% 40%
45%
53%
76%79%
73%
When asked to indicate the factors that impacted their ability to afford the ARE, African American and Latino candidates were more likely to select personal debt and family obligations than their white and Asian peers, with 50 percent of African American candidates selecting personal debt compared to just 35 percent of white candidates. Similarly, 56 percent of Latino candidates selected family obligations, compared to just 39 percent of white candidates.
Asian respondents were the most likely to indicate that their income contributed to their ability to afford the exam—8 percentage points more likely than Latino respondents, who were the least likely. And at 63 percent, African American candidates were the most likely to indicate college debt as impacting ARE affordability—7 percentage points higher than white and Latino candidates and 17 percentage points higher than Asian candidates.

58Baseline on Belonging: Examination Report
Baseline on Belonging: Examination Report
White Women Least Likely to Report Personal and Family Expenses Impacting Exam Affordability
Perc
ent
0%
10%
20%
30%
40%
50%
60%
70%
80%
90%
100%
WhiteMen
Black or African
AmericanMen
Hispanicor Latino
Men
AsianMen
WhiteWomen
Black or African
AmericanWomen
Hispanicor LatinaWomen
AsianWomen
College Debt Personal Debt Family Obligations Income
68%
47% 47%
76%
58%
51%
70%
66%
58%
52%
71%
47%
57%
32% 32%
76%
54%
73%
41%
48%
40%
34%
38%
81%
54%
41%
49%
77%
52%
49%
43%
75%
When viewed by both race/ethnicity and gender, white women were least likely to indicate that personal debt and family obligations impacted their ability to afford the ARE at 32 percent.
Asian women were most likely to report that their income impacted their ability to afford the exam—compared to just 75 percent of Asian men. White women were nearly equally as likely to indicate their income impacted their ability to afford the exam as white men, at 76 and 77 percent, respectively.
In contrast, African American women were far more likely to indicate that college debt impacted their ability to afford the exam compared to respondents of other races and ethnicities—14 percentage points more likely than white men and 28 percentage points higher than Asian women, who were the least likely to indicate college debt impacting exam affordability.

59Baseline on Belonging: Examination Report
Baseline on Belonging: Examination Report
Key Factors Impacting ARE Affordability Vary With Age
Perc
ent
0%
10%
20%
30%
40%
50%
60%
70%
80%
90%
100%
18-29 30-39 40-54 55+
College Debt Personal Debt Family Obligations Income and/or Compensation
63%
29%
78%
36%
59%
47%
75%
42%38%
69% 68%
49%
27%
62%
69%
43%
When viewed by age, younger candidates are more likely to report that college debt impacts their ability to afford the ARE compared to older candidates, with 63 percent of those in the 18-29 age group.
However, the reverse is true of family obligations— older candidates are much more likely to indicate that family expenses impacted the exam’s affordability compared to those aged 18-29.
Although candidates’ likelihood to select personal debt rose slightly with age, it didn’t vary as greatly as family and college expenses. Similarly, candidates’ likelihood to select income fell slightly with age, with those in the 18-29 age group 9 percentage points more likely to select this response than those aged 55+.

60Baseline on Belonging: Examination Report
Baseline on Belonging: Examination Report
Firm Size Doesn’t Have Significant Effect on Factors Impacting ARE Affordability
Perc
ent
0%
10%
20%
30%
40%
50%
60%
70%
80%
90%
100%
Small Firm Mid-Sized Firm Large Firm
College Debt Personal Debt Family Obligations Income and/or Compensation
50%
58%
45%
74%
57%
45%
74%
40%43%42%
49%
75%
Unlike some other areas related to the exam, most factors impacting the exam’s affordability did not change significantly when viewed by firm size.
Candidates at small firms were slightly more likely than their peers at mid-size and large firms to report family obligations by 1 percentage point as a factor impacting their ability to afford the exam, but 7-8 percentage points less likely indicate college debt.
Regardless of firm size, candidates were nearly equally as likely to select personal debt and income as factors impacting their ability to afford the ARE.

61Baseline on Belonging: Examination Report
Baseline on Belonging: Examination Report
Expected Contributors Toward ARE CostsNote: This question was asked only of respondents who were active ARE candidates. Recently licensed individuals or those who had completed the exam were asked to select the parties that did contribute toward the cost of the ARE.
When asked to indicate all the parties that would contribute toward the cost of the ARE, 97 percent of all active ARE candidate respondents selected themselves.
Despite anecdotal reports that most firms will help pay for the exam, just 46 percent—less than half—of respondents said that their firm would contribute to the exam’s cost. White and Asian candidates were more likely to report that their firm would contribute to the cost of the exam than African American and Latino candidates. However, the most significant factors in firm support to exam costs were firm size and candidate age, which both saw disparities of over 25 percent.
62Baseline on Belonging: Examination Report
Baseline on Belonging: Examination Report
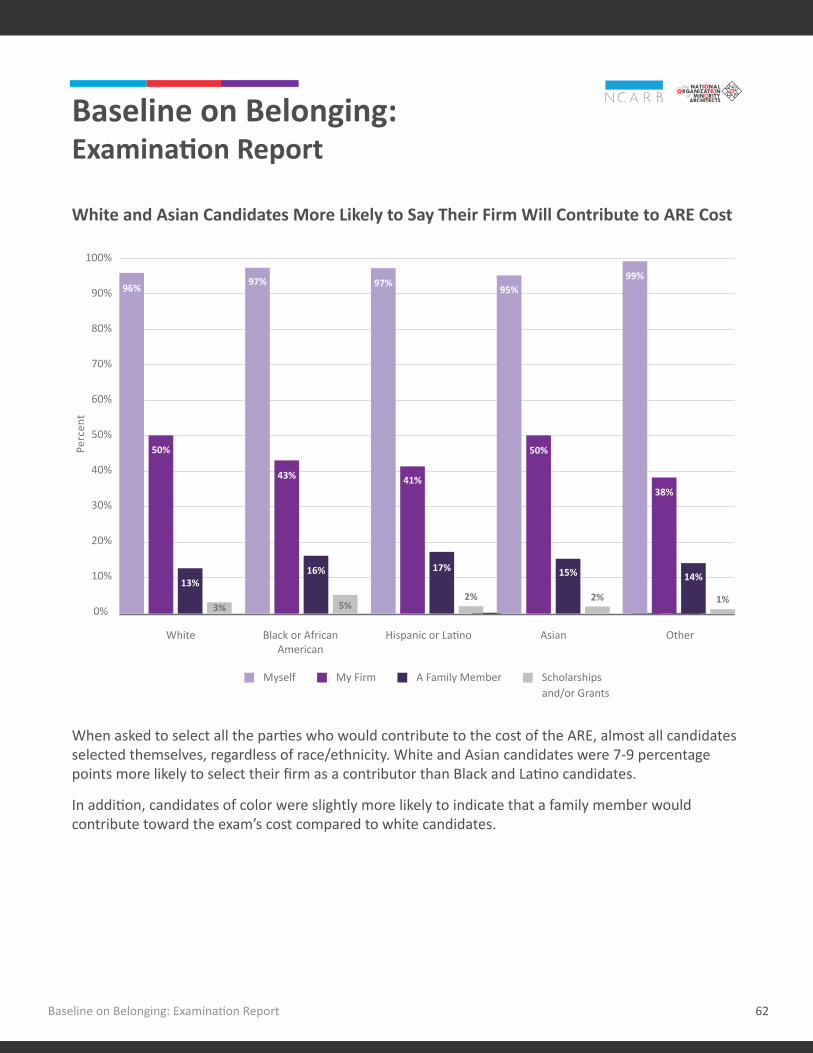
White and Asian Candidates More Likely to Say Their Firm Will Contribute to ARE Cost
Perc
ent
0%
10%
20%
30%
40%
50%
60%
70%
80%
90%
100%
White Black or AfricanAmerican
Hispanic or Latino Asian Other
Myself My Firm A Family Member Scholarships and/or Grants
58%
96%97% 97%
95%99%
43%
50%
5%
41%
2%
17%16%
50%
13%15%
38%
14%
3%2% 1%
When asked to select all the parties who would contribute to the cost of the ARE, almost all candidates selected themselves, regardless of race/ethnicity. White and Asian candidates were 7-9 percentage points more likely to select their firm as a contributor than Black and Latino candidates.
In addition, candidates of color were slightly more likely to indicate that a family member would contribute toward the exam’s cost compared to white candidates.

63Baseline on Belonging: Examination Report
Baseline on Belonging: Examination Report
White and Asian Women Most Likely to Say Their Firm Will Contribute to ARE Cost
Perc
ent
0%
10%
20%
30%
40%
50%
60%
70%
80%
90%
100%
96%98%
97%
17%
43%
7%2%
97% 97%
94%
98%
95%
45%
53%
4%
40%
1%
12%14%
42%
46%43%
3%
15%
10%
15%
21%
53%
16%
2%2% 1%
WhiteMen
Black or African
AmericanMen
Hispanicor Latino
Men
AsianMen
WhiteWomen
Black or African
AmericanWomen
Hispanicor LatinaWomen
AsianWomen
Myself My Firm A Family Member Scholarships and/or Grants
When gender is viewed with race/ethnicity, the disparity between respondents grows when it comes to external parties helping pay for the exam.
Women of most races/ethnicities were slightly more likely to indicate that their firm would help pay for the ARE compared to their male peers, with the exception of African American women—who were equally likely as African American men to report their firm contributing to the cost of the ARE.
At 53 percent, white and Asian women were the most likely of all respondents to say their firm would contribute to the cost of the ARE—11 and 13 percentage points more likely than Latina women and Latino men, respectively.
In addition, Latinas were the most likely to report that a family member would contribute toward the cost of the exam at 21 percent—11 percentage points higher than white men.

64Baseline on Belonging: Examination Report
Baseline on Belonging: Examination Report
Older Candidates Less Likely to Say Their Firm Will Contribute to ARE Cost
Perc
ent
0%
10%
20%
30%
40%
50%
60%
70%
80%
90%
100%
18-29 30-39 40-54 55+
Myself My Firm A Family Member Scholarships and/orGrants
58%
96% 97% 98% 98%
57%
15%
3%
47%
2% 1% 2%
15%
32%
21%
7%
15%
A candidate’s likelihood to report that their firm will contribute to the cost of the exam decreases dramatically with age. Nearly 60 percent of candidates in the 18-29 age group report their firm will help pay for the exam, compared to just 21 percent of those aged 55+. Even the 30-39 age group (which represents the largest cohort of exam candidates, according to NCARB’s data) is 10 percentage points less likely to report receiving firm support compared to their younger peers.

65Baseline on Belonging: Examination Report
Baseline on Belonging: Examination Report
Candidates at Large Firms More Likely to Say Their Firm Will Contribute to ARE Cost
Perc
ent
0%
10%
20%
30%
40%
50%
60%
70%
80%
90%
100%
Small Firm Mid-Sized Firm Large Firm
Myself My Firm A Family Member Scholarships and/orGrants
60%
97% 97% 96%
59%
2%
53%
3%
15%13%
30%
16%
2%
Segmenting the responses by firm size revealed that candidates working at large firms were nearly twice as likely to report that their firm would contribute to the cost of the exam compared to those at small firms. Nearly 60 percent of candidates indicated their firm would help pay for the exam, compared to 53 percent of those working at mid-size firms and 30 percent of those working at small firms.
66Baseline on Belonging: Examination Report
Baseline on Belonging: Examination Report
Firm Contribution Toward ARE CostsNote: This question was asked only of respondents who were recently licensed or those who had completed the exam.
When asked if their firm contributed to the cost of the exam, 45 percent of respondents who were licensed or had completed the ARE reported that their firm paid for the entire exam. Twenty percent reported that their firm paid for part of the ARE, and 34 percent said their firm did not contribute toward the cost of the exam (the remaining 1 percent of respondents were unsure).
Responses revealed some disparities by race/ethnicity and gender, with white respondents most likely to report receiving support toward the cost of the entire exam compared to their peers.
As with other areas related to exam support, age and firm size remained the most significant factors impacting a firm’s likelihood to pay for the ARE, with young respondents and respondents employed by large firms far more likely to receive monetary support than their peers.

67Baseline on Belonging: Examination Report
Baseline on Belonging: Examination Report
White and Asian Respondents More Likely to Receive Firm Support Toward ARE Cost
Perc
ent
0%
10%
20%
30%
40%
50%
60%
70%
80%
90%
100%
White Black or AfricanAmerican
Hispanic orLatino
OtherAsian
49%
20%
31%
37%
17%
49%
16%
35%
45% 44%
24%
31%
44%
20%
36%
Yes, they paid for the entire exam
Yes, they partiallypaid for the exam
No
When asked whether their firm had contributed to the cost of the exam, 49 percent of white respondents said their firm paid for the entire exam—4 and 5 percentage points higher than their Latino, African American, and Asian counterparts.
Asian respondents were the most likely to say that their firm partially paid for the exam at 24 percent, compared to 20 percent of white and African American respondents and 17 percent of Latino respondents.
African American and Latino respondents were nearly equally likely to say their firm did not contribute to the cost of the exam at all—5-6 percentage points higher than white and Asian respondents.

68Baseline on Belonging: Examination Report
Baseline on Belonging: Examination Report
Latino Men Most Likely to Receive No Firm Support Toward ARE Cost
Perc
ent
0%
10%
20%
30%
40%
50%
60%
70%
80%
90%
100%
WhiteMen
Black or African
AmericanMen
Hispanicor Latino
Men
AsianMen
WhiteWomen
Black or African
AmericanWomen
Hispanicor LatinaWomen
AsianWomen
48%
40%36%
24%21%
13%
39%
48%45%
43%
30%
25%
49%
31%
20%
49%
36%
15%
21%
35%
43%
19%
37%
31%
Yes, they paid for the entire exam
Yes, they partiallypaid for the exam
No
Viewing the responses by both race/ethnicity and gender reveals disparities between genders for people of color, but little difference between genders for white respondents.
White and African American women were the most likely of all respondents to report that their firm paid for the entire exam at 49 percent, with white and Latino men just one percentage point less likely at 48 percent. Conversely, just 40 percent of African American men and 43 percent of Latina and Asian women indicated that their firm would pay for the entire exam.
Latino men were the most likely to report that their firm did not contribute toward the cost of the exam at 39 percent—this is 8 percentage points higher than white men and women and 14 percentage points higher than Asian men.

69Baseline on Belonging: Examination Report
Baseline on Belonging: Examination Report
Older Respondents Less Likely to Receive Firm Support Toward ARE Cost
Perc
ent
0%
10%
20%
30%
40%
50%
60%
70%
80%
90%
100%
18-29 30-39 40-54 55+
58%
45%
34%
16%
50%
41%
6%
53%
15%
26%24%
31%
Yes, they paid for the entire exam
Yes, they partiallypaid for the exam
No
A respondent’s likelihood to report that their firm paid the cost of the entire exam decreases dramatically with age. Nearly 60 percent of candidates in the 18-29 age group report that their firm paid for the entire ARE, compared to just 34 percent of those aged 40+.
Half of respondents aged 40+ reported receiving no firm support toward the cost of the exam, compared to 31 percent of those aged 30-39 and 26 percent of those aged 18-29.

70Baseline on Belonging: Examination Report
Baseline on Belonging: Examination Report
Respondents at Large Firms Nearly Twice as Likely to Receive Firm Support for Entire ARE Cost
Perc
ent
0%
10%
20%
30%
40%
50%
60%
70%
80%
90%
100%
Small Firm Mid-Sized Firm Large Firm
31%
46%
59%
21% 20%
14%
54%
26%28%
81%
Yes, they paid for the entire exam
Yes, they partiallypaid for the exam
No
Segmenting the responses by firm size revealed that respondents working at large firms were nearly twice as likely to report that their firm paid for the entire exam compared to those working at small firms. Respondents at mid-sized firms were the most likely to report that their firm partially paid for the exam. Over half of respondents at small firms reported receiving no firm support toward the cost of the ARE, compared to just 28 percent of those at mid-sized firms and 20 percent of those at large firms.

71Baseline on Belonging: Examination Report
Baseline on Belonging: Examination Report
Difficulty Affording the ARENote: This question was asked only of respondents who were recently licensed or had passed the ARE and reported that they partially or fully paid for their exam cost.
When asked if they had personally experienced difficulty paying for the ARE, 36 percent of all respondents that completed the ARE or were recently licensed said yes. An additional 29 percent of respondents reported some difficulty paying for the exam and another 35 percent reported having no difficulty affording the exam. Unlike other areas related to the exam, firm size and age did not significantly impact respondents’ likelihood to report facing difficulty paying for the exam. Instead, race and ethnicity and gender revealed larger disparities in this area.

72Baseline on Belonging: Examination Report
Baseline on Belonging: Examination Report
White and Asian Respondents Less Likely to Report Difficulty Paying for the Exam
Perc
ent
0%
10%
20%
30%
40%
50%
60%
70%
80%
90%
100%
White Black or AfricanAmerican
Hispanic orLatino
OtherAsian
31%
38%
31%29%
31% 32%
21%
47%
40%
34%
38%
28%
34% 35%31%
Yes No Somewhat
When asked if they had experienced personal difficulty paying for the cost of the ARE, 38 percent of white and Asian respondents indicated they had not—3 percentage points higher than African American respondents and 7 percentage points higher than Latino respondents.
While white and African American respondents were the most likely to report experiencing “somewhat” difficulty paying for the exam, Latino respondents were the most likely to report experiencing difficulty affording the exam—9 percentage points more likely than white respondents.

73Baseline on Belonging: Examination Report
Baseline on Belonging: Examination Report
African American and Latina Women More Likely to Report Difficulty Paying for the Exam
Perc
ent
0%
10%
20%
30%
40%
50%
60%
70%
80%
90%
100%
WhiteMen
Black or African
AmericanMen
Hispanicor Latino
Men
AsianMen
WhiteWomen
Black or African
AmericanWomen
Hispanicor LatinaWomen
AsianWomen
32%
37%
53%
10%
26%
39%
33%
28%
35%
31%29%
51%
27%
33%
38% 36%
58%
13%
30%33%
29%
38%
19%
42%
Yes SomewhatNo
When viewed by both race/ethnicity and gender, women of all races/ethnicities were equally or more likely to report some level of difficulty paying for the cost of the exam compared to their male peers.
When asked if they experienced difficulty affording the exam, Latinas were the most likely to select “yes” at 51 percent, compared to just 31 percent of white women and 28 percent of Latino men.
African American women were far less likely than other groups to select “no” at just 13 percent—29 percentage points less than white men and 40 percentage points less than African American men. African American women, were also the most likely of all groups to select “somewhat” difficulty at 58 percent, compared to white men at 26 percent.
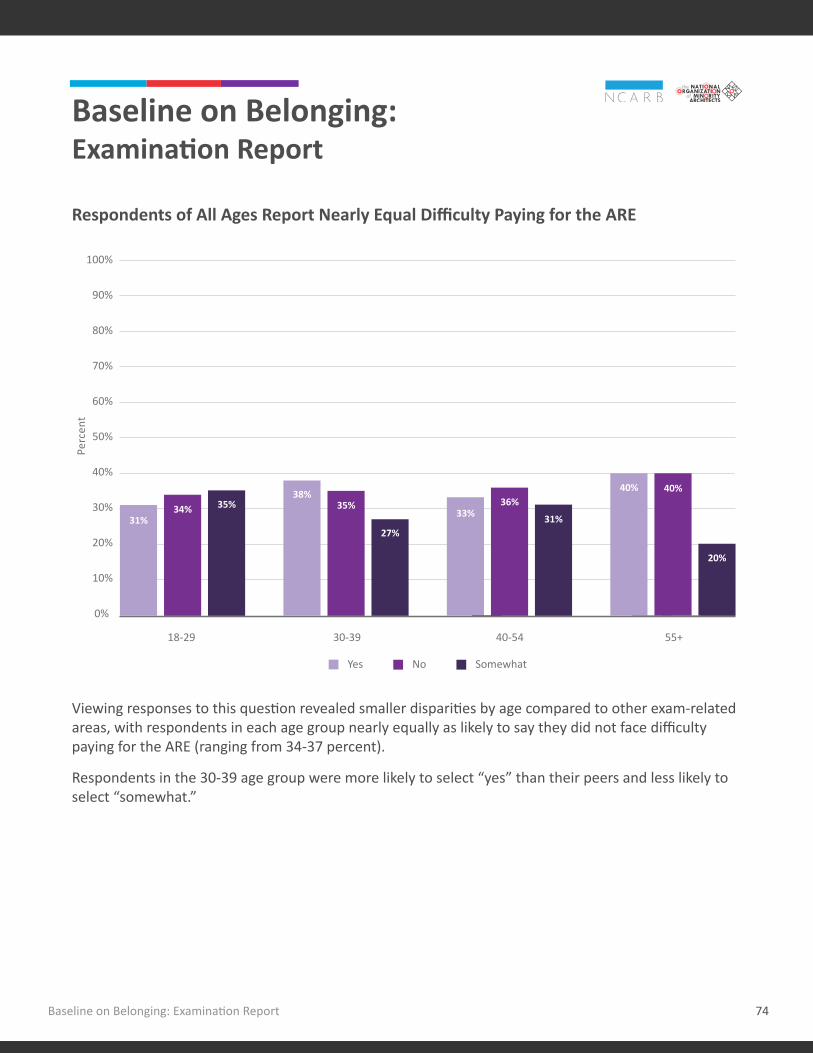
74Baseline on Belonging: Examination Report
Baseline on Belonging: Examination Report
Respondents of All Ages Report Nearly Equal Difficulty Paying for the ARE
Perc
ent
0%
10%
20%
30%
40%
50%
60%
70%
80%
90%
100%
18-29 30-39 40-54 55+
31%
38%
33%36%
31%
40% 40%
20%
34% 35% 35%
27%
81%
Yes No Somewhat
Viewing responses to this question revealed smaller disparities by age compared to other exam-related areas, with respondents in each age group nearly equally as likely to say they did not face difficulty paying for the ARE (ranging from 34-37 percent).
Respondents in the 30-39 age group were more likely to select “yes” than their peers and less likely to select “somewhat.”

75Baseline on Belonging: Examination Report
Baseline on Belonging: Examination Report
Firm Size Doesn’t Have Significant Impact on Ability to Afford the ARE
Perc
ent
0%
10%
20%
30%
40%
50%
60%
70%
80%
90%
100%
Small Firm Mid-Sized Firm Large Firm
34%36% 36% 35%
29%
37%
29%33%
31%
81%
Yes No Somewhat
Despite differences in affording the exam across age groups, there was little difference in respondents’ likelihood to report difficulty paying for the exam when viewed by firm size. Respondents employed by small firms were slightly less likely to say they experienced difficulty affording the ARE compared to their peers.

76Baseline on Belonging: Examination Report
Baseline on Belonging: Examination Report
Next Steps
Responses to the preliminary study provided insight into candidates’ challenges during the examination process and illuminated areas for NCARB and NOMA to pursue for further research. For example, some key insights from the report raise important questions—including why candidates at larger firms are more likely to receive financial support for the exam, or why candidates that identify as racial and ethnic minorities are more likely to spend more on exam-related costs.
• Why are candidates at small firms less likely to receive financial support for the exam and exam-related costs?
o Is this purely due to economic affordability for small firms?
o Do small and large firms have different perspectives on the value of licensure and the benefit to their firm?
o Are small firms more likely to regard licensure as an individual pursuit?
o Do small firms have less need or benefit in their employees becoming licensed.
• How do socioeconomic factors faced by candidates of color affect their ability to afford the exam?
o How do personal debt and other financial obligations impact a candidate’s ability to take the exam?
o Are candidates deferring testing due to affordability concerns?
o Does affordability slow down the testing process for candidates under financial stress?
o Is affordability limiting candidates’ ability to access test prep materials?
• Why are candidates of color less likely to receive firm support for the exam and exam-related costs?
o Are there examples where a specific firm is treating candidates differently?
• How might differences in treatment affect a candidates’ ability to perform or focus on preparing for the exam?
o Are Latino candidates less likely to receive firm support because they are more likely to work in small firms?
o I s financial support an established and defined benefit or are candidates having to advocate and negotiate to gain exam support?
• If the latter, are candidates equally empowered to advocate for support, and are there other influencing factors?

77Baseline on Belonging: Examination Report
Baseline on Belonging: Examination Report
o What is the mechanism for financial support—are candidates being reimbursed, or are they provided funds in advance? Is financial support dependent on successful performance?
o Does the lack of more senior minority professionals in the profession affect minority candidates’ ability to receive firm support?
• Option C: How do women of color navigate facing disproportionate challenges affording, preparing for, and taking the ARE?
o How are women of color specifically impacted by the intersection of both gender and race/ethnicity, in a profession historically led by white males?
o How do debt and other financial obligations (which disproportionally affect women of color) specifically impact their ability to prepare for the exam.
o Does the lack of female, minority mentors impact women of color in preparing for and taking the exam? If so, how?
• Key question- Age (Receiving firm support)
o Are older candidates receiving less firm support because they are more likely to work in a small firm?
o Are firms regarding older candidates as being more financially self-sufficient and therefore requiring less support?
o Are older candidates disadvantaged because firm culture toward licensure focused on r ecent graduates?
o If licensure becomes a recent pursuit for an established contributor, is it harder for that candidate to establish support structures?
o Is succession planning within firms a driver for older candidates to pursue licensure?
In Phase #2, NOMA and NCARB will look to further explore these questions by conducting focus groups and follow-up micro surveys to further explore these important questions. By conducting a drill-down study of the disparities revealed in this report, NCARB and NOMA aim to propose targeted actions that will lead to measurable progress in ensuring all candidates can succeed on the path to licensure.

78Baseline on Belonging: Examination Report
Baseline on Belonging: Examination Report
Appendix: Baseline on Belonging SurveySummary
NCARB partnered with NOMA to obtain information from licensed architects, licensure candidates actively working toward licensure, and professionals no longer interested in obtaining a license. The appendix provides an overview of the project methodology, survey structure, participant demographics, and data collected by NCARB to provide further insight on the path to licensure.
A total of 5,341 participants completed the online survey answering a series of multiple choice, open-ended, and Likert-scale questions developed jointly by NCARB and NOMA to identify and understand areas where minority professionals and other underrepresented groups experience obstacles on the path to licensure.
MethodologyAudience
The Baseline on Belonging survey was distributed via email by both NCARB and NOMA from February 19 – March 4, 2020, to approximately 70,000 targeted NCARB Record holders and all NOMA members. NCARB and NOMA publicly distributed the survey through channels such as Facebook, Twitter, and Instagram. Recipients were also strongly encouraged to share the survey with their peers.

79Baseline on Belonging: Examination Report
Baseline on Belonging: Examination Report
The survey was intentionally shared to a large pool of professionals of color, as well as women, for a fair sample size within the architecture profession. In addition, participants had to be either recently licensed, a licensure candidate, or a professional who is no longer interested in pursuing an architecture license.
We targeted the following audiences to complete the survey:
• Professionals who are no longer interested in becoming licensed to understand and identify their reasoning for deciding not to become a licensed architect. This includes inactive NCARB Record holders.
• Inactive licensure candidates who at some point decided to take a break from earning a license but still plan to become licensed in the future.
• Active licensure candidates who are actively going through the experience of getting an architecture education, working in a firm, and/or preparing for the Architect Registration Examination® (ARE®).
• Architects who were licensed within the last three years to ensure we are gathering data from architects who’ve experienced the current licensure process.
Survey ParticipantsThe survey received a total of 6,902 responses, including both complete and partial responses. Findings of this survey found in the Baseline on Belonging reports only include complete responses totaling to 5,341. The survey results also include over 13,000 open-ended responses from optional open-ended questions.
Survey participants represent the following demographics.
Race/Ethnicity Segments
Race/Ethnicity Count Percentage of Total
White 1,852 37%Black or African American 692 13.8%Hispanic or Latino 1,320 26.4%Asian 861 17.2%Other 279 5.6%Total 5,004 100%

80Baseline on Belonging: Examination Report
Baseline on Belonging: Examination Report
Race/Ethnicity Breakdown by Race Segments
Race/Ethnicity Segment Race Count Percentage of Total
White White 1,852 38%Black or African American 39 0.8%Asian 93 1.9%American Indian or Alaska Native
31 0.6%
Native Hawaiian or Other Pacific Islander
13 0.3%
Some other race 23 0.5%Black or African American White 62 1.3%
Black or African American 692 14.2%Asian 15 0.3%American Indian or Alaska Native
19 0.4%
Native Hawaiian or Other Pacific Islander
7 0.1%
Some other race 6 0.1%Hispanic or Latino White 580 11.9%
Black or African American 65 1.3%Asian 34 0.7%American Indian or Alaska Native
75 1.5%
Native Hawaiian or Other Pacific Islander
13 0.3%
Some other race 559 11.5%Asian White 99 2%
Black or African American 15 0.3%Asian 861 17.7%American Indian or Alaska Native
11 0.2%
Native Hawaiian or Other Pacific Islander
18 0.4%
Some other race 18 0.4%

81Baseline on Belonging: Examination Report
Baseline on Belonging: Examination Report
Race/Ethnicity Segment Race Count Percentage of Total
Other White 59 1.2%Black or African American 15 0.3%Asian 21 0.4%American Indian or Alaska Native
57 1.2%
Native Hawaiian or Other Pacific Islander
27 0.6%
Some other race 205 4.2%
Total 5,379 100%
Ethnicity
Ethnicity Count Percentage of Total
Hispanic or Latino 1,320 28%Non-Hispanic or Latino 3,386 72%Total 4,706 100%
Race/Ethnicity and Gender
Race/Ethnicity and Gender Count Percentage of Total
White Men 879 18.8%Black or African American Men 369 7.9%Hispanic or Latino Men 662 14.2%Asian Men 347 7.4%White Women 952 20.4%Black or African American Women 319 6.8%Hispanic or Latina Women 647 13.8%Asian Women 498 10.7%Total 4,673 100%
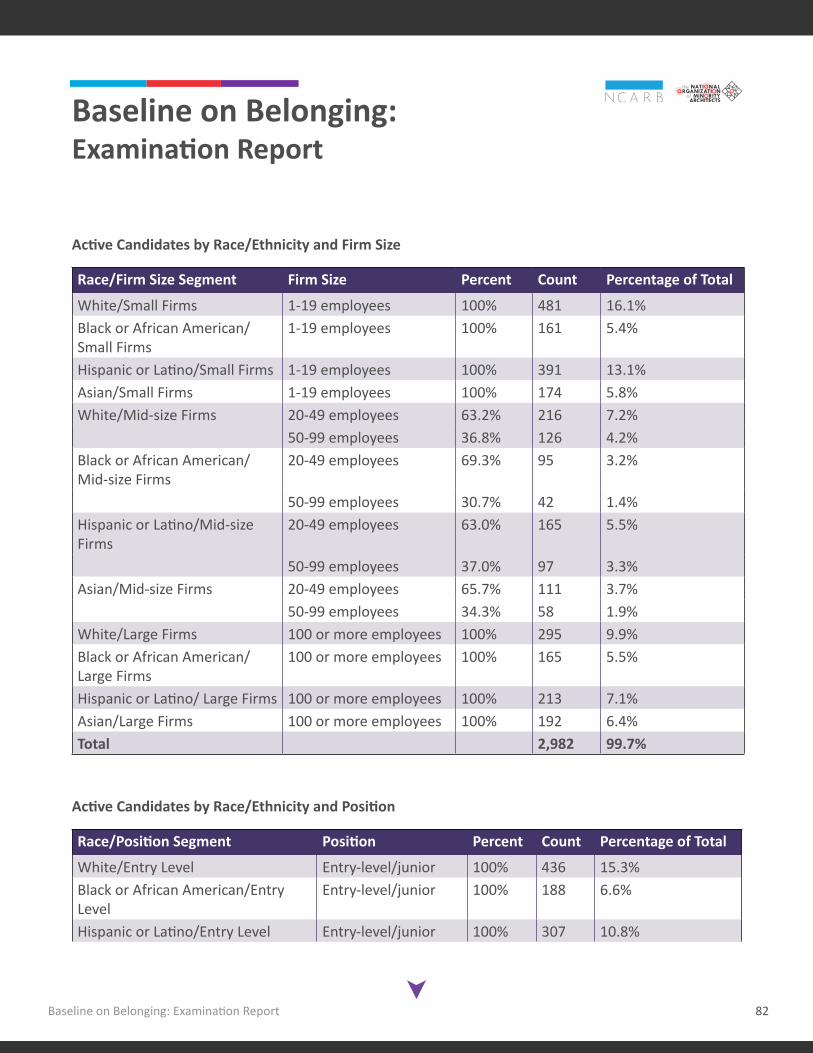
82Baseline on Belonging: Examination Report
Baseline on Belonging: Examination Report
Active Candidates by Race/Ethnicity and Firm Size
Race/Firm Size Segment Firm Size Percent Count Percentage of Total
White/Small Firms 1-19 employees 100% 481 16.1%Black or African American/Small Firms
1-19 employees 100% 161 5.4%
Hispanic or Latino/Small Firms 1-19 employees 100% 391 13.1%Asian/Small Firms 1-19 employees 100% 174 5.8%White/Mid-size Firms 20-49 employees 63.2% 216 7.2%
50-99 employees 36.8% 126 4.2%Black or African American/Mid-size Firms
20-49 employees 69.3% 95 3.2%
50-99 employees 30.7% 42 1.4%Hispanic or Latino/Mid-size Firms
20-49 employees 63.0% 165 5.5%
50-99 employees 37.0% 97 3.3%Asian/Mid-size Firms 20-49 employees 65.7% 111 3.7%
50-99 employees 34.3% 58 1.9%White/Large Firms 100 or more employees 100% 295 9.9%Black or African American/Large Firms
100 or more employees 100% 165 5.5%
Hispanic or Latino/ Large Firms 100 or more employees 100% 213 7.1%Asian/Large Firms 100 or more employees 100% 192 6.4%Total 2,982 99.7%
Active Candidates by Race/Ethnicity and Position
Race/Position Segment Position Percent Count Percentage of Total
White/Entry Level Entry-level/junior 100% 436 15.3%Black or African American/Entry Level
Entry-level/junior 100% 188 6.6%
Hispanic or Latino/Entry Level Entry-level/junior 100% 307 10.8%

83Baseline on Belonging: Examination Report
Baseline on Belonging: Examination Report
Race/Position Segment Position Percent Count Percentage of Total
Asian/Entry Level Entry-level/junior 100% 257 9.0%White/Mid-level Mid-level/associate 72.4% 444 15.6%
Manager/supervisor 27.6% 169 5.9%Black or African American/Mid-level Mid-level/associate 74.8% 193 6.8%
Manager/supervisor 25.2% 65 2.3%Hispanic or Latino/Mid-level Mid-level/associate 70.2% 368 12.9%
Manager/supervisor 29.8% 156 5.5%Asian/Mid-level Mid-level/associate 77.1% 202 7.1%
Manager/supervisor 22.9% 60 2.1%Total 2,845 99.9%
Race/Ethnicity and Age
Race/Age Segment Age Percent Count Percentage of Total
White 18-29 18-24 20.6% 142 3%25-29 79.4% 546 11.6%
Black or African American 18-29 18-24 17.2% 40 0.8%25-29 82.8% 193 4.1%
Hispanic or Latino 18-29 18-24 14.8% 62 1.3%25-29 85.2% 356 7.5%
Asian 18-29 18-24 16.9% 54 1.1%25-29 83.1% 265 5.6%
White 30-39 30-34 61.6% 461 9.8%35-39 38.4% 287 6.1%
Black or African American 30-39 30-34 60.0% 165 3.5%35-39 40.0% 110 2.3%
Hispanic or Latino 30-39 30-34 56.4% 310 6.6%35-39 43.6% 240 5.1%
Asian 30-39 30-34 64.3% 232 4.9%35-39 35.7% 129 2.7%
White 40+ 40-44 40.4% 168 3.6%45-54 40.9% 170 3.6%

84Baseline on Belonging: Examination Report
Baseline on Belonging: Examination Report
Race/Age Segment Age Percent Count Percentage of Total
55-64 17.1% 71 1.5%65 or higher 1.7% 7 0.1%
Black or African American 40+ 40-44 39.7% 73 1.5%45-54 41.3% 76 1.6%55-64 14.1% 26 0.6%65 or higher 4.9% 9 0.2%
Hispanic or Latino 40+ 40-44 40.4% 141 3.0%45-54 44.7% 156 3.3%55-64 12.6% 44 0.9%65 or higher 2.3% 8 0.2%
Asian 40+ 40-44 44.4% 80 1.7%45-54 46.7% 84 1.8%55-64 7.8% 14 0.3%65 or higher 1.1% 2 0%
Total 4,721 99.9%
Age
Age Segment Age Percent Count Percentage of Total
18-29 18-24 18.2% 295 6.2%25-29 81.8% 1,324 27.9%
30-39 30-34 60.1% 1,172 24.7%35-39 39.9% 777 6.4%
40-54 40-44 48.6% 476 10%45-54 51.4% 503 0.6%
55+ 55-64 86.5% 166 3.5%65 or higher 13.5% 26 0.5%
Total 4,739 100%

85Baseline on Belonging: Examination Report
Baseline on Belonging: Examination Report
NCARB DataNCARB data provided additional insight on the path to licensure experienced by licensure candidates who met the survey participant criteria. NCARB maintains a database on licensure candidates and Certificate holders. This allows us to track the progression of candidates as they move through the AXP, ARE, and beyond. Some of the data is self-reported, including age, race, and geographic location. Other data is triggered by candidate actions such as starting the AXP or completing the ARE.
Survey StructureThe survey was designed to take a comprehensive look at the licensure process and early career experience, based on a respondent’s licensure status. It was structured around the following topics:
1. Perspective and motivation on becoming licensed2. College education and culture3. Finding employment at an architecture firm4. Gaining AXP experience in an architecture firm5. Firm culture and support6. Supervisor/candidate relationship7. Preparing for the ARE8. Demographic questions
All respondents were asked to share their initial reasoning for wanting to be an architect. Professionals no longer pursuing a license were asked at what point in their career they decided not to become licensed.
All respondents who indicated they had or were currently working on earning an architecture degree were asked about their experiences with their professors and classmates, as well as what obstacles they may have faced while in school.
Respondents who indicated they were working or had worked in a firm were asked how and when they gained employment in a firm after graduation, and respondents who had earned AXP credit were asked to share positive and negative factors that impacted their AXP experience. In addition, respondents who’ve worked in a firm were also asked about their firm’s culture, diversity, and support for candidates preparing for and taking the ARE.

86Baseline on Belonging: Examination Report
Baseline on Belonging: Examination Report
Survey Values Percent Count
Are you a licensed architect?Yes 25.6% 1,367No 74.1% 3,956I have retired 0.3% 18How long have you been licensed?Less than a year 31.1% 4251-3 years 27.2% 3723 or more years 41.7% 570Which of the following best represents your status on becoming a licensed architect?I am actively working toward gaining a license 76.5% 3,027I am not currently working toward gaining a license but plan to in the future
15.9% 630
I am no longer interested becoming a licensed architect 7.6% 299What impacted your decision not to pursue licensure? Select all that apply.Lack of open positions in my area 7.4% 22I am no longer interested in architecture 15.8% 47Pay/compensation 50% 149Work-life balance 51% 152Personal obligations 10.7% 32Firm culture 36.9% 110Found a better opportunity 23.8% 71Cost of becoming licensed (exam fees, renewal fee, etc.) 57.7% 172None of the above 1.3% 4Other 43.6% 130What impacted your decision not to pursue licensure? Select all that apply.At what point in your career did you decide not to become an architect? [Open text]During college 6% 18While searching for employment at an architecture firm 7% 21While working in an architecture firm 46.3% 138After taking an ARE division 19.1% 57Other 21.5% 64

87Baseline on Belonging: Examination Report
Baseline on Belonging: Examination Report
Survey Values Percent Count
Which of the following best represent your initial reason for pursuing a license? Select up to three.Opportunity for a promotion 40% 1,900The ability to have my own architecture firm/work independently 53.7% 2,551The ability to call myself an architect 71.5% 3,399Respect from peers, family, and/or friends 31% 1,472The potential to earn more money 56.9% 2,703A license is required by my firm 2.9% 137None of the above 2.7% 127Would you consider returning to architecture if possible? Please explain. [Open text]After you earned your license, did any of the following occur as a result of your licensed status? Select all that apply.I received a promotion 25.3% 202I received a raise 49.8% 397I had new opportunities within my firm 27.7% 221I was made a direct supervisor of a licensure candidate 5.1% 41My firm, team, and/or supervisor celebrated my accomplishment 52.3% 417I started my own practice and/or work independently 10.4% 83I took a position with another firm 16.3% 130None of the above 14.1% 112Other 6.4% 51Did you earn a degree in architecture?Yes 91.6% 4,353No 4.9% 232I am currently pursuing a degree in architecture 3.5% 167Did you earn your architecture degree from a program accredited by the National Architectural Accrediting Board (NAAB)?Yes 81.6% 3,691No 16.2% 733Unsure 1.9% 86I don’t know what a NAAB-accredited program is 0.3% 12Is your architecture degree from a country or territory outside of the United States?Yes 15.9% 721No 84.1% 3,801

88Baseline on Belonging: Examination Report
Baseline on Belonging: Examination Report
Survey Values Percent Count
Thinking about your college experience, please rate your level of agreement with each statement below.The education I received in college prepared me for a career in architecture Strongly disagree 5.9% 268Disagree 13.6% 614Neutral 19% 858Agree 39.6% 1,792Strongly Agree 21.5% 971N/A 0.4% 19I had professors who made me excited about learning Strongly disagree 2.2% 99Disagree 3.8% 173Neutral 10.8% 487Agree 38.3% 1,730Strongly Agree 44.7% 2,022N/A 0.2% 11I had an advisor who helped me get the most of my academic experience Strongly disagree 10.6% 478Disagree 20.1% 908Neutral 24.9% 1,124Agree 24.8% 1,120Strongly Agree 17.7% 799N/A 2.1% 93I felt like I belonged in my architecture school Strongly disagree 4.6% 206Disagree 9.2% 418Neutral 18.7% 847Agree 33.7% 1,522Strongly Agree 33.5% 1,514N/A 0.3% 15My classmates encouraged me to pursue licensure Strongly disagree 7.1% 322

89Baseline on Belonging: Examination Report
Baseline on Belonging: Examination Report
Survey Values Percent Count
Disagree 17.8% 806Neutral 34.9% 1,578Agree 23.1% 1,044Strongly Agree 12.7% 574N/A 4.4% 198My professor encouraged me to pursue licensure Strongly disagree 7.2% 326Disagree 16.9% 765Neutral 30.1% 1,360Agree 25.4% 1,149Strongly Agree 16.6% 749N/A 3.8% 173My architecture school values diversity and inclusion Strongly disagree 3.4% 156Disagree 5.7% 260Neutral 21% 951Agree 35.4% 1,600Strongly Agree 32.7% 1,479N/A 1.7% 76Which of the following positively impacted you while pursuing a degree in architecture? Select all that apply.Architecture school culture 58.2% 2,629Access to study groups or peers 28.3% 1,277Access to professors or mentors 47.6% 2,153Financial support from family 38.7% 1,748Personal financial stability 17.1% 772Scholarships 34.6% 1,566Support from family and friends 62.6% 2,828Quality of education 56.5% 2,554Diversity and/or representation in classrooms 23.1% 1,044

90Baseline on Belonging: Examination Report
Baseline on Belonging: Examination Report
Survey Values Percent Count
School course schedule 22.3% 1,006Other 6.7% 302Which of the following negatively impacted you while pursuing a degree in architecture? Select all that apply.College tuition 55.8% 2,521Purchasing books and study materials 42.0% 1,899Studio class materials 36.5% 1,652Architecture school culture 31.2% 1,410Speaking English as a second language 6.8% 306Personal obligations (i.e., family, work, or dependents) 29.0% 1,312Lack of diversity and/or representation in classrooms 20.1% 910Access to study groups or peers 7.9% 359Access to professors or mentors 14.3% 645None of the above 12.2% 553Other 8.0% 361Did you ever consider not pursuing a career in architecture while in college?Yes 41.2% 1,863No 53.9% 2,437Unsure 4.9% 220In your own words, what are some factors that made you reconsider pursuing a career in architecture? [Open Text]Are you currently working in an architecture firm?Yes 78.2% 3,716No, but I previously worked in an architecture firm 19.5% 929I have never worked in an architecture firm 2.3% 107What field/industry are you working in now?Engineering 5.9% 55Landscape architecture 0.2% 2Construction 14.2% 132Interior design 4.2% 39Real estate 5% 47University/college 7% 65Urban planning 1.5% 14

91Baseline on Belonging: Examination Report
Baseline on Belonging: Examination Report
Survey Values Percent Count
Government or nonprofit 12% 112I am unemployed 19.7% 183Other 30.3% 282How soon after graduating college were you employed at an architecture firm?0-3 months 49.8% 2,222Less than a year 16.7% 7471-2 years 8.7% 3873 or more years 6.8% 302I was working in an architecture firm while I was in college 18% 805How did you find your position at an architecture firm?Online job search 28.7% 1,282Career event (job fair, recruitment event, industry convention, etc.) 9.7% 432Recommended by peers 7.9% 352Referral from a colleague and/or friend 19.1% 854Referral from my college professor or advisor 10% 445Referral from a family member 5% 225My college has a relationship with the firm 2.8% 127Social media or advertisement 2.5% 112None of the above 4.3% 194Other 9.8% 439Have you documented any experience hours toward the AXP?Yes 90.5% 4,040No 9.5% 422Please rate your level of agreement with the following statements.It was easy to find a local firm that could support me in gaining AXP experience Strongly disagree 4.7% 192Disagree 7.7% 314Neutral 16% 650Agree 36.9% 1,494Strongly agree 32.5% 1,317N/A 2.1% 85My firm provided a variety of opportunities to help me gain experience credit in all experience areas

92Baseline on Belonging: Examination Report
Baseline on Belonging: Examination Report
Survey Values Percent Count
Strongly disagree 4.7% 189Disagree 10.2% 415Neutral 14.6% 591Agree 37.3% 1,509Strongly agree 32.3% 1,310N/A 0.9% 37My firm encourages candidates to become licensed Strongly disagree 3.8% 156Disagree 7.2% 293Neutral 16.4% 663Agree 32.3% 1,309Strongly agree 39.1% 1,585N/A 1.1% 46I believe my firm compensates me fairly compared to my peers Strongly disagree 7.9% 320Disagree 15.8% 640Neutral 25.3% 1,025Agree 32.3% 1,308Strongly agree 16.8% 680N/A 1.9% 78I feel valued at my firm Strongly disagree 5% 201Disagree 9.2% 371Neutral 19.6% 796Agree 39.0% 1,578Strongly agree 26% 1,055N/A 1.2% 50My experiences since working in a firm have motivated me to become licensed Strongly disagree 5.8% 233Disagree 10.1% 407

93Baseline on Belonging: Examination Report
Baseline on Belonging: Examination Report
Survey Values Percent Count
Neutral 18.4% 743Agree 34.9% 1,413Strongly agree 29.5% 1,196N/A 1.4% 57Thinking about your relationship with your AXP supervisor, please rate your level of agreement with the following statements.My AXP supervisor provided a variety of opportunities to help me gain AXP hours in all experience areas Strongly disagree 4.1% 165Disagree 9.5% 386Neutral 19.8% 800Agree 37.1% 1,499Strongly agree 26.2% 1,059N/A 3.3% 133My supervisor was supportive of my path toward licensure Strongly disagree 2.5% 100Disagree 4.2% 171Neutral 14.7% 596Agree 39.7% 1,605Strongly agree 36.2% 1,461N/A 2.7% 108My supervisor was fully engaged and aware of my progression Strongly disagree 4.8% 193Disagree 12.9% 523Neutral 24.2% 977Agree 32.3% 1,305Strongly agree 23.2% 938N/A 2.6% 105My supervisor treats me with respect Strongly disagree 2.1% 85

94Baseline on Belonging: Examination Report
Baseline on Belonging: Examination Report
Survey Values Percent Count
Disagree 2.9% 118Neutral 11.1% 449Agree 40.7% 1,643Strongly agree 40.6% 1,639N/A 2.6% 107I can voice contrary opinions to my supervisor without fear of negative consequences Strongly disagree 4.4% 178Disagree 7.5% 305Neutral 16.7% 676Agree 38.7% 1,563Strongly agree 29% 1,170N/A 3.7% 149Have you faced challenges that made it difficult for you to earn AXP credit?Yes 24.9% 1,005No 60.3% 2,435Somewhat 14.9% 601Please expand on these challenges. [Open Text]Thinking about your firm’s work culture, please rate your level of agreement with the following statements.My firm respects individuals and values their differences Strongly disagree 2.7% 111Disagree 6.1% 245Neutral 17.5% 705Agree 42.5% 1,716Strongly agree 29.5% 1,193N/A 1.7% 70I feel like I belong in my firm Strongly disagree 4% 162Disagree 8.2% 331Neutral 20.1% 812Agree 38.7% 1,562Strongly agree 27.3% 1,101

95Baseline on Belonging: Examination Report
Baseline on Belonging: Examination Report
Survey Values Percent Count
N/A 1.8% 72My firm culture is diverse and inclusive Strongly disagree 4.3% 172Disagree 11.9% 480Neutral 21.1% 852Agree 35.5% 1,436Strongly agree 24.8% 1,002N/A 2.4% 98Employees who are different from most others are treated fairly at my firm Strongly disagree 3.1% 124Disagree 7.4% 299Neutral 18.8% 759Agree 41% 1,655Strongly agree 26% 1,050N/A 3.8% 153Employees of different backgrounds are encouraged to apply for higher positions Strongly disagree 4.9% 198Disagree 10.9% 442Neutral 29.5% 1,190Agree 26.2% 1,060Strongly agree 17.8% 719N/A 10.7% 431Employees of different backgrounds interact well within our firm Strongly disagree 2.0% 81Disagree 5.2% 210Neutral 18.3% 738Agree 43.8% 1,768Strongly agree 26% 1,052N/A 4.7% 191My firm’s work culture has positively impacted my career progression Strongly disagree 5.1% 206Disagree 8.3% 336

96Baseline on Belonging: Examination Report
Baseline on Belonging: Examination Report
Survey Values Percent Count
Neutral 21.1% 851Agree 37.3% 1,505Strongly agree 25.7% 1,039N/A 2.5% 103Diversity is a barrier to progression at my firm Strongly disagree 20.4% 824Disagree 33.1% 1,336Neutral 22.6% 914Agree 11.5% 464Strongly agree 6% 241N/A 6.5% 261Have you faced or witnessed prejudice or discrimination in your work environment?Yes 28.6% 1,154No 58.6% 2,367Unsure 12.8% 519What types of discrimination or prejudice have you witnessed or faced? Select all that apply.Age 48.1% 555Disability 4.9% 56Gender identity 42.8% 494Sexual orientation 14.7% 170Religious belief 11.9% 137Race 52.9% 610National origin 26.1% 301Pregnancy 17.5% 202Sexual harassment 27.9% 322None of the above 1.2% 14Other 13.7% 158Can you identify people similar to yourself in leadership positions at your firm?Yes 50.1% 2,025No 40.9% 1,652Unsure 9.0% 363Did you ever consider not pursuing a career in architecture based on your firm’s culture?

97Baseline on Belonging: Examination Report
Baseline on Belonging: Examination Report
Survey Values Percent Count
Yes 20.4% 823No 72.4% 2,923Unsure 7.3% 294In your own words, how did your firm’s culture impact your career in architecture? [Open Text]Which of the following best represents your ARE progress?I am currently preparing to take an ARE division 21.7% 990I have taken at least one ARE division 35.8% 1,636I have passed the ARE 20.9% 954I have not prepared for the ARE 21.6% 989In what ways did you prepare for the ARE? Select all that apply.Study groups 28% 1,004Online communities 48.9% 1,751Study guides or books 95.2% 3,409ARE Demo Exam in My NCARB 61.3% 2,194Videos and/or podcasts 69.5% 2,488I did not study 1.5% 52None of the above 0.8% 29Have you personally purchased any materials to prepare for the ARE?Yes 80.1% 2,869No 19.9% 713Roughly how much have you spent on ARE study materials?$0-$100 8.6% 248$100-$300 28.5% 817$300-$500 21.3% 610$500 or more 41.6% 1,194Did your firm provide you with free ARE study materials?Yes 54.9% 1,966No 45.1% 1,614Do you feel confident in your ability to afford taking the ARE?Yes 25.6% 673No 36% 946Somewhat 38.3% 1,007

98Baseline on Belonging: Examination Report
Baseline on Belonging: Examination Report
Survey Values Percent Count
Select all the parties that will contribute to the cost of taking the ARE. Select all that apply.Myself 96.6% 2,537My firm 45.6% 1,197A family member 14.5% 382Scholarships and/or grants 2.2% 58None of the above 0.3% 9Other 3.2% 84What factors impact your ability to afford the ARE? Select all that apply.College debt 54.3% 1,060Personal debt 41.7% 814Family obligations 46.5% 909Income and/or compensation 74.1% 1,447None of the above 4.1% 80Other 5.5% 107Did your firm contribute to the cost of the ARE?Yes, they paid for the entire exam 45.5% 434Yes, they partially paid for the exam 20.2% 193No 33.9% 323Unsure 0.4% 4Select all the parties that contributed to the cost of taking the ARE. Select all that apply.Myself 98.8% 511My firm 34% 176A family member 12.6% 65Scholarships and/or grants 1.2% 6Other 2.9% 15Did you personally experience difficulty paying for the cost of the ARE?Yes 35.4% 181No 35.2% 180Somewhat 29.4% 150Which of the following best describes your role in the organization?

99Baseline on Belonging: Examination Report
Baseline on Belonging: Examination Report
Survey Values Percent Count
Entry-level/junior 31.4% 1,477Mid-level/associate 42.7% 2,004Manager/supervisor 18.5% 867Director/vice president 1.8% 83Leadership/partner 2.2% 102Firm owner/CEO 3.5% 165How many people are currently employed at your firm? Please include all staff, not just architects.1-19 employees 39.9% 1,85920-49 employees 19.2% 89550-99 employees 11.3% 526100 or more employees 29.6% 1,381How long have you worked in the architectural profession?2 years or less 16.9% 7983-5 years 29.8% 1,4106-9 years 20.8% 98610 years or more 31.5% 1,491Never 1% 46How old are you?18-24 6.2% 29525-29 27.9% 1,32430-34 24.7% 1,17235-39 16.4% 77740-44 10% 47645-54 10.6% 50355-64 3.5% 16665 or higher 0.5% 26Do you identify as:Male 48.1% 2,277Female 50.7% 2,401Non-binary 0.5% 23

100Baseline on Belonging: Examination Report
Baseline on Belonging: Examination Report
Survey Values Percent Count
I’d like to indicate another response: 0.7% 32Are you of Hispanic, Latino, or Spanish origin?Yes 28% 1,320No 72.0% 3,38650.Which racial or ethnic group do you most identify with? Please select your race and identify your national origin, principal, or enrolled tribe.White (English, Irish, German, etc.) 53.6% 2,451Black or African American (Jamaican, Haitian, Nigerian, etc.) 15.1% 692Asian (Chinese, Filipino, Asian Indian, etc.) 18.8% 861American Indian or Alaska Native (Navajo, Blackfeet, Mayan, etc.) 2.9% 133Native Hawaiian or Other Pacific Islander (Tongan, Samoan, Fijian, etc.)
0.9% 40
Some other race 16.8% 770What is your immigration/worker status?U.S. citizen 87.4% 4,123Lawful permanent resident (green card holder) 6.3% 299Other (non-LPR) lawful immigration status 5.5% 261Unknown 0.8% 36What is your household income?Less than $25,000 3.6% 168$25,000 to $34,999 2.8% 130$35,000 to $49,999 9.7% 453$50,000 to $74,999 32.1% 1,500$75,000 to $99,999 17.4% 813$100,000 to $149,999 20.6% 961$150,000 or more 13.8% 647Any additional comments? Please share. [Open Text]

Baseline on Belonging: Examination Report