Embed Size (px)
Citation preview

Baseline Measurement and Analysis of UK Ozone and UV
Annual 2011 Report
Report for Defra
AEAT/ENV/R/3237 ED45367 Issue Number 1 Date 30/09/2011

Baseline Measurement and Analysis of UK Ozone and UV
Ref: AEA/ED45367/Issue Number 1 ii
Customer: Contact:
Defra Paul Willis
AEA Technology plc
Gemini Building, Harwell, Didcot, OX11 0QR
t: 0870 190 6602
AEA is a business name of AEA Technology plc
AEA is certificated to ISO9001 and ISO14001
Customer reference:
GA 01089
Confidentiality, copyright & reproduction:
This report is the Copyright of Defra and has been prepared by AEA Technology plc under contract to Defra dated 15/10/2010. The contents of this report may not be reproduced in whole or in part, nor passed to any organisation or person without the specific prior written permission of Defra. AEA Technology plc accepts no liability whatsoever to any third party for any loss or damage arising from any interpretation or use of the information contained in this report, or reliance on any views expressed therein.
Author:
Ian Roberts, Daniel Brookes, Ralf Toumi, John Rimmer, Andrew RD Smedley, Ann Webb, David Moore.
Approved By:
Paul Willis
Date:
30 September 2011
Signed:
AEA reference:
ID: AEAT/ENV/R/3237
Ref: ED45367- Issue Number 1

Baseline Measurement and Analysis of UK Ozone and UV
Ref: AEA/ED45367/Issue Number 1 ii
Executive summary
As part of the UK commitment to the Vienna Convention to Protect the Ozone Layer, the Department for Environment, Food and Rural Affairs (Defra) has supported the ground-based monitoring of column ozone at two UK sites over many years. Ozone measurements are made on a daily basis at Lerwick by the Met Office using Dobson ozone spectrophotometers, with an historical record going back to 1957 at this location. The Department has also supported the University of Manchester in making automated Brewer ozone measurements at Reading since 2003, and spectrally resolved UV measurements at Reading since 1993. The UV radiation measurements are primarily made to assess human exposure and are more local in their relevance given the sensitivity to factors such as tropospheric air pollution, cloud cover, etc.
In the present contract, awarded to a project team led by AEA, the Ozone and UV monitoring activities are combined under one programme with the following commitments in place:
Continuation of the Dobson Ozone Monitoring Programme at Lerwick: There is an overwhelming case to continue the ozone measurements made at Lerwick because of the proximity of this station to the Arctic polar vortex region where significant ozone depletion has been observed, and its long data record. It provides one of the key worldwide data sets.
Continuation of UV Measurements at Reading: The Reading dataset, which started in 1993, provides the longest time series of such measurements in the UK. The Reading measurements are considered to be an essential part of any future UK monitoring programme.
Brewer Ozone monitoring at Reading: The state-of-the-art ozone monitoring at Reading using a Brewer spectrophotometer is co-located with the existing UV spectrometer. This allows high frequency automated measurements, which, when combined with the UV data, provide additional insight into the factors controlling column ozone and surface UV levels. Reading acts as the southern UK monitoring site, providing representative data for an area of high population density.
The current contract commenced on 16th October 2010 and will be completed on 15th October 2015. The project team comprises AEA, the University of Manchester, Imperial College and the Met Office. This annual report covers the project activities for the period 1st January ‘10 – 30th September ’11 and describes the work carried on the data processing, reporting and analysis of the measurements made.
The key activities and results during the reporting period were:
The Reading and Lerwick sites remained fully operational. High quality, reliable results were made with a Dobson spectrophotometer at Lerwick, and with the automated Brewer ozone spectrometer and UV spectrometer at Reading. Staff at the Met Office Lerwick Observatory and the University of Manchester respectively carried out initial data checks, ensuring conformance with WMO best practice. Data transfer systems have been developed to enable AEA to carry out the quality assurance and reporting of ozone data from Lerwick and both ozone and UV data from Reading.
The on-going reporting of the daily-averaged ozone values determined at the Reading and Lerwick sites, and the Reading Spectral UV data, continued to a number of different organisations, including world data centres. This included an expansion of the worldwide website (http://ozone-uv.defra.gov.uk) to fully incorporate spectral UV data from Reading. The reporting of the ozone measurements fulfils part of the UK commitments under the Vienna Convention.
Baseline Measurement and Analysis of UK Ozone and UV
Ref: AEA/ED45367/Issue Number 1 iii
Trend Analysis of the Measurements suggests that the long-term decline in column ozone over the UK has not yet been reversed. The long-term (since 1978) autumn and spring declines observed at Lerwick remain significant. Chemical depletion is thought to account for the spring trend, but the autumn decline cannot be explained by chemistry and is very likely due to long-term circulation The trend analysis of the short Reading dataset shows an annual mean increase which is however not significant. The attribution of this change to the control of halogen-containing compounds under the Montreal Protocol requires the use of sophisticated chemical transport models and is outside the scope of this project. There continue to be seasonal systematic discrepancies between the satellite (TOMS/OMI) and the ground-based stations.
Regular Calibrations were carried out on both Dobson instruments and the Reading Brewer instrument during this period of the contract. Dobson #32 to Hohenpeisenberg in September 2011 and both the Brewers #075 and #126 were taken to Spain in July 2011 for international inter-comparison at El Arenosillo. The Dobson results were good but Brewer #126 experienced some degradation in performance as explained in the main body of the text. As instrument #126 is not formally supported by the project there is currently no funding to rectify the problems.
Baseline Measurement and Analysis of UK Ozone and UV
Ref: AEA/ED45367/Issue Number 1 iv
Table of contents
1 Introduction ................................................................................................................ 1
2 Project Aims and Objectives ..................................................................................... 2 2.1 Background ........................................................................................................ 2
3 Data Measurement, Processing & Reporting ........................................................... 3 3.1 Dobson Ozone Measurements ........................................................................... 3 3.2 Reading Ozone and UV Measurements ............................................................. 6 3.3 Manchester Measurements ...............................................................................11 3.4 Manchester FTP ...............................................................................................12 3.5 Ozone Data Reporting ......................................................................................12
4 Data Analysis .............................................................................................................13 4.1 Summary ..........................................................................................................13 4.2 Trends ...............................................................................................................13 4.3 Trends including 2011, single and multiple regression ......................................15 4.4 A new statistical model ......................................................................................16 4.5 High and Low Ozone Events .............................................................................19 4.6 Conclusion and Future work ..............................................................................20
5 Project Information & Dissemination .......................................................................22 5.1 Web Site ...........................................................................................................22 5.2 Literature Review ..............................................................................................24
6 Other Project Activities .............................................................................................26 6.1 Project Meetings ...............................................................................................26 6.2 Other Meetings .................................................................................................26
Appendices

1 Introduction
The Department for Environment, Food and Rural Affairs (Defra) has let a contract for the Baseline Measurement and Analysis of UK Ozone and UV to a project team led by AEA. The other members of the project team are the Met Office, the University of Manchester, the University of Reading and Imperial College. Each has specific individual responsibilities for the monitoring, reporting or analysis of stratospheric ozone and UV as illustrated in Figure 1 below.
Figure 1 Project team roles
The current contract runs from the 16th October 2010 to 30th September 2015. This annual report covers the period 1st October 2010 to 30th September 2011
Lerwick Ozone Observations
Met Office
Lerwick Ozone Data Screening
Met Office
Lerwick Ozone Calibration Met Office
Ozone and UV Measurement
Database Netcen
Website Netcen
Data Analysis
e - mail to Defra and other
stakeholders
Ozone & UV Imperial College
Ozone & UV Manchester
Low O 3 Events Imperial College
Dobson Instrument
Intercomparison
Satellite and Other Ozone
Measurements
Reading Ozone Observations Manchester
Reading Ozone Calibration Manchester
Reading Ozone Data Screening
Manchester
Brewer Instrument
Intercomparison
Reading UV Observations Manchester
Reading UV Data Screening
Manchester
Reading UV Calibration Manchester
UV Instrument
Intercomparison
International Data Centres
daily via ftp site
daily/weekly via ftp site daily via e - mail
updated daily daily/monthly
weekly
Lerwick Ozone Observations
Met Office
Lerwick Ozone Data Screening
Met Office
Lerwick Ozone Calibration Met Office
Ozone and UV Measurement
Database AEA
Website AEA
Data Analysis
e - mail to Defra and other
stakeholders
Ozone & UV Imperial College
Ozone & UV Manchester
Low O 3 Events Imperial College
Dobson Instrument
Intercomparison
Satellite and Other Ozone
Measurements
Reading Ozone Observations Manchester
Reading Ozone Calibration Manchester
Reading Ozone Data Screening
Manchester
Brewer Instrument
Intercomparison
Reading UV Observations Manchester
Reading UV Data Screening
Manchester
Reading UV Calibration Manchester
UV Instrument
Intercomparison
International Data Centres
daily via ftp site
daily/weekly via ftp site daily via e - mail
updated daily daily/monthly
weekly
2 Project Aims and Objectives
2.1 Background
The current monitoring programme runs from the 16th October 2010 to 30th September 2015. It has recently been independently reviewed1 and continues operation with:
Daily measurements of total column ozone at Lerwick using Dobson spectrophotometers (1957-present)
Automated measurements of total column ozone at Reading using a Brewer instrument (2003-present)
Spectral UV measurements at Reading (1993-present, co-located with the Brewer instrument).
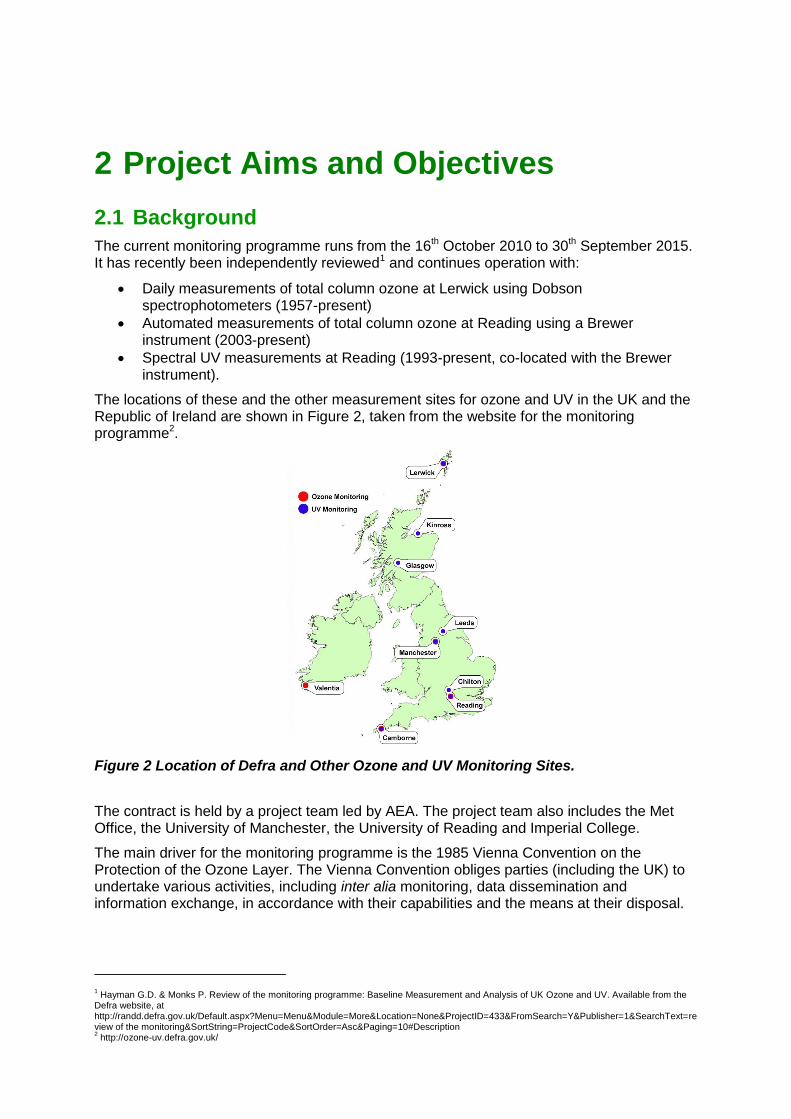
The locations of these and the other measurement sites for ozone and UV in the UK and the Republic of Ireland are shown in Figure 2, taken from the website for the monitoring programme2.
Figure 2 Location of Defra and Other Ozone and UV Monitoring Sites.
The contract is held by a project team led by AEA. The project team also includes the Met Office, the University of Manchester, the University of Reading and Imperial College.
The main driver for the monitoring programme is the 1985 Vienna Convention on the Protection of the Ozone Layer. The Vienna Convention obliges parties (including the UK) to undertake various activities, including inter alia monitoring, data dissemination and information exchange, in accordance with their capabilities and the means at their disposal.
1 Hayman G.D. & Monks P. Review of the monitoring programme: Baseline Measurement and Analysis of UK Ozone and UV. Available from the
Defra website, at http://randd.defra.gov.uk/Default.aspx?Menu=Menu&Module=More&Location=None&ProjectID=433&FromSearch=Y&Publisher=1&SearchText=review of the monitoring&SortString=ProjectCode&SortOrder=Asc&Paging=10#Description 2 http://ozone-uv.defra.gov.uk/

3 Data Measurement, Processing & Reporting
The Met Office determines column ozone amounts at Lerwick using a Dobson ozone spectrophotometer. The University of Manchester makes ozone measurements at Reading using a Brewer spectrophotometer, together with spectral UV measurements using a Bentham spectroradiometer. The University of Reading provides local support for the Reading monitoring activities. In accordance with WMO recommended best practise, the instrument operators carry out the initial data processing and quality checks, before forwarding the results to AEA for collation, analysis and final reporting.
3.1 Dobson Ozone Measurements
3.1.1 Site Operations at Lerwick
Bi-annual visits have been made to Lerwick to inspect the instruments, perform maintenance tasks, update ISO9000 documentation, train staff and if possible conduct intercomparisons.
3.1.2 Dobson #032 Calibration at Hohenpeissenberg Log
The Met Office participated in the international intercomparison of Dobson instruments from 3rd to the 7th September 2011 at the regional Dobson calibration centre at Hohenpeissenberg in S. Bavaria. D Moore, D Lyth (Met Office) were present throughout the intercomparison and were joined by M Clarke (Met Office) toward the end who took part in a restricted Mu range intercomparison. The team assisted with making lamp tests and gained experience and training with other aspects of the Dobson instrument during the period. They also helped with driving to and from the intercomparison for safety reasons. Also present at the intercomparison were two operators from Romania and two from Egypt with their respective instruments along with the regional standard Dobson No #64.
The intercomparisons are very structured with measurements being made every minute on the minute, for each wavelength, with only two minutes between sets of readings to adjust for 0.5 degree changes of temperature and align the instrument and the sun director. This procedure carries on until completion at noon with 2 breaks. Any bad readings show up immediately in the analysed data.
Upon arrival at Hohenpeissenberg a set of lamp tests were undertaken to ensure that the instrument was ready for the initial intercomparison with the other Dobsons on the 4th. The results from these tests were very good with Dobson #32 and the regional standard Dobson #64 agreeing within 1% at all Mu values. This indicates that the historical data since the last intercomparison do not need re-evaluating.
On the 5th September standard, mercury and comprehensive optical tests were completed before the wedge assembly was removed. The slight smears apparent at the last intercomparison were still apparent .To correct this issue wedges were removed from their tracks and the lengthy process of optical cleaning was undertaken by careful washing. The work was completed on the 6th after which the tracks were also taken off and grease removed which was confirmed as being responsible for the stiffness of the R dial. The wedge drive assembly was adjusted for a better R dial zero position and Teflon spray was used to lubricate the wedge guides in their tracks.

Two screws on the top of the instrument lid were not engaging properly so the helicoil kit was used to free the threads. Dust and other debris were removed from the inside the instrument casing by vacuuming followed by the use of a brush to remove particles from further within the instrument. The sun director and a spare unit’s optics were also cleaned after dismantling.
On the 7th further maintenance took place by replacing all three instrument gaskets. Mercury, standard and comprehensive optical tests were then conducted and the top lids were opened after the tests were completed to ventilate and remove the solvent fumes released from the glue used to retain the top lid gaskets. New silica gel was prepared using the microwave in preparation for more work the next day.
On the 9th spectral lamp tests were conducted to determine new Q tables, which were slightly changed and a photomultiplier symmetry test was also conducted to check on its position. The symmetry test results were similar to those conducted in Spain in 2007, where the recommendation was to lower the photomultiplier slightly. The procedure would involve rewiring a socket in addition to some difficult mechanical work and unfortunately there is no longer the expertise available at Hohenpeissenberg to carry out this work. As the Mu response of the instrument was excellent the decision was made to not make any alterations to the photomultiplier as lowering it would also necessitate an optical realignment.
The final intercomparison took place on Saturday 10th and commenced at 07:10 CET finishing at 12:00 CET. The clear sky conditions were the same as with the initial intercomparison . As the wedge calibration data were required (not yet completed) these data could not be fully analysed. Ulf Kohler, the organising scientist, noted that the results were noisy especially at low Mu. There were no obvious reasons or mistakes made whilst undertaking the measurements to account for this. The cause of this was determined later and is discussed below.
The wedge calibration took place between the 12th concluding on the 13th with the Met Office reporting that the results of this test were good.
During the 13th a short intercomparison was conducted in increasingly cloudy conditions first using the normal sun director and then with the spare to determine if changing the sun director affected the calibration. Again it was noticed that during the test readings from Dobson 32 were noisier.
On the 14th the final intercomparison results became available with the new wedge calibration and the results were very good with a flat Mu response to a value of 3.5. This indicated the two instruments had very similar characteristics and were both well aligned optically. Agreement between the two Dobsons was within 1% for both AD and CD wavelengths at all operational values of Mu. The data were still noisy and this was investigated when the weather improved. The sun director was repaired by gluing the broken piece back on and with a spare part.
On the 15th a new D wavelength Q stop was fitted. Tests were made on Dobson 32 and it was found that the sun director spot was too small and Ulf thought that this accounted for the noisy intercomparison data especially at the D wavelength. The lens was reversed but this did not resolve the issue although the support screws were lowered which helped a little. Local interference from a radio controlled hydraulic arm on a nearby lorry caused kicks in the control box zero position. This caused some alarm for awhile until the cause was found.
On the 16th an intercomparison took place over a restricted Mu range to investigate the noisy data seen on the final intercomparison. It took place at the road platform and not on the roof, as this site is less affected by RF interference from the TV tower. Both Ulf and D Moore took part and the noise was reduced to normal levels expected at an intercomparison. No differences could be seen due to operator changes. Positioning the sun director very consistently was found to reduce the noise in the data. The lack of RF interference also made a difference. The data confirmed the final intercomparison results.

The instrument was then packed away ready for departure on the 17th. The return trip to Lerwick and subsequent reinstall was uneventful.
3.1.3 Informal Intercomparisons conducted at Lerwick
On site intercomparisons were conducted 2nd and 4th Oct 2010, 12th and 13th Apr 2011 and again 29th Sept 2011. The results are summarised in Table 1 :-
Table 1 Summary of intercomparison results
Date Dobson (41-32)
DSAD (%) Dobson (41-32)
DSCD (%) Dobson 41 DSAD
Ozone values (D.U.)
2nd Oct 2010 -1.4 -3.3 323
4th Oct 2010 -0.9 -1.5 290
12th Apr 2011 -0.7 0.2 403
13th Apr 2011 -0.4 408
29th Sept 2011 -0.8 -1.1 285
Dobson #41 was the operational standard until 4th October 2011 when Dobson 32 took its place on return from Hohenpeissenberg. The average intercomparison difference between Dobson (#41-#32) DSAD was -0.8% and Dobson (#41-#32) DSCD -0.9%. Greater variation can be seen in the DSCD measurement differences, which is to be expected as the wavelengths are closer together and the Mu range is much more restricted with less data gathered. Ozone amounts also varied between the intercomparisons and therefore UV and scattered light values inside the instrument would be different for each intercomparison and this could account for some changes. The overall results were very good with Dobson #41 reading slightly lower than Dobson #32.
The Met Office report that arrangements with a local engineering firm have been agreed so that regular maintenance on the Dobson hydraulic trolleys at Lerwick can be made. This will include topping up the hydraulic fluid due to occasional weeping of fluid that tends to occur with these systems, due to the constant instrument load. There is no danger of collapse and the occasional drip is being contained. The Met Office report that it is regrettable that it happens at all, as this was why new trolleys were purchased.
A spare sun director was left at Lerwick and comparisons made with the existing unit. No differences were found at differing Mu values so they are interchangeable.
During the past year the Met Office report 100% of possible Dobson measurements were made allowing for maintenance or weather related stoppages.
A few experimental high Mu measurements were made during the out of range period (winter 2010) comparing with ozonesonde data. The results were encouraging enough to continue during winter 2011.
Dobson 35 is still on loan to the S. African Weather Service and a new memorandum of understanding will be drawn up soon to update the 2005 version. It is currently being used at Cape Point and the S. Africans are keen that this should continue and they are looking after the instrument properly.
3.1.4 Measurement Summary
Figure 3 shows the comparison of daily Lerwick column ozone values with measurements from the OMI satellite-based instrument during this reporting period. There appears to be generally good agreement between ground-based measurements at Lerwick and the OMI satellite data.
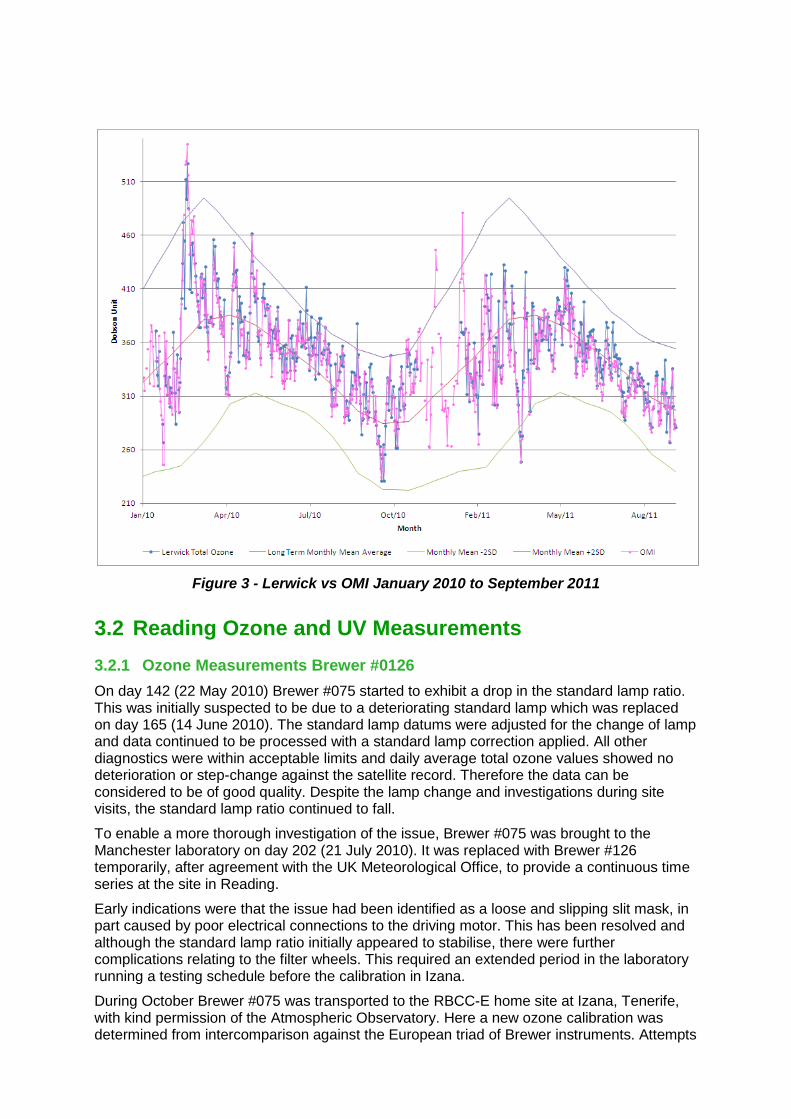
Figure 3 - Lerwick vs OMI January 2010 to September 2011
3.2 Reading Ozone and UV Measurements
3.2.1 Ozone Measurements Brewer #0126
On day 142 (22 May 2010) Brewer #075 started to exhibit a drop in the standard lamp ratio. This was initially suspected to be due to a deteriorating standard lamp which was replaced on day 165 (14 June 2010). The standard lamp datums were adjusted for the change of lamp and data continued to be processed with a standard lamp correction applied. All other diagnostics were within acceptable limits and daily average total ozone values showed no deterioration or step-change against the satellite record. Therefore the data can be considered to be of good quality. Despite the lamp change and investigations during site visits, the standard lamp ratio continued to fall.
To enable a more thorough investigation of the issue, Brewer #075 was brought to the Manchester laboratory on day 202 (21 July 2010). It was replaced with Brewer #126 temporarily, after agreement with the UK Meteorological Office, to provide a continuous time series at the site in Reading.
Early indications were that the issue had been identified as a loose and slipping slit mask, in part caused by poor electrical connections to the driving motor. This has been resolved and although the standard lamp ratio initially appeared to stabilise, there were further complications relating to the filter wheels. This required an extended period in the laboratory running a testing schedule before the calibration in Izana.
During October Brewer #075 was transported to the RBCC-E home site at Izana, Tenerife, with kind permission of the Atmospheric Observatory. Here a new ozone calibration was determined from intercomparison against the European triad of Brewer instruments. Attempts

to calculate a primary calibration using the Langley plot method were problematic due to poor weather conditions, to which the Langley method is more susceptible. On its return to the United Kingdom, Brewer #075 required a new RS422-RS323 converter which has been sourced and installed. Since then the instrument has been running a testing schedule to check its stability, and this has continued whilst waiting for suitable weather conditions at the Reading site.
It was not possible to return Brewer #075 to the Reading site over winter due to the bad weather conditions, also there was no benefit to re-installing the instrument until we could be sure of clear skies with a sufficient range of SZA to obtain a reliable sun sighting. While the instrument has been on test in the lab, a further drift in the standard lamp R6 ratio, linear with time has developed.
In the meantime Brewer #126 was still sited at Reading, courtesy of the UKMO, and continued the ozone data series using its calibration constants determined in 2009. Brewer #126 suffered some disruption of service on day 081 of 2011 due to contractors working on the roof of Reading Meteorology building.
During the first quarter of 2011 Brewer #075 underwent further tests in the laboratory to establish the cause of the linear drift in the standard lamp R6 ratio. Tests pointed to either the nickel sulphate filter or the photomultiplier tube as the source of the drift, both of which are best investigated more thoroughly during calibration. After a period on the Manchester rooftop monitoring site to carry out precalibration tests and sunscan routines, Brewer #075 was packed ready for transportation to the Regional Brewer Calibration Centre (RBCC-E) site at El Arenosillo for its biennial calibration. Likewise, a pre-calibration schedule was run on Brewer #126 at Reading.
Both instruments were then transported to the RBCC-E site and undergone calibration alongside the travelling standard, Brewer #017, maintained by International Ozone Services (IOS). A final and initial intercomparison period were carried out to enable later determination of the calibration constants. In the intervening maintenance period, the nickel sulphate filter was replaced in Brewer #075, which has since showed a stable standard lamp ratio. On its return from calibration, Brewer #075 was returned to the rooftop of the Reading Meteorology Building.
Brewer #126, however, has started to show some variation in its standard lamp ratios. This variation was anti-correlated to the lamp intensity, suggesting that the lamp was deteriorating. A new lamp was inserted during the calibration maintenance period, however laboratory tests since then in Manchester show that the issue is not resolved and the standard lamp ratio is continuing to rise. The probability is that this instrument also has a filter problem but, as it is not formally supported by the current contract, funds are not available to effect a repair.
As at the end of September 2011 we are still awaiting the final calibration report and instrument constants from IOS, but they are expected shortly
All Brewer instruments are now running on the latest version of the data acquisition software which was upgraded on their return from calibration. Initially this was tested at the Manchester site on Brewer #172 and caused some minor operational issues, such as certain aspects of the Umkehr routines not being recognised by the new core program. Once debugged the data acquisition upgrade was installed on Brewer #075 at Reading. An issue with the azimuth safety switch on 22 and 23 August required an emergency site visit to remedy. Otherwise, Brewer #075 has continued the Reading ozone data series following its normal monitoring measurement schedule without interruption.
The raw bfiles for both instruments during the period that each is sited in Reading have been submitted as usual to the WOUDC by the University of Manchester
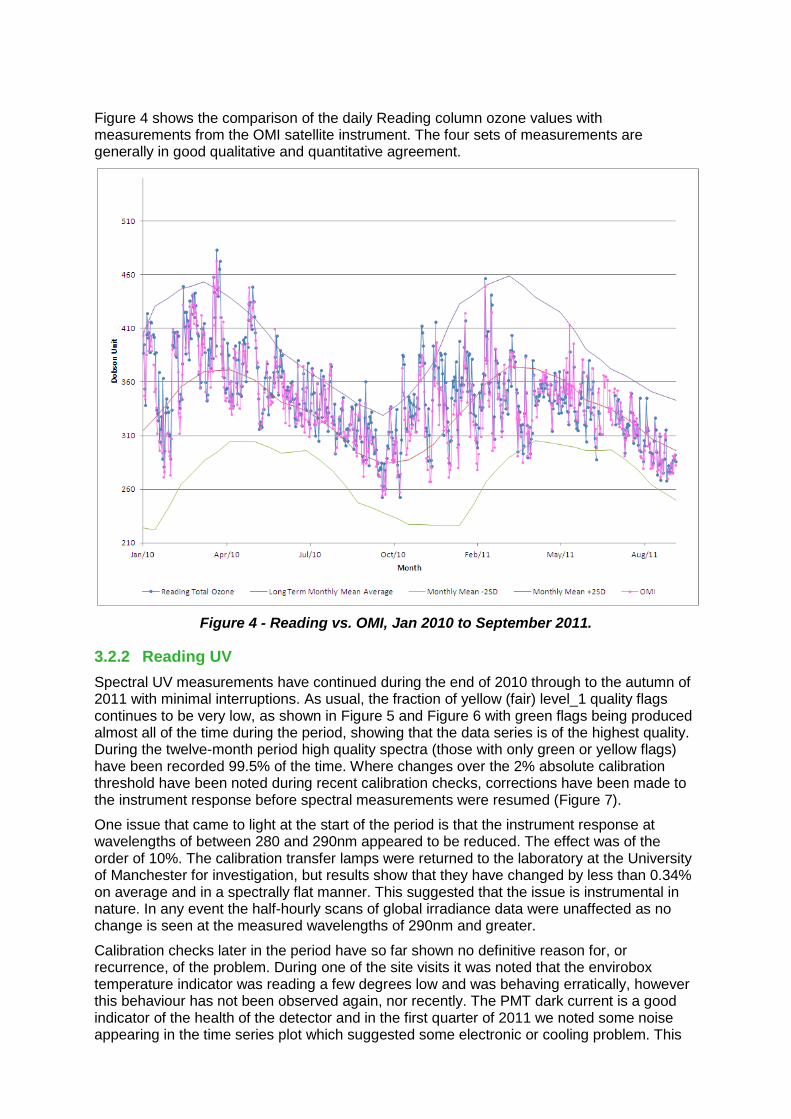
Figure 4 shows the comparison of the daily Reading column ozone values with measurements from the OMI satellite instrument. The four sets of measurements are generally in good qualitative and quantitative agreement.
Figure 4 - Reading vs. OMI, Jan 2010 to September 2011.
3.2.2 Reading UV
Spectral UV measurements have continued during the end of 2010 through to the autumn of 2011 with minimal interruptions. As usual, the fraction of yellow (fair) level_1 quality flags continues to be very low, as shown in Figure 5 and Figure 6 with green flags being produced almost all of the time during the period, showing that the data series is of the highest quality. During the twelve-month period high quality spectra (those with only green or yellow flags) have been recorded 99.5% of the time. Where changes over the 2% absolute calibration threshold have been noted during recent calibration checks, corrections have been made to the instrument response before spectral measurements were resumed (Figure 7).
One issue that came to light at the start of the period is that the instrument response at wavelengths of between 280 and 290nm appeared to be reduced. The effect was of the order of 10%. The calibration transfer lamps were returned to the laboratory at the University of Manchester for investigation, but results show that they have changed by less than 0.34% on average and in a spectrally flat manner. This suggested that the issue is instrumental in nature. In any event the half-hourly scans of global irradiance data were unaffected as no change is seen at the measured wavelengths of 290nm and greater.
Calibration checks later in the period have so far shown no definitive reason for, or recurrence, of the problem. During one of the site visits it was noted that the envirobox temperature indicator was reading a few degrees low and was behaving erratically, however this behaviour has not been observed again, nor recently. The PMT dark current is a good indicator of the health of the detector and in the first quarter of 2011 we noted some noise appearing in the time series plot which suggested some electronic or cooling problem. This

has subsided somewhat over the summer and now is as expected from a healthy instrument. The option of returning the instrument to its manufacturer for servicing was under consideration for the autumn, but at present this does not appear necessary to maintain good quality data collection. If it had proved necessary, we planned to carry out this during the replacement of the Reading observation hut, but this project has been paused for the foreseeable future due to lack of funding.
As a preventative measure the daily maintenance logs completed by the on-site staff have been upgraded to an electronic format. This new instrument log is already in place for Brewer #075, and will soon rolled out to the Bentham DM150. These measures should help diagnose and track any instrument problems in the future, and will contain a full instrument history including calibrations, any significant changes to the hardware or software, alongside the maintenance record. At the start of 2011 there was a change of local staff at Reading, which has required some periods of retraining. We expect the implementation of electronic instrument logs will assist the new staff in their daily maintenance duties.
The University of Manchester continues to produce WOUDC and EUVDB format files during the nightly processing routines, from the level_1 spectral UV dataset, filtering these for quality flags. These files reside on the o3uvdata.seaes.manchester.ac.uk ftp database. At the end of each month these files are sent to the World Ozone and UV Data Centre (WOUDC) and European Ultraviolet Database (EUVDB) for use by the wider scientific community. This processing is still considered as state of the art, although during summer 2011 WMO have now approved the inclusion of UV-index into WOUDC files. University of Manchester staff are currently in discussions with WOUDC as to the specified format, and once finalised we will then include this into our data processing routines as soon as practicable. The change will also be applied to the historic data series, and then resubmitted.
The Finnish Meteorological Institute who host EUVDB are have yet to resolve their technical difficulties with part of submission process, which incurs a slight delay before data is manually added into the database. The processing of data by the Manchester team ensures that the dataset is identical to that submitted to the WOUDC as EUVDB format files are produced during the nightly processing routines from the same underlying files.
The UV data series was included in a scientific paper written largely by the University of Manchester team, including input from other project partners. The subject matter is long term trends of UV and ozone in the UK, and the paper was submitted to the International Journal of Climatology during the period of the previous annual report. This has now completed the review process and been published as:
Smedley A. R. D., Rimmer J. S., Moore D., Toumi R., Webb A. R. (2010) Total ozone and surface UV trends in the United Kingdom: 1979 to 2008. I J Clim DOI: 10.1002/joc.2275

Figure 5 - 2010 level_1 quality flags produced by the ShicRIVM processing software
Figure 6 - 2011 level_1 quality flags produced by the ShicRIVM processing software.
0 50 100 150 200 250 300 3500
20
40
60
80
100
Day of year
Perc
enta
ge
No.
of
spectr
a
SHICrivm flag results for DM150 during 2010
0 50 100 150 200 250 300 3500
10
20
30
40
50
0 50 100 150 200 250 300 3500
20
40
60
80
100
Day of year
Perc
enta
ge
No.
of
spectr
a
SHICrivm flag results for DM150 during 2011
0 50 100 150 200 250 300 3500
10
20
30
40
50

Figure 7 DM150 irradiance calibration record.
3.2.3 UV Index
Software developed by AEA automatically processes the spectral data from the DM150 UV instrument at Reading and converts them to a simple UV index comparable with the results from the HPA broadband UV monitoring network. The measurement data and plots of the daily UV index and of the maximum daily UV index throughout the year are available on the website one day in arrears for public information.
The daily maximum UV index values are plotted with quality flags, as an ongoing annual graph. The daily maximum UV index graphs for Reading for 2011 can be found here http://ozone-uv.defra.gov.uk/uv/data_search.php
3.3 Manchester Measurements
The University of Manchester also makes column ozone measurements at Manchester using a Brewer instrument (#172), alongside the daily updates for Brewer #075. Since its return from El Arenosillo. Brewer 126 has not been used operationally since the return from El Arenosillo. The analysis contains individual measurements made at air masses up to 6.0, as well as the usual standard lamp corrections. The version 4.0 reprocessed data, including checks against the satellite record, from Brewer #172 is being submitted to WOUDC on a monthly basis together with the raw bfiles, i.e. on the same basis as both the single monochromator instruments, Brewers #075 and #126.
Umkehr ozone profiling measurements have been run by Brewer #172 as part of the daily schedule of measurements since 2008. During the period we have continued to process these on a monthly basis using a third party application, filter for good ozone profiles, and upload the resulting data files onto the Manchester-hosted database. During June these
2010 2011 2012-8
-6
-4
-2
0
2
4
6
Year
Perc
enta
ge c
hange
DM150 calibration record

measurements were interrupted whilst a precalibration schedule was put into operation until Brewer #172 was packed up ready for calibration on 30 June 2011.
Brewer #172 has now taken part in the RBCC-E calibration at El Arenosillo, and as expected was found to be operating well and in a stable manner. It has now returned to Manchester to continue the ozone time series using its standard measurement schedule (UV scans, direct sun and zenith sky ozone measurements, plus Umkehr profiles during the morning and evening).
The addition of Umkehr profiles to the Reading measurement program has been postponed by Defra until after the October 2011 review. We understand that Defra’s concern with this change is that it will cause a detrimental impact on the daily average measurements that form the core ozone time series. It should be stressed, though, that any effect could be considered a sampling issue; that is, daily averages will still be measured, but there will be slightly fewer contributing measurements. However to offset these concerns we offer two options. It may be that useful Umkehr profiles can be constructed from measurements made only down to airmass factors of 4.0. If so, then this would have no effect on the DS or ZS daily average as these measurements are only valid for airmass factors of 4.0 and less. An alternative route would be to select the measurement schedule depending on the forecast. Any impact of a standard Umkehr measurement schedule would be greatest during the winter months, but this could be programmed in only for ‘forecast as clear’ days, with the current schedule running the remainder of the time. Any changes to the measurement schedule would, of course, have to be discussed with Defra before implementation, but we offer these suggestions so that the Reading site could benefit from profiling measurements and assist with global layer by layer trend analysis.
3.4 Manchester FTP
The FTP server has continued to be reliable providing data to the project team.
3.5 Ozone Data Reporting
A summary of daily Dobson and Brewer ozone data is reported on a weekly basis by email to the project partners and a number of other interested organisations and individuals.
The data are also delivered daily to the University of Thessaloniki for the World Ozone and Ultraviolet Radiation Data Centre (WOUDC) near real-time ozone mapping programme. Interpolated maps are disseminated by return to all the participants. The mapped results can also be viewed from the web page: http://exp-studies.tor.ec.gc.ca/e/ozone/Curr_allmap.htm.
Final data are reported monthly (after AEA’s monthly QC checks and any follow-up actions) to the WOUDC data archive. The QC checks involve:
• Comparison of all relevant datasets against each other for consistency.
• Follow-up with data providers any data points which are apparent outliers.
• Regression analysis between ground-based and satellite data to determine whether the relationship is improving or deteriorating.
• Comparison with climatology to assess whether levels are normal for the time of year.
Climatology updated by AEA now includes 2010 data. The Reading site now uses its own climatology rather than that transferred from the closed Camborne site.
All reports were delivered successfully during this period of the contract.

4 Data Analysis
4.1 Summary
During the period of the contract the ozone columns at Reading and Lerwick followed their normal seasonal progression. The 2010 annual means at both sites were the largest for the last 20 years.
4.2 Trends
4.2.1 Lerwick
Analysis by simple linear regression of annual means shows that since the late 1970s ozone has been decreasing ~2-3% per decade over Lerwick (Table 2, Figure 8). Trends are sensitive to the chosen time frame and we have chosen the beginning of the global 30 year satellite period as a suitable starting year. There is as yet no evidence of significant ozone recovery. The long-term (since 1978) autumn and spring declines observed at Lerwick remain significant. Chemical depletion is thought to account for the spring trend, but the autumn decline cannot be explained by chemistry and is very likely due to long-term circulation changes. It is worth noting that autumn is the seasonal minimum in the UK and in the Northern Hemisphere mid-latitudes. For winter (December/January/February) the data set is much noisier. Trends are not significant, in part due to the limited number of measurements available at Lerwick during these months, but also because of the large inter-annual variability.
Since 1990 the Lerwick annual mean trend has been upward but this is not significant (at the 95% confidence interval). The seasonal evolution is shown in Figure 8. There is an apparent turn-around in the spring (March/April/May) ozone column over this location. From the 1970’s until around 1990 there was a very strong downward trend, which has now levelled off. However, there is no statistically significant recovery since the late 1990s, when stratospheric chlorine loading is thought to have peaked. Conversely the trends for autumn (September/October/November) remain significantly negative.
4.2.2 Reading
At Reading there is an annual increase of ozone since 2003 but this is not significant. Seasonal trends are also not significantly different from zero at the 95% confidence interval (Table 2). The largest ozone increases are seen in summer and smallest increase are found in the autumn. The data record is relatively short so that trends are very sensitive to record length and possibly tropospheric trends.

Table 2 The single regression (SR) trends in DU/per year and standard errors for Lerwick (1978-2010) and Reading (2003-2010) for the annual mean
Site Annual
(2010)
Winter (DJF)
(2009-2010)
Spring (MAM)
(2010)
Summer (JJA)
(2010)
Autumn (SON)
(2010)
Lerwick -SR
-0.62 +/- 0.20
-0.12+/- 0.58
-0.85 +/- 0.30
-0.24 +/-0.17
-0.61 +/- 0.21
Reading -SR
+2.97+/-1.19
+2.86+/-2.69
+2.18+/-1.70
+1.76+/-0.74
+2.19+/-1.70
Figure 8 Long-term trends since 1980 in annual and seasonal ozone column over Lerwick
4.2.3 Camborne / Reading
In this contract we attempted to create a simple synthetic Camborne/Reading time series. Creating synthetic time series is fraught with difficulties and results should be regarded with caution. According to satellite observations the inter-annual correlation of the annual mean ozone at Camborne and Reading should be very high (correlation coefficient greater than 0.95). The annual mean ozone of the two stations should therefore track each other very well. In 2003 both sites were run simultaneously for a complete year and it was found that Reading column ozone was 0.7% larger than the column ozone at Camborne. This is within the uncertainty of both instruments. However to be conservative Reading annual means were scaled down by 0.7% for the synthetic time series. The synthetic annual mean Camborne/Reading (1990-2010) upward trend of 0.9 DU/year is significant (at 95%). For 2010 the highest annual mean ozone was recorded since the late eighties at Lerwick and a record high for the synthetic Camborne/Reading time series since 1990 (Figure 9)

Figure 9 The annual mean of daily ozone column over the UK (Lerwick includes incomplete winter days).
4.3 Trends including 2011, single and multiple regression
On daily time scales the column ozone is strongly influenced by troposphere weather systems. The long term role of weather changes on ozone trends are only now beginning to be examined. So far we have only examined the role of the geopotential height at 500 hPa proxy. On a daily basis this dynamical proxy is known to be anti-correlated with column ozone i.e. large heights or anti-cyclones also tend to depress the ozone column by lifting the tropopause. This is a well understood physical connection and the ozone column by itself should have negligible impact on the height. In work to date we have chosen only the 500 hPa rather than the sometimes used 200 hPa to make sure that the proxy is truly tropospheric and not partly influenced by stratospheric temperatures which are influenced by stratospheric ozone. Two types of analysis have therefore been performed:
1. A simple regression of the column ozone from the start of record for Reading in 2003 and since the start of the satellite observations for Lerwick in 1978.
2. A multiple regression where we include the monthly 500 hPa geopotential height over the site from NCEP re-analysis as a tropospheric dynamical proxy.
These analyses are in the process of being automated using the “R” statistical software as far as possible so that they can be performed as simply as possible from the ozone and meteorological databases. We are of course aware that long-term trends will not vary greatly from quarter-to-quarter (e.g. the changes in the Lerwick seasonal trends from 2010 to 2011 in Table 3) but this analysis will quickly pick up any interesting anomalies or features in the data which may require further investigation.
Table 3 shows the results of the analysis to date including quarterly updates from the year 2011 where available (winter, spring and summer trends have been updated), as well as the trends as they stood at the end of the year 2010 for comparison. The trends as they stood in 2010 have been italicised to distinguish them clearly from the current values for the trend.

Site
Annual
(2010)
Autumn (SON)
(2010)
Winter (DJF)
(2010-2011); (2009-2010)
Spring (MAM)
(2011); (2010)
Summer (JJA)
(2011); (2010)
Lerwick -SR -0.62 +/- 0.20 -0.61 +/- 0.21 -0.13+/- 0.55; -0.12+/- 0.58
-0.87 +/- 0.28; -0.85 +/- 0.30
-0.23 +/-0.16; -0.24 +/-0.17
Lerwick- MR -0.52+/- 0.21 -0.40+/-0.18 -0.09+/-0.56; -0.08+/-0.60
-0.67+/- 0.25; -0.69+/- 0.26
-0.23+/-0.13; -0.22+/-0.14
Reading -SR +2.97+/-1.19 +2.19+/-1.70 +3.55+/-2.12; +2.86+/-2.69
-0.10+/-1.87; +2.18+/-1.70
+0.75+/-0.81; +1.76+/-0.74
Reading -MR +2.10+/-1.94 +0.49+/-1.15 +1.38+/-1.58; +0.07+/-1.79
+0.48+/-1.80; +2.10+/-1.87
+0.80+/-1.07; +1.66+/-0.89
Table 3 Column ozone trend in DU per year with standard errors. Numbers in bold are significant at the 95% confidence level (P<0.05) SR: single regression; MR: multiple regression. Lerwick since 1978 and Reading since 2003 both to August 2011.
A significant decline in column ozone is seen at Lerwick since 1978 in the annual mean, Spring and Autumn for both single and multiple regression analysis. This remains true where the seasonal trend has been updated to include the 2011 season where the data has become available. For relatively short records (e.g. less than 10 years) tropospheric weather change can have a substantial impact on the linear trend in terms of magnitude, as well as error and hence significance. This explains why the trends for Reading are more sensitive to year to year variability while there is little change in the reported trend for Lerwick where the seasonal trend has been updated. There are no significant trends at Reading since 2003.
Multiple regressions reduce uncertainty in linear trends and therefore can allow earlier detection of statistical significance. We find that this first multiple regression model provides a very good fit to the observations at Lerwick and Reading. Overall for Lerwick and Reading the linear trends tend to be reduced using multiple regression compared to those from the simple linear regression approach. The multiple regression technique has a large impact on seasonal trends at Reading because of the shorter record even changing the direction of the Spring trend from negative to positive when the 2011 season is included.
4.4 A new statistical model
We now propose to develop a more sophisticated statistical model of UK column ozone. There are important external and stratospheric drivers to the ozone variability. The best known are the Quasi-Biennial Oscillation (QBO) of the tropical winds and the solar cycle. We are building a new statistical model of the ozone time series at Lerwick and Reading. This model will be a multiple linear regression of a number of ozone proxies to more confidently estimate the trend. The model can be written as
O3= a +bT + cΦ +dQ+ eS + R
(1)
Where,
O3 is the observed ozone column (DU),

a is the offset (DU),
b is the linear trend (DU/year),
T is the year (or month)
Φ is the geopotential height,
Q is the Quasi-Biannual Oscillation of the stratospheric winds observed at Singapore,
S is the solar cycle (10.7 cm solar flux time series),
R is the residual error (which can also be specified as a white noise or AR(1) process),
b, c, d, e are the regression coefficients
In this proposal we will increase the sophistication of the model by including more proxies in a new statistical model.
4.4.1 The variables
We examine the correlation of ozone with a number of variables. For this analysis we chose the multi- sensor KNMI re-analysis (van der A, 2010) for ozone rather than the ground-based stations. To gain confidence in a proxy it is instructive to see the spatial and seasonal pattern of correlation. This dataset represent a realistic and homogenised climatology since 1979. We examined the correlation with a number of variables: 200 and 500 hPa geopotential height, the solar cycle and the QBO.
4.4.2 The 200 hPa Geopotential
It is important gain a sense of the overall performance of the proxy by examining the spatial correlation of column ozone with 200 hPa. Figure 10 shows the spatial correlation of the KNMI multi sensor re-analysis annual ozone with NCEP 200 hPa and 500 hPa geopotential height. The correlation with the 500 hPa height is clearly a superior measure with more significant and stronger correlation over the UK. Furthermore the 200 hPa time series is itself highly correlated with the 500 hPa field and cannot be considered independent as is required for a multiple regression. On this analysis the 200 hPa proxy is not a suitable alternative to the 500 hPa proxy.
Figure 10 Annual correlation of ozone reanalysis with NCEP 500 hPa (left) and 200 hPa (right) geopotential height. Shading only for p< 0.01.
4.4.3 The Solar Cycle
We have examined the relationship between UK column ozone and the solar cycle as defined by the total irradiance (Fröhlich, 2000). We find no significant (p<0.1) correlation with the annual mean and of all the seasons only the summer shows some regional significance at p <0.1 but not at the normally required p<0.05 (Figure 11). This suggest that the solar

cycle may have a role in regression statistics for global, tropical or zonal mean studies but it plays no role in explaining the variability of UK ozone.
Figure 11 The correlation of summer column ozone with total solar irradiance. Shading is significant the p<0.05 (left) and p < 0.1 (right)
4.4.4 The QBO
The Quasi Biennial Oscillation (QBO) is computed as the NCEP zonal mean 30 hPa wind at the Equator. The annual ozone shows no significant correlation with the tropical QBO. We have also examined the relationship at different lags at Lerwick and Reading. A consistent feature amongst the two sites is late summer (the period of ozone minimum) has a negative correlation with the spring (i.e. summer lagged by 2-3 months) QBO phase (Figure 12 and Figure 13). There is also a suggested QBO relationship with Lerwick Spring (April-May) Ozone with a lag of 0-2 months. However it is noteworthy that the 500 hPa field in the summer (August-September) is also positively correlated with the late spring (May-June) QBO (Figure 14). This suggests that much of the apparent QBO correlation is in fact already included in the 500 hPa height field and the two cannot be considered independent for multiple regression. Other seasons show no significant relationship for both sites with even the sign changing for some months. It seems plausible to further explore the QBO to study the seasonal minimum ozone, but it seems to have no particular value for the year round analysis.
Figure 12 Correlation of Ozone at Lerwick (left) and Reading (right) as function of lag. For Lerwick the Spring (lagged by 0-2 months) and Summer (lagged by 2-3 months) negative correlations are significant (p<0.05). For Reading the late summer anti-correlation is significant (p<0.1).
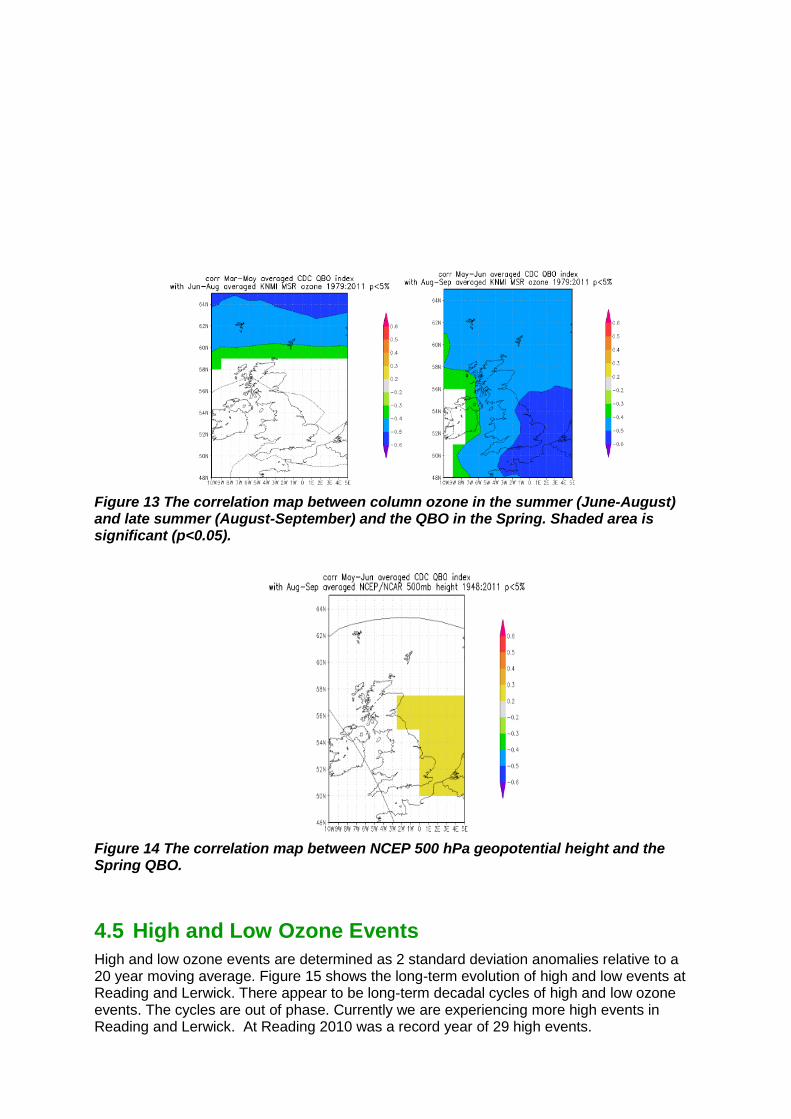
Figure 13 The correlation map between column ozone in the summer (June-August) and late summer (August-September) and the QBO in the Spring. Shaded area is significant (p<0.05).
Figure 14 The correlation map between NCEP 500 hPa geopotential height and the Spring QBO.
4.5 High and Low Ozone Events
High and low ozone events are determined as 2 standard deviation anomalies relative to a 20 year moving average. Figure 15 shows the long-term evolution of high and low events at Reading and Lerwick. There appear to be long-term decadal cycles of high and low ozone events. The cycles are out of phase. Currently we are experiencing more high events in Reading and Lerwick. At Reading 2010 was a record year of 29 high events.

Figure 15 Time series of high and low ozone events at Reading (top) and Lerwick (bottom). The Reading data is synthesised out of nearby other stations.
4.6 Conclusion and Future work
The 500 hPa proxy was found to by far have the strongest correlation with ozone. The 200 hPa height field shows a weaker correlation and is also not independent of the 500 hPa height field. There was no compelling evidence to include the solar cycle in the multiple regressions. The Spring QBO appears to have a potentially significant impact on ozone in
-30
-20
-10
0
10
20
30
Nu
mb
er
of
Day
s
Year
Number of days outside 2 sigma per year - 1977 - 2010 using a hybrid dataset consisting of Camborne (57-67), Bracknell (67-89),Reading (03-08) - Based on moving 20 year annual average. Years prior to 1977 based on static 20 year average.
High event days (outside annual 2 sigma) Low event days (outside annual 2 sigma)
-30
-20
-10
0
10
20
30
Num
ber o
f Day
s
Year
Number of days outside 2 sigma per year - 1957 - 2010 at Lerwick - Based on moving 20 year annual average. Years prior to 1977 are based on static 20 year average.
High event days (outside annual 2 sigma) Low events days (outside annual 2 sigma)

the late summer. This will be investigated further as a predictor of the progression to the seasonal minimum. At this stage there is no compelling evidence to revise the current multiple regression with only 500 hPa height. We will examine the use of “equivalent latitude” as a proxy. This proxy aims to capture both vertical tropopause lifting (equivalent to the 500hPa proxy) and horizontal advection of ozone rich/poor air (Wohltmann, 2005). This looks to be the most promising way forward to building a new statistical model.
Fröhlich, C., Observations of irradiance variability, Space Science Reviews, 94, 15-24, 2000.
van der A, R.J., M.A.F. Allaart, H.J. Eskes, Multi Sensor Reanalysis of Total Ozone, Atmos. Chem. Phys., 10, 11277-11294, 10.5194/acp-10-11277-2010, 2010.
Wohltmann, I., M. Rex, D. Brunner, and J. Mäder (2005), Integrated equivalent latitude as a proxy for dynamical changes in ozone column, Geophys. Res. Lett., 32, L09811, doi:10.1029/2005GL022497.

5 Project Information & Dissemination
5.1 Web Site
The project homepage is illustrated in Figure 16 below and accessible via the following address http://ozone-uv.defra.gov.uk/ .
Figure 16 - The project website homepage.
Traffic continues to be redirected from the old project web url (http://www.ozone-uv.co.uk/). The live statistics can be accessed from the link section off the main project page and can be viewed directly at http://ozone-uv.defra.gov.uk/cgi-bin/usage.pl.
The following data are currently updated daily during normal working hours and made available for download from the website:
Dobson ozone data from Lerwick (plus historic data from Camborne)
Brewer ozone data from Reading.
Graphs of Manchester Brewer ozone data.
Spectral UV data from Reading.

The news section continues to be periodically updated as and when suitable articles are identified. Recent articles added include the following
• Ozone UNFCCC technical paper on the implications of the establishment of new hydrochlorofluorocarbon-22 (HCFC-22) facilities seeking to obtain certified emission reductions for the destruction of hydrofluorocarbon-23 (HFC-23)
• New report highlights two-way link between ozone layer and climate change • Executive Summary of Ozone Secretariat Environmental Effects Assessment
Panel annual assessment of ozone depletion • Executive Summary of the Scientific Assessment of Ozone Depletion: 2010 • Scientific Assessment of Ozone Depletion 2010 now published • Webcast of GAW-CH Conference, Zurich 18-19 January 2011 • Arctic on the verge of record ozone loss - Arctic-wide measurements verify rapid
depletion in recent days • Low Ozone Update • Ozone Secretariat proposed amendment submitted by Canada, Mexico and the
USA to Control HFCs under the Montreal Protocol • Commission Regulation (EU) No 537/2011 on the use of ozone depleting
substances allowed for laboratory and analytical purposes • First Announcement for the 13th Biennial WMO-GAW Brewer Users Group
Workshop, Chinese Academy of Meteorological Science (CAMS) and the Chinese Meteorological Administration (CMA), Beijing, China
• UNFCCC technical paper on the implications of the establishment of new hydrochlorofluorocarbon-22 (HCFC-22) facilities seeking to obtain certified emission reductions for the destruction of hydrofluorocarbon-23 (HFC-23)
• Ozone Secretariat synthesis report of the 2010 assessments of the Montreal Protocol assessment panels
• Arctic ozone loss at record level
Further publicity for the website may still be helpful in order to increase its usage and it was discussed at the last project team meeting the possibility of providing links from the Met Office website to increase project exposure.
5.1.1 Website Usage Overview
Under the new contract a brief summary of the website usage was requested to be included in the quarterly reports. Table 4 data has been taken from the AWSTATS software which monitors the site usage, and is broken down on a month by month basis (See footnotes for any clarification of what each data represents).

Table 4 AWSTATS data for http://ozone-uv.defra.gov.uk/ Ozone AWSTATS
Year Month Unique visitors3
Number of visits4
Pages5 Hits6 Bandwidth7
2010 Jan 227 335 2177 5886 124.33 MB
2010 Feb n/a n/a n/a n/a n/a
2010 Mar n/a n/a n/a n/a n/a
2010 Apr 385 821 2074 12814 434.20 MB
2010 May 369 688 1397 8773 274.19 MB
2010 Jun 297 468 1071 6446 170.25 MB
2010 Jul 334 583 1396 6656 287.25 MB
2010 Aug 326 573 1072 6970 140.90 MB
2010 Sep 346 549 1221 7876 261.26 MB
2010 Oct 411 590 1841 8568 222.60 MB
2010 Nov 367 473 1443 8199 193.13 MB
2011 Dec 368 469 2559 9527 194.73 MB
2011 Jan 489 671 3860 11715 253.24 MB
2011 Feb 385 620 2982 10874 339.15 MB
2011 Mar 467 782 4997 13734 382.54 MB
2011 April 486 703 4748 13722 241.54 MB
2011 May 438 613 4424 11807 236.98 MB
2011 June 477 717 3620 9527 315.20 MB
2011 July 489 712 3990 9983 315.78 MB
2011 August 391 592 3542 8015 485.99 MB
2011 September 226 406 3264 7177 263.66 MB
5.2 Literature Review
During the period of the project Defra requested a review on papers focusing on column ozone or UV measurements and a short non-technical summary to be provided on each paper together with its policy significance. During this period eleven relevant papers were reviewed and their findings are summarised in the project quarterly reports
3 Unique Visitor: A unique visitor is a person or computer (host) that has made at least 1 hit on 1 page of your web site during the current period
shown by the report. If this user makes several visits during this period, it is counted only once. 4 Visits: Number of visits made by all visitors. Think "session" here, say a unique IP accesses a page, and then requests three other pages within
an hour. All of the "pages" are included in the visit, therefore you should expect multiple pages per visit and multiple visits per unique visitor 5 Pages: The number of "pages" viewed by visitors. Pages are usually HTML, PHP or ASP files, not images or other files requested as a result of
loading a "Page". 6 Hits: Any files requested from the server (including files that are "Pages").
7 Bandwidth: Total number of bytes for pages, images and files downloaded by web browsing.
Heckendorn P, Weisenstein D, Fueglistaler S, et al. The impact of geoengineering aerosols on stratospheric temperature and ozone ENVIRONMENTAL RESEARCH LETTERS 4 , 4 045108 2009
Karpechko AY, Gillett NP, Hassler B, et al. (2010) Quantitative assessment of Southern Hemisphere ozone in chemistry-climate model simulations ATMOSPHERIC CHEMISTRY AND PHYSICS Volume: 10 Issue: 3 Pages: 1385 – 1400
Lamarque JF, Solomon S. Impact of Changes in Climate and Halocarbons on Recent Lower Stratosphere Ozone and Temperature Trends JOURNAL OF CLIMATE Volume: 23 Issue: 10 Pages: 2599-2611 MAY 2010
Rieder, HE; Staehelin, J; Maeder, JA, et al., Extreme events in total ozone over Arosa - Part 1: Application of extreme value theory ATMOSPHERIC CHEMISTRY AND PHYSICS Vol.: 10 20 10021-10031 2010
Patten, KO; Wuebbles, DJ Atmospheric lifetimes and Ozone Depletion Potentials of trans-1-chloro-3,3,3-trifluoropropylene and trans-1,2-dichloroethylene in a three-dimensional model ATMOSPHERIC CHEMISTRY AND PHYSICS Vol: 10 Iss: 22 10867-10874 2010
Gillett, NP; Akiyoshi, H; Bekki, S, et al.,: Attribution of observed changes in stratospheric ozone and temperature, ATMOSPHERIC CHEMISTRY AND PHYSICS, Vol: 11, Is: 2, 599-609, 2011
Salby, M; Titova, E; Deschamps, L Rebound of Antarctic ozone GEOPHYSICAL RESEARCH LETTERS Vol: 38 L09702 2011
Watanabe, S., K. Sudo, T. Nagashima, T. Takemura, H. Kawase, and T. Nozawa (2011), Future projections of surface UV-B in a changing climate, J. Geophys. Res., 116, D16118, doi:10.1029/2011JD015749.

6 Other Project Activities
6.1 Project Meetings
Project Review meetings were held as follows:
Project Meeting 28th May 2010
Project Meeting 16th December 2011
6.2 Other Meetings
There have been a number of international conferences and meetings over the project duration which have helped to raise the profile of UK Ozone and UV monitoring activities. Selected synopses and a list of posters presented, follow:
13th WMO-GAW Brewer Users Group Meeting, Beijing, China (12–16 September 2011)
The 13th WMO-GAW biennial Brewer Workshop was held in Beijing from 12th to 16th September 2011. As a member of the WMO Brewer sub-committee, Dr John Rimmer attended and gave two oral presentations. The first of these concerned the use of instrument specific weighting coefficients in the ozone calculation and the second was on the results of applying Extreme Value Theory to the analysis of extreme events in the UK’s ozone records. During the summer of 2011 the University of Manchester team has hosted a NERC intern who has been investigating using extreme value theory as a possible statistical route to better understand Extreme Low Ozone events and mini-holes. It is common practice to model the distribution of total ozone column as a Gaussian, but this over simplifies the tails of the actual distribution, as discussed in Rieder et al (2010) who applied this to the Arosa dataset. Preliminary results of this work were presented.
The full list of presentations is not yet available on the Brewer web site but can be found at RBCC-E at http://go3uv.blogspot.com/2011/09/xiii-brewer-workshop-presentaciones.html. Recommendations from the Brewer sub-committee included further calls for more Umkehr retrievals, a delay in implementing the changeover to new cross-sections pending consistency trials and that the calibration history of the reference instrument is passed to station operators at each calibration by intercomparison.
WMO SAG-UV Meeting, Melbourne (4-5 July, 2011)
The WMO Scientific Advisory Group on UV Measurements, chaired by Dr Webb, met in Melbourne in July, 2011, in conjunction with the IUGG assembly. Of note to the consortium were the final stages of the document on Standard Operating Procedures for spectral UV measurements (the Reading site already follows the procedures) and the continued support for the bid from Davos, Switzerland to host the World Calibration Centre for UV measurements. The Regional Calibration Centre already exists at Davos, and bidding for funding for WCC status is with the Swiss Government. The Reading site has already been calibrated to this (current RCC) standard through its involvement in the development of the calibration procedure available from Davos. However, as with all calibrations it needs checking on a regular basis.
The request to include derived UV index data with UV data submission to WOUDC evolved from the SAG meeting. This is in response to WMO-JSC and OPAG-EPAC (Dr Webb also attended the OPAG-EPAC meeting in Geneva, 27-29 April, 2011) requirements that the GAW service respond to user needs. The UV index is widely used in public health agendas and WOUDC is trialling direct availability of the UVI from its database.
It was also noted that significantly increasing global coverage of UV data is best achieved by using satellite data. However, satellite retrieval processes are complex and not yet at a level suitable for GAW applications. It is imperative to maintain high quality, spectral, ground stations, providing the data that can be used to improve and continue to ground-truth the satellite data. The SAG will be working closely with the satellite community on the task of improving satellite retrievals.
WMO Ozone Profile Meeting, Geneva, Switzerland (January 2011)
The WMO Ozone profile meeting was attended by Dr John Rimmer. The aim of the meeting was to bring together the different platforms, Dobson, Brewer, FTIR, microwave, sonde, satellite etc., with a view to collating historical measurement records to see if trends to date can be identified. The work will range from assessing the viability of the data through to the building of composite datasets. Dr Rimmer has been asked to assist the working group dealing with the Brewer Umkehr data. The web page can be found at http://igaco-o3.fmi.fi/VDO/.
WMO UV-SAG, Bangkok, Thailand (8–12 February 2010)
Dr Ann Webb chaired the WMO UV-SAG meeting from 8th February to 12th February 2010 in Bangkok, Thailand. Subjects discussed included progress towards standard operating procedures for spectral instruments, and documentation for the operation of broadband and diode array instruments.
Eyjafjallajokull eruption
During March 2010 a precursor eruption began in Iceland, leading to the full-scale eruption of Eyjafjallajokull on 15th April 2010. The location of the 15th April eruption under an icecap-covered peak resulted in an ash-rich plume being swept southeast towards the UK. The ozone and UV data from the Manchester and Reading GAW sites was analysed daily for signs of the plume, with updates being provided to Defra directly. The ash cloud caused an increase in the aerosol optical depth measured at both sites, but no increase in SO2. This is in agreement with the satellite record. No obvious change was observable in the total column ozone or surface UV measurements, although some distortion of the umkehr profile measured in Manchester may be due to the ash cloud. We note however that the densest part of the plume passed to the north of the UK, away from centres of population. Data was also requested, and sent, to David Pyle, Professor of Earth Sciences at University of Oxford, which showed the level and transport of aerosol across the UK.
The Gemini Building Fermi Avenue Harwell Didcot Oxfordshire OX11 0QR
Tel: 0870 190 1900 Fax: 0870 190 6318
www.aeat.co.uk