Embed Size (px)
Citation preview
Basel III Pillar 3Capital Adequacy and Risks Disclosures as at 30 June 2019

Commonwealth Bank of Australia | ACN 123 123 124 | 7 August 2019
Commonwealth Bank of Australia – Pillar 3 Report 1
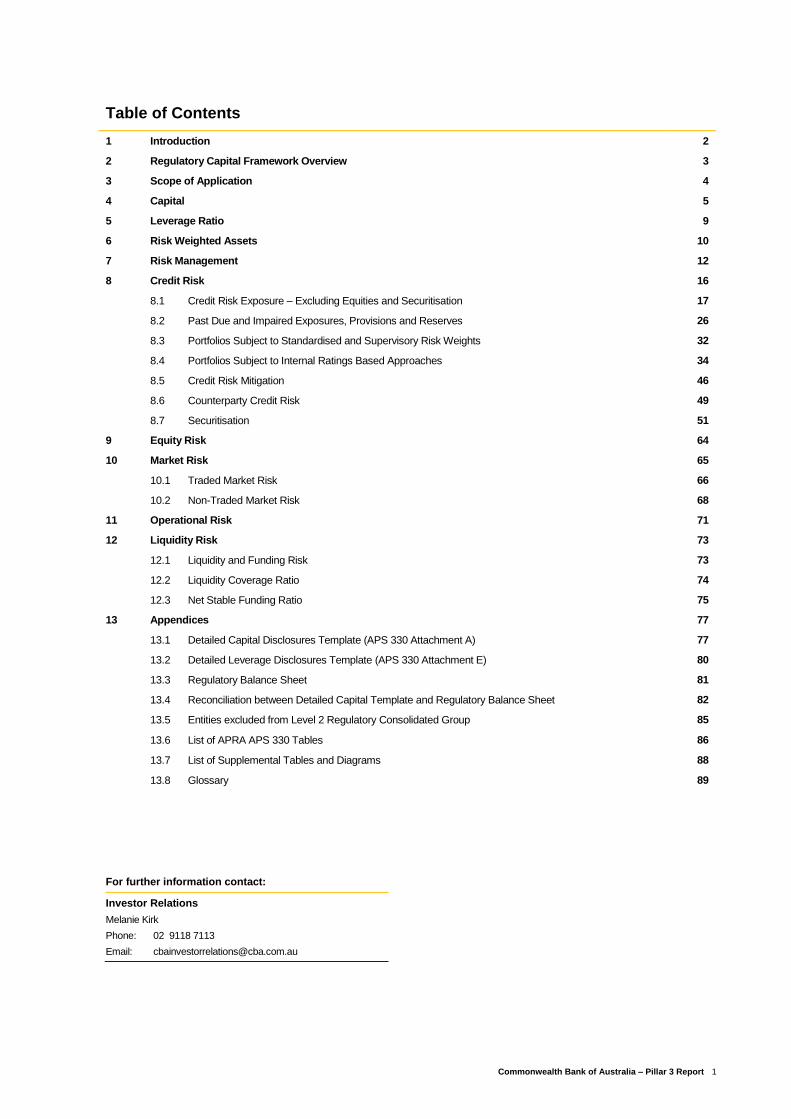
Table of Contents
1 Introduction 2
2 Regulatory Capital Framework Overview 3
3 Scope of Application 4
4 Capital 5
5 Leverage Ratio 9
6 Risk Weighted Assets 10
7 Risk Management 12
8 Credit Risk 16
8.1 Credit Risk Exposure – Excluding Equities and Securitisation 17
8.2 Past Due and Impaired Exposures, Provisions and Reserves 26
8.3 Portfolios Subject to Standardised and Supervisory Risk Weights 32
8.4 Portfolios Subject to Internal Ratings Based Approaches 34
8.5 Credit Risk Mitigation 46
8.6 Counterparty Credit Risk 49
8.7 Securitisation 51
9 Equity Risk 64
10 Market Risk 65
10.1 Traded Market Risk 66
10.2 Non-Traded Market Risk 68
11 Operational Risk 71
12 Liquidity Risk 73
12.1 Liquidity and Funding Risk 73
12.2 Liquidity Coverage Ratio 74
12.3 Net Stable Funding Ratio 75
13 Appendices 77
13.1 Detailed Capital Disclosures Template (APS 330 Attachment A) 77
13.2 Detailed Leverage Disclosures Template (APS 330 Attachment E) 80
13.3 Regulatory Balance Sheet 81
13.4 Reconciliation between Detailed Capital Template and Regulatory Balance Sheet 82
13.5 Entities excluded from Level 2 Regulatory Consolidated Group 85
13.6 List of APRA APS 330 Tables 86
13.7 List of Supplemental Tables and Diagrams 88
13.8 Glossary 89
For further information contact:
Investor Relations
Melanie Kirk
Phone: 02 9118 7113
Email: [email protected]
Introduction
2 Commonwealth Bank of Australia – Pillar 3 Report
1 Introduction
The Commonwealth Bank of Australia (the Group) is an
Authorised Deposit-taking Institution (ADI) regulated by the
Australian Prudential Regulation Authority (APRA) under the
authority of the Banking Act 1959.
This document is prepared in accordance with Board
approved policy and APRA’s prudential standard APS 330
“Public Disclosure”. It presents information on the Group’s
capital adequacy and Risk Weighted Assets (RWA)
calculations for credit risk including securitisation, market risk,
Interest Rate Risk in the Banking Book (IRRBB) and
operational risk.
This document also presents information on the Group’s
leverage and liquidity ratios and countercyclical capital buffer
(CCyB) in accordance with prescribed methodology.
The Group is required to report its assessment of capital
adequacy on a Level 2 basis. Level 2 is defined as the
consolidated banking group excluding the insurance and
funds management businesses and entities through which
securitisation of Group assets is conducted.
The Group is predominantly accredited to use the Advanced
Internal Ratings Based approach (AIRB) for credit risk and
Advanced Measurement Approach (AMA) for operational risk.
The Group is also required to assess its traded market risk
and IRRBB requirement under Pillar 1 of the Basel capital
framework.
The Group engaged the external auditor (PwC) to perform
assurance procedures over the Pillar 3 report in accordance
with the Australian Standard on Assurance Engagements
ASAE 3000 “Assurance Engagements Other Than Audits or
Reviews of Historical Financial Information” (ASAE 3000)
and in accordance with the Assurance framework “Banking
Regulatory Ratios” issued by the Institute of Chartered
Accountants in England and Wales (“ICAEW”) in March 2017.
PwC have provided recommendations to enhance the internal
controls related to the calculation of RWA and the Group has
an action plan in place to implement these recommendations.
This Pillar 3 document is available on the Group’s corporate
website:
www.commbank.com.au/about-us/investors/regulatory-
disclosure.
The Group in Review
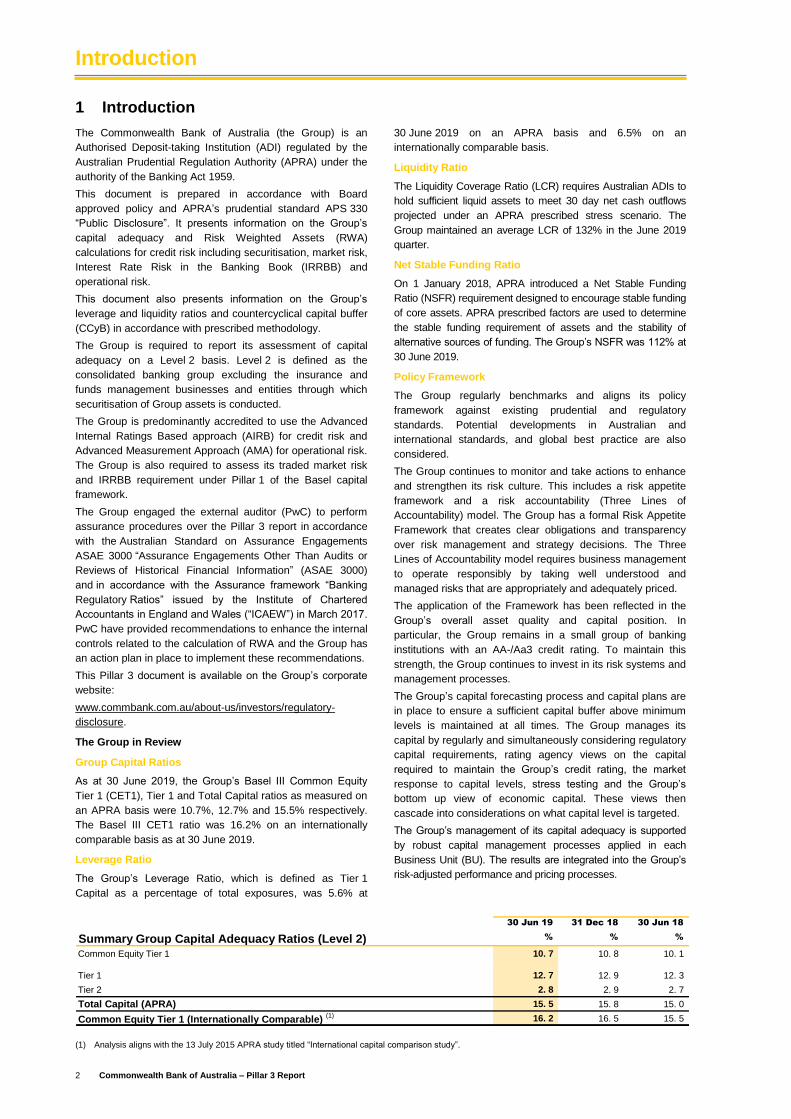
Group Capital Ratios
As at 30 June 2019, the Group’s Basel III Common Equity
Tier 1 (CET1), Tier 1 and Total Capital ratios as measured on
an APRA basis were 10.7%, 12.7% and 15.5% respectively.
The Basel III CET1 ratio was 16.2% on an internationally
comparable basis as at 30 June 2019.
Leverage Ratio
The Group’s Leverage Ratio, which is defined as Tier 1
Capital as a percentage of total exposures, was 5.6% at
30 June 2019 on an APRA basis and 6.5% on an
internationally comparable basis.
Liquidity Ratio
The Liquidity Coverage Ratio (LCR) requires Australian ADIs to
hold sufficient liquid assets to meet 30 day net cash outflows
projected under an APRA prescribed stress scenario. The
Group maintained an average LCR of 132% in the June 2019
quarter.
Net Stable Funding Ratio
On 1 January 2018, APRA introduced a Net Stable Funding
Ratio (NSFR) requirement designed to encourage stable funding
of core assets. APRA prescribed factors are used to determine
the stable funding requirement of assets and the stability of
alternative sources of funding. The Group’s NSFR was 112% at
30 June 2019.
Policy Framework
The Group regularly benchmarks and aligns its policy
framework against existing prudential and regulatory
standards. Potential developments in Australian and
international standards, and global best practice are also
considered.
The Group continues to monitor and take actions to enhance
and strengthen its risk culture. This includes a risk appetite
framework and a risk accountability (Three Lines of
Accountability) model. The Group has a formal Risk Appetite
Framework that creates clear obligations and transparency
over risk management and strategy decisions. The Three
Lines of Accountability model requires business management
to operate responsibly by taking well understood and
managed risks that are appropriately and adequately priced.
The application of the Framework has been reflected in the
Group’s overall asset quality and capital position. In
particular, the Group remains in a small group of banking
institutions with an AA-/Aa3 credit rating. To maintain this
strength, the Group continues to invest in its risk systems and
management processes.
The Group’s capital forecasting process and capital plans are
in place to ensure a sufficient capital buffer above minimum
levels is maintained at all times. The Group manages its
capital by regularly and simultaneously considering regulatory
capital requirements, rating agency views on the capital
required to maintain the Group’s credit rating, the market
response to capital levels, stress testing and the Group’s
bottom up view of economic capital. These views then
cascade into considerations on what capital level is targeted.
The Group’s management of its capital adequacy is supported
by robust capital management processes applied in each
Business Unit (BU). The results are integrated into the Group’s
risk-adjusted performance and pricing processes.
30 Jun 19 31 Dec 18 30 Jun 18
Summary Group Capital Adequacy Ratios (Level 2) % % %
Common Equity Tier 1 10. 7 10. 8 10. 1
Tier 1 12. 7 12. 9 12. 3
Tier 2 2. 8 2. 9 2. 7
Total Capital (APRA) 15. 5 15. 8 15. 0
Common Equity Tier 1 (Internationally Comparable) (1) 16. 2 16. 5 15. 5
(1) Analysis aligns with the 13 July 2015 APRA study titled “International capital comparison study”.
Capital
Commonwealth Bank of Australia – Pillar 3 Report 3
2 Regulatory Capital Framework Overview
The Group is required to report the calculation of RWA and
assessment of capital adequacy on a Level 2 basis (see
section 3, page 4 for further details). APRA has set minimum
regulatory capital requirements for banks.
These requirements define what is acceptable as capital and
provide for methods of measuring the risks incurred by banks
so that the “need” for capital can be compared to the amount
of capital “at hand”.
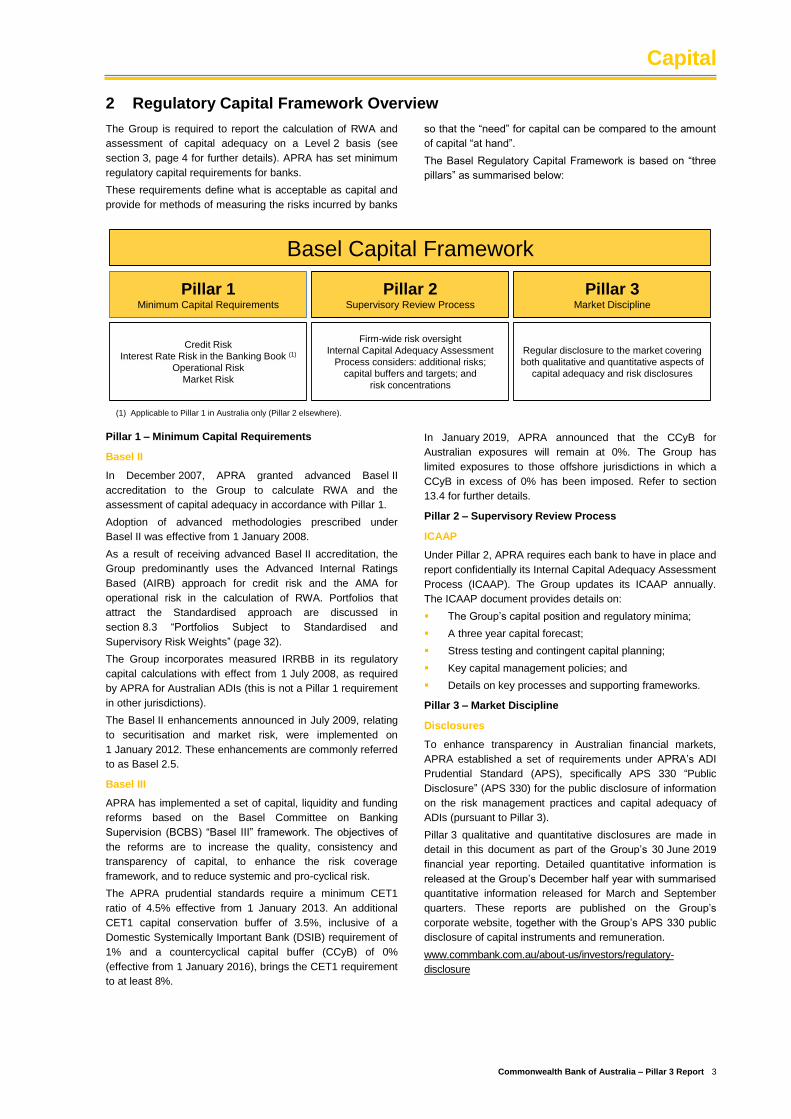
The Basel Regulatory Capital Framework is based on “three
pillars” as summarised below:
Basel Capital Framework
Pillar 1Minimum Capital Requirements
Pillar 2Supervisory Review Process
Credit Risk
Interest Rate Risk in the Banking Book (1)
Operational Risk
Market Risk
Pillar 3Market Discipline
Firm-wide risk oversight
Internal Capital Adequacy Assessment
Process considers: additional risks;
capital buffers and targets; and
risk concentrations
Regular disclosure to the market covering
both qualitative and quantitative aspects of
capital adequacy and risk disclosures
(1) Applicable to Pillar 1 in Australia only (Pillar 2 elsewhere).
Pillar 1 – Minimum Capital Requirements
Basel II
In December 2007, APRA granted advanced Basel II
accreditation to the Group to calculate RWA and the
assessment of capital adequacy in accordance with Pillar 1.
Adoption of advanced methodologies prescribed under
Basel II was effective from 1 January 2008.
As a result of receiving advanced Basel II accreditation, the
Group predominantly uses the Advanced Internal Ratings
Based (AIRB) approach for credit risk and the AMA for
operational risk in the calculation of RWA. Portfolios that
attract the Standardised approach are discussed in
section 8.3 “Portfolios Subject to Standardised and
Supervisory Risk Weights” (page 32).
The Group incorporates measured IRRBB in its regulatory
capital calculations with effect from 1 July 2008, as required
by APRA for Australian ADIs (this is not a Pillar 1 requirement
in other jurisdictions).
The Basel II enhancements announced in July 2009, relating
to securitisation and market risk, were implemented on
1 January 2012. These enhancements are commonly referred
to as Basel 2.5.
Basel III
APRA has implemented a set of capital, liquidity and funding
reforms based on the Basel Committee on Banking
Supervision (BCBS) “Basel III” framework. The objectives of
the reforms are to increase the quality, consistency and
transparency of capital, to enhance the risk coverage
framework, and to reduce systemic and pro-cyclical risk.
The APRA prudential standards require a minimum CET1
ratio of 4.5% effective from 1 January 2013. An additional
CET1 capital conservation buffer of 3.5%, inclusive of a
Domestic Systemically Important Bank (DSIB) requirement of
1% and a countercyclical capital buffer (CCyB) of 0%
(effective from 1 January 2016), brings the CET1 requirement
to at least 8%.
In January 2019, APRA announced that the CCyB for
Australian exposures will remain at 0%. The Group has
limited exposures to those offshore jurisdictions in which a
CCyB in excess of 0% has been imposed. Refer to section
13.4 for further details.
Pillar 2 – Supervisory Review Process
ICAAP
Under Pillar 2, APRA requires each bank to have in place and
report confidentially its Internal Capital Adequacy Assessment
Process (ICAAP). The Group updates its ICAAP annually.
The ICAAP document provides details on:
The Group’s capital position and regulatory minima;
A three year capital forecast;
Stress testing and contingent capital planning;
Key capital management policies; and
Details on key processes and supporting frameworks.
Pillar 3 – Market Discipline
Disclosures
To enhance transparency in Australian financial markets,
APRA established a set of requirements under APRA’s ADI
Prudential Standard (APS), specifically APS 330 “Public
Disclosure” (APS 330) for the public disclosure of information
on the risk management practices and capital adequacy of
ADIs (pursuant to Pillar 3).
Pillar 3 qualitative and quantitative disclosures are made in
detail in this document as part of the Group’s 30 June 2019
financial year reporting. Detailed quantitative information is
released at the Group’s December half year with summarised
quantitative information released for March and September
quarters. These reports are published on the Group’s
corporate website, together with the Group’s APS 330 public
disclosure of capital instruments and remuneration.
www.commbank.com.au/about-us/investors/regulatory-
disclosure
Scope of Application
4 Commonwealth Bank of Australia – Pillar 3 Report
3 Scope of Application
This document has been prepared in accordance with Board
approved policy and reporting requirements set out in
APS 330.
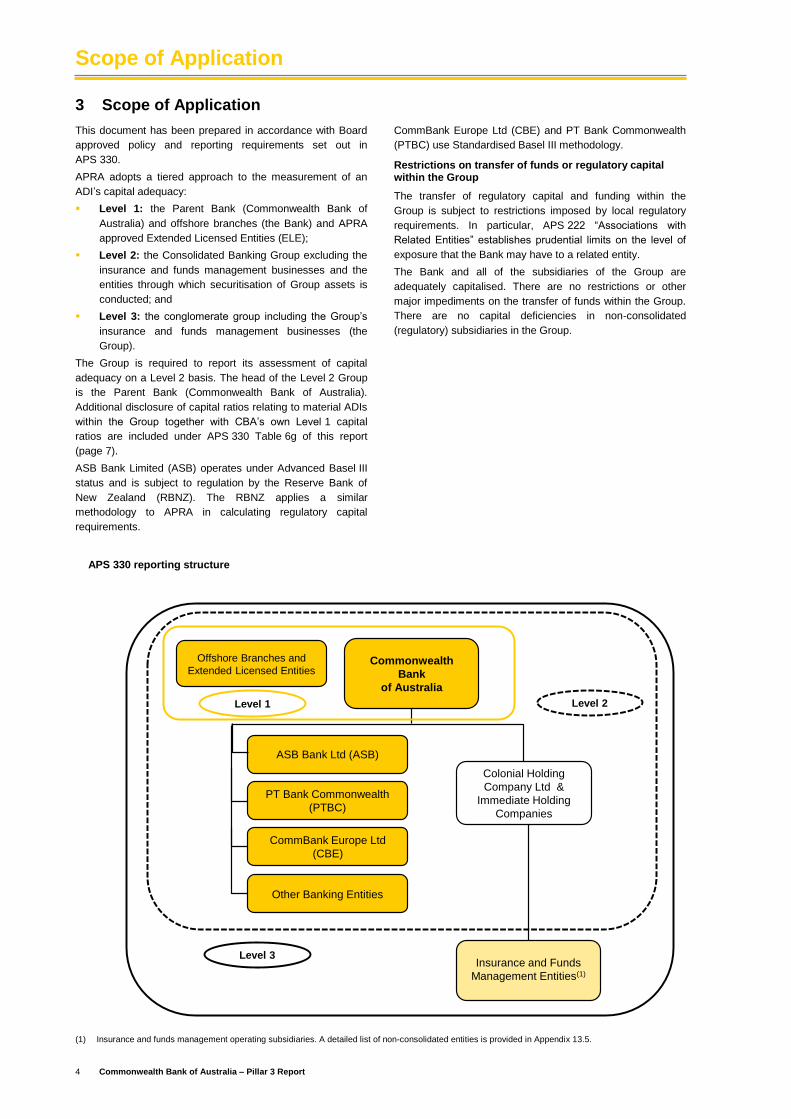
APRA adopts a tiered approach to the measurement of an
ADI’s capital adequacy:
Level 1: the Parent Bank (Commonwealth Bank of
Australia) and offshore branches (the Bank) and APRA
approved Extended Licensed Entities (ELE);
Level 2: the Consolidated Banking Group excluding the
insurance and funds management businesses and the
entities through which securitisation of Group assets is
conducted; and
Level 3: the conglomerate group including the Group’s
insurance and funds management businesses (the
Group).
The Group is required to report its assessment of capital
adequacy on a Level 2 basis. The head of the Level 2 Group
is the Parent Bank (Commonwealth Bank of Australia).
Additional disclosure of capital ratios relating to material ADIs
within the Group together with CBA’s own Level 1 capital
ratios are included under APS 330 Table 6g of this report
(page 7).
ASB Bank Limited (ASB) operates under Advanced Basel III
status and is subject to regulation by the Reserve Bank of
New Zealand (RBNZ). The RBNZ applies a similar
methodology to APRA in calculating regulatory capital
requirements.
CommBank Europe Ltd (CBE) and PT Bank Commonwealth
(PTBC) use Standardised Basel III methodology.
Restrictions on transfer of funds or regulatory capital within the Group
The transfer of regulatory capital and funding within the
Group is subject to restrictions imposed by local regulatory
requirements. In particular, APS 222 “Associations with
Related Entities” establishes prudential limits on the level of
exposure that the Bank may have to a related entity.
The Bank and all of the subsidiaries of the Group are
adequately capitalised. There are no restrictions or other
major impediments on the transfer of funds within the Group.
There are no capital deficiencies in non-consolidated
(regulatory) subsidiaries in the Group.
(1) Insurance and funds management operating subsidiaries. A detailed list of non-consolidated entities is provided in Appendix 13.5.
APS 330 reporting structure
ASB Bank Ltd (ASB)
Commonwealth
Bank
of Australia
CommBank Europe Ltd
(CBE)
PT Bank Commonwealth
(PTBC)
Offshore Branches and
Extended Licensed Entities
Colonial Holding
Company Ltd &
Immediate Holding
Companies
Insurance and Funds
Management Entities(1)
Level 2
Level 3
Level 1
Other Banking Entities
Capital
Commonwealth Bank of Australia – Pillar 3 Report 5
4 Capital
Capital Adequacy
The Group actively manages its capital to balance the
perspectives of various stakeholders (regulators, rating
agencies and shareholders). This is achieved by optimising
the mix of capital, while maintaining adequate capital ratios
throughout the financial year. The Group’s capital is managed
within a formal framework, its ICAAP, which is an integration
of risk, financial and capital management processes.
APRA advises the Group of its Prudential Capital Ratio
(PCR), which represents the regulatory minimum CET1,
Tier 1 and Total Capital ratios that the Group is required to
maintain at all times. In order to ensure there is no breach of
these minimum levels, APRA expects the Group to maintain a
prudent buffer over these prescribed minimum levels. The
PCR is subject to an ongoing review by APRA and is formally
reassessed on an annual basis. The Group is required to
inform APRA immediately of any breach or potential breach of
its PCR, including details of remedial action taken or planned
to be taken.
The Group has a range of instruments and methodologies
available to effectively manage capital. These include share
issues and buybacks, dividend and Dividend Reinvestment
Plan (DRP) policies, hybrid capital raising and dated and
undated subordinated debt issues. All major capital related
initiatives require approval by the Board.
The Group’s capital position is monitored on a continuous
basis and reported monthly to the Executive Leadership
Team of the Group and at regular intervals throughout the
year to the Board Risk Committee. Three year capital
forecasts are conducted on a quarterly basis and a detailed
capital and strategic plan is presented to the Board annually.
Capital Management
The Group’s CET1 ratio (APRA) was 10.7% as at 30 June 2019,
a decrease of 10 basis points from 31 December 2018 and an
increase of 60 basis points from 30 June 2018. During the half
year ended 30 June 2019, capital generated from earnings was
offset by the 2019 interim dividend and an overall net increase in
Risk Weighted Assets (RWA). The CET1 ratio was consistently
well in excess of regulatory minimum capital adequacy
requirements at all times thoroughout the full year ended 30
June 2019.
Capital Initiatives
The following significant capital initiatives were undertaken
during the year:
Common Equity Tier 1 Capital
The DRP in respect of the 2018 final dividend, was
satisfied by the allocation of $749 million of ordinary
shares, representing a participation rate of 18.4%;
The DRP in respect of the 2019 interim dividend was
satisfied in full by the on-market purchase of shares. The
participation rate for the interim DRP was 16.7%;
Additional Tier 1 Capital
In December 2018, the Bank issued $1.59 billion of
CommBank PERLS XI Capital Notes (PERLS XI) and
concurrently redeemed $2 billion Perpetual
Exchangeable Resaleable Listed Securities (PERLS VI);
and
In May 2019, the Group redeemed Basel III non-
compliant Perpetual Preference Shares issued by its
New Zealand subsidiaries, ASB Capital Limited and ASB
Capital No.2 Limited, (ASB PPS1 and ASV PPS 2) at
their par value of NZD550 million.
Other Regulatory Changes
Unquestionably Strong Capital Ratios
In July 2017 APRA released an information paper establishing
the quantum of additional capital required for the Australian
banking sector to have capital ratios that are unquestionably
strong.
APRA’s expectation is that the Australian major banks will
operate with a CET1 ratio of 10.5% or more by 1 January 2020.
As at 30 June 2019, the Group CET1 ratio was above this
benchmark at 10.7%.
In calendar years 2018 and 2019, APRA issued a number of
consultation documents to propose revisions to the overall
design of the capital framework. Further detail on the proposed
APRA reforms is provided on page 6. APRA has advised that
the proposed changes to the capital framework have been
accommodated within the 10.5% CET1 target set by APRA in
July 2017.
Capital
6 Commonwealth Bank of Australia – Pillar 3 Report
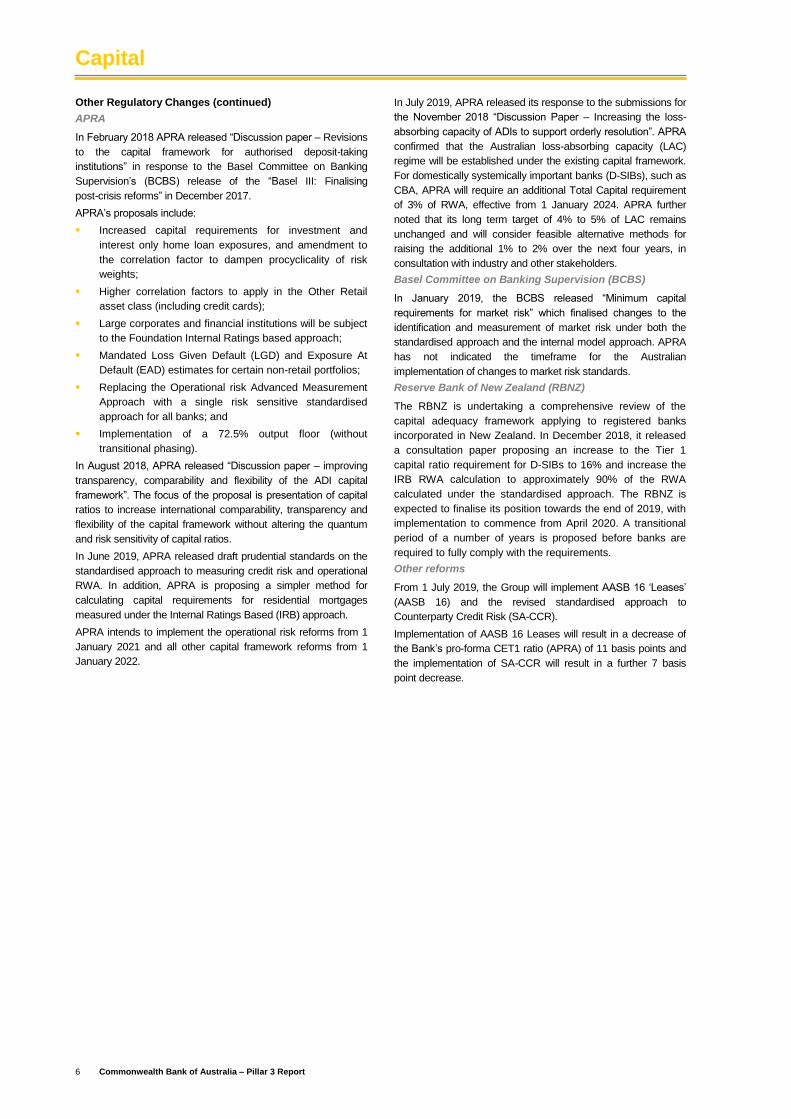
Other Regulatory Changes (continued)
APRA
In February 2018 APRA released “Discussion paper – Revisions
to the capital framework for authorised deposit-taking
institutions” in response to the Basel Committee on Banking
Supervision’s (BCBS) release of the “Basel III: Finalising
post-crisis reforms” in December 2017.
APRA’s proposals include:
Increased capital requirements for investment and
interest only home loan exposures, and amendment to
the correlation factor to dampen procyclicality of risk
weights;
Higher correlation factors to apply in the Other Retail
asset class (including credit cards);
Large corporates and financial institutions will be subject
to the Foundation Internal Ratings based approach;
Mandated Loss Given Default (LGD) and Exposure At
Default (EAD) estimates for certain non-retail portfolios;
Replacing the Operational risk Advanced Measurement
Approach with a single risk sensitive standardised
approach for all banks; and
Implementation of a 72.5% output floor (without
transitional phasing).
In August 2018, APRA released “Discussion paper – improving
transparency, comparability and flexibility of the ADI capital
framework”. The focus of the proposal is presentation of capital
ratios to increase international comparability, transparency and
flexibility of the capital framework without altering the quantum
and risk sensitivity of capital ratios.
In June 2019, APRA released draft prudential standards on the
standardised approach to measuring credit risk and operational
RWA. In addition, APRA is proposing a simpler method for
calculating capital requirements for residential mortgages
measured under the Internal Ratings Based (IRB) approach.
APRA intends to implement the operational risk reforms from 1
January 2021 and all other capital framework reforms from 1
January 2022.
In July 2019, APRA released its response to the submissions for
the November 2018 “Discussion Paper – Increasing the loss-
absorbing capacity of ADIs to support orderly resolution”. APRA
confirmed that the Australian loss-absorbing capacity (LAC)
regime will be established under the existing capital framework.
For domestically systemically important banks (D-SIBs), such as
CBA, APRA will require an additional Total Capital requirement
of 3% of RWA, effective from 1 January 2024. APRA further
noted that its long term target of 4% to 5% of LAC remains
unchanged and will consider feasible alternative methods for
raising the additional 1% to 2% over the next four years, in
consultation with industry and other stakeholders.
Basel Committee on Banking Supervision (BCBS)
In January 2019, the BCBS released “Minimum capital
requirements for market risk” which finalised changes to the
identification and measurement of market risk under both the
standardised approach and the internal model approach. APRA
has not indicated the timeframe for the Australian
implementation of changes to market risk standards.
Reserve Bank of New Zealand (RBNZ)
The RBNZ is undertaking a comprehensive review of the
capital adequacy framework applying to registered banks
incorporated in New Zealand. In December 2018, it released
a consultation paper proposing an increase to the Tier 1
capital ratio requirement for D-SIBs to 16% and increase the
IRB RWA calculation to approximately 90% of the RWA
calculated under the standardised approach. The RBNZ is
expected to finalise its position towards the end of 2019, with
implementation to commence from April 2020. A transitional
period of a number of years is proposed before banks are
required to fully comply with the requirements.
Other reforms
From 1 July 2019, the Group will implement AASB 16 ‘Leases’
(AASB 16) and the revised standardised approach to
Counterparty Credit Risk (SA-CCR).
Implementation of AASB 16 Leases will result in a decrease of
the Bank’s pro-forma CET1 ratio (APRA) of 11 basis points and
the implementation of SA-CCR will result in a further 7 basis
point decrease.
Capital
Commonwealth Bank of Australia – Pillar 3 Report 7
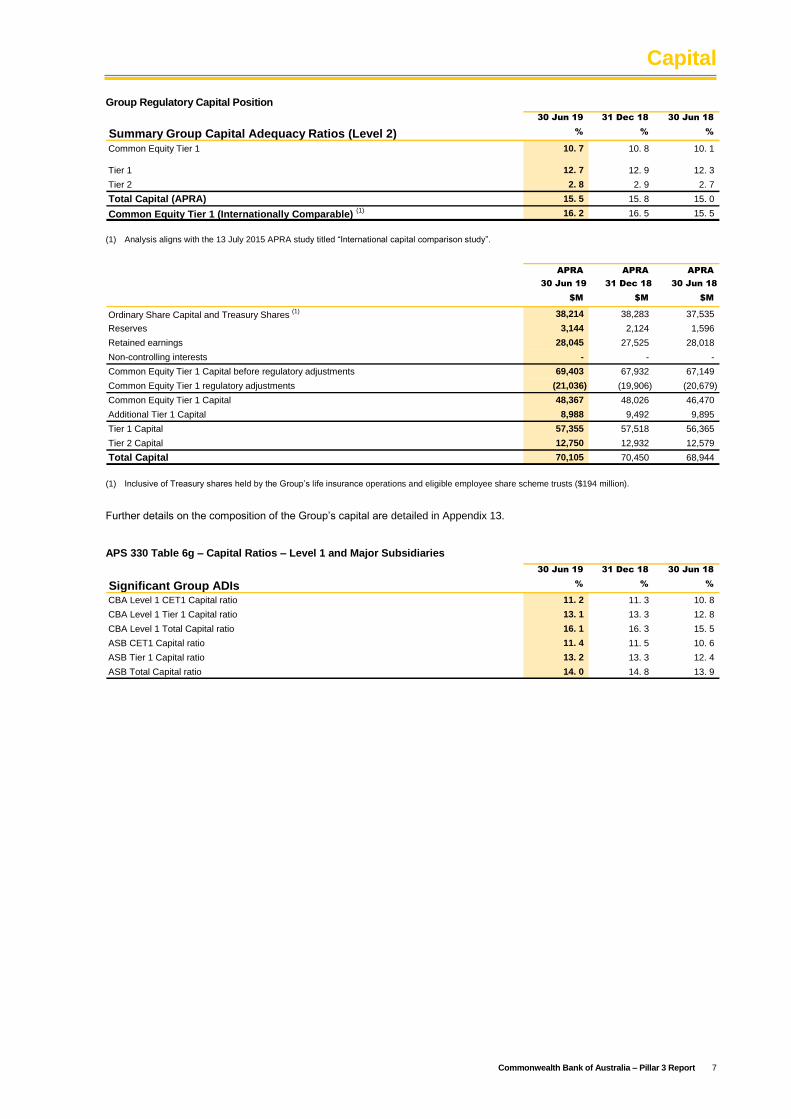
Group Regulatory Capital Position
30 Jun 19 31 Dec 18 30 Jun 18
Summary Group Capital Adequacy Ratios (Level 2) % % %
Common Equity Tier 1 10. 7 10. 8 10. 1
Tier 1 12. 7 12. 9 12. 3
Tier 2 2. 8 2. 9 2. 7
Total Capital (APRA) 15. 5 15. 8 15. 0
Common Equity Tier 1 (Internationally Comparable) (1) 16. 2 16. 5 15. 5
(1) Analysis aligns with the 13 July 2015 APRA study titled “International capital comparison study”.
APRA APRA APRA
30 Jun 19 31 Dec 18 30 Jun 18
$M $M $M
Ordinary Share Capital and Treasury Shares (1) 38,214 38,283 37,535
Reserves 3,144 2,124 1,596
Retained earnings 28,045 27,525 28,018
Non-controlling interests - - -
Common Equity Tier 1 Capital before regulatory adjustments 69,403 67,932 67,149
Common Equity Tier 1 regulatory adjustments (21,036) (19,906) (20,679)
Common Equity Tier 1 Capital 48,367 48,026 46,470
Additional Tier 1 Capital 8,988 9,492 9,895
Tier 1 Capital 57,355 57,518 56,365
Tier 2 Capital 12,750 12,932 12,579
Total Capital 70,105 70,450 68,944
(1) Inclusive of Treasury shares held by the Group’s life insurance operations and eligible employee share scheme trusts ($194 million).
Further details on the composition of the Group’s capital are detailed in Appendix 13.
APS 330 Table 6g – Capital Ratios – Level 1 and Major Subsidiaries
30 Jun 19 31 Dec 18 30 Jun 18
Significant Group ADIs % % %
CBA Level 1 CET1 Capital ratio 11. 2 11. 3 10. 8
CBA Level 1 Tier 1 Capital ratio 13. 1 13. 3 12. 8
CBA Level 1 Total Capital ratio 16. 1 16. 3 15. 5
ASB CET1 Capital ratio 11. 4 11. 5 10. 6
ASB Tier 1 Capital ratio 13. 2 13. 3 12. 4
ASB Total Capital ratio 14. 0 14. 8 13. 9
Capital
8 Commonwealth Bank of Australia – Pillar 3 Report
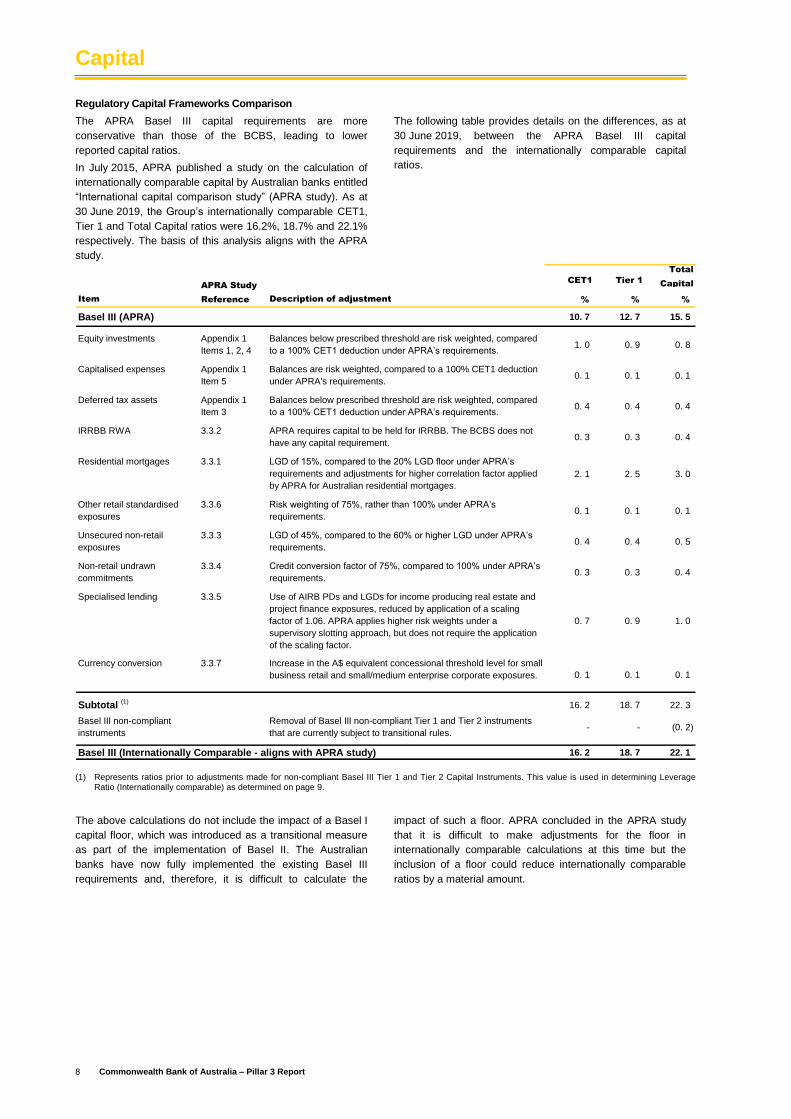
Regulatory Capital Frameworks Comparison
The APRA Basel III capital requirements are more
conservative than those of the BCBS, leading to lower
reported capital ratios.
In July 2015, APRA published a study on the calculation of
internationally comparable capital by Australian banks entitled
“International capital comparison study” (APRA study). As at
30 June 2019, the Group’s internationally comparable CET1,
Tier 1 and Total Capital ratios were 16.2%, 18.7% and 22.1%
respectively. The basis of this analysis aligns with the APRA
study.
The following table provides details on the differences, as at
30 June 2019, between the APRA Basel III capital
requirements and the internationally comparable capital
ratios.
CET1 Tier 1
Total
Capital
Item Description of adjustment % % %
Basel III (APRA) 10. 7 12. 7 15. 5
Equity investments Appendix 1
Items 1, 2, 4
Balances below prescribed threshold are risk weighted, compared
to a 100% CET1 deduction under APRA’s requirements.1. 0 0. 9 0. 8
Capitalised expenses Appendix 1
Item 5
Balances are risk weighted, compared to a 100% CET1 deduction
under APRA's requirements.0. 1 0. 1 0. 1
Deferred tax assets Appendix 1
Item 3
Balances below prescribed threshold are risk weighted, compared
to a 100% CET1 deduction under APRA’s requirements. 0. 4 0. 4 0. 4
IRRBB RWA 3.3.2 APRA requires capital to be held for IRRBB. The BCBS does not
have any capital requirement. 0. 3 0. 3 0. 4
Residential mortgages 3.3.1 LGD of 15%, compared to the 20% LGD floor under APRA’s
requirements and adjustments for higher correlation factor applied
by APRA for Australian residential mortgages.
2. 1 2. 5 3. 0
Other retail standardised
exposures
3.3.6 Risk weighting of 75%, rather than 100% under APRA’s
requirements.0. 1 0. 1 0. 1
Unsecured non-retail
exposures
3.3.3 LGD of 45%, compared to the 60% or higher LGD under APRA’s
requirements. 0. 4 0. 4 0. 5
Non-retail undrawn
commitments
3.3.4 Credit conversion factor of 75%, compared to 100% under APRA’s
requirements.0. 3 0. 3 0. 4
Specialised lending 3.3.5 Use of AIRB PDs and LGDs for income producing real estate and
project finance exposures, reduced by application of a scaling
factor of 1.06. APRA applies higher risk weights under a
supervisory slotting approach, but does not require the application
of the scaling factor.
0. 7 0. 9 1. 0
Currency conversion 3.3.7 Increase in the A$ equivalent concessional threshold level for small
business retail and small/medium enterprise corporate exposures. 0. 1 0. 1 0. 1
16. 2 18. 7 22. 3
Basel III non-compliant
instruments
Removal of Basel III non-compliant Tier 1 and Tier 2 instruments
that are currently subject to transitional rules.- - (0. 2)
Basel III (Internationally Comparable - aligns with APRA study) 16. 2 18. 7 22. 1
APRA Study
Reference
Subtotal (1)
(1) Represents ratios prior to adjustments made for non-compliant Basel III Tier 1 and Tier 2 Capital Instruments. This value is used in determining Leverage Ratio (Internationally comparable) as determined on page 9.
The above calculations do not include the impact of a Basel I
capital floor, which was introduced as a transitional measure
as part of the implementation of Basel II. The Australian
banks have now fully implemented the existing Basel III
requirements and, therefore, it is difficult to calculate the
impact of such a floor. APRA concluded in the APRA study
that it is difficult to make adjustments for the floor in
internationally comparable calculations at this time but the
inclusion of a floor could reduce internationally comparable
ratios by a material amount.
Leverage Ratio
Commonwealth Bank of Australia – Pillar 3 Report 9
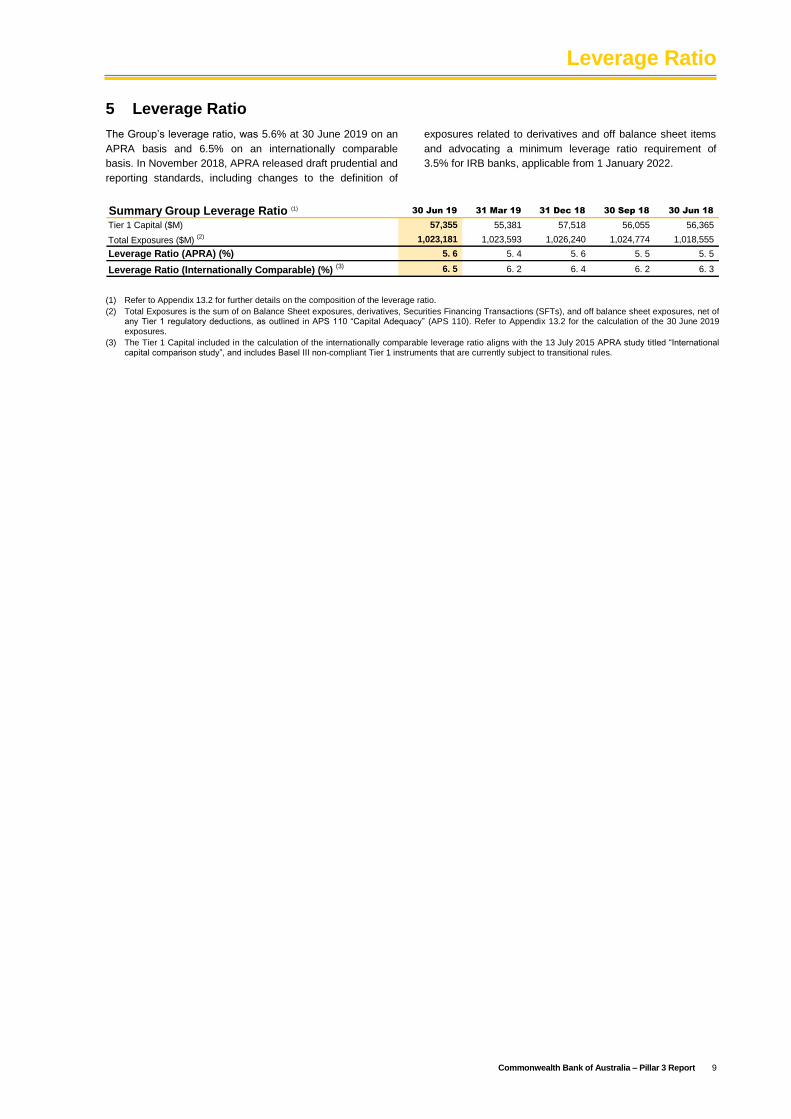
5 Leverage Ratio
The Group’s leverage ratio, was 5.6% at 30 June 2019 on an
APRA basis and 6.5% on an internationally comparable
basis. In November 2018, APRA released draft prudential and
reporting standards, including changes to the definition of
exposures related to derivatives and off balance sheet items
and advocating a minimum leverage ratio requirement of
3.5% for IRB banks, applicable from 1 January 2022.
Summary Group Leverage Ratio (1)30 Jun 19 31 Mar 19 31 Dec 18 30 Sep 18 30 Jun 18
Tier 1 Capital ($M) 57,355 55,381 57,518 56,055 56,365
Total Exposures ($M) (2) 1,023,181 1,023,593 1,026,240 1,024,774 1,018,555
Leverage Ratio (APRA) (%) 5. 6 5. 4 5. 6 5. 5 5. 5
Leverage Ratio (Internationally Comparable) (%) (3) 6. 5 6. 2 6. 4 6. 2 6. 3
(1) Refer to Appendix 13.2 for further details on the composition of the leverage ratio.
(2) Total Exposures is the sum of on Balance Sheet exposures, derivatives, Securities Financing Transactions (SFTs), and off balance sheet exposures, net of any Tier 1 regulatory deductions, as outlined in APS 110 “Capital Adequacy” (APS 110). Refer to Appendix 13.2 for the calculation of the 30 June 2019 exposures.
(3) The Tier 1 Capital included in the calculation of the internationally comparable leverage ratio aligns with the 13 July 2015 APRA study titled “International capital comparison study”, and includes Basel III non-compliant Tier 1 instruments that are currently subject to transitional rules.
Risk Weighted Assets
10 Commonwealth Bank of Australia – Pillar 3 Report
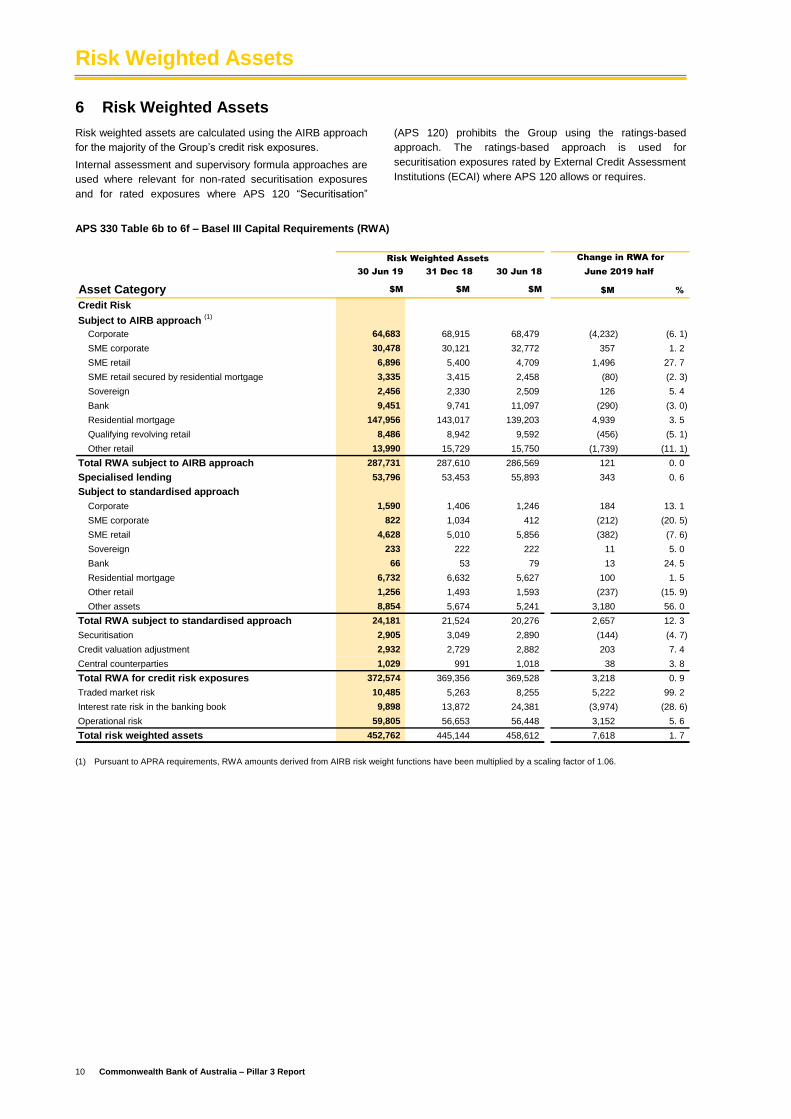
6 Risk Weighted Assets
Risk weighted assets are calculated using the AIRB approach
for the majority of the Group’s credit risk exposures.
Internal assessment and supervisory formula approaches are
used where relevant for non-rated securitisation exposures
and for rated exposures where APS 120 “Securitisation”
(APS 120) prohibits the Group using the ratings-based
approach. The ratings-based approach is used for
securitisation exposures rated by External Credit Assessment
Institutions (ECAI) where APS 120 allows or requires.
APS 330 Table 6b to 6f – Basel III Capital Requirements (RWA)
30 Jun 19 31 Dec 18 30 Jun 18
Asset Category $M $M $M $M %
Credit Risk
Subject to AIRB approach (1)
Corporate 64,683 68,915 68,479 (4,232) (6. 1)
SME corporate 30,478 30,121 32,772 357 1. 2
SME retail 6,896 5,400 4,709 1,496 27. 7
SME retail secured by residential mortgage 3,335 3,415 2,458 (80) (2. 3)
Sovereign 2,456 2,330 2,509 126 5. 4
Bank 9,451 9,741 11,097 (290) (3. 0)
Residential mortgage 147,956 143,017 139,203 4,939 3. 5
Qualifying revolving retail 8,486 8,942 9,592 (456) (5. 1)
Other retail 13,990 15,729 15,750 (1,739) (11. 1)
Total RWA subject to AIRB approach 287,731 287,610 286,569 121 0. 0
Specialised lending 53,796 53,453 55,893 343 0. 6
Subject to standardised approach
Corporate 1,590 1,406 1,246 184 13. 1
SME corporate 822 1,034 412 (212) (20. 5)
SME retail 4,628 5,010 5,856 (382) (7. 6)
Sovereign 233 222 222 11 5. 0
Bank 66 53 79 13 24. 5
Residential mortgage 6,732 6,632 5,627 100 1. 5
Other retail 1,256 1,493 1,593 (237) (15. 9)
Other assets 8,854 5,674 5,241 3,180 56. 0
Total RWA subject to standardised approach 24,181 21,524 20,276 2,657 12. 3
Securitisation 2,905 3,049 2,890 (144) (4. 7)
Credit valuation adjustment 2,932 2,729 2,882 203 7. 4
Central counterparties 1,029 991 1,018 38 3. 8
Total RWA for credit risk exposures 372,574 369,356 369,528 3,218 0. 9
Traded market risk 10,485 5,263 8,255 5,222 99. 2
Interest rate risk in the banking book 9,898 13,872 24,381 (3,974) (28. 6)
Operational risk 59,805 56,653 56,448 3,152 5. 6
Total risk weighted assets 452,762 445,144 458,612 7,618 1. 7
Change in RWA forRisk Weighted Assets
June 2019 half
(1) Pursuant to APRA requirements, RWA amounts derived from AIRB risk weight functions have been multiplied by a scaling factor of 1.06.
Risk Weighted Assets
Commonwealth Bank of Australia – Pillar 3 Report 11
Risk Weighted Assets
Total RWA increased by $7.6 billion or 1.7% on the prior half
to $452.8 billion driven by increases in traded market risk,
credit risk and operational risk RWA; partly offset by IRRBB
RWA.
Credit Risk RWA
Credit risk RWA increased by $3.2 billion or 0.9% on the prior
half, mainly driven by:
Volume growth across residential mortgages and
standardised other assets ($6.0 billion);
Reduction in credit quality across most portfolios
including residential mortgage risk weights which have
increased during the half, partly due to new home loan
models. The models incorporate long-term customer
arrears behaviour and the recent stabilisation of home
lending arrears has not yet been reflected in credit RWA
($2.2 billion);
Data and methodology changes ($1.2 billion); and
Foreign currency movements ($0.4 billion); partly
offset by
Volume reductions across non-retail portfolios, consumer
credit cards and personal loans ($6.5 billion); and
Changes to credit risk estimates and regulatory
treatments around both SME retail and other retail
portfolios subject to AIRB approach ($0.1 billion).
Traded Market Risk RWA
Traded market risk RWA increased by $5.2 billion or 99.2%
on the prior half to $10.5 billion. The Stressed Value-at-Risk
(SVaR) component under the internal model approach was
the main driver of the increase, and this resulted from both
risk positioning and the conservative modelling treatment of
some interest rate products.
Interest Rate Risk in the Banking Book (IRRBB) RWA
IRRBB RWA decreased by $4.0 billion or 28.6% on the prior
half. This was due to interest rate risk management activities
and higher embedded gains due to lower domestic and
offshore interest rates.
Operational Risk RWA
Operational risk RWA increased by $3.2 billion or 5.6% on the
prior half to $59.8 billion. This reflects changes in the Group’s
operational risk profile relating to the changing regulatory
environment and modelling variations including changes in
portfolio diversification.
The operational risk RWA includes the $12.5 billion add-on
required by APRA following the Prudential Inquiry findings dated
30 April 2018.
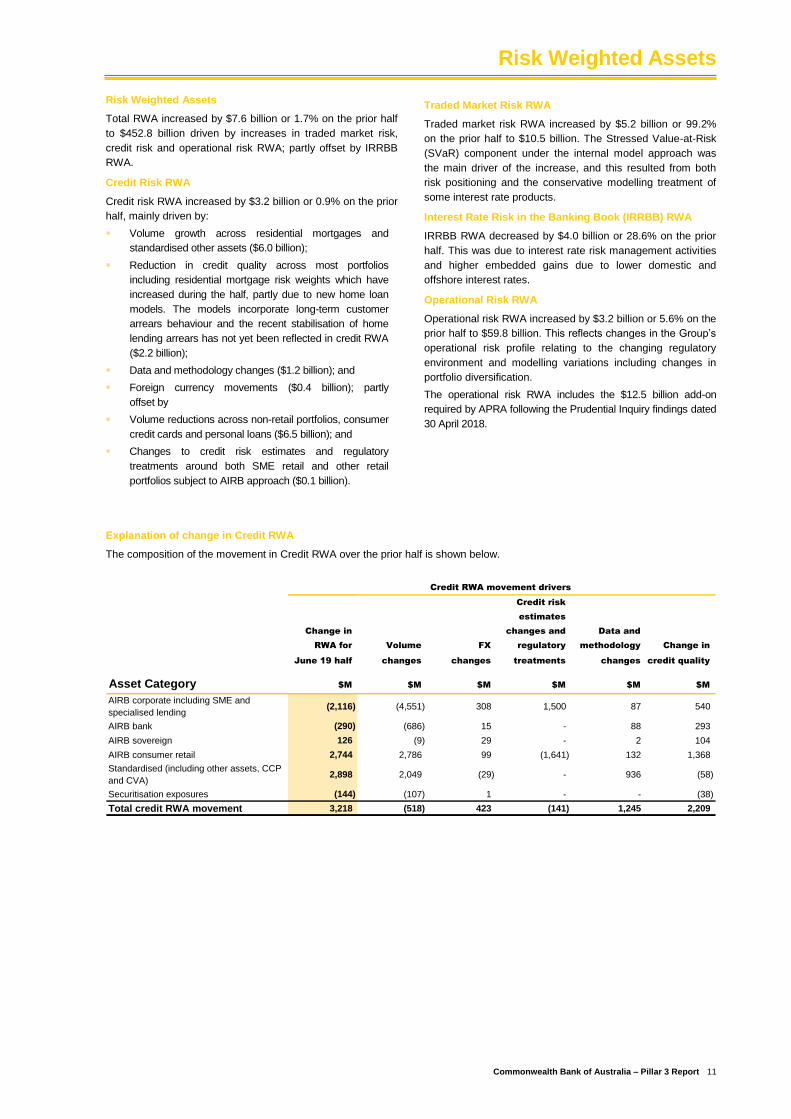
Explanation of change in Credit RWA
The composition of the movement in Credit RWA over the prior half is shown below.
Credit risk
estimates
Change in changes and Data and
RWA for Volume FX regulatory methodology Change in
June 19 half changes changes treatments changes credit quality
Asset Category $M $M $M $M $M $M
AIRB corporate including SME and
specialised lending(2,116) (4,551) 308 1,500 87 540
AIRB bank (290) (686) 15 - 88 293
AIRB sovereign 126 (9) 29 - 2 104
AIRB consumer retail 2,744 2,786 99 (1,641) 132 1,368
Standardised (including other assets, CCP
and CVA)2,898 2,049 (29) - 936 (58)
Securitisation exposures (144) (107) 1 - - (38)
Total credit RWA movement 3,218 (518) 423 (141) 1,245 2,209
Credit RWA movement drivers
Risk Management
12 Commonwealth Bank of Australia – Pillar 3 Report
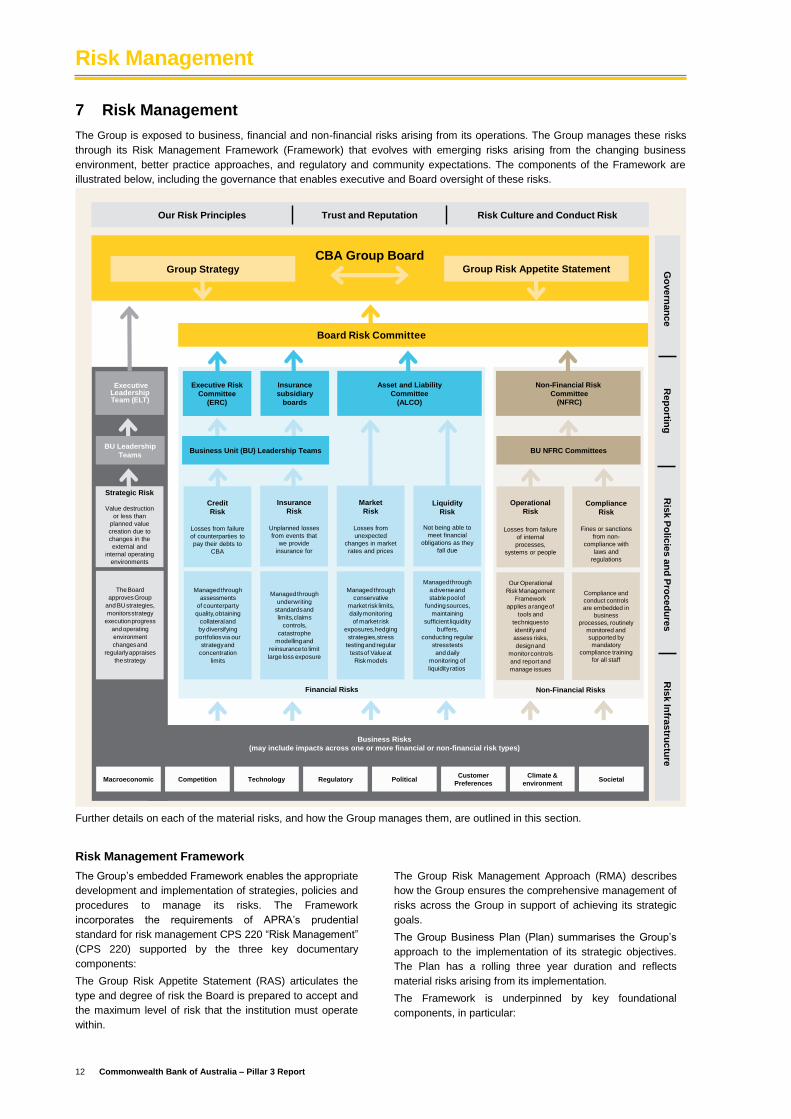
7 Risk Management
The Group is exposed to business, financial and non-financial risks arising from its operations. The Group manages these risks
through its Risk Management Framework (Framework) that evolves with emerging risks arising from the changing business
environment, better practice approaches, and regulatory and community expectations. The components of the Framework are
illustrated below, including the governance that enables executive and Board oversight of these risks.
Our Risk Principles Trust and Reputation Risk Culture and Conduct Risk
Credit
Risk
Losses from failure
of counterparties to
pay their debts to
CBA
Insurance
Risk
Unplanned losses
from events that
we provide
insurance for
Market
Risk
Losses from
unexpected
changes in market
rates and prices
Liquidity
Risk
Not being able to
meet financial
obligations as they
fall due
Insurance
subsidiary
boards
Executive Risk
Committee
(ERC)
Asset and Liability
Committee
(ALCO)
Managedthrough
assessments
of counterparty
quality,obtaining
collateraland
by diversifying
portfoliosvia our
strategyand
concentration
limits
Managedthrough
underwriting
standardsand
limits,claims
controls,
catastrophe
modellingand
reinsuranceto limit
large loss exposure
Managedthrough
conservative
market risk limits,
dailymonitoring
of market risk
exposures,hedging
strategies,stress
testingand regular
testsof Valueat
Risk models
Managedthrough
adiverseand
stablepoolof
fundingsources,
maintaining
sufficient liquidity
buffers,
conducting regular
stresstests
and daily
monitoring of
liquidityratios.
Non-Financial Risk
Committee(NFRC)
Our Operational
Risk Management
Framework
applies a rangeof
tools and
techniquesto
identifyand
assess risks,
designand
monitorcontrols
and report and
manage issues
Compliance and
conduct controls
are embedded in
business
processes, routinely
monitored and
supported by
mandatory
compliance training
for all staff
Group Strategy Group Risk Appetite Statement
TheBoard
approvesGroup
and BUstrategies,
monitorsstrategy
executionprogress
and operating
environment
changesand
regularlyappraises
thestrategy
ExecutiveLeadershipTeam (ELT)
Macroeconomic Competition Technology Regulatory PoliticalCustomer
Preferences
Climate &
environmentSocietal
BU Leadership
TeamsBusiness Unit (BU) Leadership Teams BU NFRC Committees
CBA Group Board
Board Risk Committee
Strategic Risk
Value destruction
or less than
planned value
creation due to
changes in the
external and
internal operating
environments
Operational
Risk
Losses from failure
of internal
processes,
systems or people
Compliance
Risk
Fines or sanctions
from non-
compliance with
laws and
regulations
Go
ve
rna
nce
Rep
ortin
gR
isk P
olic
ies a
nd
Pro
ce
du
res
Ris
k In
frastru
ctu
re
Business Risks
(may include impacts across one or more financial or non-financial risk types)
Financial Risks Non-Financial Risks
Further details on each of the material risks, and how the Group manages them, are outlined in this section.
Risk Management Framework
The Group’s embedded Framework enables the appropriate
development and implementation of strategies, policies and
procedures to manage its risks. The Framework
incorporates the requirements of APRA’s prudential
standard for risk management CPS 220 “Risk Management”
(CPS 220) supported by the three key documentary
components:
The Group Risk Appetite Statement (RAS) articulates the
type and degree of risk the Board is prepared to accept and
the maximum level of risk that the institution must operate
within.
The Group Risk Management Approach (RMA) describes
how the Group ensures the comprehensive management of
risks across the Group in support of achieving its strategic
goals.
The Group Business Plan (Plan) summarises the Group’s
approach to the implementation of its strategic objectives.
The Plan has a rolling three year duration and reflects
material risks arising from its implementation.
The Framework is underpinned by key foundational
components, in particular:
Risk Management
Commonwealth Bank of Australia – Pillar 3 Report 13
Risk Culture and Conduct Risk
Risk Culture is the beliefs, values and practices within the
organisation that determine how risks are identified,
measured, governed, and acted upon. A strong risk culture
guides our actions in a resilient and flexible way when we
need to react and make sound judgements in new and
unfamiliar circumstances. The organisation’s culture
influences employee behaviours and has the potential to lead
to poor conduct. The Board’s RAS in relation to conduct
requires business practices that are fair to our customers,
protects the fair and efficient operation of the market and
engender confidence in our products and services. The
Group’s risk culture emphasises doing what is right,
accountability, service, excellence and getting things done the
right way. Annually the CBA Board forms a view regarding the
effectiveness of the Group’s risk culture in keeping risk taking
within appetite. Action plans are initiated and monitored to
drive positive risk culture changes in areas of need.
Trust and Reputation
The reputation of the Group and trust of stakeholders are
significant assets. Damage to the Group’s reputation arises
from negative perception on the part of customers,
counterparties, shareholders, investors, debt holders, market
analysts, regulators and other relevant stakeholders of the
Group. The Group’s purpose and values combined with the
organisational culture and our conduct as an organisation and
as individuals form the framework which protects this asset.
Potential adverse reputational impacts are mitigated by
managing our material risks well, living by our Code of
Conduct and actively focusing on transparency in business
decisions and engagement with our customers. In addition the
Group has a corporate responsibility plan focused on driving
positive change through education, innovation and good
business practice.
The four key elements that operationalise the Framework are:
Risk Governance
The Group is committed to ensuring that its risk management
practices reflect a high standard of governance. This enables
Management to undertake, in an effective manner, prudent
risk-taking activities. The Board operates as the highest level
of the Group’s risk governance as specified in its Charter. The
Risk Committee oversees the Framework and helps formulate
the Group’s risk appetite for consideration by the Board. In
particular it:
Monitors the Group’s risk profile (including identification
of emerging risks);
Reviews regular reports from Management on the
measurement of risk and the adequacy and
effectiveness of the Group’s risk management and
internal controls systems;
Forms a view on the independence of the risk function by
meeting with the Group Chief Risk Officer (CRO) at the
will of the Committee or the CRO.
The Group operates a Three Lines of Accountability (3LoA)
model which places accountability for risk ownership with Line
1 Business Units (BUs) while focussing the mandate of Line 2
Risk Teams on appetite and framework, oversight,
assurance, approval or acceptance of risk and advice. Line 3
Audit provides independent assurance to the Board,
regulators and other stakeholders of the effectiveness of risk
management, internal controls and governance. This model
recognises that the business is best positioned to make
optimal long-term risk-reward decisions that consider the full
end-to-end value chain.
Risk Policies & Procedures
Risk Policies and Procedures provide guidance to the
business on the management of each material risk. They
support the Framework by:
Summarising the principles and practices to be used by
the Group in identifying and assessing its material risks;
Quantifying the financial operating tolerances for material
risks; and
Clearly stating the types of risk outcomes to which the
Group is intolerant.
Risk Reporting
Regular management information is produced which allows
financial and non-financial risk positions to be monitored
against approved Risk Appetite and policy limits. At Board
level, the majority of risk reporting is provided to the Board
Risk Committee but regulatory relationships, strategic risk and
reputational matters, capital and liquidity risk are reported
directly. Controls reporting is provided to the Audit Committee.
The Chairs of the Board Risk and Audit Committees report to
the Board post Committee meetings.
Risk Management Infrastructure
The Framework is supported by key infrastructure systems and
processes for the management of the Group’s material risk
types. The key risk management systems and processes in
place include:
Established risk identification and assessment
processes;
Risk controls and mitigation plans;
A Management Information System to measure and
aggregate risks across the Group;
Risk models and tools;
A Risk-Adjusted-Performance Measurement (RAPM)
process that is a means of assessing the performance of
a business after adjustment for its capital consumption
and is used as a basis for executive incentives; and
An Internal Capital Adequacy Assessment Process
(ICAAP) used in combination with other risk
management practices (including stress testing), to
understand, manage and quantify the Group’s risks; the
outcomes of which are used to inform risk decisions, set
capital buffers and assist strategic planning.
Risk Management
14 Commonwealth Bank of Australia – Pillar 3 Report
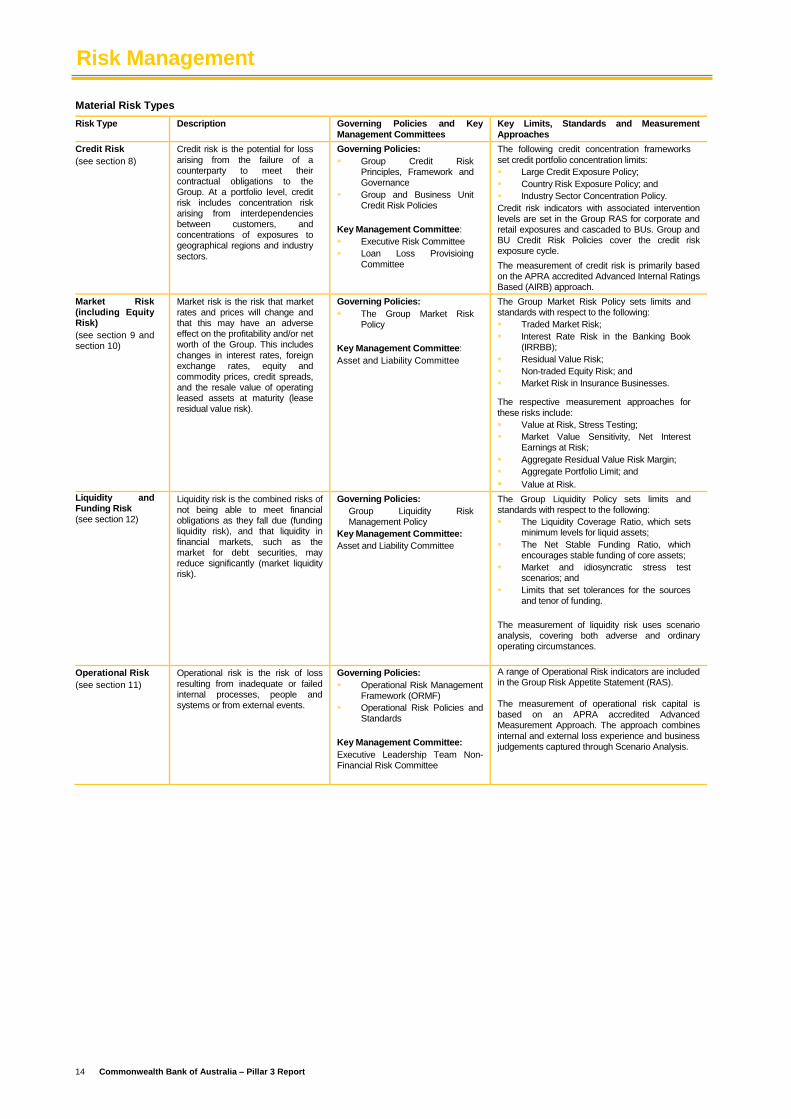
Material Risk Types
Risk Type Description Governing Policies and Key Management Committees
Key Limits, Standards and Measurement Approaches
Credit Risk
(see section 8)
Credit risk is the potential for loss arising from the failure of a counterparty to meet their contractual obligations to the Group. At a portfolio level, credit risk includes concentration risk arising from interdependencies between customers, and concentrations of exposures to geographical regions and industry sectors.
Governing Policies:
Group Credit Risk Principles, Framework and Governance
Group and Business Unit Credit Risk Policies
Key Management Committee:
Executive Risk Committee
Loan Loss Provisioing Committee
The following credit concentration frameworks set credit portfolio concentration limits:
Large Credit Exposure Policy;
Country Risk Exposure Policy; and
Industry Sector Concentration Policy.
Credit risk indicators with associated intervention levels are set in the Group RAS for corporate and retail exposures and cascaded to BUs. Group and BU Credit Risk Policies cover the credit risk exposure cycle.
The measurement of credit risk is primarily based on the APRA accredited Advanced Internal Ratings Based (AIRB) approach.
Market Risk (including Equity Risk)
(see section 9 and section 10)
Market risk is the risk that market rates and prices will change and that this may have an adverse effect on the profitability and/or net worth of the Group. This includes changes in interest rates, foreign exchange rates, equity and commodity prices, credit spreads, and the resale value of operating leased assets at maturity (lease residual value risk).
Governing Policies:
The Group Market Risk Policy
Key Management Committee:
Asset and Liability Committee
The Group Market Risk Policy sets limits and standards with respect to the following:
Traded Market Risk;
Interest Rate Risk in the Banking Book (IRRBB);
Residual Value Risk;
Non-traded Equity Risk; and
Market Risk in Insurance Businesses.
The respective measurement approaches for these risks include:
Value at Risk, Stress Testing;
Market Value Sensitivity, Net Interest Earnings at Risk;
Aggregate Residual Value Risk Margin;
Aggregate Portfolio Limit; and
Value at Risk.
Liquidity and Funding Risk (see section 12)
Liquidity risk is the combined risks of not being able to meet financial obligations as they fall due (funding liquidity risk), and that liquidity in financial markets, such as the market for debt securities, may reduce significantly (market liquidity risk).
Governing Policies:
Group Liquidity Risk Management Policy
Key Management Committee:
Asset and Liability Committee
The Group Liquidity Policy sets limits and standards with respect to the following:
The Liquidity Coverage Ratio, which sets minimum levels for liquid assets;
The Net Stable Funding Ratio, which encourages stable funding of core assets;
Market and idiosyncratic stress test scenarios; and
Limits that set tolerances for the sources and tenor of funding.
The measurement of liquidity risk uses scenario analysis, covering both adverse and ordinary operating circumstances.
Operational Risk
(see section 11)
Operational risk is the risk of loss resulting from inadequate or failed internal processes, people and systems or from external events.
Governing Policies:
Operational Risk Management Framework (ORMF)
Operational Risk Policies and Standards
Key Management Committee:
Executive Leadership Team Non- Financial Risk Committee
A range of Operational Risk indicators are included in the Group Risk Appetite Statement (RAS).
The measurement of operational risk capital is based on an APRA accredited Advanced Measurement Approach. The approach combines internal and external loss experience and business judgements captured through Scenario Analysis.
Risk Management
Commonwealth Bank of Australia – Pillar 3 Report 15
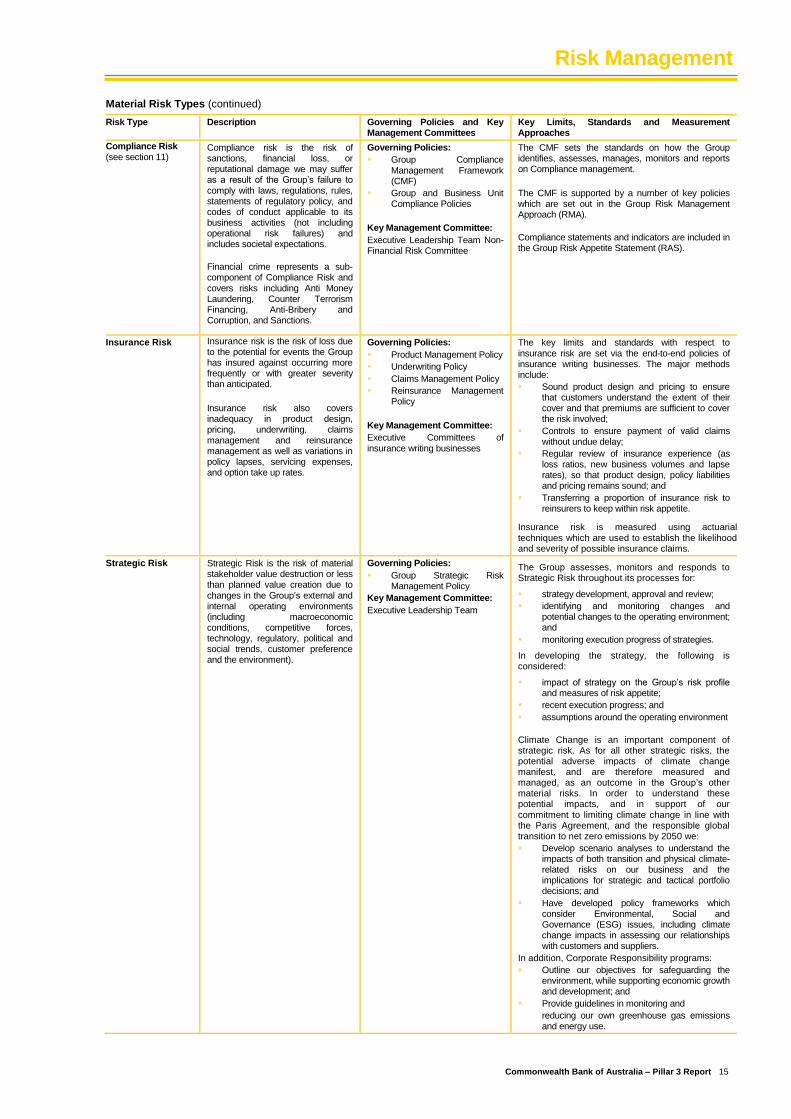
Material Risk Types (continued)
Risk Type Description Governing Policies and Key Management Committees
Key Limits, Standards and Measurement Approaches
Compliance Risk (see section 11)
Compliance risk is the risk of sanctions, financial loss, or reputational damage we may suffer as a result of the Group’s failure to comply with laws, regulations, rules, statements of regulatory policy, and codes of conduct applicable to its business activities (not including operational risk failures) and includes societal expectations.
Financial crime represents a sub-component of Compliance Risk and covers risks including Anti Money Laundering, Counter Terrorism Financing, Anti-Bribery and Corruption, and Sanctions.
Governing Policies:
Group Compliance Management Framework (CMF)
Group and Business Unit Compliance Policies
Key Management Committee:
Executive Leadership Team Non- Financial Risk Committee
The CMF sets the standards on how the Group identifies, assesses, manages, monitors and reports on Compliance management.
The CMF is supported by a number of key policies which are set out in the Group Risk Management Approach (RMA).
Compliance statements and indicators are included in the Group Risk Appetite Statement (RAS).
Insurance Risk Insurance risk is the risk of loss due to the potential for events the Group has insured against occurring more frequently or with greater severity than anticipated.
Insurance risk also covers inadequacy in product design, pricing, underwriting, claims management and reinsurance management as well as variations in policy lapses, servicing expenses, and option take up rates.
Governing Policies:
Product Management Policy
Underwriting Policy
Claims Management Policy
Reinsurance Management Policy
Key Management Committee:
Executive Committees of insurance writing businesses
The key limits and standards with respect to insurance risk are set via the end-to-end policies of insurance writing businesses. The major methods include:
Sound product design and pricing to ensure that customers understand the extent of their cover and that premiums are sufficient to cover the risk involved;
Controls to ensure payment of valid claims without undue delay;
Regular review of insurance experience (as loss ratios, new business volumes and lapse rates), so that product design, policy liabilities and pricing remains sound; and
Transferring a proportion of insurance risk to reinsurers to keep within risk appetite.
Insurance risk is measured using actuarial techniques which are used to establish the likelihood and severity of possible insurance claims.
Strategic Risk Strategic Risk is the risk of material stakeholder value destruction or less than planned value creation due to changes in the Group’s external and internal operating environments (including macroeconomic conditions, competitive forces, technology, regulatory, political and social trends, customer preference and the environment).
Governing Policies:
Group Strategic Risk Management Policy
Key Management Committee:
Executive Leadership Team
The Group assesses, monitors and responds to Strategic Risk throughout its processes for:
strategy development, approval and review;
identifying and monitoring changes and potential changes to the operating environment; and
monitoring execution progress of strategies.
In developing the strategy, the following is considered:
impact of strategy on the Group’s risk profile and measures of risk appetite;
recent execution progress; and
assumptions around the operating environment
Climate Change is an important component of strategic risk. As for all other strategic risks, the potential adverse impacts of climate change manifest, and are therefore measured and managed, as an outcome in the Group’s other material risks. In order to understand these potential impacts, and in support of our commitment to limiting climate change in line with the Paris Agreement, and the responsible global transition to net zero emissions by 2050 we:
Develop scenario analyses to understand the impacts of both transition and physical climate-related risks on our business and the implications for strategic and tactical portfolio decisions; and
Have developed policy frameworks which consider Environmental, Social and Governance (ESG) issues, including climate change impacts in assessing our relationships with customers and suppliers.
In addition, Corporate Responsibility programs:
Outline our objectives for safeguarding the environment, while supporting economic growth and development; and
Provide guidelines in monitoring and
reducing our own greenhouse gas emissions and energy use.
Credit Risk
16 Commonwealth Bank of Australia – Pillar 3 Report
8 Credit Risk
Credit risk is the potential of loss arising from failure of a
counterparty to meet their contractual obligations. It arises
primarily from lending activities, the provision of guarantees
(including letters of credit), investments in bonds and notes,
financial markets transactions, credit enhancements,
securitisations and other associated activities. In the
insurance business, credit risk primarily arises from
investment in bonds and notes, loans and from reliance on
reinsurance.
The Group maintains a robust system of controls and
processes to optimise the Group’s credit risk-taking activities.
Credit risk is managed at both a Group and Business Unit
level. The key credit risk related functions support the overall
risk management responsibilities of the Board Risk
Committee and senior management as discussed in section 7
“Risk Management” of this document.
The Group applies the following elements for effective credit
risk practice in its day-to-day business activities:
Credit Risk Management Framework with associated
policies; and
Credit Risk Rating and Measurement (pages 34 - 36).
Credit Risk Management Framework
The Board Risk Committee oversees the Group’s Credit Risk
Management approach which includes key elements of the
Group Credit Risk Framework. The Group Credit Risk
Management Framework is designed to achieve credit
portfolio outcomes that are consistent with the Group’s risk
and return expectations. The Board Risk Committee meets
approximately eight times each year.
The Group has clearly defined credit policies for the approval
and management of credit risk. These set the minimum
requirements for assessing the integrity and ability of
counterparties to meet their contractual obligations for
repayment, acceptable forms of collateral and security and
the frequency of credit reviews.
The Group’s Risk Appetite Statement requires that there is
appropriate diversification of credit risk. This is achieved
through established policies that include limits for the key
dimensions of the credit portfolio for:
Individual obligors, or groups of related obligors;
Industry sectors; and
Geography (e.g. country risk).
Experts in each Business Unit are accountable for identifying
ways to diversify credit risk exposure in their businesses, all
within the policy limits.
The Credit Portfolio Assurance Unit, part of Group Audit and
Assurance, reviews credit portfolios and Business Unit
compliance with policies, application of credit risk ratings and
other key practices on a regular basis. The Credit Portfolio
Assurance Unit reports its findings to the Board Audit and
Risk Committees as appropriate.
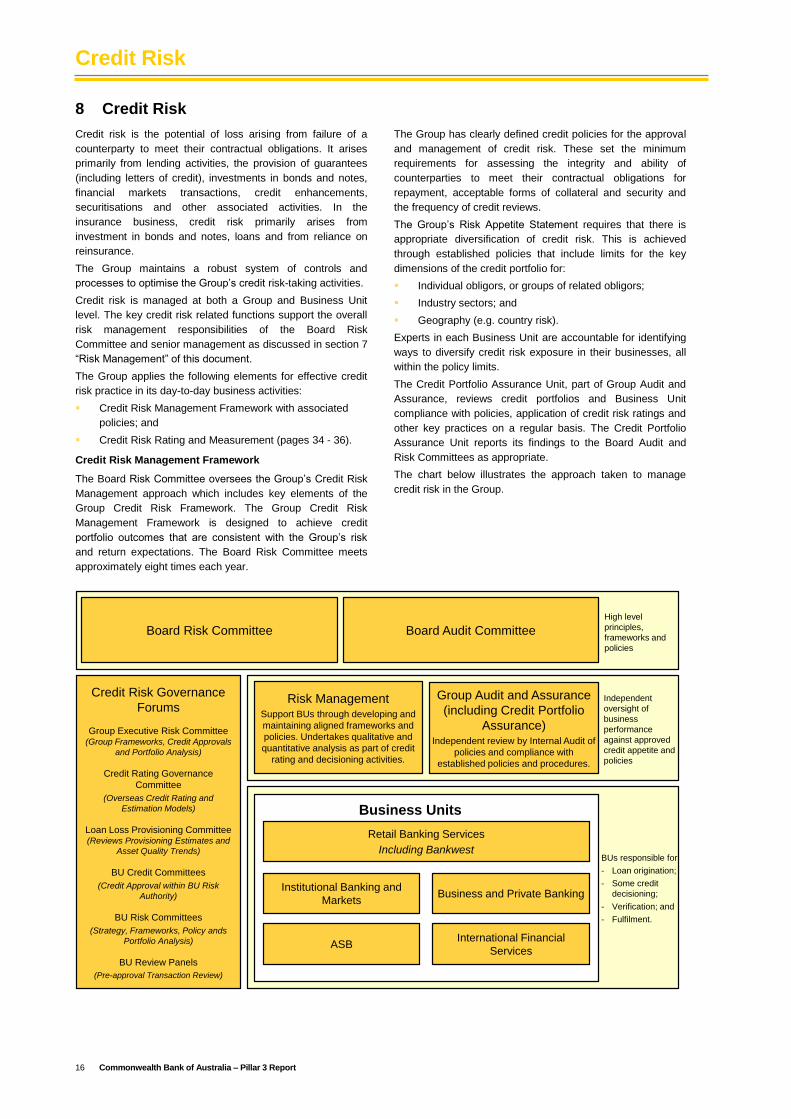
The chart below illustrates the approach taken to manage
credit risk in the Group.
Board Risk Committee
High level
principles,
frameworks and
policies
Board Audit Committee
Credit Risk Governance
Forums
Group Executive Risk Committee (Group Frameworks, Credit Approvals
and Portfolio Analysis)
Credit Rating Governance
Committee
(Overseas Credit Rating and
Estimation Models)
Loan Loss Provisioning Committee (Reviews Provisioning Estimates and
Asset Quality Trends)
BU Credit Committees
(Credit Approval within BU Risk
Authority)
BU Risk Committees
(Strategy, Frameworks, Policy ands
Portfolio Analysis)
BU Review Panels
(Pre-approval Transaction Review)
Risk ManagementSupport BUs through developing and
maintaining aligned frameworks and
policies. Undertakes qualitative and
quantitative analysis as part of credit
rating and decisioning activities.
Group Audit and Assurance
(including Credit Portfolio
Assurance)Independent review by Internal Audit of
policies and compliance with
established policies and procedures.
Independent
oversight of
business
performance
against approved
credit appetite and
policies
Business Units
(BU)Retail Banking Services
Including Bankwest
Institutional Banking and
Markets
ASB
Business and Private Banking
International Financial
Services
BUs responsible for:
- Loan origination;
- Some credit
decisioning;
- Verification; and
- Fulfilment.
Credit Risk
Commonwealth Bank of Australia – Pillar 3 Report 17
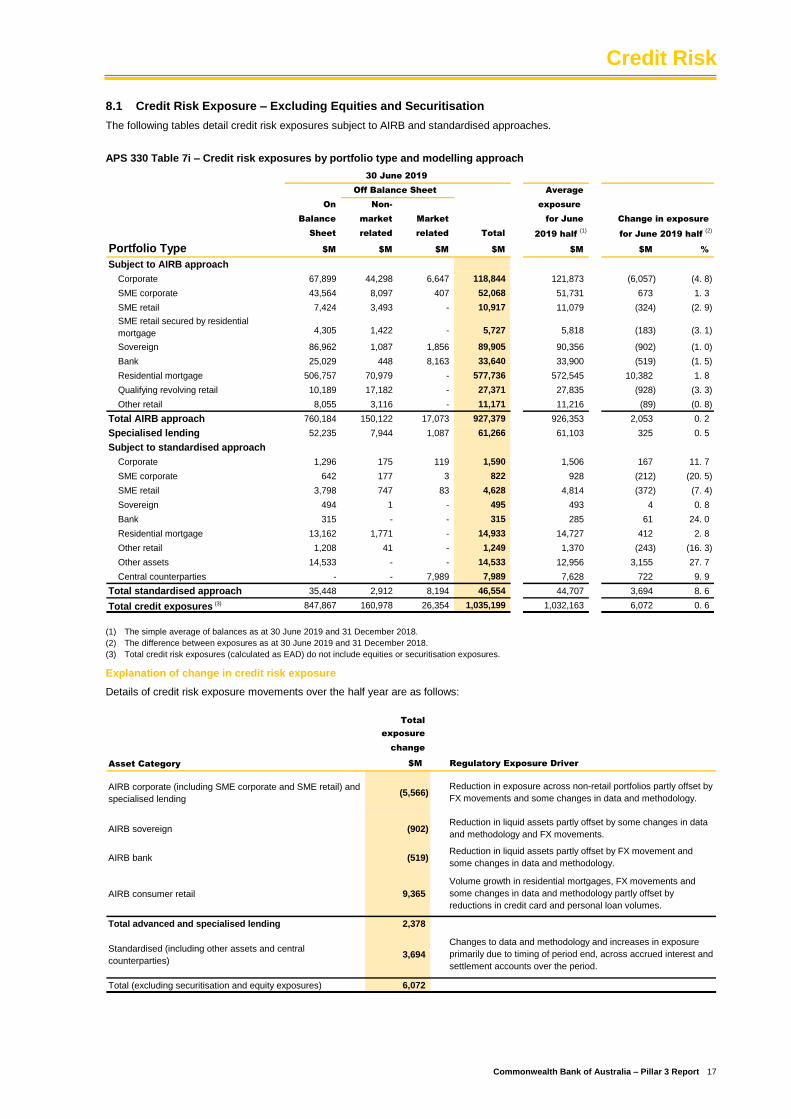
8.1 Credit Risk Exposure – Excluding Equities and Securitisation
The following tables detail credit risk exposures subject to AIRB and standardised approaches.
APS 330 Table 7i – Credit risk exposures by portfolio type and modelling approach
Average
On Non- exposure
Balance market Market for June Change in exposure
Sheet related related Total 2019 half (1)
for June 2019 half (2)
Portfolio Type $M $M $M $M $M $M %
Subject to AIRB approach
Corporate 67,899 44,298 6,647 118,844 121,873 (6,057) (4. 8)
SME corporate 43,564 8,097 407 52,068 51,731 673 1. 3
SME retail 7,424 3,493 - 10,917 11,079 (324) (2. 9)
SME retail secured by residential
mortgage 4,305 1,422 - 5,727 5,818 (183) (3. 1)
Sovereign 86,962 1,087 1,856 89,905 90,356 (902) (1. 0)
Bank 25,029 448 8,163 33,640 33,900 (519) (1. 5)
Residential mortgage 506,757 70,979 - 577,736 572,545 10,382 1. 8
Qualifying revolving retail 10,189 17,182 - 27,371 27,835 (928) (3. 3)
Other retail 8,055 3,116 - 11,171 11,216 (89) (0. 8)
Total AIRB approach 760,184 150,122 17,073 927,379 926,353 2,053 0. 2
Specialised lending 52,235 7,944 1,087 61,266 61,103 325 0. 5
Subject to standardised approach
Corporate 1,296 175 119 1,590 1,506 167 11. 7
SME corporate 642 177 3 822 928 (212) (20. 5)
SME retail 3,798 747 83 4,628 4,814 (372) (7. 4)
Sovereign 494 1 - 495 493 4 0. 8
Bank 315 - - 315 285 61 24. 0
Residential mortgage 13,162 1,771 - 14,933 14,727 412 2. 8
Other retail 1,208 41 - 1,249 1,370 (243) (16. 3)
Other assets 14,533 - - 14,533 12,956 3,155 27. 7
Central counterparties - - 7,989 7,989 7,628 722 9. 9
Total standardised approach 35,448 2,912 8,194 46,554 44,707 3,694 8. 6
Total credit exposures (3) 847,867 160,978 26,354 1,035,199 1,032,163 6,072 0. 6
Off Balance Sheet
30 June 2019
(1) The simple average of balances as at 30 June 2019 and 31 December 2018.
(2) The difference between exposures as at 30 June 2019 and 31 December 2018.
(3) Total credit risk exposures (calculated as EAD) do not include equities or securitisation exposures.
Explanation of change in credit risk exposure
Details of credit risk exposure movements over the half year are as follows:
Total
exposure
change
Asset Category $M Regulatory Exposure Driver
AIRB corporate (including SME corporate and SME retail) and
specialised lending(5,566)
AIRB sovereign (902)
AIRB bank (519)
AIRB consumer retail 9,365
Total advanced and specialised lending 2,378
Standardised (including other assets and central
counterparties)3,694
Total (excluding securitisation and equity exposures) 6,072
Reduction in exposure across non-retail portfolios partly offset by
FX movements and some changes in data and methodology.
Reduction in liquid assets partly offset by FX movement and
some changes in data and methodology.
Reduction in liquid assets partly offset by some changes in data
and methodology and FX movements.
Changes to data and methodology and increases in exposure
primarily due to timing of period end, across accrued interest and
settlement accounts over the period.
Volume growth in residential mortgages, FX movements and
some changes in data and methodology partly offset by
reductions in credit card and personal loan volumes.
Credit Risk
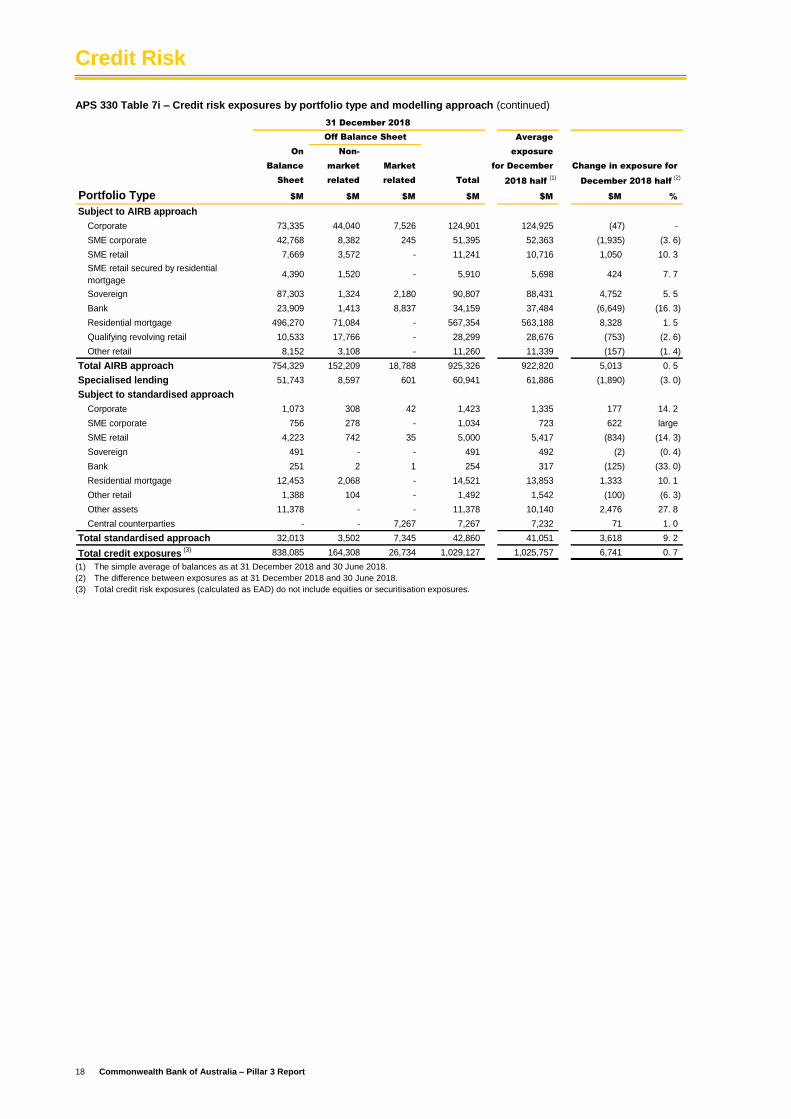
18 Commonwealth Bank of Australia – Pillar 3 Report
APS 330 Table 7i – Credit risk exposures by portfolio type and modelling approach (continued)
Average
On Non- exposure
Balance market Market for December Change in exposure for
Sheet related related Total 2018 half (1)
December 2018 half (2)
Portfolio Type $M $M $M $M $M $M %
Subject to AIRB approach
Corporate 73,335 44,040 7,526 124,901 124,925 (47) -
SME corporate 42,768 8,382 245 51,395 52,363 (1,935) (3. 6)
SME retail 7,669 3,572 - 11,241 10,716 1,050 10. 3
SME retail secured by residential
mortgage4,390 1,520 - 5,910 5,698 424 7. 7
Sovereign 87,303 1,324 2,180 90,807 88,431 4,752 5. 5
Bank 23,909 1,413 8,837 34,159 37,484 (6,649) (16. 3)
Residential mortgage 496,270 71,084 - 567,354 563,188 8,328 1. 5
Qualifying revolving retail 10,533 17,766 - 28,299 28,676 (753) (2. 6)
Other retail 8,152 3,108 - 11,260 11,339 (157) (1. 4)
Total AIRB approach 754,329 152,209 18,788 925,326 922,820 5,013 0. 5
Specialised lending 51,743 8,597 601 60,941 61,886 (1,890) (3. 0)
Subject to standardised approach
Corporate 1,073 308 42 1,423 1,335 177 14. 2
SME corporate 756 278 - 1,034 723 622 large
SME retail 4,223 742 35 5,000 5,417 (834) (14. 3)
Sovereign 491 - - 491 492 (2) (0. 4)
Bank 251 2 1 254 317 (125) (33. 0)
Residential mortgage 12,453 2,068 - 14,521 13,853 1,333 10. 1
Other retail 1,388 104 - 1,492 1,542 (100) (6. 3)
Other assets 11,378 - - 11,378 10,140 2,476 27. 8
Central counterparties - - 7,267 7,267 7,232 71 1. 0
Total standardised approach 32,013 3,502 7,345 42,860 41,051 3,618 9. 2
Total credit exposures (3) 838,085 164,308 26,734 1,029,127 1,025,757 6,741 0. 7
Off Balance Sheet
31 December 2018
(1) The simple average of balances as at 31 December 2018 and 30 June 2018.
(2) The difference between exposures as at 31 December 2018 and 30 June 2018.
(3) Total credit risk exposures (calculated as EAD) do not include equities or securitisation exposures.
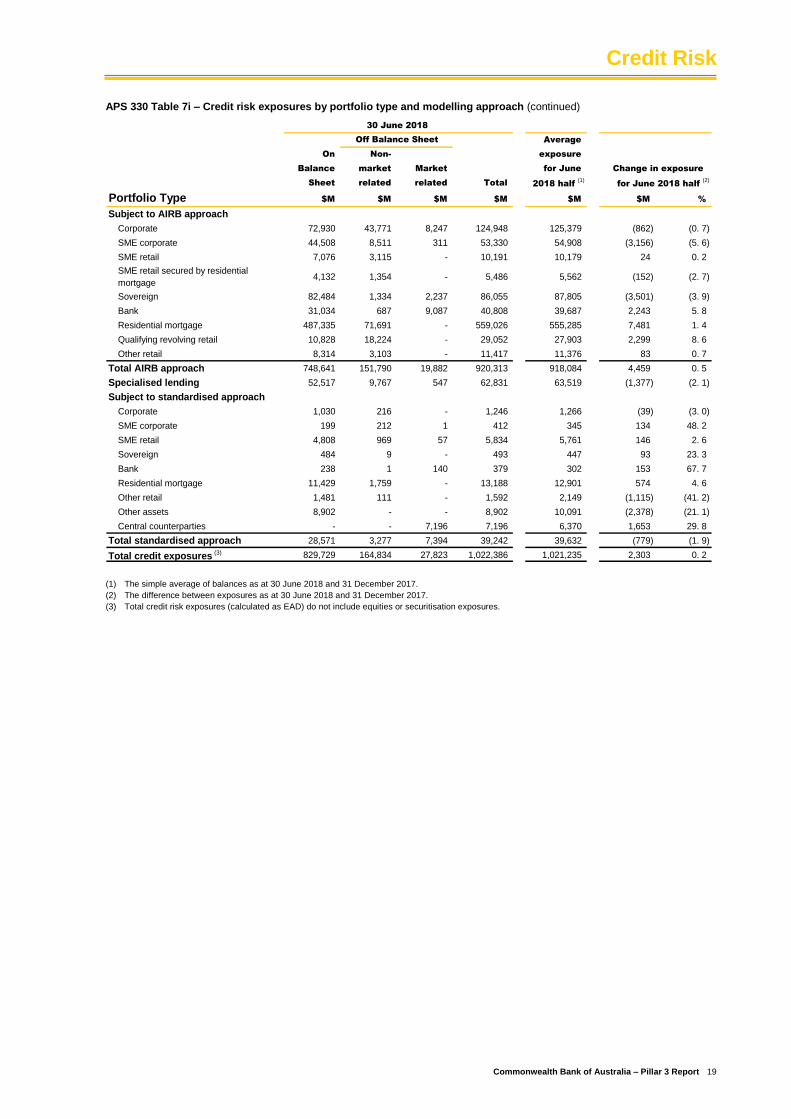
Credit Risk
Commonwealth Bank of Australia – Pillar 3 Report 19
APS 330 Table 7i – Credit risk exposures by portfolio type and modelling approach (continued)
Average
On Non- exposure
Balance market Market for June Change in exposure
Sheet related related Total 2018 half (1)
for June 2018 half (2)
Portfolio Type $M $M $M $M $M $M %
Subject to AIRB approach
Corporate 72,930 43,771 8,247 124,948 125,379 (862) (0. 7)
SME corporate 44,508 8,511 311 53,330 54,908 (3,156) (5. 6)
SME retail 7,076 3,115 - 10,191 10,179 24 0. 2
SME retail secured by residential
mortgage4,132 1,354 - 5,486 5,562 (152) (2. 7)
Sovereign 82,484 1,334 2,237 86,055 87,805 (3,501) (3. 9)
Bank 31,034 687 9,087 40,808 39,687 2,243 5. 8
Residential mortgage 487,335 71,691 - 559,026 555,285 7,481 1. 4
Qualifying revolving retail 10,828 18,224 - 29,052 27,903 2,299 8. 6
Other retail 8,314 3,103 - 11,417 11,376 83 0. 7
Total AIRB approach 748,641 151,790 19,882 920,313 918,084 4,459 0. 5
Specialised lending 52,517 9,767 547 62,831 63,519 (1,377) (2. 1)
Subject to standardised approach
Corporate 1,030 216 - 1,246 1,266 (39) (3. 0)
SME corporate 199 212 1 412 345 134 48. 2
SME retail 4,808 969 57 5,834 5,761 146 2. 6
Sovereign 484 9 - 493 447 93 23. 3
Bank 238 1 140 379 302 153 67. 7
Residential mortgage 11,429 1,759 - 13,188 12,901 574 4. 6
Other retail 1,481 111 - 1,592 2,149 (1,115) (41. 2)
Other assets 8,902 - - 8,902 10,091 (2,378) (21. 1)
Central counterparties - - 7,196 7,196 6,370 1,653 29. 8
Total standardised approach 28,571 3,277 7,394 39,242 39,632 (779) (1. 9)
Total credit exposures (3) 829,729 164,834 27,823 1,022,386 1,021,235 2,303 0. 2
Off Balance Sheet
30 June 2018
(1) The simple average of balances as at 30 June 2018 and 31 December 2017.
(2) The difference between exposures as at 30 June 2018 and 31 December 2017.
(3) Total credit risk exposures (calculated as EAD) do not include equities or securitisation exposures.
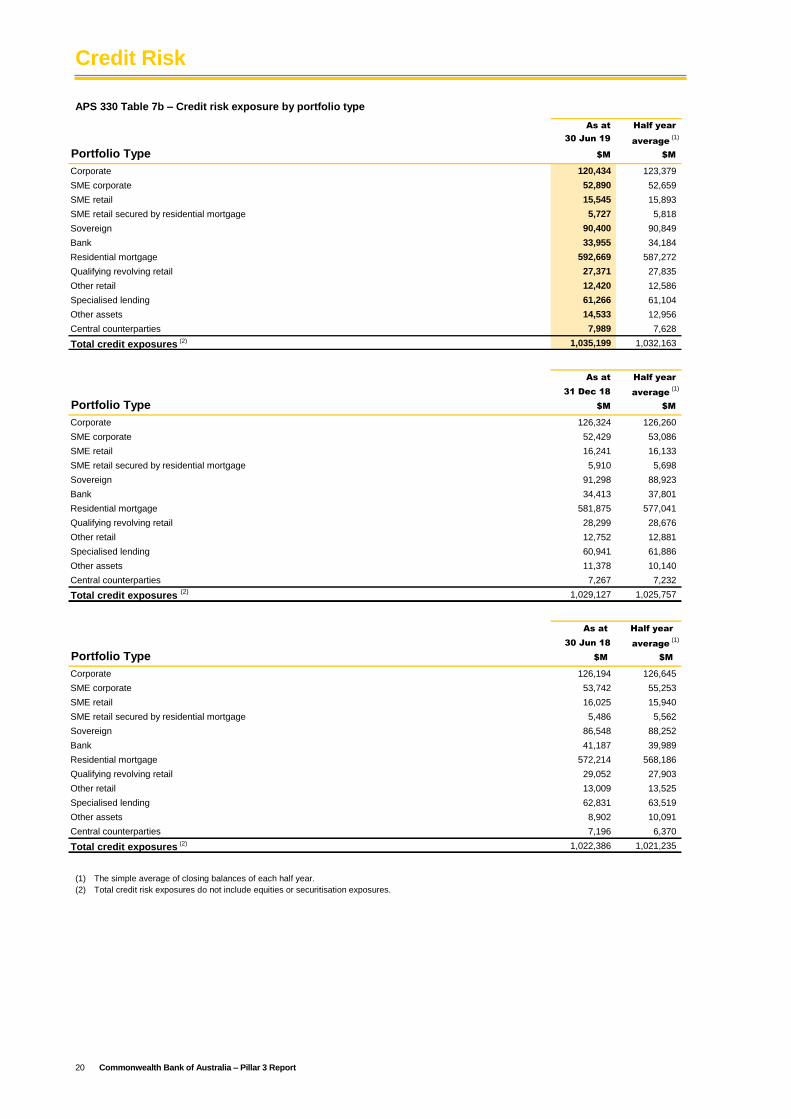
Credit Risk
20 Commonwealth Bank of Australia – Pillar 3 Report
APS 330 Table 7b – Credit risk exposure by portfolio type
As at Half year
30 Jun 19average
(1)
Portfolio Type $M $M
Corporate 120,434 123,379
SME corporate 52,890 52,659
SME retail 15,545 15,893
SME retail secured by residential mortgage 5,727 5,818
Sovereign 90,400 90,849
Bank 33,955 34,184
Residential mortgage 592,669 587,272
Qualifying revolving retail 27,371 27,835
Other retail 12,420 12,586
Specialised lending 61,266 61,104
Other assets 14,533 12,956
Central counterparties 7,989 7,628
Total credit exposures (2) 1,035,199 1,032,163
As at Half year
31 Dec 18 average (1)
Portfolio Type $M $M
Corporate 126,324 126,260
SME corporate 52,429 53,086
SME retail 16,241 16,133
SME retail secured by residential mortgage 5,910 5,698
Sovereign 91,298 88,923
Bank 34,413 37,801
Residential mortgage 581,875 577,041
Qualifying revolving retail 28,299 28,676
Other retail 12,752 12,881
Specialised lending 60,941 61,886
Other assets 11,378 10,140
Central counterparties 7,267 7,232
Total credit exposures (2) 1,029,127 1,025,757
As at Half year
30 Jun 18 average (1)
Portfolio Type $M $M
Corporate 126,194 126,645
SME corporate 53,742 55,253
SME retail 16,025 15,940
SME retail secured by residential mortgage 5,486 5,562
Sovereign 86,548 88,252
Bank 41,187 39,989
Residential mortgage 572,214 568,186
Qualifying revolving retail 29,052 27,903
Other retail 13,009 13,525
Specialised lending 62,831 63,519
Other assets 8,902 10,091
Central counterparties 7,196 6,370
Total credit exposures (2) 1,022,386 1,021,235
(1) The simple average of closing balances of each half year.
(2) Total credit risk exposures do not include equities or securitisation exposures.
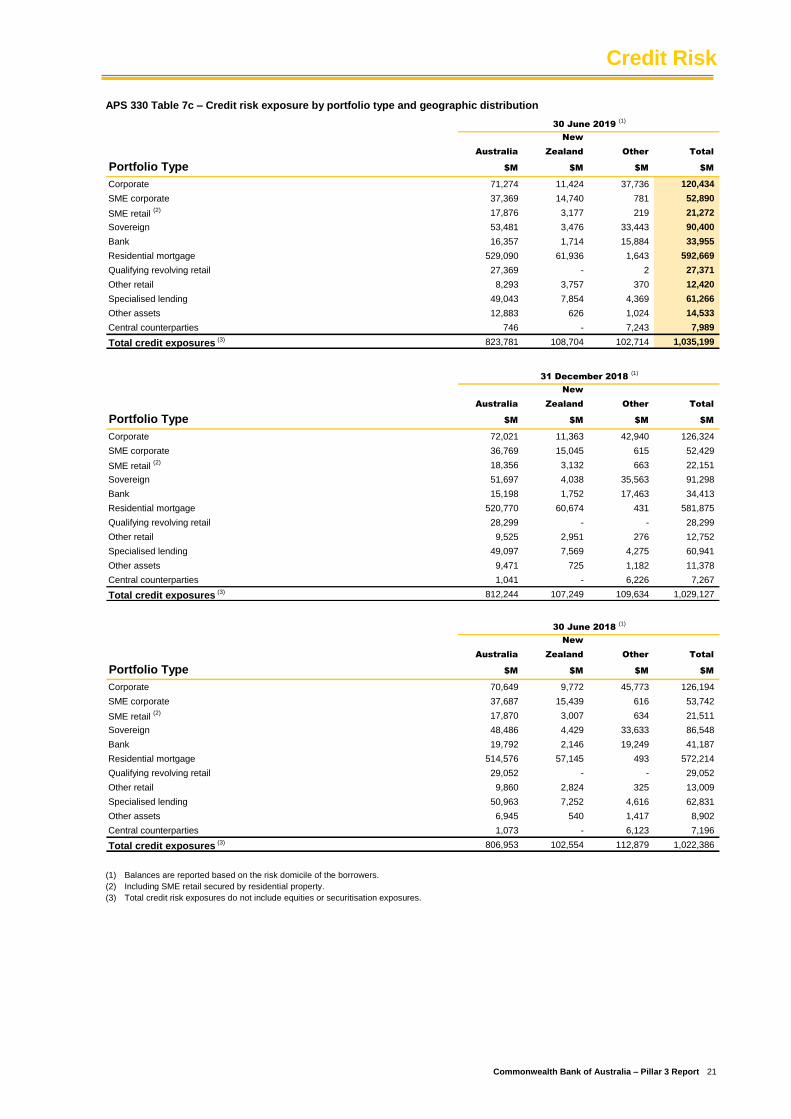
Credit Risk
Commonwealth Bank of Australia – Pillar 3 Report 21
APS 330 Table 7c – Credit risk exposure by portfolio type and geographic distribution
New
Australia Zealand Other Total
Portfolio Type $M $M $M $M
Corporate 71,274 11,424 37,736 120,434
SME corporate 37,369 14,740 781 52,890
SME retail (2) 17,876 3,177 219 21,272
Sovereign 53,481 3,476 33,443 90,400
Bank 16,357 1,714 15,884 33,955
Residential mortgage 529,090 61,936 1,643 592,669
Qualifying revolving retail 27,369 - 2 27,371
Other retail 8,293 3,757 370 12,420
Specialised lending 49,043 7,854 4,369 61,266
Other assets 12,883 626 1,024 14,533
Central counterparties 746 - 7,243 7,989
Total credit exposures (3) 823,781 108,704 102,714 1,035,199
30 June 2019 (1)
New
Australia Zealand Other Total
Portfolio Type $M $M $M $M
Corporate 72,021 11,363 42,940 126,324
SME corporate 36,769 15,045 615 52,429
SME retail (2) 18,356 3,132 663 22,151
Sovereign 51,697 4,038 35,563 91,298
Bank 15,198 1,752 17,463 34,413
Residential mortgage 520,770 60,674 431 581,875
Qualifying revolving retail 28,299 - - 28,299
Other retail 9,525 2,951 276 12,752
Specialised lending 49,097 7,569 4,275 60,941
Other assets 9,471 725 1,182 11,378
Central counterparties 1,041 - 6,226 7,267
Total credit exposures (3) 812,244 107,249 109,634 1,029,127
31 December 2018 (1)
New
Australia Zealand Other Total
Portfolio Type $M $M $M $M
Corporate 70,649 9,772 45,773 126,194
SME corporate 37,687 15,439 616 53,742
SME retail (2) 17,870 3,007 634 21,511
Sovereign 48,486 4,429 33,633 86,548
Bank 19,792 2,146 19,249 41,187
Residential mortgage 514,576 57,145 493 572,214
Qualifying revolving retail 29,052 - - 29,052
Other retail 9,860 2,824 325 13,009
Specialised lending 50,963 7,252 4,616 62,831
Other assets 6,945 540 1,417 8,902
Central counterparties 1,073 - 6,123 7,196
Total credit exposures (3) 806,953 102,554 112,879 1,022,386
30 June 2018 (1)
(1) Balances are reported based on the risk domicile of the borrowers.
(2) Including SME retail secured by residential property.
(3) Total credit risk exposures do not include equities or securitisation exposures.
Credit Risk
22 Commonwealth Bank of Australia – Pillar 3 Report
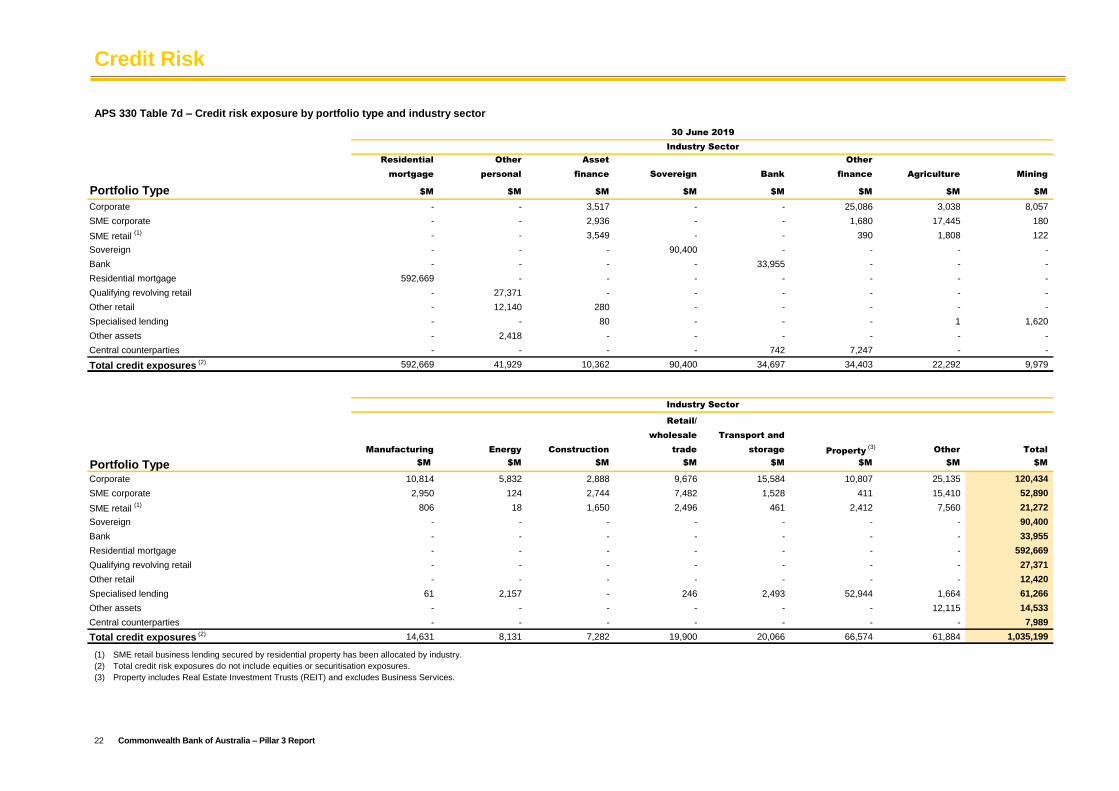
APS 330 Table 7d – Credit risk exposure by portfolio type and industry sector
Residential Other Asset Other
mortgage personal finance Sovereign Bank finance Agriculture Mining
Portfolio Type $M $M $M $M $M $M $M $M
Corporate - - 3,517 - - 25,086 3,038 8,057
SME corporate - - 2,936 - - 1,680 17,445 180
SME retail (1) - - 3,549 - - 390 1,808 122
Sovereign - - - 90,400 - - - -
Bank - - - - 33,955 - - -
Residential mortgage 592,669 - - - - - - -
Qualifying revolving retail - 27,371 - - - - - -
Other retail - 12,140 280 - - - - -
Specialised lending - - 80 - - - 1 1,620
Other assets - 2,418 - - - - - -
Central counterparties - - - - 742 7,247 - -
Total credit exposures (2) 592,669 41,929 10,362 90,400 34,697 34,403 22,292 9,979
30 June 2019
Industry Sector
Retail/
wholesale Transport and
Manufacturing Energy Construction trade storage Property (3)
Other Total
Portfolio Type $M $M $M $M $M $M $M $M
Corporate 10,814 5,832 2,888 9,676 15,584 10,807 25,135 120,434
SME corporate 2,950 124 2,744 7,482 1,528 411 15,410 52,890
SME retail (1) 806 18 1,650 2,496 461 2,412 7,560 21,272
Sovereign - - - - - - - 90,400
Bank - - - - - - - 33,955
Residential mortgage - - - - - - - 592,669
Qualifying revolving retail - - - - - - - 27,371
Other retail - - - - - - - 12,420
Specialised lending 61 2,157 - 246 2,493 52,944 1,664 61,266
Other assets - - - - - - 12,115 14,533
Central counterparties - - - - - - - 7,989
Total credit exposures (2) 14,631 8,131 7,282 19,900 20,066 66,574 61,884 1,035,199
Industry Sector
(1) SME retail business lending secured by residential property has been allocated by industry.
(2) Total credit risk exposures do not include equities or securitisation exposures.
(3) Property includes Real Estate Investment Trusts (REIT) and excludes Business Services.
Credit Risk
Commonwealth Bank of Australia – Pillar 3 Report 23
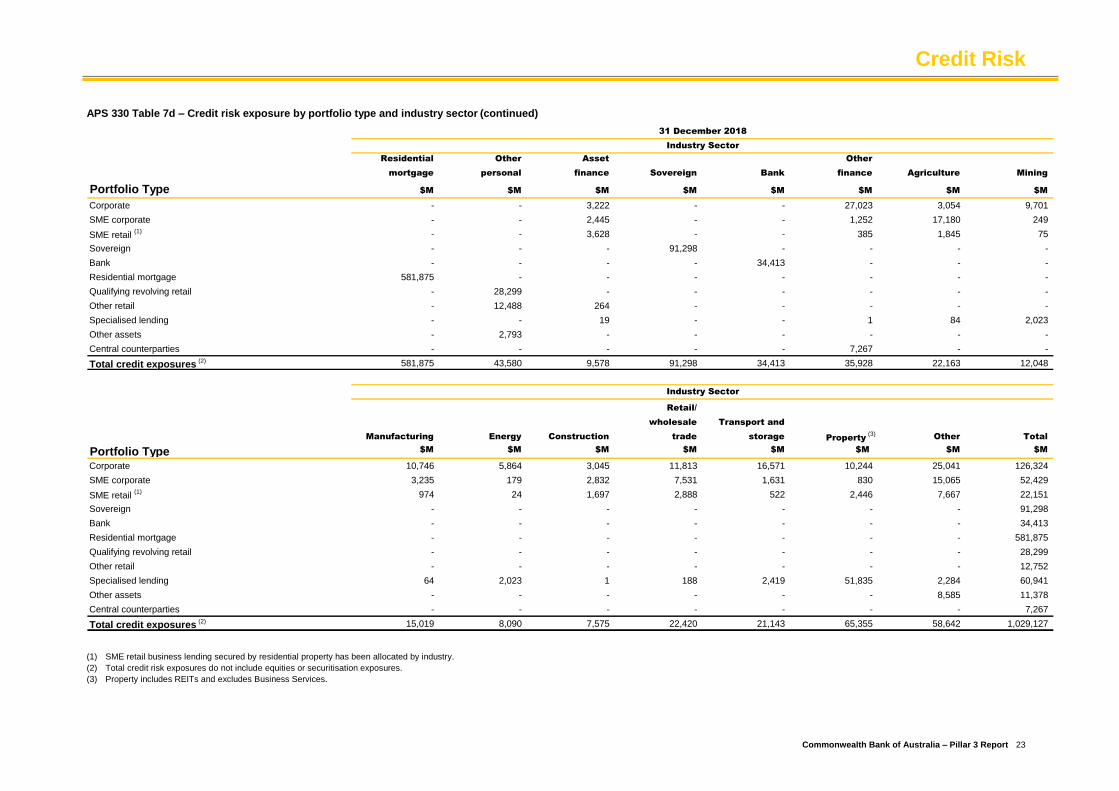
APS 330 Table 7d – Credit risk exposure by portfolio type and industry sector (continued)
Residential Other Asset Other
mortgage personal finance Sovereign Bank finance Agriculture Mining
Portfolio Type $M $M $M $M $M $M $M $M
Corporate - - 3,222 - - 27,023 3,054 9,701
SME corporate - - 2,445 - - 1,252 17,180 249
SME retail (1) - - 3,628 - - 385 1,845 75
Sovereign - - - 91,298 - - - -
Bank - - - - 34,413 - - -
Residential mortgage 581,875 - - - - - - -
Qualifying revolving retail - 28,299 - - - - - -
Other retail - 12,488 264 - - - - -
Specialised lending - - 19 - - 1 84 2,023
Other assets - 2,793 - - - - - -
Central counterparties - - - - - 7,267 - -
Total credit exposures (2) 581,875 43,580 9,578 91,298 34,413 35,928 22,163 12,048
31 December 2018
Industry Sector
Retail/
wholesale Transport and
Manufacturing Energy Construction trade storage Property (3)
Other Total
Portfolio Type $M $M $M $M $M $M $M $M
Corporate 10,746 5,864 3,045 11,813 16,571 10,244 25,041 126,324
SME corporate 3,235 179 2,832 7,531 1,631 830 15,065 52,429
SME retail (1) 974 24 1,697 2,888 522 2,446 7,667 22,151
Sovereign - - - - - - - 91,298
Bank - - - - - - - 34,413
Residential mortgage - - - - - - - 581,875
Qualifying revolving retail - - - - - - - 28,299
Other retail - - - - - - - 12,752
Specialised lending 64 2,023 1 188 2,419 51,835 2,284 60,941
Other assets - - - - - - 8,585 11,378
Central counterparties - - - - - - - 7,267
Total credit exposures (2) 15,019 8,090 7,575 22,420 21,143 65,355 58,642 1,029,127
Industry Sector
(1) SME retail business lending secured by residential property has been allocated by industry.
(2) Total credit risk exposures do not include equities or securitisation exposures.
(3) Property includes REITs and excludes Business Services.
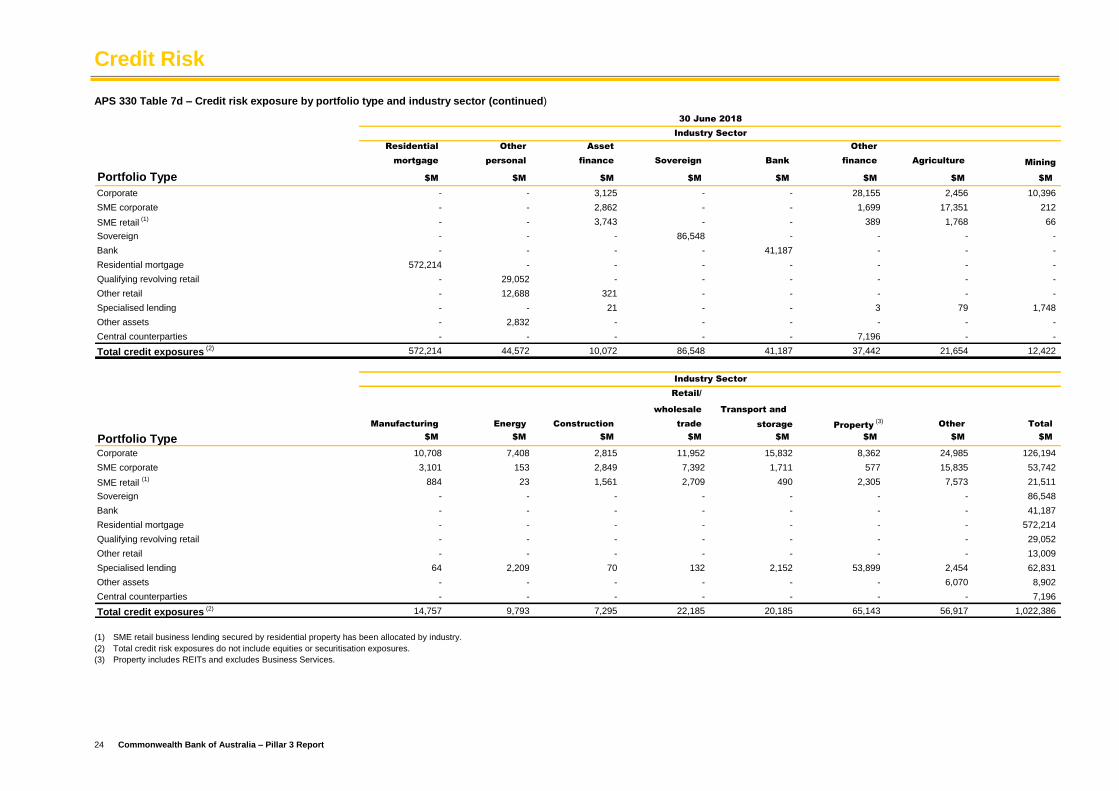
Credit Risk
24 Commonwealth Bank of Australia – Pillar 3 Report
APS 330 Table 7d – Credit risk exposure by portfolio type and industry sector (continued)
Residential Other Asset Other
mortgage personal finance Sovereign Bank finance Agriculture Mining
Portfolio Type $M $M $M $M $M $M $M $M
Corporate - - 3,125 - - 28,155 2,456 10,396
SME corporate - - 2,862 - - 1,699 17,351 212
SME retail (1) - - 3,743 - - 389 1,768 66
Sovereign - - - 86,548 - - - -
Bank - - - - 41,187 - - -
Residential mortgage 572,214 - - - - - - -
Qualifying revolving retail - 29,052 - - - - - -
Other retail - 12,688 321 - - - - -
Specialised lending - - 21 - - 3 79 1,748
Other assets - 2,832 - - - - - -
Central counterparties - - - - - 7,196 - -
Total credit exposures (2) 572,214 44,572 10,072 86,548 41,187 37,442 21,654 12,422
Retail/
wholesale Transport and
Manufacturing Energy Construction trade storage Property (3)
Other Total
Portfolio Type $M $M $M $M $M $M $M $M
Corporate 10,708 7,408 2,815 11,952 15,832 8,362 24,985 126,194
SME corporate 3,101 153 2,849 7,392 1,711 577 15,835 53,742
SME retail (1) 884 23 1,561 2,709 490 2,305 7,573 21,511
Sovereign - - - - - - - 86,548
Bank - - - - - - - 41,187
Residential mortgage - - - - - - - 572,214
Qualifying revolving retail - - - - - - - 29,052
Other retail - - - - - - - 13,009
Specialised lending 64 2,209 70 132 2,152 53,899 2,454 62,831
Other assets - - - - - - 6,070 8,902
Central counterparties - - - - - - - 7,196
Total credit exposures (2) 14,757 9,793 7,295 22,185 20,185 65,143 56,917 1,022,386
Industry Sector
30 June 2018
Industry Sector
(1) SME retail business lending secured by residential property has been allocated by industry.
(2) Total credit risk exposures do not include equities or securitisation exposures.
(3) Property includes REITs and excludes Business Services.
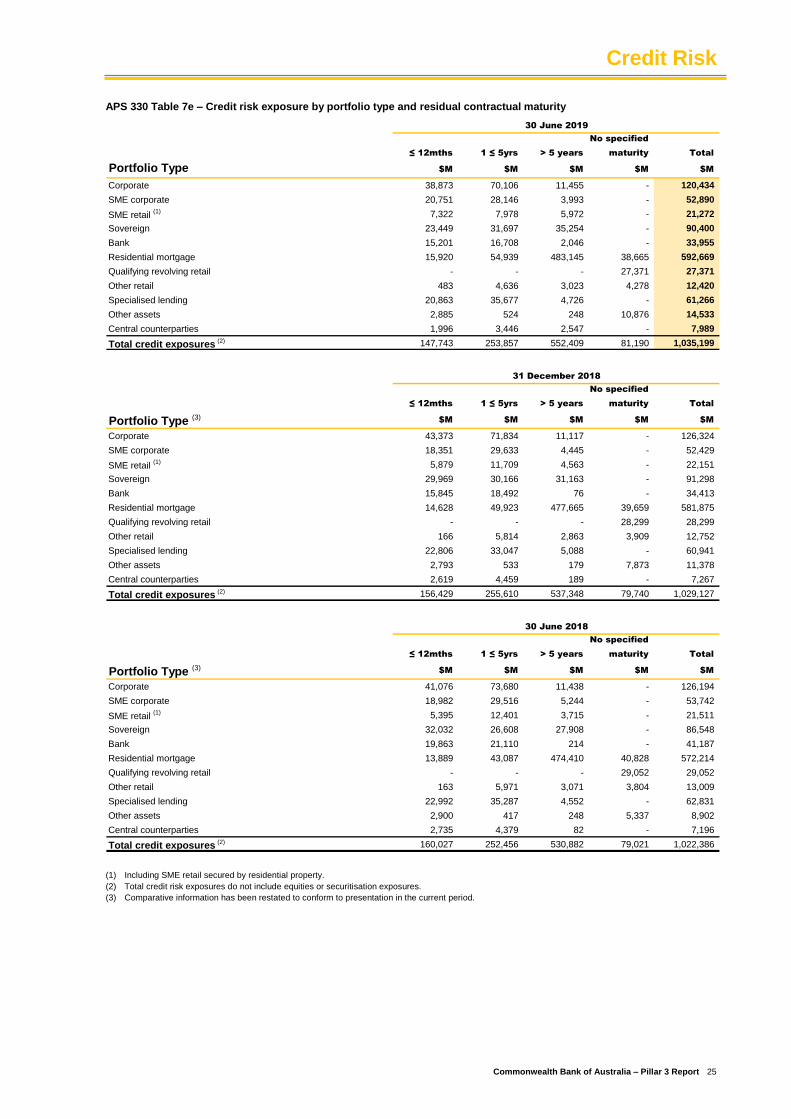
Credit Risk
Commonwealth Bank of Australia – Pillar 3 Report 25
APS 330 Table 7e – Credit risk exposure by portfolio type and residual contractual maturity
No specified
≤ 12mths 1 ≤ 5yrs > 5 years maturity Total
Portfolio Type $M $M $M $M $M
Corporate 38,873 70,106 11,455 - 120,434
SME corporate 20,751 28,146 3,993 - 52,890
SME retail (1) 7,322 7,978 5,972 - 21,272
Sovereign 23,449 31,697 35,254 - 90,400
Bank 15,201 16,708 2,046 - 33,955
Residential mortgage 15,920 54,939 483,145 38,665 592,669
Qualifying revolving retail - - - 27,371 27,371
Other retail 483 4,636 3,023 4,278 12,420
Specialised lending 20,863 35,677 4,726 - 61,266
Other assets 2,885 524 248 10,876 14,533
Central counterparties 1,996 3,446 2,547 - 7,989
Total credit exposures (2) 147,743 253,857 552,409 81,190 1,035,199
30 June 2019
No specified
≤ 12mths 1 ≤ 5yrs > 5 years maturity Total
Portfolio Type (3)$M $M $M $M $M
Corporate 43,373 71,834 11,117 - 126,324
SME corporate 18,351 29,633 4,445 - 52,429
SME retail (1) 5,879 11,709 4,563 - 22,151
Sovereign 29,969 30,166 31,163 - 91,298
Bank 15,845 18,492 76 - 34,413
Residential mortgage 14,628 49,923 477,665 39,659 581,875
Qualifying revolving retail - - - 28,299 28,299
Other retail 166 5,814 2,863 3,909 12,752
Specialised lending 22,806 33,047 5,088 - 60,941
Other assets 2,793 533 179 7,873 11,378
Central counterparties 2,619 4,459 189 - 7,267
Total credit exposures (2) 156,429 255,610 537,348 79,740 1,029,127
31 December 2018
No specified
≤ 12mths 1 ≤ 5yrs > 5 years maturity Total
Portfolio Type (3)$M $M $M $M $M
Corporate 41,076 73,680 11,438 - 126,194
SME corporate 18,982 29,516 5,244 - 53,742
SME retail (1) 5,395 12,401 3,715 - 21,511
Sovereign 32,032 26,608 27,908 - 86,548
Bank 19,863 21,110 214 - 41,187
Residential mortgage 13,889 43,087 474,410 40,828 572,214
Qualifying revolving retail - - - 29,052 29,052
Other retail 163 5,971 3,071 3,804 13,009
Specialised lending 22,992 35,287 4,552 - 62,831
Other assets 2,900 417 248 5,337 8,902
Central counterparties 2,735 4,379 82 - 7,196
Total credit exposures (2) 160,027 252,456 530,882 79,021 1,022,386
30 June 2018
(1) Including SME retail secured by residential property.
(2) Total credit risk exposures do not include equities or securitisation exposures.
(3) Comparative information has been restated to conform to presentation in the current period.
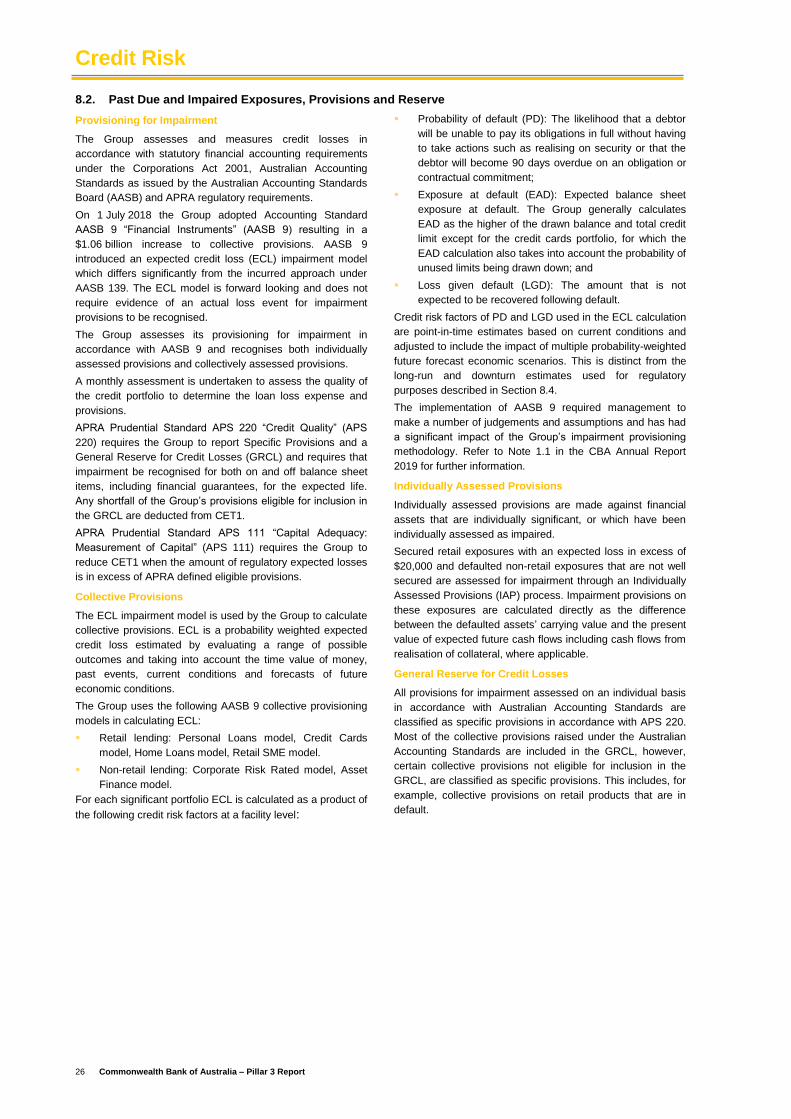
Credit Risk
26 Commonwealth Bank of Australia – Pillar 3 Report
8.2. Past Due and Impaired Exposures, Provisions and Reserve
Provisioning for Impairment
The Group assesses and measures credit losses in
accordance with statutory financial accounting requirements
under the Corporations Act 2001, Australian Accounting
Standards as issued by the Australian Accounting Standards
Board (AASB) and APRA regulatory requirements.
On 1 July 2018 the Group adopted Accounting Standard
AASB 9 “Financial Instruments” (AASB 9) resulting in a
$1.06 billion increase to collective provisions. AASB 9
introduced an expected credit loss (ECL) impairment model
which differs significantly from the incurred approach under
AASB 139. The ECL model is forward looking and does not
require evidence of an actual loss event for impairment
provisions to be recognised.
The Group assesses its provisioning for impairment in
accordance with AASB 9 and recognises both individually
assessed provisions and collectively assessed provisions.
A monthly assessment is undertaken to assess the quality of
the credit portfolio to determine the loan loss expense and
provisions.
APRA Prudential Standard APS 220 “Credit Quality” (APS
220) requires the Group to report Specific Provisions and a
General Reserve for Credit Losses (GRCL) and requires that
impairment be recognised for both on and off balance sheet
items, including financial guarantees, for the expected life.
Any shortfall of the Group’s provisions eligible for inclusion in
the GRCL are deducted from CET1.
APRA Prudential Standard APS 111 “Capital Adequacy:
Measurement of Capital” (APS 111) requires the Group to
reduce CET1 when the amount of regulatory expected losses
is in excess of APRA defined eligible provisions.
Collective Provisions
The ECL impairment model is used by the Group to calculate
collective provisions. ECL is a probability weighted expected
credit loss estimated by evaluating a range of possible
outcomes and taking into account the time value of money,
past events, current conditions and forecasts of future
economic conditions.
The Group uses the following AASB 9 collective provisioning
models in calculating ECL:
Retail lending: Personal Loans model, Credit Cards
model, Home Loans model, Retail SME model.
Non-retail lending: Corporate Risk Rated model, Asset
Finance model.
For each significant portfolio ECL is calculated as a product of
the following credit risk factors at a facility level:
Probability of default (PD): The likelihood that a debtor
will be unable to pay its obligations in full without having
to take actions such as realising on security or that the
debtor will become 90 days overdue on an obligation or
contractual commitment;
Exposure at default (EAD): Expected balance sheet
exposure at default. The Group generally calculates
EAD as the higher of the drawn balance and total credit
limit except for the credit cards portfolio, for which the
EAD calculation also takes into account the probability of
unused limits being drawn down; and
Loss given default (LGD): The amount that is not
expected to be recovered following default.
Credit risk factors of PD and LGD used in the ECL calculation
are point-in-time estimates based on current conditions and
adjusted to include the impact of multiple probability-weighted
future forecast economic scenarios. This is distinct from the
long-run and downturn estimates used for regulatory
purposes described in Section 8.4.
The implementation of AASB 9 required management to
make a number of judgements and assumptions and has had
a significant impact of the Group’s impairment provisioning
methodology. Refer to Note 1.1 in the CBA Annual Report
2019 for further information.
Individually Assessed Provisions
Individually assessed provisions are made against financial
assets that are individually significant, or which have been
individually assessed as impaired.
Secured retail exposures with an expected loss in excess of
$20,000 and defaulted non-retail exposures that are not well
secured are assessed for impairment through an Individually
Assessed Provisions (IAP) process. Impairment provisions on
these exposures are calculated directly as the difference
between the defaulted assets’ carrying value and the present
value of expected future cash flows including cash flows from
realisation of collateral, where applicable.
General Reserve for Credit Losses
All provisions for impairment assessed on an individual basis
in accordance with Australian Accounting Standards are
classified as specific provisions in accordance with APS 220.
Most of the collective provisions raised under the Australian
Accounting Standards are included in the GRCL, however,
certain collective provisions not eligible for inclusion in the
GRCL, are classified as specific provisions. This includes, for
example, collective provisions on retail products that are in
default.
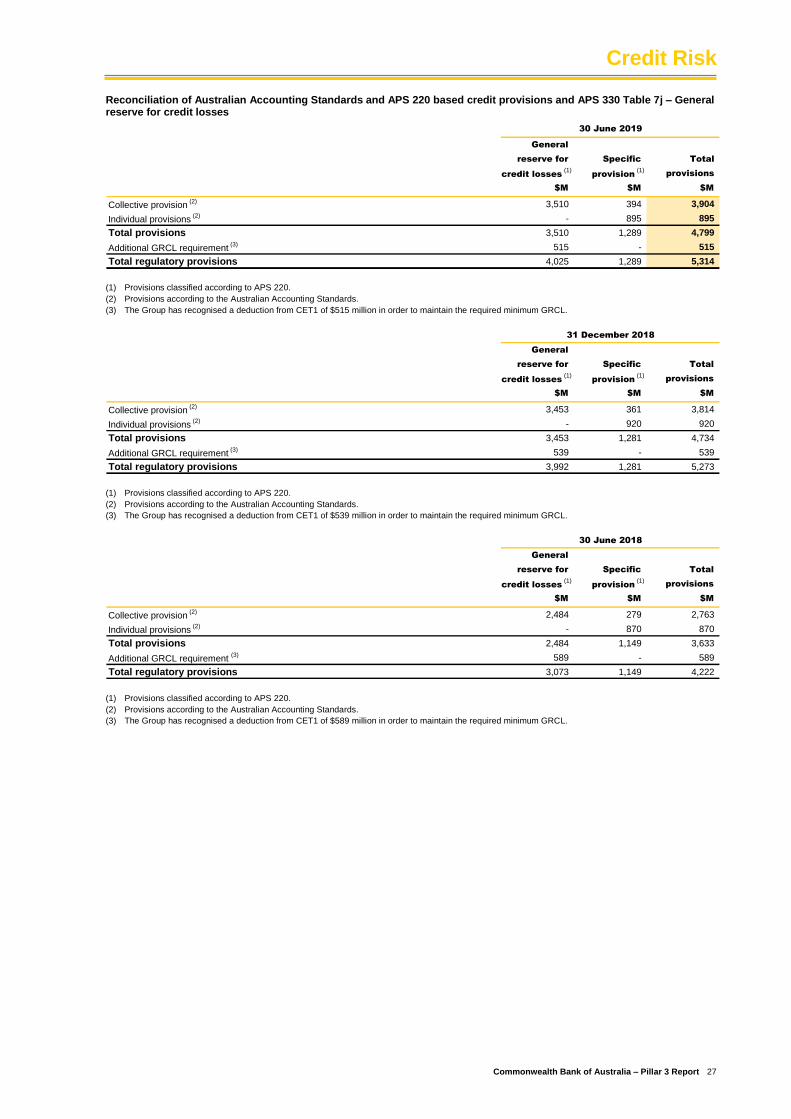
Credit Risk
Commonwealth Bank of Australia – Pillar 3 Report 27
Reconciliation of Australian Accounting Standards and APS 220 based credit provisions and APS 330 Table 7j – General reserve for credit losses
General
reserve for Specific Total
credit losses (1)
provision (1)
provisions
$M $M $M
Collective provision (2) 3,510 394 3,904
Individual provisions (2) - 895 895
Total provisions 3,510 1,289 4,799
Additional GRCL requirement (3) 515 - 515
Total regulatory provisions 4,025 1,289 5,314
30 June 2019
(1) Provisions classified according to APS 220.
(2) Provisions according to the Australian Accounting Standards.
(3) The Group has recognised a deduction from CET1 of $515 million in order to maintain the required minimum GRCL.
General
reserve for Specific Total
credit losses (1)
provision (1)
provisions
$M $M $M
Collective provision (2) 3,453 361 3,814
Individual provisions (2) - 920 920
Total provisions 3,453 1,281 4,734
Additional GRCL requirement (3) 539 - 539
Total regulatory provisions 3,992 1,281 5,273
31 December 2018
(1) Provisions classified according to APS 220.
(2) Provisions according to the Australian Accounting Standards.
(3) The Group has recognised a deduction from CET1 of $539 million in order to maintain the required minimum GRCL.
General
reserve for Specific Total
credit losses (1)
provision (1)
provisions
$M $M $M
Collective provision (2) 2,484 279 2,763
Individual provisions (2) - 870 870
Total provisions 2,484 1,149 3,633
Additional GRCL requirement (3) 589 - 589
Total regulatory provisions 3,073 1,149 4,222
30 June 2018
(1) Provisions classified according to APS 220.
(2) Provisions according to the Australian Accounting Standards.
(3) The Group has recognised a deduction from CET1 of $589 million in order to maintain the required minimum GRCL.
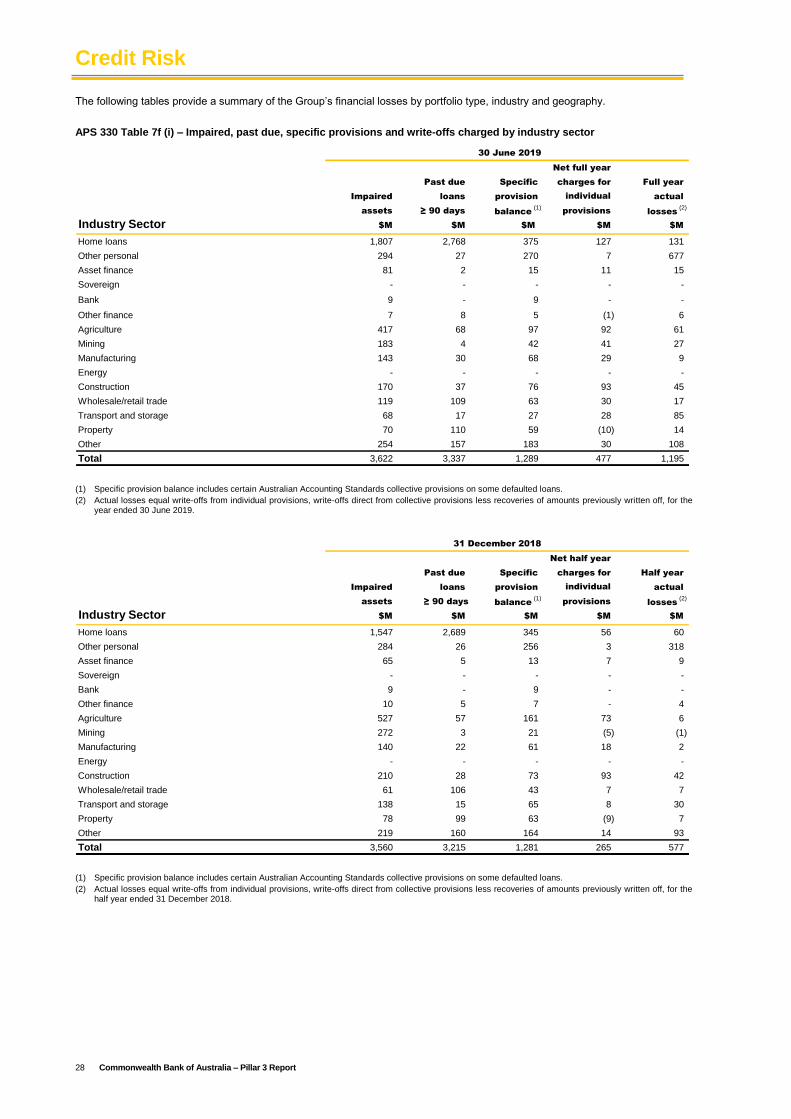
Credit Risk
28 Commonwealth Bank of Australia – Pillar 3 Report
The following tables provide a summary of the Group’s financial losses by portfolio type, industry and geography.
APS 330 Table 7f (i) – Impaired, past due, specific provisions and write-offs charged by industry sector
30 June 2019 > 0 = Error in calculation
Net full year
Past due Specific charges for Full year
Impaired loans provision individual actual
assets ≥ 90 days balance (1)
provisions losses (2)
Industry Sector $M $M $M $M $M
Home loans 1,807 2,768 375 127 131
Other personal 294 27 270 7 677
Asset finance 81 2 15 11 15
Sovereign - - - - -
Bank 9 - 9 - -
Other finance 7 8 5 (1) 6
Agriculture 417 68 97 92 61
Mining 183 4 42 41 27
Manufacturing 143 30 68 29 9
Energy - - - - -
Construction 170 37 76 93 45
Wholesale/retail trade 119 109 63 30 17
Transport and storage 68 17 27 28 85
Property 70 110 59 (10) 14
Other 254 157 183 30 108
Total 3,622 3,337 1,289 477 1,195
(1) Specific provision balance includes certain Australian Accounting Standards collective provisions on some defaulted loans.
(2) Actual losses equal write-offs from individual provisions, write-offs direct from collective provisions less recoveries of amounts previously written off, for the year ended 30 June 2019.
31 December 2018
Net half year
Past due Specific charges for Half year
Impaired loans provision individual actual
assets ≥ 90 days balance (1)
provisions losses (2)
Industry Sector $M $M $M $M $M
Home loans 1,547 2,689 345 56 60
Other personal 284 26 256 3 318
Asset finance 65 5 13 7 9
Sovereign - - - - -
Bank 9 - 9 - -
Other finance 10 5 7 - 4
Agriculture 527 57 161 73 6
Mining 272 3 21 (5) (1)
Manufacturing 140 22 61 18 2
Energy - - - - -
Construction 210 28 73 93 42
Wholesale/retail trade 61 106 43 7 7
Transport and storage 138 15 65 8 30
Property 78 99 63 (9) 7
Other 219 160 164 14 93
Total 3,560 3,215 1,281 265 577
(1) Specific provision balance includes certain Australian Accounting Standards collective provisions on some defaulted loans.
(2) Actual losses equal write-offs from individual provisions, write-offs direct from collective provisions less recoveries of amounts previously written off, for the half year ended 31 December 2018.
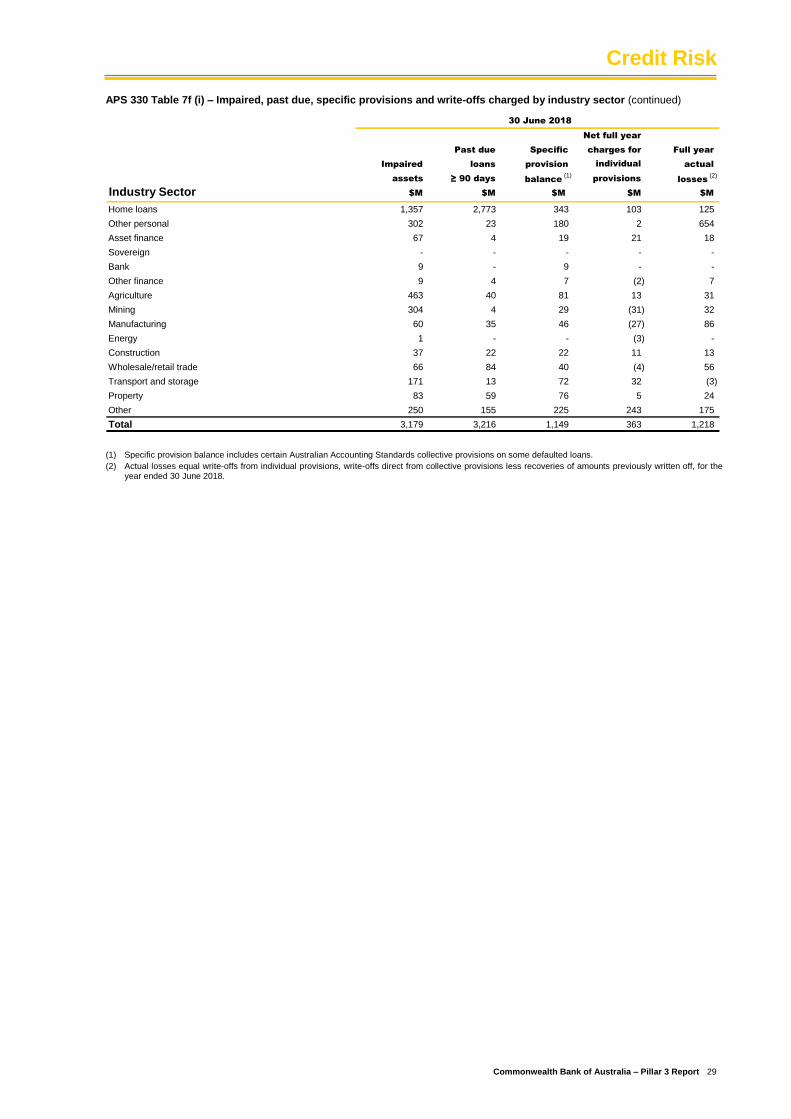
Credit Risk
Commonwealth Bank of Australia – Pillar 3 Report 29
APS 330 Table 7f (i) – Impaired, past due, specific provisions and write-offs charged by industry sector (continued)
30 June 2018
Net full year
Past due Specific charges for Full year
Impaired loans provision individual actual
assets ≥ 90 days balance (1)
provisions losses (2)
Industry Sector $M $M $M $M $M
Home loans 1,357 2,773 343 103 125
Other personal 302 23 180 2 654
Asset finance 67 4 19 21 18
Sovereign - - - - -
Bank 9 - 9 - -
Other finance 9 4 7 (2) 7
Agriculture 463 40 81 13 31
Mining 304 4 29 (31) 32
Manufacturing 60 35 46 (27) 86
Energy 1 - - (3) -
Construction 37 22 22 11 13
Wholesale/retail trade 66 84 40 (4) 56
Transport and storage 171 13 72 32 (3)
Property 83 59 76 5 24
Other 250 155 225 243 175
Total 3,179 3,216 1,149 363 1,218
(1) Specific provision balance includes certain Australian Accounting Standards collective provisions on some defaulted loans.
(2) Actual losses equal write-offs from individual provisions, write-offs direct from collective provisions less recoveries of amounts previously written off, for the year ended 30 June 2018.
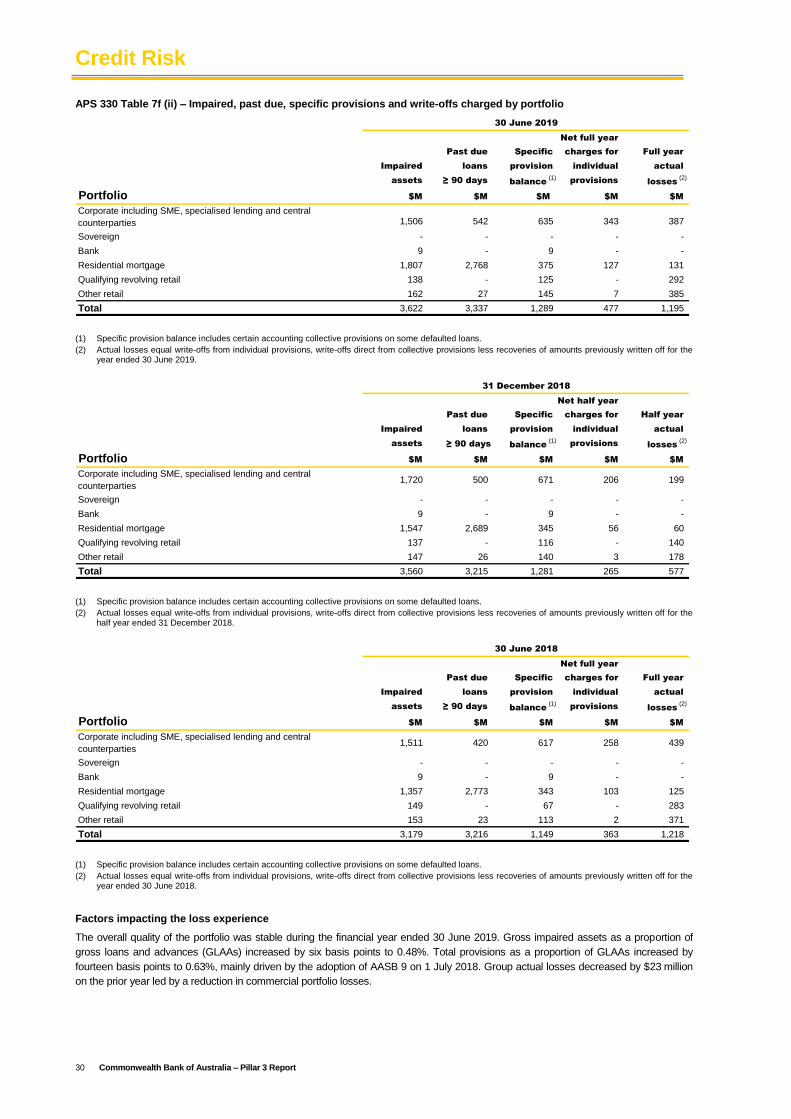
Credit Risk
30 Commonwealth Bank of Australia – Pillar 3 Report
APS 330 Table 7f (ii) – Impaired, past due, specific provisions and write-offs charged by portfolio
Net full year
Past due Specific charges for Full year
Impaired loans provision individual actual
assets ≥ 90 days balance (1)
provisions losses (2)
Portfolio $M $M $M $M $M
Corporate including SME, specialised lending and central
counterparties 1,506 542 635 343 387
Sovereign - - - - -
Bank 9 - 9 - -
Residential mortgage 1,807 2,768 375 127 131
Qualifying revolving retail 138 - 125 - 292
Other retail 162 27 145 7 385
Total 3,622 3,337 1,289 477 1,195
30 June 2019
(1) Specific provision balance includes certain accounting collective provisions on some defaulted loans.
(2) Actual losses equal write-offs from individual provisions, write-offs direct from collective provisions less recoveries of amounts previously written off for the year ended 30 June 2019.
Net half year
Past due Specific charges for Half year
Impaired loans provision individual actual
assets ≥ 90 days balance (1)
provisions losses (2)
Portfolio $M $M $M $M $M
Corporate including SME, specialised lending and central
counterparties1,720 500 671 206 199
Sovereign - - - - -
Bank 9 - 9 - -
Residential mortgage 1,547 2,689 345 56 60
Qualifying revolving retail 137 - 116 - 140
Other retail 147 26 140 3 178
Total 3,560 3,215 1,281 265 577
31 December 2018
(1) Specific provision balance includes certain accounting collective provisions on some defaulted loans.
(2) Actual losses equal write-offs from individual provisions, write-offs direct from collective provisions less recoveries of amounts previously written off for the half year ended 31 December 2018.
Net full year
Past due Specific charges for Full year
Impaired loans provision individual actual
assets ≥ 90 days balance (1)
provisions losses (2)
Portfolio $M $M $M $M $M
Corporate including SME, specialised lending and central
counterparties1,511 420 617 258 439
Sovereign - - - - -
Bank 9 - 9 - -
Residential mortgage 1,357 2,773 343 103 125
Qualifying revolving retail 149 - 67 - 283
Other retail 153 23 113 2 371
Total 3,179 3,216 1,149 363 1,218
30 June 2018
(1) Specific provision balance includes certain accounting collective provisions on some defaulted loans.
(2) Actual losses equal write-offs from individual provisions, write-offs direct from collective provisions less recoveries of amounts previously written off for the year ended 30 June 2018.
Factors impacting the loss experience
The overall quality of the portfolio was stable during the financial year ended 30 June 2019. Gross impaired assets as a proportion of
gross loans and advances (GLAAs) increased by six basis points to 0.48%. Total provisions as a proportion of GLAAs increased by
fourteen basis points to 0.63%, mainly driven by the adoption of AASB 9 on 1 July 2018. Group actual losses decreased by $23 million
on the prior year led by a reduction in commercial portfolio losses.
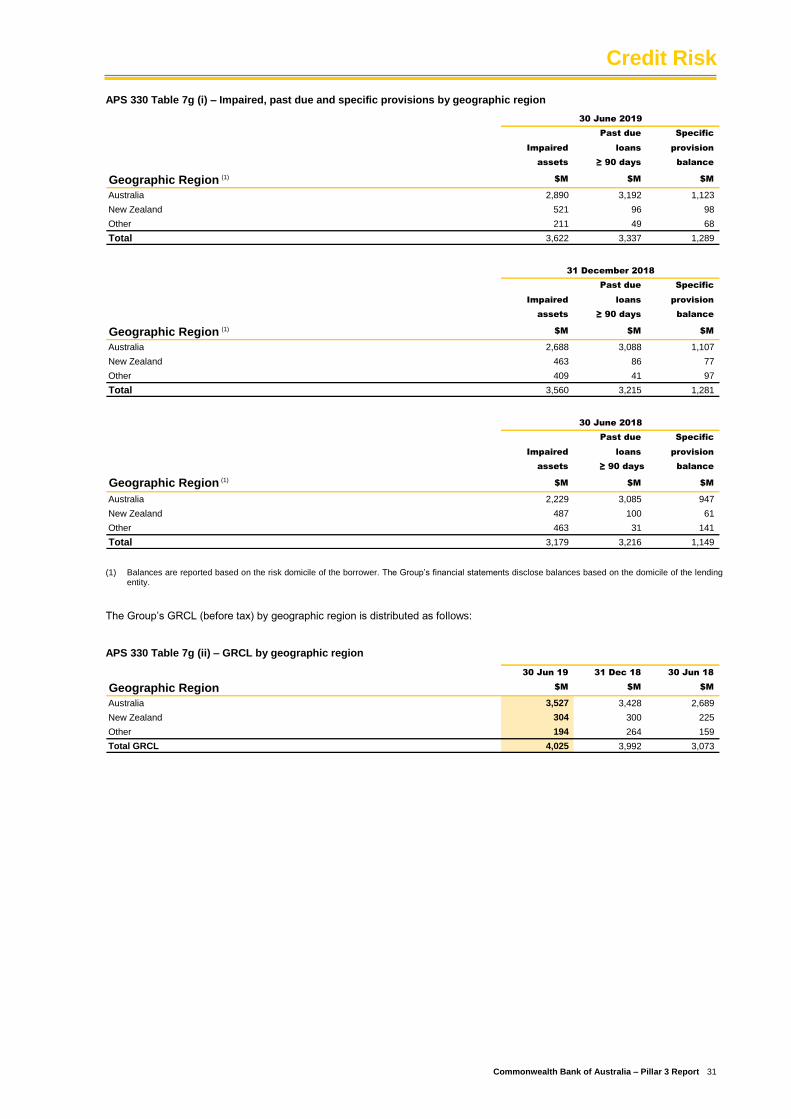
Credit Risk
Commonwealth Bank of Australia – Pillar 3 Report 31
APS 330 Table 7g (i) – Impaired, past due and specific provisions by geographic region
Past due Specific
Impaired loans provision
assets ≥ 90 days balance
Geographic Region (1)
$M $M $M
Australia 2,890 3,192 1,123
New Zealand 521 96 98
Other 211 49 68
Total 3,622 3,337 1,289
30 June 2019
Past due Specific
Impaired loans provision
assets ≥ 90 days balance
Geographic Region (1)
$M $M $M
Australia 2,688 3,088 1,107
New Zealand 463 86 77
Other 409 41 97
Total 3,560 3,215 1,281
31 December 2018
Past due Specific
Impaired loans provision
assets ≥ 90 days balance
Geographic Region (1)$M $M $M
Australia 2,229 3,085 947
New Zealand 487 100 61
Other 463 31 141
Total 3,179 3,216 1,149
30 June 2018
(1) Balances are reported based on the risk domicile of the borrower. The Group’s financial statements disclose balances based on the domicile of the lending
entity.
The Group’s GRCL (before tax) by geographic region is distributed as follows:
APS 330 Table 7g (ii) – GRCL by geographic region
30 Jun 19 31 Dec 18 30 Jun 18
Geographic Region $M $M $M
Australia 3,527 3,428 2,689
New Zealand 304 300 225
Other 194 264 159
Total GRCL 4,025 3,992 3,073
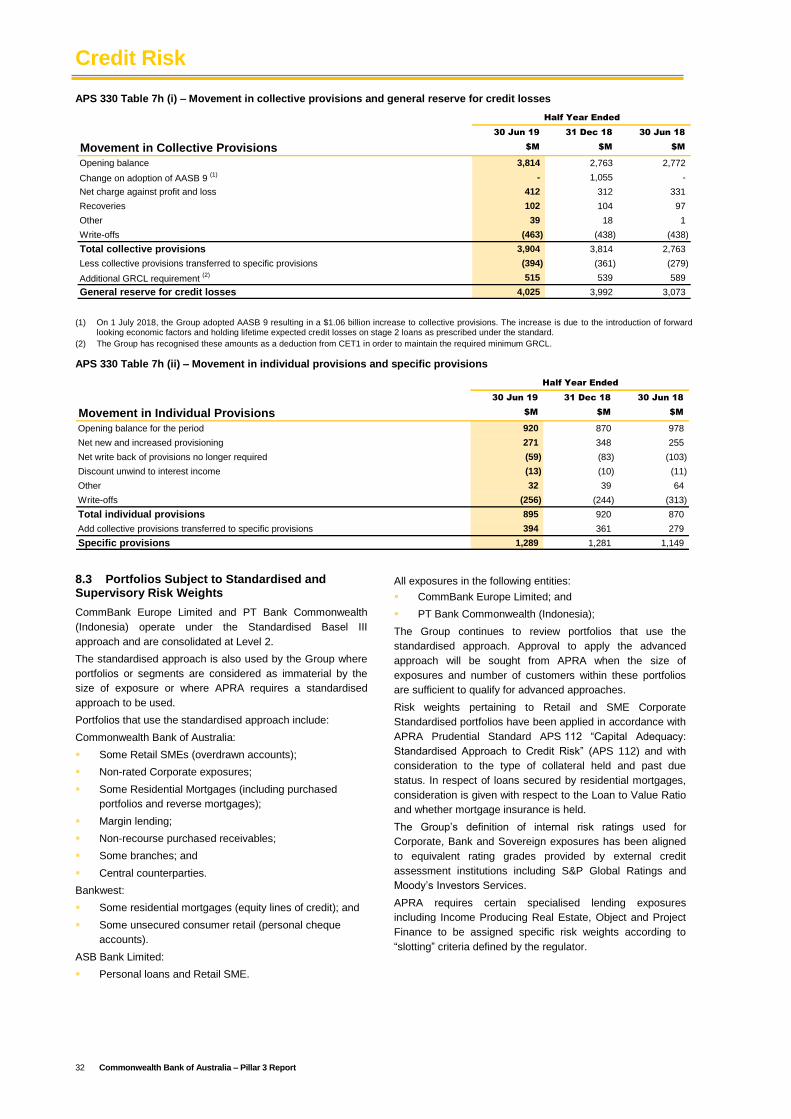
Credit Risk
32 Commonwealth Bank of Australia – Pillar 3 Report
APS 330 Table 7h (i) – Movement in collective provisions and general reserve for credit losses
30 Jun 19 31 Dec 18 30 Jun 18
Movement in Collective Provisions $M $M $M
Opening balance 3,814 2,763 2,772
Change on adoption of AASB 9 (1) - 1,055 -
Net charge against profit and loss 412 312 331
Recoveries 102 104 97
Other 39 18 1
Write-offs (463) (438) (438)
Total collective provisions 3,904 3,814 2,763
Less collective provisions transferred to specific provisions (394) (361) (279)
Additional GRCL requirement (2) 515 539 589
General reserve for credit losses 4,025 3,992 3,073
Half Year Ended
(1) On 1 July 2018, the Group adopted AASB 9 resulting in a $1.06 billion increase to collective provisions. The increase is due to the introduction of forward
looking economic factors and holding lifetime expected credit losses on stage 2 loans as prescribed under the standard. (2) The Group has recognised these amounts as a deduction from CET1 in order to maintain the required minimum GRCL.
APS 330 Table 7h (ii) – Movement in individual provisions and specific provisions
30 Jun 19 31 Dec 18 30 Jun 18
Movement in Individual Provisions $M $M $M
Opening balance for the period 920 870 978
Net new and increased provisioning 271 348 255
Net write back of provisions no longer required (59) (83) (103)
Discount unwind to interest income (13) (10) (11)
Other 32 39 64
Write-offs (256) (244) (313)
Total individual provisions 895 920 870
Add collective provisions transferred to specific provisions 394 361 279
Specific provisions 1,289 1,281 1,149
Half Year Ended
8.3 Portfolios Subject to Standardised and Supervisory Risk Weights
CommBank Europe Limited and PT Bank Commonwealth
(Indonesia) operate under the Standardised Basel III
approach and are consolidated at Level 2.
The standardised approach is also used by the Group where
portfolios or segments are considered as immaterial by the
size of exposure or where APRA requires a standardised
approach to be used.
Portfolios that use the standardised approach include:
Commonwealth Bank of Australia:
Some Retail SMEs (overdrawn accounts);
Non-rated Corporate exposures;
Some Residential Mortgages (including purchased
portfolios and reverse mortgages);
Margin lending;
Non-recourse purchased receivables;
Some branches; and
Central counterparties.
Bankwest:
Some residential mortgages (equity lines of credit); and
Some unsecured consumer retail (personal cheque
accounts).
ASB Bank Limited:
Personal loans and Retail SME.
All exposures in the following entities:
CommBank Europe Limited; and
PT Bank Commonwealth (Indonesia);
The Group continues to review portfolios that use the
standardised approach. Approval to apply the advanced
approach will be sought from APRA when the size of
exposures and number of customers within these portfolios
are sufficient to qualify for advanced approaches.
Risk weights pertaining to Retail and SME Corporate
Standardised portfolios have been applied in accordance with
APRA Prudential Standard APS 112 “Capital Adequacy:
Standardised Approach to Credit Risk” (APS 112) and with
consideration to the type of collateral held and past due
status. In respect of loans secured by residential mortgages,
consideration is given with respect to the Loan to Value Ratio
and whether mortgage insurance is held.
The Group’s definition of internal risk ratings used for
Corporate, Bank and Sovereign exposures has been aligned
to equivalent rating grades provided by external credit
assessment institutions including S&P Global Ratings and
Moody’s Investors Services.
APRA requires certain specialised lending exposures
including Income Producing Real Estate, Object and Project
Finance to be assigned specific risk weights according to
“slotting” criteria defined by the regulator.
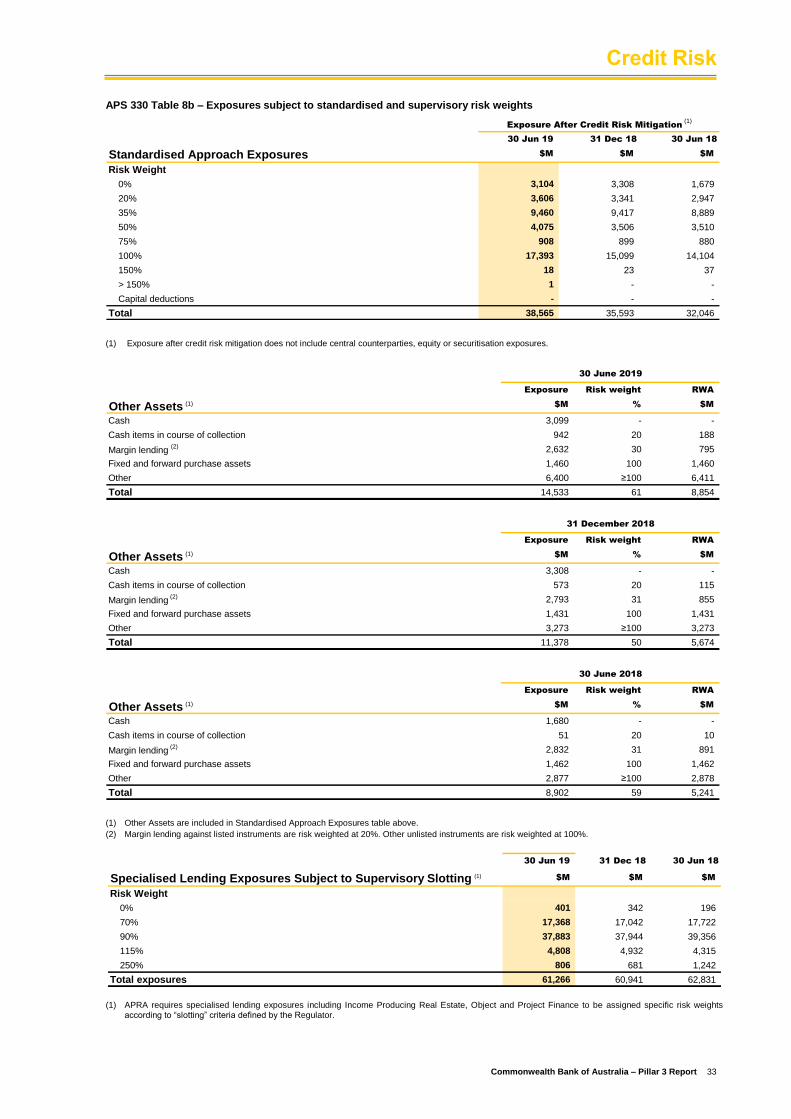
Credit Risk
Commonwealth Bank of Australia – Pillar 3 Report 33
APS 330 Table 8b – Exposures subject to standardised and supervisory risk weights
30 Jun 19 31 Dec 18 30 Jun 18
Standardised Approach Exposures $M $M $M
Risk Weight
0% 3,104 3,308 1,679
20% 3,606 3,341 2,947
35% 9,460 9,417 8,889
50% 4,075 3,506 3,510
75% 908 899 880
100% 17,393 15,099 14,104
150% 18 23 37
> 150% 1 - -
Capital deductions - - -
Total 38,565 35,593 32,046
Exposure After Credit Risk Mitigation (1)
(1) Exposure after credit risk mitigation does not include central counterparties, equity or securitisation exposures.
Exposure Risk weight RWA
Other Assets (1) $M % $M
Cash 3,099 - -
Cash items in course of collection 942 20 188
Margin lending (2) 2,632 30 795
Fixed and forward purchase assets 1,460 100 1,460
Other 6,400 ≥100 6,411
Total 14,533 61 8,854
30 June 2019
Exposure Risk weight RWA
Other Assets (1) $M % $M
Cash 3,308 - -
Cash items in course of collection 573 20 115
Margin lending (2) 2,793 31 855
Fixed and forward purchase assets 1,431 100 1,431
Other 3,273 ≥100 3,273
Total 11,378 50 5,674
31 December 2018
Exposure Risk weight RWA
Other Assets (1) $M % $M
Cash 1,680 - -
Cash items in course of collection 51 20 10
Margin lending (2) 2,832 31 891
Fixed and forward purchase assets 1,462 100 1,462
Other 2,877 ≥100 2,878
Total 8,902 59 5,241
30 June 2018
(1) Other Assets are included in Standardised Approach Exposures table above.
(2) Margin lending against listed instruments are risk weighted at 20%. Other unlisted instruments are risk weighted at 100%.
30 Jun 19 31 Dec 18 30 Jun 18
Specialised Lending Exposures Subject to Supervisory Slotting (1) $M $M $M
Risk Weight
0% 401 342 196
70% 17,368 17,042 17,722
90% 37,883 37,944 39,356
115% 4,808 4,932 4,315
250% 806 681 1,242
Total exposures 61,266 60,941 62,831
(1) APRA requires specialised lending exposures including Income Producing Real Estate, Object and Project Finance to be assigned specific risk weights according to “slotting” criteria defined by the Regulator.
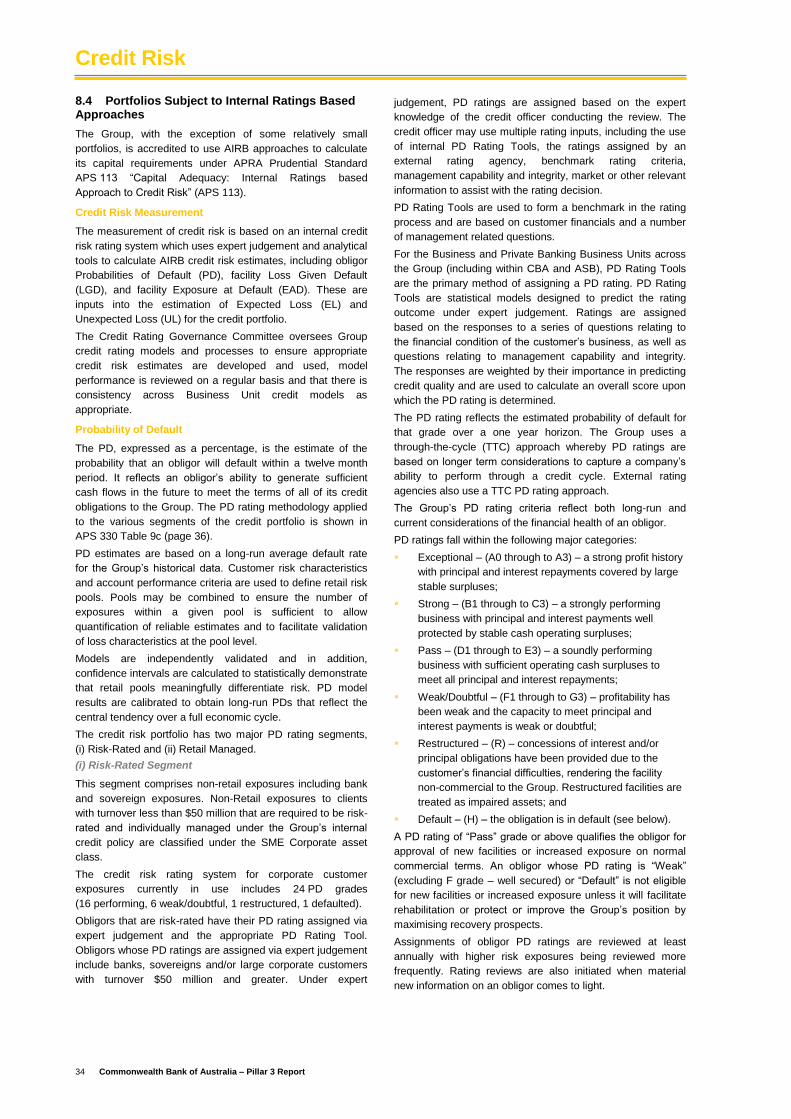
Credit Risk
34 Commonwealth Bank of Australia – Pillar 3 Report
8.4 Portfolios Subject to Internal Ratings Based Approaches
The Group, with the exception of some relatively small
portfolios, is accredited to use AIRB approaches to calculate
its capital requirements under APRA Prudential Standard
APS 113 “Capital Adequacy: Internal Ratings based
Approach to Credit Risk” (APS 113).
Credit Risk Measurement
The measurement of credit risk is based on an internal credit
risk rating system which uses expert judgement and analytical
tools to calculate AIRB credit risk estimates, including obligor
Probabilities of Default (PD), facility Loss Given Default
(LGD), and facility Exposure at Default (EAD). These are
inputs into the estimation of Expected Loss (EL) and
Unexpected Loss (UL) for the credit portfolio.
The Credit Rating Governance Committee oversees Group
credit rating models and processes to ensure appropriate
credit risk estimates are developed and used, model
performance is reviewed on a regular basis and that there is
consistency across Business Unit credit models as
appropriate.
Probability of Default
The PD, expressed as a percentage, is the estimate of the
probability that an obligor will default within a twelve month
period. It reflects an obligor’s ability to generate sufficient
cash flows in the future to meet the terms of all of its credit
obligations to the Group. The PD rating methodology applied
to the various segments of the credit portfolio is shown in
APS 330 Table 9c (page 36).
PD estimates are based on a long-run average default rate
for the Group’s historical data. Customer risk characteristics
and account performance criteria are used to define retail risk
pools. Pools may be combined to ensure the number of
exposures within a given pool is sufficient to allow
quantification of reliable estimates and to facilitate validation
of loss characteristics at the pool level.
Models are independently validated and in addition,
confidence intervals are calculated to statistically demonstrate
that retail pools meaningfully differentiate risk. PD model
results are calibrated to obtain long-run PDs that reflect the
central tendency over a full economic cycle.
The credit risk portfolio has two major PD rating segments,
(i) Risk-Rated and (ii) Retail Managed.
(i) Risk-Rated Segment
This segment comprises non-retail exposures including bank
and sovereign exposures. Non-Retail exposures to clients
with turnover less than $50 million that are required to be risk-
rated and individually managed under the Group’s internal
credit policy are classified under the SME Corporate asset
class.
The credit risk rating system for corporate customer
exposures currently in use includes 24 PD grades
(16 performing, 6 weak/doubtful, 1 restructured, 1 defaulted).
Obligors that are risk-rated have their PD rating assigned via
expert judgement and the appropriate PD Rating Tool.
Obligors whose PD ratings are assigned via expert judgement
include banks, sovereigns and/or large corporate customers
with turnover $50 million and greater. Under expert
judgement, PD ratings are assigned based on the expert
knowledge of the credit officer conducting the review. The
credit officer may use multiple rating inputs, including the use
of internal PD Rating Tools, the ratings assigned by an
external rating agency, benchmark rating criteria,
management capability and integrity, market or other relevant
information to assist with the rating decision.
PD Rating Tools are used to form a benchmark in the rating
process and are based on customer financials and a number
of management related questions.
For the Business and Private Banking Business Units across
the Group (including within CBA and ASB), PD Rating Tools
are the primary method of assigning a PD rating. PD Rating
Tools are statistical models designed to predict the rating
outcome under expert judgement. Ratings are assigned
based on the responses to a series of questions relating to
the financial condition of the customer’s business, as well as
questions relating to management capability and integrity.
The responses are weighted by their importance in predicting
credit quality and are used to calculate an overall score upon
which the PD rating is determined.
The PD rating reflects the estimated probability of default for
that grade over a one year horizon. The Group uses a
through-the-cycle (TTC) approach whereby PD ratings are
based on longer term considerations to capture a company’s
ability to perform through a credit cycle. External rating
agencies also use a TTC PD rating approach.
The Group’s PD rating criteria reflect both long-run and
current considerations of the financial health of an obligor.
PD ratings fall within the following major categories:
Exceptional – (A0 through to A3) – a strong profit history
with principal and interest repayments covered by large
stable surpluses;
Strong – (B1 through to C3) – a strongly performing
business with principal and interest payments well
protected by stable cash operating surpluses;
Pass – (D1 through to E3) – a soundly performing
business with sufficient operating cash surpluses to
meet all principal and interest repayments;
Weak/Doubtful – (F1 through to G3) – profitability has
been weak and the capacity to meet principal and
interest payments is weak or doubtful;
Restructured – (R) – concessions of interest and/or
principal obligations have been provided due to the
customer’s financial difficulties, rendering the facility
non-commercial to the Group. Restructured facilities are
treated as impaired assets; and
Default – (H) – the obligation is in default (see below).
A PD rating of “Pass” grade or above qualifies the obligor for
approval of new facilities or increased exposure on normal
commercial terms. An obligor whose PD rating is “Weak”
(excluding F grade – well secured) or “Default” is not eligible
for new facilities or increased exposure unless it will facilitate
rehabilitation or protect or improve the Group’s position by
maximising recovery prospects.
Assignments of obligor PD ratings are reviewed at least
annually with higher risk exposures being reviewed more
frequently. Rating reviews are also initiated when material
new information on an obligor comes to light.
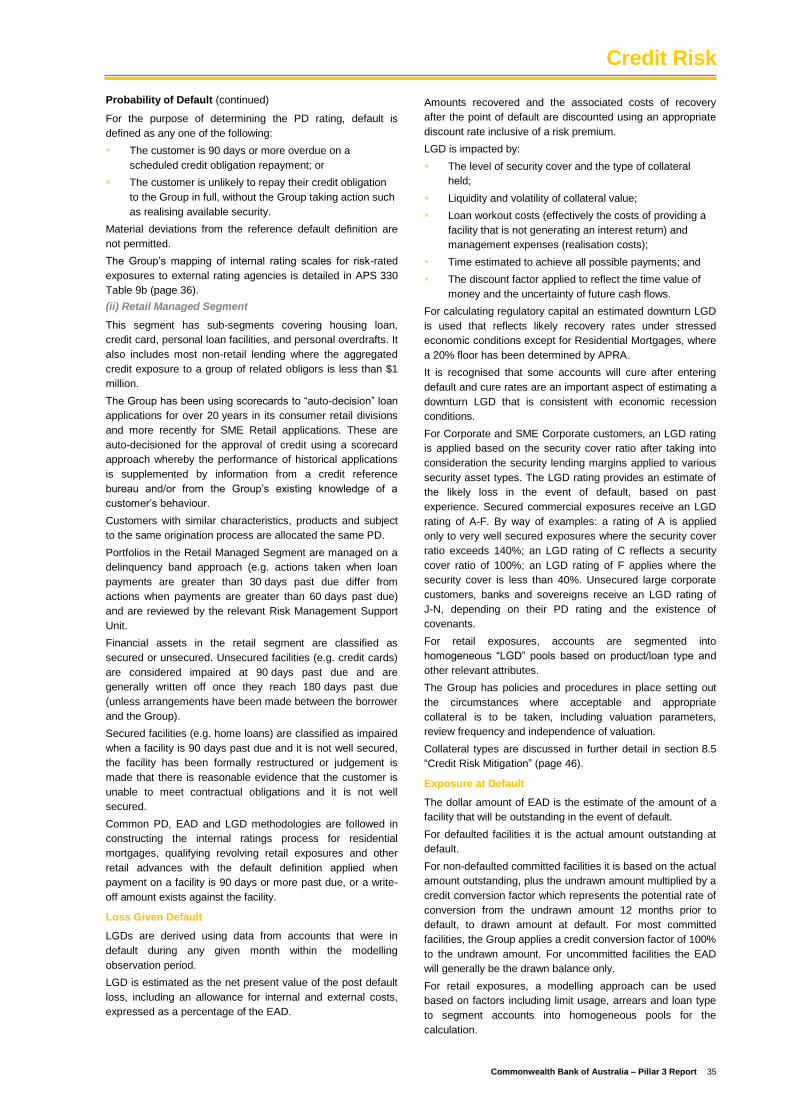
Credit Risk
Commonwealth Bank of Australia – Pillar 3 Report 35
Probability of Default (continued)
For the purpose of determining the PD rating, default is
defined as any one of the following:
The customer is 90 days or more overdue on a
scheduled credit obligation repayment; or
The customer is unlikely to repay their credit obligation
to the Group in full, without the Group taking action such
as realising available security.
Material deviations from the reference default definition are
not permitted.
The Group’s mapping of internal rating scales for risk-rated
exposures to external rating agencies is detailed in APS 330
Table 9b (page 36).
(ii) Retail Managed Segment
This segment has sub-segments covering housing loan,
credit card, personal loan facilities, and personal overdrafts. It
also includes most non-retail lending where the aggregated
credit exposure to a group of related obligors is less than $1
million.
The Group has been using scorecards to “auto-decision” loan
applications for over 20 years in its consumer retail divisions
and more recently for SME Retail applications. These are
auto-decisioned for the approval of credit using a scorecard
approach whereby the performance of historical applications
is supplemented by information from a credit reference
bureau and/or from the Group’s existing knowledge of a
customer’s behaviour.
Customers with similar characteristics, products and subject
to the same origination process are allocated the same PD.
Portfolios in the Retail Managed Segment are managed on a
delinquency band approach (e.g. actions taken when loan
payments are greater than 30 days past due differ from
actions when payments are greater than 60 days past due)
and are reviewed by the relevant Risk Management Support
Unit.
Financial assets in the retail segment are classified as
secured or unsecured. Unsecured facilities (e.g. credit cards)
are considered impaired at 90 days past due and are
generally written off once they reach 180 days past due
(unless arrangements have been made between the borrower
and the Group).
Secured facilities (e.g. home loans) are classified as impaired
when a facility is 90 days past due and it is not well secured,
the facility has been formally restructured or judgement is
made that there is reasonable evidence that the customer is
unable to meet contractual obligations and it is not well
secured.
Common PD, EAD and LGD methodologies are followed in
constructing the internal ratings process for residential
mortgages, qualifying revolving retail exposures and other
retail advances with the default definition applied when
payment on a facility is 90 days or more past due, or a write-
off amount exists against the facility.
Loss Given Default
LGDs are derived using data from accounts that were in
default during any given month within the modelling
observation period.
LGD is estimated as the net present value of the post default
loss, including an allowance for internal and external costs,
expressed as a percentage of the EAD.
Amounts recovered and the associated costs of recovery
after the point of default are discounted using an appropriate
discount rate inclusive of a risk premium.
LGD is impacted by:
The level of security cover and the type of collateral
held;
Liquidity and volatility of collateral value;
Loan workout costs (effectively the costs of providing a
facility that is not generating an interest return) and
management expenses (realisation costs);
Time estimated to achieve all possible payments; and
The discount factor applied to reflect the time value of
money and the uncertainty of future cash flows.
For calculating regulatory capital an estimated downturn LGD
is used that reflects likely recovery rates under stressed
economic conditions except for Residential Mortgages, where
a 20% floor has been determined by APRA.
It is recognised that some accounts will cure after entering
default and cure rates are an important aspect of estimating a
downturn LGD that is consistent with economic recession
conditions.
For Corporate and SME Corporate customers, an LGD rating
is applied based on the security cover ratio after taking into
consideration the security lending margins applied to various
security asset types. The LGD rating provides an estimate of
the likely loss in the event of default, based on past
experience. Secured commercial exposures receive an LGD
rating of A-F. By way of examples: a rating of A is applied
only to very well secured exposures where the security cover
ratio exceeds 140%; an LGD rating of C reflects a security
cover ratio of 100%; an LGD rating of F applies where the
security cover is less than 40%. Unsecured large corporate
customers, banks and sovereigns receive an LGD rating of
J-N, depending on their PD rating and the existence of
covenants.
For retail exposures, accounts are segmented into
homogeneous “LGD” pools based on product/loan type and
other relevant attributes.
The Group has policies and procedures in place setting out
the circumstances where acceptable and appropriate
collateral is to be taken, including valuation parameters,
review frequency and independence of valuation.
Collateral types are discussed in further detail in section 8.5
“Credit Risk Mitigation” (page 46).
Exposure at Default
The dollar amount of EAD is the estimate of the amount of a
facility that will be outstanding in the event of default.
For defaulted facilities it is the actual amount outstanding at
default.
For non-defaulted committed facilities it is based on the actual
amount outstanding, plus the undrawn amount multiplied by a
credit conversion factor which represents the potential rate of
conversion from the undrawn amount 12 months prior to
default, to drawn amount at default. For most committed
facilities, the Group applies a credit conversion factor of 100%
to the undrawn amount. For uncommitted facilities the EAD
will generally be the drawn balance only.
For retail exposures, a modelling approach can be used
based on factors including limit usage, arrears and loan type
to segment accounts into homogeneous pools for the
calculation.
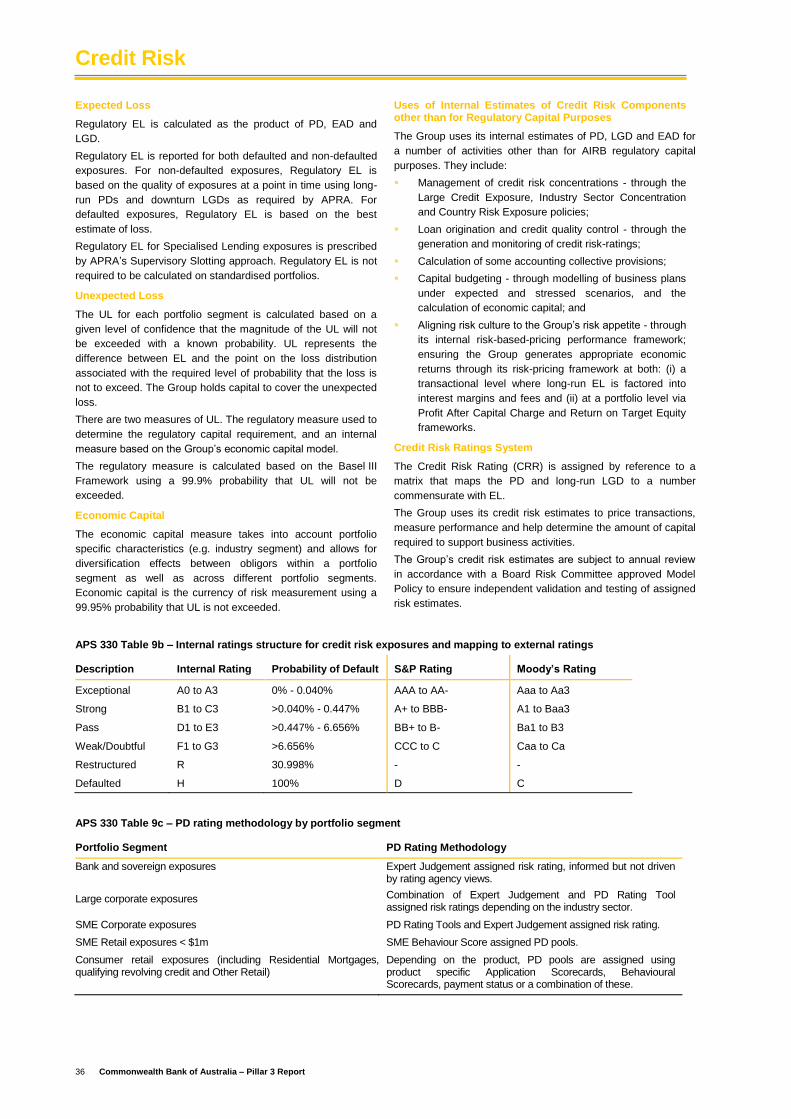
Credit Risk
36 Commonwealth Bank of Australia – Pillar 3 Report
Expected Loss
Regulatory EL is calculated as the product of PD, EAD and
LGD.
Regulatory EL is reported for both defaulted and non-defaulted
exposures. For non-defaulted exposures, Regulatory EL is
based on the quality of exposures at a point in time using long-
run PDs and downturn LGDs as required by APRA. For
defaulted exposures, Regulatory EL is based on the best
estimate of loss.
Regulatory EL for Specialised Lending exposures is prescribed
by APRA’s Supervisory Slotting approach. Regulatory EL is not
required to be calculated on standardised portfolios.
Unexpected Loss
The UL for each portfolio segment is calculated based on a
given level of confidence that the magnitude of the UL will not
be exceeded with a known probability. UL represents the
difference between EL and the point on the loss distribution
associated with the required level of probability that the loss is
not to exceed. The Group holds capital to cover the unexpected
loss.
There are two measures of UL. The regulatory measure used to
determine the regulatory capital requirement, and an internal
measure based on the Group’s economic capital model.
The regulatory measure is calculated based on the Basel III
Framework using a 99.9% probability that UL will not be
exceeded.
Economic Capital
The economic capital measure takes into account portfolio
specific characteristics (e.g. industry segment) and allows for
diversification effects between obligors within a portfolio
segment as well as across different portfolio segments.
Economic capital is the currency of risk measurement using a
99.95% probability that UL is not exceeded.
Uses of Internal Estimates of Credit Risk Components other than for Regulatory Capital Purposes
The Group uses its internal estimates of PD, LGD and EAD for
a number of activities other than for AIRB regulatory capital
purposes. They include:
Management of credit risk concentrations - through the
Large Credit Exposure, Industry Sector Concentration
and Country Risk Exposure policies;
Loan origination and credit quality control - through the
generation and monitoring of credit risk-ratings;
Calculation of some accounting collective provisions;
Capital budgeting - through modelling of business plans
under expected and stressed scenarios, and the
calculation of economic capital; and
Aligning risk culture to the Group’s risk appetite - through
its internal risk-based-pricing performance framework;
ensuring the Group generates appropriate economic
returns through its risk-pricing framework at both: (i) a
transactional level where long-run EL is factored into
interest margins and fees and (ii) at a portfolio level via
Profit After Capital Charge and Return on Target Equity
frameworks.
Credit Risk Ratings System
The Credit Risk Rating (CRR) is assigned by reference to a
matrix that maps the PD and long-run LGD to a number
commensurate with EL.
The Group uses its credit risk estimates to price transactions,
measure performance and help determine the amount of capital
required to support business activities.
The Group’s credit risk estimates are subject to annual review
in accordance with a Board Risk Committee approved Model
Policy to ensure independent validation and testing of assigned
risk estimates.
APS 330 Table 9b – Internal ratings structure for credit risk exposures and mapping to external ratings
Description Internal Rating Probability of Default S&P Rating Moody’s Rating
Exceptional A0 to A3 0% - 0.040% AAA to AA- Aaa to Aa3
Strong B1 to C3 >0.040% - 0.447% A+ to BBB- A1 to Baa3
Pass D1 to E3 >0.447% - 6.656% BB+ to B- Ba1 to B3
Weak/Doubtful F1 to G3 >6.656% CCC to C Caa to Ca
Restructured R 30.998% - -
Defaulted H 100% D C
APS 330 Table 9c – PD rating methodology by portfolio segment
Portfolio Segment PD Rating Methodology
Bank and sovereign exposures
Large corporate exposures
Expert Judgement assigned risk rating, informed but not driven by rating agency views.
Combination of Expert Judgement and PD Rating Tool assigned risk ratings depending on the industry sector.
SME Corporate exposures PD Rating Tools and Expert Judgement assigned risk rating.
SME Retail exposures < $1m SME Behaviour Score assigned PD pools.
Consumer retail exposures (including Residential Mortgages, qualifying revolving credit and Other Retail)
Depending on the product, PD pools are assigned using product specific Application Scorecards, Behavioural Scorecards, payment status or a combination of these.
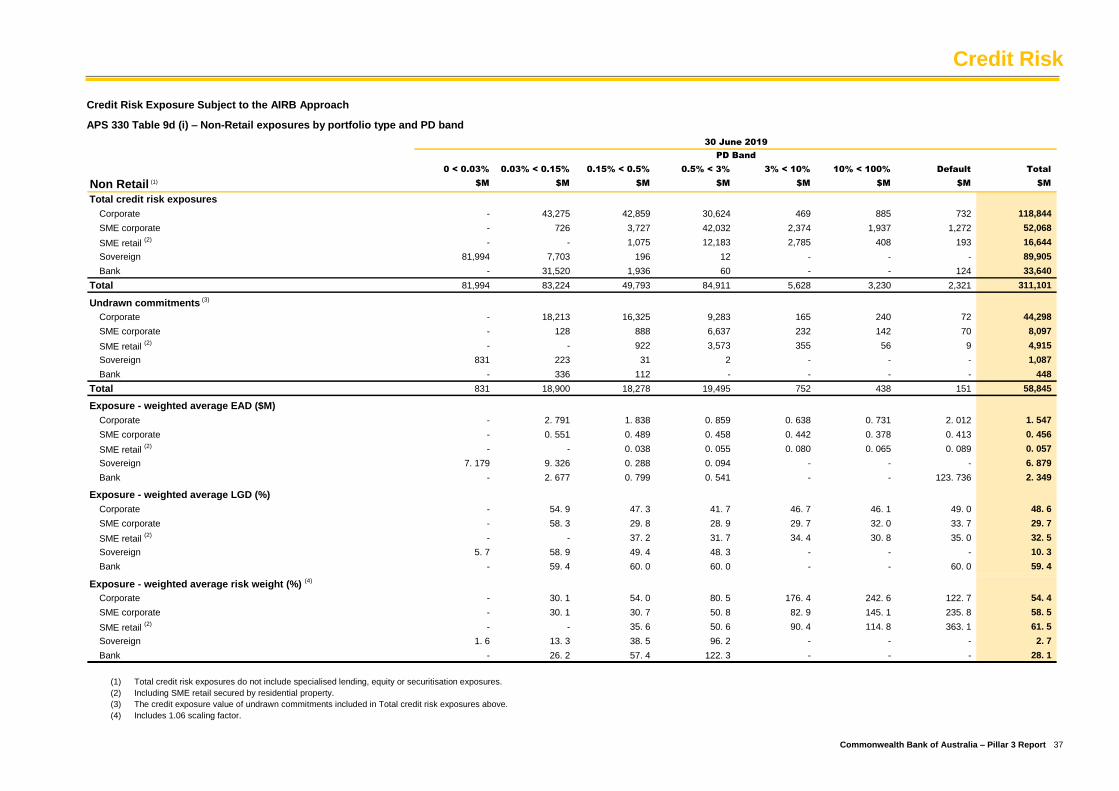
Credit Risk
Commonwealth Bank of Australia – Pillar 3 Report 37
Credit Risk Exposure Subject to the AIRB Approach
APS 330 Table 9d (i) – Non-Retail exposures by portfolio type and PD band
0 < 0.03% 0.03% < 0.15% 0.15% < 0.5% 0.5% < 3% 3% < 10% 10% < 100% Default Total
Non Retail (1) $M $M $M $M $M $M $M $M
Total credit risk exposures
Corporate - 43,275 42,859 30,624 469 885 732 118,844
SME corporate - 726 3,727 42,032 2,374 1,937 1,272 52,068
SME retail (2) - - 1,075 12,183 2,785 408 193 16,644
Sovereign 81,994 7,703 196 12 - - - 89,905
Bank - 31,520 1,936 60 - - 124 33,640
Total 81,994 83,224 49,793 84,911 5,628 3,230 2,321 311,101
Undrawn commitments (3)
Corporate - 18,213 16,325 9,283 165 240 72 44,298
SME corporate - 128 888 6,637 232 142 70 8,097
SME retail (2) - - 922 3,573 355 56 9 4,915
Sovereign 831 223 31 2 - - - 1,087
Bank - 336 112 - - - - 448
Total 831 18,900 18,278 19,495 752 438 151 58,845
Exposure - weighted average EAD ($M)
Corporate - 2. 791 1. 838 0. 859 0. 638 0. 731 2. 012 1. 547
SME corporate - 0. 551 0. 489 0. 458 0. 442 0. 378 0. 413 0. 456
SME retail (2) - - 0. 038 0. 055 0. 080 0. 065 0. 089 0. 057
Sovereign 7. 179 9. 326 0. 288 0. 094 - - - 6. 879
Bank - 2. 677 0. 799 0. 541 - - 123. 736 2. 349
Exposure - weighted average LGD (%)
Corporate - 54. 9 47. 3 41. 7 46. 7 46. 1 49. 0 48. 6
SME corporate - 58. 3 29. 8 28. 9 29. 7 32. 0 33. 7 29. 7
SME retail (2) - - 37. 2 31. 7 34. 4 30. 8 35. 0 32. 5
Sovereign 5. 7 58. 9 49. 4 48. 3 - - - 10. 3
Bank - 59. 4 60. 0 60. 0 - - 60. 0 59. 4
Exposure - weighted average risk weight (%) (4)
Corporate - 30. 1 54. 0 80. 5 176. 4 242. 6 122. 7 54. 4
SME corporate - 30. 1 30. 7 50. 8 82. 9 145. 1 235. 8 58. 5
SME retail (2) - - 35. 6 50. 6 90. 4 114. 8 363. 1 61. 5
Sovereign 1. 6 13. 3 38. 5 96. 2 - - - 2. 7
Bank - 26. 2 57. 4 122. 3 - - - 28. 1
30 June 2019
PD Band
(1) Total credit risk exposures do not include specialised lending, equity or securitisation exposures.
(2) Including SME retail secured by residential property.
(3) The credit exposure value of undrawn commitments included in Total credit risk exposures above.
(4) Includes 1.06 scaling factor.
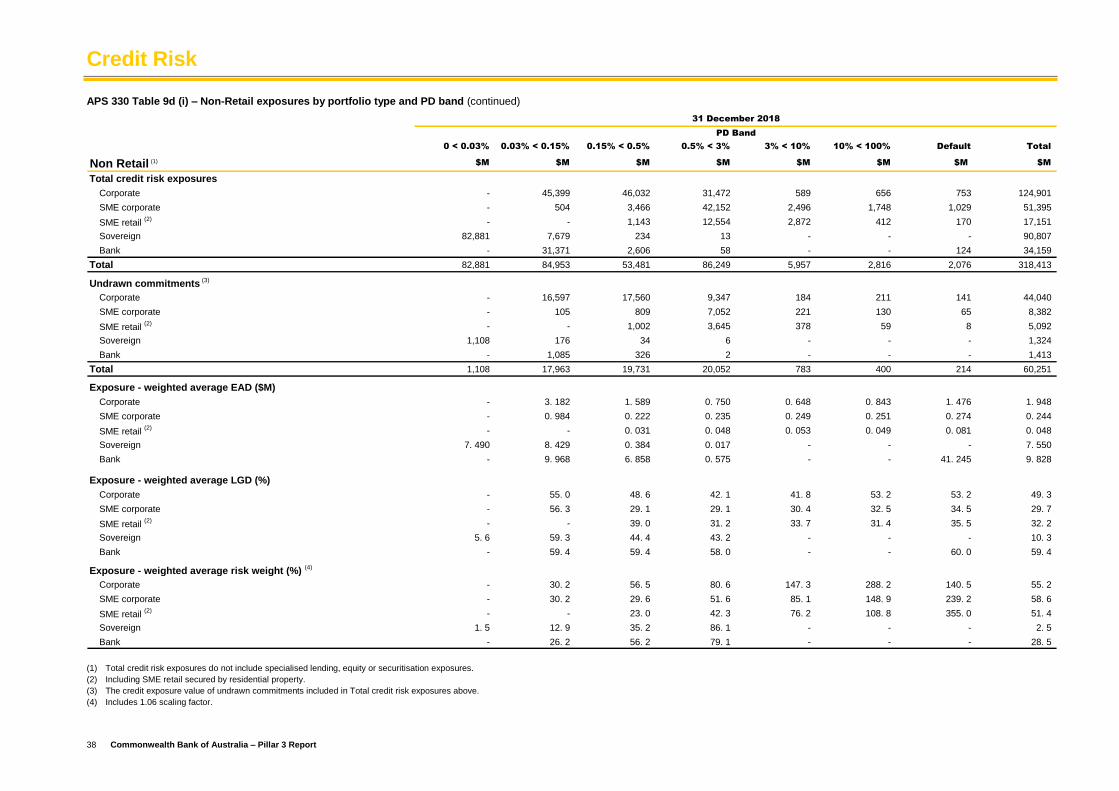
Credit Risk
38 Commonwealth Bank of Australia – Pillar 3 Report
APS 330 Table 9d (i) – Non-Retail exposures by portfolio type and PD band (continued)
0 < 0.03% 0.03% < 0.15% 0.15% < 0.5% 0.5% < 3% 3% < 10% 10% < 100% Default Total
Non Retail (1) $M $M $M $M $M $M $M $M
Total credit risk exposures
Corporate - 45,399 46,032 31,472 589 656 753 124,901
SME corporate - 504 3,466 42,152 2,496 1,748 1,029 51,395
SME retail (2) - - 1,143 12,554 2,872 412 170 17,151
Sovereign 82,881 7,679 234 13 - - - 90,807
Bank - 31,371 2,606 58 - - 124 34,159
Total 82,881 84,953 53,481 86,249 5,957 2,816 2,076 318,413
Undrawn commitments (3)
Corporate - 16,597 17,560 9,347 184 211 141 44,040
SME corporate - 105 809 7,052 221 130 65 8,382
SME retail (2) - - 1,002 3,645 378 59 8 5,092
Sovereign 1,108 176 34 6 - - - 1,324
Bank - 1,085 326 2 - - - 1,413
Total 1,108 17,963 19,731 20,052 783 400 214 60,251
Exposure - weighted average EAD ($M)
Corporate - 3. 182 1. 589 0. 750 0. 648 0. 843 1. 476 1. 948
SME corporate - 0. 984 0. 222 0. 235 0. 249 0. 251 0. 274 0. 244
SME retail (2) - - 0. 031 0. 048 0. 053 0. 049 0. 081 0. 048
Sovereign 7. 490 8. 429 0. 384 0. 017 - - - 7. 550
Bank - 9. 968 6. 858 0. 575 - - 41. 245 9. 828
Exposure - weighted average LGD (%)
Corporate - 55. 0 48. 6 42. 1 41. 8 53. 2 53. 2 49. 3
SME corporate - 56. 3 29. 1 29. 1 30. 4 32. 5 34. 5 29. 7
SME retail (2) - - 39. 0 31. 2 33. 7 31. 4 35. 5 32. 2
Sovereign 5. 6 59. 3 44. 4 43. 2 - - - 10. 3
Bank - 59. 4 59. 4 58. 0 - - 60. 0 59. 4
Exposure - weighted average risk weight (%) (4)
Corporate - 30. 2 56. 5 80. 6 147. 3 288. 2 140. 5 55. 2
SME corporate - 30. 2 29. 6 51. 6 85. 1 148. 9 239. 2 58. 6
SME retail (2) - - 23. 0 42. 3 76. 2 108. 8 355. 0 51. 4
Sovereign 1. 5 12. 9 35. 2 86. 1 - - - 2. 5
Bank - 26. 2 56. 2 79. 1 - - - 28. 5
31 December 2018
PD Band
(1) Total credit risk exposures do not include specialised lending, equity or securitisation exposures.
(2) Including SME retail secured by residential property.
(3) The credit exposure value of undrawn commitments included in Total credit risk exposures above.
(4) Includes 1.06 scaling factor.
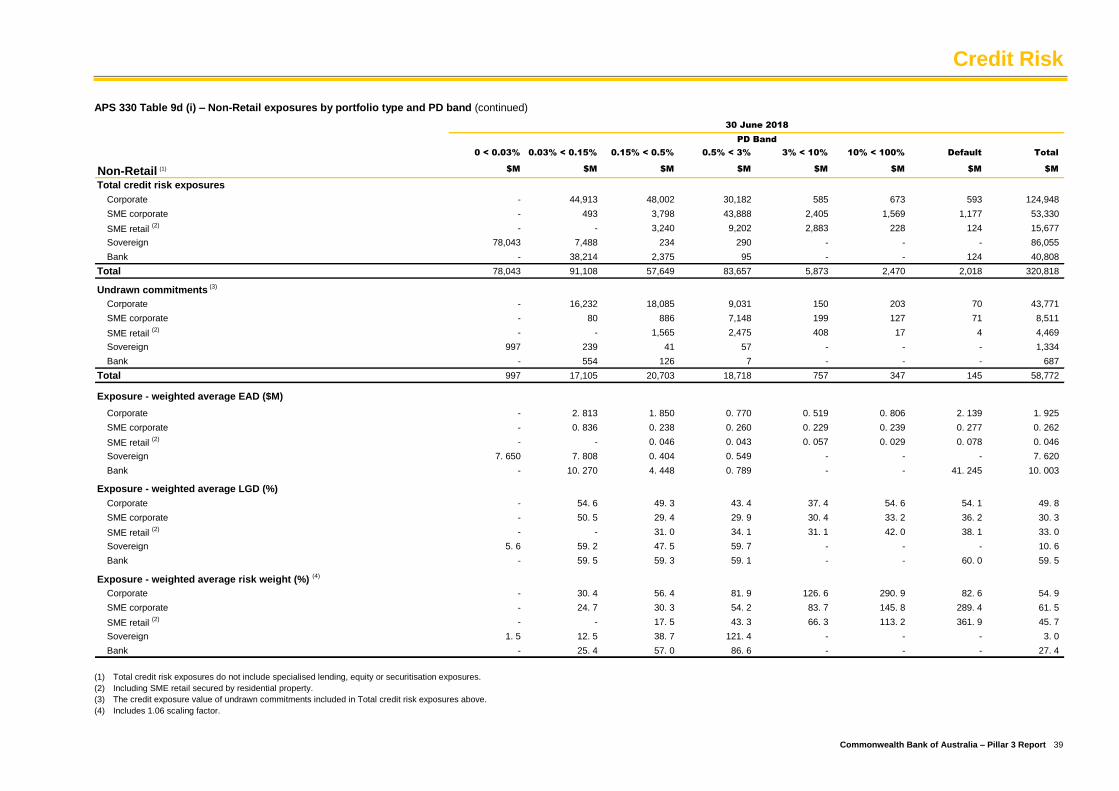
Credit Risk
Commonwealth Bank of Australia – Pillar 3 Report 39
APS 330 Table 9d (i) – Non-Retail exposures by portfolio type and PD band (continued)
0 < 0.03% 0.03% < 0.15% 0.15% < 0.5% 0.5% < 3% 3% < 10% 10% < 100% Default Total
Non-Retail (1) $M $M $M $M $M $M $M $M
Total credit risk exposures
Corporate - 44,913 48,002 30,182 585 673 593 124,948
SME corporate - 493 3,798 43,888 2,405 1,569 1,177 53,330
SME retail (2) - - 3,240 9,202 2,883 228 124 15,677
Sovereign 78,043 7,488 234 290 - - - 86,055
Bank - 38,214 2,375 95 - - 124 40,808
Total 78,043 91,108 57,649 83,657 5,873 2,470 2,018 320,818
Undrawn commitments (3)
Corporate - 16,232 18,085 9,031 150 203 70 43,771
SME corporate - 80 886 7,148 199 127 71 8,511
SME retail (2) - - 1,565 2,475 408 17 4 4,469
Sovereign 997 239 41 57 - - - 1,334
Bank - 554 126 7 - - - 687
Total 997 17,105 20,703 18,718 757 347 145 58,772
Exposure - weighted average EAD ($M)
Corporate - 2. 813 1. 850 0. 770 0. 519 0. 806 2. 139 1. 925
SME corporate - 0. 836 0. 238 0. 260 0. 229 0. 239 0. 277 0. 262
SME retail (2) - - 0. 046 0. 043 0. 057 0. 029 0. 078 0. 046
Sovereign 7. 650 7. 808 0. 404 0. 549 - - - 7. 620
Bank - 10. 270 4. 448 0. 789 - - 41. 245 10. 003
Exposure - weighted average LGD (%)
Corporate - 54. 6 49. 3 43. 4 37. 4 54. 6 54. 1 49. 8
SME corporate - 50. 5 29. 4 29. 9 30. 4 33. 2 36. 2 30. 3
SME retail (2) - - 31. 0 34. 1 31. 1 42. 0 38. 1 33. 0
Sovereign 5. 6 59. 2 47. 5 59. 7 - - - 10. 6
Bank - 59. 5 59. 3 59. 1 - - 60. 0 59. 5
Exposure - weighted average risk weight (%) (4)
Corporate - 30. 4 56. 4 81. 9 126. 6 290. 9 82. 6 54. 9
SME corporate - 24. 7 30. 3 54. 2 83. 7 145. 8 289. 4 61. 5
SME retail (2) - - 17. 5 43. 3 66. 3 113. 2 361. 9 45. 7
Sovereign 1. 5 12. 5 38. 7 121. 4 - - - 3. 0
Bank - 25. 4 57. 0 86. 6 - - - 27. 4
30 June 2018
PD Band
(1) Total credit risk exposures do not include specialised lending, equity or securitisation exposures.
(2) Including SME retail secured by residential property.
(3) The credit exposure value of undrawn commitments included in Total credit risk exposures above.
(4) Includes 1.06 scaling factor.
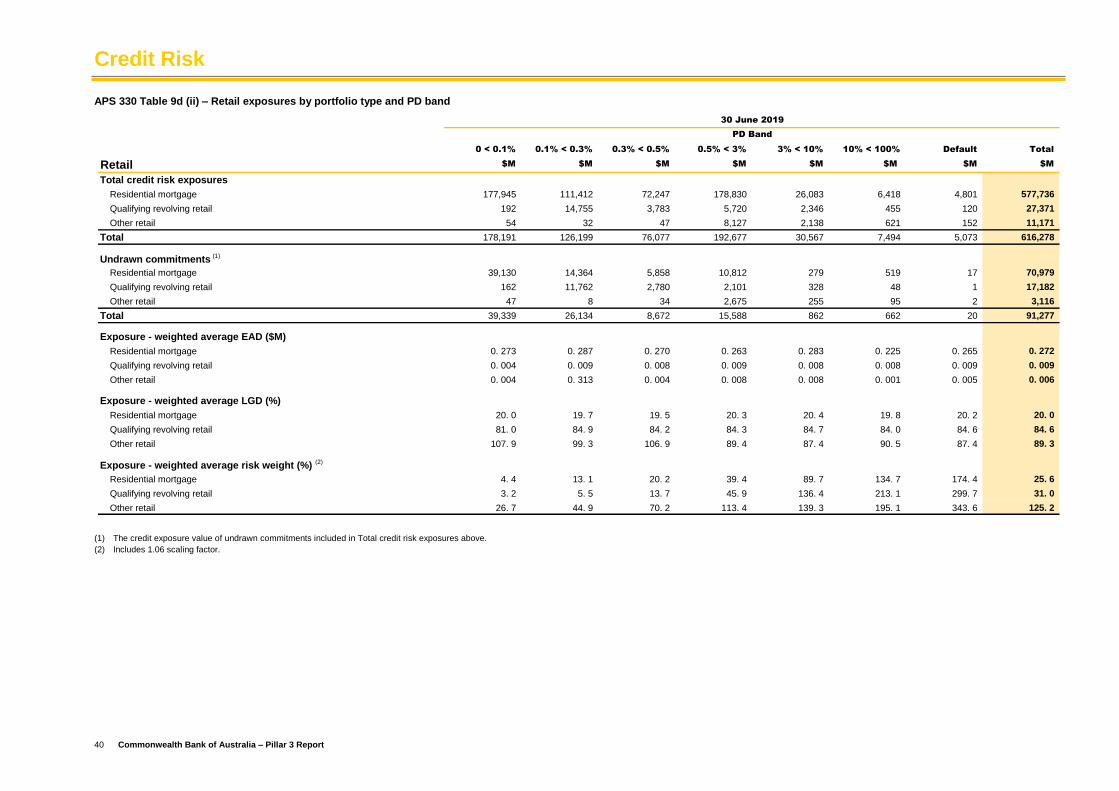
Credit Risk
40 Commonwealth Bank of Australia – Pillar 3 Report
APS 330 Table 9d (ii) – Retail exposures by portfolio type and PD band
0 < 0.1% 0.1% < 0.3% 0.3% < 0.5% 0.5% < 3% 3% < 10% 10% < 100% Default Total
Retail $M $M $M $M $M $M $M $M
Total credit risk exposures
Residential mortgage 177,945 111,412 72,247 178,830 26,083 6,418 4,801 577,736
Qualifying revolving retail 192 14,755 3,783 5,720 2,346 455 120 27,371
Other retail 54 32 47 8,127 2,138 621 152 11,171
Total 178,191 126,199 76,077 192,677 30,567 7,494 5,073 616,278
Undrawn commitments (1)
Residential mortgage 39,130 14,364 5,858 10,812 279 519 17 70,979
Qualifying revolving retail 162 11,762 2,780 2,101 328 48 1 17,182
Other retail 47 8 34 2,675 255 95 2 3,116
Total 39,339 26,134 8,672 15,588 862 662 20 91,277
Exposure - weighted average EAD ($M)
Residential mortgage 0. 273 0. 287 0. 270 0. 263 0. 283 0. 225 0. 265 0. 272
Qualifying revolving retail 0. 004 0. 009 0. 008 0. 009 0. 008 0. 008 0. 009 0. 009
Other retail 0. 004 0. 313 0. 004 0. 008 0. 008 0. 001 0. 005 0. 006
Exposure - weighted average LGD (%)
Residential mortgage 20. 0 19. 7 19. 5 20. 3 20. 4 19. 8 20. 2 20. 0
Qualifying revolving retail 81. 0 84. 9 84. 2 84. 3 84. 7 84. 0 84. 6 84. 6
Other retail 107. 9 99. 3 106. 9 89. 4 87. 4 90. 5 87. 4 89. 3
Exposure - weighted average risk weight (%) (2)
Residential mortgage 4. 4 13. 1 20. 2 39. 4 89. 7 134. 7 174. 4 25. 6
Qualifying revolving retail 3. 2 5. 5 13. 7 45. 9 136. 4 213. 1 299. 7 31. 0
Other retail 26. 7 44. 9 70. 2 113. 4 139. 3 195. 1 343. 6 125. 2
30 June 2019
PD Band
(1) The credit exposure value of undrawn commitments included in Total credit risk exposures above.
(2) Includes 1.06 scaling factor.
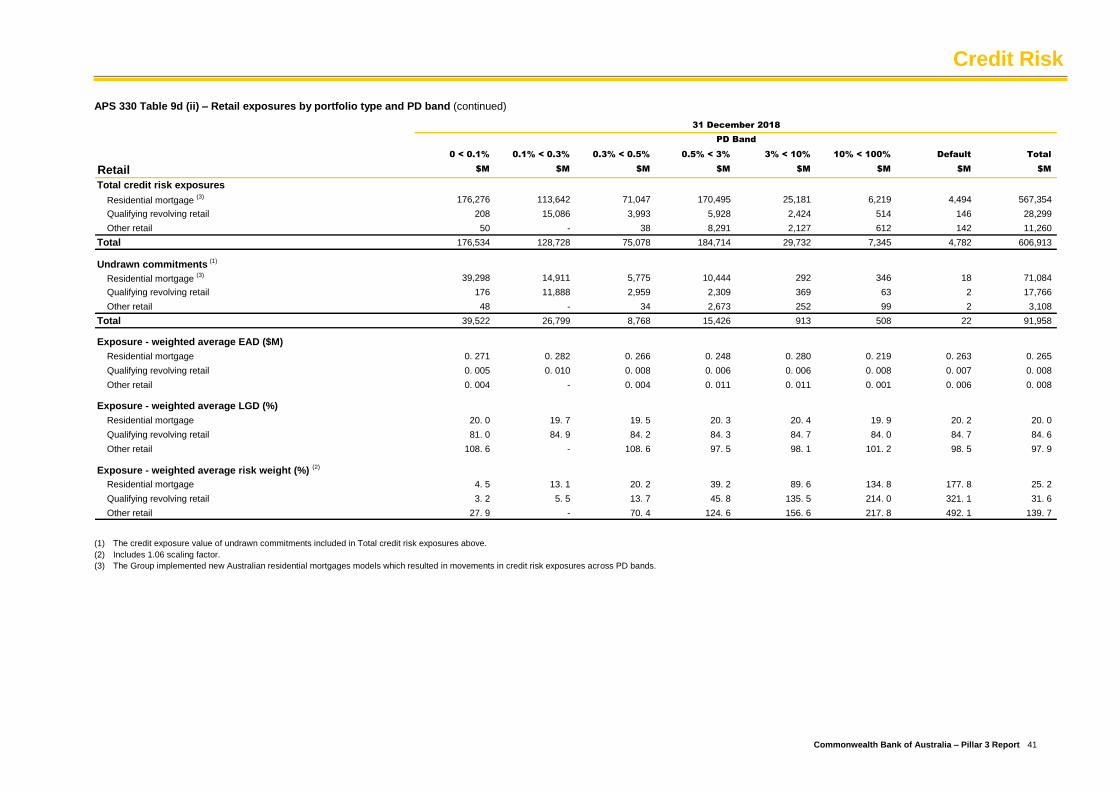
Credit Risk
Commonwealth Bank of Australia – Pillar 3 Report 41
APS 330 Table 9d (ii) – Retail exposures by portfolio type and PD band (continued)
0 < 0.1% 0.1% < 0.3% 0.3% < 0.5% 0.5% < 3% 3% < 10% 10% < 100% Default Total
Retail $M $M $M $M $M $M $M $M
Total credit risk exposures
Residential mortgage (3) 176,276 113,642 71,047 170,495 25,181 6,219 4,494 567,354
Qualifying revolving retail 208 15,086 3,993 5,928 2,424 514 146 28,299
Other retail 50 - 38 8,291 2,127 612 142 11,260
Total 176,534 128,728 75,078 184,714 29,732 7,345 4,782 606,913
Undrawn commitments (1)
Residential mortgage (3) 39,298 14,911 5,775 10,444 292 346 18 71,084
Qualifying revolving retail 176 11,888 2,959 2,309 369 63 2 17,766
Other retail 48 - 34 2,673 252 99 2 3,108
Total 39,522 26,799 8,768 15,426 913 508 22 91,958
Exposure - weighted average EAD ($M)
Residential mortgage 0. 271 0. 282 0. 266 0. 248 0. 280 0. 219 0. 263 0. 265
Qualifying revolving retail 0. 005 0. 010 0. 008 0. 006 0. 006 0. 008 0. 007 0. 008
Other retail 0. 004 - 0. 004 0. 011 0. 011 0. 001 0. 006 0. 008
Exposure - weighted average LGD (%)
Residential mortgage 20. 0 19. 7 19. 5 20. 3 20. 4 19. 9 20. 2 20. 0
Qualifying revolving retail 81. 0 84. 9 84. 2 84. 3 84. 7 84. 0 84. 7 84. 6
Other retail 108. 6 - 108. 6 97. 5 98. 1 101. 2 98. 5 97. 9
Exposure - weighted average risk weight (%) (2)
Residential mortgage 4. 5 13. 1 20. 2 39. 2 89. 6 134. 8 177. 8 25. 2
Qualifying revolving retail 3. 2 5. 5 13. 7 45. 8 135. 5 214. 0 321. 1 31. 6
Other retail 27. 9 - 70. 4 124. 6 156. 6 217. 8 492. 1 139. 7
31 December 2018
PD Band
(1) The credit exposure value of undrawn commitments included in Total credit risk exposures above.
(2) Includes 1.06 scaling factor.
(3) The Group implemented new Australian residential mortgages models which resulted in movements in credit risk exposures across PD bands.
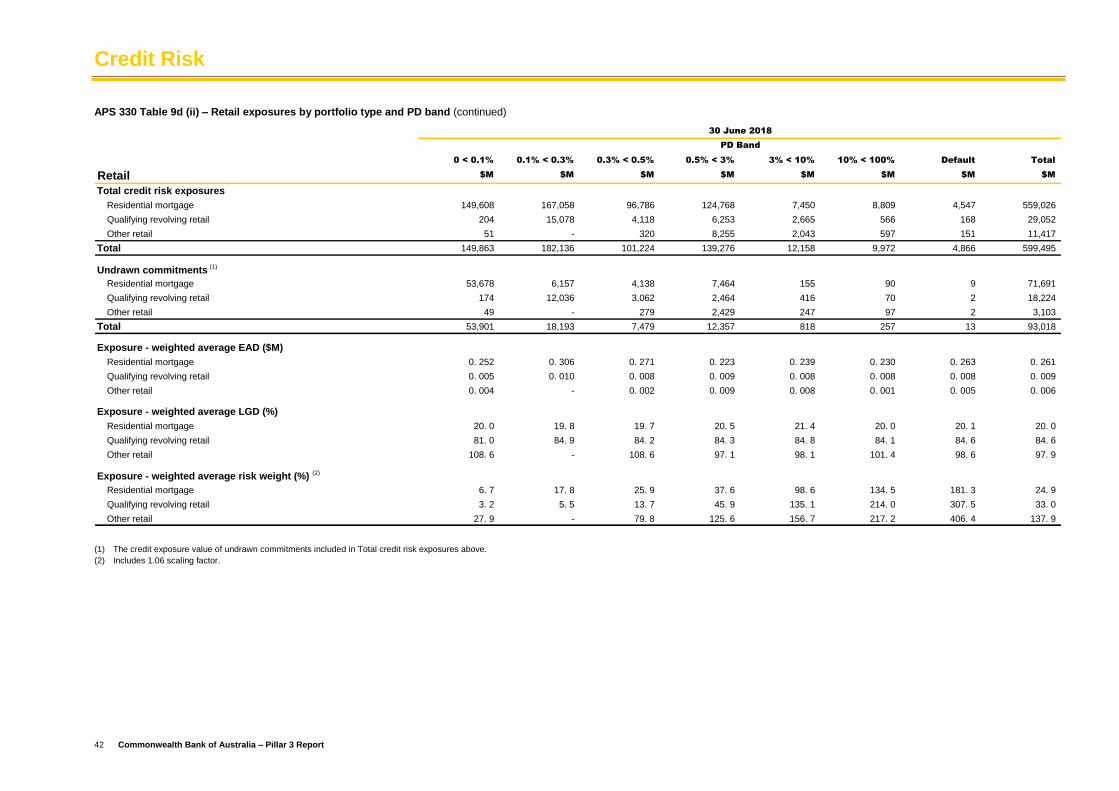
Credit Risk
42 Commonwealth Bank of Australia – Pillar 3 Report
APS 330 Table 9d (ii) – Retail exposures by portfolio type and PD band (continued)
0 < 0.1% 0.1% < 0.3% 0.3% < 0.5% 0.5% < 3% 3% < 10% 10% < 100% Default Total
Retail $M $M $M $M $M $M $M $M
Total credit risk exposures
Residential mortgage 149,608 167,058 96,786 124,768 7,450 8,809 4,547 559,026
Qualifying revolving retail 204 15,078 4,118 6,253 2,665 566 168 29,052
Other retail 51 - 320 8,255 2,043 597 151 11,417
Total 149,863 182,136 101,224 139,276 12,158 9,972 4,866 599,495
Undrawn commitments (1)
Residential mortgage 53,678 6,157 4,138 7,464 155 90 9 71,691
Qualifying revolving retail 174 12,036 3,062 2,464 416 70 2 18,224
Other retail 49 - 279 2,429 247 97 2 3,103
Total 53,901 18,193 7,479 12,357 818 257 13 93,018
Exposure - weighted average EAD ($M)
Residential mortgage 0. 252 0. 306 0. 271 0. 223 0. 239 0. 230 0. 263 0. 261
Qualifying revolving retail 0. 005 0. 010 0. 008 0. 009 0. 008 0. 008 0. 008 0. 009
Other retail 0. 004 - 0. 002 0. 009 0. 008 0. 001 0. 005 0. 006
Exposure - weighted average LGD (%)
Residential mortgage 20. 0 19. 8 19. 7 20. 5 21. 4 20. 0 20. 1 20. 0
Qualifying revolving retail 81. 0 84. 9 84. 2 84. 3 84. 8 84. 1 84. 6 84. 6
Other retail 108. 6 - 108. 6 97. 1 98. 1 101. 4 98. 6 97. 9
Exposure - weighted average risk weight (%) (2)
Residential mortgage 6. 7 17. 8 25. 9 37. 6 98. 6 134. 5 181. 3 24. 9
Qualifying revolving retail 3. 2 5. 5 13. 7 45. 9 135. 1 214. 0 307. 5 33. 0
Other retail 27. 9 - 79. 8 125. 6 156. 7 217. 2 406. 4 137. 9
30 June 2018
PD Band
(1) The credit exposure value of undrawn commitments included in Total credit risk exposures above.
(2) Includes 1.06 scaling factor.
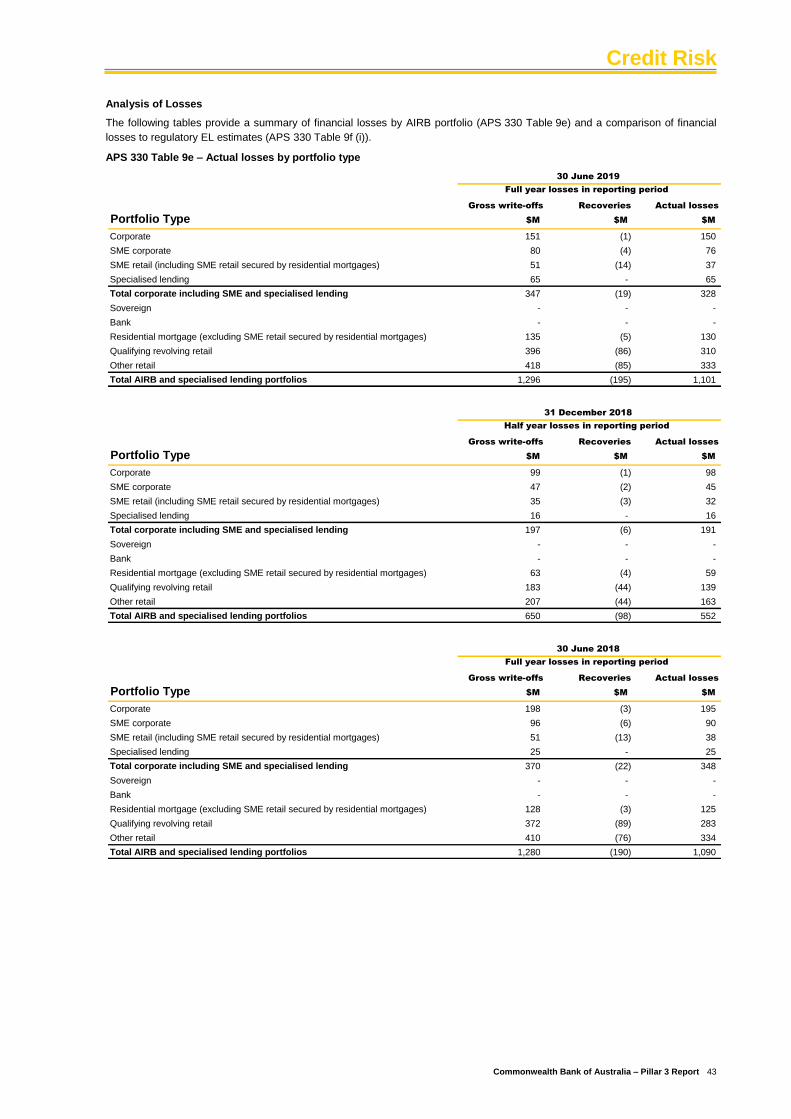
Credit Risk
Commonwealth Bank of Australia – Pillar 3 Report 43
Analysis of Losses
The following tables provide a summary of financial losses by AIRB portfolio (APS 330 Table 9e) and a comparison of financial
losses to regulatory EL estimates (APS 330 Table 9f (i)).
APS 330 Table 9e – Actual losses by portfolio type
Gross write-offs Recoveries Actual losses
Portfolio Type $M $M $M
Corporate 151 (1) 150
SME corporate 80 (4) 76
SME retail (including SME retail secured by residential mortgages) 51 (14) 37
Specialised lending 65 - 65
Total corporate including SME and specialised lending 347 (19) 328
Sovereign - - -
Bank - - -
Residential mortgage (excluding SME retail secured by residential mortgages) 135 (5) 130
Qualifying revolving retail 396 (86) 310
Other retail 418 (85) 333
Total AIRB and specialised lending portfolios 1,296 (195) 1,101
30 June 2019
Full year losses in reporting period
Gross write-offs Recoveries Actual losses
Portfolio Type $M $M $M
Corporate 99 (1) 98
SME corporate 47 (2) 45
SME retail (including SME retail secured by residential mortgages) 35 (3) 32
Specialised lending 16 - 16
Total corporate including SME and specialised lending 197 (6) 191
Sovereign - - -
Bank - - -
Residential mortgage (excluding SME retail secured by residential mortgages) 63 (4) 59
Qualifying revolving retail 183 (44) 139
Other retail 207 (44) 163
Total AIRB and specialised lending portfolios 650 (98) 552
31 December 2018
Half year losses in reporting period
Gross write-offs Recoveries Actual losses
Portfolio Type $M $M $M
Corporate 198 (3) 195
SME corporate 96 (6) 90
SME retail (including SME retail secured by residential mortgages) 51 (13) 38
Specialised lending 25 - 25
Total corporate including SME and specialised lending 370 (22) 348
Sovereign - - -
Bank - - -
Residential mortgage (excluding SME retail secured by residential mortgages) 128 (3) 125
Qualifying revolving retail 372 (89) 283
Other retail 410 (76) 334
Total AIRB and specialised lending portfolios 1,280 (190) 1,090
30 June 2018
Full year losses in reporting period
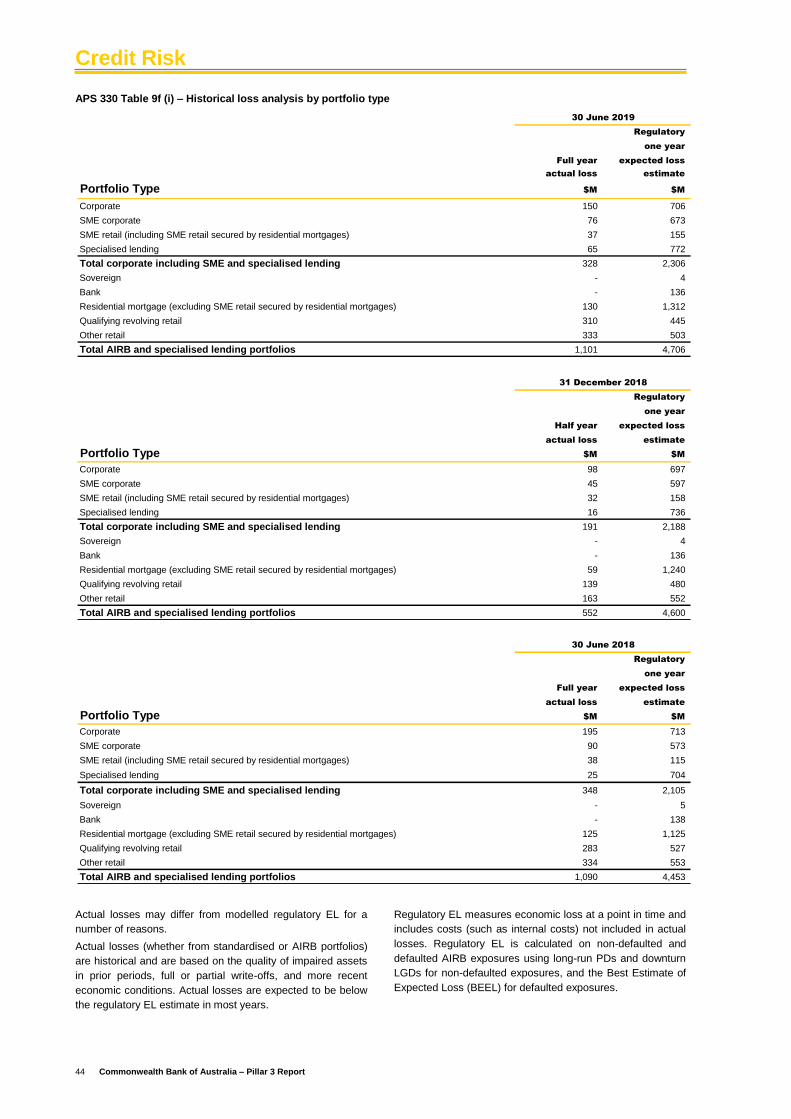
Credit Risk
44 Commonwealth Bank of Australia – Pillar 3 Report
APS 330 Table 9f (i) – Historical loss analysis by portfolio type
Regulatory
one year
Full year expected loss
actual loss estimate
Portfolio Type $M $M
Corporate 150 706
SME corporate 76 673
SME retail (including SME retail secured by residential mortgages) 37 155
Specialised lending 65 772
Total corporate including SME and specialised lending 328 2,306
Sovereign - 4
Bank - 136
Residential mortgage (excluding SME retail secured by residential mortgages) 130 1,312
Qualifying revolving retail 310 445
Other retail 333 503
Total AIRB and specialised lending portfolios 1,101 4,706
30 June 2019
Regulatory
one year
Half year expected loss
actual loss estimate
Portfolio Type $M $M
Corporate 98 697
SME corporate 45 597
SME retail (including SME retail secured by residential mortgages) 32 158
Specialised lending 16 736
Total corporate including SME and specialised lending 191 2,188
Sovereign - 4
Bank - 136
Residential mortgage (excluding SME retail secured by residential mortgages) 59 1,240
Qualifying revolving retail 139 480
Other retail 163 552
Total AIRB and specialised lending portfolios 552 4,600
31 December 2018
Regulatory
one year
Full year expected loss
actual loss estimate
Portfolio Type $M $M
Corporate 195 713
SME corporate 90 573
SME retail (including SME retail secured by residential mortgages) 38 115
Specialised lending 25 704
Total corporate including SME and specialised lending 348 2,105
Sovereign - 5
Bank - 138
Residential mortgage (excluding SME retail secured by residential mortgages) 125 1,125
Qualifying revolving retail 283 527
Other retail 334 553
Total AIRB and specialised lending portfolios 1,090 4,453
30 June 2018
Actual losses may differ from modelled regulatory EL for a
number of reasons.
Actual losses (whether from standardised or AIRB portfolios)
are historical and are based on the quality of impaired assets
in prior periods, full or partial write-offs, and more recent
economic conditions. Actual losses are expected to be below
the regulatory EL estimate in most years.
Regulatory EL measures economic loss at a point in time and
includes costs (such as internal costs) not included in actual
losses. Regulatory EL is calculated on non-defaulted and
defaulted AIRB exposures using long-run PDs and downturn
LGDs for non-defaulted exposures, and the Best Estimate of
Expected Loss (BEEL) for defaulted exposures.
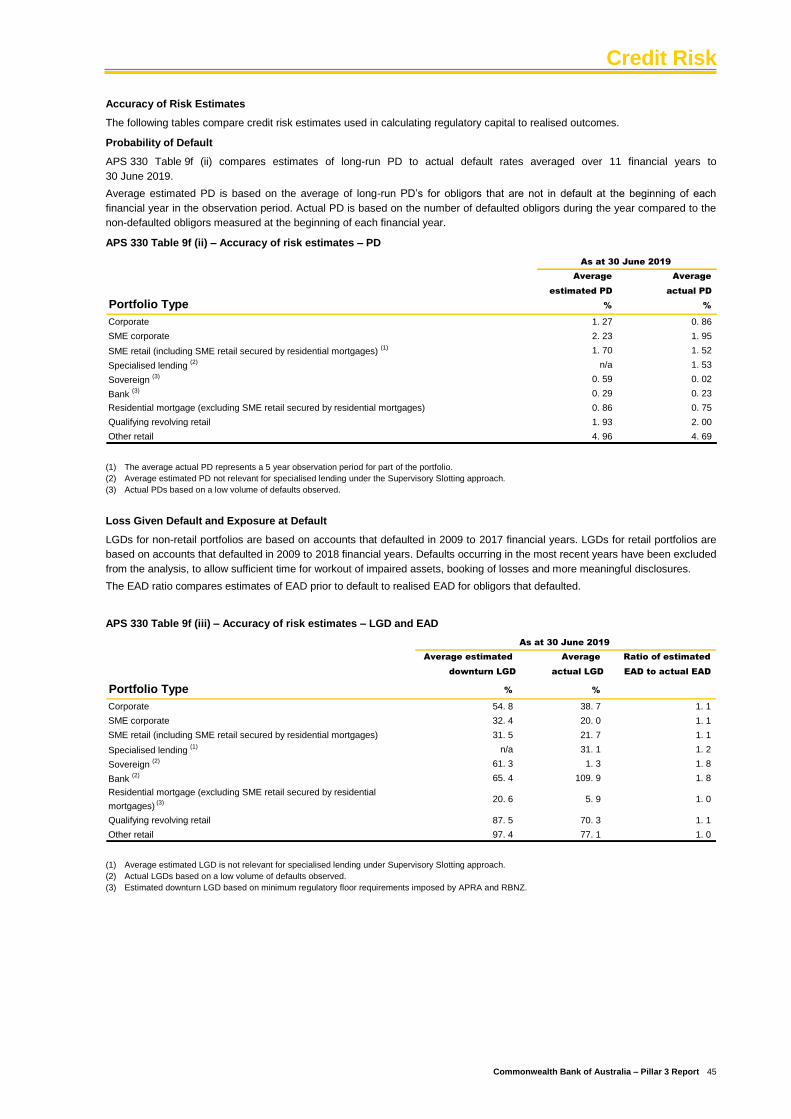
Credit Risk
Commonwealth Bank of Australia – Pillar 3 Report 45
Accuracy of Risk Estimates
The following tables compare credit risk estimates used in calculating regulatory capital to realised outcomes.
Probability of Default
APS 330 Table 9f (ii) compares estimates of long-run PD to actual default rates averaged over 11 financial years to
30 June 2019.
Average estimated PD is based on the average of long-run PD’s for obligors that are not in default at the beginning of each
financial year in the observation period. Actual PD is based on the number of defaulted obligors during the year compared to the
non-defaulted obligors measured at the beginning of each financial year.
APS 330 Table 9f (ii) – Accuracy of risk estimates – PD
Average Average
estimated PD actual PD
Portfolio Type % %
Corporate 1. 27 0. 86
SME corporate 2. 23 1. 95
SME retail (including SME retail secured by residential mortgages) (1) 1. 70 1. 52
Specialised lending (2) n/a 1. 53
Sovereign (3) 0. 59 0. 02
Bank (3) 0. 29 0. 23
Residential mortgage (excluding SME retail secured by residential mortgages) 0. 86 0. 75
Qualifying revolving retail 1. 93 2. 00
Other retail 4. 96 4. 69
As at 30 June 2019
(1) The average actual PD represents a 5 year observation period for part of the portfolio.
(2) Average estimated PD not relevant for specialised lending under the Supervisory Slotting approach.
(3) Actual PDs based on a low volume of defaults observed.
Loss Given Default and Exposure at Default
LGDs for non-retail portfolios are based on accounts that defaulted in 2009 to 2017 financial years. LGDs for retail portfolios are
based on accounts that defaulted in 2009 to 2018 financial years. Defaults occurring in the most recent years have been excluded
from the analysis, to allow sufficient time for workout of impaired assets, booking of losses and more meaningful disclosures.
The EAD ratio compares estimates of EAD prior to default to realised EAD for obligors that defaulted.
APS 330 Table 9f (iii) – Accuracy of risk estimates – LGD and EAD
Average estimated Average Ratio of estimated
downturn LGD actual LGD EAD to actual EAD
Portfolio Type % %
Corporate 54. 8 38. 7 1. 1
SME corporate 32. 4 20. 0 1. 1
SME retail (including SME retail secured by residential mortgages) 31. 5 21. 7 1. 1
Specialised lending (1) n/a 31. 1 1. 2
Sovereign (2) 61. 3 1. 3 1. 8
Bank (2) 65. 4 109. 9 1. 8
Residential mortgage (excluding SME retail secured by residential
mortgages) (3) 20. 6 5. 9 1. 0
Qualifying revolving retail 87. 5 70. 3 1. 1
Other retail 97. 4 77. 1 1. 0
As at 30 June 2019
(1) Average estimated LGD is not relevant for specialised lending under Supervisory Slotting approach.
(2) Actual LGDs based on a low volume of defaults observed.
(3) Estimated downturn LGD based on minimum regulatory floor requirements imposed by APRA and RBNZ.
Credit Risk
46 Commonwealth Bank of Australia – Pillar 3 Report
8.5 Credit Risk Mitigation
Collateral
The Group has policies and procedures in place setting out
the acceptable collateral for mitigating credit risk. These
include valuation parameters, review frequency and
independence of valuation. The Chief Credit Officer (or
delegate) is responsible for approving acceptable collateral
types.
The collateral type, value, liquidity, realisation costs, security
lending margin and loss experience are key determinants of
the LGD percentage that is assigned to a credit risk exposure.
Collateral held for any credit facility is valued, recorded and
controlled as follows:
Real Estate Collateral
Real estate collateral values can only be used for reducing
LGD estimates where the following criteria are met:
Objective market value of collateral - the collateral must
be valued by an independent valuer (or via a valuation
approach approved by the Business Unit CRO or
delegate), at no more than the current fair value under
which the property could be sold via a private contract
between a willing seller and an arm’s length buyer on the
date of valuation;
Revaluation - the value of the collateral should be up-to-
date, which the Group monitors and when appropriate,
updates;
Insurance - steps are taken to ensure that property taken
as collateral is adequately insured against damage or
destruction at origination with documentation requiring
the customer to maintain adequate insurance for the life
of the credit exposure;
Prior claim - other parties may have senior claims to the
Group on an asset offered for collateral. For example,
council rates and land tax usually benefit from specific
legal protection. The impact of such claims needs to be
considered when assessing collateral values; and
Environment - the risk of environmental liability arising in
respect of the collateral must be appropriately assessed,
monitored and where appropriate, reflected in the
valuation of collateral.
Home loans are generally secured by mortgages over
borrowers’ residential properties. In limited circumstances,
collateral in the form of cash or commercial property may be
provided in addition to residential property. With the exception
of some relatively small portfolios, for loans with a Loan to
Valuation ratio (LVR) of higher than 80% either a Low Deposit
Premium or margin is levied, or Lender’s Mortgage Insurance
(LMI) is taken out to protect the Group by covering the
difference between the principal amount plus interest owing
and the net amount received from selling the collateral upon
default.
Non-Real Estate Collateral
Non-real estate collateral values are only used for reducing
LGD estimates where there is a sound process for
determining the value of the collateral. Monitoring processes
appropriate for the exposure and the collateral type are
required to be in place. The main non-real estate collateral
types include:
Cash (usually in the form of a charge over a term
deposit) and other liquid assets (e.g. bonds, shares,
investment funds);
Fixed or floating charges over a company’s assets,
including stock, debtors and work in progress; and
A charge over assets being financed (e.g. vehicles,
equipment).
Where financial collateral is highly correlated with the
counterparty exposure that it is used to secure (wrong way
risk), policy specifies that no risk reduction can be taken for
the collateral held.
Other - Including Credit Default Swaps and Guarantees
The Group mitigates its credit exposure by entering into
master netting arrangements with counterparties with which it
undertakes a significant volume of transactions. Counterparty
credit risk is reduced by a master netting arrangement to the
extent that if an event of default occurs, all amounts with the
counterparty are terminated and settled on a net basis.
The Group mitigates its counterparty credit risk exposure from
dealing in Global Markets type products through the use of
Credit Support Annexes (CSAs) and clearing of eligible trades
with Central Counterparties (CCPs). CSAs require the
counterparty (or the Group) to post collateral when Mark-to-
Market positions exceed agreed threshold and minimum
transfer amounts.
Other forms of credit risk mitigation used to either reduce or
transfer credit risk include purchasing credit derivatives (e.g.
credit default swaps) and/or guarantees from highly rated
banks or corporates. To be an eligible mitigant, the credit
derivative or guarantee must be contractually binding, have
legal certainty and be non-cancellable. APS 330 Table 10b
and 10c (page 47) discloses the Group’s coverage of
exposure by credit default swaps and guarantees.
Portfolio Management
The Group applies a Board-approved Large Credit Exposure
Policy (LCEP). This policy governs the authority of
management with regard to the amount of credit provided to
any single counterparty, or group of related counterparties (as
determined by applying Aggregation Policy) within the risk-
rated segment.
The objective of the LCEP is to limit the risk of catastrophic
loss to the Group through over-exposure to the failure of a
single obligor, or group of related counterparties. The LCEP is
reviewed annually.
Usage of LCEP limits is determined at both individual
counterparty and group of related counterparty levels. Limits
are tiered by counterparty type, PD Rating, security cover and
facility maturity.
Management reports to the Executive Risk Committee and
the Risk Committee each quarter, on a total credit risk
exposure basis:
All exposures at, or greater than, the LCEP limits,
including those resulting from term extension, PD or
security cover deterioration; and
All exposures ceasing to exceed LCEP limits since the
last report.
All relevant borrower specific credit submissions prominently
display relative compliance with the LCEP.
Credit risk concentration limits are in place to ensure portfolio
diversification and prevent over concentration to industries or
countries. Geographic dispersion monitoring within Australia
and New Zealand is also conducted for some larger sub-
portfolios. Periodic stress tests of major credit risk
concentrations are conducted to identify potential changes in
market conditions such as changes in interest rates,
droughts, etc. that could adversely impact the credit portfolio’s
performance. Action is taken where necessary to reduce the
volatility of losses.
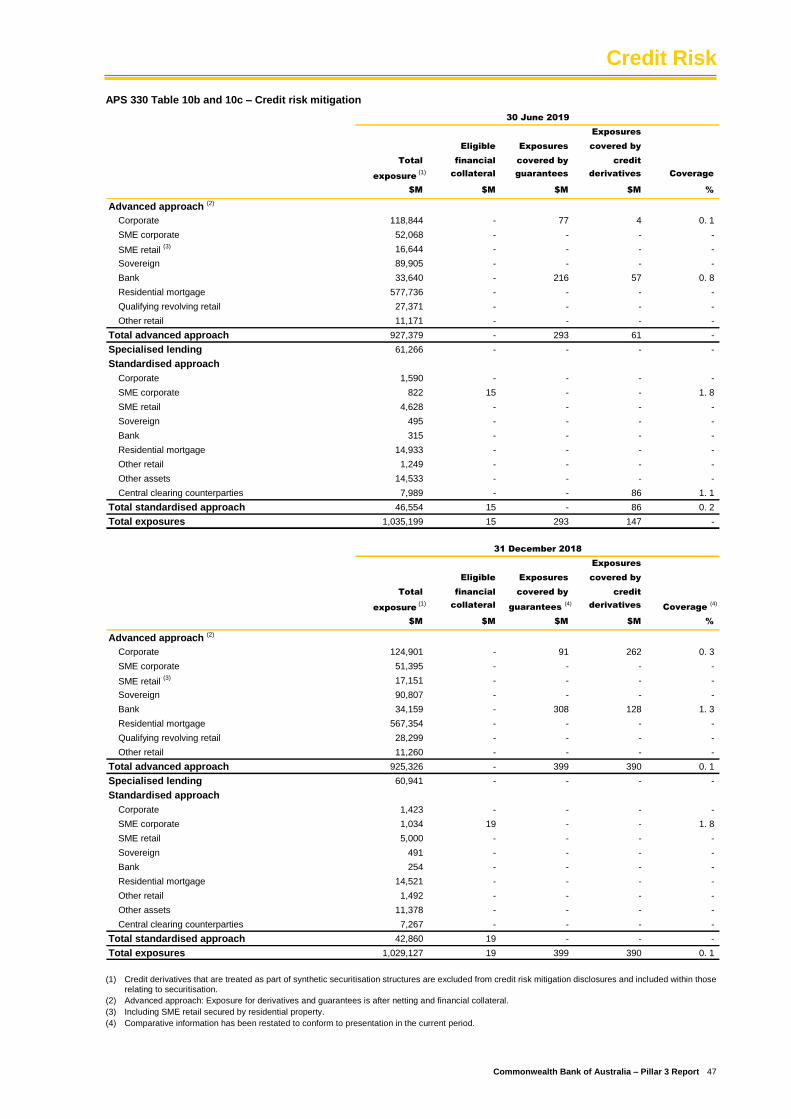
Credit Risk
Commonwealth Bank of Australia – Pillar 3 Report 47
APS 330 Table 10b and 10c – Credit risk mitigation
Exposures
Eligible Exposures covered by
Total financial covered by credit
exposure (1) collateral guarantees derivatives Coverage
$M $M $M $M %
Advanced approach (2)
Corporate 118,844 - 77 4 0. 1
SME corporate 52,068 - - - -
SME retail (3) 16,644 - - - -
Sovereign 89,905 - - - -
Bank 33,640 - 216 57 0. 8
Residential mortgage 577,736 - - - -
Qualifying revolving retail 27,371 - - - -
Other retail 11,171 - - - -
Total advanced approach 927,379 - 293 61 -
Specialised lending 61,266 - - - -
Standardised approach
Corporate 1,590 - - - -
SME corporate 822 15 - - 1. 8
SME retail 4,628 - - - -
Sovereign 495 - - - -
Bank 315 - - - -
Residential mortgage 14,933 - - - -
Other retail 1,249 - - - -
Other assets 14,533 - - - -
Central clearing counterparties 7,989 - - 86 1. 1
Total standardised approach 46,554 15 - 86 0. 2
Total exposures 1,035,199 15 293 147 -
30 June 2019
Exposures
Eligible Exposures covered by
Total financial covered by credit
exposure (1) collateral guarantees
(4)derivatives Coverage
(4)
$M $M $M $M %
Advanced approach (2)
Corporate 124,901 - 91 262 0. 3
SME corporate 51,395 - - - -
SME retail (3) 17,151 - - - -
Sovereign 90,807 - - - -
Bank 34,159 - 308 128 1. 3
Residential mortgage 567,354 - - - -
Qualifying revolving retail 28,299 - - - -
Other retail 11,260 - - - -
Total advanced approach 925,326 - 399 390 0. 1
Specialised lending 60,941 - - - -
Standardised approach
Corporate 1,423 - - - -
SME corporate 1,034 19 - - 1. 8
SME retail 5,000 - - - -
Sovereign 491 - - - -
Bank 254 - - - -
Residential mortgage 14,521 - - - -
Other retail 1,492 - - - -
Other assets 11,378 - - - -
Central clearing counterparties 7,267 - - - -
Total standardised approach 42,860 19 - - -
Total exposures 1,029,127 19 399 390 0. 1
31 December 2018
(1) Credit derivatives that are treated as part of synthetic securitisation structures are excluded from credit risk mitigation disclosures and included within those
relating to securitisation.
(2) Advanced approach: Exposure for derivatives and guarantees is after netting and financial collateral.
(3) Including SME retail secured by residential property.
(4) Comparative information has been restated to conform to presentation in the current period.
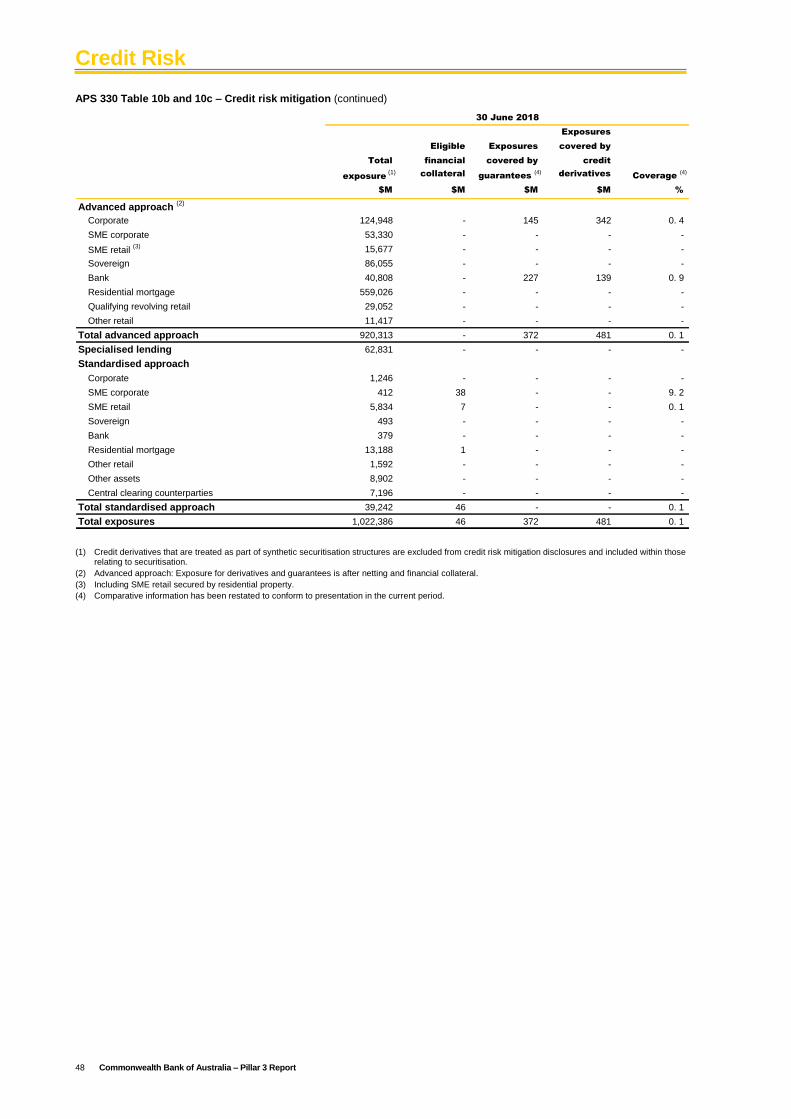
Credit Risk
48 Commonwealth Bank of Australia – Pillar 3 Report
APS 330 Table 10b and 10c – Credit risk mitigation (continued)
Exposures
Eligible Exposures covered by
Total financial covered by credit
exposure (1) collateral guarantees
(4)derivatives Coverage
(4)
$M $M $M $M %
Advanced approach (2)
Corporate 124,948 - 145 342 0. 4
SME corporate 53,330 - - - -
SME retail (3) 15,677 - - - -
Sovereign 86,055 - - - -
Bank 40,808 - 227 139 0. 9
Residential mortgage 559,026 - - - -
Qualifying revolving retail 29,052 - - - -
Other retail 11,417 - - - -
Total advanced approach 920,313 - 372 481 0. 1
Specialised lending 62,831 - - - -
Standardised approach
Corporate 1,246 - - - -
SME corporate 412 38 - - 9. 2
SME retail 5,834 7 - - 0. 1
Sovereign 493 - - - -
Bank 379 - - - -
Residential mortgage 13,188 1 - - -
Other retail 1,592 - - - -
Other assets 8,902 - - - -
Central clearing counterparties 7,196 - - - -
Total standardised approach 39,242 46 - - 0. 1
Total exposures 1,022,386 46 372 481 0. 1
30 June 2018
(1) Credit derivatives that are treated as part of synthetic securitisation structures are excluded from credit risk mitigation disclosures and included within those
relating to securitisation.
(2) Advanced approach: Exposure for derivatives and guarantees is after netting and financial collateral.
(3) Including SME retail secured by residential property.
(4) Comparative information has been restated to conform to presentation in the current period.
Credit Risk
Commonwealth Bank of Australia – Pillar 3 Report 49
8.6 Counterparty Credit Risk
Counterparty Credit Risk (CCR) is the risk that the
counterparty to a transaction could default before the final
settlement of the transaction's cash flows. An economic loss
would occur if the transactions or a portfolio of transactions
with the counterparty has a positive economic value for the
Group at the time of default. Unlike an exposure to credit risk
through a loan, where the exposure to credit risk is unilateral
and only the lending bank faces the risk of loss, CCR creates
a bilateral risk of loss whereby the market value for many
different types of transactions can be positive or negative to
either counterparty. The market value is uncertain and can
vary over time with the movement of underlying market
factors.
Capital is allocated to CCR exposures after taking into
account the risk-rating and expected exposure to the
counterparty, and correlations and diversification impacts
across risk types.
CCR is controlled through a variety of credit policies and
procedures including, but not limited, to the following:
Large Credit Exposure Policy;
Country Risk Exposure Policy;
Aggregation Policy;
Netting Policy;
Collaterisation of Derivative Transactions Policy;
Wrong Way risk Policy; and
Specific product policies.
Wrong-way risk is a risk associated with CCR. There are two
types of wrong-way risk, general and specific. General wrong-
way risk arises when the PD of counterparties is positively
correlated with general market risk factors. Specific wrong-
way risk arises when the exposure to a particular
counterparty and the PD of the counterparty providing credit
risk mitigation for the exposure are highly correlated.
Specific wrong-way risk is controlled through not recognising
any risk reduction from credit risk mitigation provided by
highly correlated counterparties. General wrong way risk is
monitored through the Group’s stress testing activities and is
controlled via the Group’s policies that manage industry,
country and individual counterparty concentrations.
Credit Support Annexes (CSAs) are used with some large
corporates and most bank and non-bank financial institution
counterparties to collateralise CCR for Global Markets
products. The use of CSAs is governed by the Collaterisation
of Derivative Transactions Policy and Netting Policies. CSAs
lower the wrong-way risk that arises from market movements
by requiring the counterparty (or the Group) to post collateral
to cover mark-to-market values that might be owed upon a
counterparty default.
Aggregate threshold and minimum transfer amounts, are the
amounts by which the counterparty (or the Bank) can be out
of the money before they may be obliged to post collateral. In
approximately 8% of ISDA Master Agreements and CSAs
these amounts vary depending on the counterparty’s long-
term debt rating. In the remaining agreements the amounts
are fixed. Generally, a counterparty’s rating is considered in
determining its Threshold and Minimum Transfer amount. A
trend to lower thresholds has been observed since the Global
Financial Crisis. This trend will continue in line with regulatory
change.
Risk Managers provide sign-off on terms of the CSA prior to
the documentation being executed. Upon execution of a CSA
with a counterparty, all relevant threshold levels are input into
the collateral management system.
Collateral stress testing is used to determine the effect that a
rating downgrade would have on the Group’s collateral
obligation to its counterparties.
As at 30 June 2019, the maximum additional collateral that
could be posted to other counterparties based on the Group’s
current rating is $71.1 million. As at 30 June 2019, a unilateral
one-notch and two-notch downgrade in the Group’s rating
would have resulted in a further $50.2 million and $158 million
of collateral being posted to other counterparties respectively.
Collateral stress tests are also conducted on the Group’s
counterparties so that it can monitor for likely collateral
stresses in the event of a counterparty downgrade.
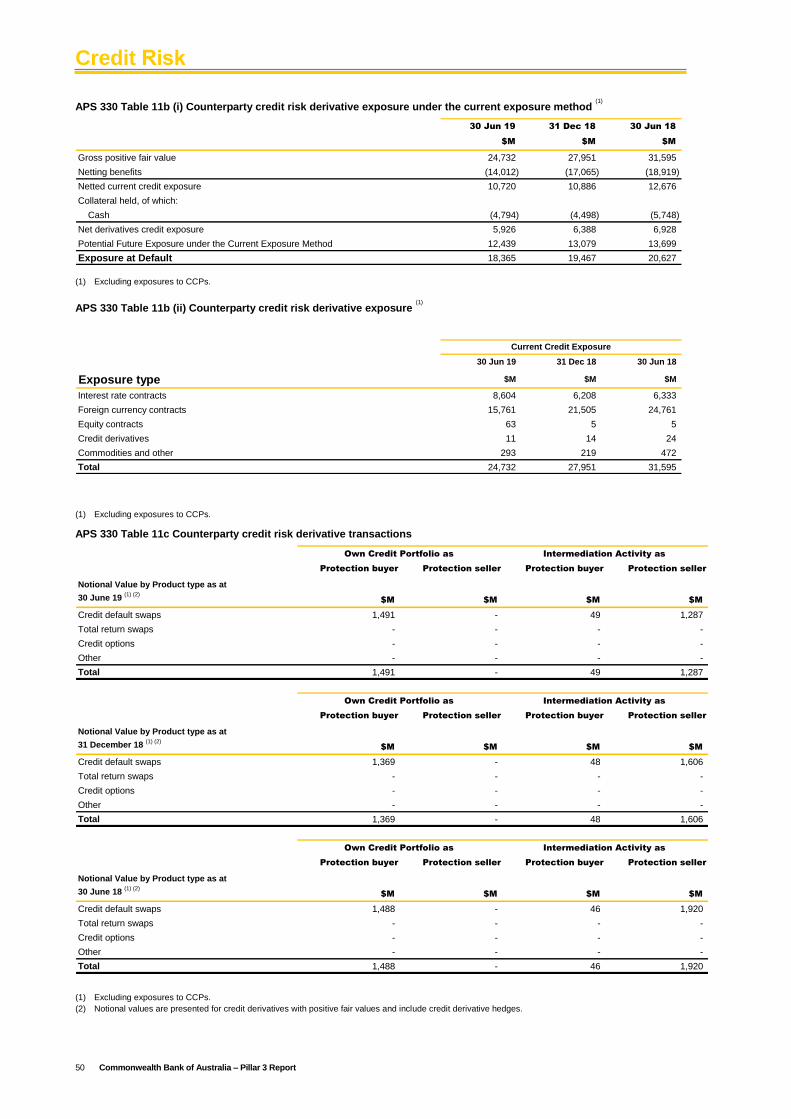
Credit Risk
50 Commonwealth Bank of Australia – Pillar 3 Report
APS 330 Table 11b (i) Counterparty credit risk derivative exposure under the current exposure method (1)
30 Jun 19 31 Dec 18 30 Jun 18
$M $M $M
Gross positive fair value 24,732 27,951 31,595
Netting benefits (14,012) (17,065) (18,919)
Netted current credit exposure 10,720 10,886 12,676
Collateral held, of which:
Cash (4,794) (4,498) (5,748)
Net derivatives credit exposure 5,926 6,388 6,928
Potential Future Exposure under the Current Exposure Method 12,439 13,079 13,699
Exposure at Default 18,365 19,467 20,627
(1) Excluding exposures to CCPs.
APS 330 Table 11b (ii) Counterparty credit risk derivative exposure (1)
30 Jun 19 31 Dec 18 30 Jun 18
Exposure type $M $M $M
Interest rate contracts 8,604 6,208 6,333
Foreign currency contracts 15,761 21,505 24,761
Equity contracts 63 5 5
Credit derivatives 11 14 24
Commodities and other 293 219 472
Total 24,732 27,951 31,595
Current Credit Exposure
(1) Excluding exposures to CCPs.
APS 330 Table 11c Counterparty credit risk derivative transactions
Protection buyer Protection seller Protection buyer Protection seller
Notional Value by Product type as at
30 June 19 (1) (2)
$M $M $M $M
Credit default swaps 1,491 - 49 1,287
Total return swaps - - - -
Credit options - - - -
Other - - - -
Total 1,491 - 49 1,287
Own Credit Portfolio as Intermediation Activity as
Protection buyer Protection seller Protection buyer Protection seller
Notional Value by Product type as at
31 December 18 (1) (2)
$M $M $M $M
Credit default swaps 1,369 - 48 1,606
Total return swaps - - - -
Credit options - - - -
Other - - - -
Total 1,369 - 48 1,606
Own Credit Portfolio as Intermediation Activity as
Protection buyer Protection seller Protection buyer Protection seller
Notional Value by Product type as at
30 June 18 (1) (2)
$M $M $M $M
Credit default swaps 1,488 - 46 1,920
Total return swaps - - - -
Credit options - - - -
Other - - - -
Total 1,488 - 46 1,920
Own Credit Portfolio as Intermediation Activity as
(1) Excluding exposures to CCPs.
(2) Notional values are presented for credit derivatives with positive fair values and include credit derivative hedges.
Credit Risk
Commonwealth Bank of Australia – Pillar 3 Report 51
8.7 Securitisation
Securitisation is defined as a structure where the cash flow
from a pool of assets is used to service obligations to at least
two different tranches or classes of creditors (typically holders
of debt securities), with each class or tranche reflecting a
different degree of credit risk (i.e. one class of creditor is
entitled to receive payments from the pool before another
class of creditors).
Securitisations may be categorised as either:
Traditional securitisations - a securitisation where the pool is
transferred (or assigned) to, and held by, or otherwise held
directly in its name by, an SPV; or
Synthetic securitisation - a securitisation whereby the credit
risk, or part of the credit risk, of a pool is transferred to a third
party which need not be an SPV. The transfer of credit risk
can be undertaken through the use of funded (e.g. credit
linked notes) or unfunded (e.g. credit default swaps) credit
derivatives or guarantees.
Securitisation Activities
The Group is involved in the following types of business
activities that give rise to securitisation exposures:
Group originated securitisations – where the Group
equitably assigns home loans it has originated to a SPV,
which in turn raises wholesale funding by the issuance of
notes to external investors. The Medallion Programme is
the Group’s securitisation program of CBA and ASB
originated residential mortgage loans, and the Swan
Programme is the Group’s securitisation program of
Bankwest originated residential mortgage loans. CBA
has also established an internal securitisation where
CBA retains all the notes issued to use as collateral to
raise contingent liquidity from the Reserve Bank of
Australia (RBA);
Third-party securitisations – where assets are originated
by parties other than the Group. Such transactions
usually have added layers of credit protection, whether it
is lender’s mortgage insurance, over-collateralisation,
cash reserves and/or other subordinated credit support.
The nature of the underlying assets is similar to those
that the Group would normally support in a non-
securitised form including residential and commercial
mortgages, personal loans, revolving credit exposures,
and vehicle loans and equipment financing. The Group
acts as a funder/note holder;
The purchase of asset/mortgage backed securities for
trading or portfolio investment; and
The provision of interest rate swaps, cross-currency
swaps and/or liquidity support facilities to an external
SPV where the Group may be the arranger, lead
manager and/or originator of the respective securities or
underlying assets.
For contingent liquidity, the Group manages a $56 billion
RMBS portfolio which is not intended to be issued publicly.
These notes will be held by the Group and the senior notes, if
required, can be used for repurchase agreements with the
RBA to generate additional liquidity for the Group. These
RMBS are eligible collateral for repurchase agreements with
the RBA.
Strategic Issues
For the Group, securitisation has provided and will continue to
provide a source of liquidity through RBA repurchase
transactions and an opportunistic rather than core external
funding source. The Group, when undertaking an
intermediary role for third-party securitisations, receives fee-
based income and collateral business in other banking
products.
Regulatory Compliance
APRA’s requirements in managing the capital and risks
associated with securitisation activities and exposures are set
out in APRA’s Prudential Standard APS 120 “Securitisation”
(APS 120) and Prudential Practice Guide APG 120
“Securitisation”. To be compliant with the standard the Group
has policies and procedures that include:
Appropriate risk management systems to identify,
measure, monitor and manage the risks arising from the
Group’s involvement in securitisation;
Monitoring the effects of securitisation on its risk profile,
including credit quality, and how it has aligned with its
risk management practices; and
Measures to ensure that it is not providing implicit
support for a securitisation.
The Group’s securitisation activities also need to comply with
other prudential standards applicable to any traded or
Balance Sheet exposure.
The Group uses a hierarchy detailed in APS 120 to determine
the credit rating grade for regulatory capital purposes. The
two approaches the Group uses are the Ratings-Based
Approach or the Supervisory Formula Approach (SFA).
Credit Risk
52 Commonwealth Bank of Australia – Pillar 3 Report
Securitisation Risk Management Framework
Risk Assessment
Securitisation activities expose the Group to risks including
liquidity risk, market risk, operational risk and credit risk,
which are managed in accordance with the Group’s
respective risk management frameworks. Where the Group
arranges either a Group-originated or third-party securitisation
transaction, the capital markets issuance will be rated by at
least one ECAI based on their respective rating models. The
Group uses recognised ECAI including S&P Global Ratings,
Moody’s Investors Service and/or Fitch Ratings for both
Group-originated and third-party securitisation transactions.
The Group undertakes credit assessment on all securitisation
transactions. In addition to compliance with the securitisation
and other prudential standards, credit risk assessment of
securitisation exposures is performed in accordance with the
Group’s policies and procedures.
The risk assessment takes into account a wide range of
credit, reputation, origination, concentration and servicing
factors related to the underlying portfolio of assets being
securitised in addition to the capital structure of the proposed
securitisation SPV.
Where a securitisation exposure is held through a warehouse
structure prior to terming out via the debt capital markets, the
credit ratings of the warehouse facility are also assessed by
the Group using the rating methodologies of the ECAI and/or
other models accepted by APRA.
Credit Approval
Credit approval authorities relating to securitisation are
restricted to officers with appropriately badged delegations.
Risk Management’s Institutional Banking and Markets team is
responsible for approval and limit management and
monitoring for all securitisations. Proposed exposures that
exceed individual approval authorities are referred to various
credit committees of the Group for decisioning.
Each Group-originated or third-party transaction is led by a
Deal Team leader who is responsible for the deal origination
and its compliance with Group policies and prudential
standards.
Exposure Reporting and Monitoring
All securitisation exposures and limits are recorded on
appropriate risk systems and monitored for limit and capital
compliance.
Where exposures are fair valued for accounting purposes, the
transactions are monitored under the Group’s market risk
management framework (refer section 10, page 65). This
includes a limit framework and monitoring around the size
and turnover of such exposures, and a robust independent
price validation process conducted on the prices used to
value those exposures. All securitisation limits and exposures
are reviewed in accordance with the Group’s approved risk
management framework which in turn is subject to periodic
internal (internal audits and reviews) and external reviews
(conducted by external audit and APRA). At a minimum, the
following reviews are undertaken:
Externally-rated exposures:
External ratings are reviewed on a weekly basis via a
report that tracks rating changes; and
The underlying pool and transaction performance is
reviewed monthly via an internally produced report and/
or reports provided by issuers.
The Group has no exposure to resecuritisation transactions.
Third-party unrated client securitisation exposures:
The Bank receives periodic and detailed pool
performance data from the issuer/trust manager. The
pool performance data reports are extracted and
reviewed for changes in underlying pool quality;
Dynamic models are run monthly to determine the
required credit support; and
Formal credit reviews are conducted at least annually for
all third-party client exposures.
Group-originated securitisation program exposures:
Formal reviews are conducted at least annually for all
Medallion and Swan exposures; and
The Bank receives the monthly Investor reports and
underlying pool data.
Exposure Aggregation
Securitisation SPVs are bankruptcy remote entities.
Generally, there is no legally enforceable obligation on the
asset originator or issuer to provide ongoing credit support to
such transactions and they are mostly not aggregated for
either Group Large Credit Exposure Policy or APRA
prudential standard compliance. Aggregation is assessed on
a case by case basis having regard to the proposed structure.
The Group will aggregate, where appropriate, the broader
banking exposures to the proposed originator and/or issuing
entities in making its determinations.
Group-Originated Securitisations
General Principles
Where the Group intends to securitise assets it has
originated, it ensures the terms and conditions applicable to
the proposed securitisation and any support facilities or
dealings are arm’s length and market based and compliant
with APRA’s prudential regulations. These transactions are
managed by the Group’s Treasury.
Where the Group has sold assets to a SPV but retains a
servicer role in managing those assets on behalf of the SPV
the Group ensures those securitised assets are effectively
ring-fenced from the Group’s own assets. Where the Group or
its subsidiary provides support services such as servicing to
the SPV, these need to be subject to arm’s length, market
based terms and be of an equivalent standard available in the
market.
Purchase of Securities issued under Group-Originated Securitisation
Any purchases of either securities issued by an SPV or
assets of an SPV must be arm’s length in nature and
approved under the Group’s credit approval process. No
pre-existing obligation to purchase public securities or the
underlying assets of the SPV exists. The Group’s SPVs under
the Medallion and Swan programs are consolidated for
accounting purposes. As at 30 June 2019 the Group achieved
capital relief for $5.1 billion of assets in externally issued
RMBS with $8.6 billion not achieving capital relief.
The Group holds less than 20% (excepting permitted
underwritings as per APS 120) of the public securities
outstanding issued by an SPV for Group-originated
securitisations.
The aggregated value of all securities held by the Group
under its various public Medallion and Swan programs does
not exceed 10% of the Group’s Level 2 capital (excepting
permitted security underwritings as per APS 120).
Credit Risk
Commonwealth Bank of Australia – Pillar 3 Report 53
Summary of Accounting Policies
Securitisations may, depending on the individual
arrangement, result in: continued recognition of the
securitised assets on the Balance Sheet of the Group;
continued recognition of the assets to the extent of the
Group’s continuing involvement in those assets (as defined
within AASB 9 “Financial Instruments” (AASB 9); or
derecognition of the assets and the separate recognition, as
assets or liabilities, of any rights and obligations created or
retained in the transfer of assets to the securitisation vehicle.
A securitisation transaction is first assessed for any potential
requirement to consolidate the vehicles used.
The assessment is made considering the requirements of
AASB 10 “Consolidated Financial Statements” (AASB 10).
AASB 10 introduces control as the single basis for
consolidation for all entities, regardless of the nature of the
investee. The Group exercises judgement at inception and
periodically, to assess whether a structured entity should be
consolidated based on the Bank’s power over the relevant
activities of the entity and the significance of its exposure to
variable returns of the structured entity.
For the Group’s accounting policy on the derecognition of
financial assets and financial liabilities and the measurement
of any retained interests, refer to the 2019 Annual Report.
The valuation process of any retained interests in
securitisation exposures primarily focuses on quotations from
third parties and calibrated valuations from market standard
models with key inputs such as spreads to discount rates,
default and recovery rates that may be observable or
unobservable. This process did not change in 2019.
Assets are valued according to the normal methods
appropriate to the asset class. As at 30 June 2019 and
31 December 2018, the Group had no assets awaiting
securitisation.
The Group discloses all contractual commitments, such as
liquidity lines, and applies the accounting policies as set out in
the Group’s 2019 Annual Report. The Group provides support
for securitisation transactions to the extent of those
contractual obligations.
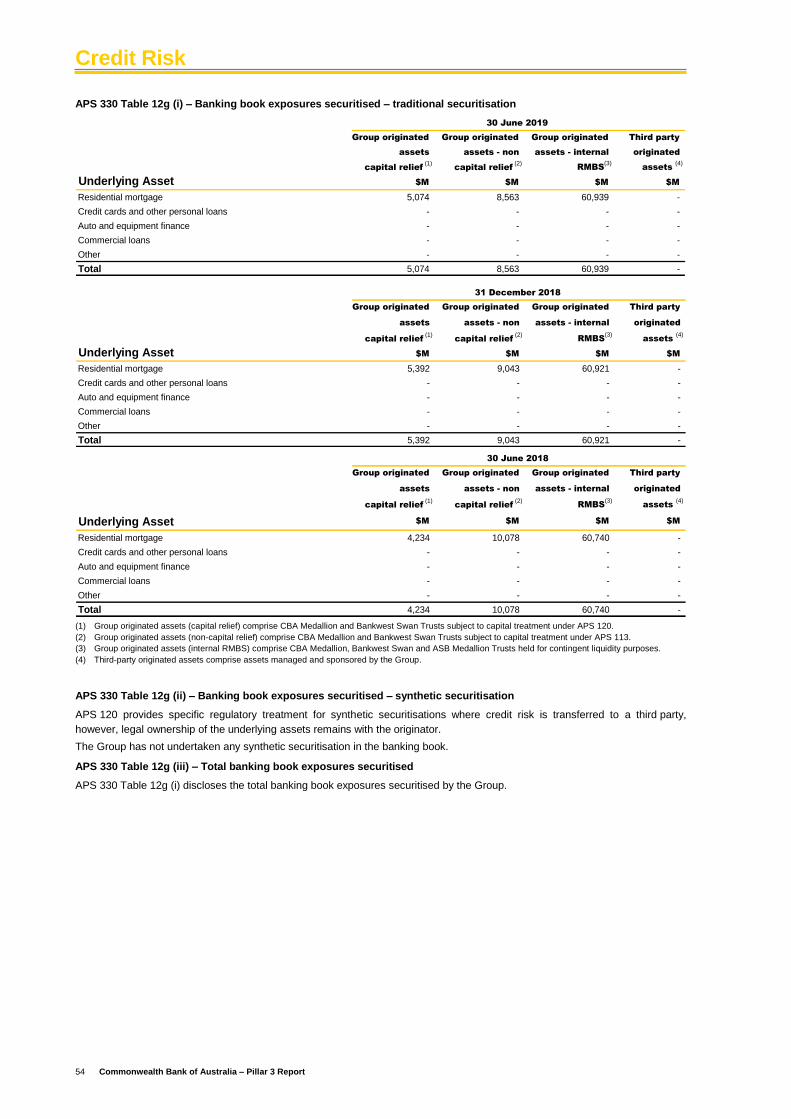
Credit Risk
54 Commonwealth Bank of Australia – Pillar 3 Report
APS 330 Table 12g (i) – Banking book exposures securitised – traditional securitisation
Group originated Group originated Group originated Third party
assets assets - non assets - internal originated
capital relief (1)
capital relief (2)
RMBS(3)
assets (4)
Underlying Asset $M $M $M $M
Residential mortgage 5,074 8,563 60,939 -
Credit cards and other personal loans - - - -
Auto and equipment finance - - - -
Commercial loans - - - -
Other - - - -
Total 5,074 8,563 60,939 -
30 June 2019
Group originated Group originated Group originated Third party
assets assets - non assets - internal originated
capital relief (1)
capital relief (2)
RMBS(3)
assets (4)
Underlying Asset $M $M $M $M
Residential mortgage 5,392 9,043 60,921 -
Credit cards and other personal loans - - - -
Auto and equipment finance - - - -
Commercial loans - - - -
Other - - - -
Total 5,392 9,043 60,921 -
31 December 2018
Group originated Group originated Group originated Third party
assets assets - non assets - internal originated
capital relief (1)
capital relief (2)
RMBS(3)
assets (4)
Underlying Asset $M $M $M $M
Residential mortgage 4,234 10,078 60,740 -
Credit cards and other personal loans - - - -
Auto and equipment finance - - - -
Commercial loans - - - -
Other - - - -
Total 4,234 10,078 60,740 -
30 June 2018
(1) Group originated assets (capital relief) comprise CBA Medallion and Bankwest Swan Trusts subject to capital treatment under APS 120.
(2) Group originated assets (non-capital relief) comprise CBA Medallion and Bankwest Swan Trusts subject to capital treatment under APS 113.
(3) Group originated assets (internal RMBS) comprise CBA Medallion, Bankwest Swan and ASB Medallion Trusts held for contingent liquidity purposes.
(4) Third-party originated assets comprise assets managed and sponsored by the Group.
APS 330 Table 12g (ii) – Banking book exposures securitised – synthetic securitisation
APS 120 provides specific regulatory treatment for synthetic securitisations where credit risk is transferred to a third party,
however, legal ownership of the underlying assets remains with the originator.
The Group has not undertaken any synthetic securitisation in the banking book.
APS 330 Table 12g (iii) – Total banking book exposures securitised
APS 330 Table 12g (i) discloses the total banking book exposures securitised by the Group.
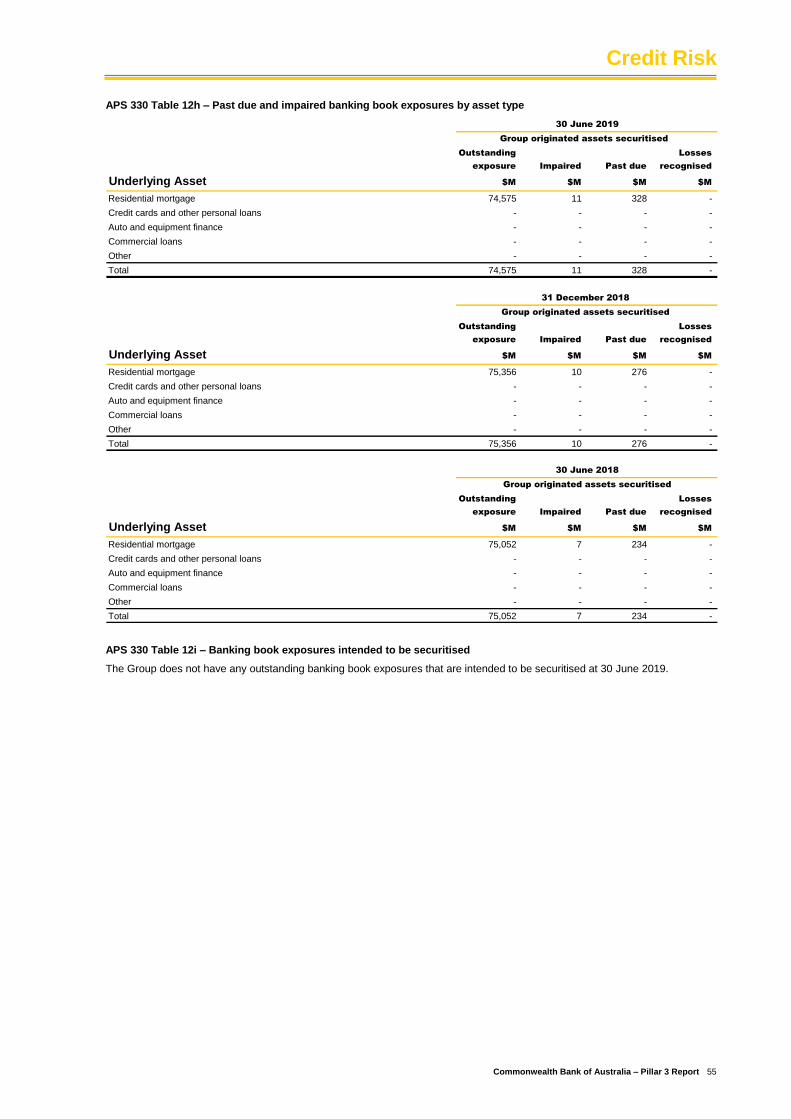
Credit Risk
Commonwealth Bank of Australia – Pillar 3 Report 55
APS 330 Table 12h – Past due and impaired banking book exposures by asset type
Outstanding Losses
exposure Impaired Past due recognised
Underlying Asset $M $M $M $M
Residential mortgage 74,575 11 328 -
Credit cards and other personal loans - - - -
Auto and equipment finance - - - -
Commercial loans - - - -
Other - - - -
Total 74,575 11 328 -
30 June 2019
Group originated assets securitised
Outstanding Losses
exposure Impaired Past due recognised
Underlying Asset $M $M $M $M
Residential mortgage 75,356 10 276 -
Credit cards and other personal loans - - - -
Auto and equipment finance - - - -
Commercial loans - - - -
Other - - - -
Total 75,356 10 276 -
31 December 2018
Group originated assets securitised
Outstanding Losses
exposure Impaired Past due recognised
Underlying Asset $M $M $M $M
Residential mortgage 75,052 7 234 -
Credit cards and other personal loans - - - -
Auto and equipment finance - - - -
Commercial loans - - - -
Other - - - -
Total 75,052 7 234 -
30 June 2018
Group originated assets securitised
APS 330 Table 12i – Banking book exposures intended to be securitised
The Group does not have any outstanding banking book exposures that are intended to be securitised at 30 June 2019.
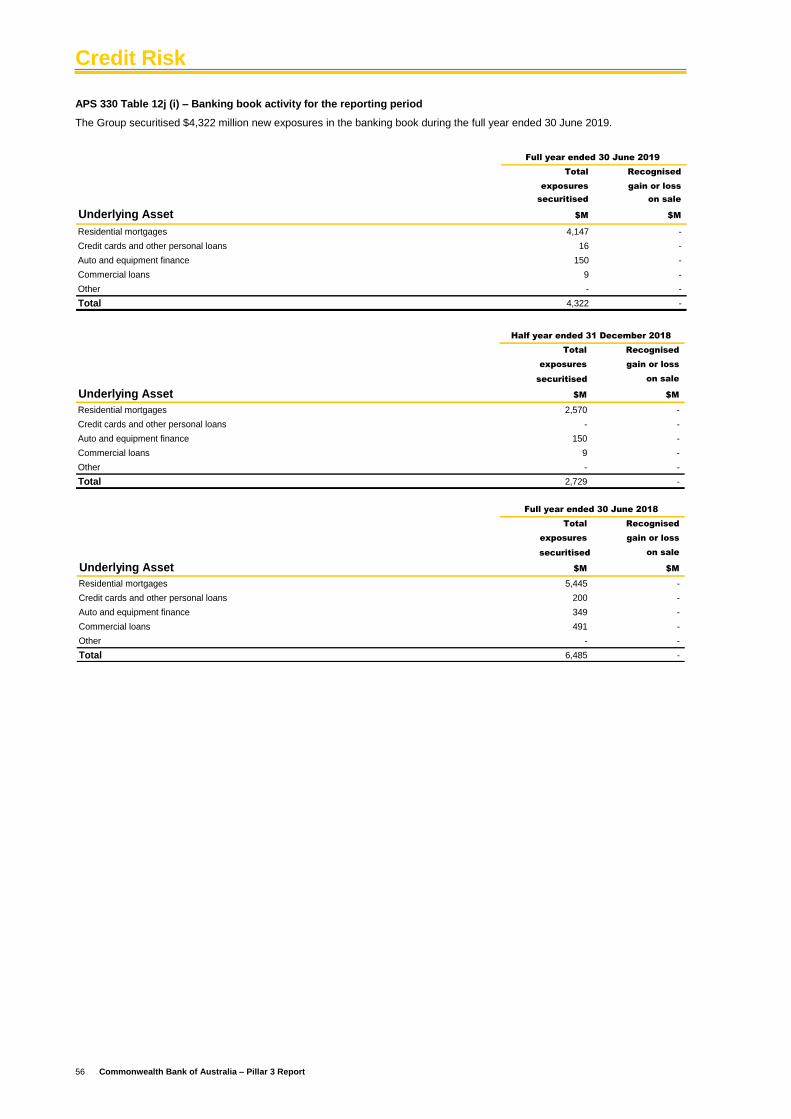
Credit Risk
56 Commonwealth Bank of Australia – Pillar 3 Report
APS 330 Table 12j (i) – Banking book activity for the reporting period
The Group securitised $4,322 million new exposures in the banking book during the full year ended 30 June 2019.
Total Recognised
exposures gain or loss
securitised on sale
Underlying Asset $M $M
Residential mortgages 4,147 -
Credit cards and other personal loans 16 -
Auto and equipment finance 150 -
Commercial loans 9 -
Other - -
Total 4,322 -
Full year ended 30 June 2019
Total Recognised
exposures gain or loss
securitised on sale
Underlying Asset $M $M
Residential mortgages 2,570 -
Credit cards and other personal loans - -
Auto and equipment finance 150 -
Commercial loans 9 -
Other - -
Total 2,729 -
Half year ended 31 December 2018
Total Recognised
exposures gain or loss
securitised on sale
Underlying Asset $M $M
Residential mortgages 5,445 -
Credit cards and other personal loans 200 -
Auto and equipment finance 349 -
Commercial loans 491 -
Other - -
Total 6,485 -
Full year ended 30 June 2018
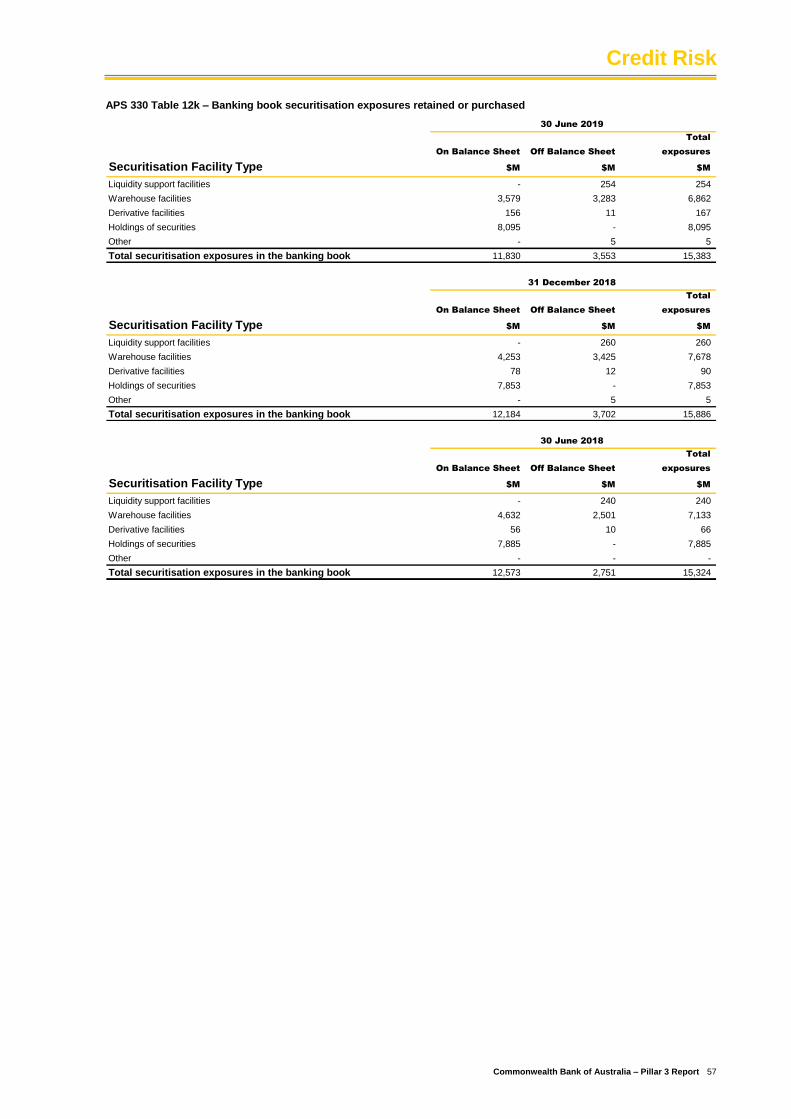
Credit Risk
Commonwealth Bank of Australia – Pillar 3 Report 57
APS 330 Table 12k – Banking book securitisation exposures retained or purchased
Total
On Balance Sheet Off Balance Sheet exposures
Securitisation Facility Type $M $M $M
Liquidity support facilities - 254 254
Warehouse facilities 3,579 3,283 6,862
Derivative facilities 156 11 167
Holdings of securities 8,095 - 8,095
Other - 5 5
Total securitisation exposures in the banking book 11,830 3,553 15,383
30 June 2019
Total
On Balance Sheet Off Balance Sheet exposures
Securitisation Facility Type $M $M $M
Liquidity support facilities - 260 260
Warehouse facilities 4,253 3,425 7,678
Derivative facilities 78 12 90
Holdings of securities 7,853 - 7,853
Other - 5 5
Total securitisation exposures in the banking book 12,184 3,702 15,886
31 December 2018
Total
On Balance Sheet Off Balance Sheet exposures
Securitisation Facility Type $M $M $M
Liquidity support facilities - 240 240
Warehouse facilities 4,632 2,501 7,133
Derivative facilities 56 10 66
Holdings of securities 7,885 - 7,885
Other - - -
Total securitisation exposures in the banking book 12,573 2,751 15,324
30 June 2018
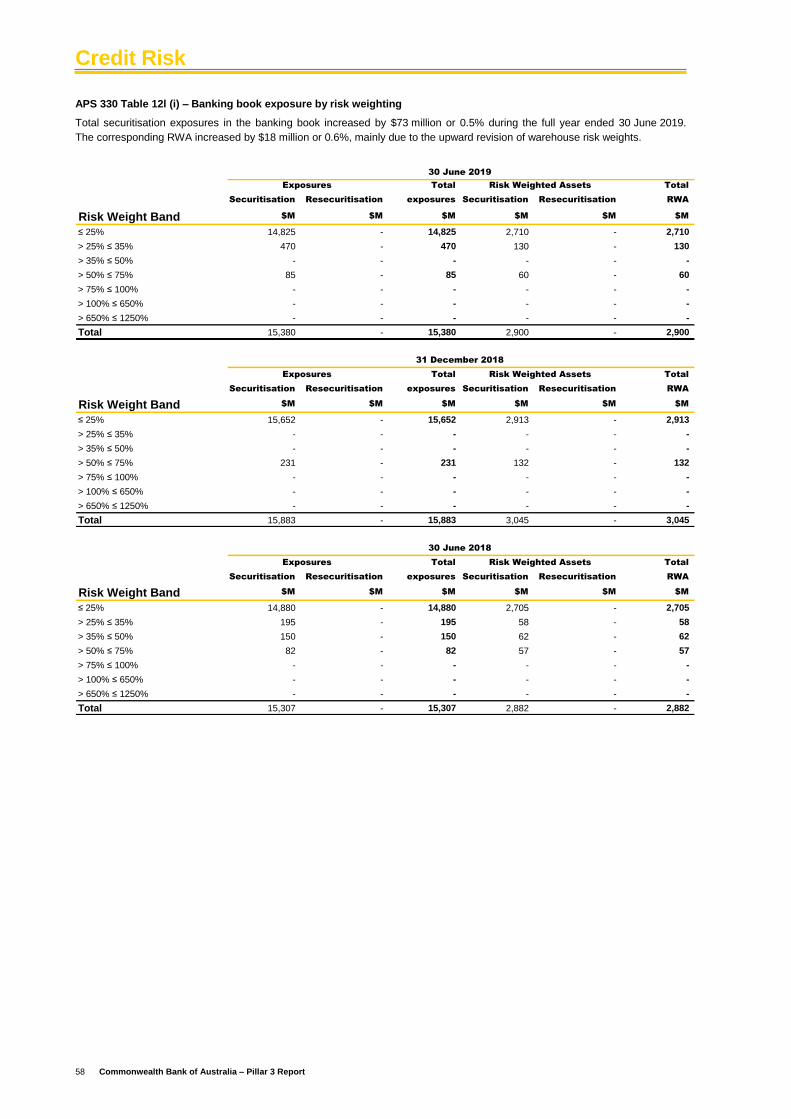
Credit Risk
58 Commonwealth Bank of Australia – Pillar 3 Report
APS 330 Table 12l (i) – Banking book exposure by risk weighting
Total securitisation exposures in the banking book increased by $73 million or 0.5% during the full year ended 30 June 2019.
The corresponding RWA increased by $18 million or 0.6%, mainly due to the upward revision of warehouse risk weights.
Total Total
Securitisation Resecuritisation exposures Securitisation Resecuritisation RWA
Risk Weight Band $M $M $M $M $M $M
≤ 25% 14,825 - 14,825 2,710 - 2,710
> 25% ≤ 35% 470 - 470 130 - 130
> 35% ≤ 50% - - - - - -
> 50% ≤ 75% 85 - 85 60 - 60
> 75% ≤ 100% - - - - - -
> 100% ≤ 650% - - - - - -
> 650% ≤ 1250% - - - - - -
Total 15,380 - 15,380 2,900 - 2,900
Risk Weighted Assets
30 June 2019
Exposures
Total Total
Securitisation Resecuritisation exposures Securitisation Resecuritisation RWA
Risk Weight Band $M $M $M $M $M $M
≤ 25% 15,652 - 15,652 2,913 - 2,913
> 25% ≤ 35% - - - - - -
> 35% ≤ 50% - - - - - -
> 50% ≤ 75% 231 - 231 132 - 132
> 75% ≤ 100% - - - - - -
> 100% ≤ 650% - - - - - -
> 650% ≤ 1250% - - - - - -
Total 15,883 - 15,883 3,045 - 3,045
31 December 2018
Exposures Risk Weighted Assets
Total Total
Securitisation Resecuritisation exposures Securitisation Resecuritisation RWA
Risk Weight Band $M $M $M $M $M $M
≤ 25% 14,880 - 14,880 2,705 - 2,705
> 25% ≤ 35% 195 - 195 58 - 58
> 35% ≤ 50% 150 - 150 62 - 62
> 50% ≤ 75% 82 - 82 57 - 57
> 75% ≤ 100% - - - - - -
> 100% ≤ 650% - - - - - -
> 650% ≤ 1250% - - - - - -
Total 15,307 - 15,307 2,882 - 2,882
Risk Weighted Assets
30 June 2018
Exposures
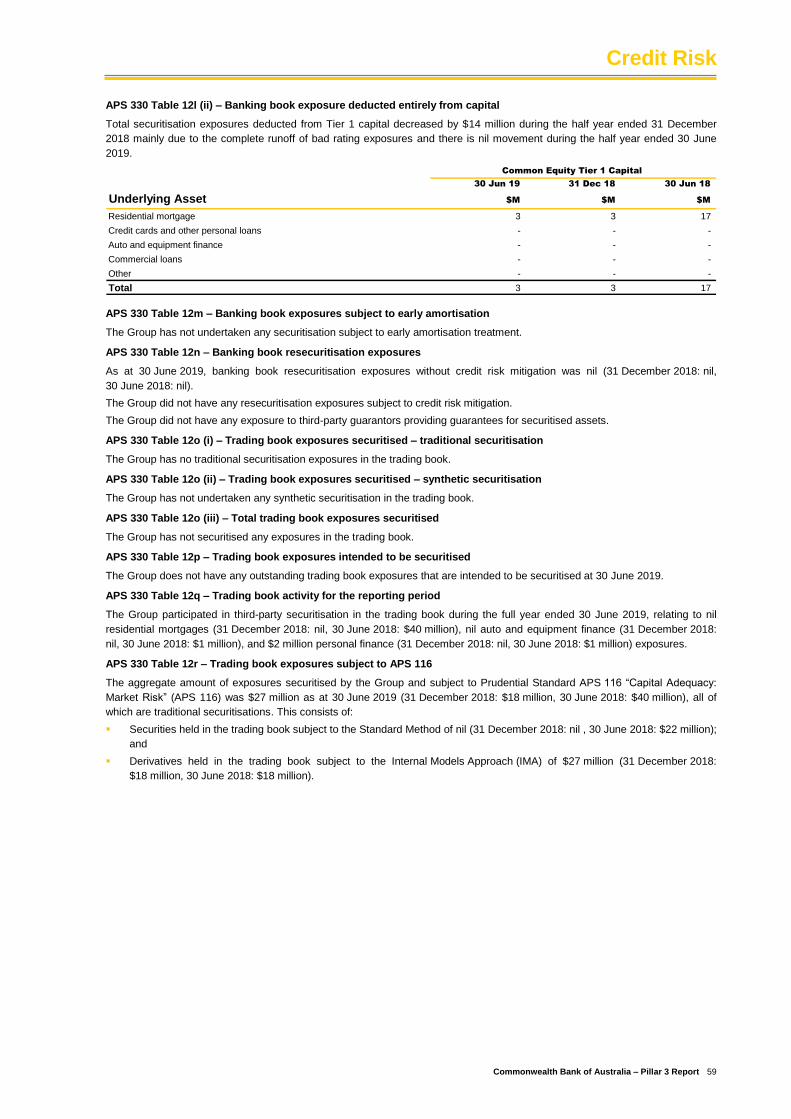
Credit Risk
Commonwealth Bank of Australia – Pillar 3 Report 59
APS 330 Table 12l (ii) – Banking book exposure deducted entirely from capital
Total securitisation exposures deducted from Tier 1 capital decreased by $14 million during the half year ended 31 December
2018 mainly due to the complete runoff of bad rating exposures and there is nil movement during the half year ended 30 June
2019.
30 Jun 19 31 Dec 18 30 Jun 18
Underlying Asset $M $M $M
Residential mortgage 3 3 17
Credit cards and other personal loans - - -
Auto and equipment finance - - -
Commercial loans - - -
Other - - -
Total 3 3 17
Common Equity Tier 1 Capital
APS 330 Table 12m – Banking book exposures subject to early amortisation
The Group has not undertaken any securitisation subject to early amortisation treatment.
APS 330 Table 12n – Banking book resecuritisation exposures
As at 30 June 2019, banking book resecuritisation exposures without credit risk mitigation was nil (31 December 2018: nil,
30 June 2018: nil).
The Group did not have any resecuritisation exposures subject to credit risk mitigation.
The Group did not have any exposure to third-party guarantors providing guarantees for securitised assets.
APS 330 Table 12o (i) – Trading book exposures securitised – traditional securitisation
The Group has no traditional securitisation exposures in the trading book.
APS 330 Table 12o (ii) – Trading book exposures securitised – synthetic securitisation
The Group has not undertaken any synthetic securitisation in the trading book.
APS 330 Table 12o (iii) – Total trading book exposures securitised
The Group has not securitised any exposures in the trading book.
APS 330 Table 12p – Trading book exposures intended to be securitised
The Group does not have any outstanding trading book exposures that are intended to be securitised at 30 June 2019.
APS 330 Table 12q – Trading book activity for the reporting period
The Group participated in third-party securitisation in the trading book during the full year ended 30 June 2019, relating to nil
residential mortgages (31 December 2018: nil, 30 June 2018: $40 million), nil auto and equipment finance (31 December 2018:
nil, 30 June 2018: $1 million), and $2 million personal finance (31 December 2018: nil, 30 June 2018: $1 million) exposures.
APS 330 Table 12r – Trading book exposures subject to APS 116
The aggregate amount of exposures securitised by the Group and subject to Prudential Standard APS 116 “Capital Adequacy:
Market Risk” (APS 116) was $27 million as at 30 June 2019 (31 December 2018: $18 million, 30 June 2018: $40 million), all of
which are traditional securitisations. This consists of:
Securities held in the trading book subject to the Standard Method of nil (31 December 2018: nil , 30 June 2018: $22 million);
and
Derivatives held in the trading book subject to the Internal Models Approach (IMA) of $27 million (31 December 2018:
$18 million, 30 June 2018: $18 million).
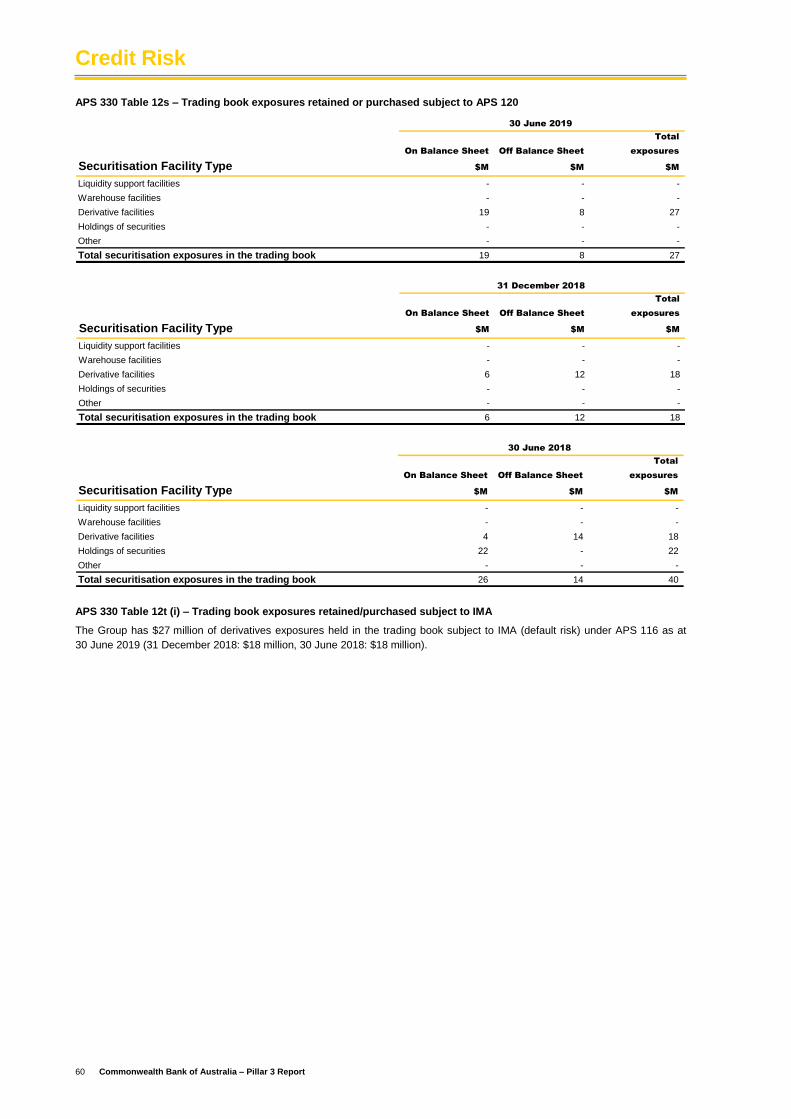
Credit Risk
60 Commonwealth Bank of Australia – Pillar 3 Report
APS 330 Table 12s – Trading book exposures retained or purchased subject to APS 120
Total
On Balance Sheet Off Balance Sheet exposures
Securitisation Facility Type $M $M $M
Liquidity support facilities - - -
Warehouse facilities - - -
Derivative facilities 19 8 27
Holdings of securities - - -
Other - - -
Total securitisation exposures in the trading book 19 8 27
30 June 2019
Total
On Balance Sheet Off Balance Sheet exposures
Securitisation Facility Type $M $M $M
Liquidity support facilities - - -
Warehouse facilities - - -
Derivative facilities 6 12 18
Holdings of securities - - -
Other - - -
Total securitisation exposures in the trading book 6 12 18
31 December 2018
Total
On Balance Sheet Off Balance Sheet exposures
Securitisation Facility Type $M $M $M
Liquidity support facilities - - -
Warehouse facilities - - -
Derivative facilities 4 14 18
Holdings of securities 22 - 22
Other - - -
Total securitisation exposures in the trading book 26 14 40
30 June 2018
APS 330 Table 12t (i) – Trading book exposures retained/purchased subject to IMA
The Group has $27 million of derivatives exposures held in the trading book subject to IMA (default risk) under APS 116 as at
30 June 2019 (31 December 2018: $18 million, 30 June 2018: $18 million).
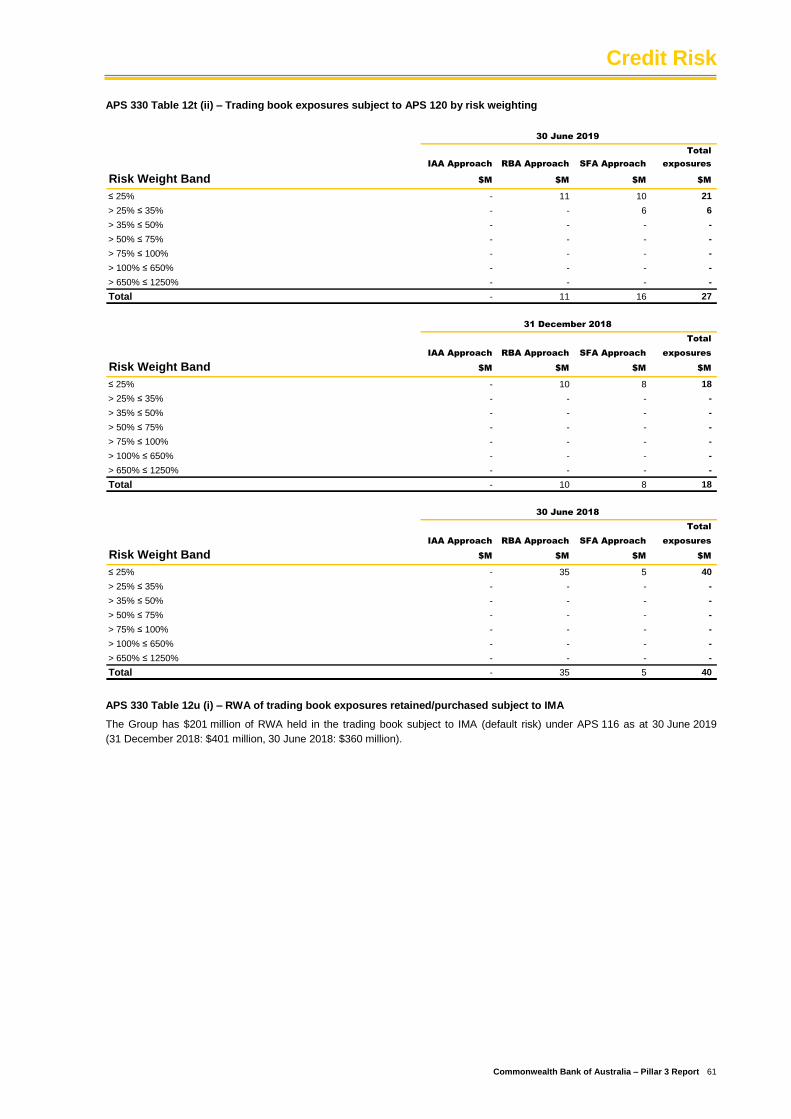
Credit Risk
Commonwealth Bank of Australia – Pillar 3 Report 61
APS 330 Table 12t (ii) – Trading book exposures subject to APS 120 by risk weighting
Total
IAA Approach RBA Approach SFA Approach exposures
Risk Weight Band $M $M $M $M
≤ 25% - 11 10 21
> 25% ≤ 35% - - 6 6
> 35% ≤ 50% - - - -
> 50% ≤ 75% - - - -
> 75% ≤ 100% - - - -
> 100% ≤ 650% - - - -
> 650% ≤ 1250% - - - -
Total - 11 16 27
30 June 2019
Total
IAA Approach RBA Approach SFA Approach exposures
Risk Weight Band $M $M $M $M
≤ 25% - 10 8 18
> 25% ≤ 35% - - - -
> 35% ≤ 50% - - - -
> 50% ≤ 75% - - - -
> 75% ≤ 100% - - - -
> 100% ≤ 650% - - - -
> 650% ≤ 1250% - - - -
Total - 10 8 18
31 December 2018
Total
IAA Approach RBA Approach SFA Approach exposures
Risk Weight Band $M $M $M $M
≤ 25% - 35 5 40
> 25% ≤ 35% - - - -
> 35% ≤ 50% - - - -
> 50% ≤ 75% - - - -
> 75% ≤ 100% - - - -
> 100% ≤ 650% - - - -
> 650% ≤ 1250% - - - -
Total - 35 5 40
30 June 2018
APS 330 Table 12u (i) – RWA of trading book exposures retained/purchased subject to IMA
The Group has $201 million of RWA held in the trading book subject to IMA (default risk) under APS 116 as at 30 June 2019
(31 December 2018: $401 million, 30 June 2018: $360 million).
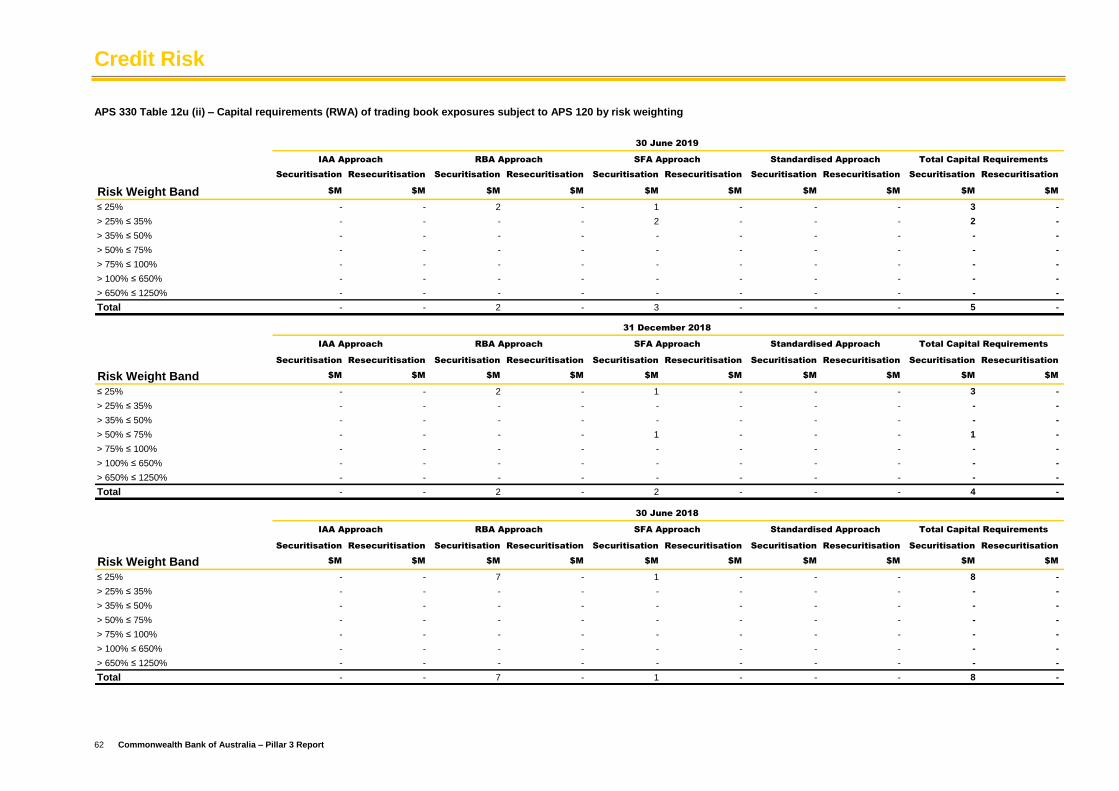
Credit Risk
62 Commonwealth Bank of Australia – Pillar 3 Report
APS 330 Table 12u (ii) – Capital requirements (RWA) of trading book exposures subject to APS 120 by risk weighting
Securitisation Resecuritisation Securitisation Resecuritisation Securitisation Resecuritisation Securitisation Resecuritisation Securitisation Resecuritisation
Risk Weight Band $M $M $M $M $M $M $M $M $M $M
≤ 25% - - 2 - 1 - - - 3 -
> 25% ≤ 35% - - - - 2 - - - 2 -
> 35% ≤ 50% - - - - - - - - - -
> 50% ≤ 75% - - - - - - - - - -
> 75% ≤ 100% - - - - - - - - - -
> 100% ≤ 650% - - - - - - - - - -
> 650% ≤ 1250% - - - - - - - - - -
Total - - 2 - 3 - - - 5 -
Securitisation Resecuritisation Securitisation Resecuritisation Securitisation Resecuritisation Securitisation Resecuritisation Securitisation Resecuritisation
Risk Weight Band $M $M $M $M $M $M $M $M $M $M
≤ 25% - - 2 - 1 - - - 3 -
> 25% ≤ 35% - - - - - - - - - -
> 35% ≤ 50% - - - - - - - - - -
> 50% ≤ 75% - - - - 1 - - - 1 -
> 75% ≤ 100% - - - - - - - - - -
> 100% ≤ 650% - - - - - - - - - -
> 650% ≤ 1250% - - - - - - - - - -
Total - - 2 - 2 - - - 4 -
Securitisation Resecuritisation Securitisation Resecuritisation Securitisation Resecuritisation Securitisation Resecuritisation Securitisation Resecuritisation
Risk Weight Band $M $M $M $M $M $M $M $M $M $M
≤ 25% - - 7 - 1 - - - 8 -
> 25% ≤ 35% - - - - - - - - - -
> 35% ≤ 50% - - - - - - - - - -
> 50% ≤ 75% - - - - - - - - - -
> 75% ≤ 100% - - - - - - - - - -
> 100% ≤ 650% - - - - - - - - - -
> 650% ≤ 1250% - - - - - - - - - -
Total - - 7 - 1 - - - 8 -
30 June 2018
IAA Approach RBA Approach SFA Approach Standardised Approach Total Capital Requirements
31 December 2018
IAA Approach RBA Approach SFA Approach Standardised Approach Total Capital Requirements
30 June 2019
IAA Approach RBA Approach SFA Approach Standardised Approach Total Capital Requirements
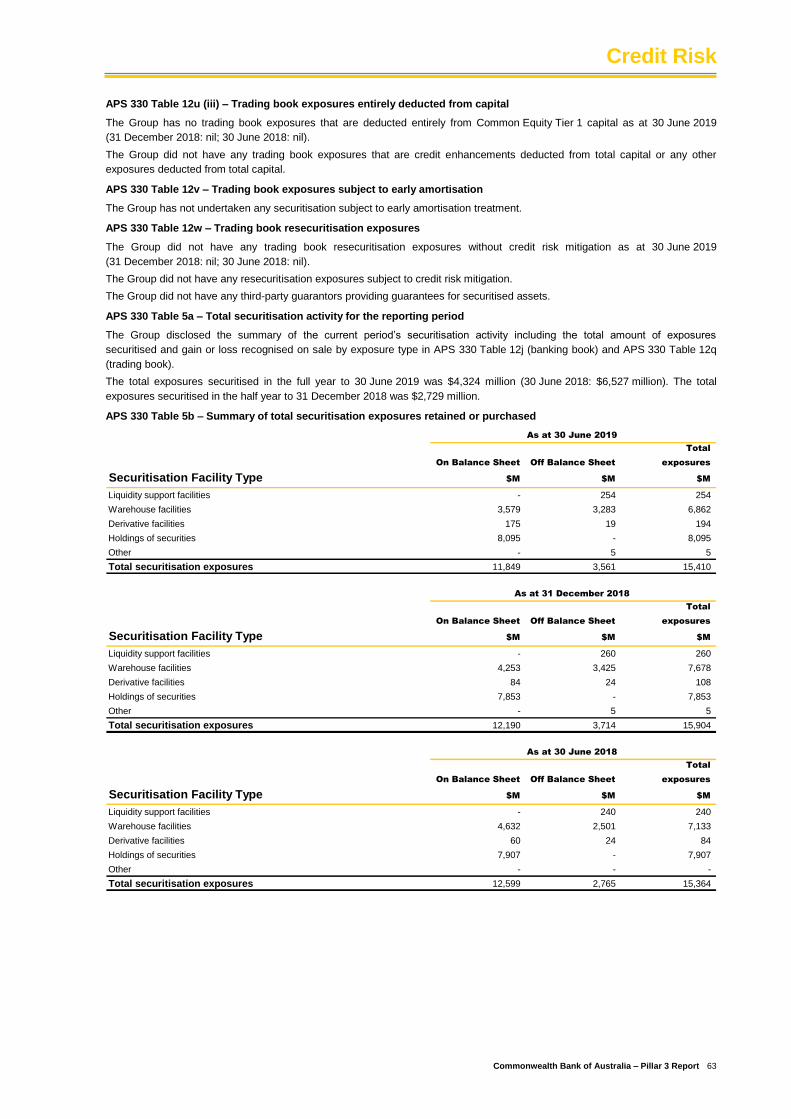
Credit Risk
Commonwealth Bank of Australia – Pillar 3 Report 63
APS 330 Table 12u (iii) – Trading book exposures entirely deducted from capital
The Group has no trading book exposures that are deducted entirely from Common Equity Tier 1 capital as at 30 June 2019
(31 December 2018: nil; 30 June 2018: nil).
The Group did not have any trading book exposures that are credit enhancements deducted from total capital or any other
exposures deducted from total capital.
APS 330 Table 12v – Trading book exposures subject to early amortisation
The Group has not undertaken any securitisation subject to early amortisation treatment.
APS 330 Table 12w – Trading book resecuritisation exposures
The Group did not have any trading book resecuritisation exposures without credit risk mitigation as at 30 June 2019
(31 December 2018: nil; 30 June 2018: nil).
The Group did not have any resecuritisation exposures subject to credit risk mitigation.
The Group did not have any third-party guarantors providing guarantees for securitised assets.
APS 330 Table 5a – Total securitisation activity for the reporting period
The Group disclosed the summary of the current period’s securitisation activity including the total amount of exposures
securitised and gain or loss recognised on sale by exposure type in APS 330 Table 12j (banking book) and APS 330 Table 12q
(trading book).
The total exposures securitised in the full year to 30 June 2019 was $4,324 million (30 June 2018: $6,527 million). The total
exposures securitised in the half year to 31 December 2018 was $2,729 million.
APS 330 Table 5b – Summary of total securitisation exposures retained or purchased
Total
On Balance Sheet Off Balance Sheet exposures
Securitisation Facility Type $M $M $M
Liquidity support facilities - 254 254
Warehouse facilities 3,579 3,283 6,862
Derivative facilities 175 19 194
Holdings of securities 8,095 - 8,095
Other - 5 5
Total securitisation exposures 11,849 3,561 15,410
As at 30 June 2019
Total
On Balance Sheet Off Balance Sheet exposures
Securitisation Facility Type $M $M $M
Liquidity support facilities - 260 260
Warehouse facilities 4,253 3,425 7,678
Derivative facilities 84 24 108
Holdings of securities 7,853 - 7,853
Other - 5 5
Total securitisation exposures 12,190 3,714 15,904
As at 31 December 2018
Total
On Balance Sheet Off Balance Sheet exposures
Securitisation Facility Type $M $M $M
Liquidity support facilities - 240 240
Warehouse facilities 4,632 2,501 7,133
Derivative facilities 60 24 84
Holdings of securities 7,907 - 7,907
Other - - -
Total securitisation exposures 12,599 2,765 15,364
As at 30 June 2018
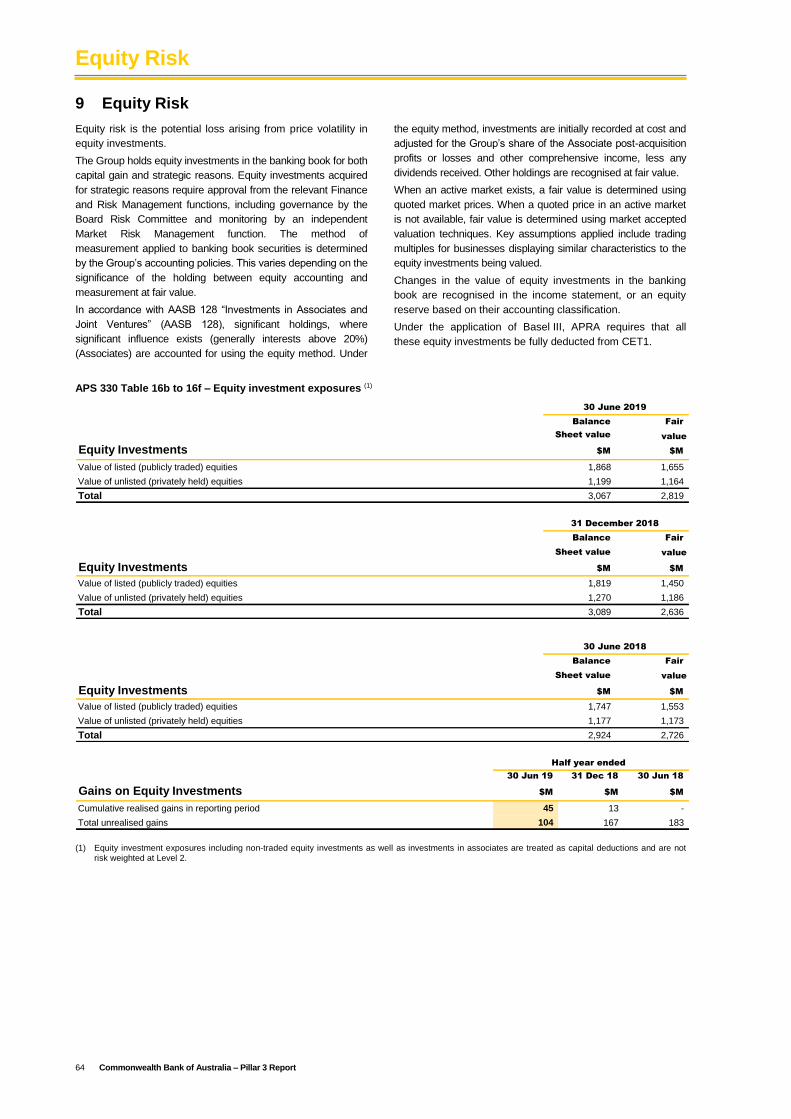
Equity Risk
64 Commonwealth Bank of Australia – Pillar 3 Report
9 Equity Risk
Equity risk is the potential loss arising from price volatility in
equity investments.
The Group holds equity investments in the banking book for both
capital gain and strategic reasons. Equity investments acquired
for strategic reasons require approval from the relevant Finance
and Risk Management functions, including governance by the
Board Risk Committee and monitoring by an independent
Market Risk Management function. The method of
measurement applied to banking book securities is determined
by the Group’s accounting policies. This varies depending on the
significance of the holding between equity accounting and
measurement at fair value.
In accordance with AASB 128 “Investments in Associates and
Joint Ventures” (AASB 128), significant holdings, where
significant influence exists (generally interests above 20%)
(Associates) are accounted for using the equity method. Under
the equity method, investments are initially recorded at cost and
adjusted for the Group’s share of the Associate post-acquisition
profits or losses and other comprehensive income, less any
dividends received. Other holdings are recognised at fair value.
When an active market exists, a fair value is determined using
quoted market prices. When a quoted price in an active market
is not available, fair value is determined using market accepted
valuation techniques. Key assumptions applied include trading
multiples for businesses displaying similar characteristics to the
equity investments being valued.
Changes in the value of equity investments in the banking
book are recognised in the income statement, or an equity
reserve based on their accounting classification.
Under the application of Basel III, APRA requires that all
these equity investments be fully deducted from CET1.
APS 330 Table 16b to 16f – Equity investment exposures (1)
Balance Fair
Sheet value value
Equity Investments $M $M
Value of listed (publicly traded) equities 1,868 1,655
Value of unlisted (privately held) equities 1,199 1,164
Total 3,067 2,819
30 June 2019
Balance Fair
Sheet value value
Equity Investments $M $M
Value of listed (publicly traded) equities 1,819 1,450
Value of unlisted (privately held) equities 1,270 1,186
Total 3,089 2,636
31 December 2018
Balance Fair
Sheet value value
Equity Investments $M $M
Value of listed (publicly traded) equities 1,747 1,553
Value of unlisted (privately held) equities 1,177 1,173
Total 2,924 2,726
30 June 2018
30 Jun 19 31 Dec 18 30 Jun 18
Gains on Equity Investments $M $M $M
Cumulative realised gains in reporting period 45 13 -
Total unrealised gains 104 167 183
Half year ended
(1) Equity investment exposures including non-traded equity investments as well as investments in associates are treated as capital deductions and are not risk weighted at Level 2.
Market Risk
Commonwealth Bank of Australia – Pillar 3 Report 65
10 Market Risk
Market risk is the potential of an adverse impact on the
Group’s earnings or capital from changes in interest rates,
foreign exchange rates, equity and commodity prices, credit
spreads, and the resale value of assets under operating
leases at maturity (lease residual value risk).
The Group makes a distinction between Traded and Non-
traded market risk for the purposes of risk management,
measurement and reporting. Traded market risk principally
arises from the Group’s trading book activities within the
Institutional Banking and Markets business and its subsidiary
financial institutions.
Non-traded market risk includes interest rate risk that arises
from banking book activities, non-traded equity risk, market
risk arising from the insurance business, structural foreign
exchange risk and lease residual value risk.
Market Risk Management Governance Overview
The Group’s appetite for market risk is determined by the
Board and is expressed via the Group’s Risk Appetite
Statement and its framework of limits and policies. The limits
are designed to manage the volatility in earnings and value
due to market risk. The policies establish a sound operating
environment for market risk, which is consistent with the
governance and control standards of the Group and conform
to prudential regulatory requirements.
The market risk profile of the Group is overseen by the Board
Risk Committee and senior executive management via the
Group’s Asset and Liability Committee (ALCO). The Portfolio
and Market Risk Management (PMRM) unit provides support
to the Risk Committee and ALCO in the performance of their
market risk management accountabilities.
Market risk may only be generated by authorised business
areas across the Group. The key functional areas that must
be established to support market risk activity comprise:
An approved Trading, Treasury or Origination function;
An independent Market Risk Oversight area; and
A Senior Management Oversight Committee.
The chart on page 66 summarises governance arrangements
for market risk.
The Market Risk Oversight area supports the implementation
of the Board approved policies through the establishment of
Market Risk Standards and other documents that define the
operational requirements for managing market risk, including
details of sub-limits, stress testing, key controls, delegations,
reporting and escalation requirements. The Market Risk
Oversight area is responsible for the daily monitoring and
analysis of risk positions. Senior Management has oversight
of market risk performance against risk and return
expectations on a monthly basis. The Board Risk Committee
meets approximately eight times each year and considers the
operation of the market risk management framework together
with any issues that may arise.
Market Risk Measurement
The Group uses Value-at-Risk (VaR) as one of the measures
of Traded and Non-traded market risk. VaR measures
potential loss using historically observed market volatility and
correlation between different markets. The VaR measured for
Traded market risk uses two years of daily movement in
market rates. The VaR measure for Non-traded Banking Book
market risk uses six years of daily movement in market rates.
VaR is modelled at a 97.5% confidence level over a 1-day
holding period for trading book positions. A 20-day holding
period is used for Interest Rate Risk in the Banking Book
(IRRBB), insurance business market risk and Non-traded
equity risk.
Stressed VaR (SVaR) is calculated for Traded market risk
using the same methodology as the regular Traded market
risk VaR except that the historical data is taken from a one
year observation period of significant market volatility as seen
during the Global Financial Crisis (GFC).
VaR is driven by historical observations and is not an
estimate of the maximum loss that the Group could
experience from an extreme market event. As a result of this
limitation, management also uses stress testing to measure
the potential for economic loss at confidence levels
significantly higher than 97.5%. Management then uses these
results in decisions to manage the economic impact of market
risk positions.
The stress events considered for market risk are extreme but
plausible market movements, and have been back-tested
against moves seen during 2008 and 2009 at the height of
the GFC. The results are reported to the Board Risk
Committee and the Group’s ALCO on a regular basis. Stress
tests also include a range of forward looking macroeconomic
scenario stresses.
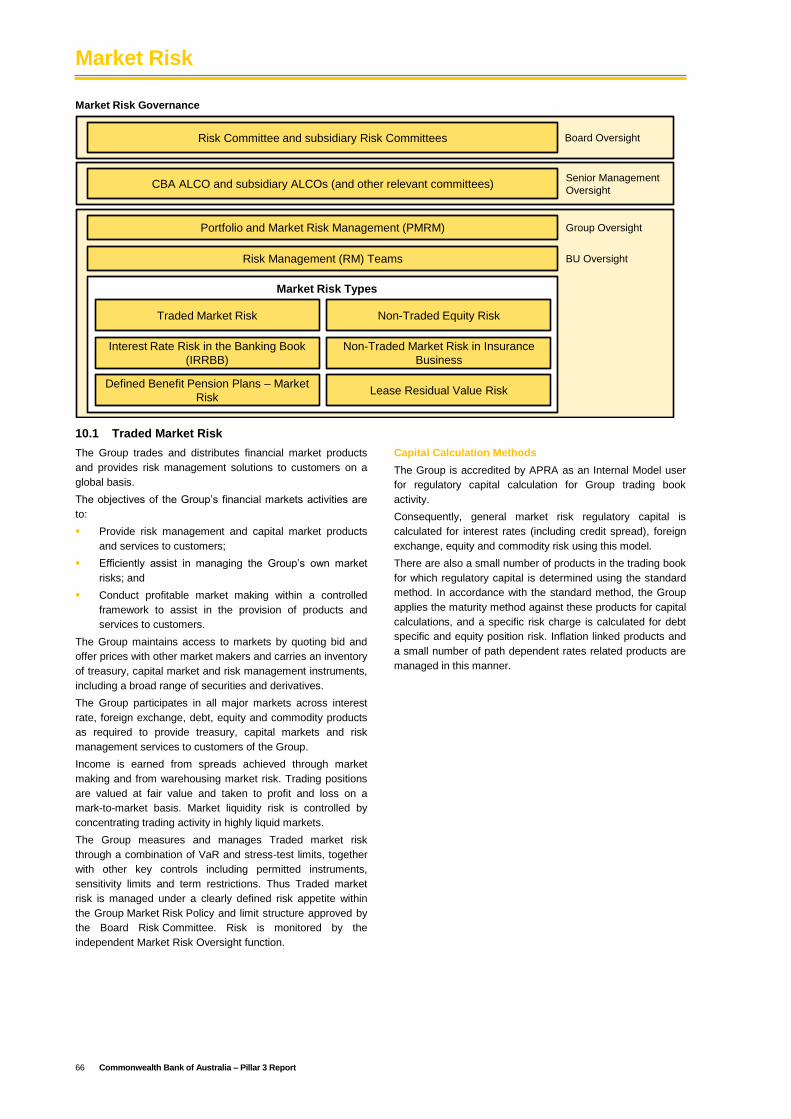
Market Risk
66 Commonwealth Bank of Australia – Pillar 3 Report
Market Risk Governance
Risk Committee and subsidiary Risk Committees
CBA ALCO and subsidiary ALCOs (and other relevant committees)
Portfolio and Market Risk Management (PMRM)
Risk Management (RM) Teams
Traded Market Risk
Interest Rate Risk in the Banking Book
(IRRBB)
Defined Benefit Pension Plans – Market
Risk
Non-Traded Market Risk in Insurance
Business
Non-Traded Equity Risk
Lease Residual Value Risk
Market Risk Types
Board Oversight
Senior Management
Oversight
Group Oversight
BU Oversight
10.1 Traded Market Risk
The Group trades and distributes financial market products
and provides risk management solutions to customers on a
global basis.
The objectives of the Group’s financial markets activities are
to:
Provide risk management and capital market products
and services to customers;
Efficiently assist in managing the Group’s own market
risks; and
Conduct profitable market making within a controlled
framework to assist in the provision of products and
services to customers.
The Group maintains access to markets by quoting bid and
offer prices with other market makers and carries an inventory
of treasury, capital market and risk management instruments,
including a broad range of securities and derivatives.
The Group participates in all major markets across interest
rate, foreign exchange, debt, equity and commodity products
as required to provide treasury, capital markets and risk
management services to customers of the Group.
Income is earned from spreads achieved through market
making and from warehousing market risk. Trading positions
are valued at fair value and taken to profit and loss on a
mark-to-market basis. Market liquidity risk is controlled by
concentrating trading activity in highly liquid markets.
The Group measures and manages Traded market risk
through a combination of VaR and stress-test limits, together
with other key controls including permitted instruments,
sensitivity limits and term restrictions. Thus Traded market
risk is managed under a clearly defined risk appetite within
the Group Market Risk Policy and limit structure approved by
the Board Risk Committee. Risk is monitored by the
independent Market Risk Oversight function.
Capital Calculation Methods
The Group is accredited by APRA as an Internal Model user
for regulatory capital calculation for Group trading book
activity.
Consequently, general market risk regulatory capital is
calculated for interest rates (including credit spread), foreign
exchange, equity and commodity risk using this model.
There are also a small number of products in the trading book
for which regulatory capital is determined using the standard
method. In accordance with the standard method, the Group
applies the maturity method against these products for capital
calculations, and a specific risk charge is calculated for debt
specific and equity position risk. Inflation linked products and
a small number of path dependent rates related products are
managed in this manner.
Market Risk
Commonwealth Bank of Australia – Pillar 3 Report 67
Capital Calculation Methods (continued)
The breakdown of RWA for Traded market risk by modelling method is summarised in the table below.
30 Jun 19 31 Dec 18 30 Jun 18
Traded Market Risk RWA by Modelling Approach (1) $M $M $M
Internal Model Approach 9,834 4,499 7,477
Standard Method 651 764 778
Total Traded Market Risk RWA 10,485 5,263 8,255
(1) Refer to page 11 for commentary.
The capital requirement for Traded market risk under the standard method is disclosed in APS 330 Table 13b.
APS 330 Table 13b – Traded Market Risk Under the Standard Method
30 Jun 19 31 Dec 18 30 Jun 18
Exposure Type $M $M $M
Interest rate risk 51. 9 60. 9 61. 9
Equity risk 0. 2 0. 1 0. 2
Foreign exchange risk - 0. 1 0. 1
Commodity risk - - -
Total 52. 1 61. 1 62. 2
Risk Weighted Asset equivalent (1) 651 764 778
(1) Risk Weighted Assets equivalent is the capital requirements multiplied by 12.5 in accordance with APRA Prudential Standard APS 110.
Traded Market Risk Internal Model
The VaR and SVaR results calculated under the internal model approach are summarised in APS 330 Table 14f (i).
APS 330 Table 14f (i) – Value-at-Risk and Stressed Value-at-Risk for Trading Portfolios Under the Internal Model Approach
As at
Mean Maximum Minimum balance
value value value date
Average VaR (1) $M $M $M $M
Over the 6 months to 30 June 2019 30 46 21 40
Over the 6 months to 31 December 2018 48 75 27 41
Over the 6 months to 30 June 2018 59 103 26 67
Aggregate Value-at-Risk Over the Reporting Period
As at
Mean Maximum Minimum balance
value value value date
Stressed VaR (1)$M $M $M $M
Over the 6 months to 30 June 2019 180 347 98 201
Over the 6 months to 31 December 2018 89 162 51 85
Over the 6 months to 30 June 2018 117 178 65 123
Aggregate SVaR Over the Reporting Period
(1) 10 day, 99% confidence interval over the reporting period.
Internal Model Approach – Back-test results
The Internal Model is subject to back-testing against hypothetical profit and loss. In the 6 months to 30 June 2019 there were no
back-test outliers. The back-test results are summarised in APS 330 Table 14f (ii) and details of these are provided in APS 330
Table 14f (iii). A comparison of VaR with actual gains or losses during the 6 months to 30 June 2019 is illustrated in APS 330
Table 14f (iv).
APS 330 Table 14f (ii) - Summary Table of the Number of Back-Testing Outliers (1)
Over the 6 months to 30 June 2019 -
Over the 6 months to 31 December 2018 -
Over the 6 months to 30 June 2018 -
(1) 1 day, 99% confidence interval over the reporting period.
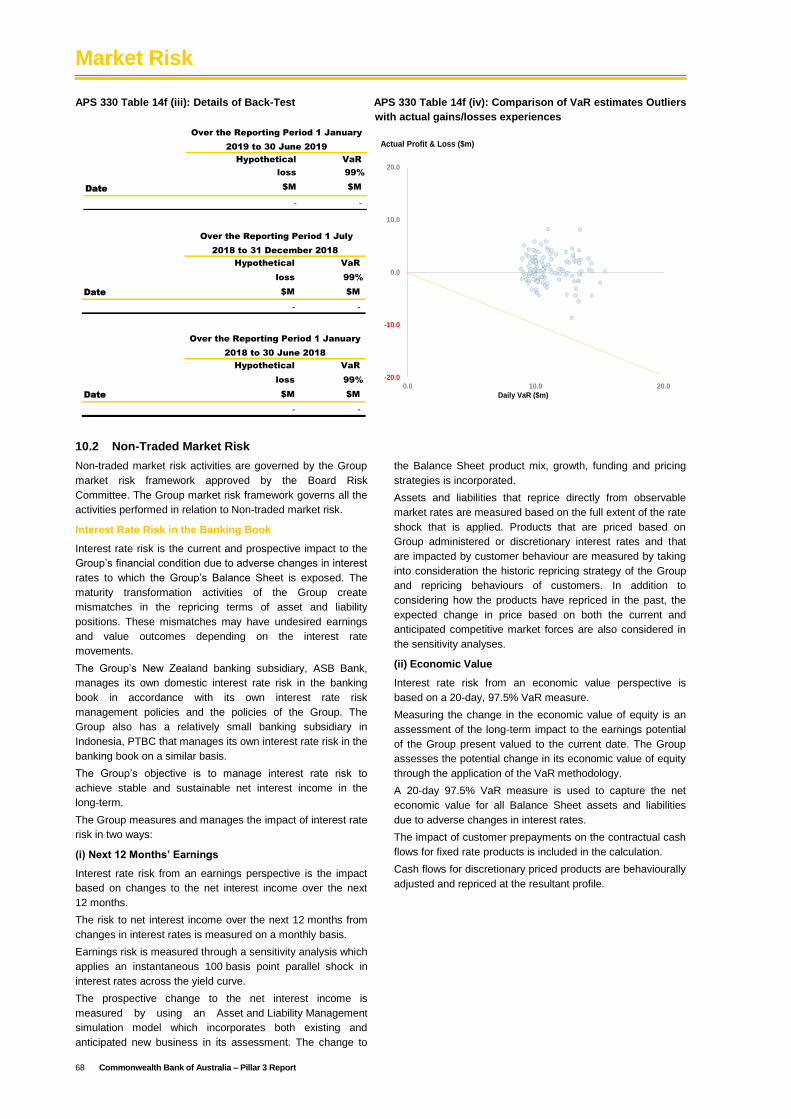
Market Risk
68 Commonwealth Bank of Australia – Pillar 3 Report
APS 330 Table 14f (iii): Details of Back-Test APS 330 Table 14f (iv): Comparison of VaR estimates Outliers
with actual gains/losses experiences
Hypothetical VaR
loss 99%
Date $M $M
- -
Over the Reporting Period 1 January
2019 to 30 June 2019
-20.0
-10.0
0.0
10.0
20.0
0.0 10.0 20.0
Actual Profit & Loss ($m)
Daily VaR ($m)
Hypothetical VaR
loss 99%
Date $M $M
- -
Over the Reporting Period 1 July
2018 to 31 December 2018
Hypothetical VaR
loss 99%
Date $M $M
- -
Over the Reporting Period 1 January
2018 to 30 June 2018
10.2 Non-Traded Market Risk
Non-traded market risk activities are governed by the Group
market risk framework approved by the Board Risk
Committee. The Group market risk framework governs all the
activities performed in relation to Non-traded market risk.
Interest Rate Risk in the Banking Book
Interest rate risk is the current and prospective impact to the
Group’s financial condition due to adverse changes in interest
rates to which the Group’s Balance Sheet is exposed. The
maturity transformation activities of the Group create
mismatches in the repricing terms of asset and liability
positions. These mismatches may have undesired earnings
and value outcomes depending on the interest rate
movements.
The Group’s New Zealand banking subsidiary, ASB Bank,
manages its own domestic interest rate risk in the banking
book in accordance with its own interest rate risk
management policies and the policies of the Group. The
Group also has a relatively small banking subsidiary in
Indonesia, PTBC that manages its own interest rate risk in the
banking book on a similar basis.
The Group’s objective is to manage interest rate risk to
achieve stable and sustainable net interest income in the
long-term.
The Group measures and manages the impact of interest rate
risk in two ways:
(i) Next 12 Months’ Earnings
Interest rate risk from an earnings perspective is the impact
based on changes to the net interest income over the next
12 months.
The risk to net interest income over the next 12 months from
changes in interest rates is measured on a monthly basis.
Earnings risk is measured through a sensitivity analysis which
applies an instantaneous 100 basis point parallel shock in
interest rates across the yield curve.
The prospective change to the net interest income is
measured by using an Asset and Liability Management
simulation model which incorporates both existing and
anticipated new business in its assessment. The change to
the Balance Sheet product mix, growth, funding and pricing
strategies is incorporated.
Assets and liabilities that reprice directly from observable
market rates are measured based on the full extent of the rate
shock that is applied. Products that are priced based on
Group administered or discretionary interest rates and that
are impacted by customer behaviour are measured by taking
into consideration the historic repricing strategy of the Group
and repricing behaviours of customers. In addition to
considering how the products have repriced in the past, the
expected change in price based on both the current and
anticipated competitive market forces are also considered in
the sensitivity analyses.
(ii) Economic Value
Interest rate risk from an economic value perspective is
based on a 20-day, 97.5% VaR measure.
Measuring the change in the economic value of equity is an
assessment of the long-term impact to the earnings potential
of the Group present valued to the current date. The Group
assesses the potential change in its economic value of equity
through the application of the VaR methodology.
A 20-day 97.5% VaR measure is used to capture the net
economic value for all Balance Sheet assets and liabilities
due to adverse changes in interest rates.
The impact of customer prepayments on the contractual cash
flows for fixed rate products is included in the calculation.
Cash flows for discretionary priced products are behaviourally
adjusted and repriced at the resultant profile.
Market Risk
Commonwealth Bank of Australia – Pillar 3 Report 69
Determining Interest Rate Risk in the Banking Book
APRA requires Australian banks accredited for the Advanced
Approach under the Basel III framework to incorporate
regulatory capital for IRRBB in their assessment of total
capital. The capital requirement associated with IRRBB is
measured by the Group’s internal measurement model which
incorporates the following risk calculations:
Repricing and yield curve risks, which arise from
repricing mismatches between assets and liabilities, are
jointly determined from the distribution of changes in the
economic value of the banking book as a consequence
of interest rate changes (overall level of the yield curve
and the shape of the yield curve). A historical simulation
VaR approach is used, with IRRBB regulatory capital
determined with respect to a one year holding period
and a 99% level of confidence. Interest rate scenarios
are constructed over a historical observation period of
six years.
Basis risk is measured as the risk of loss in earnings of
the banking book arising from differences between the
actual and expected interest margins on banking book
items. The IRRBB regulatory capital requirement for
basis risk is measured under a dynamic simulation
approach, as the change in net interest income over a
twelve month forecast period in response to an adverse
change to implied forward cash rates.
Optionality risk is measured as the risk of loss in
economic value owing to the existence of stand-alone or
embedded options in the banking book, to the extent that
such potential losses are not included in the
measurement of repricing, yield curve or basis risks.
Optionality risk arising from a departure from assumed
prepayment behaviour is calculated from a stressed
prepayment rate scenario by the VaR model. Optionality
risk arising from the use of replicating portfolios for
indeterminate maturity or discretionary rate items is
measured by the VaR model under an applied mismatch
between the underlying product balances and the
unhedged term asset positions.
The embedded loss or gain in banking book items not
accounted for on a mark-to-market basis is measured
and included in the regulatory capital for IRRBB. The
embedded loss or gain measures the difference between
the book value and economic value of banking book
activities, based on transfer-priced assets and liabilities.
These interest rate risk calculations are summed (subject to
the capital requirement not being less than zero in total) and
multiplied by 12.5 to derive Regulatory RWA for IRRBB in
accordance with APRA’s Prudential Standard APS 110
“Capital Adequacy” (APS 110).
Stress Testing of Interest Rate Risk in the Banking Book
Stress testing of IRRBB measures the impact of extreme but
plausible market movements on both an earnings and an
economic value basis. The results are reported to the Board
Risk Committee and the Group ALCO on a regular basis.
The Stress Testing figures in APS 330 Table 17b (below)
represent expected net change in the economic value of
assets and liabilities, held for purposes other than trading,
based on a 200 basis point parallel rate shock. In addition
APS 330 Table 17b includes the Regulatory RWA for IRRBB.
APS 330 Table 17b – Interest Rate Risk in the Banking Book
30 Jun 19 31 Dec 18 30 Jun 18
Stress Testing: Interest Rate Shock Applied $M $M $M
AUD
200 basis point parallel increase (702) (328) (1,259)
200 basis point parallel decrease 770 368 1,368
NZD
200 basis point parallel increase (330) (298) (269)
200 basis point parallel decrease 351 317 287
USD
200 basis point parallel increase (133) (59) (76)
200 basis point parallel decrease 143 67 87
Other
200 basis point parallel increase (11) (5) 19
200 basis point parallel decrease 12 3 (19)
Change in Economic Value
30 Jun 19 31 Dec 18 30 Jun 18
Regulatory RWA (1)$M $M $M
Interest rate risk in the banking book 9,898 13,872 24,381
(1) Refer to page 11 for commentary.
Market Risk
70 Commonwealth Bank of Australia – Pillar 3 Report
Structural Foreign Exchange Risk
Structural Foreign Exchange Risk is the risk that movements in
foreign exchange rates may have an adverse effect on the
Group’s Australian dollar earnings and economic value when the
Group’s foreign currency denominated earnings and capital are
translated into Australian dollars. The Group’s primary exposure
to this risk arises from its New Zealand banking and insurance,
Asian and US operations. This risk is managed in accordance
with the following Risk Committee approved principles:
Permanently deployed capital in a foreign jurisdiction is
not hedged; and
Forecast earnings from the Group’s New Zealand
banking and insurance subsidiaries are hedged.
The management of structural foreign exchange risk is regularly
reported to the Group’s ALCO.
Non-Traded Equity Risk
The Group retains Non-Traded Equity Risk primarily through
business activities in Wealth Management. This activity is
subject to governance arrangements approved by the Risk
Committee, and is monitored within the Board Risk
Management function.
A 20-day, 97.5% confidence VaR is used to measure the
economic impact of adverse changes in value. The
30 June 2019 VaR measure is $22 million (30 June 2018:
$21 million) (refer also to section 9 “Equity Risk”).
Market Risk in Insurance Businesses
There are two main sources of market risk in the Life
Insurance businesses: (i) market risk arising from guarantees
made to policyholders; and (ii) market risk arising from the
investment of Shareholders’ capital.
Guarantees (to Policyholders)
All financial assets within the Life Insurance Statutory Funds
directly support either the Group's life insurance or life
investment contracts. Market risk arises for the Group on
contracts where the liabilities to policyholders are guaranteed
by the Group. The Group manages this risk by having an
asset and liability management framework which includes the
use of hedging instruments. The Group also monitors the risk
on a monthly basis.
Shareholders’ Capital
A portion of financial assets held within the Insurance
business, both within the Statutory Funds and in the
Shareholders’ Funds of the Life Insurance company
represents shareholder (Group) capital. Market risk also
arises for the Group on the investment of this capital.
Shareholders’ funds in the Australian Life Insurance
businesses are invested 99% in income assets (cash and
fixed interest) and 1% in growth assets as at 30 June 2019.
Lease Residual Value Risk
The Group takes lease residual value risk on assets such as
industrial, mining, rail, aircraft, marine, technology, healthcare
and other equipment. A lease residual value guarantee then
exposes the Group to the movement in second-hand prices of
these assets. The lease residual value risk within the Group is
controlled through a risk management framework approved by
the Board Risk Committee. Supporting this framework is an
internal Market Risk Standard document, which has a risk limit
framework that includes asset, geographic and maturity
concentration limits, and stress testing that is performed by the
Market Risk Oversight function.
Commonwealth Bank Group Super Fund
The Commonwealth Bank Group Super Fund (the Fund) has
a defined benefit portion that creates market risk for the
Group. Risk Management and Group Corporate Affairs
provide oversight of the market risks of the Fund held and
managed on behalf of the employees receiving defined
benefit pension funds on behalf of the Group. Regular
reporting is provided to senior management via the Group’s
ALCO and the Board Risk Committee on the status of the
surplus, risk sensitivities and risk management options. For
further information on the Fund, refer to Note 10.2 of the
Annual Report 2019.
Operational Risk
Commonwealth Bank of Australia – Pillar 3 Report 71
11 Operational Risk
Operational risk is defined as the risk of loss arising from
inadequate or failed internal processes, people, systems or
from external events, exposing the Group to loss, reputational
damage and/or regulatory scrutiny.
Operational Risk Objectives
The Group’s operational risk objectives are designed to
support the achievement of its financial and business goals,
through:
The maintenance of an effective internal control
environment and system;
The demonstration of effective governance, including a
consistent approach to operational risk management
across the Group;
Transparency, escalation and resolution of risk and
control incidents and issues; and
Making decisions based upon an informed risk-return
analysis and appropriate standards of professional
practice.
Operational Risk Management Framework
The Operational Risk Management Framework (ORMF) is
integral to the achievement of the Group’s operational risk
objectives and is embedded within business practices across
the Group. It comprises four core components to ensure
sound management and measurement of the Group’s
operational risk. The core components are:
Governance;
Management, Measurement and Systems;
Analytics, Review and Reporting; and
People and Culture.
The ORMF is supported by a single platform, internally
referred to as RiskInSite, which enables consistent
application of the ORMF across the Group; including
assessment of operational risks, monitoring and review
activities, escalation and remediation of control weaknesses
and loss incident management, and reporting to management
and Boards.
Compliance Risk Management
Compliance risk is the risk of legal or regulatory sanctions,
material financial loss, or loss of reputation that the Group
may incur as a result of its failure to comply with the
requirements of relevant laws, regulations, industry
standards, rules, codes and guidelines, and includes societal
expectations.
The Group’s Compliance Management Framework (CMF) is
broadly consistent with the Australian Standard on
Compliance Programs and aims to help meet the Group’s
obligations under the Corporations Act 2001, the Group’s
Australian Financial Services Licence and Australian Credit
Licences. The CMF also aims to support the Group’s
compliance with requirements in the offshore jurisdictions in
which it operates. The CMF incorporates key mandatory
requirements and roles and responsibilities for managing
compliance risk. It captures compliance requirements, Group
compliance policies, regulatory change and people and
culture considerations.
The CMF provides for the assessment of compliance risks,
implementation of controls, monitoring and testing of
framework effectiveness and the escalation, remediation and
reporting of compliance incidents and compliance control
weaknesses.
APRA Prudential Inquiry report findings
The APRA Prudential Inquiry report, published on 1 May 2018
highlighted a number of areas for improvement in the ORMF
and CMF.
Following the report, the Group entered into an Enforceable
Undertaking (EU) with APRA. Under the terms of the EU the
Group has had endorsed, by APRA, a Remedial Action Plan.
The plan outlines the actions it is taking to improve the ORMF
and CMF.
Roles and Responsibilities
Every staff member has a responsibility for managing
operational risk and compliance. Individual responsibilities
and limits of authority are articulated within the position
descriptions for each role.
Within the Group, accountability for operational risk and
compliance has been structured into “Three Lines of
Accountability” as per section 7. This is the subject of
improvements under the Remedial Action Plan.
Risk Mitigation through Insurance
The Group insures against selected unexpected insurable
operational risk losses. The Group’s insurance program is
structured based upon the Group’s risk appetite and risk
retention strategies.
In designing the Group’s insurance program, the adequacy
and appropriateness of cover are considered along with the
Group’s operational risk profile.
The insurance program is subject to review by the Executive
Leadership Team and the Board.
Capital Measurement Approach
Operational Risk Capital is calculated using the Group’s
Advanced Measurement Approach (AMA) methodology.
The Operational Risk Measurement System (ORMS)
describes the Group’s AMA methodology which combines
internal and external loss data and judgement based
scenarios into loss distributions using Monte Carlo
simulations, to produce regulatory and economic capital for
the Group and each business unit. Direct inputs into the model
include scenarios (called Quantitative Risk Assessments),
internal loss data and external loss data sourced from an
external provider the Operational Riskdata eXchange
association (ORX). Inputs to scenarios include internal and
external loss data, business environment and internal control
factors, and business judgement.
Operational Risk
72 Commonwealth Bank of Australia – Pillar 3 Report
Economic Capital Calculation
The outcomes of the operational risk capital measurement
process include an economic capital requirement based on a
99.95% confidence interval that is calibrated to the Group’s
overall target AA debt rating.
Regulatory Capital Calculation
The Group has approval from APRA to calculate its
operational risk regulatory capital using the Basel II Advanced
Measurement Approach, the requirements of which are
unchanged under Basel III. The Group uses the AMA model
APRA granted permission for it to use in March 2016 for
calculating Operational Risk Capital.
APS330 Table 6e - Capital requirements for operational risk
30 Jun 19 31 Dec 18 30 Jun 18
$M $M $M
Total operational risk RWA (1) 59,805 56,653 56,448
(1) Refer to page 11 for commentary.
Liquidity Risk
Commonwealth Bank of Australia – Pillar 3 Report 73
12 Liquidity Risk
12.1 Liquidity and Funding Risk
Overview
The Group’s liquidity and funding policies are designed to
ensure it will meet its obligations as and when they fall due by
ensuring it is able to borrow funds on an unsecured basis,
has sufficient liquid assets to borrow against on a secured
basis, or sell to raise immediate funds without adversely
affecting the Group’s net asset value.
The Group’s liquidity policies are designed to ensure it
maintains sufficient cash balances and liquid asset holdings
to meet its obligations to customers, in both ordinary market
conditions and during periods of extreme stress. These
policies are intended to protect the value of the Group’s
operations during periods of unfavourable market conditions.
The Group’s funding policies are designed to achieve
diversified sources of funding by product, term, maturity date,
investor type, investor location, currency and concentration,
on a cost effective basis. This objective applies to the Group’s
wholesale and retail funding activities.
Liquidity and Funding Risk Management Framework
The CBA Board is ultimately responsible for the sound and
prudent management of liquidity risk across the Group. The
Group’s liquidity and funding policies, structured under a
formal Group Liquidity and Funding Risk Management
Framework, are approved by the Board and agreed with
APRA. The Group has an Asset and Liability Committee
(ALCO), the charter of which includes reviewing the
management of assets and liabilities, reviewing liquidity and
funding policies and strategies, as well as regularly
monitoring compliance with those policies across the Group.
Group Treasury manages the Group’s liquidity and funding
positions in accordance with the Group’s liquidity policies and
has ultimate authority to execute liquidity decisions should the
Group Contingent Funding Plan be activated. Risk
Management provides oversight of the Group’s liquidity and
funding risks, compliance with Group policies and manages
the Group’s relationship with prudential regulators.
Subsidiaries within the Colonial Group apply their own
liquidity and funding strategies to address their specific
needs. The Group’s New Zealand banking subsidiary, ASB
Bank, manages its own domestic liquidity and funding needs
in accordance with its own liquidity policies and the policies of
the Group. ASB’s liquidity policy is also overseen by the
Reserve Bank of New Zealand.
Liquidity and Funding Policies and Management
The Group’s liquidity and funding policies provide that:
An excess of liquid assets over the minimum prescribed
under APRA’s Liquidity Coverage Ratio (LCR)
requirement is maintained. Australian ADIs are required
to meet a 100% LCR, calculated as the ratio of high
quality liquid assets to 30 day net cash outflows
projected under a prescribed stress scenario;
A surplus of stable funding from various sources, as
measured by APRA’s Net Stable Funding Ratio (NSFR),
is maintained. The NSFR is calculated by applying
APRA prescribed factors to assets and liabilities to
determine a ratio of required stable funding to available
stable funding which must be greater than 100%;
Additional internal funding and liquidity metrics are
calculated and stress tests additional to the LCR are run;
Short and long-term wholesale funding limits are
established, monitored and reviewed regularly;
The Group’s wholesale funding market capacity is
regularly assessed and used as a factor in funding
strategies;
Balance Sheet assets that cannot be liquidated quickly
are funded with stable deposits or term borrowings that
meet minimum maturity requirements with appropriate
liquidity buffers;
Liquid assets are held in Australian dollar and foreign
currency denominated securities in accordance with
expected requirements;
The Group has three categories of liquid assets within its
domestic liquid assets portfolio. The first includes cash,
government and Australian semi-government securities.
The second includes Negotiable Certificates of Deposit,
bank bills, bank term securities, supranational bonds,
Australian Residential Mortgage-backed Securities
(RMBS) and securities that meet certain Reserve Bank
of Australia (RBA) criteria for purchases under reverse
repo. The final category is internal RMBS, being
mortgages that have been securitised but retained by
the Bank, that are repo-eligible with the RBA under
stress; and
Offshore branches and subsidiaries adhere to liquidity
policies and hold appropriate foreign currency liquid
assets to meet required regulations.
The Group’s key funding tools include:
Its consumer retail funding base, which includes a wide
range of retail transaction accounts, savings accounts
and term deposits for individual consumers;
Its small business customer and institutional deposit
base; and
Its wholesale international and domestic funding
programs which include its Australian dollar negotiable
certificates of deposit; Australian dollar bank bills; Asian
Transferable Certificates of Deposit program; Australian,
U.S. and Euro Commercial Paper programs; U.S.
Extendible Notes programs; Australian dollar Domestic
Debt Program; U.S.144a and 3a2 Medium-Term Note
Programs; Euro Medium-Term Note Program; multi
jurisdiction Covered Bond program; and its Medallion
and Swan securitisation programs.
The Group’s key liquidity tools include:
A regulatory liquidity management reporting system
delivering granular customer and product type
information to inform business decision making, product
development and resulting in a greater awareness of the
liquidity risk adjusted value of banking products;
A liquidity management model similar to a “maturity
ladder” or “liquidity gap analysis”, that allows forecasting
of liquidity needs on a daily basis;
An additional liquidity management model that
implements the agreed prudential liquidity policies. This
model is calibrated with a series of “stress” liquidity crisis
scenarios, incorporating both systemic and idiosyncratic
crisis assumptions, such that the Group will have
sufficient liquid assets available to ensure it meets all of
its obligations as and when they fall due;
Central bank repurchase agreement facilities including
the RBA’s Committed Liquidity Facility that provide the
Group with the ability to borrow funds on a secured
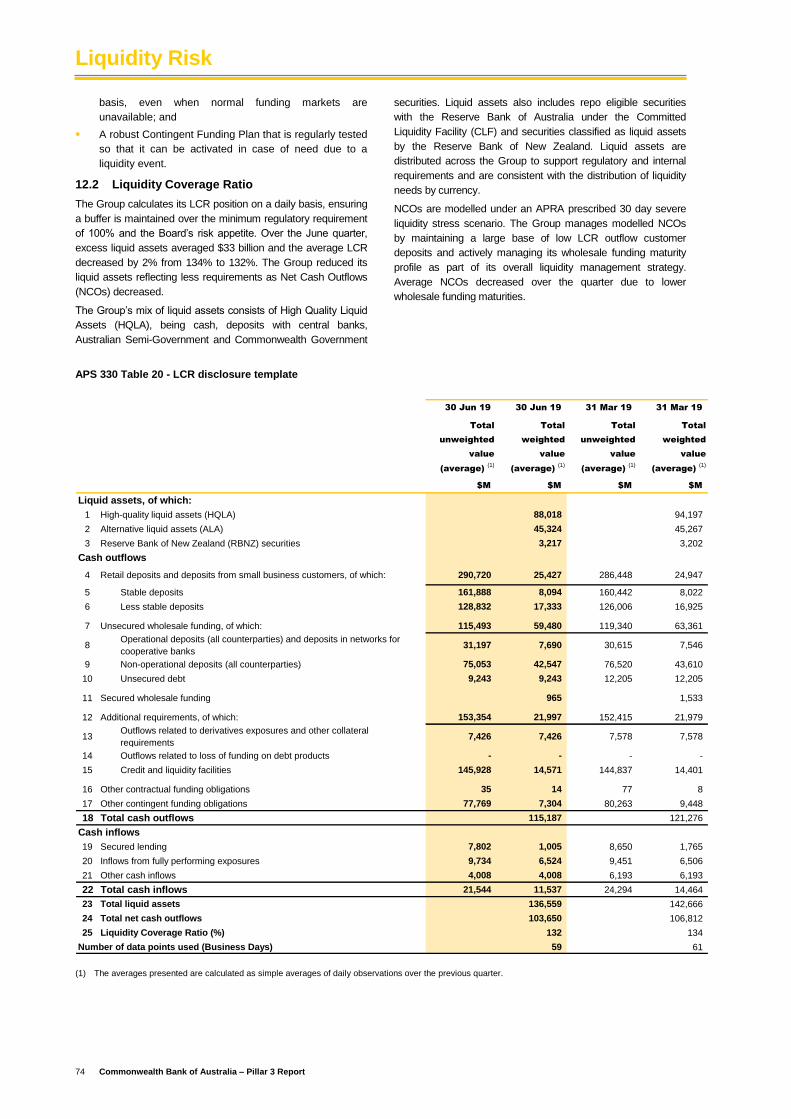
Liquidity Risk
74 Commonwealth Bank of Australia – Pillar 3 Report
basis, even when normal funding markets are
unavailable; and
A robust Contingent Funding Plan that is regularly tested
so that it can be activated in case of need due to a
liquidity event.
12.2 Liquidity Coverage Ratio
The Group calculates its LCR position on a daily basis, ensuring
a buffer is maintained over the minimum regulatory requirement
of 100% and the Board’s risk appetite. Over the June quarter,
excess liquid assets averaged $33 billion and the average LCR
decreased by 2% from 134% to 132%. The Group reduced its
liquid assets reflecting less requirements as Net Cash Outflows
(NCOs) decreased.
The Group’s mix of liquid assets consists of High Quality Liquid
Assets (HQLA), being cash, deposits with central banks,
Australian Semi-Government and Commonwealth Government
securities. Liquid assets also includes repo eligible securities
with the Reserve Bank of Australia under the Committed
Liquidity Facility (CLF) and securities classified as liquid assets
by the Reserve Bank of New Zealand. Liquid assets are
distributed across the Group to support regulatory and internal
requirements and are consistent with the distribution of liquidity
needs by currency.
NCOs are modelled under an APRA prescribed 30 day severe
liquidity stress scenario. The Group manages modelled NCOs
by maintaining a large base of low LCR outflow customer
deposits and actively managing its wholesale funding maturity
profile as part of its overall liquidity management strategy.
Average NCOs decreased over the quarter due to lower
wholesale funding maturities.
APS 330 Table 20 - LCR disclosure template
30 Jun 19 30 Jun 19 31 Mar 19 31 Mar 19
Total
unweighted
value
(average) (1)
Total
weighted
value
(average) (1)
Total
unweighted
value
(average) (1)
Total
weighted
value
(average) (1)
$M $M $M $M
Liquid assets, of which:
1 High-quality liquid assets (HQLA) 88,018 94,197
2 Alternative liquid assets (ALA) 45,324 45,267
3 Reserve Bank of New Zealand (RBNZ) securities 3,217 3,202
Cash outflows
4 Retail deposits and deposits from small business customers, of which: 290,720 25,427 286,448 24,947
5 Stable deposits 161,888 8,094 160,442 8,022
6 Less stable deposits 128,832 17,333 126,006 16,925
7 Unsecured wholesale funding, of which: 115,493 59,480 119,340 63,361
8Operational deposits (all counterparties) and deposits in networks for
cooperative banks31,197 7,690 30,615 7,546
9 Non-operational deposits (all counterparties) 75,053 42,547 76,520 43,610
10 Unsecured debt 9,243 9,243 12,205 12,205
11 Secured wholesale funding 965 1,533
12 Additional requirements, of which: 153,354 21,997 152,415 21,979
13Outflows related to derivatives exposures and other collateral
requirements7,426 7,426 7,578 7,578
14 Outflows related to loss of funding on debt products - - - -
15 Credit and liquidity facilities 145,928 14,571 144,837 14,401
16 Other contractual funding obligations 35 14 77 8
17 Other contingent funding obligations 77,769 7,304 80,263 9,448
18 Total cash outflows 115,187 121,276
Cash inflows
19 Secured lending 7,802 1,005 8,650 1,765
20 Inflows from fully performing exposures 9,734 6,524 9,451 6,506
21 Other cash inflows 4,008 4,008 6,193 6,193
22 Total cash inflows 21,544 11,537 24,294 14,464
23 Total liquid assets 136,559 142,666
24 Total net cash outflows 103,650 106,812
25 Liquidity Coverage Ratio (%) 132 134
Number of data points used (Business Days) 59 61 (1) The averages presented are calculated as simple averages of daily observations over the previous quarter.
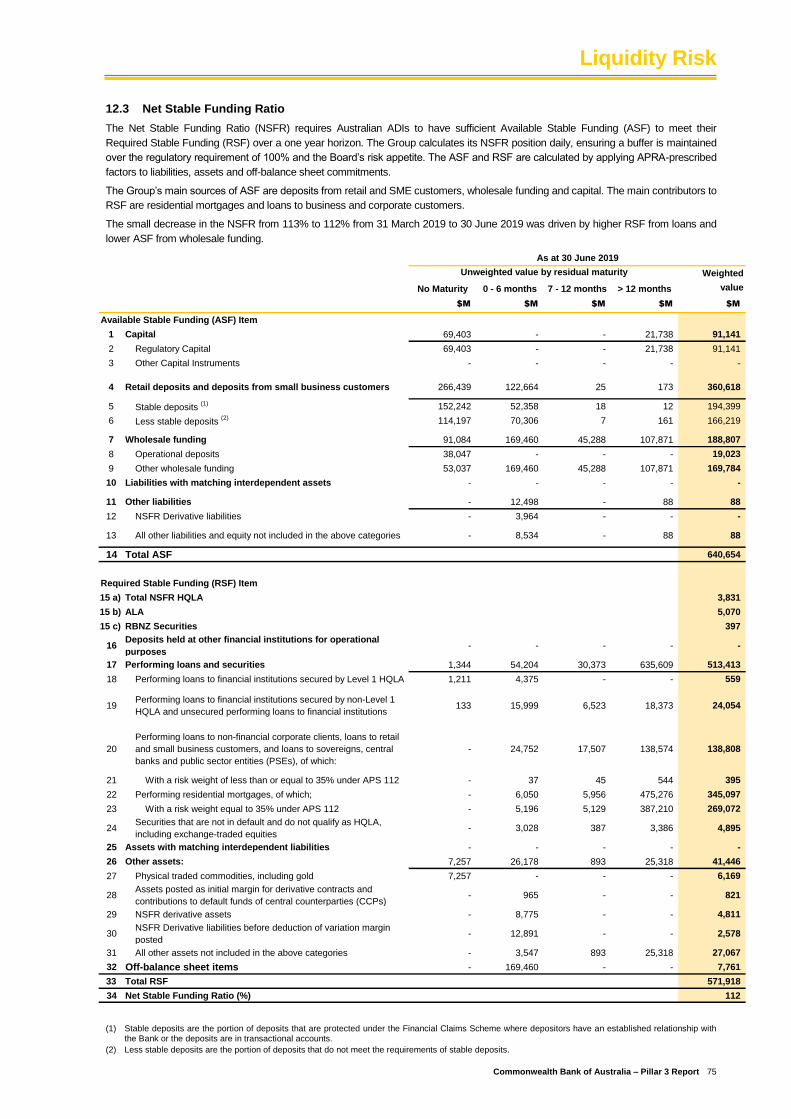
Liquidity Risk
Commonwealth Bank of Australia – Pillar 3 Report 75
12.3 Net Stable Funding Ratio
The Net Stable Funding Ratio (NSFR) requires Australian ADIs to have sufficient Available Stable Funding (ASF) to meet their
Required Stable Funding (RSF) over a one year horizon. The Group calculates its NSFR position daily, ensuring a buffer is maintained
over the regulatory requirement of 100% and the Board’s risk appetite. The ASF and RSF are calculated by applying APRA-prescribed
factors to liabilities, assets and off-balance sheet commitments.
The Group’s main sources of ASF are deposits from retail and SME customers, wholesale funding and capital. The main contributors to
RSF are residential mortgages and loans to business and corporate customers.
The small decrease in the NSFR from 113% to 112% from 31 March 2019 to 30 June 2019 was driven by higher RSF from loans and
lower ASF from wholesale funding.
Weighted
No Maturity 0 - 6 months 7 - 12 months > 12 months value
$M $M $M $M $M
Available Stable Funding (ASF) Item
1 Capital 69,403 - - 21,738 91,141
2 Regulatory Capital 69,403 - - 21,738 91,141
3 Other Capital Instruments - - - - -
4 Retail deposits and deposits from small business customers 266,439 122,664 25 173 360,618
5 Stable deposits (1) 152,242 52,358 18 12 194,399
6 Less stable deposits (2) 114,197 70,306 7 161 166,219
7 Wholesale funding 91,084 169,460 45,288 107,871 188,807
8 Operational deposits 38,047 - - - 19,023
9 Other wholesale funding 53,037 169,460 45,288 107,871 169,784
10 Liabilities with matching interdependent assets - - - - -
11 Other liabilities - 12,498 - 88 88
12 NSFR Derivative liabilities - 3,964 - - -
13 All other liabilities and equity not included in the above categories - 8,534 - 88 88
14 Total ASF 640,654
Required Stable Funding (RSF) Item
15 a) Total NSFR HQLA 3,831
15 b) ALA 5,070
15 c) RBNZ Securities 397
16Deposits held at other financial institutions for operational
purposes- - - - -
17 Performing loans and securities 1,344 54,204 30,373 635,609 513,413
18 Performing loans to financial institutions secured by Level 1 HQLA 1,211 4,375 - - 559
19Performing loans to financial institutions secured by non-Level 1
HQLA and unsecured performing loans to financial institutions133 15,999 6,523 18,373 24,054
20
Performing loans to non-financial corporate clients, loans to retail
and small business customers, and loans to sovereigns, central
banks and public sector entities (PSEs), of which:
- 24,752 17,507 138,574 138,808
21 With a risk weight of less than or equal to 35% under APS 112 - 37 45 544 395
22 Performing residential mortgages, of which; - 6,050 5,956 475,276 345,097
23 With a risk weight equal to 35% under APS 112 - 5,196 5,129 387,210 269,072
24Securities that are not in default and do not qualify as HQLA,
including exchange-traded equities- 3,028 387 3,386 4,895
25 Assets with matching interdependent liabilities - - - - -
26 Other assets: 7,257 26,178 893 25,318 41,446
27 Physical traded commodities, including gold 7,257 - - - 6,169
28Assets posted as initial margin for derivative contracts and
contributions to default funds of central counterparties (CCPs)- 965 - - 821
29 NSFR derivative assets - 8,775 - - 4,811
30NSFR Derivative liabilities before deduction of variation margin
posted- 12,891 - - 2,578
31 All other assets not included in the above categories - 3,547 893 25,318 27,067
32 Off-balance sheet items - 169,460 - - 7,761
33 Total RSF 571,918
34 Net Stable Funding Ratio (%) 112
As at 30 June 2019
Unweighted value by residual maturity
(1) Stable deposits are the portion of deposits that are protected under the Financial Claims Scheme where depositors have an established relationship with the Bank or the deposits are in transactional accounts.
(2) Less stable deposits are the portion of deposits that do not meet the requirements of stable deposits.
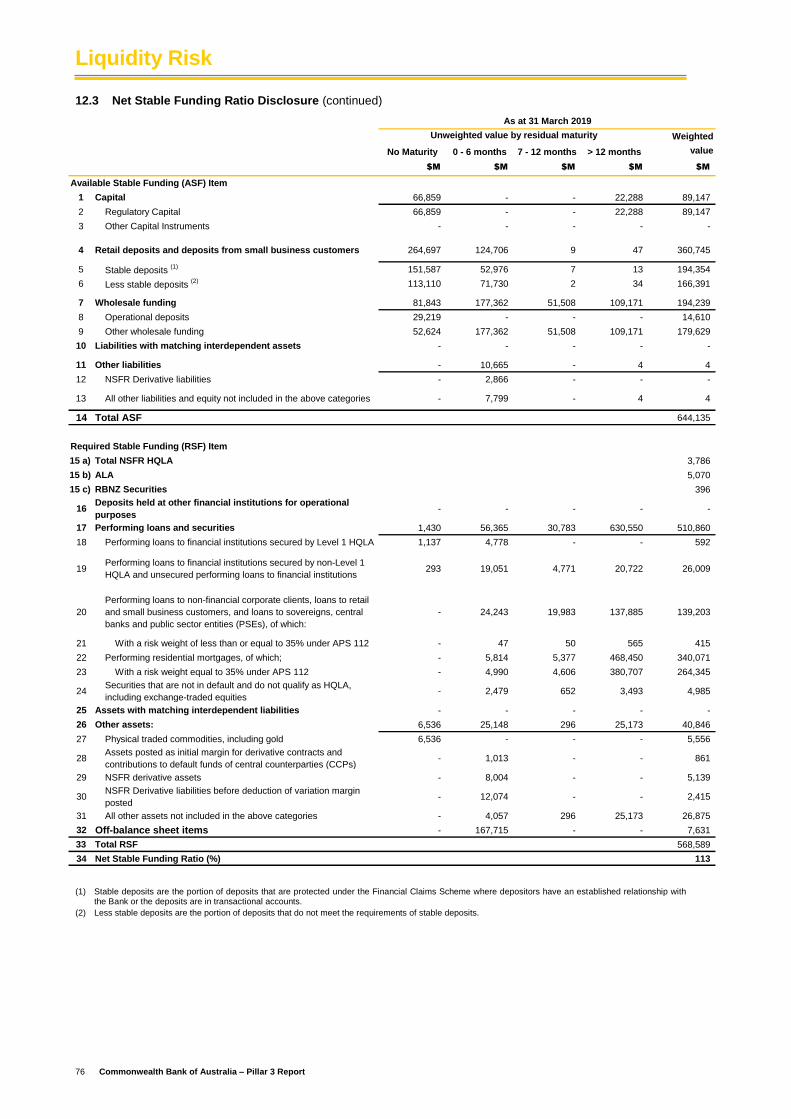
Liquidity Risk
76 Commonwealth Bank of Australia – Pillar 3 Report
12.3 Net Stable Funding Ratio Disclosure (continued)
Weighted
No Maturity 0 - 6 months 7 - 12 months > 12 months value
$M $M $M $M $M
Available Stable Funding (ASF) Item
1 Capital 66,859 - - 22,288 89,147
2 Regulatory Capital 66,859 - - 22,288 89,147
3 Other Capital Instruments - - - - -
4 Retail deposits and deposits from small business customers 264,697 124,706 9 47 360,745
5 Stable deposits (1) 151,587 52,976 7 13 194,354
6 Less stable deposits (2) 113,110 71,730 2 34 166,391
7 Wholesale funding 81,843 177,362 51,508 109,171 194,239
8 Operational deposits 29,219 - - - 14,610
9 Other wholesale funding 52,624 177,362 51,508 109,171 179,629
10 Liabilities with matching interdependent assets - - - - -
11 Other liabilities - 10,665 - 4 4
12 NSFR Derivative liabilities - 2,866 - - -
13 All other liabilities and equity not included in the above categories - 7,799 - 4 4
14 Total ASF 644,135
Required Stable Funding (RSF) Item
15 a) Total NSFR HQLA 3,786
15 b) ALA 5,070
15 c) RBNZ Securities 396
16Deposits held at other financial institutions for operational
purposes- - - - -
17 Performing loans and securities 1,430 56,365 30,783 630,550 510,860
18 Performing loans to financial institutions secured by Level 1 HQLA 1,137 4,778 - - 592
19Performing loans to financial institutions secured by non-Level 1
HQLA and unsecured performing loans to financial institutions293 19,051 4,771 20,722 26,009
20
Performing loans to non-financial corporate clients, loans to retail
and small business customers, and loans to sovereigns, central
banks and public sector entities (PSEs), of which:
- 24,243 19,983 137,885 139,203
21 With a risk weight of less than or equal to 35% under APS 112 - 47 50 565 415
22 Performing residential mortgages, of which; - 5,814 5,377 468,450 340,071
23 With a risk weight equal to 35% under APS 112 - 4,990 4,606 380,707 264,345
24Securities that are not in default and do not qualify as HQLA,
including exchange-traded equities- 2,479 652 3,493 4,985
25 Assets with matching interdependent liabilities - - - - -
26 Other assets: 6,536 25,148 296 25,173 40,846
27 Physical traded commodities, including gold 6,536 - - - 5,556
28Assets posted as initial margin for derivative contracts and
contributions to default funds of central counterparties (CCPs)- 1,013 - - 861
29 NSFR derivative assets - 8,004 - - 5,139
30NSFR Derivative liabilities before deduction of variation margin
posted- 12,074 - - 2,415
31 All other assets not included in the above categories - 4,057 296 25,173 26,875
32 Off-balance sheet items - 167,715 - - 7,631
33 Total RSF 568,589
34 Net Stable Funding Ratio (%) 113
As at 31 March 2019
Unweighted value by residual maturity
(1) Stable deposits are the portion of deposits that are protected under the Financial Claims Scheme where depositors have an established relationship with the Bank or the deposits are in transactional accounts.
(2) Less stable deposits are the portion of deposits that do not meet the requirements of stable deposits.
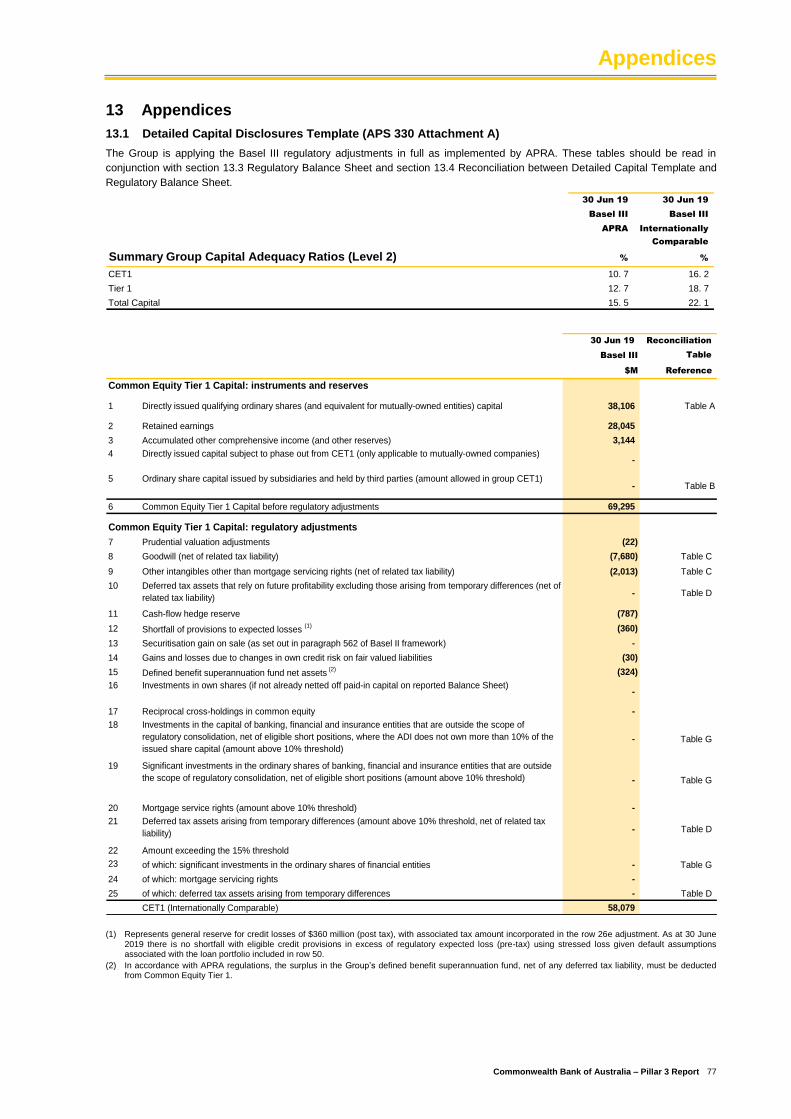
Appendices
Commonwealth Bank of Australia – Pillar 3 Report 77
13 Appendices
13.1 Detailed Capital Disclosures Template (APS 330 Attachment A)
The Group is applying the Basel III regulatory adjustments in full as implemented by APRA. These tables should be read in
conjunction with section 13.3 Regulatory Balance Sheet and section 13.4 Reconciliation between Detailed Capital Template and
Regulatory Balance Sheet.
30 Jun 19 30 Jun 19
Basel III Basel III
APRA Internationally
Comparable
Summary Group Capital Adequacy Ratios (Level 2) % %
CET1 10. 7 16. 2
Tier 1 12. 7 18. 7
Total Capital 15. 5 22. 1
30 Jun 19 Reconciliation
Basel III Table
$M Reference
Common Equity Tier 1 Capital: instruments and reserves
1 Directly issued qualifying ordinary shares (and equivalent for mutually-owned entities) capital 38,106 Table A
2 Retained earnings 28,045
3 Accumulated other comprehensive income (and other reserves) 3,144
4 Directly issued capital subject to phase out from CET1 (only applicable to mutually-owned companies)-
5 Ordinary share capital issued by subsidiaries and held by third parties (amount allowed in group CET1)- Table B
6 Common Equity Tier 1 Capital before regulatory adjustments 69,295
Common Equity Tier 1 Capital: regulatory adjustments
7 Prudential valuation adjustments (22)
8 Goodwill (net of related tax liability) (7,680) Table C
9 Other intangibles other than mortgage servicing rights (net of related tax liability) (2,013) Table C
10 Deferred tax assets that rely on future profitability excluding those arising from temporary differences (net of
related tax liability)- Table D
11 Cash-flow hedge reserve (787)
12 Shortfall of provisions to expected losses (1) (360)
13 Securitisation gain on sale (as set out in paragraph 562 of Basel II framework) -
14 Gains and losses due to changes in own credit risk on fair valued liabilities (30)
15 Defined benefit superannuation fund net assets (2) (324)
16 Investments in own shares (if not already netted off paid-in capital on reported Balance Sheet)-
17 Reciprocal cross-holdings in common equity -
18 Investments in the capital of banking, financial and insurance entities that are outside the scope of
regulatory consolidation, net of eligible short positions, where the ADI does not own more than 10% of the
issued share capital (amount above 10% threshold) - Table G
19 Significant investments in the ordinary shares of banking, financial and insurance entities that are outside
the scope of regulatory consolidation, net of eligible short positions (amount above 10% threshold) - Table G
20 Mortgage service rights (amount above 10% threshold) -
21 Deferred tax assets arising from temporary differences (amount above 10% threshold, net of related tax
liability) - Table D
22 Amount exceeding the 15% threshold
23 of which: significant investments in the ordinary shares of financial entities - Table G
24 of which: mortgage servicing rights -
25 of which: deferred tax assets arising from temporary differences - Table D
CET1 (Internationally Comparable) 58,079
(1) Represents general reserve for credit losses of $360 million (post tax), with associated tax amount incorporated in the row 26e adjustment. As at 30 June
2019 there is no shortfall with eligible credit provisions in excess of regulatory expected loss (pre-tax) using stressed loss given default assumptions associated with the loan portfolio included in row 50.
(2) In accordance with APRA regulations, the surplus in the Group’s defined benefit superannuation fund, net of any deferred tax liability, must be deducted from Common Equity Tier 1.
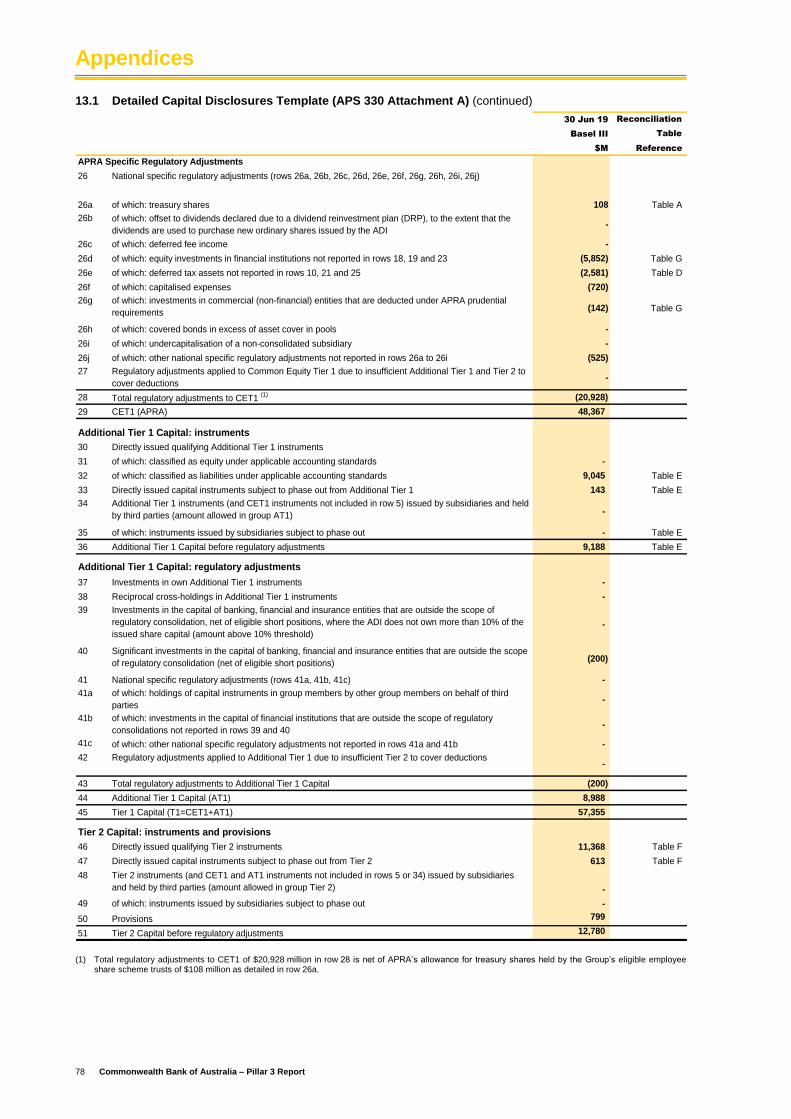
Appendices
78 Commonwealth Bank of Australia – Pillar 3 Report
13.1 Detailed Capital Disclosures Template (APS 330 Attachment A) (continued)
30 Jun 19 Reconciliation
Basel III Table
$M Reference
APRA Specific Regulatory Adjustments
26 National specific regulatory adjustments (rows 26a, 26b, 26c, 26d, 26e, 26f, 26g, 26h, 26i, 26j)
26a of which: treasury shares 108 Table A
26b of which: offset to dividends declared due to a dividend reinvestment plan (DRP), to the extent that the
dividends are used to purchase new ordinary shares issued by the ADI -
26c of which: deferred fee income -
26d of which: equity investments in financial institutions not reported in rows 18, 19 and 23 (5,852) Table G
26e of which: deferred tax assets not reported in rows 10, 21 and 25 (2,581) Table D
26f of which: capitalised expenses (720)
26g of which: investments in commercial (non-financial) entities that are deducted under APRA prudential
requirements(142) Table G
26h of which: covered bonds in excess of asset cover in pools -
26i of which: undercapitalisation of a non-consolidated subsidiary -
26j of which: other national specific regulatory adjustments not reported in rows 26a to 26i (525)
27 Regulatory adjustments applied to Common Equity Tier 1 due to insufficient Additional Tier 1 and Tier 2 to
cover deductions -
28 Total regulatory adjustments to CET1 (1) (20,928)
29 CET1 (APRA) 48,367
Additional Tier 1 Capital: instruments
30 Directly issued qualifying Additional Tier 1 instruments
31 of which: classified as equity under applicable accounting standards -
32 of which: classified as liabilities under applicable accounting standards 9,045 Table E
33 Directly issued capital instruments subject to phase out from Additional Tier 1 143 Table E
34 Additional Tier 1 instruments (and CET1 instruments not included in row 5) issued by subsidiaries and held
by third parties (amount allowed in group AT1) -
35 of which: instruments issued by subsidiaries subject to phase out - Table E
36 Additional Tier 1 Capital before regulatory adjustments 9,188 Table E
Additional Tier 1 Capital: regulatory adjustments
37 Investments in own Additional Tier 1 instruments -
38 Reciprocal cross-holdings in Additional Tier 1 instruments -
39 Investments in the capital of banking, financial and insurance entities that are outside the scope of
regulatory consolidation, net of eligible short positions, where the ADI does not own more than 10% of the
issued share capital (amount above 10% threshold)-
40 Significant investments in the capital of banking, financial and insurance entities that are outside the scope
of regulatory consolidation (net of eligible short positions)(200)
41 National specific regulatory adjustments (rows 41a, 41b, 41c) -
41a of which: holdings of capital instruments in group members by other group members on behalf of third
parties-
41b of which: investments in the capital of financial institutions that are outside the scope of regulatory
consolidations not reported in rows 39 and 40-
41c of which: other national specific regulatory adjustments not reported in rows 41a and 41b -
42 Regulatory adjustments applied to Additional Tier 1 due to insufficient Tier 2 to cover deductions-
43 Total regulatory adjustments to Additional Tier 1 Capital (200)
44 Additional Tier 1 Capital (AT1) 8,988
45 Tier 1 Capital (T1=CET1+AT1) 57,355
Tier 2 Capital: instruments and provisions
46 Directly issued qualifying Tier 2 instruments 11,368 Table F
47 Directly issued capital instruments subject to phase out from Tier 2 613 Table F
48 Tier 2 instruments (and CET1 and AT1 instruments not included in rows 5 or 34) issued by subsidiaries
and held by third parties (amount allowed in group Tier 2) -
49 of which: instruments issued by subsidiaries subject to phase out -
50 Provisions 799
51 Tier 2 Capital before regulatory adjustments 12,780
(1) Total regulatory adjustments to CET1 of $20,928 million in row 28 is net of APRA’s allowance for treasury shares held by the Group’s eligible employee
share scheme trusts of $108 million as detailed in row 26a.
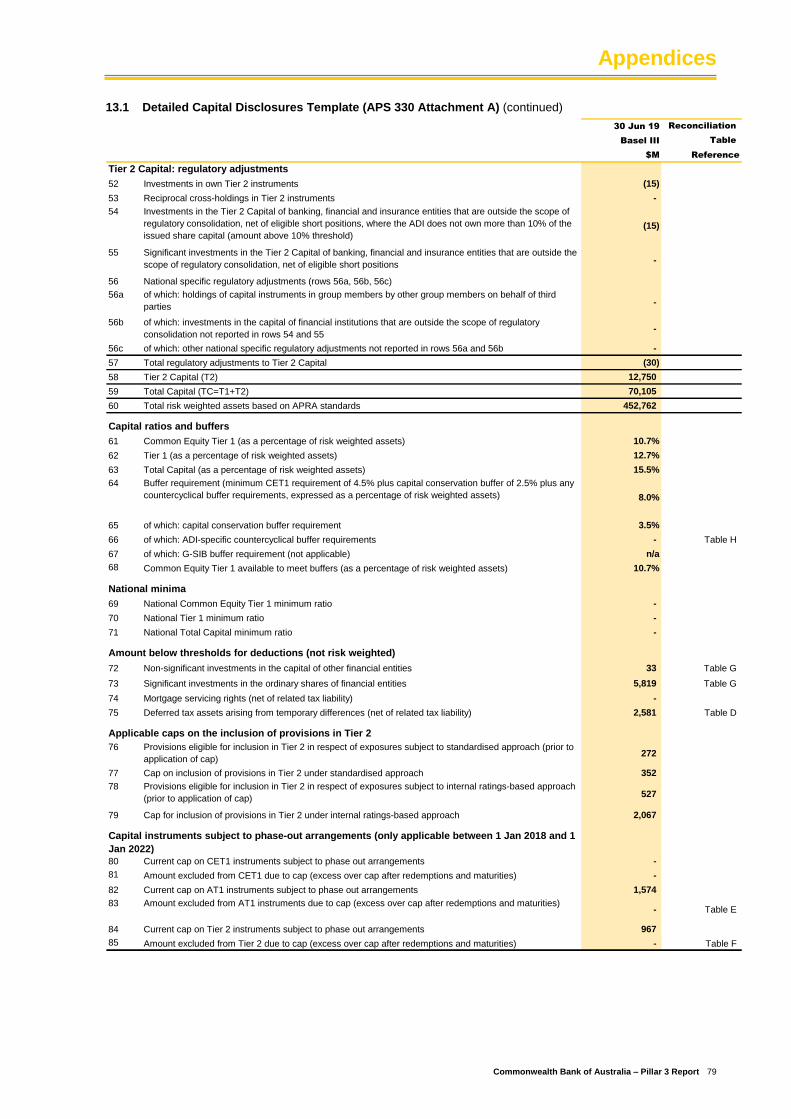
Appendices
Commonwealth Bank of Australia – Pillar 3 Report 79
13.1 Detailed Capital Disclosures Template (APS 330 Attachment A) (continued)
30 Jun 19 Reconciliation
Basel III Table
$M Reference
Tier 2 Capital: regulatory adjustments
52 Investments in own Tier 2 instruments (15)
53 Reciprocal cross-holdings in Tier 2 instruments -
54 Investments in the Tier 2 Capital of banking, financial and insurance entities that are outside the scope of
regulatory consolidation, net of eligible short positions, where the ADI does not own more than 10% of the
issued share capital (amount above 10% threshold)(15)
55 Significant investments in the Tier 2 Capital of banking, financial and insurance entities that are outside the
scope of regulatory consolidation, net of eligible short positions-
56 National specific regulatory adjustments (rows 56a, 56b, 56c)
56a of which: holdings of capital instruments in group members by other group members on behalf of third
parties-
56b of which: investments in the capital of financial institutions that are outside the scope of regulatory
consolidation not reported in rows 54 and 55-
56c of which: other national specific regulatory adjustments not reported in rows 56a and 56b -
57 Total regulatory adjustments to Tier 2 Capital (30)
58 Tier 2 Capital (T2) 12,750
59 Total Capital (TC=T1+T2) 70,105
60 Total risk weighted assets based on APRA standards 452,762
Capital ratios and buffers
61 Common Equity Tier 1 (as a percentage of risk weighted assets) 10.7%
62 Tier 1 (as a percentage of risk weighted assets) 12.7%
63 Total Capital (as a percentage of risk weighted assets) 15.5%
64 Buffer requirement (minimum CET1 requirement of 4.5% plus capital conservation buffer of 2.5% plus any
countercyclical buffer requirements, expressed as a percentage of risk weighted assets) 8.0%
65 of which: capital conservation buffer requirement 3.5%
66 of which: ADI-specific countercyclical buffer requirements - Table H
67 of which: G-SIB buffer requirement (not applicable) n/a
68 Common Equity Tier 1 available to meet buffers (as a percentage of risk weighted assets) 10.7%
National minima
69 National Common Equity Tier 1 minimum ratio -
70 National Tier 1 minimum ratio -
71 National Total Capital minimum ratio -
Amount below thresholds for deductions (not risk weighted)
72 Non-significant investments in the capital of other financial entities 33 Table G
73 Significant investments in the ordinary shares of financial entities 5,819 Table G
74 Mortgage servicing rights (net of related tax liability) -
75 Deferred tax assets arising from temporary differences (net of related tax liability) 2,581 Table D
Applicable caps on the inclusion of provisions in Tier 2
76 Provisions eligible for inclusion in Tier 2 in respect of exposures subject to standardised approach (prior to
application of cap)272
77 Cap on inclusion of provisions in Tier 2 under standardised approach 352
78 Provisions eligible for inclusion in Tier 2 in respect of exposures subject to internal ratings-based approach
(prior to application of cap)527
79 Cap for inclusion of provisions in Tier 2 under internal ratings-based approach 2,067
80 Current cap on CET1 instruments subject to phase out arrangements -
81 Amount excluded from CET1 due to cap (excess over cap after redemptions and maturities) -
82 Current cap on AT1 instruments subject to phase out arrangements 1,574
83 Amount excluded from AT1 instruments due to cap (excess over cap after redemptions and maturities)- Table E
84 Current cap on Tier 2 instruments subject to phase out arrangements 967
85 Amount excluded from Tier 2 due to cap (excess over cap after redemptions and maturities) - Table F
Capital instruments subject to phase-out arrangements (only applicable between 1 Jan 2018 and 1
Jan 2022)
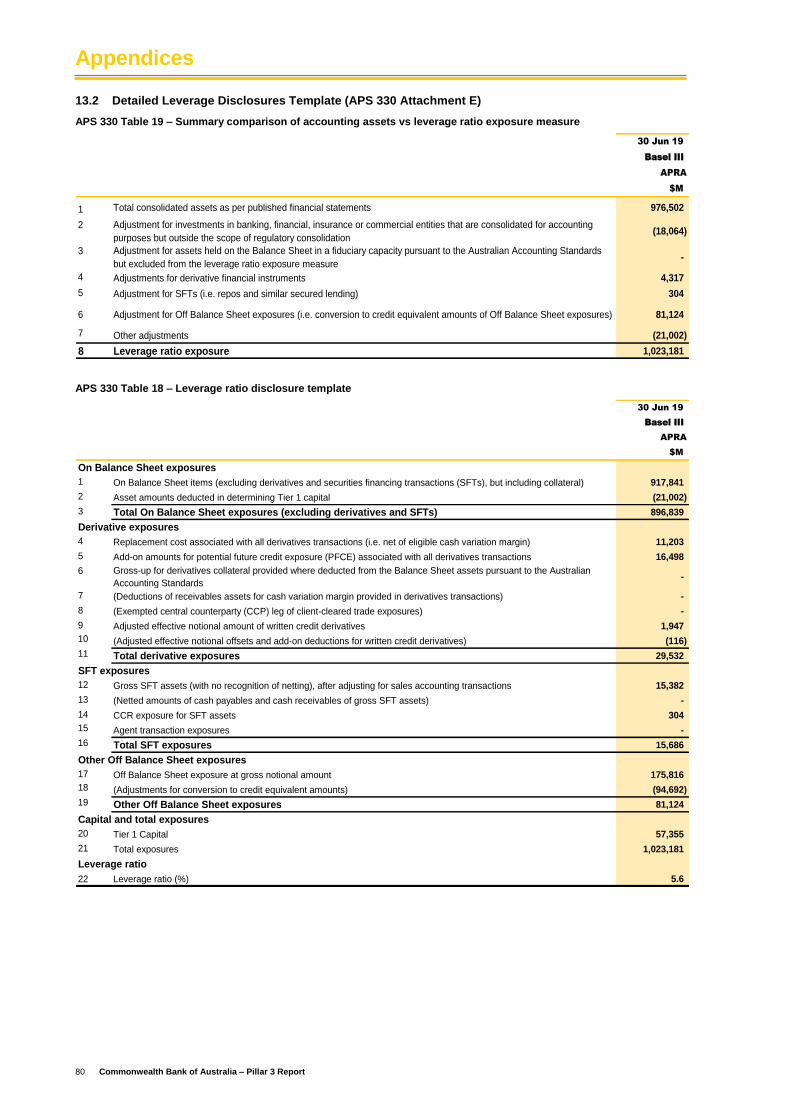
Appendices
80 Commonwealth Bank of Australia – Pillar 3 Report
13.2 Detailed Leverage Disclosures Template (APS 330 Attachment E)
APS 330 Table 19 – Summary comparison of accounting assets vs leverage ratio exposure measure
30 Jun 19
Basel III
APRA
$M
1 Total consolidated assets as per published financial statements 976,502
2 Adjustment for investments in banking, financial, insurance or commercial entities that are consolidated for accounting
purposes but outside the scope of regulatory consolidation(18,064)
3 Adjustment for assets held on the Balance Sheet in a fiduciary capacity pursuant to the Australian Accounting Standards
but excluded from the leverage ratio exposure measure-
4 Adjustments for derivative financial instruments 4,317
5 Adjustment for SFTs (i.e. repos and similar secured lending) 304
6 Adjustment for Off Balance Sheet exposures (i.e. conversion to credit equivalent amounts of Off Balance Sheet exposures) 81,124
7 Other adjustments (21,002)
8 Leverage ratio exposure 1,023,181
APS 330 Table 18 – Leverage ratio disclosure template
30 Jun 19
Basel III
APRA
$M
On Balance Sheet exposures
1 On Balance Sheet items (excluding derivatives and securities financing transactions (SFTs), but including collateral) 917,841
2 Asset amounts deducted in determining Tier 1 capital (21,002)
3 Total On Balance Sheet exposures (excluding derivatives and SFTs) 896,839
Derivative exposures
4 Replacement cost associated with all derivatives transactions (i.e. net of eligible cash variation margin) 11,203
5 Add-on amounts for potential future credit exposure (PFCE) associated with all derivatives transactions 16,498
6 Gross-up for derivatives collateral provided where deducted from the Balance Sheet assets pursuant to the Australian
Accounting Standards-
7 (Deductions of receivables assets for cash variation margin provided in derivatives transactions) -
8 (Exempted central counterparty (CCP) leg of client-cleared trade exposures) -
9 Adjusted effective notional amount of written credit derivatives 1,947
10 (Adjusted effective notional offsets and add-on deductions for written credit derivatives) (116)
11 Total derivative exposures 29,532
SFT exposures
12 Gross SFT assets (with no recognition of netting), after adjusting for sales accounting transactions 15,382
13 (Netted amounts of cash payables and cash receivables of gross SFT assets) -
14 CCR exposure for SFT assets 304
15 Agent transaction exposures -
16 Total SFT exposures 15,686
Other Off Balance Sheet exposures
17 Off Balance Sheet exposure at gross notional amount 175,816
18 (Adjustments for conversion to credit equivalent amounts) (94,692)
19 Other Off Balance Sheet exposures 81,124
Capital and total exposures
20 Tier 1 Capital 57,355
21 Total exposures 1,023,181
Leverage ratio
22 Leverage ratio (%) 5.6

Appendices
Commonwealth Bank of Australia – Pillar 3 Report 81
13.3 Regulatory Balance Sheet
The following table provides details on the Commonwealth Bank of Australia Group’s Balance Sheet and the Level 2 Regulatory
Balance Sheet as at 30 June 2019.
Level 2
Group Regulatory Template/
Balance Balance Reconciliation
Sheet Adjustment (1)
Sheet Table
$M $M $M Reference
Assets
Cash and liquid assets 29,387 (6) 29,381
Receivables due from other financial institutions 8,093 - 8,093
Assets at fair value through Income Statement:
Trading 32,506 - 32,506
Other 1,171 (518) 653
Derivative assets 25,215 - 25,215
Investment securities: Table G
At amortised cost 7,355 - 7,355
At fair value through Other Comprehensive Income 78,912 - 78,912
Loans, bills discounted and other receivables 755,141 (4,738) 750,403
Bank acceptances of customers 32 - 32
Investment in regulatory non-consolidated subsidiaries - 2,906 2,906 Table G
Property, plant and equipment 2,383 - 2,383
Investment in associates and joint ventures 3,001 (7) 2,994 Table G
Intangible assets 7,965 1,795 9,760 Table C
Deferred tax assets 1,675 17 1,692 Table D
Other assets 7,115 (1,091) 6,024
Assets held for sale 16,551 (16,422) 129 Table G
Total assets 976,502 (18,064) 958,438
Liabilities
Deposits and other public borrowings 636,040 3,472 639,512
Payables due to other financial institutions 23,370 - 23,370
Liabilities at fair value through Income Statement 8,520 - 8,520
Derivative liabilities 22,777 89 22,866
Bank acceptances 32 - 32
Current tax liabilities 326 (110) 216
Other provisions 2,751 (284) 2,467
Debt issues 163,990 (4,792) 159,198
Bills payable and other liabilities 10,285 (425) 9,860
Loan capital 22,966 - 22,966 Table E
Liabilities held for sale 15,796 (15,663) 133
Total liabilities 906,853 (17,713) 889,140
Net assets 69,649 (351) 69,298
Shareholders' Equity
Share capital:
Ordinary share capital 38,020 86 38,106 Row 1, Table A
Reserves 3,092 52 3,144 Row 3
Retained profits 28,482 (437) 28,045 Row 2
Shareholders' Equity attributable to Equity holders of the Bank 69,594 (299) 69,295
Non-controlling interests 55 (52) 3 Table B
Total Shareholders' Equity 69,649 (351) 69,298
(1) Reflects the deconsolidation of the insurance and funds management entities and those entities through which securitisation of the Group's assets are conducted. These entities are classified as non-consolidated subsidiaries by APRA and are excluded from the Level 2 Regulatory Consolidated Banking Group.
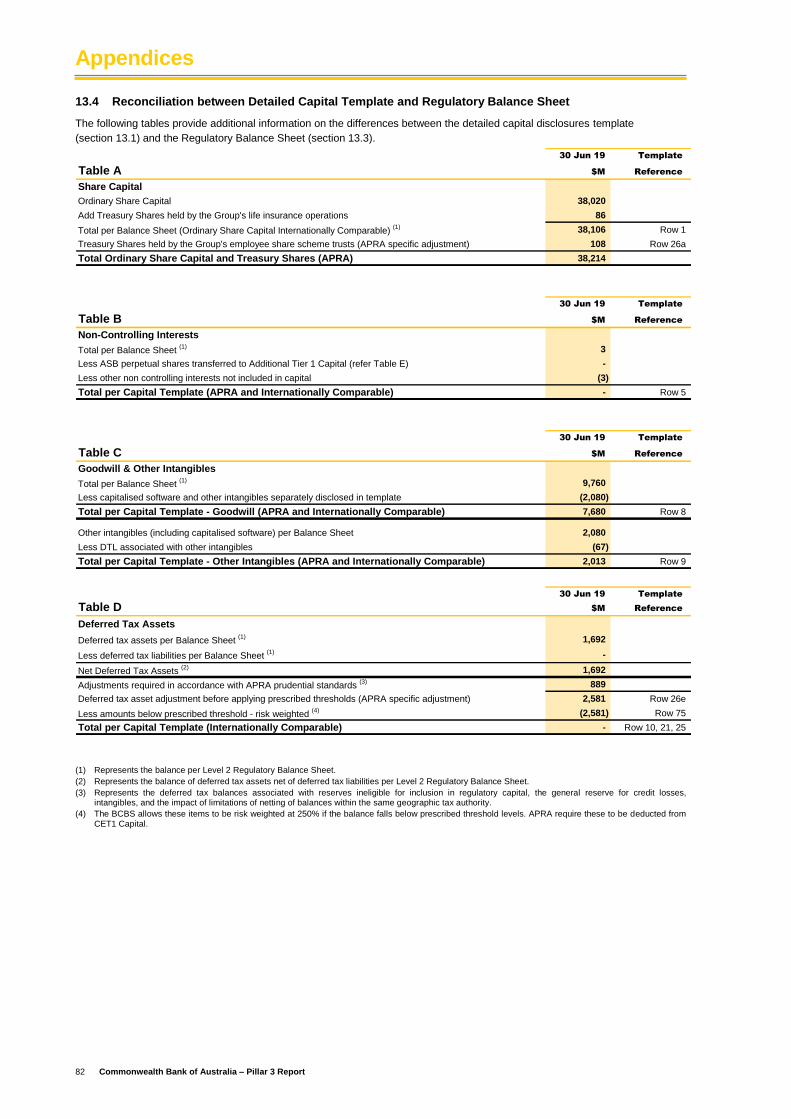
Appendices
82 Commonwealth Bank of Australia – Pillar 3 Report
13.4 Reconciliation between Detailed Capital Template and Regulatory Balance Sheet
The following tables provide additional information on the differences between the detailed capital disclosures template
(section 13.1) and the Regulatory Balance Sheet (section 13.3).
30 Jun 19 Template
Table A $M Reference
Share Capital
Ordinary Share Capital 38,020
Add Treasury Shares held by the Group's life insurance operations 86
Total per Balance Sheet (Ordinary Share Capital Internationally Comparable) (1) 38,106 Row 1
Treasury Shares held by the Group's employee share scheme trusts (APRA specific adjustment) 108 Row 26a
Total Ordinary Share Capital and Treasury Shares (APRA) 38,214
30 Jun 19 Template
Table B $M Reference
Non-Controlling Interests
Total per Balance Sheet (1) 3
Less ASB perpetual shares transferred to Additional Tier 1 Capital (refer Table E) -
Less other non controlling interests not included in capital (3)
Total per Capital Template (APRA and Internationally Comparable) - Row 5
30 Jun 19 Template
Table C $M Reference
Goodwill & Other Intangibles
Total per Balance Sheet (1) 9,760
Less capitalised software and other intangibles separately disclosed in template (2,080)
Total per Capital Template - Goodwill (APRA and Internationally Comparable) 7,680 Row 8
Other intangibles (including capitalised software) per Balance Sheet 2,080
Less DTL associated with other intangibles (67)
Total per Capital Template - Other Intangibles (APRA and Internationally Comparable) 2,013 Row 9
30 Jun 19 Template
Table D $M Reference
Deferred Tax Assets
Deferred tax assets per Balance Sheet (1) 1,692
Less deferred tax liabilities per Balance Sheet (1) -
Net Deferred Tax Assets (2) 1,692
Adjustments required in accordance with APRA prudential standards (3) 889
Deferred tax asset adjustment before applying prescribed thresholds (APRA specific adjustment) 2,581 Row 26e
Less amounts below prescribed threshold - risk weighted (4) (2,581) Row 75
Total per Capital Template (Internationally Comparable) - Row 10, 21, 25
(1) Represents the balance per Level 2 Regulatory Balance Sheet.
(2) Represents the balance of deferred tax assets net of deferred tax liabilities per Level 2 Regulatory Balance Sheet.
(3) Represents the deferred tax balances associated with reserves ineligible for inclusion in regulatory capital, the general reserve for credit losses, intangibles, and the impact of limitations of netting of balances within the same geographic tax authority.
(4) The BCBS allows these items to be risk weighted at 250% if the balance falls below prescribed threshold levels. APRA require these to be deducted from CET1 Capital.
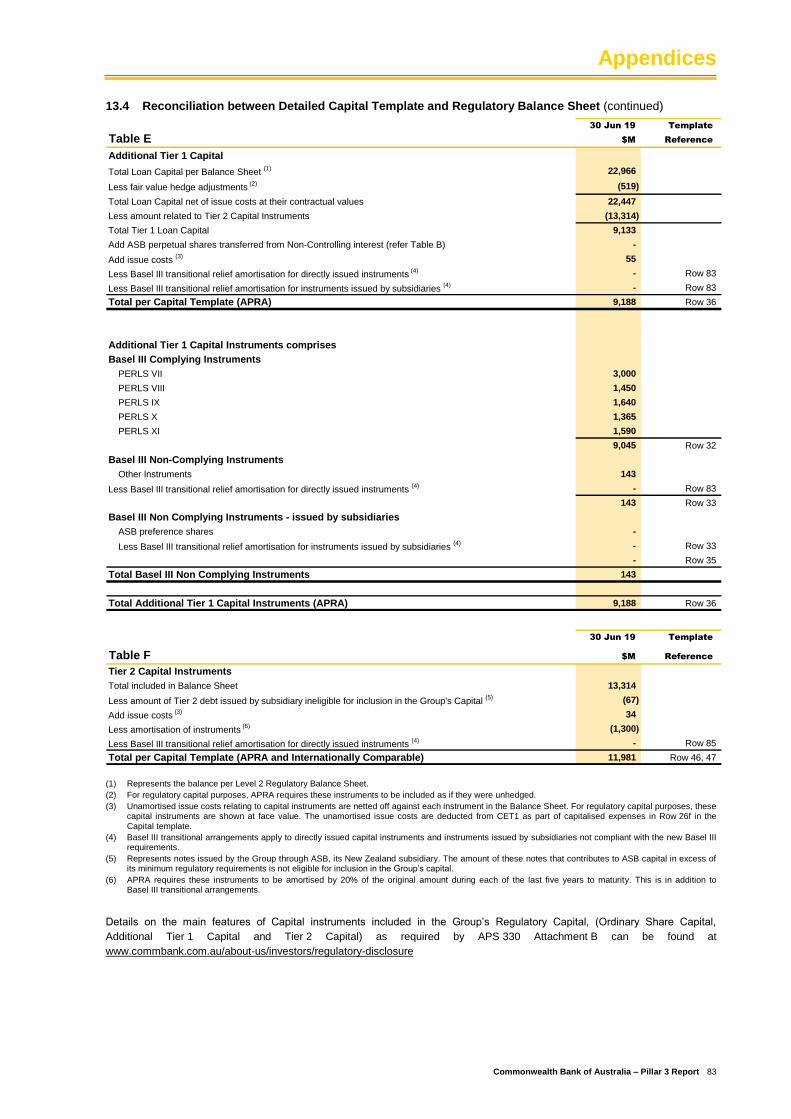
Appendices
Commonwealth Bank of Australia – Pillar 3 Report 83
13.4 Reconciliation between Detailed Capital Template and Regulatory Balance Sheet (continued)
30 Jun 19 Template
Table E $M Reference
Additional Tier 1 Capital
Total Loan Capital per Balance Sheet (1) 22,966
Less fair value hedge adjustments (2) (519)
Total Loan Capital net of issue costs at their contractual values 22,447
Less amount related to Tier 2 Capital Instruments (13,314)
Total Tier 1 Loan Capital 9,133
Add ASB perpetual shares transferred from Non-Controlling interest (refer Table B) -
Add issue costs (3) 55
Less Basel III transitional relief amortisation for directly issued instruments (4) - Row 83
Less Basel III transitional relief amortisation for instruments issued by subsidiaries (4) - Row 83
Total per Capital Template (APRA) 9,188 Row 36
Additional Tier 1 Capital Instruments comprises
Basel III Complying Instruments
PERLS VII 3,000
PERLS VIII 1,450
PERLS IX 1,640
PERLS X 1,365
PERLS XI 1,590
9,045 Row 32
Basel III Non-Complying Instruments
Other Instruments 143
Less Basel III transitional relief amortisation for directly issued instruments (4) - Row 83
143 Row 33
Basel III Non Complying Instruments - issued by subsidiaries
ASB preference shares -
Less Basel III transitional relief amortisation for instruments issued by subsidiaries (4) - Row 33
- Row 35
Total Basel III Non Complying Instruments 143
Total Additional Tier 1 Capital Instruments (APRA) 9,188 Row 36
30 Jun 19 Template
Table F $M Reference
Tier 2 Capital Instruments
Total included in Balance Sheet 13,314
Less amount of Tier 2 debt issued by subsidiary ineligible for inclusion in the Group's Capital (5) (67)
Add issue costs (3) 34
Less amortisation of instruments (6) (1,300)
Less Basel III transitional relief amortisation for directly issued instruments (4) - Row 85
Total per Capital Template (APRA and Internationally Comparable) 11,981 Row 46, 47
(1) Represents the balance per Level 2 Regulatory Balance Sheet.
(2) For regulatory capital purposes, APRA requires these instruments to be included as if they were unhedged.
(3) Unamortised issue costs relating to capital instruments are netted off against each instrument in the Balance Sheet. For regulatory capital purposes, these capital instruments are shown at face value. The unamortised issue costs are deducted from CET1 as part of capitalised expenses in Row 26f in the Capital template.
(4) Basel III transitional arrangements apply to directly issued capital instruments and instruments issued by subsidiaries not compliant with the new Basel III requirements.
(5) Represents notes issued by the Group through ASB, its New Zealand subsidiary. The amount of these notes that contributes to ASB capital in excess of its minimum regulatory requirements is not eligible for inclusion in the Group’s capital.
(6) APRA requires these instruments to be amortised by 20% of the original amount during each of the last five years to maturity. This is in addition to Basel III transitional arrangements.
Details on the main features of Capital instruments included in the Group’s Regulatory Capital, (Ordinary Share Capital,
Additional Tier 1 Capital and Tier 2 Capital) as required by APS 330 Attachment B can be found at
www.commbank.com.au/about-us/investors/regulatory-disclosure
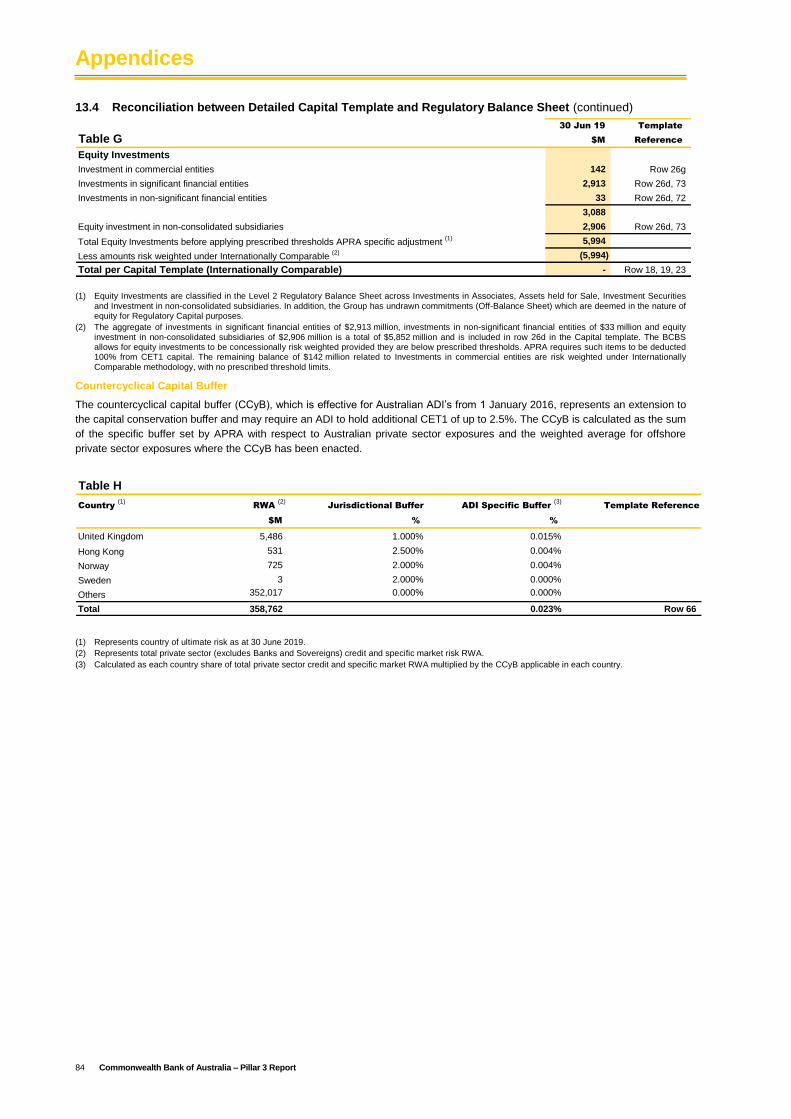
Appendices
84 Commonwealth Bank of Australia – Pillar 3 Report
13.4 Reconciliation between Detailed Capital Template and Regulatory Balance Sheet (continued)
30 Jun 19 Template
Table G $M Reference
Equity Investments
Investment in commercial entities 142 Row 26g
Investments in significant financial entities 2,913 Row 26d, 73
Investments in non-significant financial entities 33 Row 26d, 72
3,088
Equity investment in non-consolidated subsidiaries 2,906 Row 26d, 73
Total Equity Investments before applying prescribed thresholds APRA specific adjustment (1) 5,994
Less amounts risk weighted under Internationally Comparable (2) (5,994)
Total per Capital Template (Internationally Comparable) - Row 18, 19, 23
(1) Equity Investments are classified in the Level 2 Regulatory Balance Sheet across Investments in Associates, Assets held for Sale, Investment Securities
and Investment in non-consolidated subsidiaries. In addition, the Group has undrawn commitments (Off-Balance Sheet) which are deemed in the nature of equity for Regulatory Capital purposes.
(2) The aggregate of investments in significant financial entities of $2,913 million, investments in non-significant financial entities of $33 million and equity investment in non-consolidated subsidiaries of $2,906 million is a total of $5,852 million and is included in row 26d in the Capital template. The BCBS allows for equity investments to be concessionally risk weighted provided they are below prescribed thresholds. APRA requires such items to be deducted 100% from CET1 capital. The remaining balance of $142 million related to Investments in commercial entities are risk weighted under Internationally Comparable methodology, with no prescribed threshold limits.
Countercyclical Capital Buffer
The countercyclical capital buffer (CCyB), which is effective for Australian ADI’s from 1 January 2016, represents an extension to
the capital conservation buffer and may require an ADI to hold additional CET1 of up to 2.5%. The CCyB is calculated as the sum
of the specific buffer set by APRA with respect to Australian private sector exposures and the weighted average for offshore
private sector exposures where the CCyB has been enacted.
Table H
Country (1)
RWA (2)
Jurisdictional Buffer ADI Specific Buffer (3)
Template Reference
$M % %
United Kingdom 5,486 1.000% 0.015%
Hong Kong 531 2.500% 0.004%
Norway 725 2.000% 0.004%
Sweden 3 2.000% 0.000%
Others 352,017 0.000% 0.000%
Total 358,762 0.023% Row 66
(1) Represents country of ultimate risk as at 30 June 2019.
(2) Represents total private sector (excludes Banks and Sovereigns) credit and specific market risk RWA.
(3) Calculated as each country share of total private sector credit and specific market RWA multiplied by the CCyB applicable in each country.
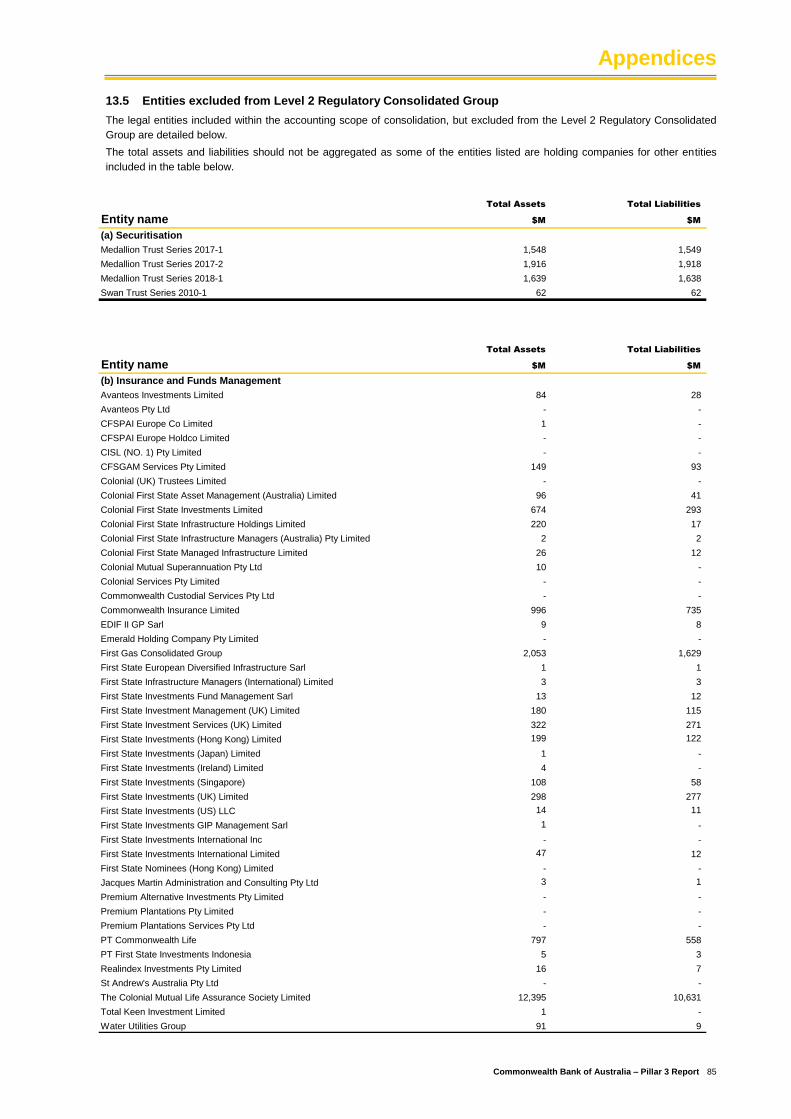
Appendices
Commonwealth Bank of Australia – Pillar 3 Report 85
13.5 Entities excluded from Level 2 Regulatory Consolidated Group
The legal entities included within the accounting scope of consolidation, but excluded from the Level 2 Regulatory Consolidated
Group are detailed below.
The total assets and liabilities should not be aggregated as some of the entities listed are holding companies for other entities
included in the table below.
Total Assets Total Liabilities
Entity name $M $M
(a) Securitisation
Medallion Trust Series 2017-1 1,548 1,549
Medallion Trust Series 2017-2 1,916 1,918
Medallion Trust Series 2018-1 1,639 1,638
Swan Trust Series 2010-1 62 62
Total Assets Total Liabilities
Entity name $M $M
(b) Insurance and Funds Management
Avanteos Investments Limited 84 28
Avanteos Pty Ltd - -
CFSPAI Europe Co Limited 1 -
CFSPAI Europe Holdco Limited - -
CISL (NO. 1) Pty Limited - -
CFSGAM Services Pty Limited 149 93
Colonial (UK) Trustees Limited - -
Colonial First State Asset Management (Australia) Limited 96 41
Colonial First State Investments Limited 674 293
Colonial First State Infrastructure Holdings Limited 220 17
Colonial First State Infrastructure Managers (Australia) Pty Limited 2 2
Colonial First State Managed Infrastructure Limited 26 12
Colonial Mutual Superannuation Pty Ltd 10 -
Colonial Services Pty Limited - -
Commonwealth Custodial Services Pty Ltd - -
Commonwealth Insurance Limited 996 735
EDIF II GP Sarl 9 8
Emerald Holding Company Pty Limited - -
First Gas Consolidated Group 2,053 1,629
First State European Diversified Infrastructure Sarl 1 1
First State Infrastructure Managers (International) Limited 3 3
First State Investments Fund Management Sarl 13 12
First State Investment Management (UK) Limited 180 115
First State Investment Services (UK) Limited 322 271
First State Investments (Hong Kong) Limited 199 122
First State Investments (Japan) Limited 1 -
First State Investments (Ireland) Limited 4 -
First State Investments (Singapore) 108 58
First State Investments (UK) Limited 298 277
First State Investments (US) LLC 14 11
First State Investments GIP Management Sarl 1 -
First State Investments International Inc - -
First State Investments International Limited 47 12
First State Nominees (Hong Kong) Limited - -
Jacques Martin Administration and Consulting Pty Ltd 3 1
Premium Alternative Investments Pty Limited - -
Premium Plantations Pty Limited - -
Premium Plantations Services Pty Ltd - -
PT Commonwealth Life 797 558
PT First State Investments Indonesia 5 3
Realindex Investments Pty Limited 16 7
St Andrew's Australia Pty Ltd - -
The Colonial Mutual Life Assurance Society Limited 12,395 10,631
Total Keen Investment Limited 1 -
Water Utilities Group 91 9
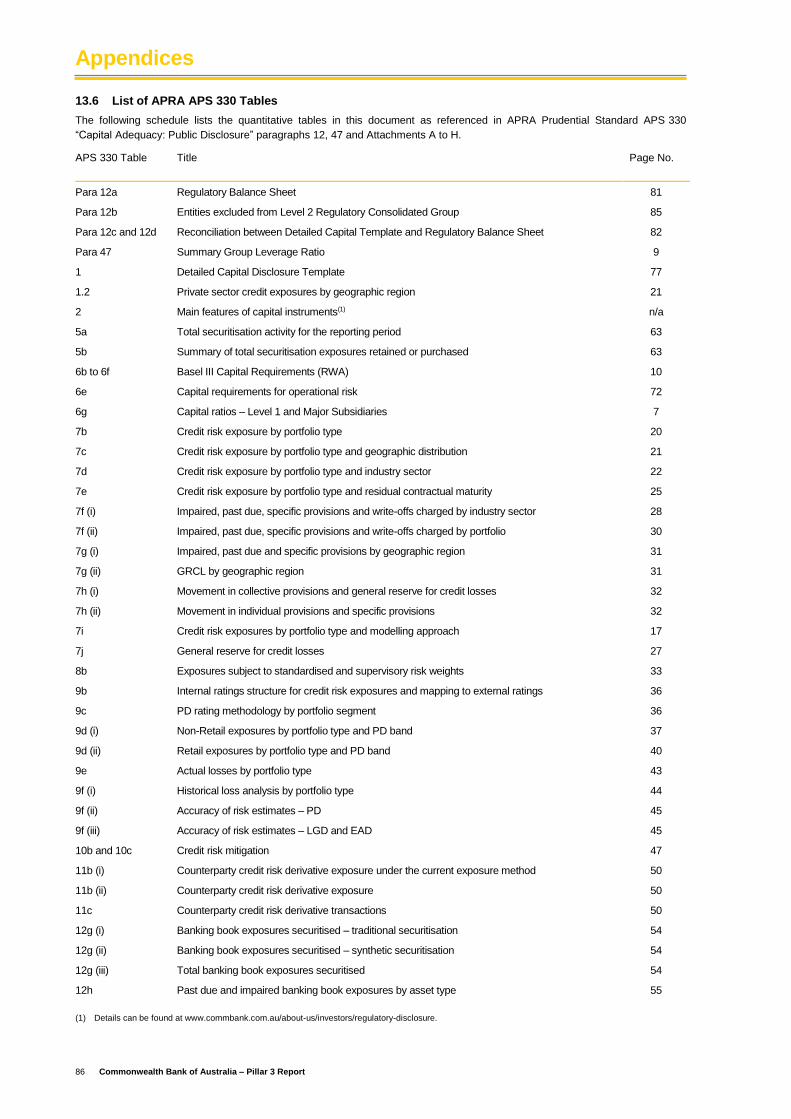
Appendices
86 Commonwealth Bank of Australia – Pillar 3 Report
13.6 List of APRA APS 330 Tables
The following schedule lists the quantitative tables in this document as referenced in APRA Prudential Standard APS 330
“Capital Adequacy: Public Disclosure” paragraphs 12, 47 and Attachments A to H.
APS 330 Table Title Page No.
Para 12a Regulatory Balance Sheet 81
Para 12b Entities excluded from Level 2 Regulatory Consolidated Group 85
Para 12c and 12d Reconciliation between Detailed Capital Template and Regulatory Balance Sheet 82
Para 47 Summary Group Leverage Ratio 9
1 Detailed Capital Disclosure Template 77
1.2 Private sector credit exposures by geographic region 21
2 Main features of capital instruments(1) n/a
5a Total securitisation activity for the reporting period 63
5b Summary of total securitisation exposures retained or purchased 63
6b to 6f Basel III Capital Requirements (RWA) 10
6e Capital requirements for operational risk 72
6g Capital ratios – Level 1 and Major Subsidiaries 7
7b Credit risk exposure by portfolio type 20
7c Credit risk exposure by portfolio type and geographic distribution 21
7d Credit risk exposure by portfolio type and industry sector 22
7e Credit risk exposure by portfolio type and residual contractual maturity 25
7f (i) Impaired, past due, specific provisions and write-offs charged by industry sector 28
7f (ii) Impaired, past due, specific provisions and write-offs charged by portfolio 30
7g (i) Impaired, past due and specific provisions by geographic region 31
7g (ii) GRCL by geographic region 31
7h (i) Movement in collective provisions and general reserve for credit losses 32
7h (ii) Movement in individual provisions and specific provisions 32
7i Credit risk exposures by portfolio type and modelling approach 17
7j General reserve for credit losses 27
8b Exposures subject to standardised and supervisory risk weights 33
9b Internal ratings structure for credit risk exposures and mapping to external ratings 36
9c PD rating methodology by portfolio segment 36
9d (i) Non-Retail exposures by portfolio type and PD band 37
9d (ii) Retail exposures by portfolio type and PD band 40
9e Actual losses by portfolio type 43
9f (i) Historical loss analysis by portfolio type 44
9f (ii) Accuracy of risk estimates – PD 45
9f (iii) Accuracy of risk estimates – LGD and EAD 45
10b and 10c Credit risk mitigation 47
11b (i) Counterparty credit risk derivative exposure under the current exposure method 50
11b (ii) Counterparty credit risk derivative exposure 50
11c Counterparty credit risk derivative transactions 50
12g (i) Banking book exposures securitised – traditional securitisation 54
12g (ii) Banking book exposures securitised – synthetic securitisation 54
12g (iii) Total banking book exposures securitised 54
12h Past due and impaired banking book exposures by asset type 55
(1) Details can be found at www.commbank.com.au/about-us/investors/regulatory-disclosure.
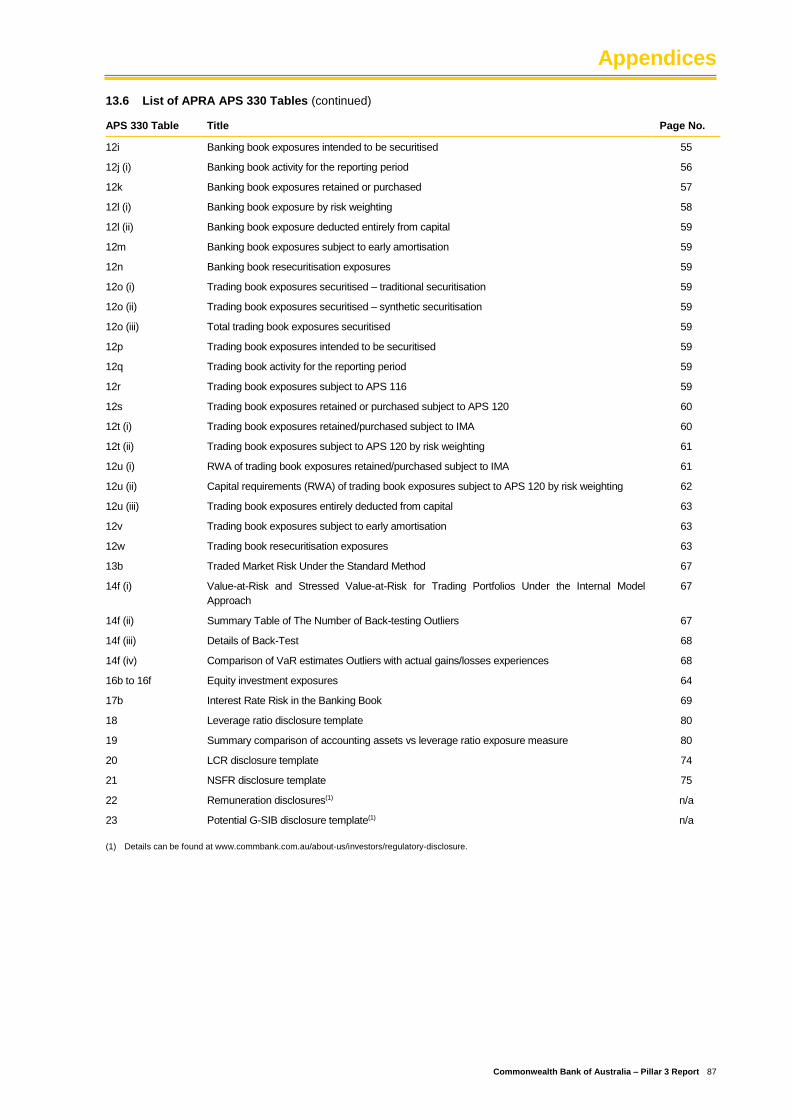
Appendices
Commonwealth Bank of Australia – Pillar 3 Report 87
13.6 List of APRA APS 330 Tables (continued)
APS 330 Table Title Page No.
12i Banking book exposures intended to be securitised 55
12j (i) Banking book activity for the reporting period 56
12k Banking book exposures retained or purchased 57
12l (i) Banking book exposure by risk weighting 58
12l (ii) Banking book exposure deducted entirely from capital 59
12m Banking book exposures subject to early amortisation 59
12n Banking book resecuritisation exposures 59
12o (i) Trading book exposures securitised – traditional securitisation 59
12o (ii) Trading book exposures securitised – synthetic securitisation 59
12o (iii) Total trading book exposures securitised 59
12p Trading book exposures intended to be securitised 59
12q Trading book activity for the reporting period 59
12r Trading book exposures subject to APS 116 59
12s Trading book exposures retained or purchased subject to APS 120 60
12t (i) Trading book exposures retained/purchased subject to IMA 60
12t (ii) Trading book exposures subject to APS 120 by risk weighting 61
12u (i) RWA of trading book exposures retained/purchased subject to IMA 61
12u (ii) Capital requirements (RWA) of trading book exposures subject to APS 120 by risk weighting 62
12u (iii) Trading book exposures entirely deducted from capital 63
12v Trading book exposures subject to early amortisation 63
12w Trading book resecuritisation exposures 63
13b Traded Market Risk Under the Standard Method 67
14f (i) Value-at-Risk and Stressed Value-at-Risk for Trading Portfolios Under the Internal Model
Approach
67
14f (ii) Summary Table of The Number of Back-testing Outliers 67
14f (iii) Details of Back-Test 68
14f (iv) Comparison of VaR estimates Outliers with actual gains/losses experiences 68
16b to 16f Equity investment exposures 64
17b Interest Rate Risk in the Banking Book 69
18 Leverage ratio disclosure template 80
19 Summary comparison of accounting assets vs leverage ratio exposure measure 80
20 LCR disclosure template 74
21 NSFR disclosure template 75
22 Remuneration disclosures(1) n/a
23 Potential G-SIB disclosure template(1) n/a
(1) Details can be found at www.commbank.com.au/about-us/investors/regulatory-disclosure.
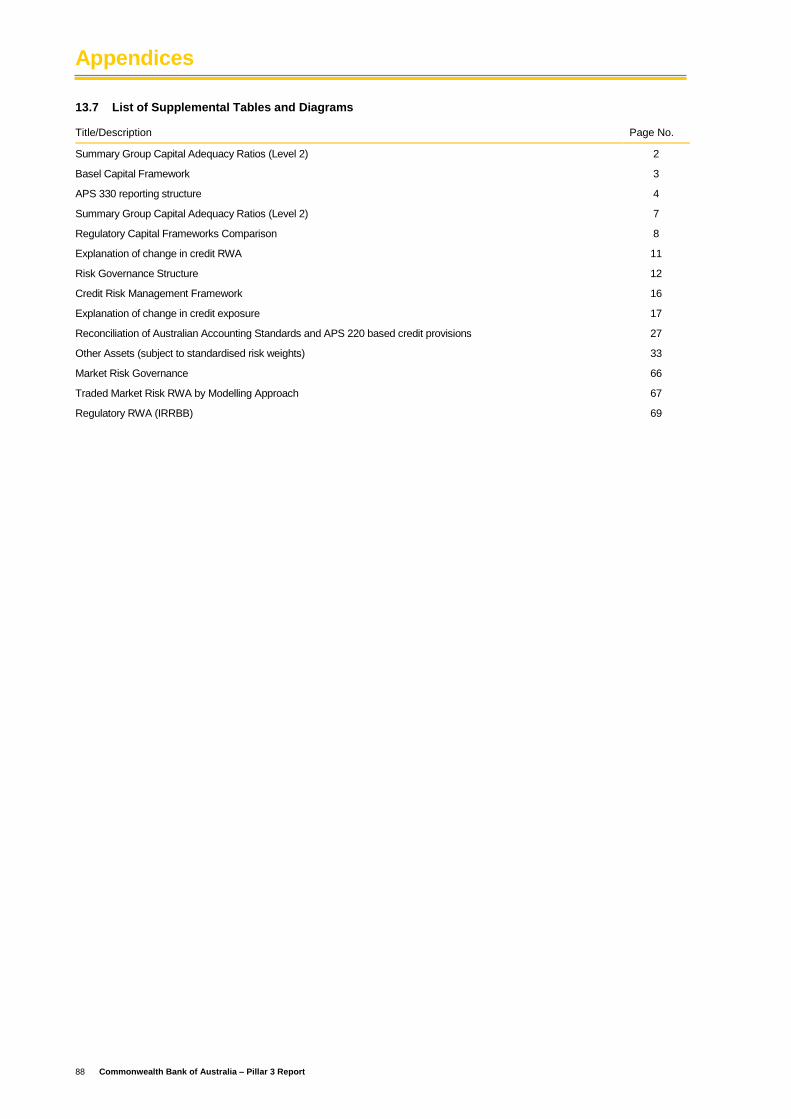
Appendices
88 Commonwealth Bank of Australia – Pillar 3 Report
13.7 List of Supplemental Tables and Diagrams
Title/Description Page No.
Summary Group Capital Adequacy Ratios (Level 2) 2
Basel Capital Framework 3
APS 330 reporting structure 4
Summary Group Capital Adequacy Ratios (Level 2) 7
Regulatory Capital Frameworks Comparison 8
Explanation of change in credit RWA 11
Risk Governance Structure 12
Credit Risk Management Framework 16
Explanation of change in credit exposure 17
Reconciliation of Australian Accounting Standards and APS 220 based credit provisions 27
Other Assets (subject to standardised risk weights) 33
Market Risk Governance 66
Traded Market Risk RWA by Modelling Approach 67
Regulatory RWA (IRRBB) 69
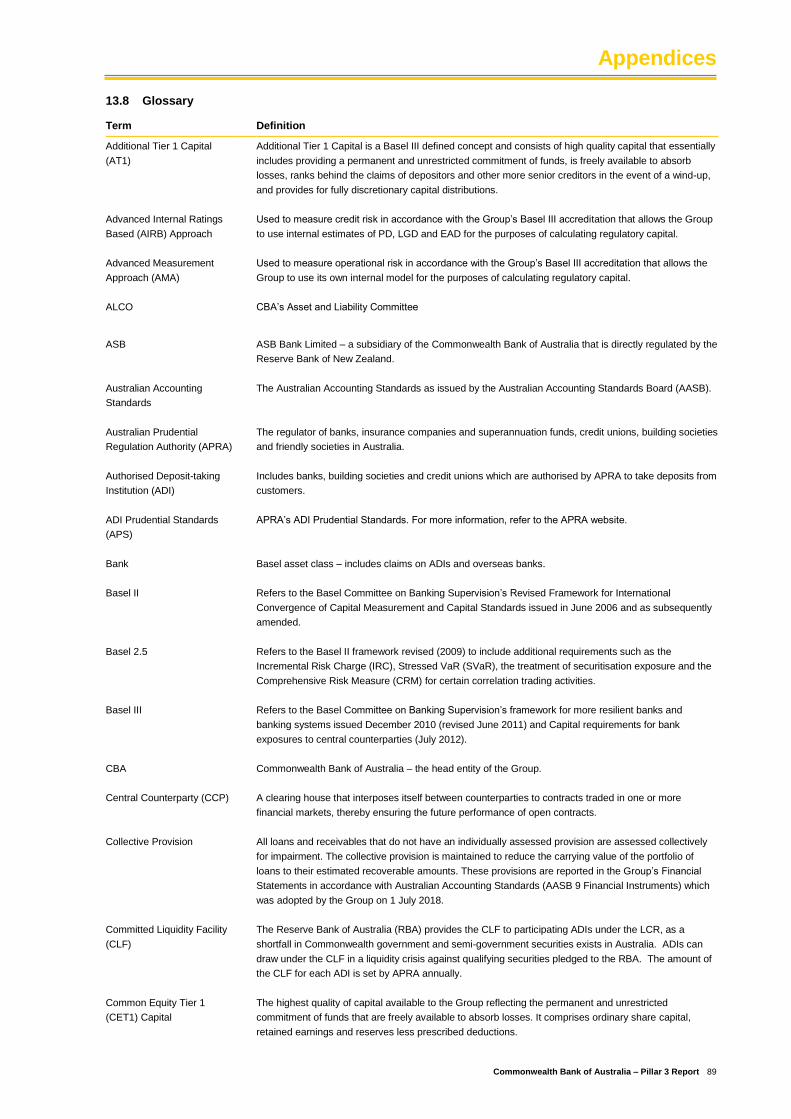
Appendices
Commonwealth Bank of Australia – Pillar 3 Report 89
13.8 Glossary
Term Definition
Additional Tier 1 Capital
(AT1)
Additional Tier 1 Capital is a Basel III defined concept and consists of high quality capital that essentially
includes providing a permanent and unrestricted commitment of funds, is freely available to absorb
losses, ranks behind the claims of depositors and other more senior creditors in the event of a wind-up,
and provides for fully discretionary capital distributions.
Advanced Internal Ratings
Based (AIRB) Approach
Used to measure credit risk in accordance with the Group’s Basel III accreditation that allows the Group
to use internal estimates of PD, LGD and EAD for the purposes of calculating regulatory capital.
Advanced Measurement
Approach (AMA)
Used to measure operational risk in accordance with the Group’s Basel III accreditation that allows the
Group to use its own internal model for the purposes of calculating regulatory capital.
ALCO CBA’s Asset and Liability Committee
ASB ASB Bank Limited – a subsidiary of the Commonwealth Bank of Australia that is directly regulated by the
Reserve Bank of New Zealand.
Australian Accounting
Standards
The Australian Accounting Standards as issued by the Australian Accounting Standards Board (AASB).
Australian Prudential
Regulation Authority (APRA)
The regulator of banks, insurance companies and superannuation funds, credit unions, building societies
and friendly societies in Australia.
Authorised Deposit-taking
Institution (ADI)
Includes banks, building societies and credit unions which are authorised by APRA to take deposits from
customers.
ADI Prudential Standards
(APS)
APRA’s ADI Prudential Standards. For more information, refer to the APRA website.
Bank Basel asset class – includes claims on ADIs and overseas banks.
Basel II Refers to the Basel Committee on Banking Supervision’s Revised Framework for International
Convergence of Capital Measurement and Capital Standards issued in June 2006 and as subsequently
amended.
Basel 2.5 Refers to the Basel II framework revised (2009) to include additional requirements such as the
Incremental Risk Charge (IRC), Stressed VaR (SVaR), the treatment of securitisation exposure and the
Comprehensive Risk Measure (CRM) for certain correlation trading activities.
Basel III Refers to the Basel Committee on Banking Supervision’s framework for more resilient banks and
banking systems issued December 2010 (revised June 2011) and Capital requirements for bank
exposures to central counterparties (July 2012).
CBA Commonwealth Bank of Australia – the head entity of the Group.
Central Counterparty (CCP) A clearing house that interposes itself between counterparties to contracts traded in one or more
financial markets, thereby ensuring the future performance of open contracts.
Collective Provision All loans and receivables that do not have an individually assessed provision are assessed collectively
for impairment. The collective provision is maintained to reduce the carrying value of the portfolio of
loans to their estimated recoverable amounts. These provisions are reported in the Group’s Financial
Statements in accordance with Australian Accounting Standards (AASB 9 Financial Instruments) which
was adopted by the Group on 1 July 2018.
Committed Liquidity Facility
(CLF)
The Reserve Bank of Australia (RBA) provides the CLF to participating ADIs under the LCR, as a
shortfall in Commonwealth government and semi-government securities exists in Australia. ADIs can
draw under the CLF in a liquidity crisis against qualifying securities pledged to the RBA. The amount of
the CLF for each ADI is set by APRA annually.
Common Equity Tier 1
(CET1) Capital
The highest quality of capital available to the Group reflecting the permanent and unrestricted
commitment of funds that are freely available to absorb losses. It comprises ordinary share capital,
retained earnings and reserves less prescribed deductions.
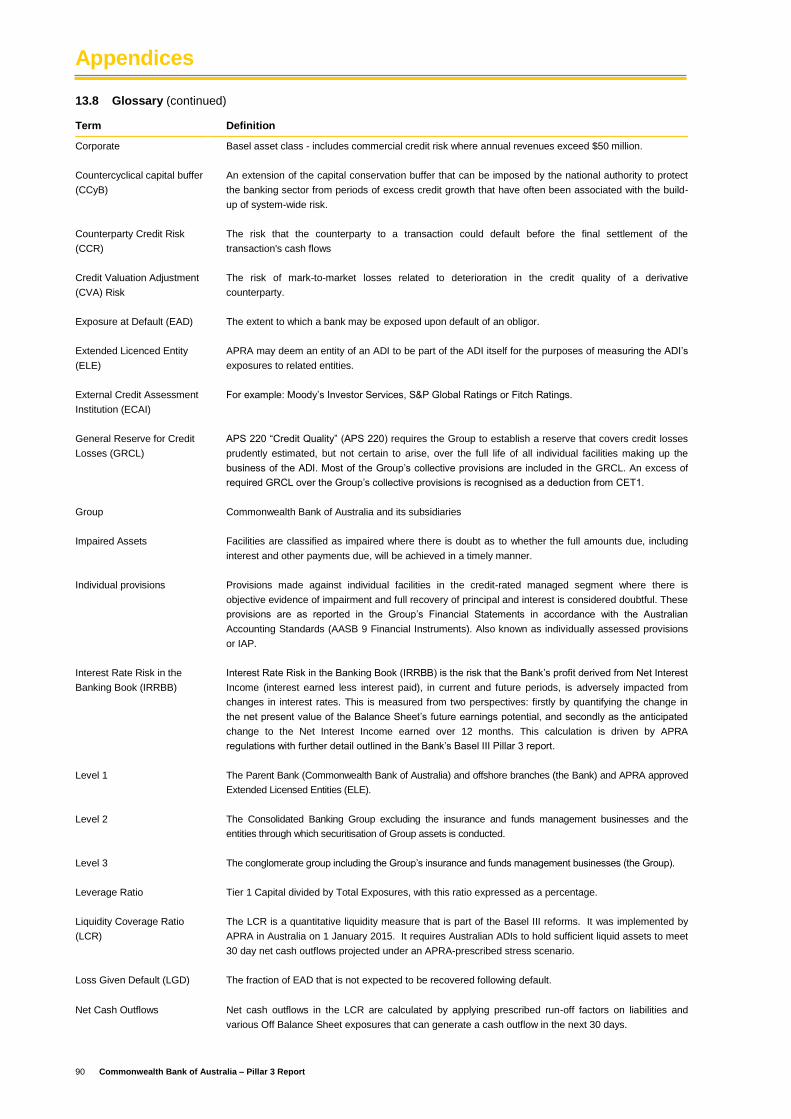
Appendices
90 Commonwealth Bank of Australia – Pillar 3 Report
13.8 Glossary (continued)
Term Definition
Corporate Basel asset class - includes commercial credit risk where annual revenues exceed $50 million.
Countercyclical capital buffer
(CCyB)
An extension of the capital conservation buffer that can be imposed by the national authority to protect
the banking sector from periods of excess credit growth that have often been associated with the build-
up of system-wide risk.
Counterparty Credit Risk
(CCR)
The risk that the counterparty to a transaction could default before the final settlement of the
transaction's cash flows
Credit Valuation Adjustment
(CVA) Risk
The risk of mark-to-market losses related to deterioration in the credit quality of a derivative
counterparty.
Exposure at Default (EAD) The extent to which a bank may be exposed upon default of an obligor.
Extended Licenced Entity
(ELE)
APRA may deem an entity of an ADI to be part of the ADI itself for the purposes of measuring the ADI’s
exposures to related entities.
External Credit Assessment
Institution (ECAI)
For example: Moody’s Investor Services, S&P Global Ratings or Fitch Ratings.
General Reserve for Credit
Losses (GRCL)
APS 220 “Credit Quality” (APS 220) requires the Group to establish a reserve that covers credit losses
prudently estimated, but not certain to arise, over the full life of all individual facilities making up the
business of the ADI. Most of the Group’s collective provisions are included in the GRCL. An excess of
required GRCL over the Group’s collective provisions is recognised as a deduction from CET1.
Group Commonwealth Bank of Australia and its subsidiaries
Impaired Assets Facilities are classified as impaired where there is doubt as to whether the full amounts due, including
interest and other payments due, will be achieved in a timely manner.
Individual provisions Provisions made against individual facilities in the credit-rated managed segment where there is
objective evidence of impairment and full recovery of principal and interest is considered doubtful. These
provisions are as reported in the Group’s Financial Statements in accordance with the Australian
Accounting Standards (AASB 9 Financial Instruments). Also known as individually assessed provisions
or IAP.
Interest Rate Risk in the
Banking Book (IRRBB)
Interest Rate Risk in the Banking Book (IRRBB) is the risk that the Bank’s profit derived from Net Interest
Income (interest earned less interest paid), in current and future periods, is adversely impacted from
changes in interest rates. This is measured from two perspectives: firstly by quantifying the change in
the net present value of the Balance Sheet’s future earnings potential, and secondly as the anticipated
change to the Net Interest Income earned over 12 months. This calculation is driven by APRA
regulations with further detail outlined in the Bank’s Basel III Pillar 3 report.
Level 1 The Parent Bank (Commonwealth Bank of Australia) and offshore branches (the Bank) and APRA approved
Extended Licensed Entities (ELE).
Level 2 The Consolidated Banking Group excluding the insurance and funds management businesses and the
entities through which securitisation of Group assets is conducted.
Level 3 The conglomerate group including the Group’s insurance and funds management businesses (the Group).
Leverage Ratio Tier 1 Capital divided by Total Exposures, with this ratio expressed as a percentage.
Liquidity Coverage Ratio
(LCR)
The LCR is a quantitative liquidity measure that is part of the Basel III reforms. It was implemented by
APRA in Australia on 1 January 2015. It requires Australian ADIs to hold sufficient liquid assets to meet
30 day net cash outflows projected under an APRA-prescribed stress scenario.
Loss Given Default (LGD) The fraction of EAD that is not expected to be recovered following default.
Net Cash Outflows Net cash outflows in the LCR are calculated by applying prescribed run-off factors on liabilities and
various Off Balance Sheet exposures that can generate a cash outflow in the next 30 days.
Appendices
Commonwealth Bank of Australia – Pillar 3 Report 91
13.8 Glossary (continued)
Term Definition
Net Stable Funding Ratio
(NSFR)
The NSFR more closely aligns the behaviour term of assets and liabilities. It is the ratio of the amount of
available stable funding (ASF) to the amount of required stable funding (RSF). ASF is the portion of an
Authorised Deposit-taking Institution’s (ADI) capital and liabilities expected to be a reliable source of
funds over a one year time horizon. RSF is a function of the liquidity characteristics and residual
maturities of an ADI’s assets and off-balance sheet activities.
Other Assets Basel asset class – primarily includes Cash, Investments in Related Entities, Fixed Assets and Margin
Lending.
Other Retail Basel asset class – primarily includes retail credit exposures not otherwise classed as a residential
mortgage, SME retail or a qualifying revolving retail asset.
Past Due Facilities are past due when a contracted amount, including principal or interest, has not been met when due
or it is otherwise outside contracted arrangements.
Probability of Default (PD) The likelihood that a debtor fails to meet an obligation or contractual commitment.
Prudential Capital Ratio
(PCR)
The regulatory minimum CET1, Tier 1 and Total Capital ratios that the Group is required to maintain at
all times.
Qualifying Revolving Retail
(QRR)
Basel asset class – represents revolving exposures to individuals less than $0.1m, unsecured and
unconditionally cancellable by the Group. Only Australian retail credit cards qualify for this AIRB asset
class.
RBA Reserve Bank of Australia.
RBNZ Reserve Bank of New Zealand.
Residential Mortgage Basel asset class – retail exposures secured by residential mortgage property.
Risk Weighted Assets (RWA) The value of the Group’s On and Off Balance Sheet assets are adjusted by risk weights calculated
according to various APRA prudential standards. For more information, refer to the APRA website.
Scaling Factor In order to broadly maintain the aggregate level of capital in the global financial system post
implementation of Basel II, the Basel Committee on Banking Supervision applies a scaling factor to the
risk weighted assets amounts for credit risk under the IRB approach of 1.06.
Securitisation Basel asset class – Group-originated securitised exposures and the provision of facilities to customers in
relation to securitisation activities.
SME Corporate Basel asset class – Small and Medium Enterprise (SME) commercial credit risk where annual revenues
are less than $50 million and exposures are greater than $1 million.
SME Retail Basel asset class – Small and Medium Enterprise (SME) exposures up to $1 million that are not secured
by residential mortgage property.
SME Retail Secured by
Residential Mortgage
Basel asset class – Small and Medium Enterprise (SME) exposures up to $1 million that are partly or
fully secured by residential mortgage property.
Sovereign Basel asset class – primarily includes claims on Australian and foreign governments, central banks
(including Reserve Bank of Australia), international banking agencies and regional development banks.
Specialised Lending Basel asset classes subject to the supervisory slotting approach and which include Income Producing
Real Estate (IPRE), object finance, project finance and commodity finance.
Specific Provisions APS 220 “Credit Quality” (APS 220) requires ADIs to report as specific provisions all provisions for
impairment assessed by an ADI on an individual basis in accordance with the Australian Accounting
Standards and that portion of provisions assessed on a collective basis which are deemed ineligible to
be included in the General Reserve for Credit Losses (which are primarily collective provisions on some
defaulted assets).
Appendices
92 Commonwealth Bank of Australia – Pillar 3 Report
13.8 Glossary (continued)
Term Definition
Stressed Value-at-Risk
(SVaR)
Stressed Value-at-Risk (SVaR) uses the same methodology as Value at Risk (VaR) except that the
historical data used is taken from a one year observation period of significant market volatility as seen
during the Global Financial Crisis.
Tier 1 Capital Comprises CET1 and Additional Tier 1 Capital.
Tier 2 Capital Capital items that fall short of the necessary conditions to qualify as Tier 1 Capital.
Total Exposures (as used in
the Leverage Ratio)
The sum of On Balance Sheet items, derivatives, securities financing transactions (SFTs), and Off
Balance Sheet items, net of any Tier 1 regulatory deductions that are already included in these items, as
outlined in APS 110 “Capital Adequacy” (APS 110) Attachment D.