Embed Size (px)
Citation preview

Basel II Pillar 3 Disclosures for the period ended 30 June 2016
- CIMB Bank Group
- CIMB Islamic Bank Group
- CIMB Investment Bank Group
Abbreviations
A-IRB Approach : Advanced Internal Ratings Based Approach
BIA : Basic Indicator Approach
CAF : Capital Adequacy Framework or in some instances referred to as
the Risk Weighted Capital Adequacy Framework (RWCAF)
CAFIB : Capital Adequacy Framework for Islamic Banks
CAR : Capital Adequacy Ratio or in some instances referred to as the Risk
Weighted Capital Ratio
CIMBBG : CIMB Bank, CIMB Islamic Bank Berhad, CIMBTH, CIMB Bank PLC
(Cambodia) and CIMB Factor Lease Berhad
CIMBIBG : CIMB Investment Bank Berhad, CIMB Futures SdnBhd and non-
financial subsidiaries
CIMBISLG : CIMB Islamic Bank Berhad, CIMB Islamic Nominees (Asing) SdnBhd
and CIMB Islamic Nominees (Tempatan) SdnBhd
CIMBGH Group : Group of Companies under CIMB Group Holdings Berhad
CIMBTH : CIMB Thai Bank Public Company Ltd and its subsidiaries
CIMB Bank : CIMB Bank Berhad and CIMB Bank (L) Ltd (as determined under the
Capital Adequacy Framework (Capital Components) and Capital
Adequacy Framework (Basel II - Risk Weighted Assets) to include its
wholly owned offshore banking subsidiary company)
CIMB Group or the Group : Collectively CIMBBG, CIMBIBG and CIMB Islamic as described within
this Report
CIMB IB : CIMB Investment Bank Berhad
CIMB Islamic : CIMB Islamic Bank Berhad
CRM : Credit Risk Mitigants
DFIs : Development Financial Institutions
EAD : Exposure at Default
ECAIs : External Credit Assessment Institutions
EL : Expected Loss
EP : Eligible Provision
F-IRB Approach : Foundation Internal Ratings Based Approach
HPE : Hire Purchase Exposures
IRB Approach : Internal Ratings Based Approach
IRRBB : Interest Rate Risk in the Banking Book
LGD : Loss Given Default
MDBs : Multilateral Development Bank
OTC : Over the Counter
PD : Probability of Default
PSEs : Non-Federal Government Public Sector Entities
PSIA : Profit Sharing Investment Accounts
QRRE : Qualifying Revolving Retail Exposures
RORBB : Rate of Return Risk in the Banking Book
RRE : Residential Real Estate
RWA : Risk Weighted Assets
SA : Standardised Approach
Table of Contents
OVERVIEW ..................................................................................................................................................... 2
CAPITAL MANAGEMENT ................................................................................................................................ 2
CREDIT RISK ................................................................................................................................................. 19
SECURITISATION .......................................................................................................................................... 79
MARKET RISK ............................................................................................................................................... 89
OPERATIONAL RISK ...................................................................................................................................... 89
EQUITY EXPOSURES IN BANKING BOOK ...................................................................................................... 90
INTEREST RATE RISK/RATE OF RETURN RISK IN THE BANKING BOOK ........................................................ 91
BASEL II PILLAR 3 DISCLOSURES FOR 30 JUNE 2016
2
OVERVIEW
The information herein is disclosed pursuant to the requirements of Bank Negara Malaysia’s RWCAF –
Disclosure Requirements (Pillar 3) and CAFIB – Disclosure Requirements (Pillar 3) and is published for
the period ended 30 June 2016.
Pursuant to paragraph 7.2 of BNM’s guidelines on CAFIB – Disclosure Requirements (Pillar 3), the Group
has applied the provision in whereby the Group has been exempted from disclosing comparative
information as a first time adoption of this requirement for CIMBISLG.
Any discrepancies between the totals and sum of the components in the tables contained in this
disclosure are due to actual summation method and then rounded up to the nearest thousands.
These disclosures have been reviewed and verified by internal auditors and approved by the Board Risk
Committee of CIMB Group, as delegated by the Board of Directors of CIMBGH Group.
CAPITAL MANAGEMENT
Capital Structure and Adequacy
On 13 October 2015, BNM issued revised guidelines on the Capital Adequacy Framework (Capital
Components), of which will take effect beginning 1 January 2016 and 1 January 2019 for banking
institutions and financial holding company respectively. BNM also issued updated guidelines on the
Capital Adequacy Framework (Basel II – Risk-Weighted Assets) which are applicable to all banking
institutions with immediate effect and all financial holding companies with effect from 1 January 2019.
The risk weighted assets of the CIMB Bank Group (other than CIMB Thai Bank and CIMB Bank PLC), CIMB
Bank and CIMB Islamic Bank are computed in accordance with the Capital Adequacy Framework (Basel II
- Risk-Weighted Assets). The IRB Approach is applied for the major credit exposures. It prescribes two
approaches, the F-IRB Approach and A-IRB Approach. The remaining credit exposures and Market Risk
are on the Standardised Approach while Operational Risk is based on Basic Indicator Approach.
The risk-weighted assets of CIMB Investment Bank Group are computed in accordance with
StandardisedApproachfor Credit Risk and Market Risk and Basic Indicator Approach for Operational Risk
based on the Capital Adequacy Framework (Basel II - Risk Weighted Assets).
The components of eligible regulatory capital are based on the Capital Adequacy Framework (Capital
Components). The comparative capital adequacy ratios as at 30 June 2015 were based on BNM's Capital
Adequacy Framework CAF.
BASEL II PILLAR 3 DISCLOSURES FOR 30 JUNE 2016
3
CAPITAL MANAGEMENT (CONTINUED)
Capital Structure and Adequacy (continued
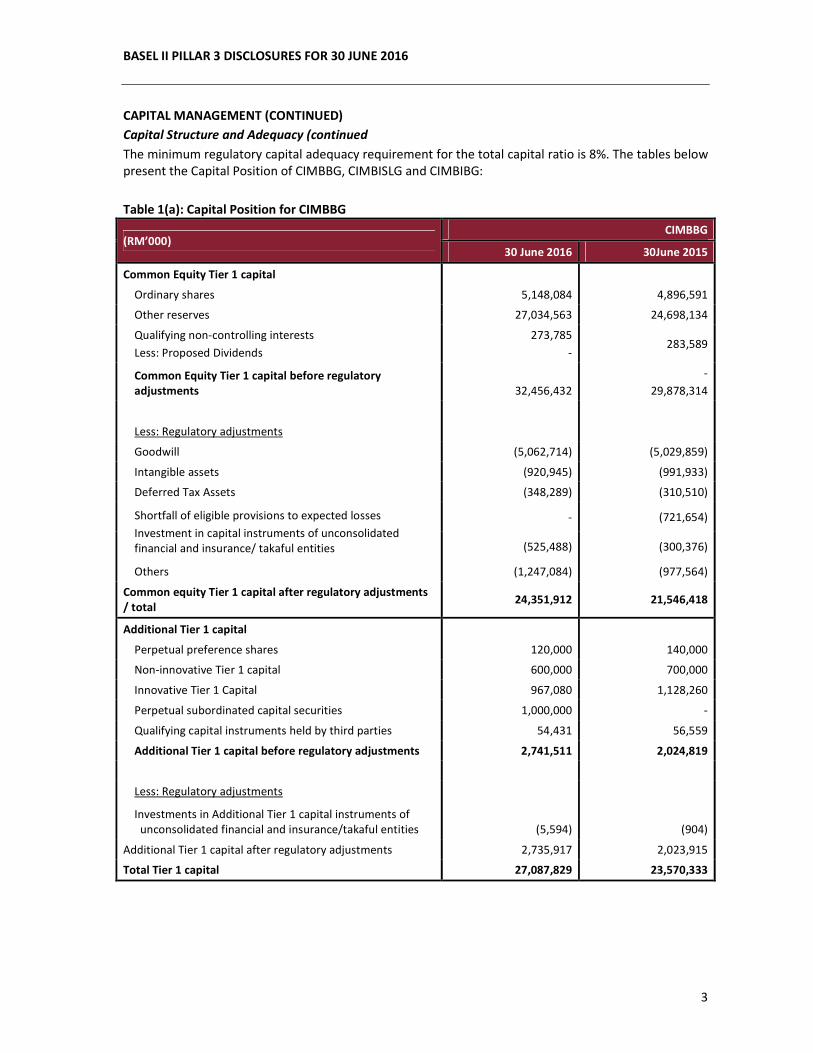
The minimum regulatory capital adequacy requirement for the total capital ratio is 8%. The tables below
present the Capital Position of CIMBBG, CIMBISLG and CIMBIBG:
Table 1(a): Capital Position for CIMBBG
(RM’000) CIMBBG
30 June 2016 30June 2015
Common Equity Tier 1 capital
Ordinary shares 5,148,084 4,896,591
Other reserves 27,034,563 24,698,134
Qualifying non-controlling interests
Less: Proposed Dividends
273,785
- 283,589
Common Equity Tier 1 capital before regulatory
adjustments
32,456,432
-
29,878,314
Less: Regulatory adjustments
Goodwill (5,062,714) (5,029,859)
Intangible assets (920,945) (991,933)
Deferred Tax Assets (348,289) (310,510)
Shortfall of eligible provisions to expected losses
Investment in capital instruments of unconsolidated
financial and insurance/ takaful entities
- (721,654)
(525,488) (300,376)
Others (1,247,084) (977,564)
Common equity Tier 1 capital after regulatory adjustments
/ total 24,351,912 21,546,418
Additional Tier 1 capital
Perpetual preference shares 120,000 140,000
Non-innovative Tier 1 capital 600,000 700,000
Innovative Tier 1 Capital 967,080 1,128,260
Perpetual subordinated capital securities 1,000,000 -
Qualifying capital instruments held by third parties 54,431 56,559
Additional Tier 1 capital before regulatory adjustments 2,741,511 2,024,819
Less: Regulatory adjustments
Investments in Additional Tier 1 capital instruments of
unconsolidated financial and insurance/takaful entities
(5,594)
(904)
Additional Tier 1 capital after regulatory adjustments 2,735,917 2,023,915
Total Tier 1 capital 27,087,829 23,570,333
BASEL II PILLAR 3 DISCLOSURES FOR 30 JUNE 2016
4
CAPITAL MANAGEMENT (CONTINUED)
Capital Structure and Adequacy (continued)
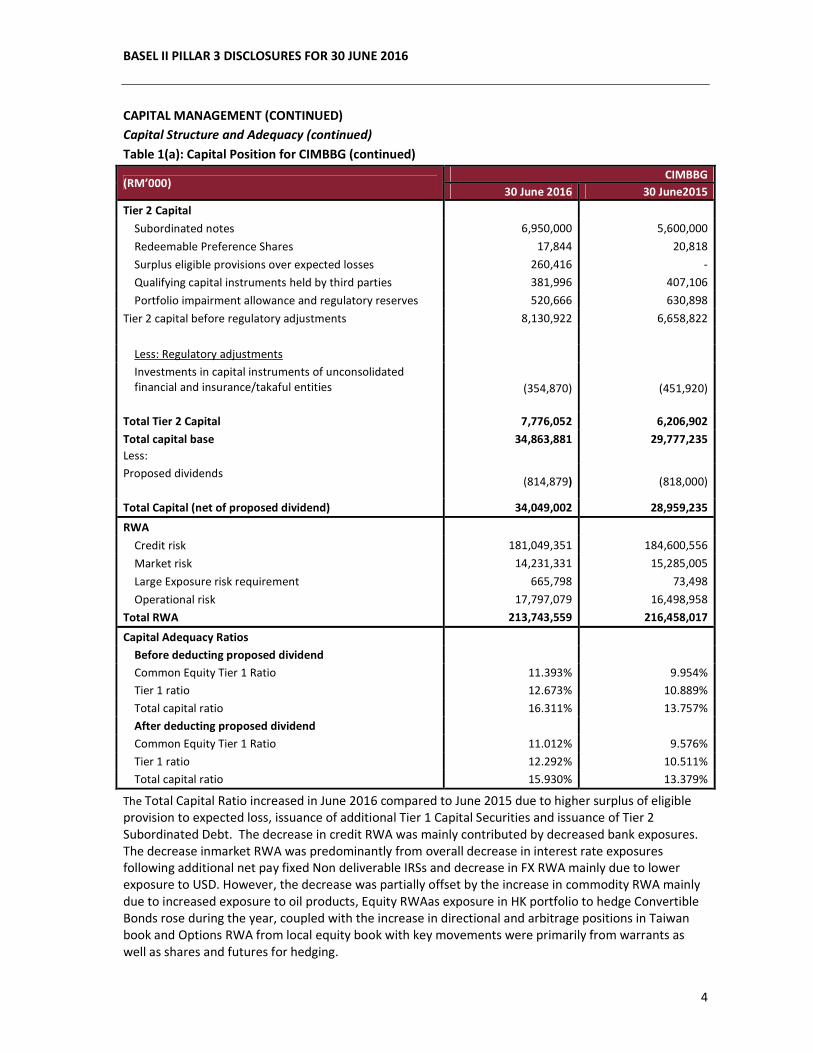
Table 1(a): Capital Position for CIMBBG (continued)
(RM’000) CIMBBG
30 June 2016 30 June2015
Tier 2 Capital
Subordinated notes 6,950,000 5,600,000
Redeemable Preference Shares 17,844 20,818
Surplus eligible provisions over expected losses 260,416 -
Qualifying capital instruments held by third parties 381,996 407,106
Portfolio impairment allowance and regulatory reserves 520,666 630,898
Tier 2 capital before regulatory adjustments 8,130,922 6,658,822
Less: Regulatory adjustments
Investments in capital instruments of unconsolidated
financial and insurance/takaful entities
(354,870)
(451,920)
Total Tier 2 Capital 7,776,052 6,206,902
Total capital base
Less:
34,863,881
29,777,235
Proposed dividends
(814,879) (818,000)
Total Capital (net of proposed dividend) 34,049,002 28,959,235
RWA
Credit risk 181,049,351 184,600,556
Market risk 14,231,331 15,285,005
Large Exposure risk requirement 665,798 73,498
Operational risk 17,797,079 16,498,958
Total RWA 213,743,559 216,458,017
Capital Adequacy Ratios
Before deducting proposed dividend
Common Equity Tier 1 Ratio 11.393% 9.954%
Tier 1 ratio 12.673% 10.889%
Total capital ratio 16.311% 13.757%
After deducting proposed dividend
Common Equity Tier 1 Ratio 11.012% 9.576%
Tier 1 ratio 12.292% 10.511%
Total capital ratio 15.930% 13.379%
The Total Capital Ratio increased in June 2016 compared to June 2015 due to higher surplus of eligible
provision to expected loss, issuance of additional Tier 1 Capital Securities and issuance of Tier 2
Subordinated Debt. The decrease in credit RWA was mainly contributed by decreased bank exposures.
The decrease inmarket RWA was predominantly from overall decrease in interest rate exposures
following additional net pay fixed Non deliverable IRSs and decrease in FX RWA mainly due to lower
exposure to USD. However, the decrease was partially offset by the increase in commodity RWA mainly
due to increased exposure to oil products, Equity RWAas exposure in HK portfolio to hedge Convertible
Bonds rose during the year, coupled with the increase in directional and arbitrage positions in Taiwan
book and Options RWA from local equity book with key movements were primarily from warrants as
well as shares and futures for hedging.
BASEL II PILLAR 3 DISCLOSURES FOR 30 JUNE 2016
5
CAPITAL MANAGEMENT (CONTINUED)
Capital Structure and Adequacy (continued)
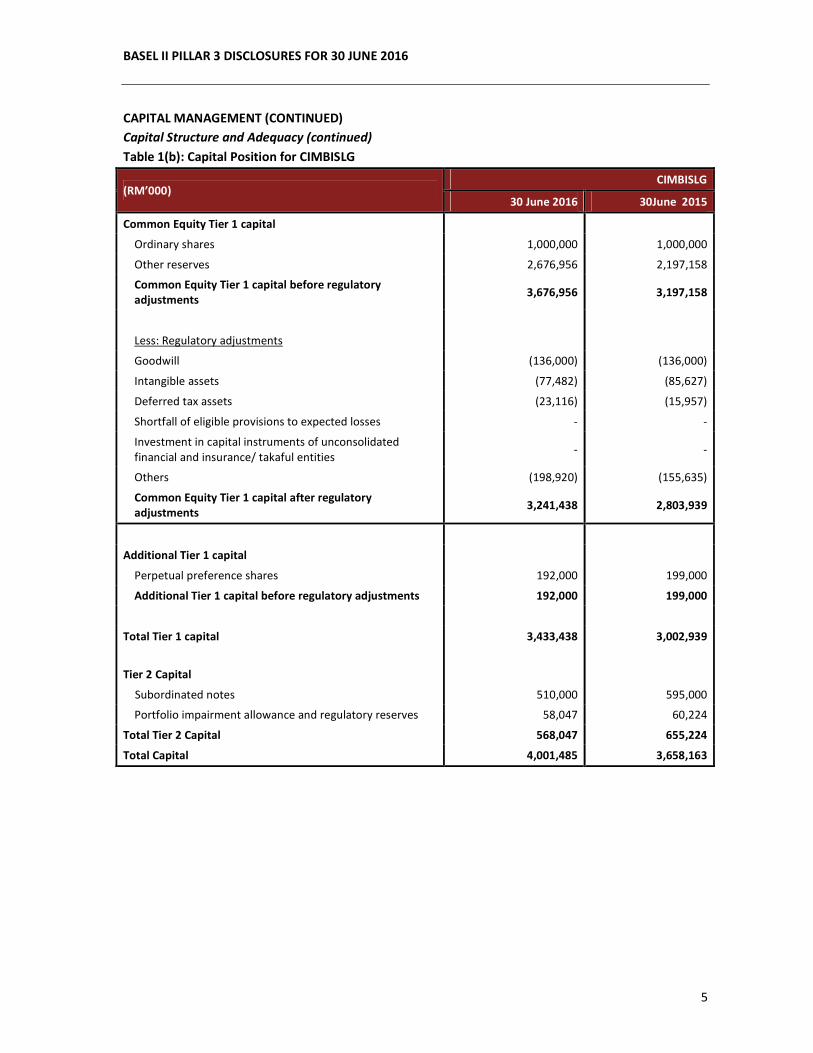
Table 1(b): Capital Position for CIMBISLG
(RM’000) CIMBISLG
30 June 2016 30June 2015
Common Equity Tier 1 capital
Ordinary shares 1,000,000 1,000,000
Other reserves 2,676,956 2,197,158
Common Equity Tier 1 capital before regulatory
adjustments 3,676,956 3,197,158
Less: Regulatory adjustments
Goodwill (136,000) (136,000)
Intangible assets (77,482) (85,627)
Deferred tax assets (23,116) (15,957)
Shortfall of eligible provisions to expected losses - -
Investment in capital instruments of unconsolidated
financial and insurance/ takaful entities - -
Others (198,920) (155,635)
Common Equity Tier 1 capital after regulatory
adjustments 3,241,438 2,803,939
Additional Tier 1 capital
Perpetual preference shares 192,000 199,000
Additional Tier 1 capital before regulatory adjustments 192,000 199,000
Total Tier 1 capital 3,433,438 3,002,939
Tier 2 Capital
Subordinated notes 510,000 595,000
Portfolio impairment allowance and regulatory reserves 58,047 60,224
Total Tier 2 Capital 568,047 655,224
Total Capital 4,001,485 3,658,163
BASEL II PILLAR 3 DISCLOSURES FOR 30 JUNE 2016
6
CAPITAL MANAGEMENT (CONTINUED)
Capital Structure and Adequacy (continued)
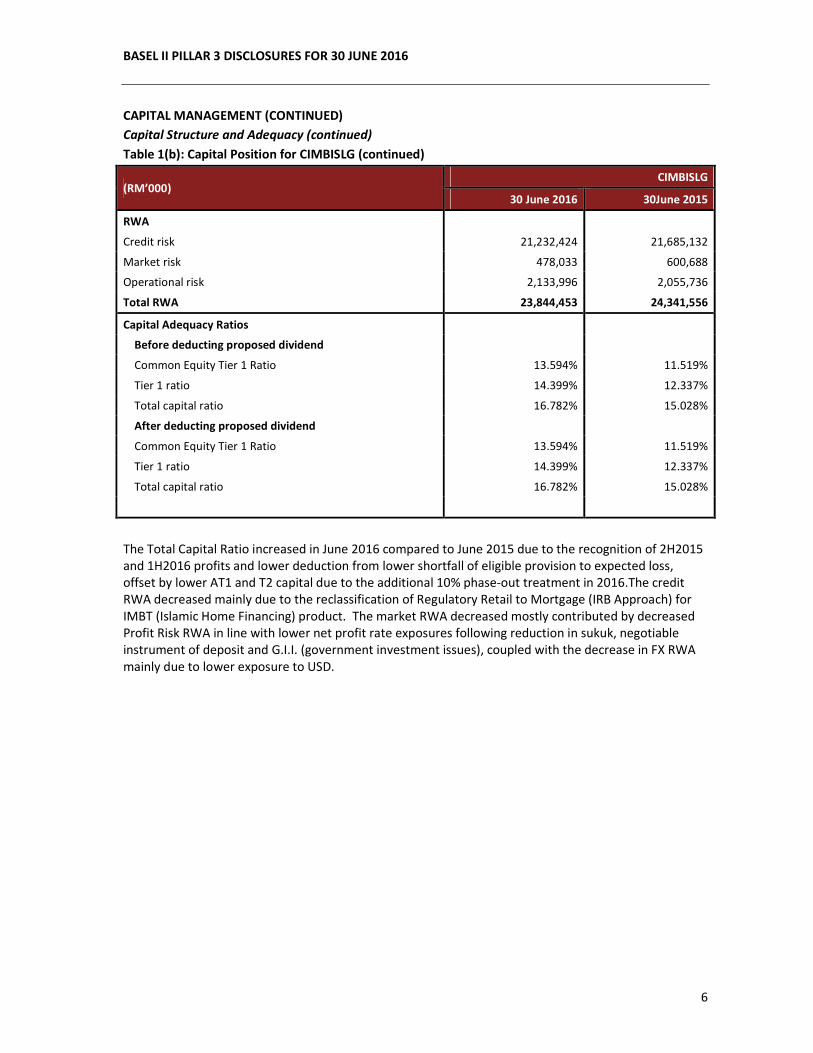
Table 1(b): Capital Position for CIMBISLG (continued)
(RM’000) CIMBISLG
30 June 2016 30June 2015
RWA
Credit risk 21,232,424 21,685,132
Market risk 478,033 600,688
Operational risk 2,133,996 2,055,736
Total RWA 23,844,453 24,341,556
Capital Adequacy Ratios
Before deducting proposed dividend
Common Equity Tier 1 Ratio 13.594% 11.519%
Tier 1 ratio 14.399% 12.337%
Total capital ratio 16.782% 15.028%
After deducting proposed dividend
Common Equity Tier 1 Ratio 13.594% 11.519%
Tier 1 ratio 14.399% 12.337%
Total capital ratio 16.782% 15.028%
The Total Capital Ratio increased in June 2016 compared to June 2015 due to the recognition of 2H2015
and 1H2016 profits and lower deduction from lower shortfall of eligible provision to expected loss,
offset by lower AT1 and T2 capital due to the additional 10% phase-out treatment in 2016.The credit
RWA decreased mainly due to the reclassification of Regulatory Retail to Mortgage (IRB Approach) for
IMBT (Islamic Home Financing) product. The market RWA decreased mostly contributed by decreased
Profit Risk RWA in line with lower net profit rate exposures following reduction in sukuk, negotiable
instrument of deposit and G.I.I. (government investment issues), coupled with the decrease in FX RWA
mainly due to lower exposure to USD.
BASEL II PILLAR 3 DISCLOSURES FOR 30 JUNE 2016
7
CAPITAL MANAGEMENT (CONTINUED)
Capital Structure and Adequacy (continued)
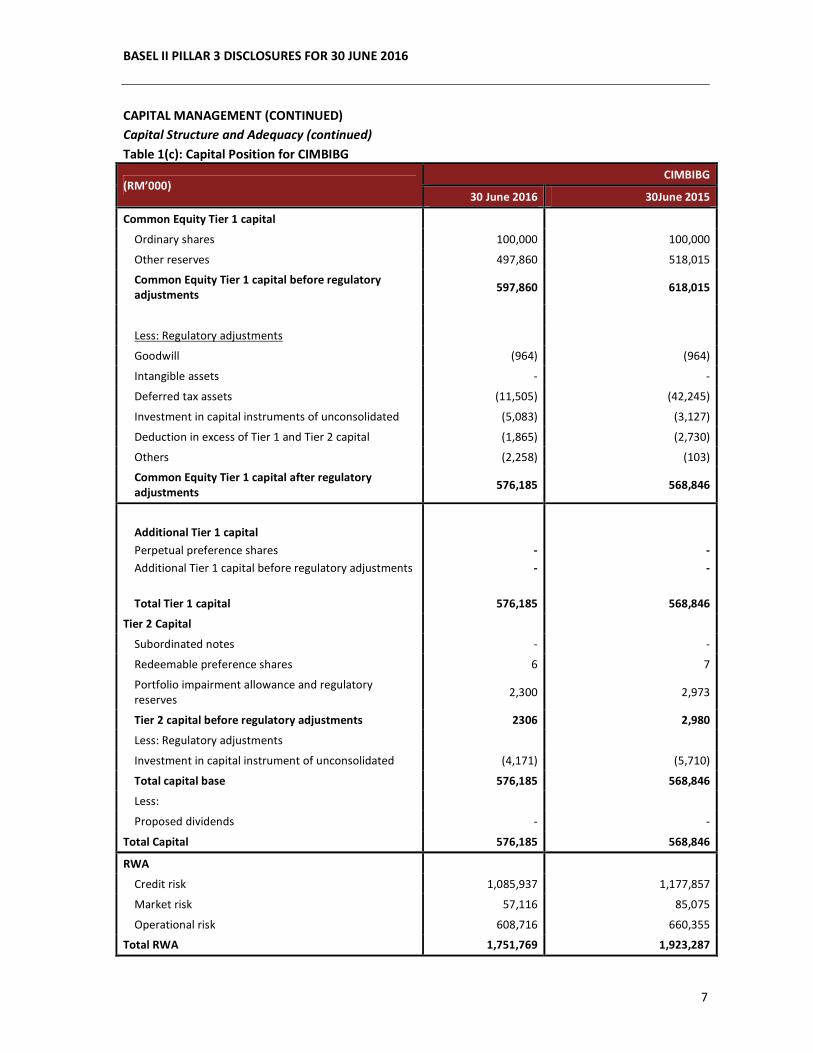
Table 1(c): Capital Position for CIMBIBG
(RM’000) CIMBIBG
30 June 2016 30June 2015
Common Equity Tier 1 capital
Ordinary shares 100,000 100,000
Other reserves 497,860 518,015
Common Equity Tier 1 capital before regulatory
adjustments 597,860 618,015
Less: Regulatory adjustments
Goodwill (964) (964)
Intangible assets - -
Deferred tax assets (11,505) (42,245)
Investment in capital instruments of unconsolidated (5,083) (3,127)
Deduction in excess of Tier 1 and Tier 2 capital (1,865) (2,730)
Others (2,258) (103)
Common Equity Tier 1 capital after regulatory
adjustments 576,185 568,846
Additional Tier 1 capital
Perpetual preference shares
Additional Tier 1 capital before regulatory adjustments
Total Tier 1 capital
-
-
576,185
-
-
568,846
Tier 2 Capital
Subordinated notes - -
Redeemable preference shares 6 7
Portfolio impairment allowance and regulatory
reserves 2,300 2,973
Tier 2 capital before regulatory adjustments 2306 2,980
Less: Regulatory adjustments
Investment in capital instrument of unconsolidated (4,171) (5,710)
Total capital base 576,185 568,846
Less:
Proposed dividends - -
Total Capital 576,185 568,846
RWA
Credit risk 1,085,937 1,177,857
Market risk 57,116 85,075
Operational risk 608,716 660,355
Total RWA 1,751,769 1,923,287
BASEL II PILLAR 3 DISCLOSURES FOR 30 JUNE 2016
8
CAPITAL MANAGEMENT (CONTINUED)
Capital Structure and Adequacy (continued)
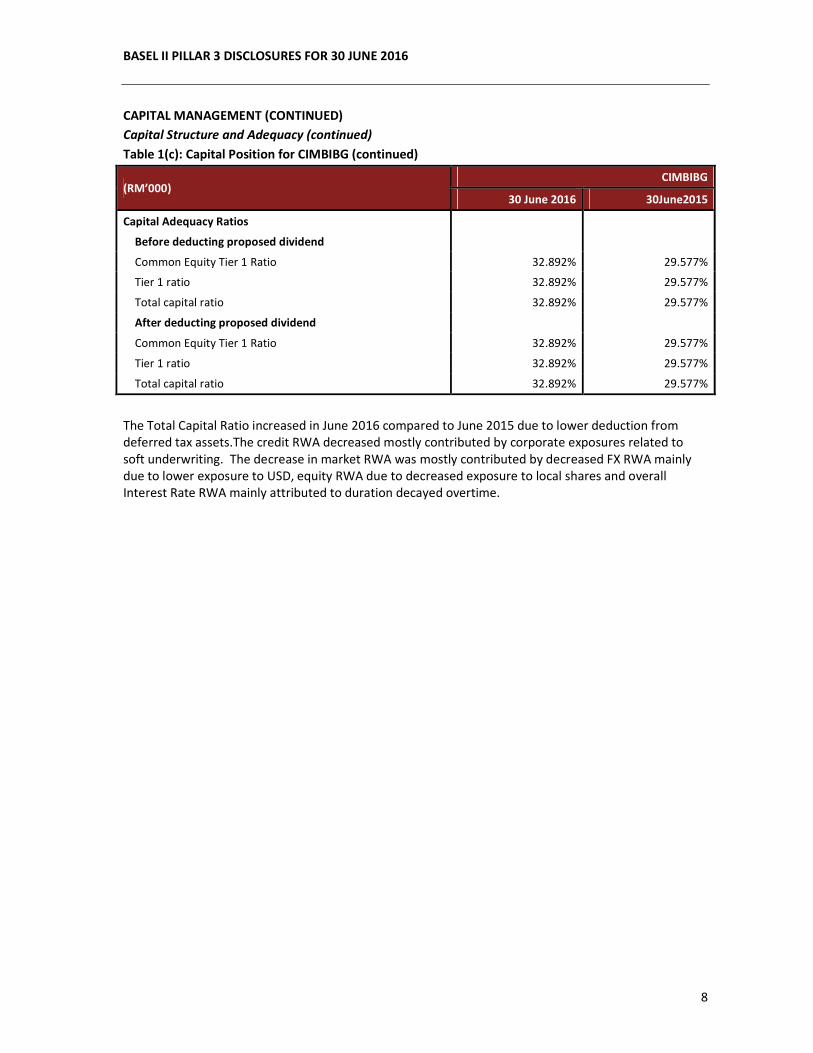
Table 1(c): Capital Position for CIMBIBG (continued)
(RM’000) CIMBIBG
30 June 2016 30June2015
Capital Adequacy Ratios
Before deducting proposed dividend
Common Equity Tier 1 Ratio 32.892% 29.577%
Tier 1 ratio 32.892% 29.577%
Total capital ratio 32.892% 29.577%
After deducting proposed dividend
Common Equity Tier 1 Ratio 32.892% 29.577%
Tier 1 ratio 32.892% 29.577%
Total capital ratio 32.892% 29.577%
The Total Capital Ratio increased in June 2016 compared to June 2015 due to lower deduction from
deferred tax assets.The credit RWA decreased mostly contributed by corporate exposures related to
soft underwriting. The decrease in market RWA was mostly contributed by decreased FX RWA mainly
due to lower exposure to USD, equity RWA due to decreased exposure to local shares and overall
Interest Rate RWA mainly attributed to duration decayed overtime.
BASEL II PILLAR 3 DISCLOSURES FOR 30 JUNE 2016
9
CAPITAL MANAGEMENT (CONTINUED)
Capital Structure and Adequacy (continued)
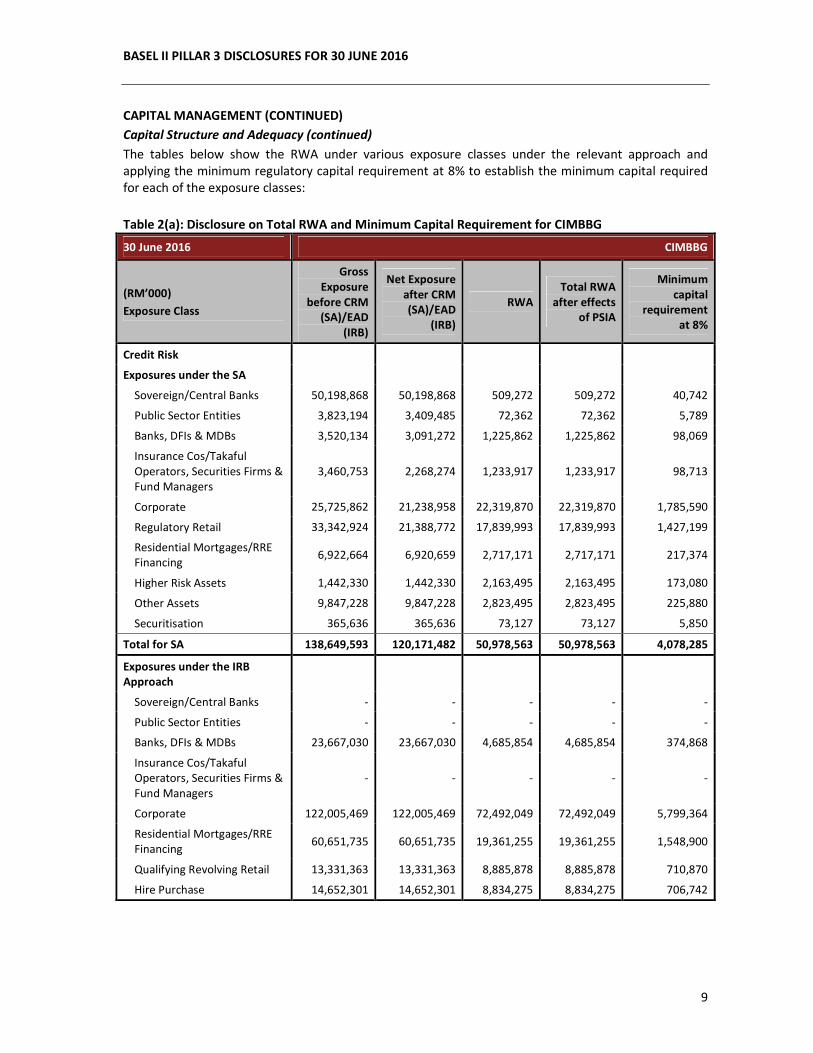
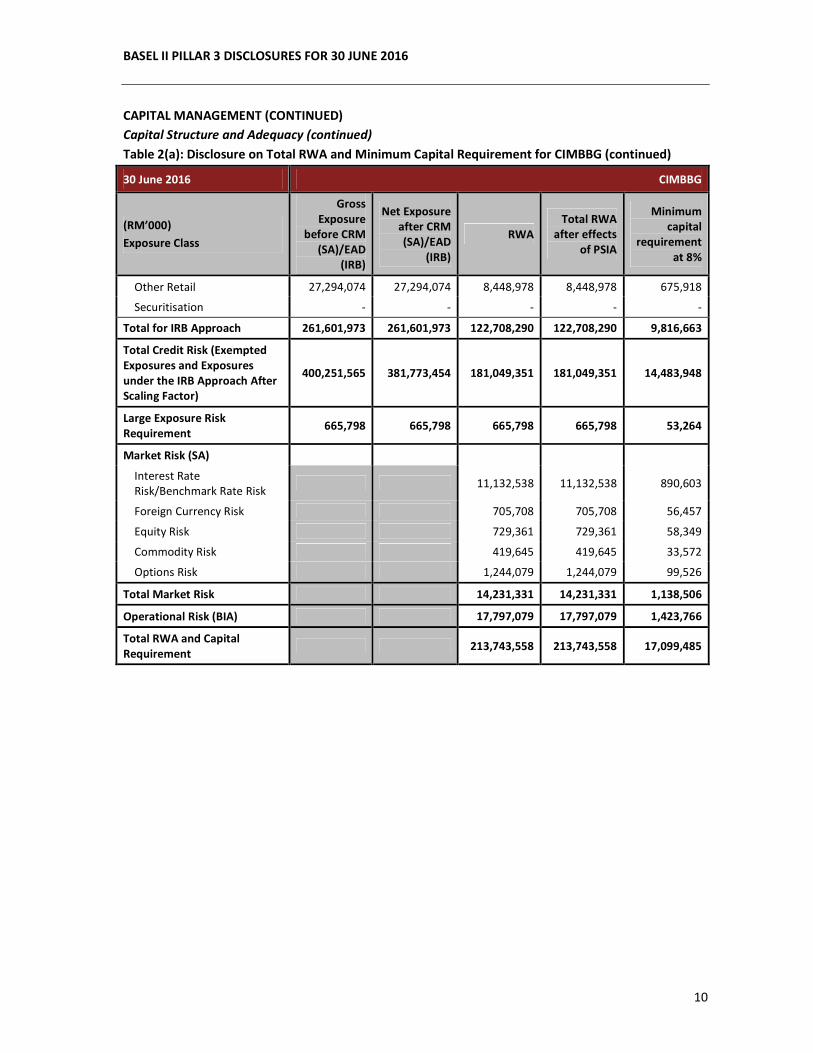
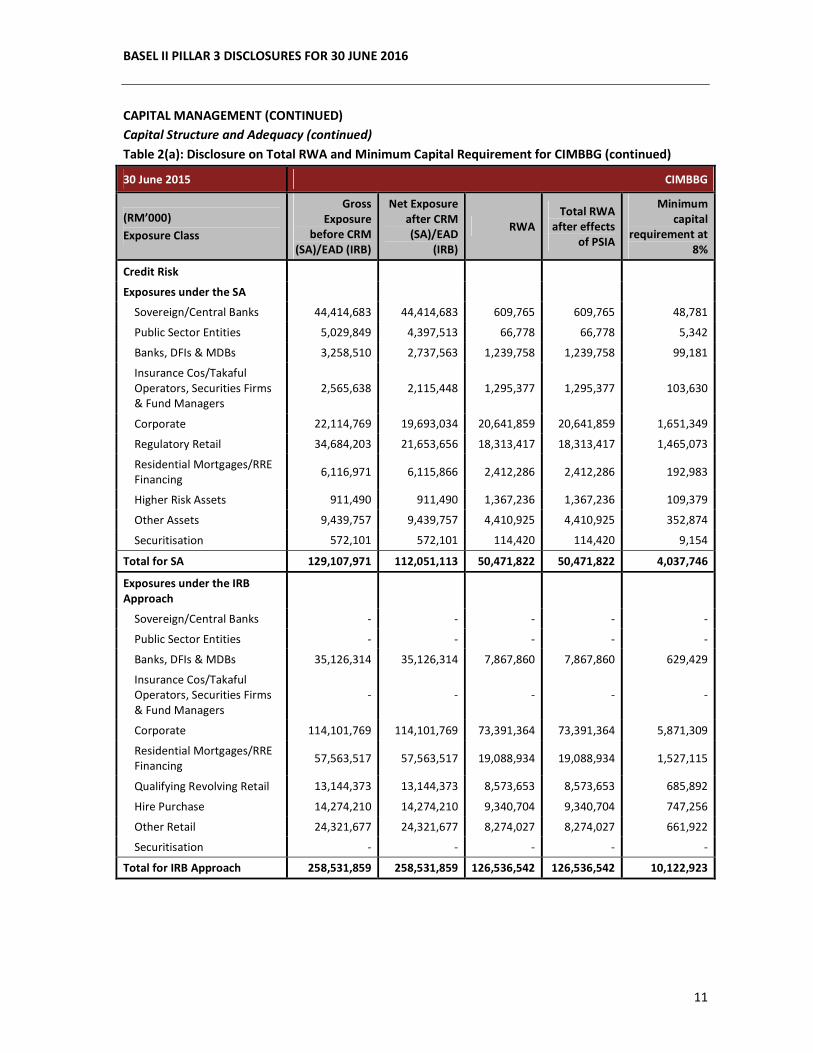
The tables below show the RWA under various exposure classes under the relevant approach and
applying the minimum regulatory capital requirement at 8% to establish the minimum capital required
for each of the exposure classes:
Table 2(a): Disclosure on Total RWA and Minimum Capital Requirement for CIMBBG
30 June 2016 CIMBBG
(RM’000)
Exposure Class
Gross
Exposure
before CRM
(SA)/EAD
(IRB)
Net Exposure
after CRM
(SA)/EAD
(IRB)
RWA
Total RWA
after effects
of PSIA
Minimum
capital
requirement
at 8%
Credit Risk
Exposures under the SA
Sovereign/Central Banks 50,198,868 50,198,868 509,272 509,272 40,742
Public Sector Entities 3,823,194 3,409,485 72,362 72,362 5,789
Banks, DFIs & MDBs 3,520,134 3,091,272 1,225,862 1,225,862 98,069
Insurance Cos/Takaful
Operators, Securities Firms &
Fund Managers
3,460,753 2,268,274 1,233,917 1,233,917 98,713
Corporate 25,725,862 21,238,958 22,319,870 22,319,870 1,785,590
Regulatory Retail 33,342,924 21,388,772 17,839,993 17,839,993 1,427,199
Residential Mortgages/RRE
Financing 6,922,664 6,920,659 2,717,171 2,717,171 217,374
Higher Risk Assets 1,442,330 1,442,330 2,163,495 2,163,495 173,080
Other Assets 9,847,228 9,847,228 2,823,495 2,823,495 225,880
Securitisation 365,636 365,636 73,127 73,127 5,850
Total for SA 138,649,593 120,171,482 50,978,563 50,978,563 4,078,285
Exposures under the IRB
Approach
Sovereign/Central Banks - - - - -
Public Sector Entities - - - - -
Banks, DFIs & MDBs 23,667,030 23,667,030 4,685,854 4,685,854 374,868
Insurance Cos/Takaful
Operators, Securities Firms &
Fund Managers
- - - - -
Corporate 122,005,469 122,005,469 72,492,049 72,492,049 5,799,364
Residential Mortgages/RRE
Financing 60,651,735 60,651,735 19,361,255 19,361,255 1,548,900
Qualifying Revolving Retail 13,331,363 13,331,363 8,885,878 8,885,878 710,870
Hire Purchase 14,652,301 14,652,301 8,834,275 8,834,275 706,742
BASEL II PILLAR 3 DISCLOSURES FOR 30 JUNE 2016
10
CAPITAL MANAGEMENT (CONTINUED)
Capital Structure and Adequacy (continued)
Table 2(a): Disclosure on Total RWA and Minimum Capital Requirement for CIMBBG (continued)
30 June 2016 CIMBBG
(RM’000)
Exposure Class
Gross
Exposure
before CRM
(SA)/EAD
(IRB)
Net Exposure
after CRM
(SA)/EAD
(IRB)
RWA
Total RWA
after effects
of PSIA
Minimum
capital
requirement
at 8%
Other Retail 27,294,074 27,294,074 8,448,978 8,448,978 675,918
Securitisation - - - - -
Total for IRB Approach 261,601,973 261,601,973 122,708,290 122,708,290 9,816,663
Total Credit Risk (Exempted
Exposures and Exposures
under the IRB Approach After
Scaling Factor)
400,251,565 381,773,454 181,049,351 181,049,351 14,483,948
Large Exposure Risk
Requirement 665,798 665,798 665,798 665,798 53,264
Market Risk (SA)
Interest Rate
Risk/Benchmark Rate Risk 11,132,538 11,132,538 890,603
Foreign Currency Risk 705,708 705,708 56,457
Equity Risk 729,361 729,361 58,349
Commodity Risk 419,645 419,645 33,572
Options Risk 1,244,079 1,244,079 99,526
Total Market Risk 14,231,331 14,231,331 1,138,506
Operational Risk (BIA) 17,797,079 17,797,079 1,423,766
Total RWA and Capital
Requirement 213,743,558 213,743,558 17,099,485
BASEL II PILLAR 3 DISCLOSURES FOR 30 JUNE 2016
11
CAPITAL MANAGEMENT (CONTINUED)
Capital Structure and Adequacy (continued)
Table 2(a): Disclosure on Total RWA and Minimum Capital Requirement for CIMBBG (continued)
30 June 2015 CIMBBG
(RM’000)
Exposure Class
Gross
Exposure
before CRM
(SA)/EAD (IRB)
Net Exposure
after CRM
(SA)/EAD
(IRB)
RWA
Total RWA
after effects
of PSIA
Minimum
capital
requirement at
8%
Credit Risk
Exposures under the SA
Sovereign/Central Banks 44,414,683 44,414,683 609,765 609,765 48,781
Public Sector Entities 5,029,849 4,397,513 66,778 66,778 5,342
Banks, DFIs & MDBs 3,258,510 2,737,563 1,239,758 1,239,758 99,181
Insurance Cos/Takaful
Operators, Securities Firms
& Fund Managers
2,565,638 2,115,448 1,295,377 1,295,377 103,630
Corporate 22,114,769 19,693,034 20,641,859 20,641,859 1,651,349
Regulatory Retail 34,684,203 21,653,656 18,313,417 18,313,417 1,465,073
Residential Mortgages/RRE
Financing 6,116,971 6,115,866 2,412,286 2,412,286 192,983
Higher Risk Assets 911,490 911,490 1,367,236 1,367,236 109,379
Other Assets 9,439,757 9,439,757 4,410,925 4,410,925 352,874
Securitisation 572,101 572,101 114,420 114,420 9,154
Total for SA 129,107,971 112,051,113 50,471,822 50,471,822 4,037,746
Exposures under the IRB
Approach
Sovereign/Central Banks - - - - -
Public Sector Entities - - - - -
Banks, DFIs & MDBs 35,126,314 35,126,314 7,867,860 7,867,860 629,429
Insurance Cos/Takaful
Operators, Securities Firms
& Fund Managers
- - - - -
Corporate 114,101,769 114,101,769 73,391,364 73,391,364 5,871,309
Residential Mortgages/RRE
Financing 57,563,517 57,563,517 19,088,934 19,088,934 1,527,115
Qualifying Revolving Retail 13,144,373 13,144,373 8,573,653 8,573,653 685,892
Hire Purchase 14,274,210 14,274,210 9,340,704 9,340,704 747,256
Other Retail 24,321,677 24,321,677 8,274,027 8,274,027 661,922
Securitisation - - - - -
Total for IRB Approach 258,531,859 258,531,859 126,536,542 126,536,542 10,122,923
BASEL II PILLAR 3 DISCLOSURES FOR 30 JUNE 2016
12
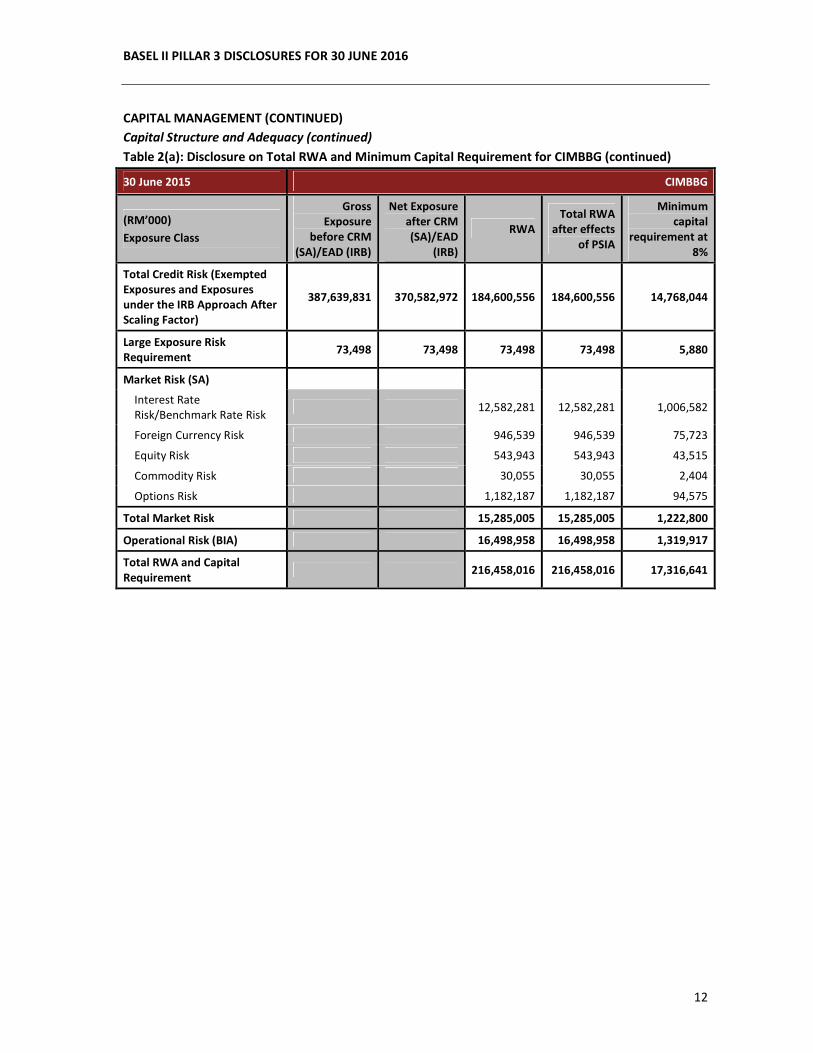
CAPITAL MANAGEMENT (CONTINUED)
Capital Structure and Adequacy (continued)
Table 2(a): Disclosure on Total RWA and Minimum Capital Requirement for CIMBBG (continued)
30 June 2015 CIMBBG
(RM’000)
Exposure Class
Gross
Exposure
before CRM
(SA)/EAD (IRB)
Net Exposure
after CRM
(SA)/EAD
(IRB)
RWA
Total RWA
after effects
of PSIA
Minimum
capital
requirement at
8%
Total Credit Risk (Exempted
Exposures and Exposures
under the IRB Approach After
Scaling Factor)
387,639,831 370,582,972 184,600,556 184,600,556 14,768,044
Large Exposure Risk
Requirement 73,498 73,498 73,498 73,498 5,880
Market Risk (SA)
Interest Rate
Risk/Benchmark Rate Risk 12,582,281 12,582,281 1,006,582
Foreign Currency Risk 946,539 946,539 75,723
Equity Risk 543,943 543,943 43,515
Commodity Risk 30,055 30,055 2,404
Options Risk 1,182,187 1,182,187 94,575
Total Market Risk 15,285,005 15,285,005 1,222,800
Operational Risk (BIA) 16,498,958 16,498,958 1,319,917
Total RWA and Capital
Requirement 216,458,016 216,458,016 17,316,641
BASEL II PILLAR 3 DISCLOSURES FOR 30 JUNE 2016
13
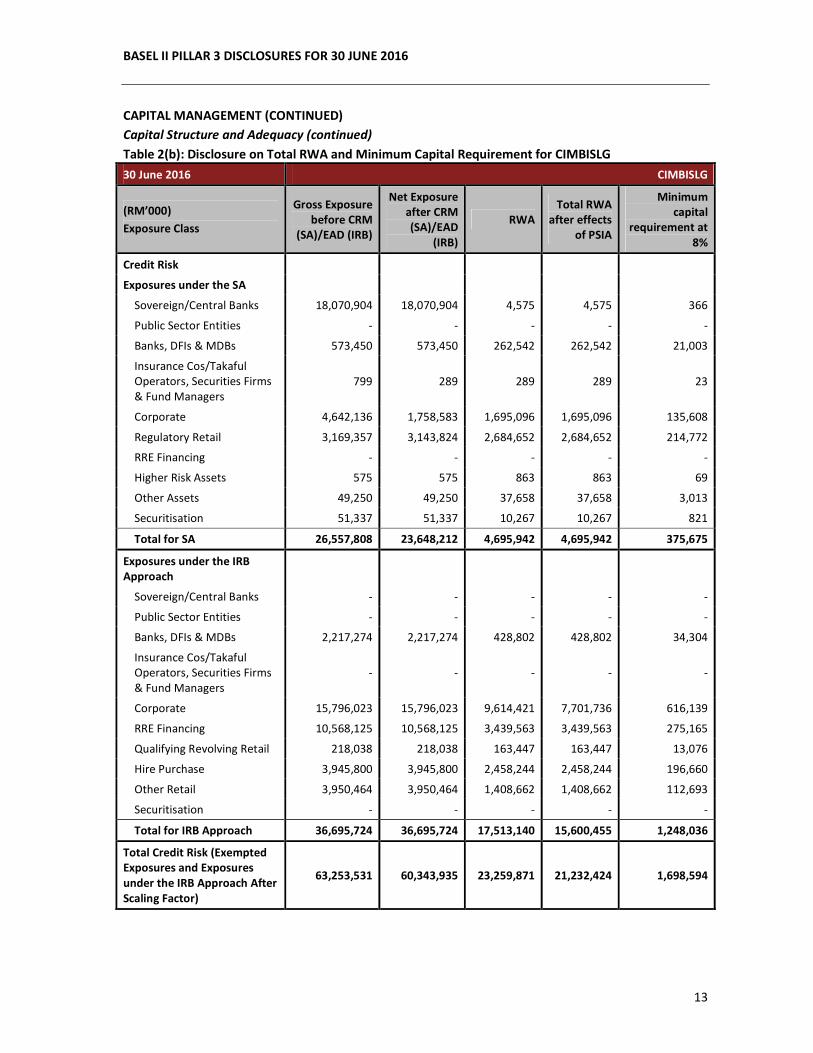
CAPITAL MANAGEMENT (CONTINUED)
Capital Structure and Adequacy (continued)
Table 2(b): Disclosure on Total RWA and Minimum Capital Requirement for CIMBISLG
30 June 2016 CIMBISLG
(RM’000)
Exposure Class
Gross Exposure
before CRM
(SA)/EAD (IRB)
Net Exposure
after CRM
(SA)/EAD
(IRB)
RWA
Total RWA
after effects
of PSIA
Minimum
capital
requirement at
8%
Credit Risk
Exposures under the SA
Sovereign/Central Banks 18,070,904 18,070,904 4,575 4,575 366
Public Sector Entities - - - - -
Banks, DFIs & MDBs 573,450 573,450 262,542 262,542 21,003
Insurance Cos/Takaful
Operators, Securities Firms
& Fund Managers
799 289 289 289 23
Corporate 4,642,136 1,758,583 1,695,096 1,695,096 135,608
Regulatory Retail 3,169,357 3,143,824 2,684,652 2,684,652 214,772
RRE Financing - - - - -
Higher Risk Assets 575 575 863 863 69
Other Assets 49,250 49,250 37,658 37,658 3,013
Securitisation 51,337 51,337 10,267 10,267 821
Total for SA 26,557,808 23,648,212 4,695,942 4,695,942 375,675
Exposures under the IRB
Approach
Sovereign/Central Banks - - - - -
Public Sector Entities - - - - -
Banks, DFIs & MDBs 2,217,274 2,217,274 428,802 428,802 34,304
Insurance Cos/Takaful
Operators, Securities Firms
& Fund Managers
- - - - -
Corporate 15,796,023 15,796,023 9,614,421 7,701,736 616,139
RRE Financing 10,568,125 10,568,125 3,439,563 3,439,563 275,165
Qualifying Revolving Retail 218,038 218,038 163,447 163,447 13,076
Hire Purchase 3,945,800 3,945,800 2,458,244 2,458,244 196,660
Other Retail 3,950,464 3,950,464 1,408,662 1,408,662 112,693
Securitisation - - - - -
Total for IRB Approach 36,695,724 36,695,724 17,513,140 15,600,455 1,248,036
Total Credit Risk (Exempted
Exposures and Exposures
under the IRB Approach After
Scaling Factor)
63,253,531 60,343,935 23,259,871 21,232,424 1,698,594
BASEL II PILLAR 3 DISCLOSURES FOR 30 JUNE 2016
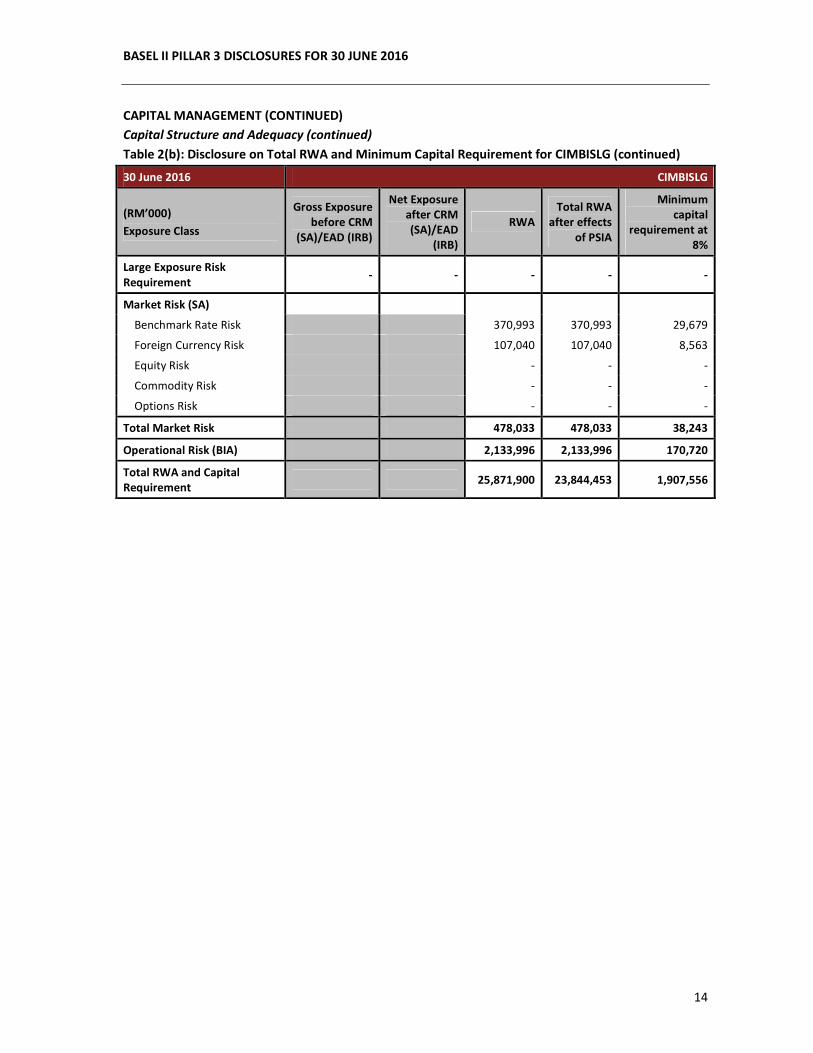
14
CAPITAL MANAGEMENT (CONTINUED)
Capital Structure and Adequacy (continued)
Table 2(b): Disclosure on Total RWA and Minimum Capital Requirement for CIMBISLG (continued)
30 June 2016 CIMBISLG
(RM’000)
Exposure Class
Gross Exposure
before CRM
(SA)/EAD (IRB)
Net Exposure
after CRM
(SA)/EAD
(IRB)
RWA
Total RWA
after effects
of PSIA
Minimum
capital
requirement at
8%
Large Exposure Risk
Requirement - - - - -
Market Risk (SA)
Benchmark Rate Risk 370,993 370,993 29,679
Foreign Currency Risk 107,040 107,040 8,563
Equity Risk - - -
Commodity Risk - - -
Options Risk - - -
Total Market Risk 478,033 478,033 38,243
Operational Risk (BIA) 2,133,996 2,133,996 170,720
Total RWA and Capital
Requirement 25,871,900 23,844,453 1,907,556
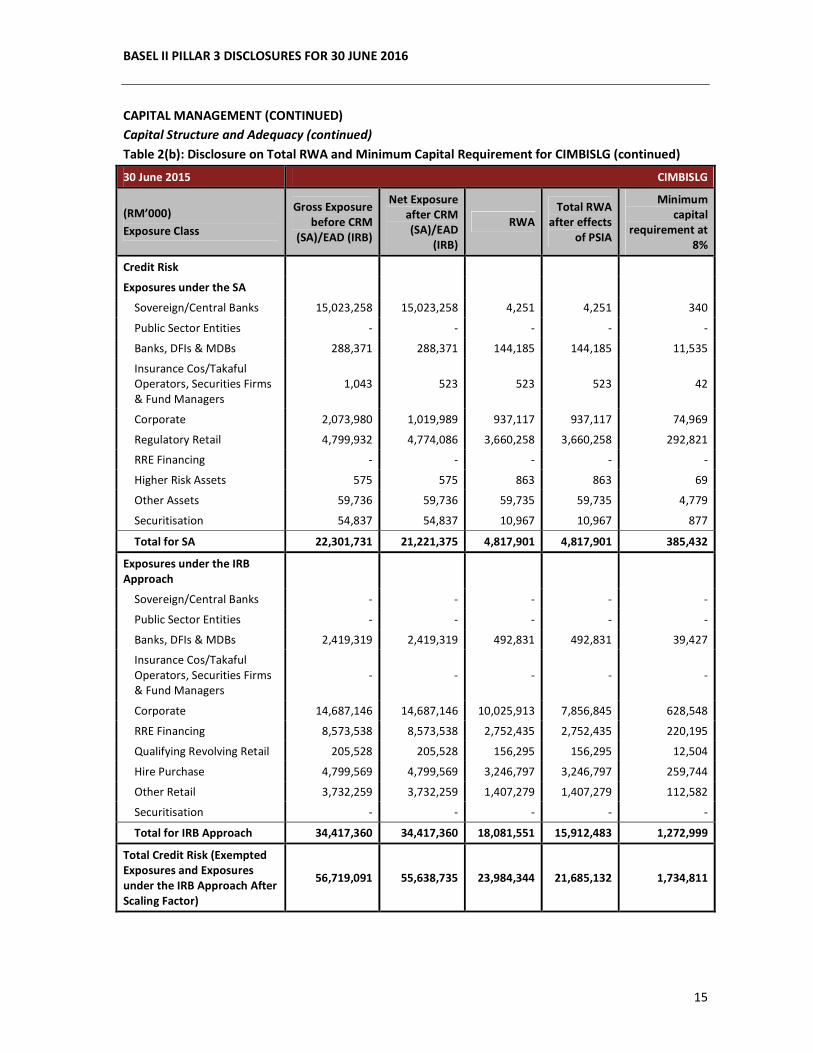
BASEL II PILLAR 3 DISCLOSURES FOR 30 JUNE 2016
15
CAPITAL MANAGEMENT (CONTINUED)
Capital Structure and Adequacy (continued)
Table 2(b): Disclosure on Total RWA and Minimum Capital Requirement for CIMBISLG (continued)
30 June 2015 CIMBISLG
(RM’000)
Exposure Class
Gross Exposure
before CRM
(SA)/EAD (IRB)
Net Exposure
after CRM
(SA)/EAD
(IRB)
RWA
Total RWA
after effects
of PSIA
Minimum
capital
requirement at
8%
Credit Risk
Exposures under the SA
Sovereign/Central Banks 15,023,258 15,023,258 4,251 4,251 340
Public Sector Entities - - - - -
Banks, DFIs & MDBs 288,371 288,371 144,185 144,185 11,535
Insurance Cos/Takaful
Operators, Securities Firms
& Fund Managers
1,043 523 523 523 42
Corporate 2,073,980 1,019,989 937,117 937,117 74,969
Regulatory Retail 4,799,932 4,774,086 3,660,258 3,660,258 292,821
RRE Financing - - - - -
Higher Risk Assets 575 575 863 863 69
Other Assets 59,736 59,736 59,735 59,735 4,779
Securitisation 54,837 54,837 10,967 10,967 877
Total for SA 22,301,731 21,221,375 4,817,901 4,817,901 385,432
Exposures under the IRB
Approach
Sovereign/Central Banks - - - - -
Public Sector Entities - - - - -
Banks, DFIs & MDBs 2,419,319 2,419,319 492,831 492,831 39,427
Insurance Cos/Takaful
Operators, Securities Firms
& Fund Managers
- - - - -
Corporate 14,687,146 14,687,146 10,025,913 7,856,845 628,548
RRE Financing 8,573,538 8,573,538 2,752,435 2,752,435 220,195
Qualifying Revolving Retail 205,528 205,528 156,295 156,295 12,504
Hire Purchase 4,799,569 4,799,569 3,246,797 3,246,797 259,744
Other Retail 3,732,259 3,732,259 1,407,279 1,407,279 112,582
Securitisation - - - - -
Total for IRB Approach 34,417,360 34,417,360 18,081,551 15,912,483 1,272,999
Total Credit Risk (Exempted
Exposures and Exposures
under the IRB Approach After
Scaling Factor)
56,719,091 55,638,735 23,984,344 21,685,132 1,734,811
BASEL II PILLAR 3 DISCLOSURES FOR 30 JUNE 2016
16
CAPITAL MANAGEMENT (CONTINUED)
Capital Structure and Adequacy (continued)
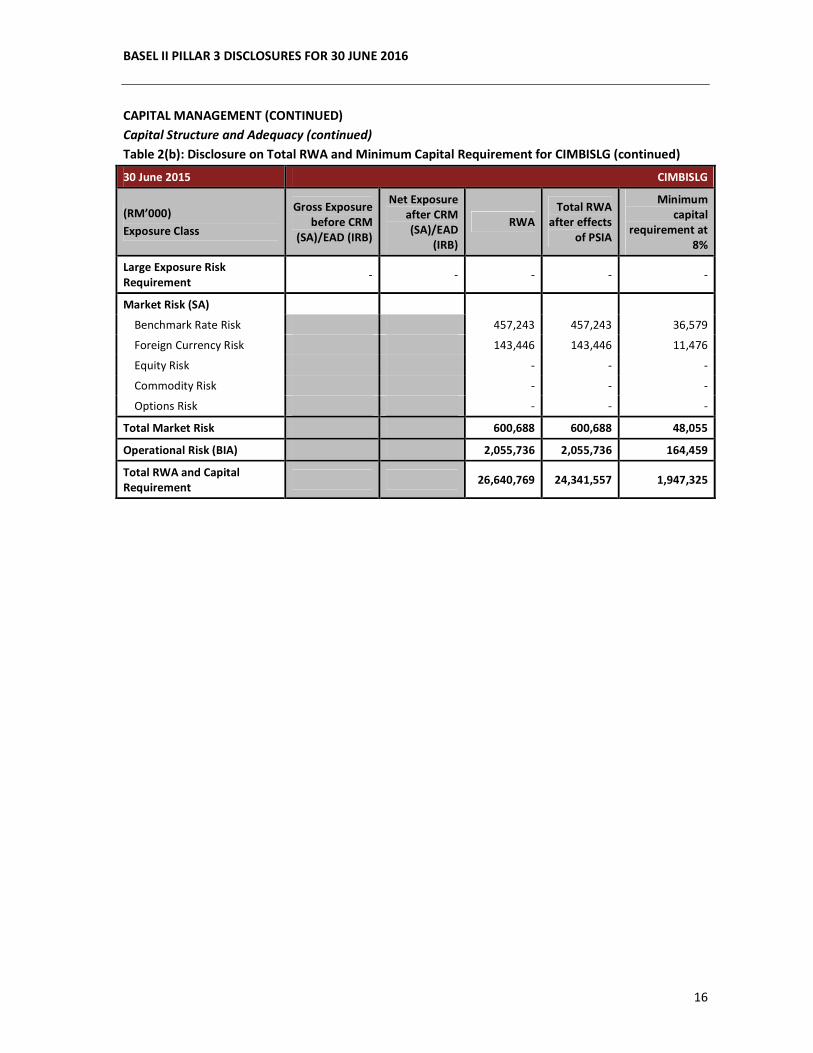
Table 2(b): Disclosure on Total RWA and Minimum Capital Requirement for CIMBISLG (continued)
30 June 2015 CIMBISLG
(RM’000)
Exposure Class
Gross Exposure
before CRM
(SA)/EAD (IRB)
Net Exposure
after CRM
(SA)/EAD
(IRB)
RWA
Total RWA
after effects
of PSIA
Minimum
capital
requirement at
8%
Large Exposure Risk
Requirement - - - - -
Market Risk (SA)
Benchmark Rate Risk 457,243 457,243 36,579
Foreign Currency Risk 143,446 143,446 11,476
Equity Risk - - -
Commodity Risk - - -
Options Risk - - -
Total Market Risk 600,688 600,688 48,055
Operational Risk (BIA) 2,055,736 2,055,736 164,459
Total RWA and Capital
Requirement 26,640,769 24,341,557 1,947,325
BASEL II PILLAR 3 DISCLOSURES FOR 30 JUNE 2016
17
CAPITAL MANAGEMENT (CONTINUED)
Capital Structure and Adequacy (continued)
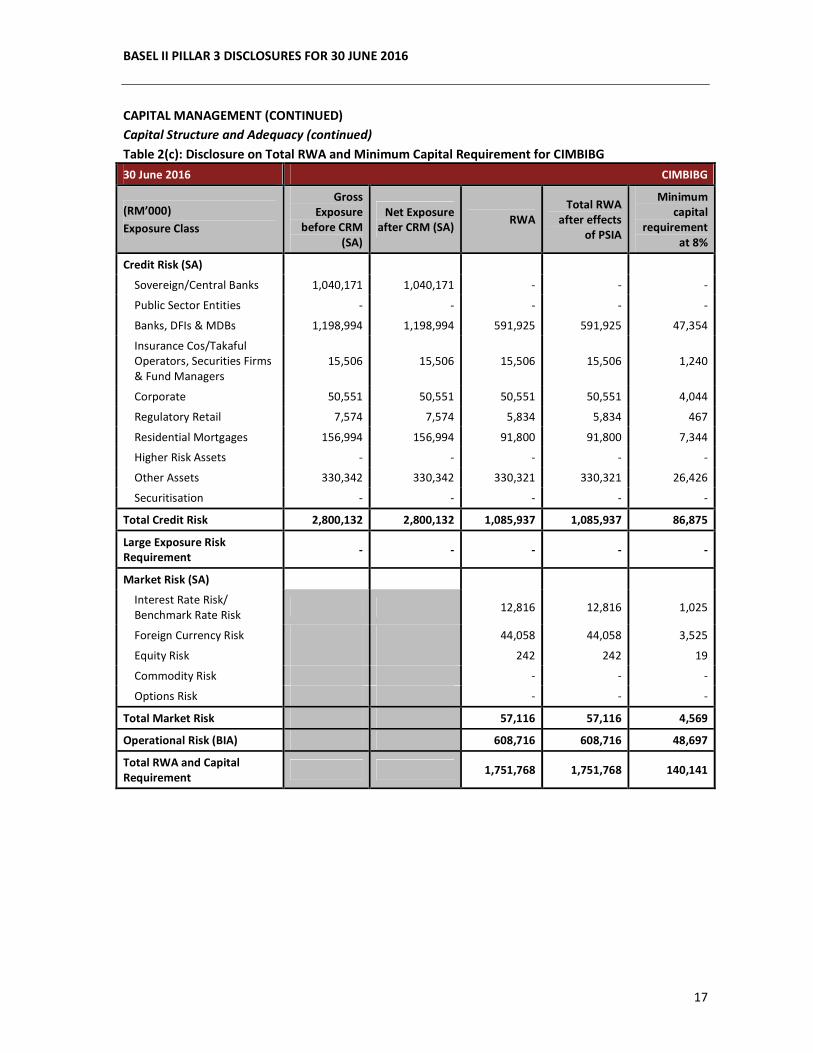
Table 2(c): Disclosure on Total RWA and Minimum Capital Requirement for CIMBIBG
30 June 2016 CIMBIBG
(RM’000)
Exposure Class
Gross
Exposure
before CRM
(SA)
Net Exposure
after CRM (SA) RWA
Total RWA
after effects
of PSIA
Minimum
capital
requirement
at 8%
Credit Risk (SA)
Sovereign/Central Banks 1,040,171 1,040,171 - - -
Public Sector Entities - - - - -
Banks, DFIs & MDBs 1,198,994 1,198,994 591,925 591,925 47,354
Insurance Cos/Takaful
Operators, Securities Firms
& Fund Managers
15,506 15,506 15,506 15,506 1,240
Corporate 50,551 50,551 50,551 50,551 4,044
Regulatory Retail 7,574 7,574 5,834 5,834 467
Residential Mortgages 156,994 156,994 91,800 91,800 7,344
Higher Risk Assets - - - - -
Other Assets 330,342 330,342 330,321 330,321 26,426
Securitisation - - - - -
Total Credit Risk 2,800,132 2,800,132 1,085,937 1,085,937 86,875
Large Exposure Risk
Requirement - - - - -
Market Risk (SA)
Interest Rate Risk/
Benchmark Rate Risk 12,816 12,816 1,025
Foreign Currency Risk 44,058 44,058 3,525
Equity Risk 242 242 19
Commodity Risk - - -
Options Risk - - -
Total Market Risk 57,116 57,116 4,569
Operational Risk (BIA) 608,716 608,716 48,697
Total RWA and Capital
Requirement 1,751,768 1,751,768 140,141
BASEL II PILLAR 3 DISCLOSURES FOR 30 JUNE 2016
18
CAPITAL MANAGEMENT (CONTINUED)
Capital Structure and Adequacy (continued)
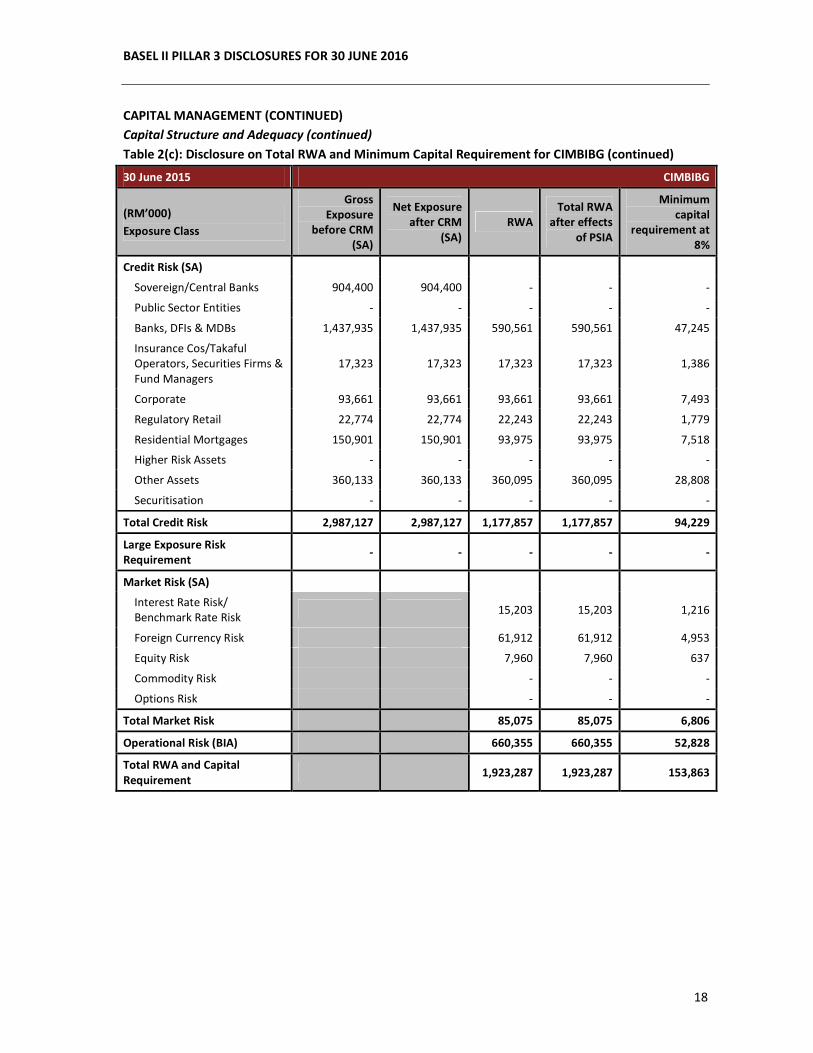
Table 2(c): Disclosure on Total RWA and Minimum Capital Requirement for CIMBIBG (continued)
30 June 2015 CIMBIBG
(RM’000)
Exposure Class
Gross
Exposure
before CRM
(SA)
Net Exposure
after CRM
(SA)
RWA
Total RWA
after effects
of PSIA
Minimum
capital
requirement at
8%
Credit Risk (SA)
Sovereign/Central Banks 904,400 904,400 - - -
Public Sector Entities - - - - -
Banks, DFIs & MDBs 1,437,935 1,437,935 590,561 590,561 47,245
Insurance Cos/Takaful
Operators, Securities Firms &
Fund Managers
17,323 17,323 17,323 17,323 1,386
Corporate 93,661 93,661 93,661 93,661 7,493
Regulatory Retail 22,774 22,774 22,243 22,243 1,779
Residential Mortgages 150,901 150,901 93,975 93,975 7,518
Higher Risk Assets - - - - -
Other Assets 360,133 360,133 360,095 360,095 28,808
Securitisation - - - - -
Total Credit Risk 2,987,127 2,987,127 1,177,857 1,177,857 94,229
Large Exposure Risk
Requirement - - - - -
Market Risk (SA)
Interest Rate Risk/
Benchmark Rate Risk 15,203 15,203 1,216
Foreign Currency Risk 61,912 61,912 4,953
Equity Risk 7,960 7,960 637
Commodity Risk - - -
Options Risk - - -
Total Market Risk 85,075 85,075 6,806
Operational Risk (BIA) 660,355 660,355 52,828
Total RWA and Capital
Requirement 1,923,287 1,923,287 153,863
BASEL II PILLAR 3 DISCLOSURES FOR 30 JUNE 2016
19
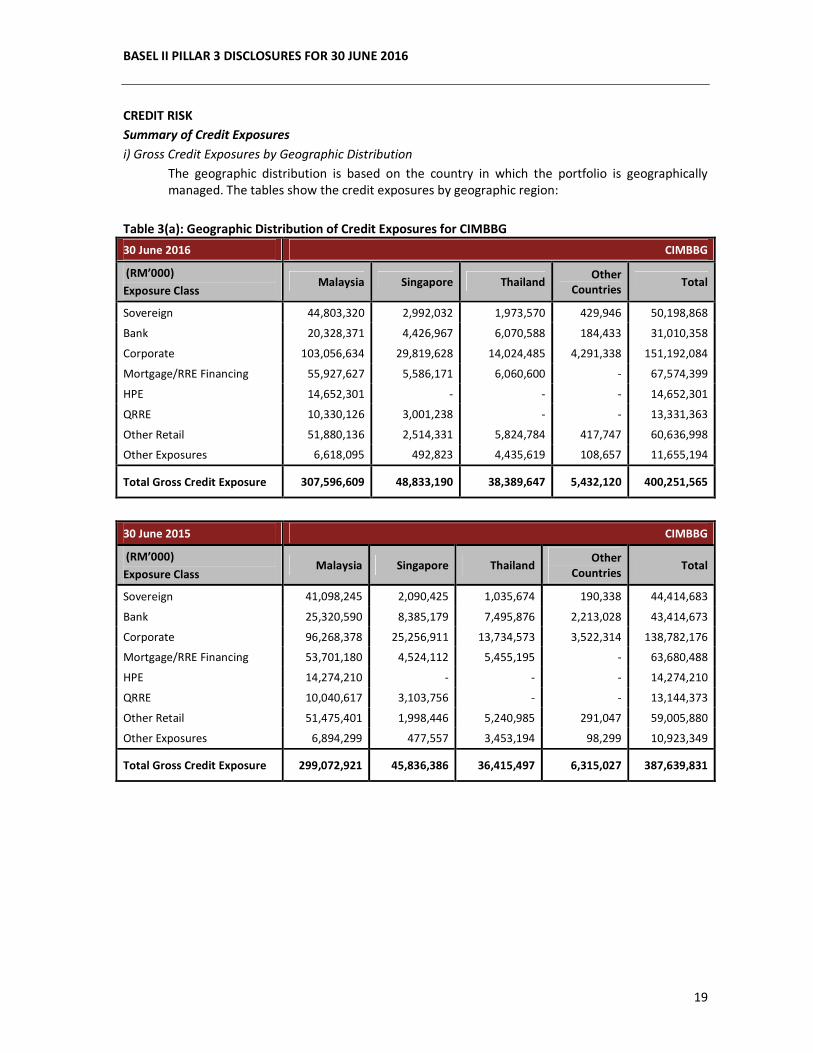
CREDIT RISK
Summary of Credit Exposures
i) Gross Credit Exposures by Geographic Distribution
The geographic distribution is based on the country in which the portfolio is geographically
managed. The tables show the credit exposures by geographic region:
Table 3(a): Geographic Distribution of Credit Exposures for CIMBBG
30 June 2016 CIMBBG
(RM’000)
Exposure Class Malaysia Singapore Thailand
Other
Countries Total
Sovereign 44,803,320 2,992,032 1,973,570 429,946 50,198,868
Bank 20,328,371 4,426,967 6,070,588 184,433 31,010,358
Corporate 103,056,634 29,819,628 14,024,485 4,291,338 151,192,084
Mortgage/RRE Financing 55,927,627 5,586,171 6,060,600 - 67,574,399
HPE 14,652,301 - - - 14,652,301
QRRE 10,330,126 3,001,238 - - 13,331,363
Other Retail 51,880,136 2,514,331 5,824,784 417,747 60,636,998
Other Exposures 6,618,095 492,823 4,435,619 108,657 11,655,194
Total Gross Credit Exposure 307,596,609 48,833,190 38,389,647 5,432,120 400,251,565
30 June 2015 CIMBBG
(RM’000)
Exposure Class Malaysia Singapore Thailand
Other
Countries Total
Sovereign 41,098,245 2,090,425 1,035,674 190,338 44,414,683
Bank 25,320,590 8,385,179 7,495,876 2,213,028 43,414,673
Corporate 96,268,378 25,256,911 13,734,573 3,522,314 138,782,176
Mortgage/RRE Financing 53,701,180 4,524,112 5,455,195 - 63,680,488
HPE 14,274,210 - - - 14,274,210
QRRE 10,040,617 3,103,756 - - 13,144,373
Other Retail 51,475,401 1,998,446 5,240,985 291,047 59,005,880
Other Exposures 6,894,299 477,557 3,453,194 98,299 10,923,349
Total Gross Credit Exposure 299,072,921 45,836,386 36,415,497 6,315,027 387,639,831
BASEL II PILLAR 3 DISCLOSURES FOR 30 JUNE 2016
20
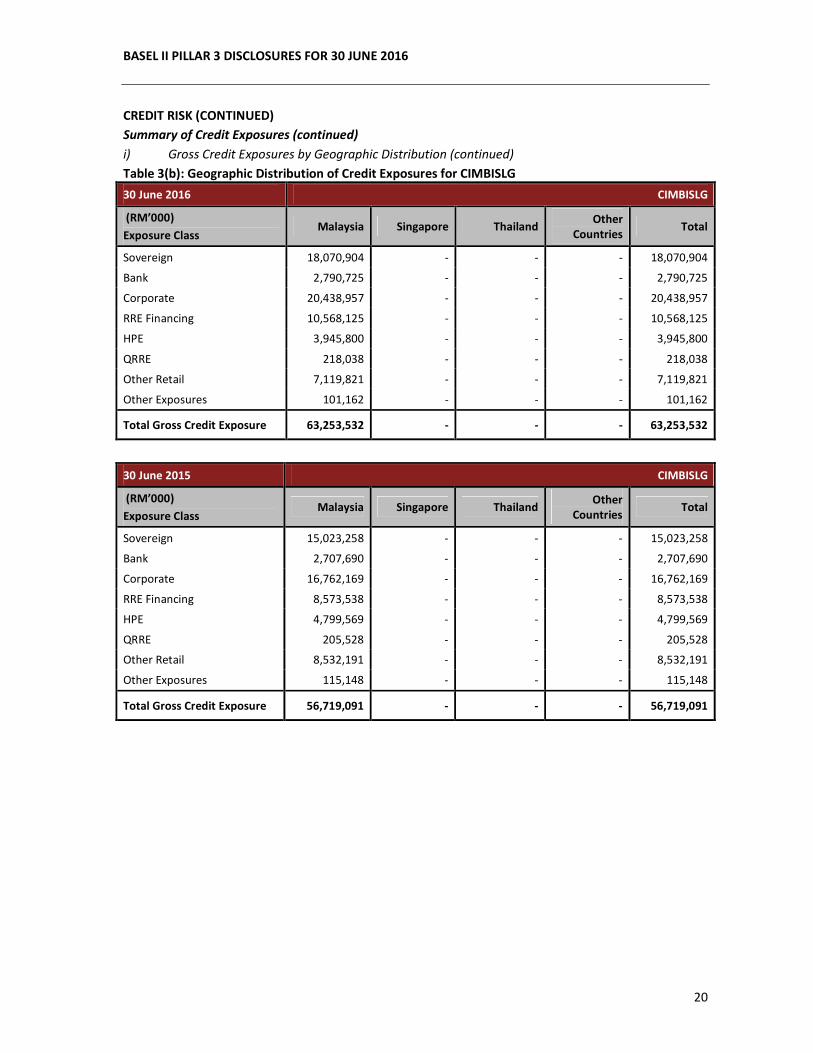
CREDIT RISK (CONTINUED)
Summary of Credit Exposures (continued)
i) Gross Credit Exposures by Geographic Distribution (continued)
Table 3(b): Geographic Distribution of Credit Exposures for CIMBISLG
30 June 2016 CIMBISLG
(RM’000)
Exposure Class Malaysia Singapore Thailand
Other
Countries Total
Sovereign 18,070,904 - - - 18,070,904
Bank 2,790,725 - - - 2,790,725
Corporate 20,438,957 - - - 20,438,957
RRE Financing 10,568,125 - - - 10,568,125
HPE 3,945,800 - - - 3,945,800
QRRE 218,038 - - - 218,038
Other Retail 7,119,821 - - - 7,119,821
Other Exposures 101,162 - - - 101,162
Total Gross Credit Exposure 63,253,532 - - - 63,253,532
30 June 2015 CIMBISLG
(RM’000)
Exposure Class Malaysia Singapore Thailand
Other
Countries Total
Sovereign 15,023,258 - - - 15,023,258
Bank 2,707,690 - - - 2,707,690
Corporate 16,762,169 - - - 16,762,169
RRE Financing 8,573,538 - - - 8,573,538
HPE 4,799,569 - - - 4,799,569
QRRE 205,528 - - - 205,528
Other Retail 8,532,191 - - - 8,532,191
Other Exposures 115,148 - - - 115,148
Total Gross Credit Exposure 56,719,091 - - - 56,719,091
BASEL II PILLAR 3 DISCLOSURES FOR 30 JUNE 2016
21
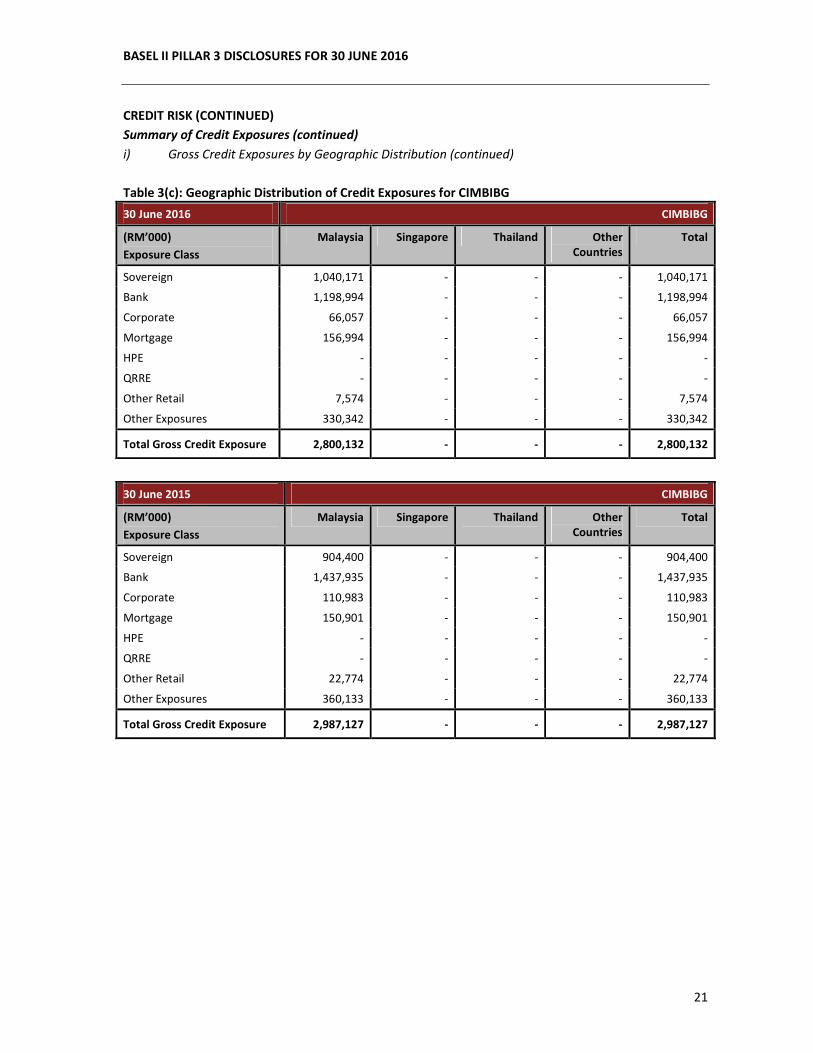
CREDIT RISK (CONTINUED)
Summary of Credit Exposures (continued)
i) Gross Credit Exposures by Geographic Distribution (continued)
Table 3(c): Geographic Distribution of Credit Exposures for CIMBIBG
30 June 2016 CIMBIBG
(RM’000)
Exposure Class
Malaysia Singapore Thailand Other
Countries
Total
Sovereign 1,040,171 - - - 1,040,171
Bank 1,198,994 - - - 1,198,994
Corporate 66,057 - - - 66,057
Mortgage 156,994 - - - 156,994
HPE - - - - -
QRRE - - - - -
Other Retail 7,574 - - - 7,574
Other Exposures 330,342 - - - 330,342
Total Gross Credit Exposure 2,800,132 - - - 2,800,132
30 June 2015 CIMBIBG
(RM’000)
Exposure Class
Malaysia Singapore Thailand Other
Countries
Total
Sovereign 904,400 - - - 904,400
Bank 1,437,935 - - - 1,437,935
Corporate 110,983 - - - 110,983
Mortgage 150,901 - - - 150,901
HPE - - - - -
QRRE - - - - -
Other Retail 22,774 - - - 22,774
Other Exposures 360,133 - - - 360,133
Total Gross Credit Exposure 2,987,127 - - - 2,987,127
BASEL II PILLAR 3 DISCLOSURES FOR 30 JUNE 2016
22
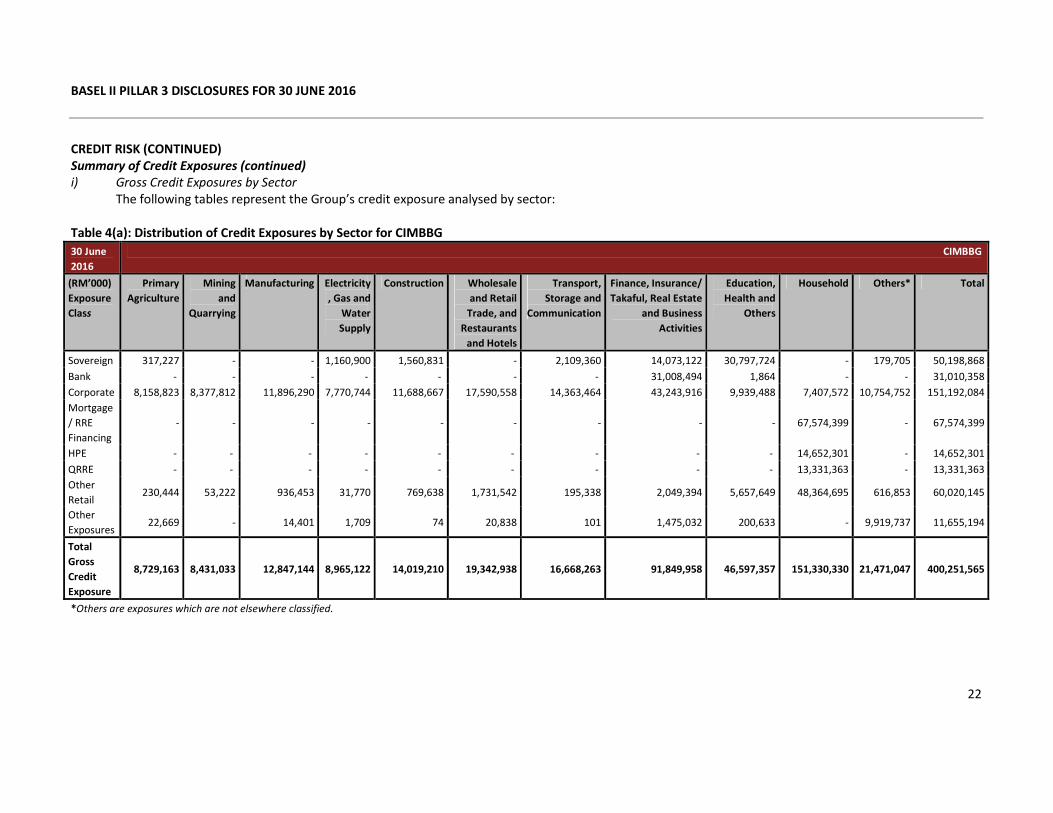
CREDIT RISK (CONTINUED)
Summary of Credit Exposures (continued)
i) Gross Credit Exposures by Sector
The following tables represent the Group’s credit exposure analysed by sector:
Table 4(a): Distribution of Credit Exposures by Sector for CIMBBG
30 June
2016
CIMBBG
(RM’000)
Exposure
Class
Primary
Agriculture
Mining
and
Quarrying
Manufacturing Electricity
, Gas and
Water
Supply
Construction Wholesale
and Retail
Trade, and
Restaurants
and Hotels
Transport,
Storage and
Communication
Finance, Insurance/
Takaful, Real Estate
and Business
Activities
Education,
Health and
Others
Household Others* Total
Sovereign 317,227 - - 1,160,900 1,560,831 - 2,109,360 14,073,122 30,797,724 - 179,705 50,198,868
Bank - - - - - - - 31,008,494 1,864 - - 31,010,358
Corporate 8,158,823 8,377,812 11,896,290 7,770,744 11,688,667 17,590,558 14,363,464 43,243,916 9,939,488 7,407,572 10,754,752 151,192,084
Mortgage
/ RRE
Financing
- - - - - - - - - 67,574,399 - 67,574,399
HPE - - - - - - - - - 14,652,301 - 14,652,301
QRRE - - - - - - - - - 13,331,363 - 13,331,363
Other
Retail 230,444 53,222 936,453 31,770 769,638 1,731,542 195,338 2,049,394 5,657,649 48,364,695 616,853 60,020,145
Other
Exposures 22,669 - 14,401 1,709 74 20,838 101 1,475,032 200,633 - 9,919,737 11,655,194
Total
Gross
Credit
Exposure
8,729,163 8,431,033 12,847,144 8,965,122 14,019,210 19,342,938 16,668,263 91,849,958 46,597,357 151,330,330 21,471,047 400,251,565
*Others are exposures which are not elsewhere classified.
BASEL II PILLAR 3 DISCLOSURES FOR 30 JUNE 2016
23
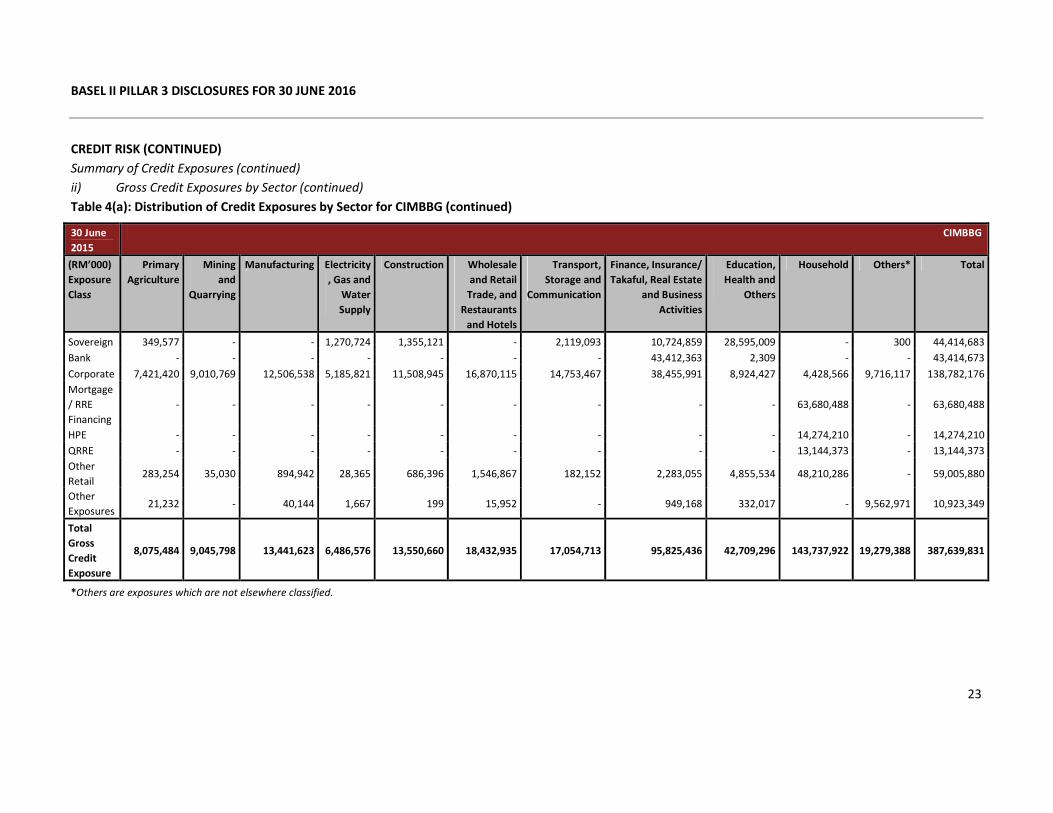
CREDIT RISK (CONTINUED)
Summary of Credit Exposures (continued)
ii) Gross Credit Exposures by Sector (continued)
Table 4(a): Distribution of Credit Exposures by Sector for CIMBBG (continued)
30 June
2015
CIMBBG
(RM’000)
Exposure
Class
Primary
Agriculture
Mining
and
Quarrying
Manufacturing Electricity
, Gas and
Water
Supply
Construction Wholesale
and Retail
Trade, and
Restaurants
and Hotels
Transport,
Storage and
Communication
Finance, Insurance/
Takaful, Real Estate
and Business
Activities
Education,
Health and
Others
Household Others* Total
Sovereign 349,577 - - 1,270,724 1,355,121 - 2,119,093 10,724,859 28,595,009 - 300 44,414,683
Bank - - - - - - - 43,412,363 2,309 - - 43,414,673
Corporate 7,421,420 9,010,769 12,506,538 5,185,821 11,508,945 16,870,115 14,753,467 38,455,991 8,924,427 4,428,566 9,716,117 138,782,176
Mortgage
/ RRE
Financing
- - - - - - - - - 63,680,488 - 63,680,488
HPE - - - - - - - - - 14,274,210 - 14,274,210
QRRE - - - - - - - - - 13,144,373 - 13,144,373
Other
Retail 283,254 35,030 894,942 28,365 686,396 1,546,867 182,152 2,283,055 4,855,534 48,210,286 - 59,005,880
Other
Exposures 21,232 - 40,144 1,667 199 15,952 - 949,168 332,017 - 9,562,971 10,923,349
Total
Gross
Credit
Exposure
8,075,484 9,045,798 13,441,623 6,486,576 13,550,660 18,432,935 17,054,713 95,825,436 42,709,296 143,737,922 19,279,388 387,639,831
*Others are exposures which are not elsewhere classified.

BASEL II PILLAR 3 DISCLOSURES FOR 30 JUNE 2016
24
CREDIT RISK (CONTINUED)
Summary of Credit Exposures (continued)
ii) Gross Credit Exposures by Sector (continued)
Table 4(b): Distribution of Credit Exposures by Sector for CIMBISLG
30 June
2016 CIMBISLG
(RM’000)
Exposure
Class
Primary
Agriculture
Mining
and
Quarrying
Manufacturing
Electricity,
Gas and
Water
Supply
Construction
Wholesale
and Retail
Trade, and
Restaurants
and Hotels
Transport,
Storage and
Communication
Islamic Finance,
Insurance/Takaful
, Real Estate and
Business Activities
Education,
Health and
Others
Household Others* Total
Sovereign 54,356 - - 276,309 439,848 - 114,597 9,186,311 7,999,482 - - 18,070,904
Bank - - - - - - - 2,790,725 - - - 2,790,725
Corporate 1,416,492 905,998 1,331,268 404,419 2,662,950 1,053,518 2,287,780 5,263,276 858,564 4,092,255 162,439 20,438,957
RRE
Financing - - - - - - - - - 10,568,125 - 10,568,125
HPE - - - - - - - - - 3,945,800 - 3,945,800
QRRE - - - - - - - - - 218,038 - 218,038
Other
Retail 12,297 8,919 53,065 2,053 68,223 157,893 5,213 207,257 37,115 6,529,076 38,711 7,119,821
Other
Exposures - - - - - - - 575 51,337 - 49,250 101,162
Total Gross
Credit
Exposure
1,483,145 914,917 1,384,332 682,781 3,171,021 1,211,411 2,407,589 17,448,143 8,946,498 25,353,293 250,400 63,253,532
Note: All sectors above are Shariah compliant.
*Others are exposures which are not elsewhere classified.
BASEL II PILLAR 3 DISCLOSURES FOR 30 JUNE 2016
25
CREDIT RISK (CONTINUED)
Summary of Credit Exposures (continued)
ii) Gross Credit Exposures by Sector (continued)
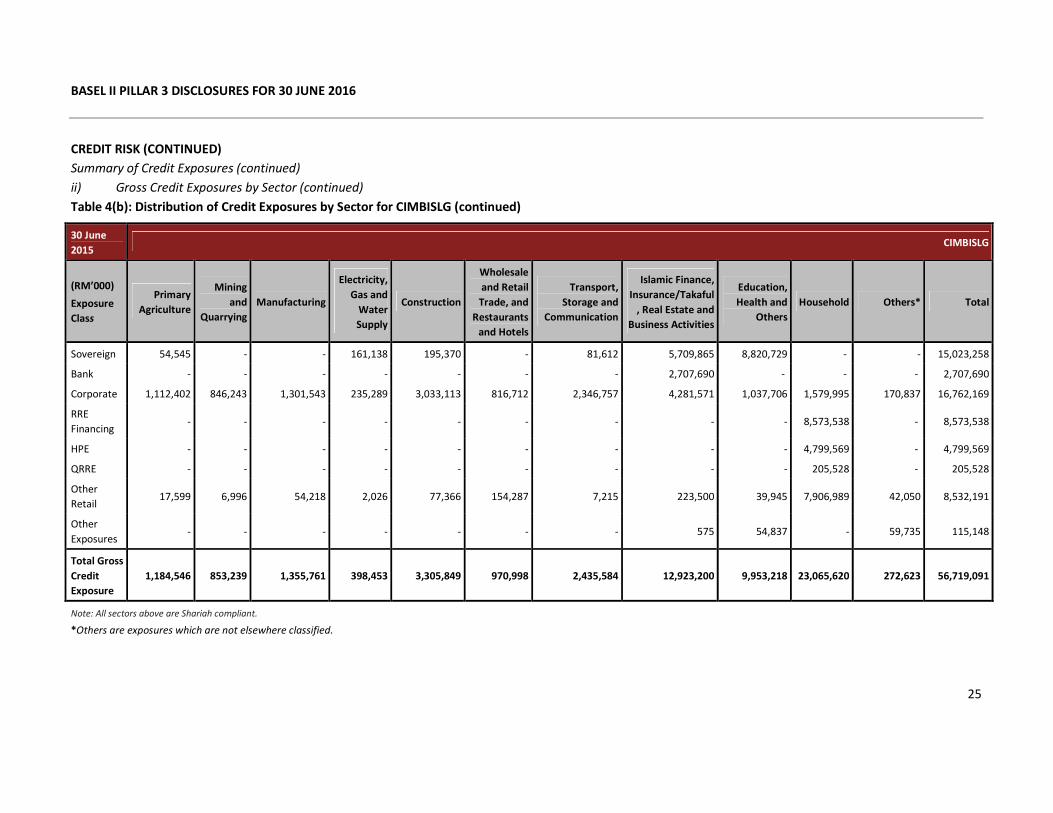
Table 4(b): Distribution of Credit Exposures by Sector for CIMBISLG (continued)
30 June
2015 CIMBISLG
(RM’000)
Exposure
Class
Primary
Agriculture
Mining
and
Quarrying
Manufacturing
Electricity,
Gas and
Water
Supply
Construction
Wholesale
and Retail
Trade, and
Restaurants
and Hotels
Transport,
Storage and
Communication
Islamic Finance,
Insurance/Takaful
, Real Estate and
Business Activities
Education,
Health and
Others
Household Others* Total
Sovereign 54,545 - - 161,138 195,370 - 81,612 5,709,865 8,820,729 - - 15,023,258
Bank - - - - - - - 2,707,690 - - - 2,707,690
Corporate 1,112,402 846,243 1,301,543 235,289 3,033,113 816,712 2,346,757 4,281,571 1,037,706 1,579,995 170,837 16,762,169
RRE
Financing - - - - - - - - - 8,573,538 - 8,573,538
HPE - - - - - - - - - 4,799,569 - 4,799,569
QRRE - - - - - - - - - 205,528 - 205,528
Other
Retail 17,599 6,996 54,218 2,026 77,366 154,287 7,215 223,500 39,945 7,906,989 42,050 8,532,191
Other
Exposures - - - - - - - 575 54,837 - 59,735 115,148
Total Gross
Credit
Exposure
1,184,546 853,239 1,355,761 398,453 3,305,849 970,998 2,435,584 12,923,200 9,953,218 23,065,620 272,623 56,719,091
Note: All sectors above are Shariah compliant.
*Others are exposures which are not elsewhere classified.
BASEL II PILLAR 3 DISCLOSURES FOR 30 JUNE 2016
26
CREDIT RISK (CONTINUED)
Summary of Credit Exposures (continued)
ii) Gross Credit Exposures by Sector (continued)
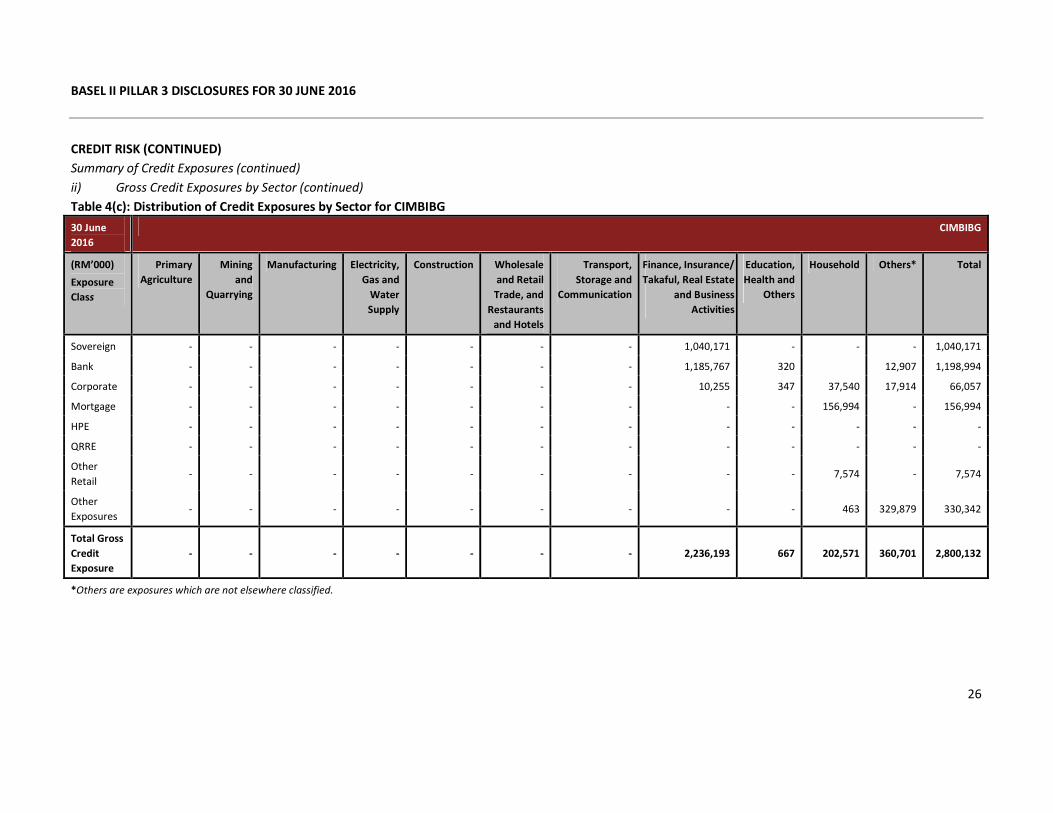
Table 4(c): Distribution of Credit Exposures by Sector for CIMBIBG
30 June
2016
CIMBIBG
(RM’000)
Exposure
Class
Primary
Agriculture
Mining
and
Quarrying
Manufacturing Electricity,
Gas and
Water
Supply
Construction Wholesale
and Retail
Trade, and
Restaurants
and Hotels
Transport,
Storage and
Communication
Finance, Insurance/
Takaful, Real Estate
and Business
Activities
Education,
Health and
Others
Household Others* Total
Sovereign - - - - - - - 1,040,171 - - - 1,040,171
Bank - - - - - - - 1,185,767 320 12,907 1,198,994
Corporate - - - - - - - 10,255 347 37,540 17,914 66,057
Mortgage - - - - - - - - - 156,994 - 156,994
HPE - - - - - - - - - - - -
QRRE - - - - - - - - - - - -
Other
Retail - - - - - - - - - 7,574 - 7,574
Other
Exposures - - - - - - - - - 463 329,879 330,342
Total Gross
Credit
Exposure
- - - - - - - 2,236,193 667 202,571 360,701 2,800,132
*Others are exposures which are not elsewhere classified.
BASEL II PILLAR 3 DISCLOSURES FOR 30 JUNE 2016
27
CREDIT RISK (CONTINUED)
Summary of Credit Exposures (continued)
ii) Gross Credit Exposures by Sector (continued)
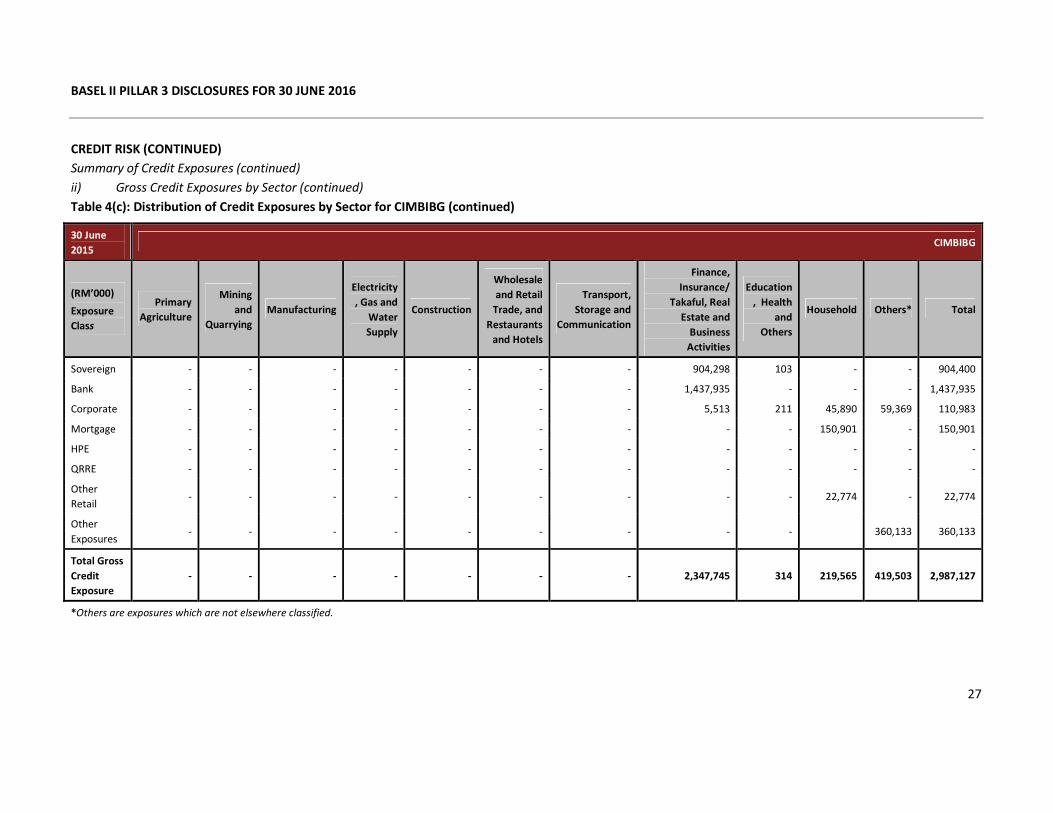
Table 4(c): Distribution of Credit Exposures by Sector for CIMBIBG (continued)
30 June
2015 CIMBIBG
(RM’000)
Exposure
Class
Primary
Agriculture
Mining
and
Quarrying
Manufacturing
Electricity
, Gas and
Water
Supply
Construction
Wholesale
and Retail
Trade, and
Restaurants
and Hotels
Transport,
Storage and
Communication
Finance,
Insurance/
Takaful, Real
Estate and
Business
Activities
Education
, Health
and
Others
Household Others* Total
Sovereign - - - - - - - 904,298 103 - - 904,400
Bank - - - - - - - 1,437,935 - - - 1,437,935
Corporate - - - - - - - 5,513 211 45,890 59,369 110,983
Mortgage - - - - - - - - - 150,901 - 150,901
HPE - - - - - - - - - - - -
QRRE - - - - - - - - - - - -
Other
Retail - - - - - - - - - 22,774 - 22,774
Other
Exposures - - - - - - - - - 360,133 360,133
Total Gross
Credit
Exposure
- - - - - - - 2,347,745 314 219,565 419,503 2,987,127
*Others are exposures which are not elsewhere classified.
BASEL II PILLAR 3 DISCLOSURES FOR 30 JUNE 2016
28
CREDIT RISK (CONTINUED)
Summary of Credit Exposures (continued)
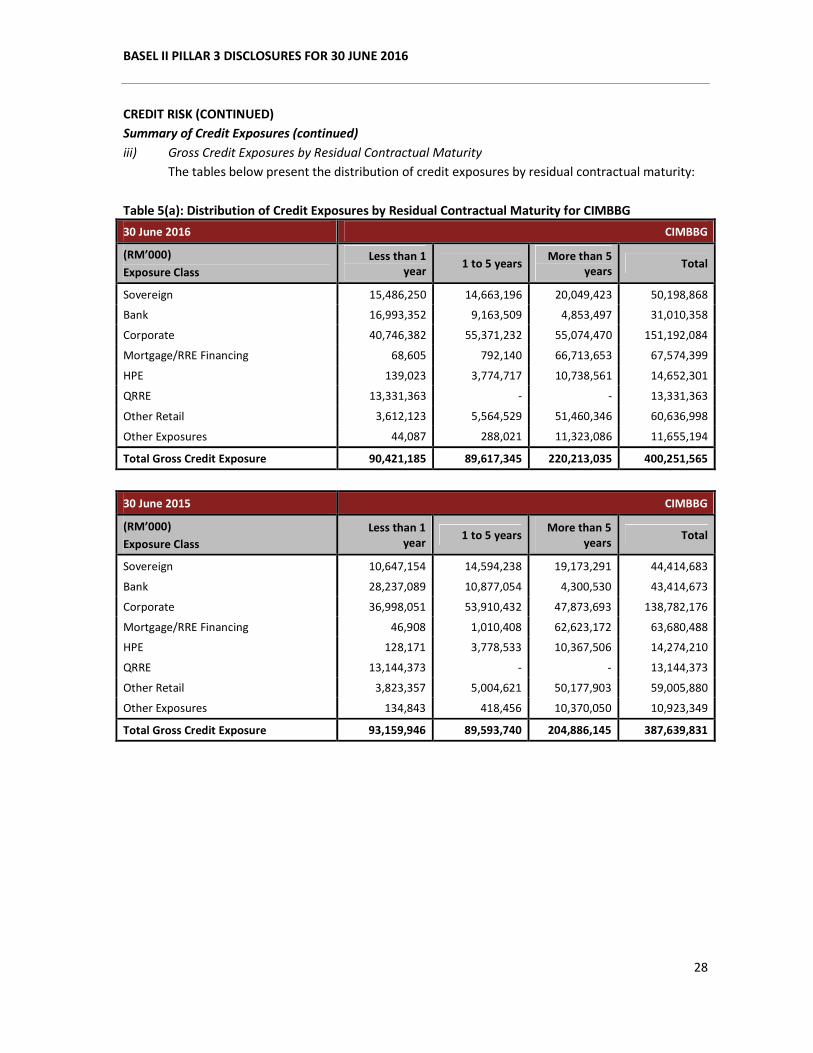
iii) Gross Credit Exposures by Residual Contractual Maturity
The tables below present the distribution of credit exposures by residual contractual maturity:
Table 5(a): Distribution of Credit Exposures by Residual Contractual Maturity for CIMBBG
30 June 2016 CIMBBG
(RM’000)
Exposure Class
Less than 1
year 1 to 5 years
More than 5
years Total
Sovereign 15,486,250 14,663,196 20,049,423 50,198,868
Bank 16,993,352 9,163,509 4,853,497 31,010,358
Corporate 40,746,382 55,371,232 55,074,470 151,192,084
Mortgage/RRE Financing 68,605 792,140 66,713,653 67,574,399
HPE 139,023 3,774,717 10,738,561 14,652,301
QRRE 13,331,363 - - 13,331,363
Other Retail 3,612,123 5,564,529 51,460,346 60,636,998
Other Exposures 44,087 288,021 11,323,086 11,655,194
Total Gross Credit Exposure 90,421,185 89,617,345 220,213,035 400,251,565
30 June 2015 CIMBBG
(RM’000)
Exposure Class
Less than 1
year 1 to 5 years
More than 5
years Total
Sovereign 10,647,154 14,594,238 19,173,291 44,414,683
Bank 28,237,089 10,877,054 4,300,530 43,414,673
Corporate 36,998,051 53,910,432 47,873,693 138,782,176
Mortgage/RRE Financing 46,908 1,010,408 62,623,172 63,680,488
HPE 128,171 3,778,533 10,367,506 14,274,210
QRRE 13,144,373 - - 13,144,373
Other Retail 3,823,357 5,004,621 50,177,903 59,005,880
Other Exposures 134,843 418,456 10,370,050 10,923,349
Total Gross Credit Exposure 93,159,946 89,593,740 204,886,145 387,639,831
BASEL II PILLAR 3 DISCLOSURES FOR 30 JUNE 2016
29
CREDIT RISK (CONTINUED)
Summary of Credit Exposures (continued)
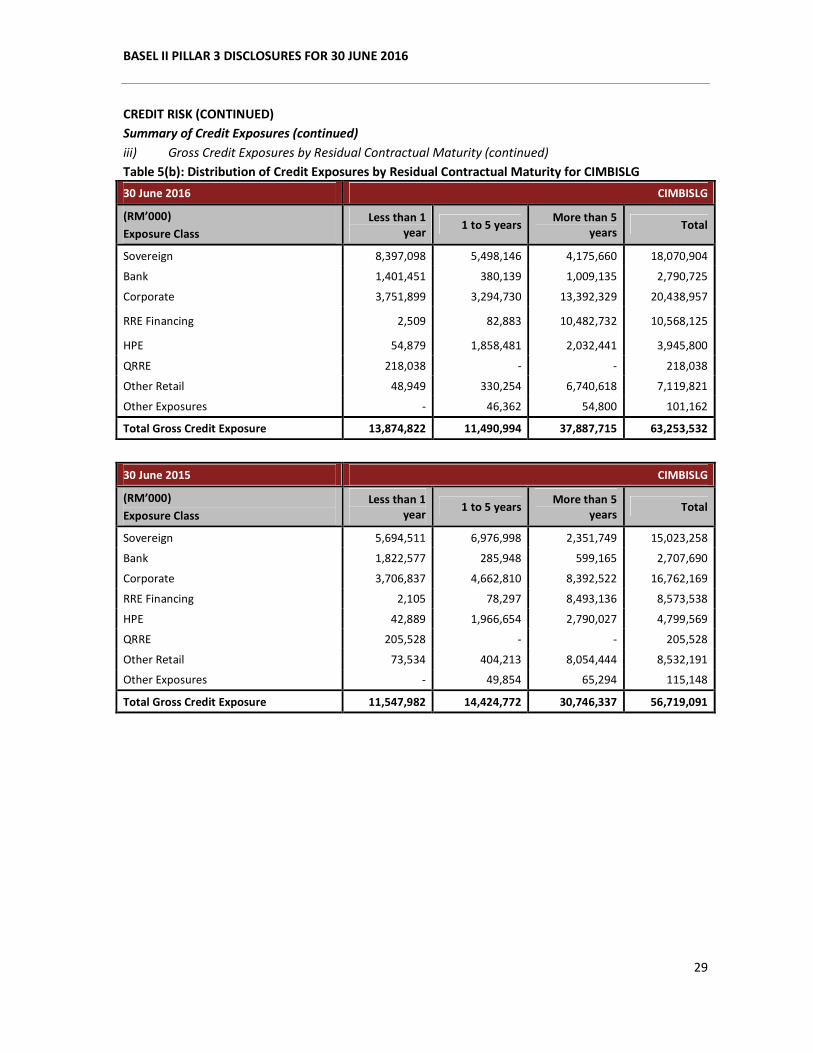
iii) Gross Credit Exposures by Residual Contractual Maturity (continued)
Table 5(b): Distribution of Credit Exposures by Residual Contractual Maturity for CIMBISLG
30 June 2016 CIMBISLG
(RM’000)
Exposure Class
Less than 1
year 1 to 5 years
More than 5
years Total
Sovereign 8,397,098 5,498,146 4,175,660 18,070,904
Bank 1,401,451 380,139 1,009,135 2,790,725
Corporate 3,751,899 3,294,730 13,392,329 20,438,957
RRE Financing 2,509 82,883 10,482,732 10,568,125
HPE 54,879 1,858,481 2,032,441 3,945,800
QRRE 218,038 - - 218,038
Other Retail 48,949 330,254 6,740,618 7,119,821
Other Exposures - 46,362 54,800 101,162
Total Gross Credit Exposure 13,874,822 11,490,994 37,887,715 63,253,532
30 June 2015 CIMBISLG
(RM’000)
Exposure Class
Less than 1
year 1 to 5 years
More than 5
years Total
Sovereign 5,694,511 6,976,998 2,351,749 15,023,258
Bank 1,822,577 285,948 599,165 2,707,690
Corporate 3,706,837 4,662,810 8,392,522 16,762,169
RRE Financing 2,105 78,297 8,493,136 8,573,538
HPE 42,889 1,966,654 2,790,027 4,799,569
QRRE 205,528 - - 205,528
Other Retail 73,534 404,213 8,054,444 8,532,191
Other Exposures - 49,854 65,294 115,148
Total Gross Credit Exposure 11,547,982 14,424,772 30,746,337 56,719,091
BASEL II PILLAR 3 DISCLOSURES FOR 30 JUNE 2016
30
CREDIT RISK (CONTINUED)
Summary of Credit Exposures (continued)
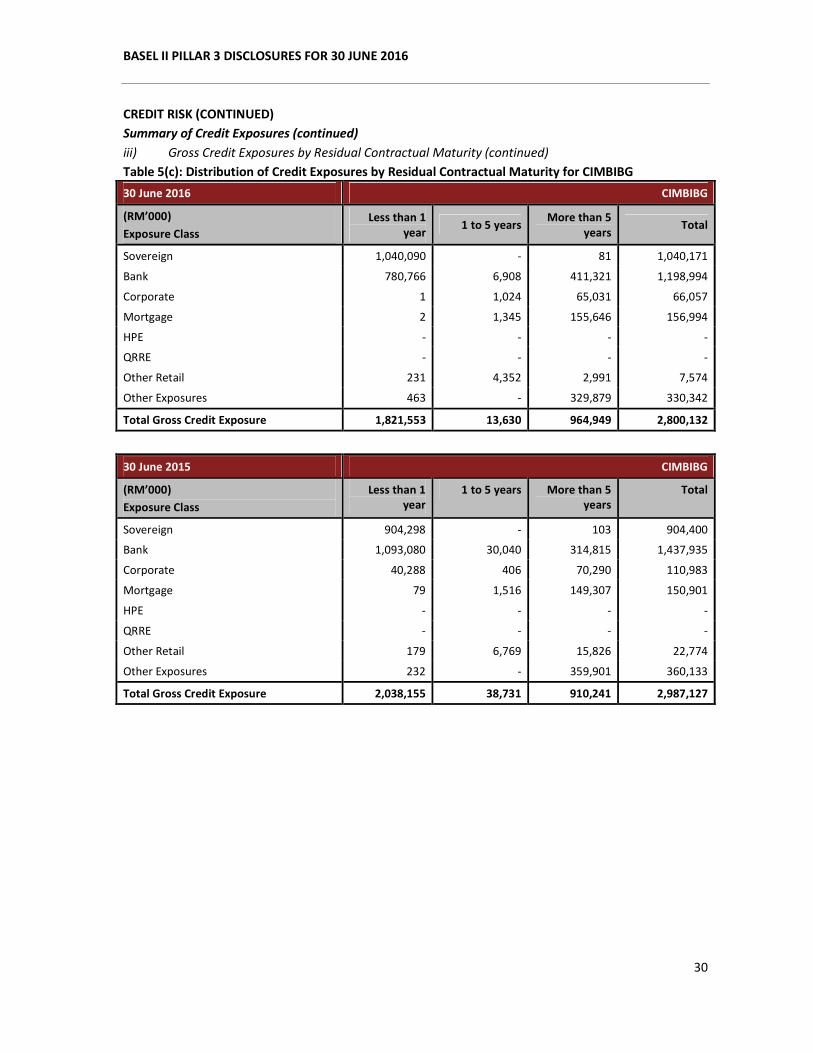
iii) Gross Credit Exposures by Residual Contractual Maturity (continued)
Table 5(c): Distribution of Credit Exposures by Residual Contractual Maturity for CIMBIBG
30 June 2016 CIMBIBG
(RM’000)
Exposure Class
Less than 1
year 1 to 5 years
More than 5
years Total
Sovereign 1,040,090 - 81 1,040,171
Bank 780,766 6,908 411,321 1,198,994
Corporate 1 1,024 65,031 66,057
Mortgage 2 1,345 155,646 156,994
HPE - - - -
QRRE - - - -
Other Retail 231 4,352 2,991 7,574
Other Exposures 463 - 329,879 330,342
Total Gross Credit Exposure 1,821,553 13,630 964,949 2,800,132
30 June 2015 CIMBIBG
(RM’000)
Exposure Class
Less than 1
year
1 to 5 years More than 5
years
Total
Sovereign 904,298 - 103 904,400
Bank 1,093,080 30,040 314,815 1,437,935
Corporate 40,288 406 70,290 110,983
Mortgage 79 1,516 149,307 150,901
HPE - - - -
QRRE - - - -
Other Retail 179 6,769 15,826 22,774
Other Exposures 232 - 359,901 360,133
Total Gross Credit Exposure 2,038,155 38,731 910,241 2,987,127
BASEL II PILLAR 3 DISCLOSURES FOR 30 JUNE 2016
31
CREDIT RISK (CONTINUED)
Credit Quality of Loans, Advances and Financing
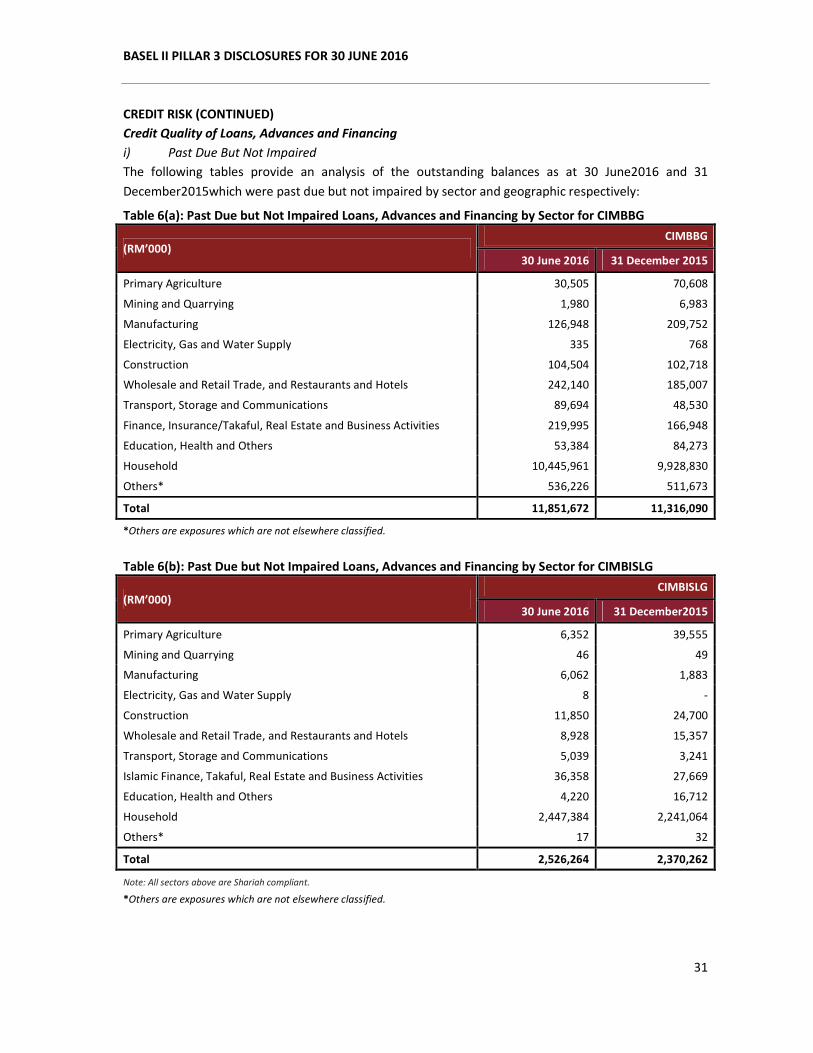
i) Past Due But Not Impaired
The following tables provide an analysis of the outstanding balances as at 30 June2016 and 31
December2015which were past due but not impaired by sector and geographic respectively:
Table 6(a): Past Due but Not Impaired Loans, Advances and Financing by Sector for CIMBBG
(RM’000) CIMBBG
30 June 2016 31 December 2015
Primary Agriculture 30,505 70,608
Mining and Quarrying 1,980 6,983
Manufacturing 126,948 209,752
Electricity, Gas and Water Supply 335 768
Construction 104,504 102,718
Wholesale and Retail Trade, and Restaurants and Hotels 242,140 185,007
Transport, Storage and Communications 89,694 48,530
Finance, Insurance/Takaful, Real Estate and Business Activities 219,995 166,948
Education, Health and Others 53,384 84,273
Household 10,445,961 9,928,830
Others* 536,226 511,673
Total 11,851,672 11,316,090
*Others are exposures which are not elsewhere classified.
Table 6(b): Past Due but Not Impaired Loans, Advances and Financing by Sector for CIMBISLG
(RM’000) CIMBISLG
30 June 2016 31 December2015
Primary Agriculture 6,352 39,555
Mining and Quarrying 46 49
Manufacturing 6,062 1,883
Electricity, Gas and Water Supply 8 -
Construction 11,850 24,700
Wholesale and Retail Trade, and Restaurants and Hotels 8,928 15,357
Transport, Storage and Communications 5,039 3,241
Islamic Finance, Takaful, Real Estate and Business Activities 36,358 27,669
Education, Health and Others 4,220 16,712
Household 2,447,384 2,241,064
Others* 17 32
Total 2,526,264 2,370,262
Note: All sectors above are Shariah compliant.
*Others are exposures which are not elsewhere classified.
BASEL II PILLAR 3 DISCLOSURES FOR 30 JUNE 2016
32
CREDIT RISK (CONTINUED)
Credit Quality of Loans, Advances and Financing (continued)
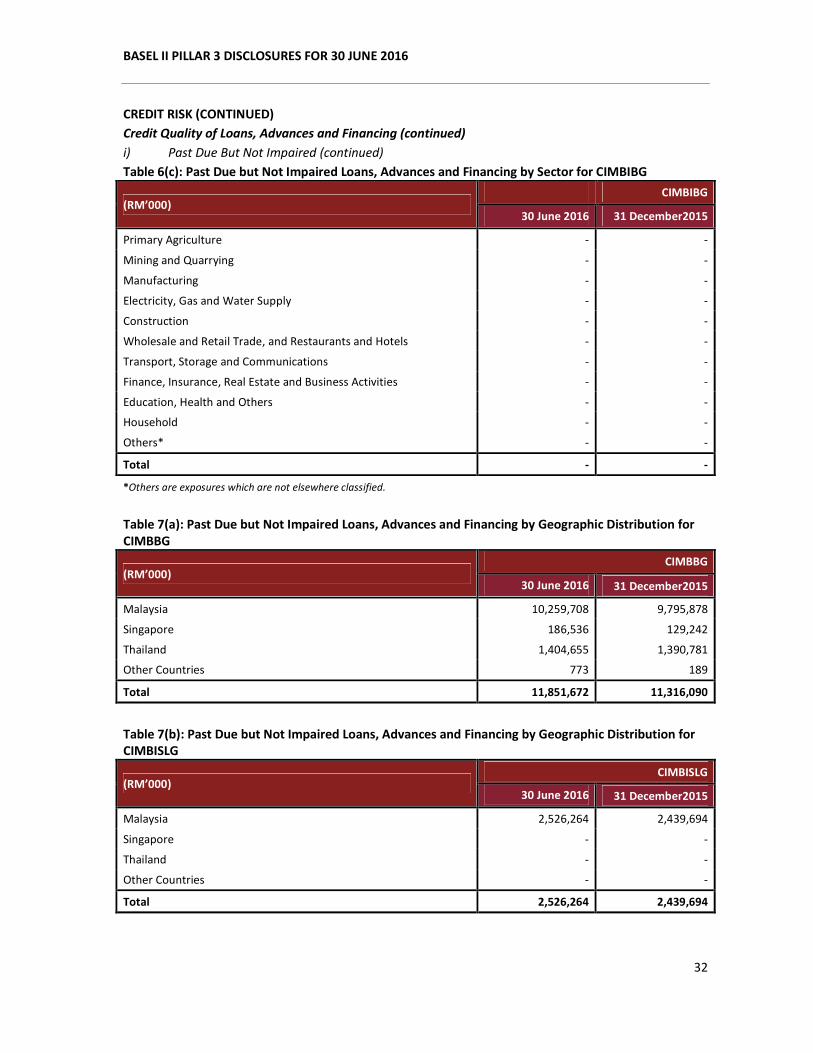
i) Past Due But Not Impaired (continued)
Table 6(c): Past Due but Not Impaired Loans, Advances and Financing by Sector for CIMBIBG
(RM’000) CIMBIBG
30 June 2016 31 December2015
Primary Agriculture - -
Mining and Quarrying - -
Manufacturing - -
Electricity, Gas and Water Supply - -
Construction - -
Wholesale and Retail Trade, and Restaurants and Hotels - -
Transport, Storage and Communications - -
Finance, Insurance, Real Estate and Business Activities - -
Education, Health and Others - -
Household - -
Others* - -
Total - -
*Others are exposures which are not elsewhere classified.
Table 7(a): Past Due but Not Impaired Loans, Advances and Financing by Geographic Distribution for
CIMBBG
(RM’000) CIMBBG
30 June 2016 31 December2015
Malaysia 10,259,708 9,795,878
Singapore 186,536 129,242
Thailand 1,404,655 1,390,781
Other Countries 773 189
Total 11,851,672 11,316,090
Table 7(b): Past Due but Not Impaired Loans, Advances and Financing by Geographic Distribution for
CIMBISLG
(RM’000) CIMBISLG
30 June 2016 31 December2015
Malaysia 2,526,264 2,439,694
Singapore - -
Thailand - -
Other Countries - -
Total 2,526,264 2,439,694
BASEL II PILLAR 3 DISCLOSURES FOR 30 JUNE 2016
33
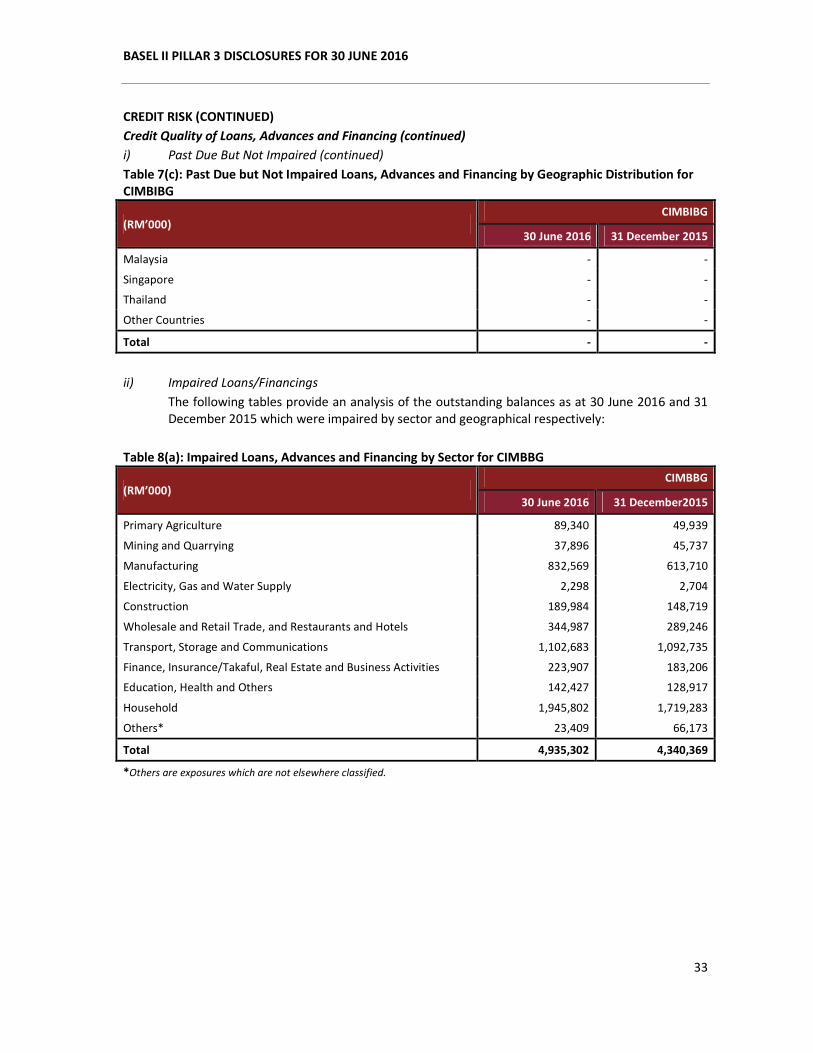
CREDIT RISK (CONTINUED)
Credit Quality of Loans, Advances and Financing (continued)
i) Past Due But Not Impaired (continued)
Table 7(c): Past Due but Not Impaired Loans, Advances and Financing by Geographic Distribution for
CIMBIBG
(RM’000) CIMBIBG
30 June 2016 31 December 2015
Malaysia - -
Singapore - -
Thailand - -
Other Countries - -
Total - -
ii) Impaired Loans/Financings
The following tables provide an analysis of the outstanding balances as at 30 June 2016 and 31
December 2015 which were impaired by sector and geographical respectively:
Table 8(a): Impaired Loans, Advances and Financing by Sector for CIMBBG
(RM’000) CIMBBG
30 June 2016 31 December2015
Primary Agriculture 89,340 49,939
Mining and Quarrying 37,896 45,737
Manufacturing 832,569 613,710
Electricity, Gas and Water Supply 2,298 2,704
Construction 189,984 148,719
Wholesale and Retail Trade, and Restaurants and Hotels 344,987 289,246
Transport, Storage and Communications 1,102,683 1,092,735
Finance, Insurance/Takaful, Real Estate and Business Activities 223,907 183,206
Education, Health and Others 142,427 128,917
Household 1,945,802 1,719,283
Others* 23,409 66,173
Total 4,935,302 4,340,369
*Others are exposures which are not elsewhere classified.
BASEL II PILLAR 3 DISCLOSURES FOR 30 JUNE 2016
34
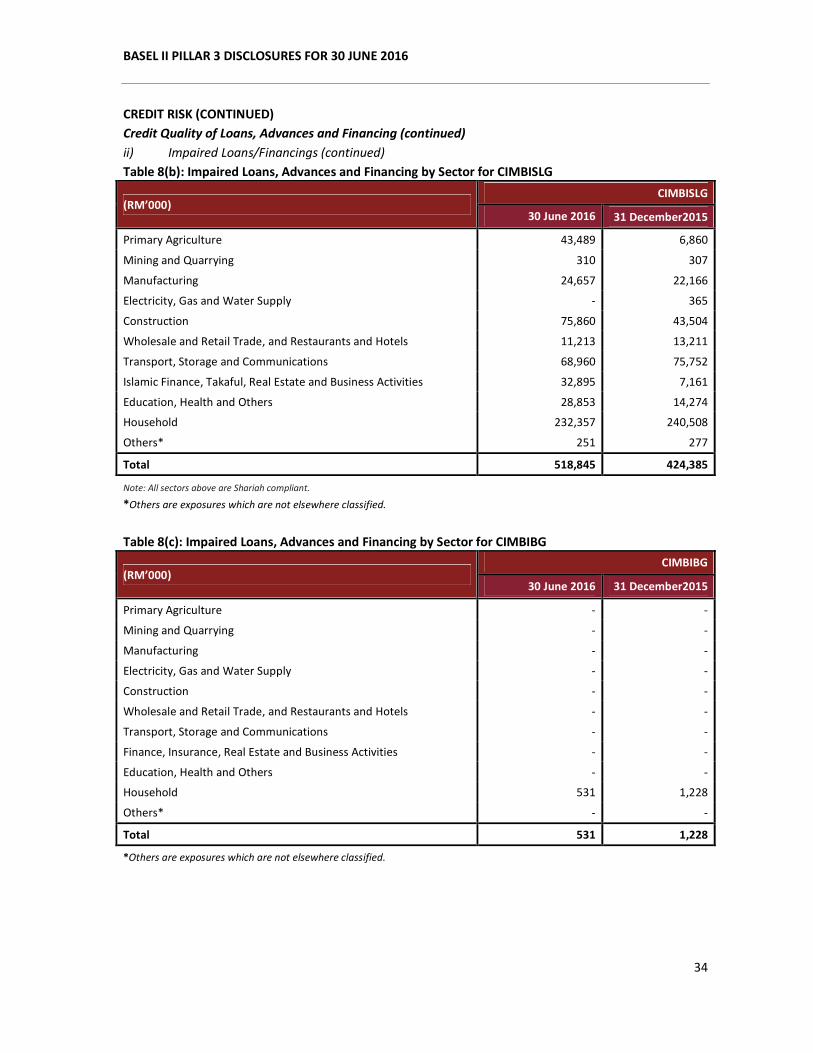
CREDIT RISK (CONTINUED)
Credit Quality of Loans, Advances and Financing (continued)
ii) Impaired Loans/Financings (continued)
Table 8(b): Impaired Loans, Advances and Financing by Sector for CIMBISLG
(RM’000) CIMBISLG
30 June 2016 31 December2015
Primary Agriculture 43,489 6,860
Mining and Quarrying 310 307
Manufacturing 24,657 22,166
Electricity, Gas and Water Supply - 365
Construction 75,860 43,504
Wholesale and Retail Trade, and Restaurants and Hotels 11,213 13,211
Transport, Storage and Communications 68,960 75,752
Islamic Finance, Takaful, Real Estate and Business Activities 32,895 7,161
Education, Health and Others 28,853 14,274
Household 232,357 240,508
Others* 251 277
Total 518,845 424,385
Note: All sectors above are Shariah compliant.
*Others are exposures which are not elsewhere classified.
Table 8(c): Impaired Loans, Advances and Financing by Sector for CIMBIBG
(RM’000) CIMBIBG
30 June 2016 31 December2015
Primary Agriculture - -
Mining and Quarrying - -
Manufacturing - -
Electricity, Gas and Water Supply - -
Construction - -
Wholesale and Retail Trade, and Restaurants and Hotels - -
Transport, Storage and Communications - -
Finance, Insurance, Real Estate and Business Activities - -
Education, Health and Others - -
Household 531 1,228
Others* - -
Total 531 1,228
*Others are exposures which are not elsewhere classified.
BASEL II PILLAR 3 DISCLOSURES FOR 30 JUNE 2016
35
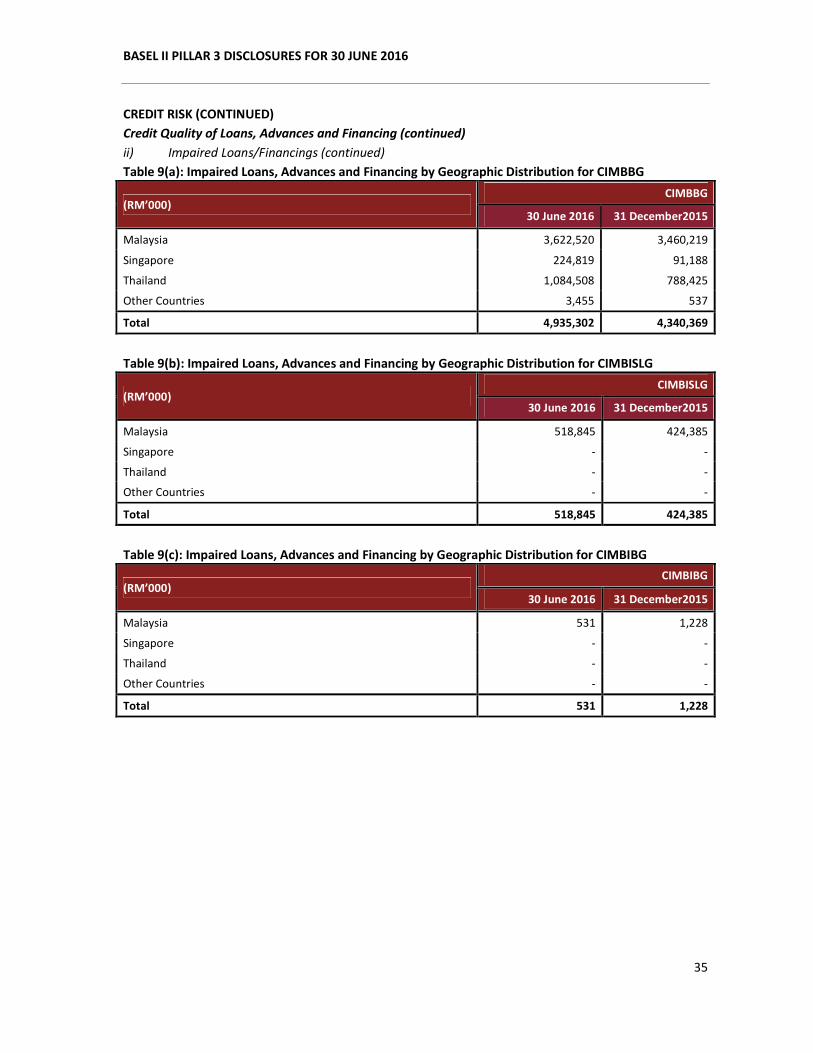
CREDIT RISK (CONTINUED)
Credit Quality of Loans, Advances and Financing (continued)
ii) Impaired Loans/Financings (continued)
Table 9(a): Impaired Loans, Advances and Financing by Geographic Distribution for CIMBBG
(RM’000) CIMBBG
30 June 2016 31 December2015
Malaysia 3,622,520 3,460,219
Singapore 224,819 91,188
Thailand 1,084,508 788,425
Other Countries 3,455 537
Total 4,935,302 4,340,369
Table 9(b): Impaired Loans, Advances and Financing by Geographic Distribution for CIMBISLG
(RM’000) CIMBISLG
30 June 2016 31 December2015
Malaysia 518,845 424,385
Singapore - -
Thailand - -
Other Countries - -
Total 518,845 424,385
Table 9(c): Impaired Loans, Advances and Financing by Geographic Distribution for CIMBIBG
(RM’000) CIMBIBG
30 June 2016 31 December2015
Malaysia 531 1,228
Singapore - -
Thailand - -
Other Countries - -
Total 531 1,228
BASEL II PILLAR 3 DISCLOSURES FOR 30 JUNE 2016
36
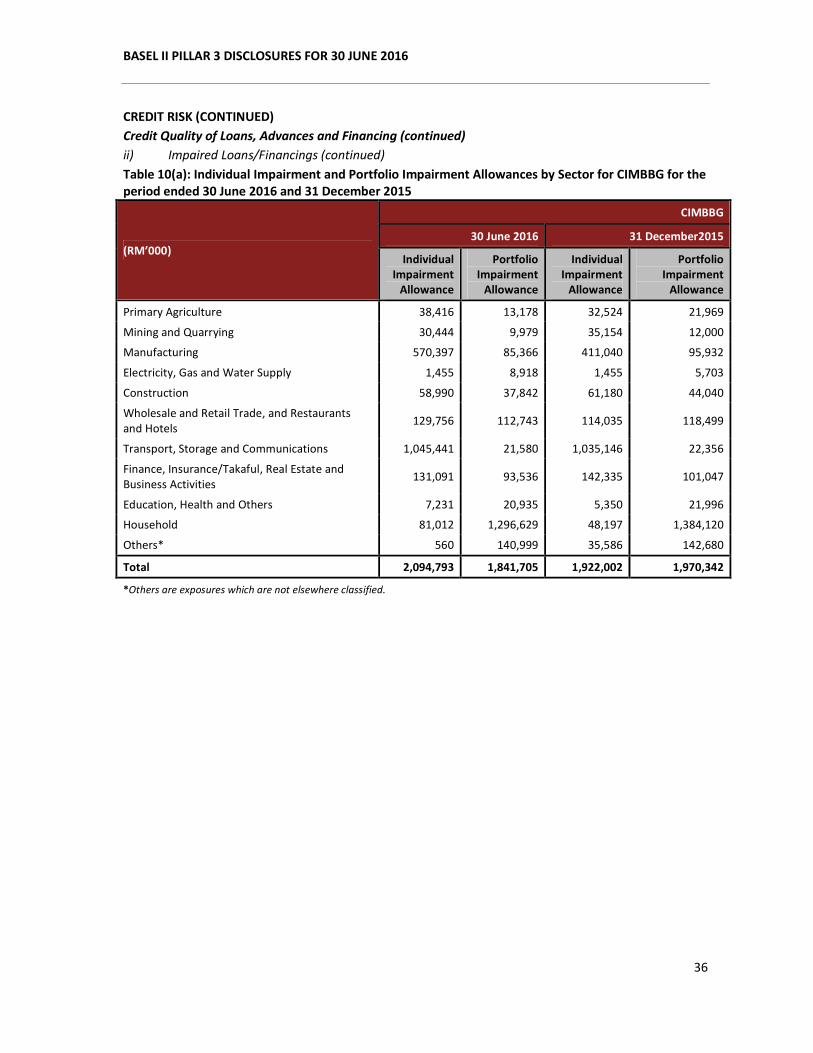
CREDIT RISK (CONTINUED)
Credit Quality of Loans, Advances and Financing (continued)
ii) Impaired Loans/Financings (continued)
Table 10(a): Individual Impairment and Portfolio Impairment Allowances by Sector for CIMBBG for the
period ended 30 June 2016 and 31 December 2015
(RM’000)
CIMBBG
30 June 2016 31 December2015
Individual
Impairment
Allowance
Portfolio
Impairment
Allowance
Individual
Impairment
Allowance
Portfolio
Impairment
Allowance
Primary Agriculture 38,416 13,178 32,524 21,969
Mining and Quarrying 30,444 9,979 35,154 12,000
Manufacturing 570,397 85,366 411,040 95,932
Electricity, Gas and Water Supply 1,455 8,918 1,455 5,703
Construction 58,990 37,842 61,180 44,040
Wholesale and Retail Trade, and Restaurants
and Hotels 129,756 112,743 114,035 118,499
Transport, Storage and Communications 1,045,441 21,580 1,035,146 22,356
Finance, Insurance/Takaful, Real Estate and
Business Activities 131,091 93,536 142,335 101,047
Education, Health and Others 7,231 20,935 5,350 21,996
Household 81,012 1,296,629 48,197 1,384,120
Others* 560 140,999 35,586 142,680
Total 2,094,793 1,841,705 1,922,002 1,970,342
*Others are exposures which are not elsewhere classified.
BASEL II PILLAR 3 DISCLOSURES FOR 30 JUNE 2016
37
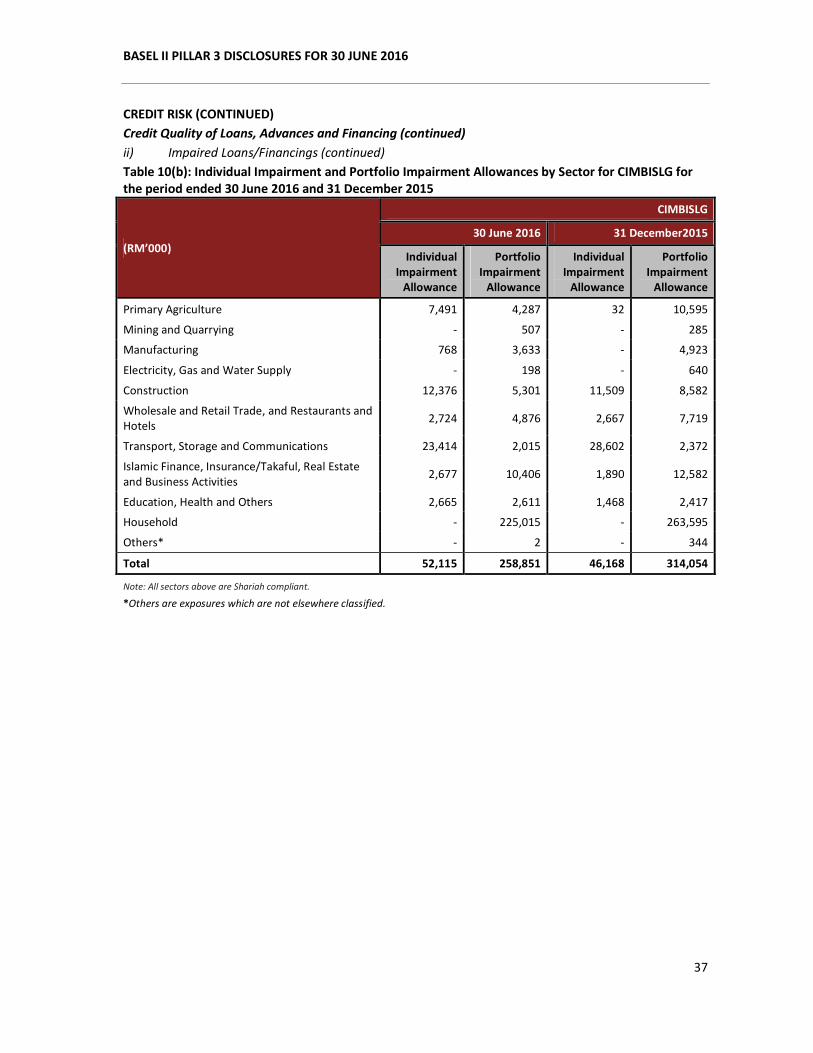
CREDIT RISK (CONTINUED)
Credit Quality of Loans, Advances and Financing (continued)
ii) Impaired Loans/Financings (continued)
Table 10(b): Individual Impairment and Portfolio Impairment Allowances by Sector for CIMBISLG for
the period ended 30 June 2016 and 31 December 2015
(RM’000)
CIMBISLG
30 June 2016 31 December2015
Individual
Impairment
Allowance
Portfolio
Impairment
Allowance
Individual
Impairment
Allowance
Portfolio
Impairment
Allowance
Primary Agriculture 7,491 4,287 32 10,595
Mining and Quarrying - 507 - 285
Manufacturing 768 3,633 - 4,923
Electricity, Gas and Water Supply - 198 - 640
Construction 12,376 5,301 11,509 8,582
Wholesale and Retail Trade, and Restaurants and
Hotels 2,724 4,876 2,667 7,719
Transport, Storage and Communications 23,414 2,015 28,602 2,372
Islamic Finance, Insurance/Takaful, Real Estate
and Business Activities 2,677 10,406 1,890 12,582
Education, Health and Others 2,665 2,611 1,468 2,417
Household - 225,015 - 263,595
Others* - 2 - 344
Total 52,115 258,851 46,168 314,054
Note: All sectors above are Shariah compliant.
*Others are exposures which are not elsewhere classified.
BASEL II PILLAR 3 DISCLOSURES FOR 30 JUNE 2016
38
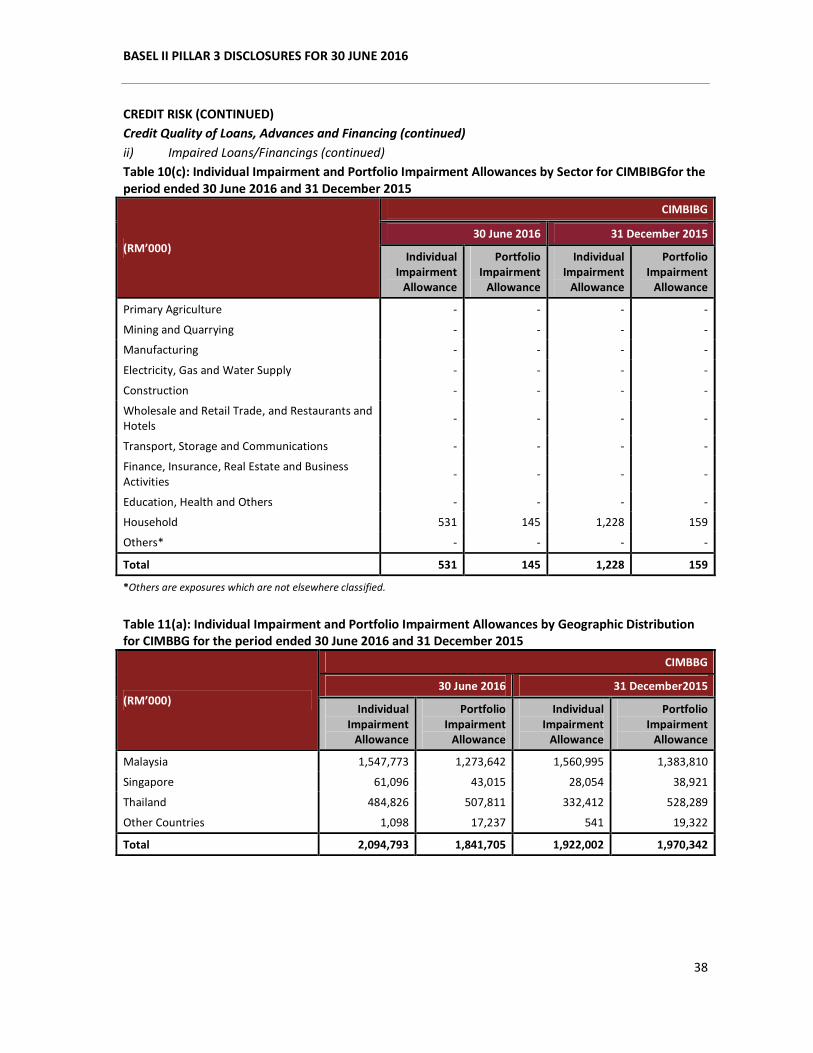
CREDIT RISK (CONTINUED)
Credit Quality of Loans, Advances and Financing (continued)
ii) Impaired Loans/Financings (continued)
Table 10(c): Individual Impairment and Portfolio Impairment Allowances by Sector for CIMBIBGfor the
period ended 30 June 2016 and 31 December 2015
(RM’000)
CIMBIBG
30 June 2016 31 December 2015
Individual
Impairment
Allowance
Portfolio
Impairment
Allowance
Individual
Impairment
Allowance
Portfolio
Impairment
Allowance
Primary Agriculture - - - -
Mining and Quarrying - - - -
Manufacturing - - - -
Electricity, Gas and Water Supply - - - -
Construction - - - -
Wholesale and Retail Trade, and Restaurants and
Hotels - - - -
Transport, Storage and Communications - - - -
Finance, Insurance, Real Estate and Business
Activities - - - -
Education, Health and Others - - - -
Household 531 145 1,228 159
Others* - - - -
Total 531 145 1,228 159
*Others are exposures which are not elsewhere classified.
Table 11(a): Individual Impairment and Portfolio Impairment Allowances by Geographic Distribution
for CIMBBG for the period ended 30 June 2016 and 31 December 2015
(RM’000)
CIMBBG
30 June 2016 31 December2015
Individual
Impairment
Allowance
Portfolio
Impairment
Allowance
Individual
Impairment
Allowance
Portfolio
Impairment
Allowance
Malaysia 1,547,773 1,273,642 1,560,995 1,383,810
Singapore 61,096 43,015 28,054 38,921
Thailand 484,826 507,811 332,412 528,289
Other Countries 1,098 17,237 541 19,322
Total 2,094,793 1,841,705 1,922,002 1,970,342
BASEL II PILLAR 3 DISCLOSURES FOR 30 JUNE 2016
39
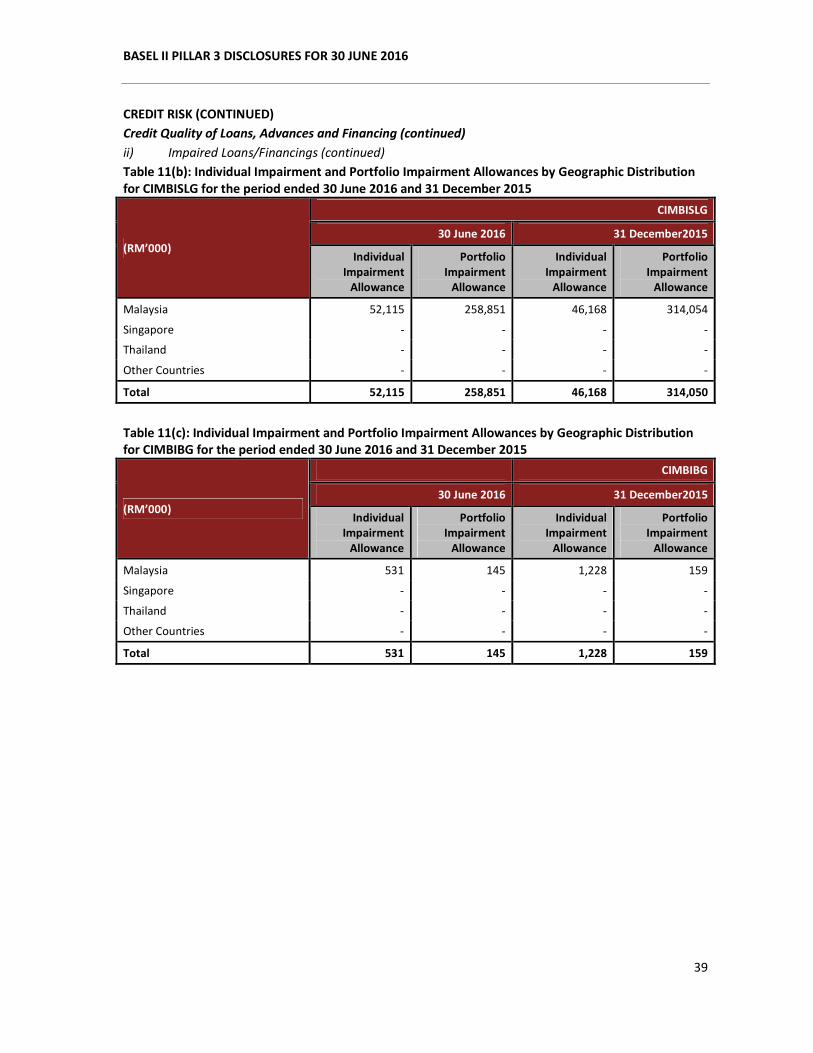
CREDIT RISK (CONTINUED)
Credit Quality of Loans, Advances and Financing (continued)
ii) Impaired Loans/Financings (continued)
Table 11(b): Individual Impairment and Portfolio Impairment Allowances by Geographic Distribution
for CIMBISLG for the period ended 30 June 2016 and 31 December 2015
(RM’000)
CIMBISLG
30 June 2016 31 December2015
Individual
Impairment
Allowance
Portfolio
Impairment
Allowance
Individual
Impairment
Allowance
Portfolio
Impairment
Allowance
Malaysia 52,115 258,851 46,168 314,054
Singapore - - - -
Thailand - - - -
Other Countries - - - -
Total 52,115 258,851 46,168 314,050
Table 11(c): Individual Impairment and Portfolio Impairment Allowances by Geographic Distribution
for CIMBIBG for the period ended 30 June 2016 and 31 December 2015
(RM’000)
CIMBIBG
30 June 2016 31 December2015
Individual
Impairment
Allowance
Portfolio
Impairment
Allowance
Individual
Impairment
Allowance
Portfolio
Impairment
Allowance
Malaysia 531 145 1,228 159
Singapore - - - -
Thailand - - - -
Other Countries - - - -
Total 531 145 1,228 159
BASEL II PILLAR 3 DISCLOSURES FOR 30 JUNE 2016
40
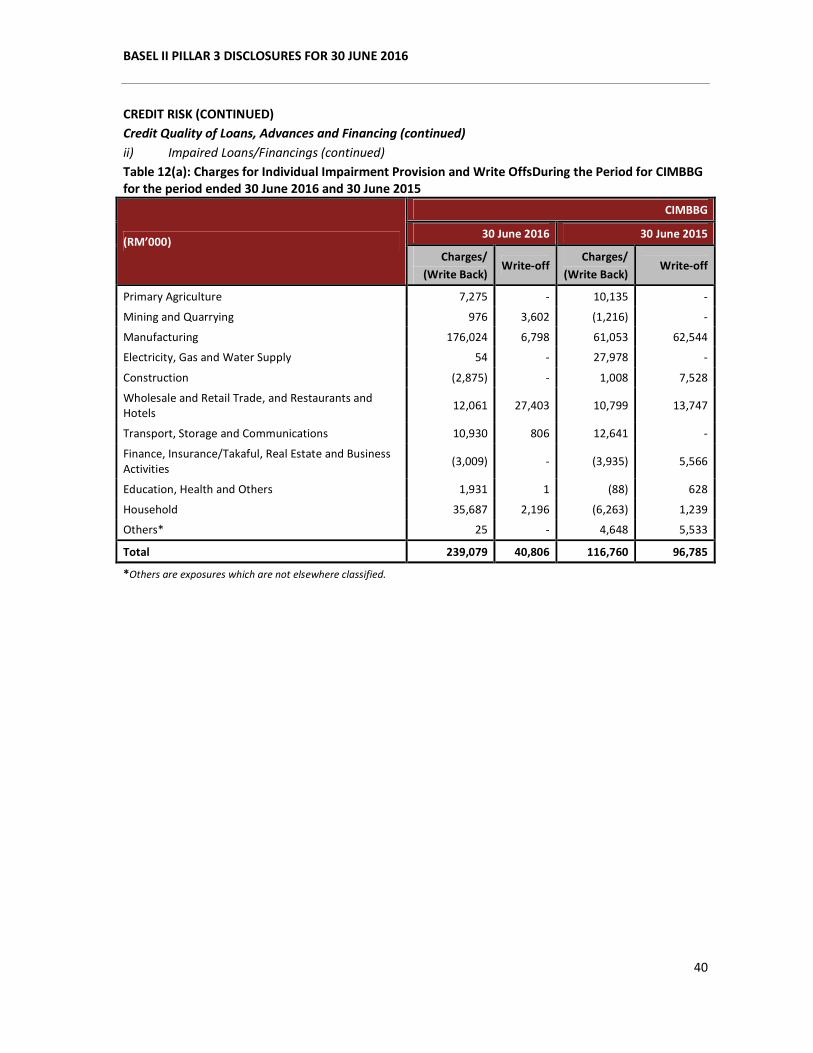
CREDIT RISK (CONTINUED)
Credit Quality of Loans, Advances and Financing (continued)
ii) Impaired Loans/Financings (continued)
Table 12(a): Charges for Individual Impairment Provision and Write OffsDuring the Period for CIMBBG
for the period ended 30 June 2016 and 30 June 2015
(RM’000)
CIMBBG
30 June 2016 30 June 2015
Charges/
(Write Back) Write-off
Charges/
(Write Back) Write-off
Primary Agriculture 7,275 - 10,135 -
Mining and Quarrying 976 3,602 (1,216) -
Manufacturing 176,024 6,798 61,053 62,544
Electricity, Gas and Water Supply 54 - 27,978 -
Construction (2,875) - 1,008 7,528
Wholesale and Retail Trade, and Restaurants and
Hotels 12,061 27,403 10,799 13,747
Transport, Storage and Communications 10,930 806 12,641 -
Finance, Insurance/Takaful, Real Estate and Business
Activities (3,009) - (3,935) 5,566
Education, Health and Others 1,931 1 (88) 628
Household 35,687 2,196 (6,263) 1,239
Others* 25 - 4,648 5,533
Total 239,079 40,806 116,760 96,785
*Others are exposures which are not elsewhere classified.
BASEL II PILLAR 3 DISCLOSURES FOR 30 JUNE 2016
41
CREDIT RISK (CONTINUED)
Credit Quality of Loans, Advances and Financing (continued)
ii) Impaired Loans/Financings (continued)
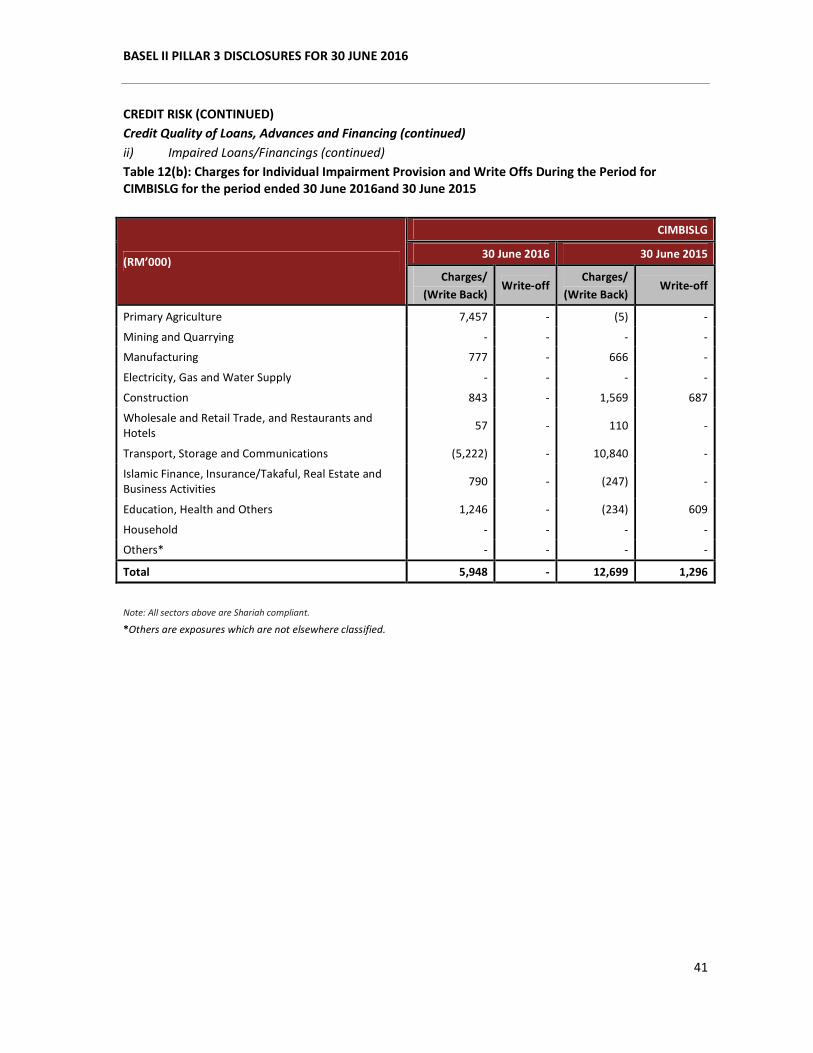
Table 12(b): Charges for Individual Impairment Provision and Write Offs During the Period for
CIMBISLG for the period ended 30 June 2016and 30 June 2015
(RM’000)
CIMBISLG
30 June 2016 30 June 2015
Charges/
(Write Back) Write-off
Charges/
(Write Back) Write-off
Primary Agriculture 7,457 - (5) -
Mining and Quarrying - - - -
Manufacturing 777 - 666 -
Electricity, Gas and Water Supply - - - -
Construction 843 - 1,569 687
Wholesale and Retail Trade, and Restaurants and
Hotels 57 - 110 -
Transport, Storage and Communications (5,222) - 10,840 -
Islamic Finance, Insurance/Takaful, Real Estate and
Business Activities 790 - (247) -
Education, Health and Others 1,246 - (234) 609
Household - - - -
Others* - - - -
Total 5,948 - 12,699 1,296
Note: All sectors above are Shariah compliant.
*Others are exposures which are not elsewhere classified.
BASEL II PILLAR 3 DISCLOSURES FOR 30 JUNE 2016
42
CREDIT RISK (CONTINUED)
Credit Quality of Loans, Advances and Financing (continued)
ii) Impaired Loans/Financings (continued)
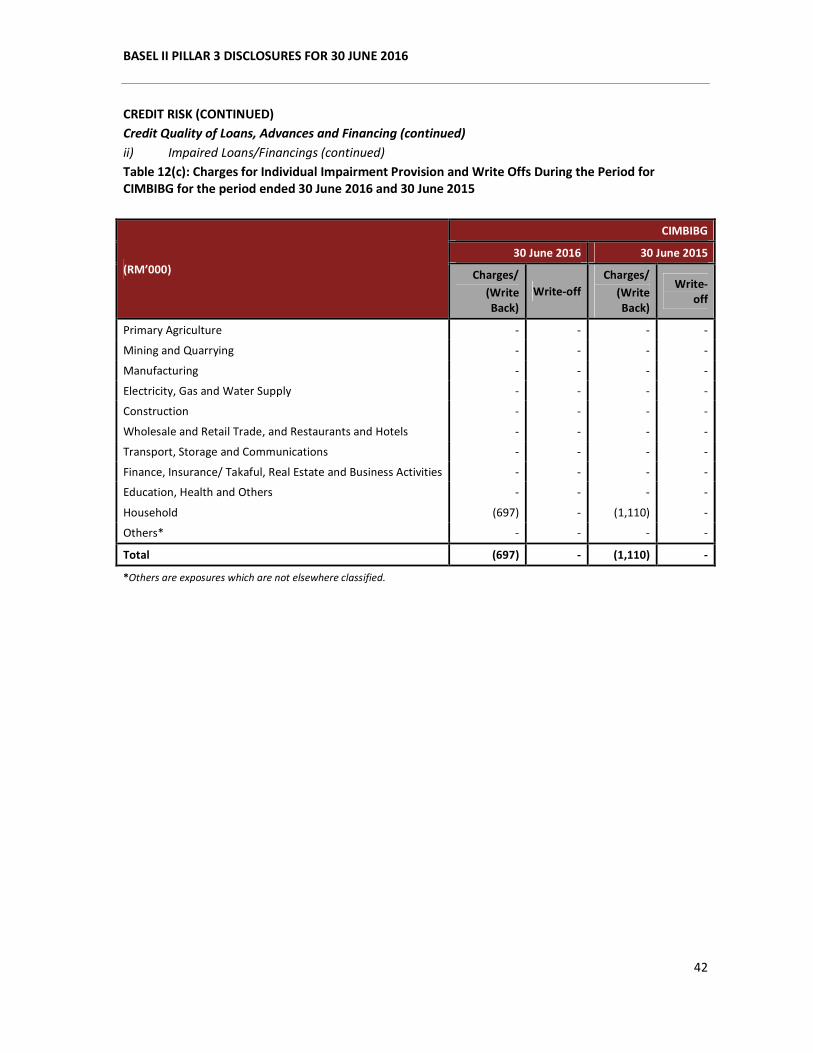
Table 12(c): Charges for Individual Impairment Provision and Write Offs During the Period for
CIMBIBG for the period ended 30 June 2016 and 30 June 2015
(RM’000)
CIMBIBG
30 June 2016 30 June 2015
Charges/
(Write
Back)
Write-off
Charges/
(Write
Back)
Write-
off
Primary Agriculture - - - -
Mining and Quarrying - - - -
Manufacturing - - - -
Electricity, Gas and Water Supply - - - -
Construction - - - -
Wholesale and Retail Trade, and Restaurants and Hotels - - - -
Transport, Storage and Communications - - - -
Finance, Insurance/ Takaful, Real Estate and Business Activities - - - -
Education, Health and Others - - - -
Household (697) - (1,110) -
Others* - - - -
Total (697) - (1,110) -
*Others are exposures which are not elsewhere classified.
BASEL II PILLAR 3 DISCLOSURES FOR 30 JUNE 2016
43
CREDIT RISK (CONTINUED)
Credit Quality of Loans, Advances and Financing (continued)
ii) Impaired Loans/Financings (continued)
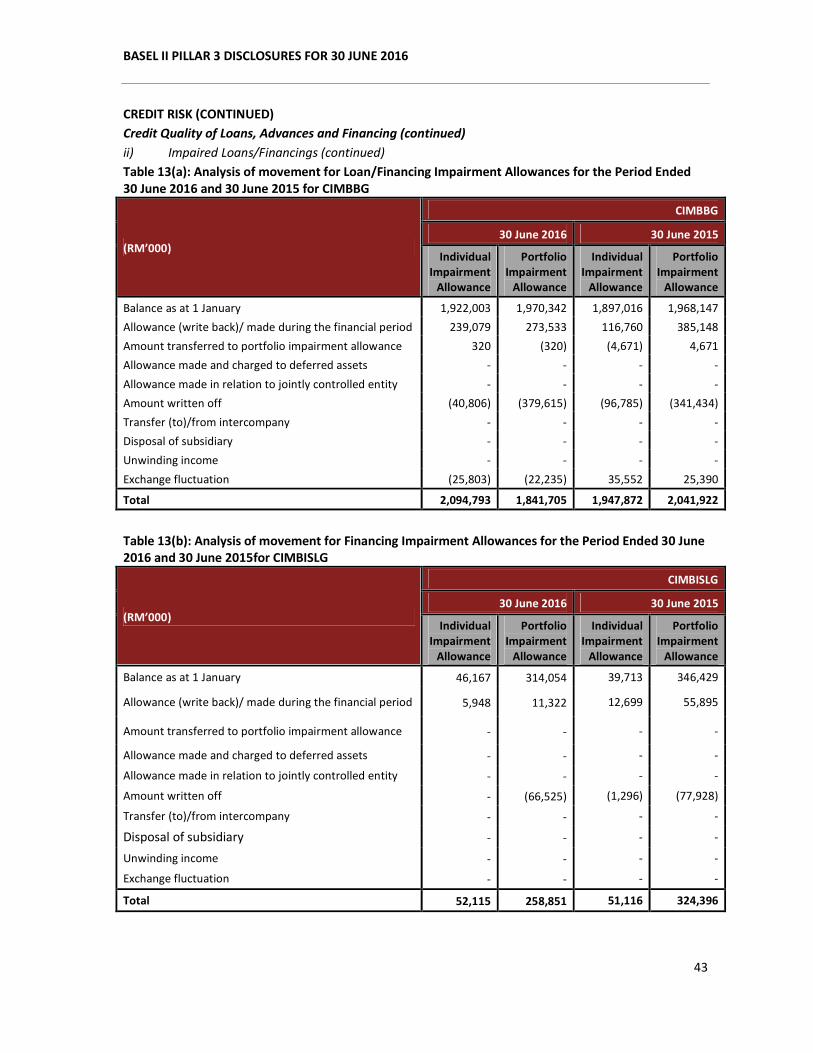
Table 13(a): Analysis of movement for Loan/Financing Impairment Allowances for the Period Ended
30 June 2016 and 30 June 2015 for CIMBBG
(RM’000)
CIMBBG
30 June 2016 30 June 2015
Individual
Impairment
Allowance
Portfolio
Impairment
Allowance
Individual
Impairment
Allowance
Portfolio
Impairment
Allowance
Balance as at 1 January 1,922,003 1,970,342 1,897,016 1,968,147
Allowance (write back)/ made during the financial period 239,079 273,533 116,760 385,148
Amount transferred to portfolio impairment allowance 320 (320) (4,671) 4,671
Allowance made and charged to deferred assets - - - -
Allowance made in relation to jointly controlled entity - - - -
Amount written off (40,806) (379,615) (96,785) (341,434)
Transfer (to)/from intercompany - - - -
Disposal of subsidiary - - - -
Unwinding income - - - -
Exchange fluctuation (25,803) (22,235) 35,552 25,390
Total 2,094,793 1,841,705 1,947,872 2,041,922
Table 13(b): Analysis of movement for Financing Impairment Allowances for the Period Ended 30 June
2016 and 30 June 2015for CIMBISLG
(RM’000)
CIMBISLG
30 June 2016 30 June 2015
Individual
Impairment
Allowance
Portfolio
Impairment
Allowance
Individual
Impairment
Allowance
Portfolio
Impairment
Allowance
Balance as at 1 January 46,167 314,054 39,713 346,429
Allowance (write back)/ made during the financial period 5,948 11,322 12,699 55,895
Amount transferred to portfolio impairment allowance - - - -
Allowance made and charged to deferred assets - - - -
Allowance made in relation to jointly controlled entity - - - -
Amount written off - (66,525) (1,296) (77,928)
Transfer (to)/from intercompany - - - -
Disposal of subsidiary - - - -
Unwinding income - - - -
Exchange fluctuation - - - -
Total 52,115 258,851 51,116 324,396
BASEL II PILLAR 3 DISCLOSURES FOR 30 JUNE 2016
44
CREDIT RISK (CONTINUED)
Credit Quality of Loans, Advances and Financing (continued)
ii) Impaired Loans/Financings (continued)
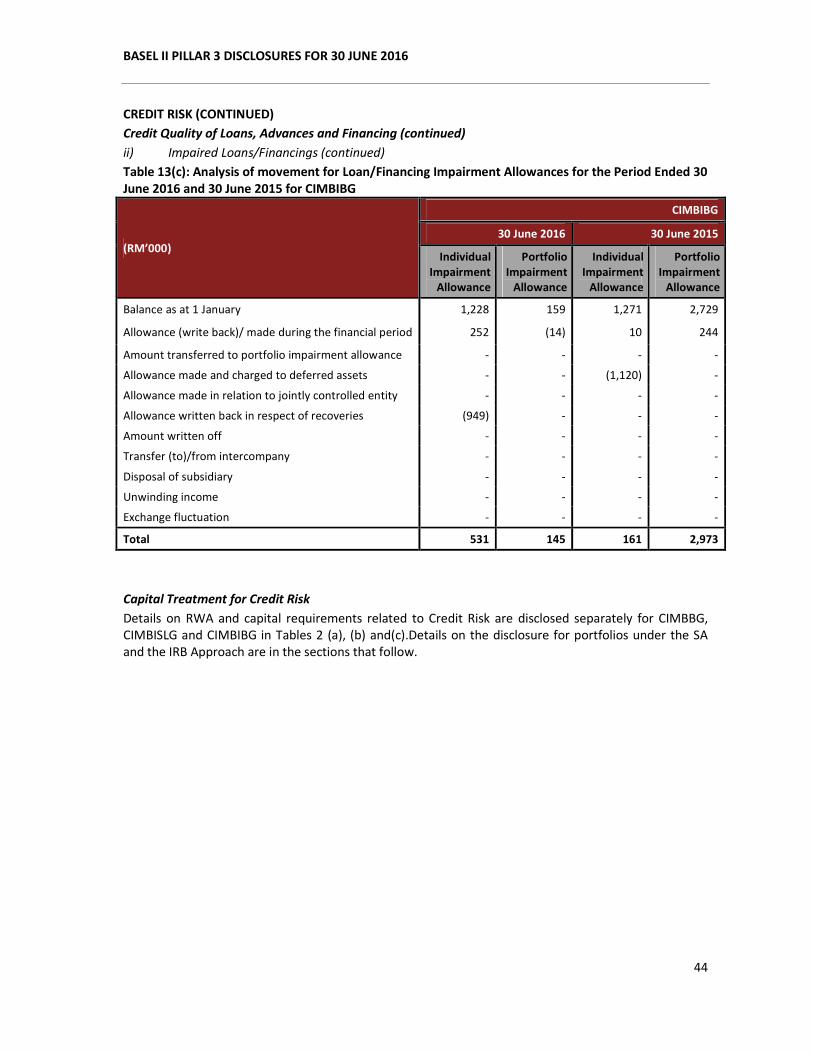
Table 13(c): Analysis of movement for Loan/Financing Impairment Allowances for the Period Ended 30
June 2016 and 30 June 2015 for CIMBIBG
(RM’000)
CIMBIBG
30 June 2016 30 June 2015
Individual
Impairment
Allowance
Portfolio
Impairment
Allowance
Individual
Impairment
Allowance
Portfolio
Impairment
Allowance
Balance as at 1 January 1,228 159 1,271 2,729
Allowance (write back)/ made during the financial period 252 (14) 10 244
Amount transferred to portfolio impairment allowance - - - -
Allowance made and charged to deferred assets - - (1,120) -
Allowance made in relation to jointly controlled entity - - - -
Allowance written back in respect of recoveries (949) - - -
Amount written off - - - -
Transfer (to)/from intercompany - - - -
Disposal of subsidiary - - - -
Unwinding income - - - -
Exchange fluctuation - - - -
Total 531 145 161 2,973
Capital Treatment for Credit Risk
Details on RWA and capital requirements related to Credit Risk are disclosed separately for CIMBBG,
CIMBISLG and CIMBIBG in Tables 2 (a), (b) and(c).Details on the disclosure for portfolios under the SA
and the IRB Approach are in the sections that follow.
BASEL II PILLAR 3 DISCLOSURES FOR 30 JUNE 2016
45
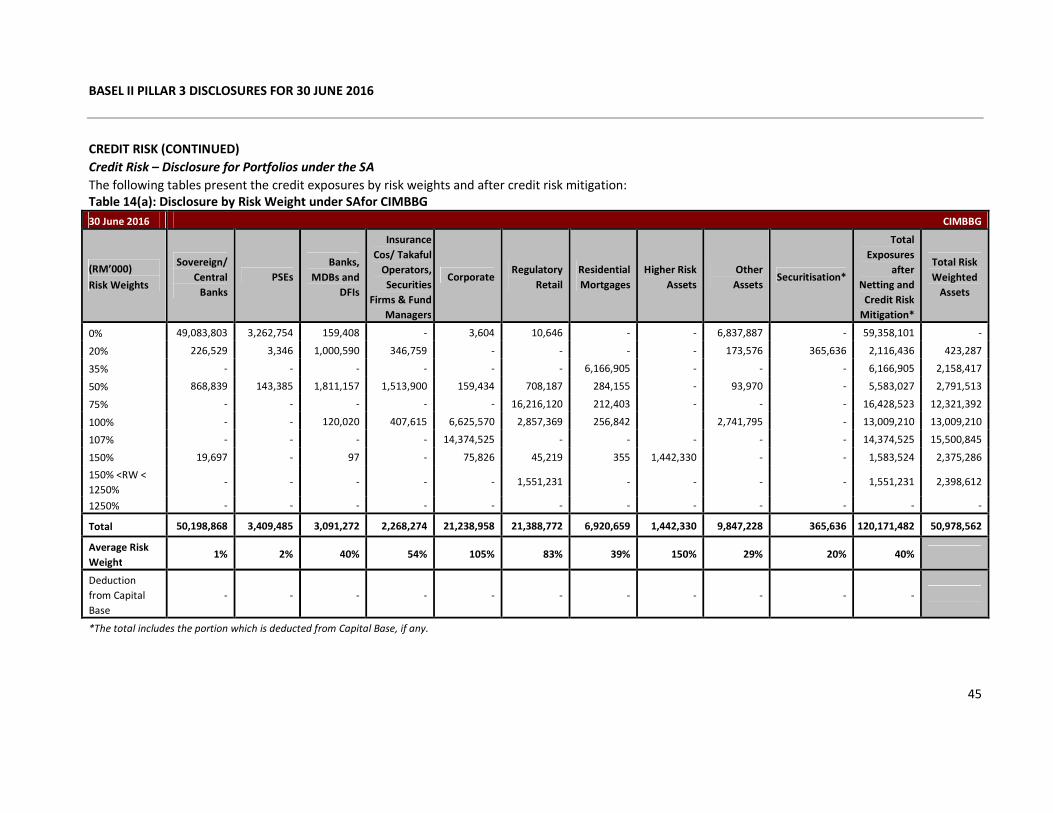
CREDIT RISK (CONTINUED)
Credit Risk – Disclosure for Portfolios under the SA
The following tables present the credit exposures by risk weights and after credit risk mitigation:
Table 14(a): Disclosure by Risk Weight under SAfor CIMBBG
30 June 2016 CIMBBG
(RM’000)
Risk Weights
Sovereign/
Central
Banks
PSEs
Banks,
MDBs and
DFIs
Insurance
Cos/ Takaful
Operators,
Securities
Firms & Fund
Managers
Corporate Regulatory
Retail
Residential
Mortgages
Higher Risk
Assets
Other
Assets Securitisation*
Total
Exposures
after
Netting and
Credit Risk
Mitigation*
Total Risk
Weighted
Assets
0% 49,083,803 3,262,754 159,408 - 3,604 10,646 - - 6,837,887 - 59,358,101 -
20% 226,529 3,346 1,000,590 346,759 - - - - 173,576 365,636 2,116,436 423,287
35% - - - - - - 6,166,905 - - - 6,166,905 2,158,417
50% 868,839 143,385 1,811,157 1,513,900 159,434 708,187 284,155 - 93,970 - 5,583,027 2,791,513
75% - - - - - 16,216,120 212,403 - - - 16,428,523 12,321,392
100% - - 120,020 407,615 6,625,570 2,857,369 256,842 2,741,795 - 13,009,210 13,009,210
107% - - - - 14,374,525 - - - - - 14,374,525 15,500,845
150% 19,697 - 97 - 75,826 45,219 355 1,442,330 - - 1,583,524 2,375,286
150% <RW <
1250% - - - - - 1,551,231 - - - - 1,551,231 2,398,612
1250% - - - - - - - - - - - -
Total 50,198,868 3,409,485 3,091,272 2,268,274 21,238,958 21,388,772 6,920,659 1,442,330 9,847,228 365,636 120,171,482 50,978,562
Average Risk
Weight 1% 2% 40% 54% 105% 83% 39% 150% 29% 20% 40%
Deduction
from Capital
Base
- - - - - - - - - - -
*The total includes the portion which is deducted from Capital Base, if any.
BASEL II PILLAR 3 DISCLOSURES FOR 30 JUNE 2016
46
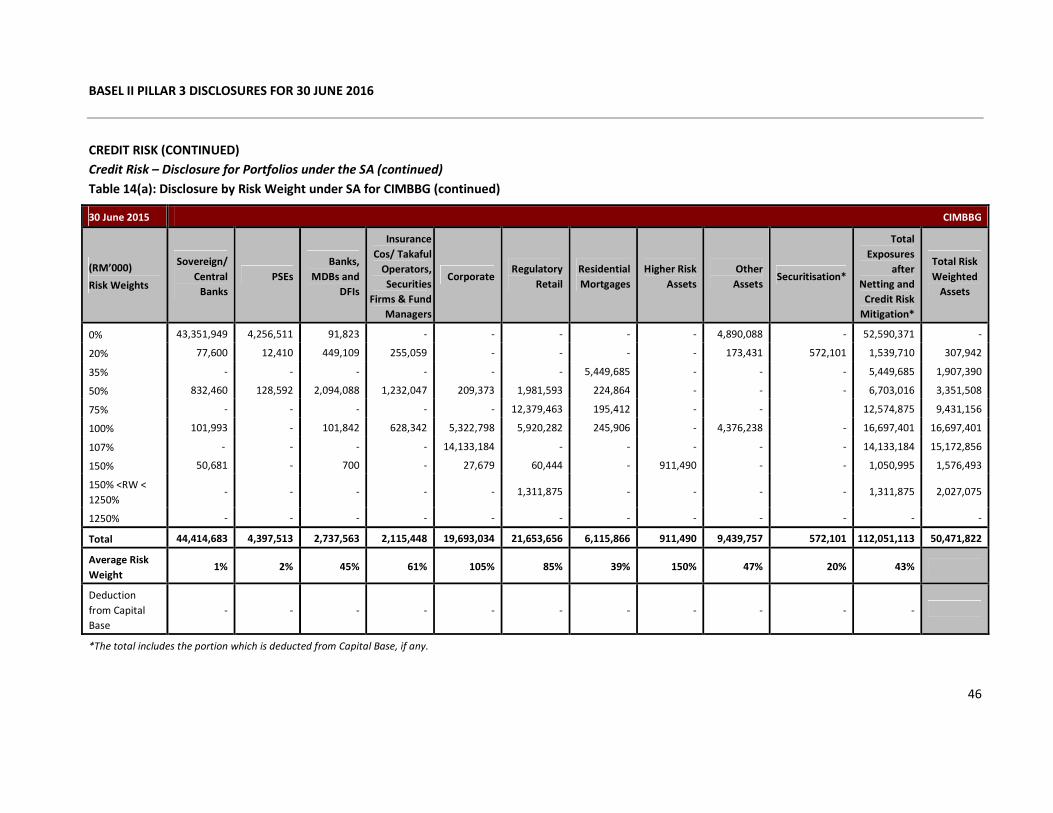
CREDIT RISK (CONTINUED)
Credit Risk – Disclosure for Portfolios under the SA (continued)
Table 14(a): Disclosure by Risk Weight under SA for CIMBBG (continued)
30 June 2015 CIMBBG
(RM’000)
Risk Weights
Sovereign/
Central
Banks
PSEs
Banks,
MDBs and
DFIs
Insurance
Cos/ Takaful
Operators,
Securities
Firms & Fund
Managers
Corporate Regulatory
Retail
Residential
Mortgages
Higher Risk
Assets
Other
Assets Securitisation*
Total
Exposures
after
Netting and
Credit Risk
Mitigation*
Total Risk
Weighted
Assets
0% 43,351,949 4,256,511 91,823 - - - - - 4,890,088 - 52,590,371 -
20% 77,600 12,410 449,109 255,059 - - - - 173,431 572,101 1,539,710 307,942
35% - - - - - - 5,449,685 - - - 5,449,685 1,907,390
50% 832,460 128,592 2,094,088 1,232,047 209,373 1,981,593 224,864 - - - 6,703,016 3,351,508
75% - - - - - 12,379,463 195,412 - - 12,574,875 9,431,156
100% 101,993 - 101,842 628,342 5,322,798 5,920,282 245,906 - 4,376,238 - 16,697,401 16,697,401
107% - - - - 14,133,184 - - - - - 14,133,184 15,172,856
150% 50,681 - 700 - 27,679 60,444 - 911,490 - - 1,050,995 1,576,493
150% <RW <
1250% - - - - - 1,311,875 - - - - 1,311,875 2,027,075
1250% - - - - - - - - - - - -
Total 44,414,683 4,397,513 2,737,563 2,115,448 19,693,034 21,653,656 6,115,866 911,490 9,439,757 572,101 112,051,113 50,471,822
Average Risk
Weight 1% 2% 45% 61% 105% 85% 39% 150% 47% 20% 43%
Deduction
from Capital
Base
- - - - - - - - - - -
*The total includes the portion which is deducted from Capital Base, if any.
BASEL II PILLAR 3 DISCLOSURES FOR 30 JUNE 2016
47
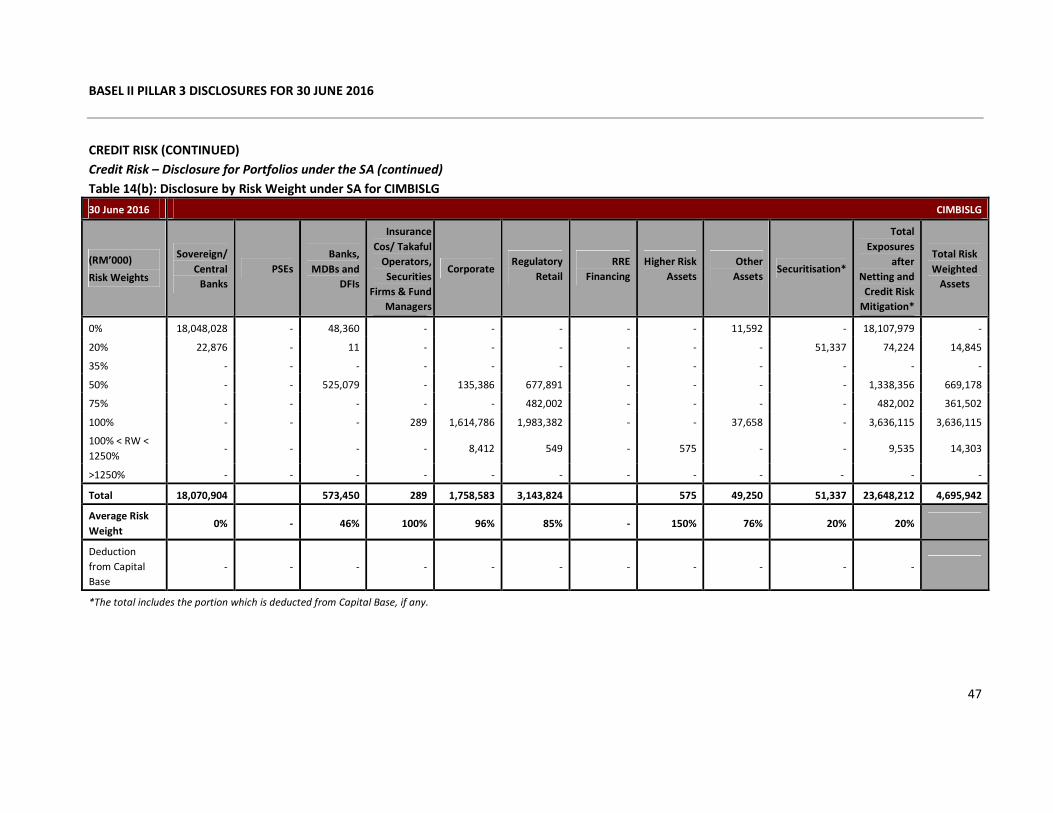
CREDIT RISK (CONTINUED)
Credit Risk – Disclosure for Portfolios under the SA (continued)
Table 14(b): Disclosure by Risk Weight under SA for CIMBISLG
30 June 2016 CIMBISLG
(RM’000)
Risk Weights
Sovereign/
Central
Banks
PSEs
Banks,
MDBs and
DFIs
Insurance
Cos/ Takaful
Operators,
Securities
Firms & Fund
Managers
Corporate Regulatory
Retail
RRE
Financing
Higher Risk
Assets
Other
Assets Securitisation*
Total
Exposures
after
Netting and
Credit Risk
Mitigation*
Total Risk
Weighted
Assets
0% 18,048,028 - 48,360 - - - - - 11,592 - 18,107,979 -
20% 22,876 - 11 - - - - - - 51,337 74,224 14,845
35% - - - - - - - - - - - -
50% - - 525,079 - 135,386 677,891 - - - - 1,338,356 669,178
75% - - - - - 482,002 - - - - 482,002 361,502
100% - - - 289 1,614,786 1,983,382 - - 37,658 - 3,636,115 3,636,115
100% < RW <
1250% - - - - 8,412 549 - 575 - - 9,535 14,303
>1250% - - - - - - - - - - - -
Total 18,070,904 573,450 289 1,758,583 3,143,824 575 49,250 51,337 23,648,212 4,695,942
Average Risk
Weight 0% - 46% 100% 96% 85% - 150% 76% 20% 20%
Deduction
from Capital
Base
- - - - - - - - - - -
*The total includes the portion which is deducted from Capital Base, if any.
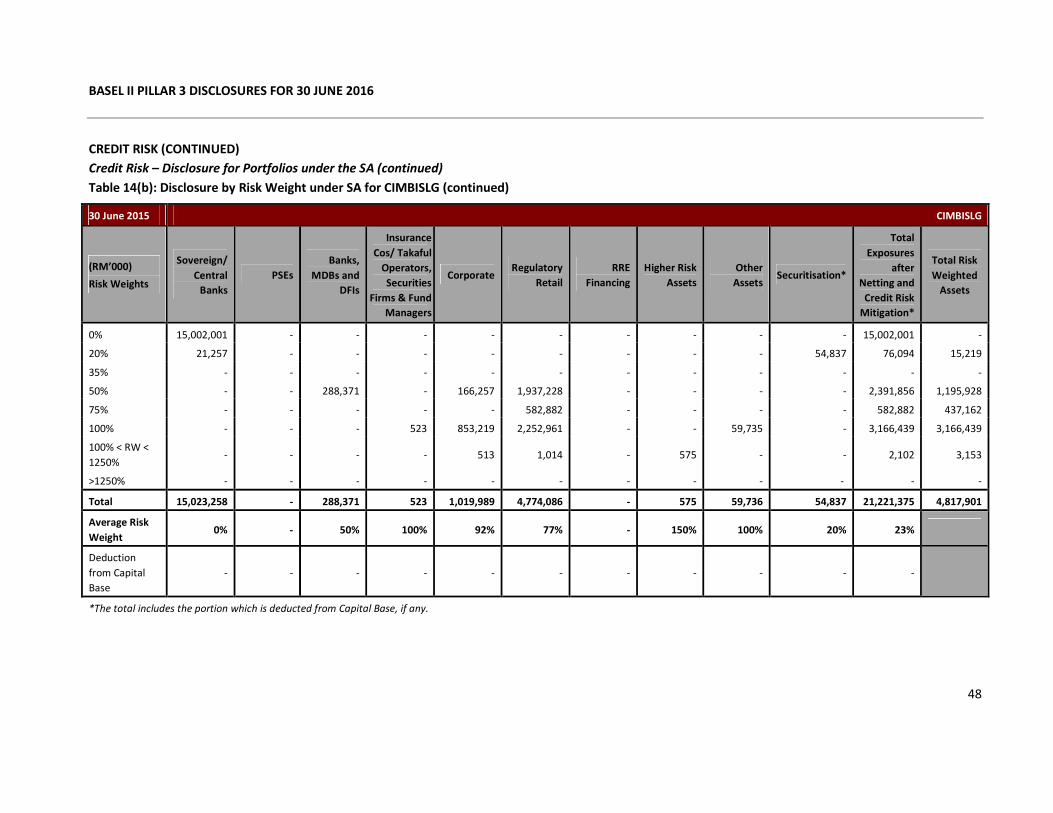
BASEL II PILLAR 3 DISCLOSURES FOR 30 JUNE 2016
48
CREDIT RISK (CONTINUED)
Credit Risk – Disclosure for Portfolios under the SA (continued)
Table 14(b): Disclosure by Risk Weight under SA for CIMBISLG (continued)
30 June 2015 CIMBISLG
(RM’000)
Risk Weights
Sovereign/
Central
Banks
PSEs
Banks,
MDBs and
DFIs
Insurance
Cos/ Takaful
Operators,
Securities
Firms & Fund
Managers
Corporate Regulatory
Retail
RRE
Financing
Higher Risk
Assets
Other
Assets Securitisation*
Total
Exposures
after
Netting and
Credit Risk
Mitigation*
Total Risk
Weighted
Assets
0% 15,002,001 - - - - - - - - - 15,002,001 -
20% 21,257 - - - - - - - - 54,837 76,094 15,219
35% - - - - - - - - - - - -
50% - - 288,371 - 166,257 1,937,228 - - - - 2,391,856 1,195,928
75% - - - - - 582,882 - - - - 582,882 437,162
100% - - - 523 853,219 2,252,961 - - 59,735 - 3,166,439 3,166,439
100% < RW <
1250% - - - - 513 1,014 - 575 - - 2,102 3,153
>1250% - - - - - - - - - - - -
Total 15,023,258 - 288,371 523 1,019,989 4,774,086 - 575 59,736 54,837 21,221,375 4,817,901
Average Risk
Weight 0% - 50% 100% 92% 77% - 150% 100% 20% 23%
Deduction
from Capital
Base
- - - - - - - - - - -
*The total includes the portion which is deducted from Capital Base, if any.
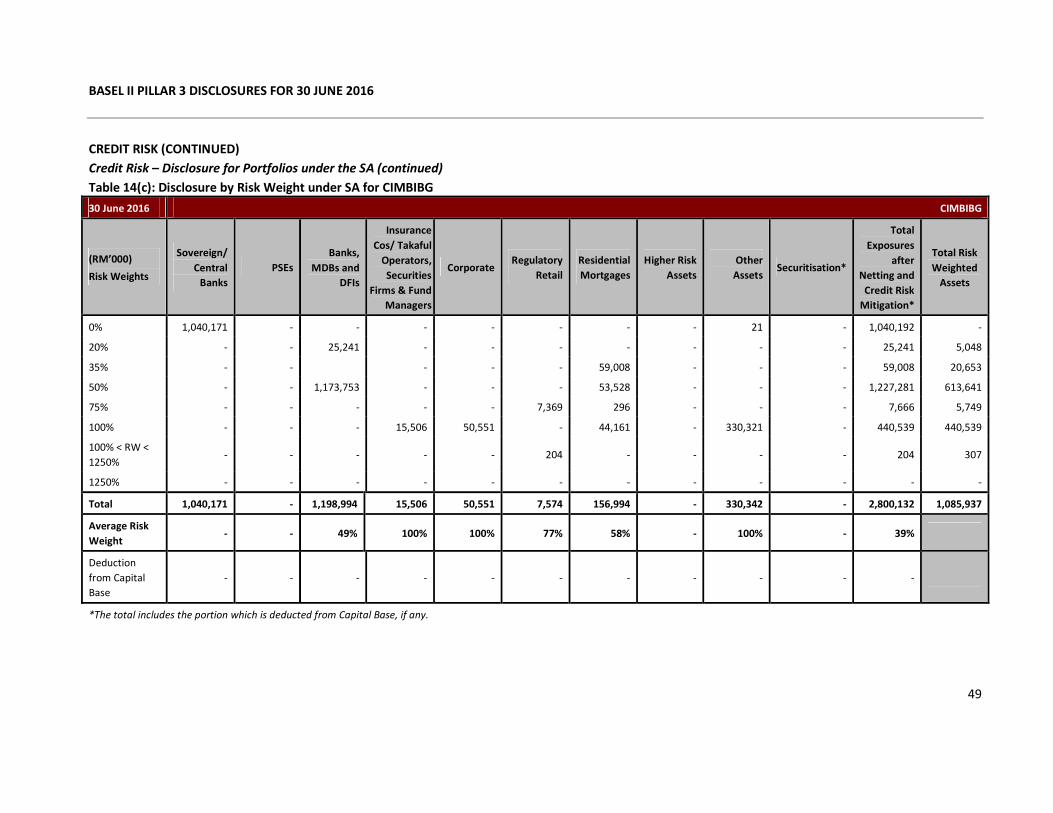
BASEL II PILLAR 3 DISCLOSURES FOR 30 JUNE 2016
49
CREDIT RISK (CONTINUED)
Credit Risk – Disclosure for Portfolios under the SA (continued)
Table 14(c): Disclosure by Risk Weight under SA for CIMBIBG
30 June 2016 CIMBIBG
(RM’000)
Risk Weights
Sovereign/
Central
Banks
PSEs
Banks,
MDBs and
DFIs
Insurance
Cos/ Takaful
Operators,
Securities
Firms & Fund
Managers
Corporate Regulatory
Retail
Residential
Mortgages
Higher Risk
Assets
Other
Assets Securitisation*
Total
Exposures
after
Netting and
Credit Risk
Mitigation*
Total Risk
Weighted
Assets
0% 1,040,171 - - - - - - - 21 - 1,040,192 -
20% - - 25,241 - - - - - - - 25,241 5,048
35% - - - - - 59,008 - - - 59,008 20,653
50% - - 1,173,753 - - - 53,528 - - - 1,227,281 613,641
75% - - - - - 7,369 296 - - - 7,666 5,749
100% - - - 15,506 50,551 - 44,161 - 330,321 - 440,539 440,539
100% < RW <
1250% - - - - - 204 - - - - 204 307
1250% - - - - - - - - - - - -
Total 1,040,171 - 1,198,994 15,506 50,551 7,574 156,994 - 330,342 - 2,800,132 1,085,937
Average Risk
Weight - - 49% 100% 100% 77% 58% - 100% - 39%
Deduction
from Capital
Base
- - - - - - - - - - -
*The total includes the portion which is deducted from Capital Base, if any.
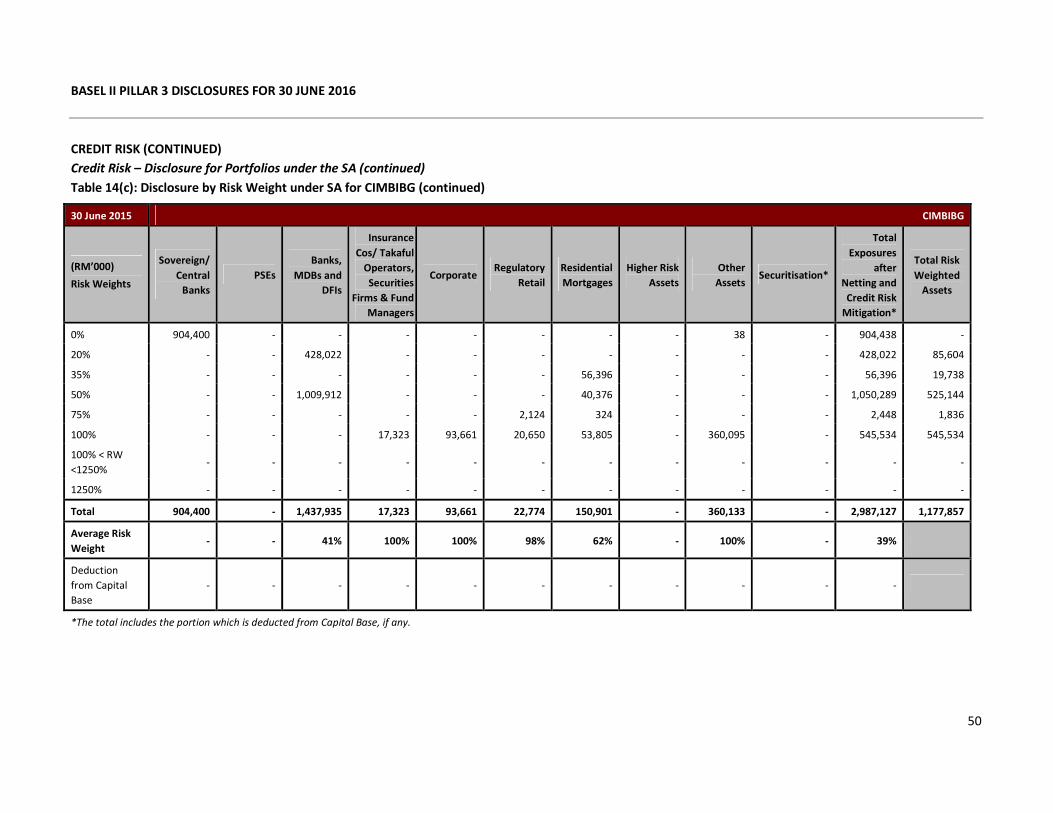
BASEL II PILLAR 3 DISCLOSURES FOR 30 JUNE 2016
50
CREDIT RISK (CONTINUED)
Credit Risk – Disclosure for Portfolios under the SA (continued)
Table 14(c): Disclosure by Risk Weight under SA for CIMBIBG (continued)
30 June 2015 CIMBIBG
(RM’000)
Risk Weights
Sovereign/
Central
Banks
PSEs
Banks,
MDBs and
DFIs
Insurance
Cos/ Takaful
Operators,
Securities
Firms & Fund
Managers
Corporate Regulatory
Retail
Residential
Mortgages
Higher Risk
Assets
Other
Assets Securitisation*
Total
Exposures
after
Netting and
Credit Risk
Mitigation*
Total Risk
Weighted
Assets
0% 904,400 - - - - - - - 38 - 904,438 -
20% - - 428,022 - - - - - - - 428,022 85,604
35% - - - - - - 56,396 - - - 56,396 19,738
50% - - 1,009,912 - - - 40,376 - - - 1,050,289 525,144
75% - - - - - 2,124 324 - - - 2,448 1,836
100% - - - 17,323 93,661 20,650 53,805 - 360,095 - 545,534 545,534
100% < RW
<1250% - - - - - - - - - - - -
1250% - - - - - - - - - - - -
Total 904,400 - 1,437,935 17,323 93,661 22,774 150,901 - 360,133 - 2,987,127 1,177,857
Average Risk
Weight - - 41% 100% 100% 98% 62% - 100% - 39%
Deduction
from Capital
Base
- - - - - - - - - - -
*The total includes the portion which is deducted from Capital Base, if any.
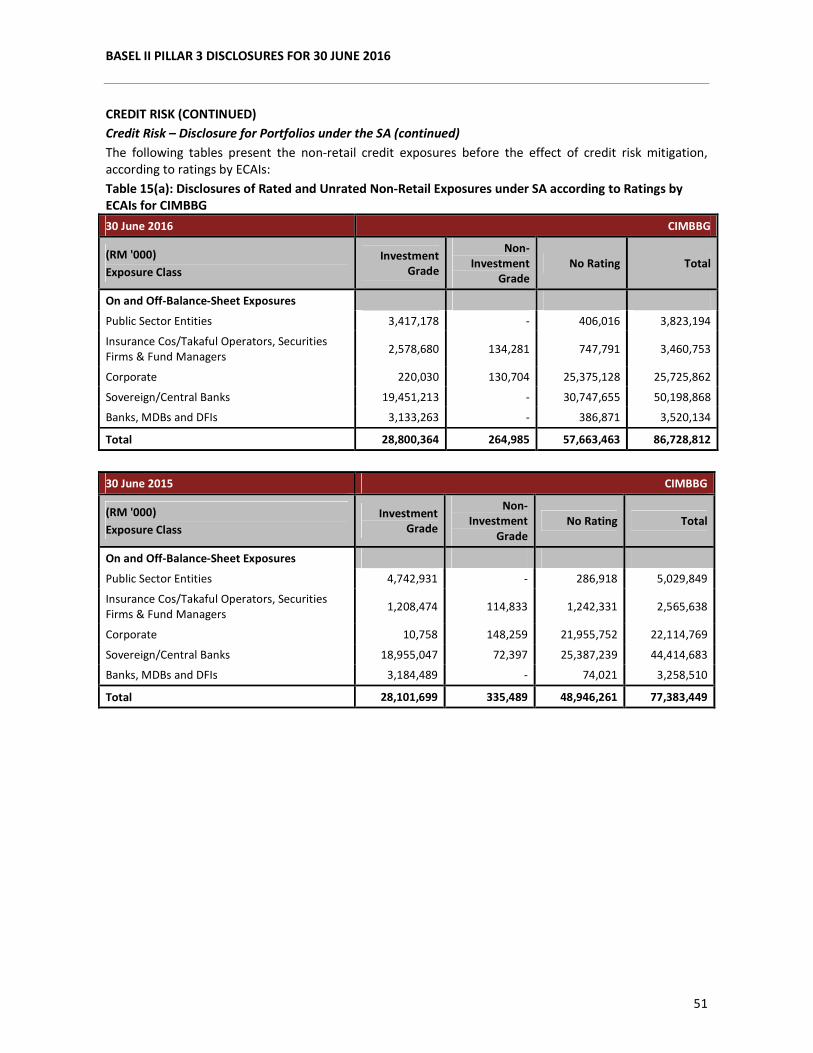
BASEL II PILLAR 3 DISCLOSURES FOR 30 JUNE 2016
51
CREDIT RISK (CONTINUED)
Credit Risk – Disclosure for Portfolios under the SA (continued)
The following tables present the non-retail credit exposures before the effect of credit risk mitigation,
according to ratings by ECAIs:
Table 15(a): Disclosures of Rated and Unrated Non-Retail Exposures under SA according to Ratings by
ECAIs for CIMBBG
30 June 2016 CIMBBG
(RM '000)
Exposure Class
Investment
Grade
Non-
Investment
Grade
No Rating Total
On and Off-Balance-Sheet Exposures
Public Sector Entities 3,417,178 - 406,016 3,823,194
Insurance Cos/Takaful Operators, Securities
Firms & Fund Managers 2,578,680 134,281 747,791 3,460,753
Corporate 220,030 130,704 25,375,128 25,725,862
Sovereign/Central Banks 19,451,213 - 30,747,655 50,198,868
Banks, MDBs and DFIs 3,133,263 - 386,871 3,520,134
Total 28,800,364 264,985 57,663,463 86,728,812
30 June 2015 CIMBBG
(RM '000)
Exposure Class
Investment
Grade
Non-
Investment
Grade
No Rating Total
On and Off-Balance-Sheet Exposures
Public Sector Entities 4,742,931 - 286,918 5,029,849
Insurance Cos/Takaful Operators, Securities
Firms & Fund Managers 1,208,474 114,833 1,242,331 2,565,638
Corporate 10,758 148,259 21,955,752 22,114,769
Sovereign/Central Banks 18,955,047 72,397 25,387,239 44,414,683
Banks, MDBs and DFIs 3,184,489 - 74,021 3,258,510
Total 28,101,699 335,489 48,946,261 77,383,449
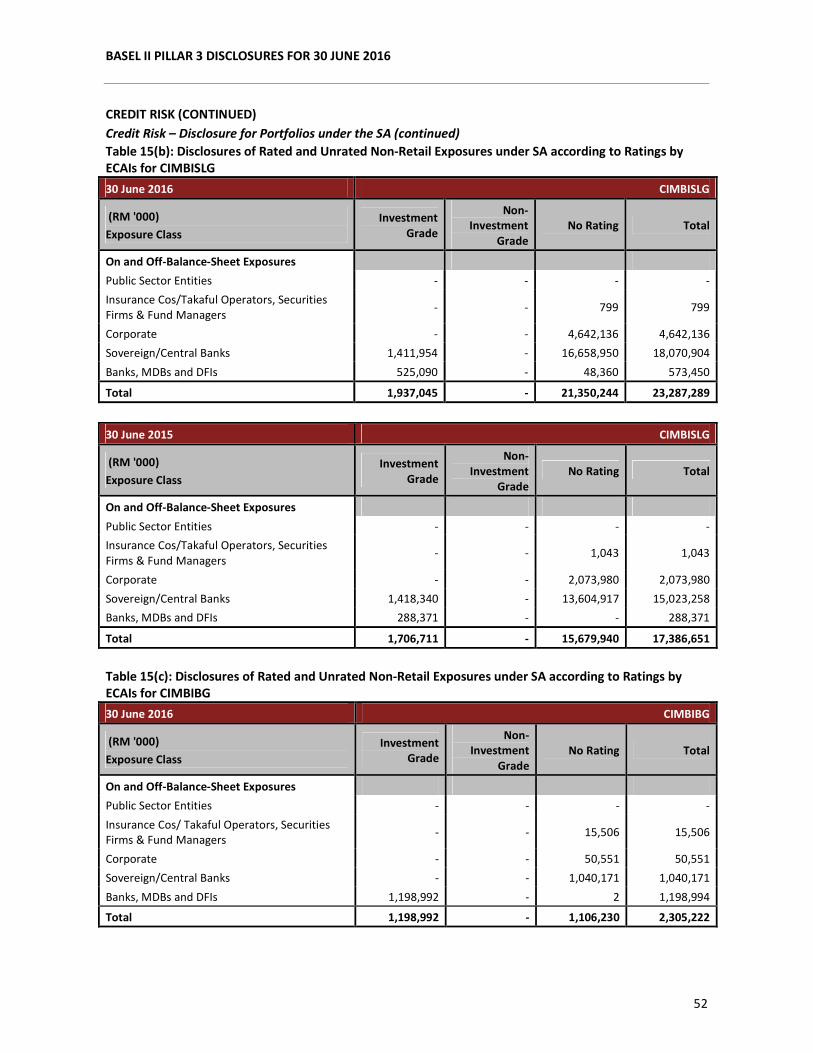
BASEL II PILLAR 3 DISCLOSURES FOR 30 JUNE 2016
52
CREDIT RISK (CONTINUED)
Credit Risk – Disclosure for Portfolios under the SA (continued)
Table 15(b): Disclosures of Rated and Unrated Non-Retail Exposures under SA according to Ratings by
ECAIs for CIMBISLG
30 June 2016 CIMBISLG
(RM '000)
Exposure Class
Investment
Grade
Non-
Investment
Grade
No Rating Total
On and Off-Balance-Sheet Exposures
Public Sector Entities - - - -
Insurance Cos/Takaful Operators, Securities
Firms & Fund Managers - - 799 799
Corporate - - 4,642,136 4,642,136
Sovereign/Central Banks 1,411,954 - 16,658,950 18,070,904
Banks, MDBs and DFIs 525,090 - 48,360 573,450
Total 1,937,045 - 21,350,244 23,287,289
30 June 2015 CIMBISLG
(RM '000)
Exposure Class
Investment
Grade
Non-
Investment
Grade
No Rating Total
On and Off-Balance-Sheet Exposures
Public Sector Entities - - - -
Insurance Cos/Takaful Operators, Securities
Firms & Fund Managers - - 1,043 1,043
Corporate - - 2,073,980 2,073,980
Sovereign/Central Banks 1,418,340 - 13,604,917 15,023,258
Banks, MDBs and DFIs 288,371 - - 288,371
Total 1,706,711 - 15,679,940 17,386,651
Table 15(c): Disclosures of Rated and Unrated Non-Retail Exposures under SA according to Ratings by
ECAIs for CIMBIBG
30 June 2016 CIMBIBG
(RM '000)
Exposure Class
Investment
Grade
Non-
Investment
Grade
No Rating Total
On and Off-Balance-Sheet Exposures
Public Sector Entities - - - -
Insurance Cos/ Takaful Operators, Securities
Firms & Fund Managers - - 15,506 15,506
Corporate - - 50,551 50,551
Sovereign/Central Banks - - 1,040,171 1,040,171
Banks, MDBs and DFIs 1,198,992 - 2 1,198,994
Total 1,198,992 - 1,106,230 2,305,222
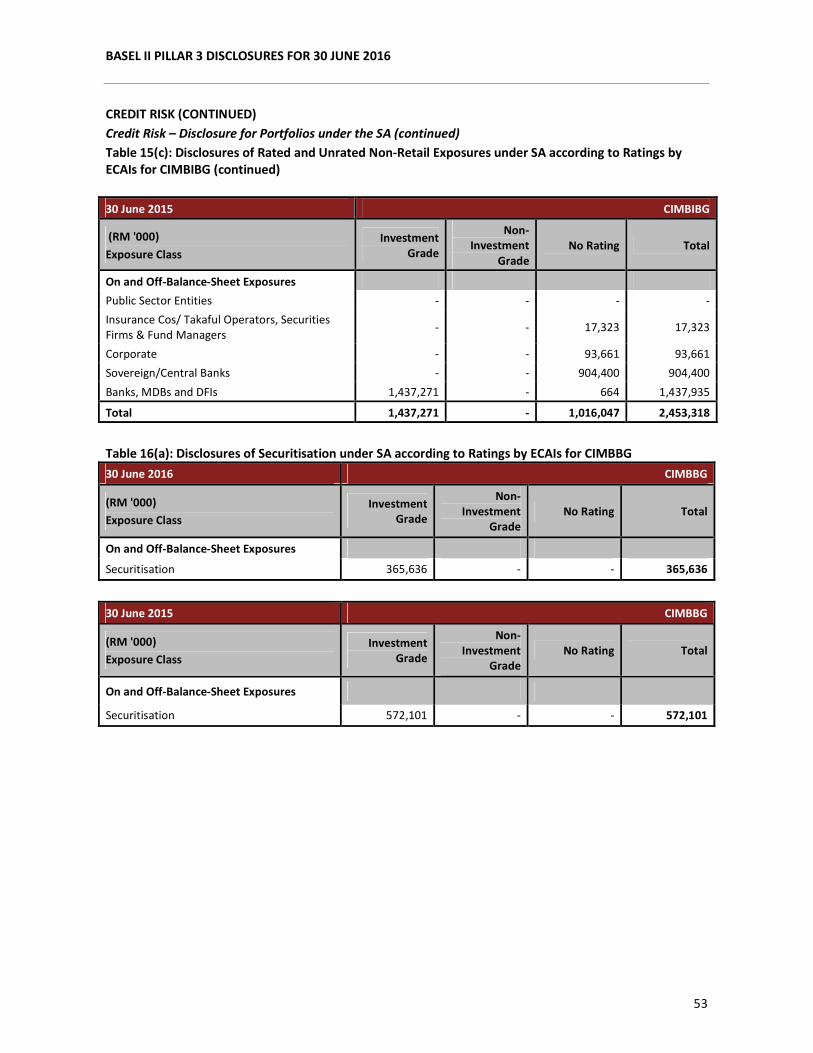
BASEL II PILLAR 3 DISCLOSURES FOR 30 JUNE 2016
53
CREDIT RISK (CONTINUED)
Credit Risk – Disclosure for Portfolios under the SA (continued)
Table 15(c): Disclosures of Rated and Unrated Non-Retail Exposures under SA according to Ratings by
ECAIs for CIMBIBG (continued)
30 June 2015 CIMBIBG
(RM '000)
Exposure Class
Investment
Grade
Non-
Investment
Grade
No Rating Total
On and Off-Balance-Sheet Exposures
Public Sector Entities - - - -
Insurance Cos/ Takaful Operators, Securities
Firms & Fund Managers - - 17,323 17,323
Corporate - - 93,661 93,661
Sovereign/Central Banks - - 904,400 904,400
Banks, MDBs and DFIs 1,437,271 - 664 1,437,935
Total 1,437,271 - 1,016,047 2,453,318
Table 16(a): Disclosures of Securitisation under SA according to Ratings by ECAIs for CIMBBG
30 June 2016 CIMBBG
(RM '000)
Exposure Class
Investment
Grade
Non-
Investment
Grade
No Rating Total
On and Off-Balance-Sheet Exposures
Securitisation 365,636 - - 365,636
30 June 2015 CIMBBG
(RM '000)
Exposure Class
Investment
Grade
Non-
Investment
Grade
No Rating Total
On and Off-Balance-Sheet Exposures
Securitisation 572,101 - - 572,101
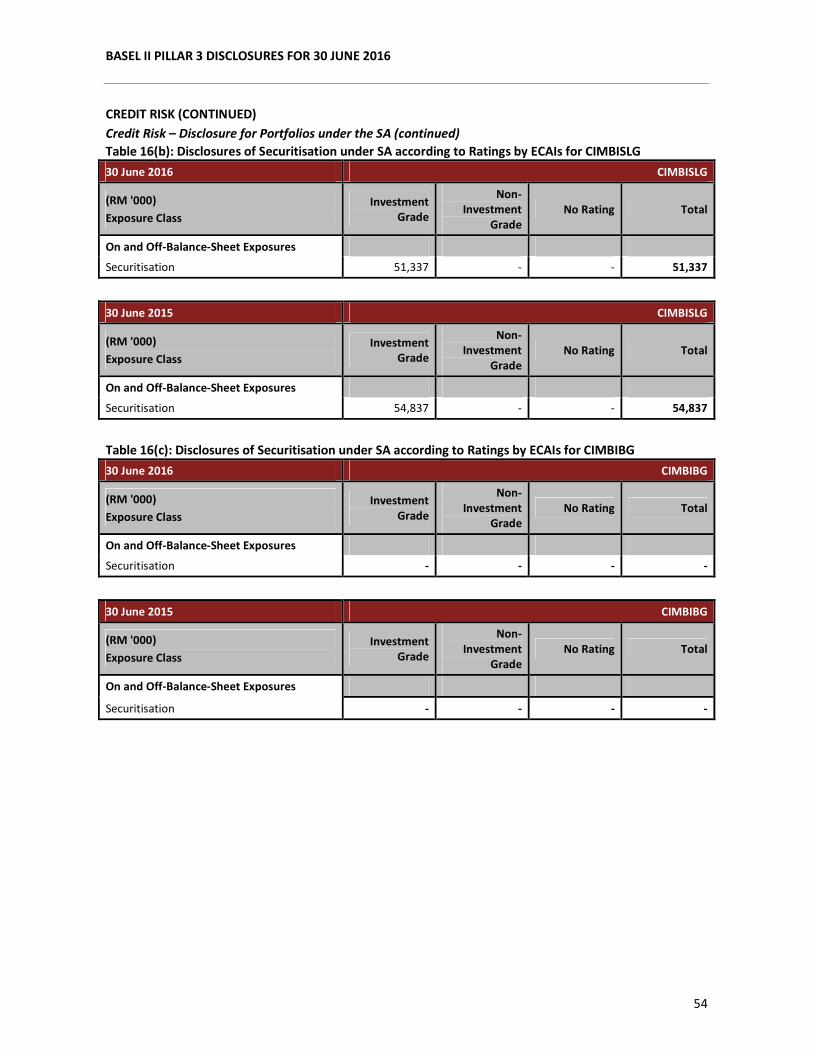
BASEL II PILLAR 3 DISCLOSURES FOR 30 JUNE 2016
54
CREDIT RISK (CONTINUED)
Credit Risk – Disclosure for Portfolios under the SA (continued)
Table 16(b): Disclosures of Securitisation under SA according to Ratings by ECAIs for CIMBISLG
30 June 2016 CIMBISLG
(RM '000)
Exposure Class
Investment
Grade
Non-
Investment
Grade
No Rating Total
On and Off-Balance-Sheet Exposures
Securitisation 51,337 - - 51,337
30 June 2015 CIMBISLG
(RM '000)
Exposure Class
Investment
Grade
Non-
Investment
Grade
No Rating Total
On and Off-Balance-Sheet Exposures
Securitisation 54,837 - - 54,837
Table 16(c): Disclosures of Securitisation under SA according to Ratings by ECAIs for CIMBIBG
30 June 2016 CIMBIBG
(RM '000)
Exposure Class
Investment
Grade
Non-
Investment
Grade
No Rating Total
On and Off-Balance-Sheet Exposures
Securitisation - - - -
30 June 2015 CIMBIBG
(RM '000)
Exposure Class
Investment
Grade
Non-
Investment
Grade
No Rating Total
On and Off-Balance-Sheet Exposures
Securitisation - - - -
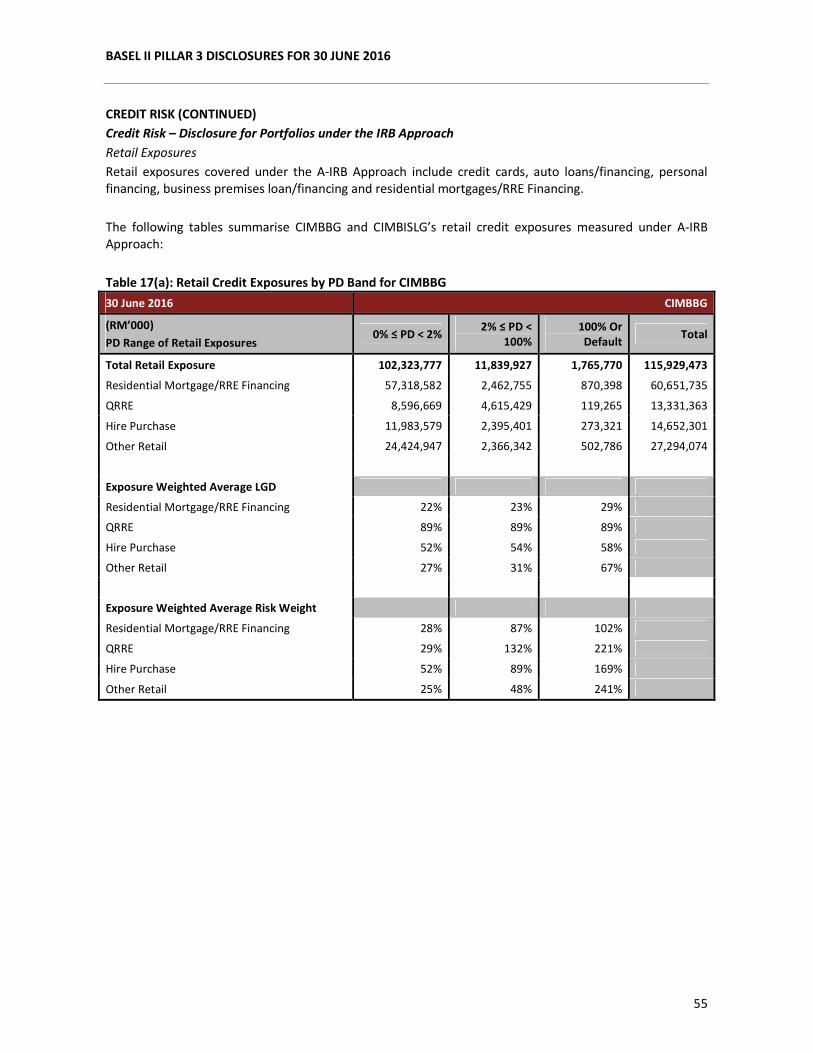
BASEL II PILLAR 3 DISCLOSURES FOR 30 JUNE 2016
55
CREDIT RISK (CONTINUED)
Credit Risk – Disclosure for Portfolios under the IRB Approach
Retail Exposures
Retail exposures covered under the A-IRB Approach include credit cards, auto loans/financing, personal
financing, business premises loan/financing and residential mortgages/RRE Financing.
The following tables summarise CIMBBG and CIMBISLG’s retail credit exposures measured under A-IRB
Approach:
Table 17(a): Retail Credit Exposures by PD Band for CIMBBG
30 June 2016 CIMBBG
(RM’000)
PD Range of Retail Exposures 0% ≤ PD < 2%
2% ≤ PD <
100%
100% Or
Default Total
Total Retail Exposure 102,323,777 11,839,927 1,765,770 115,929,473
Residential Mortgage/RRE Financing 57,318,582 2,462,755 870,398 60,651,735
QRRE 8,596,669 4,615,429 119,265 13,331,363
Hire Purchase 11,983,579 2,395,401 273,321 14,652,301
Other Retail 24,424,947 2,366,342 502,786 27,294,074
Exposure Weighted Average LGD
Residential Mortgage/RRE Financing 22% 23% 29%
QRRE 89% 89% 89%
Hire Purchase 52% 54% 58%
Other Retail 27% 31% 67%
Exposure Weighted Average Risk Weight
Residential Mortgage/RRE Financing 28% 87% 102%
QRRE 29% 132% 221%
Hire Purchase 52% 89% 169%
Other Retail 25% 48% 241%
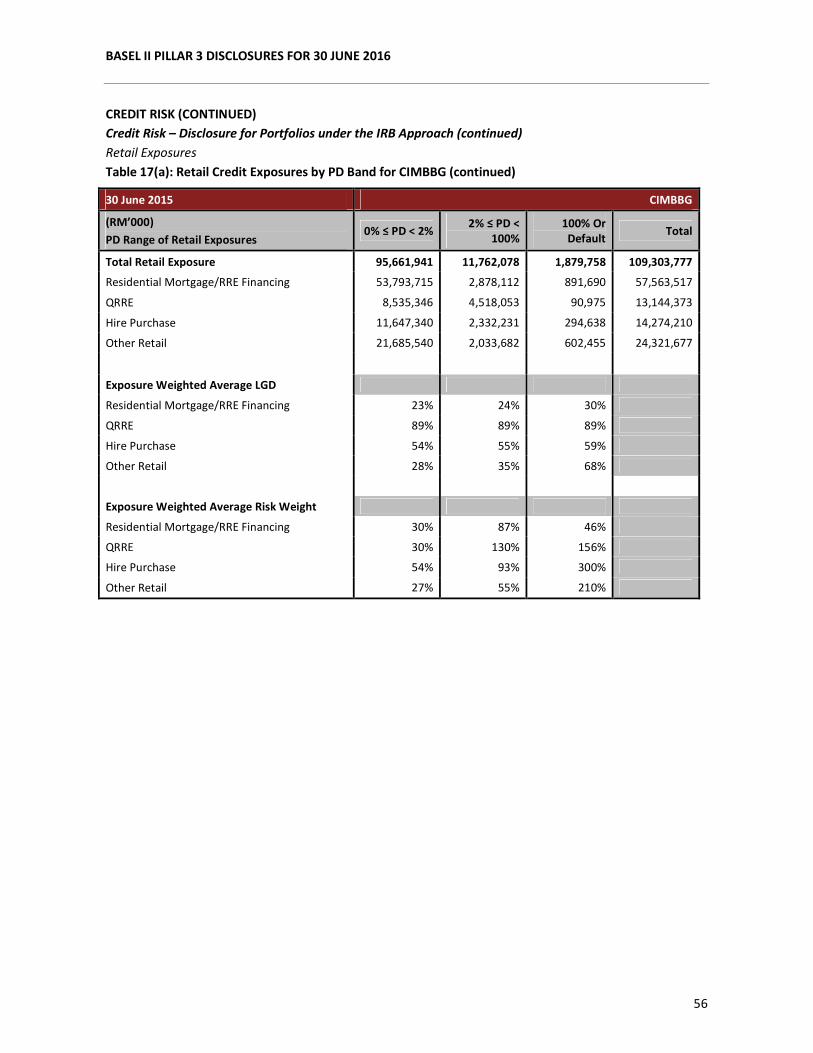
BASEL II PILLAR 3 DISCLOSURES FOR 30 JUNE 2016
56
CREDIT RISK (CONTINUED)
Credit Risk – Disclosure for Portfolios under the IRB Approach (continued)
Retail Exposures
Table 17(a): Retail Credit Exposures by PD Band for CIMBBG (continued)
30 June 2015 CIMBBG
(RM’000)
PD Range of Retail Exposures 0% ≤ PD < 2%
2% ≤ PD <
100%
100% Or
Default Total
Total Retail Exposure 95,661,941 11,762,078 1,879,758 109,303,777
Residential Mortgage/RRE Financing 53,793,715 2,878,112 891,690 57,563,517
QRRE 8,535,346 4,518,053 90,975 13,144,373
Hire Purchase 11,647,340 2,332,231 294,638 14,274,210
Other Retail 21,685,540 2,033,682 602,455 24,321,677
Exposure Weighted Average LGD
Residential Mortgage/RRE Financing 23% 24% 30%
QRRE 89% 89% 89%
Hire Purchase 54% 55% 59%
Other Retail 28% 35% 68%
Exposure Weighted Average Risk Weight
Residential Mortgage/RRE Financing 30% 87% 46%
QRRE 30% 130% 156%
Hire Purchase 54% 93% 300%
Other Retail 27% 55% 210%
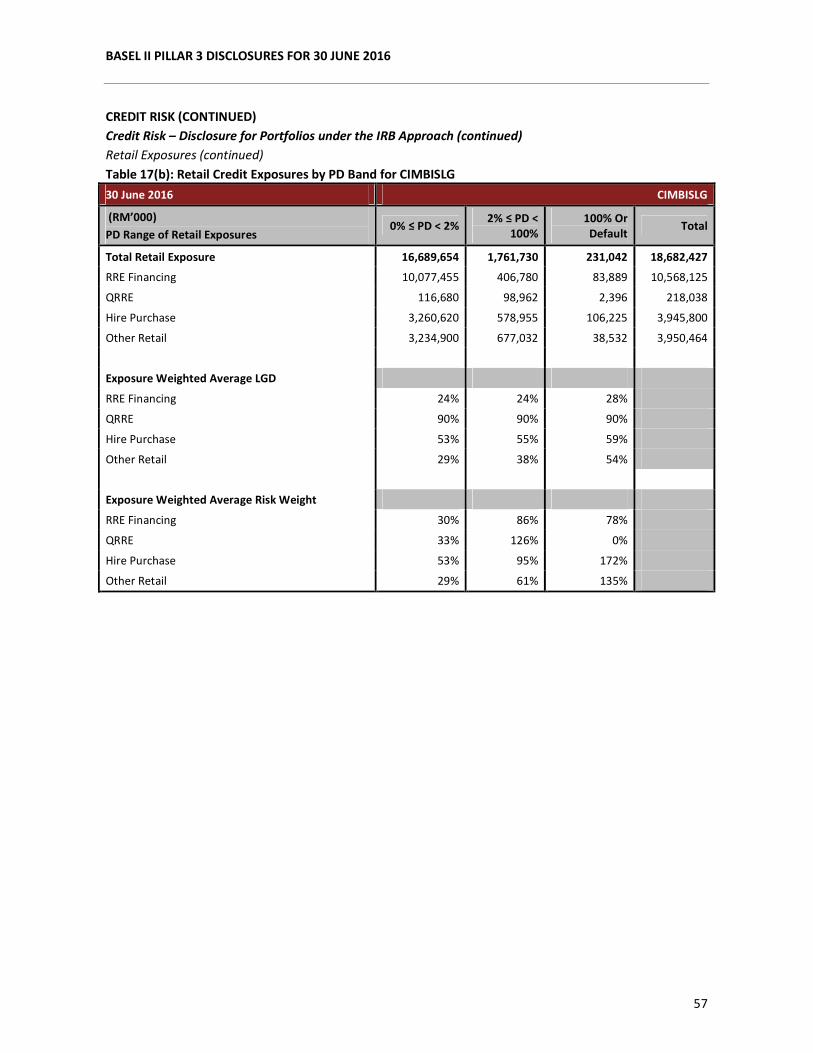
BASEL II PILLAR 3 DISCLOSURES FOR 30 JUNE 2016
57
CREDIT RISK (CONTINUED)
Credit Risk – Disclosure for Portfolios under the IRB Approach (continued)
Retail Exposures (continued)
Table 17(b): Retail Credit Exposures by PD Band for CIMBISLG
30 June 2016 CIMBISLG
(RM’000)
PD Range of Retail Exposures 0% ≤ PD < 2%
2% ≤ PD <
100%
100% Or
Default Total
Total Retail Exposure 16,689,654 1,761,730 231,042 18,682,427
RRE Financing 10,077,455 406,780 83,889 10,568,125
QRRE 116,680 98,962 2,396 218,038
Hire Purchase 3,260,620 578,955 106,225 3,945,800
Other Retail 3,234,900 677,032 38,532 3,950,464
Exposure Weighted Average LGD
RRE Financing 24% 24% 28%
QRRE 90% 90% 90%
Hire Purchase 53% 55% 59%
Other Retail 29% 38% 54%
Exposure Weighted Average Risk Weight
RRE Financing 30% 86% 78%
QRRE 33% 126% 0%
Hire Purchase 53% 95% 172%
Other Retail 29% 61% 135%
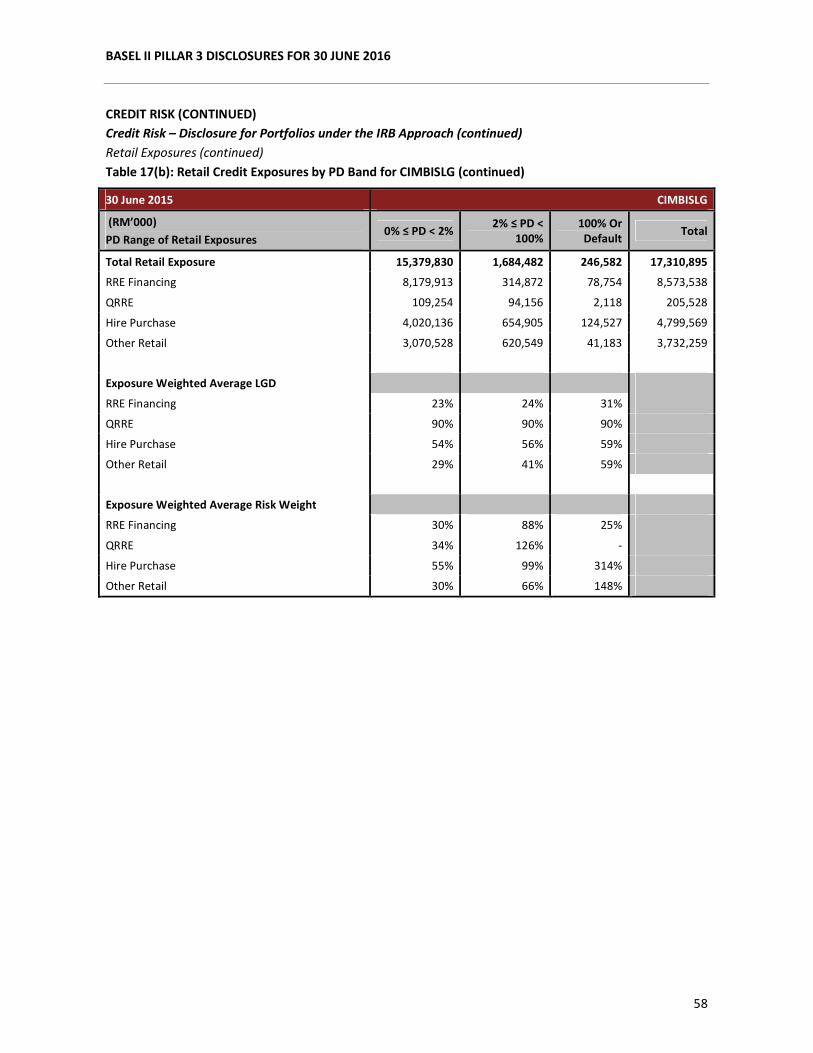
BASEL II PILLAR 3 DISCLOSURES FOR 30 JUNE 2016
58
CREDIT RISK (CONTINUED)
Credit Risk – Disclosure for Portfolios under the IRB Approach (continued)
Retail Exposures (continued)
Table 17(b): Retail Credit Exposures by PD Band for CIMBISLG (continued)
30 June 2015 CIMBISLG
(RM’000)
PD Range of Retail Exposures 0% ≤ PD < 2%
2% ≤ PD <
100%
100% Or
Default Total
Total Retail Exposure 15,379,830 1,684,482 246,582 17,310,895
RRE Financing 8,179,913 314,872 78,754 8,573,538
QRRE 109,254 94,156 2,118 205,528
Hire Purchase 4,020,136 654,905 124,527 4,799,569
Other Retail 3,070,528 620,549 41,183 3,732,259
Exposure Weighted Average LGD
RRE Financing 23% 24% 31%
QRRE 90% 90% 90%
Hire Purchase 54% 56% 59%
Other Retail 29% 41% 59%
Exposure Weighted Average Risk Weight
RRE Financing 30% 88% 25%
QRRE 34% 126% -
Hire Purchase 55% 99% 314%
Other Retail 30% 66% 148%
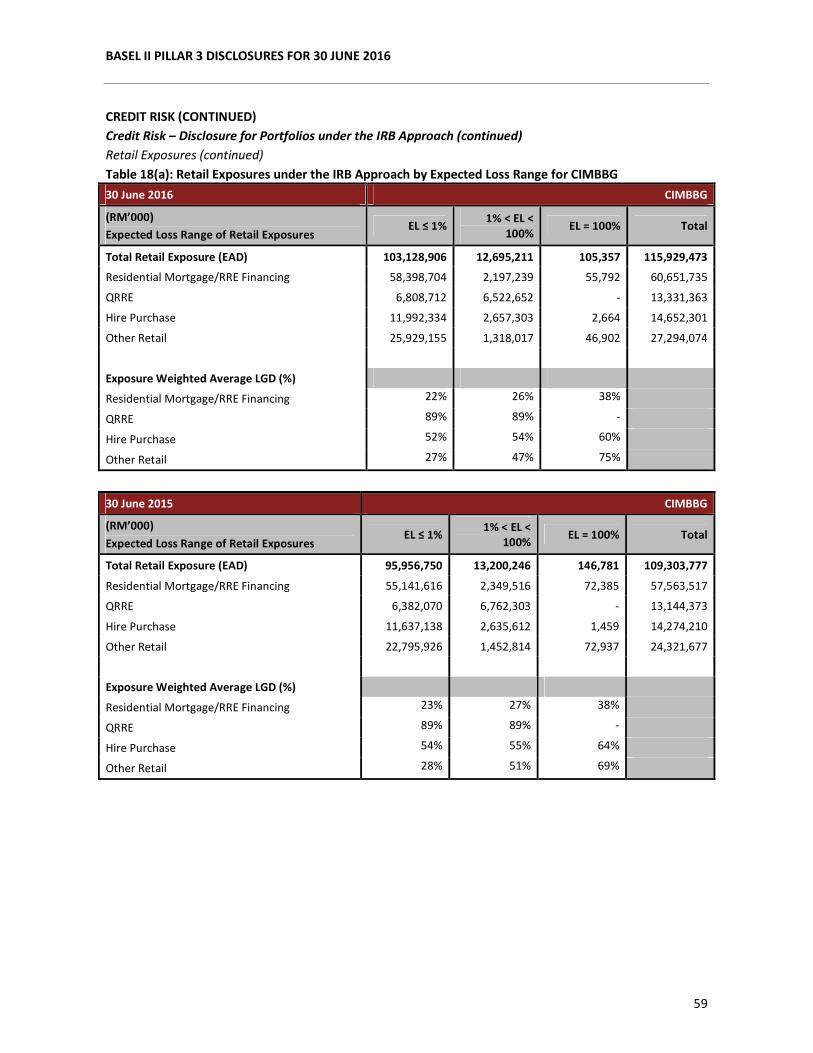
BASEL II PILLAR 3 DISCLOSURES FOR 30 JUNE 2016
59
CREDIT RISK (CONTINUED)
Credit Risk – Disclosure for Portfolios under the IRB Approach (continued)
Retail Exposures (continued)
Table 18(a): Retail Exposures under the IRB Approach by Expected Loss Range for CIMBBG
30 June 2016 CIMBBG
(RM’000)
Expected Loss Range of Retail Exposures EL ≤ 1%
1% < EL <
100% EL = 100% Total
Total Retail Exposure (EAD) 103,128,906 12,695,211 105,357 115,929,473
Residential Mortgage/RRE Financing 58,398,704 2,197,239 55,792 60,651,735
QRRE 6,808,712 6,522,652 - 13,331,363
Hire Purchase 11,992,334 2,657,303 2,664 14,652,301
Other Retail 25,929,155 1,318,017 46,902 27,294,074
Exposure Weighted Average LGD (%)
Residential Mortgage/RRE Financing 22% 26% 38%
QRRE 89% 89% -
Hire Purchase 52% 54% 60%
Other Retail 27% 47% 75%
30 June 2015 CIMBBG
(RM’000)
Expected Loss Range of Retail Exposures EL ≤ 1%
1% < EL <
100% EL = 100% Total
Total Retail Exposure (EAD) 95,956,750 13,200,246 146,781 109,303,777
Residential Mortgage/RRE Financing 55,141,616 2,349,516 72,385 57,563,517
QRRE 6,382,070 6,762,303 - 13,144,373
Hire Purchase 11,637,138 2,635,612 1,459 14,274,210
Other Retail 22,795,926 1,452,814 72,937 24,321,677
Exposure Weighted Average LGD (%)
Residential Mortgage/RRE Financing 23% 27% 38%
QRRE 89% 89% -
Hire Purchase 54% 55% 64%
Other Retail 28% 51% 69%
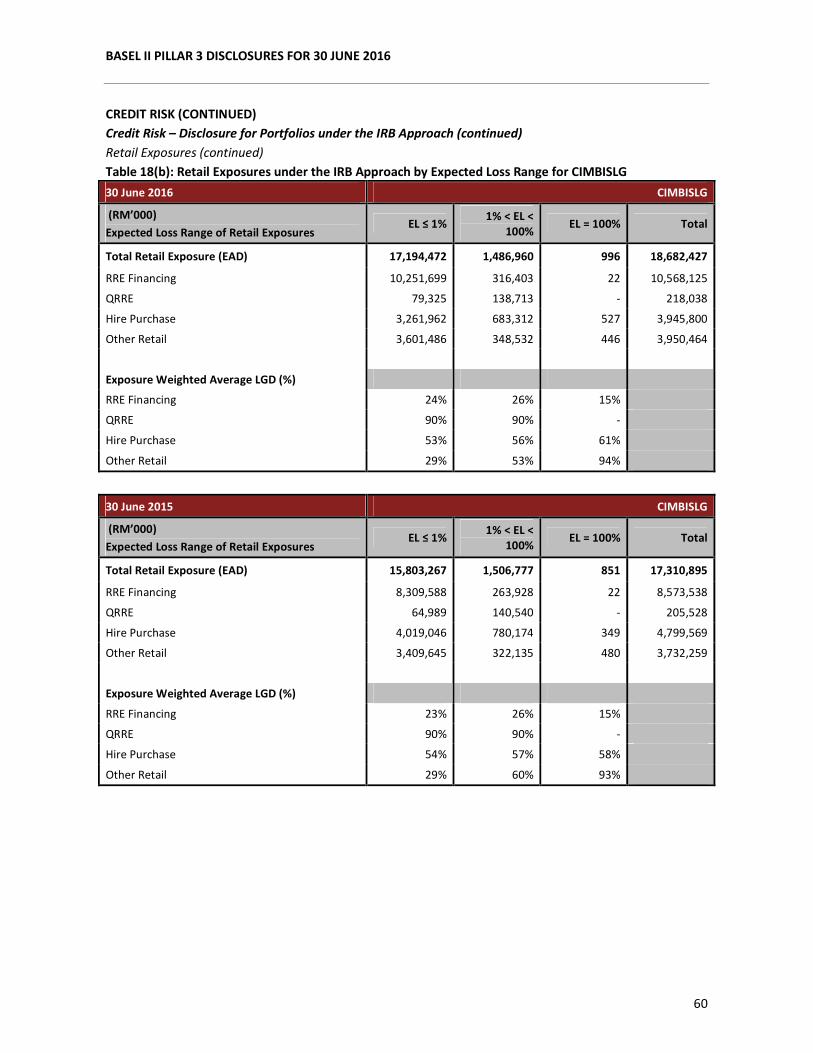
BASEL II PILLAR 3 DISCLOSURES FOR 30 JUNE 2016
60
CREDIT RISK (CONTINUED)
Credit Risk – Disclosure for Portfolios under the IRB Approach (continued)
Retail Exposures (continued)
Table 18(b): Retail Exposures under the IRB Approach by Expected Loss Range for CIMBISLG
30 June 2016 CIMBISLG
(RM’000)
Expected Loss Range of Retail Exposures EL ≤ 1%
1% < EL <
100% EL = 100% Total
Total Retail Exposure (EAD) 17,194,472 1,486,960 996 18,682,427
RRE Financing 10,251,699 316,403 22 10,568,125
QRRE 79,325 138,713 - 218,038
Hire Purchase 3,261,962 683,312 527 3,945,800
Other Retail 3,601,486 348,532 446 3,950,464
Exposure Weighted Average LGD (%)
RRE Financing 24% 26% 15%
QRRE 90% 90% -
Hire Purchase 53% 56% 61%
Other Retail 29% 53% 94%
30 June 2015 CIMBISLG
(RM’000)
Expected Loss Range of Retail Exposures EL ≤ 1%
1% < EL <
100% EL = 100% Total
Total Retail Exposure (EAD) 15,803,267 1,506,777 851 17,310,895
RRE Financing 8,309,588 263,928 22 8,573,538
QRRE 64,989 140,540 - 205,528
Hire Purchase 4,019,046 780,174 349 4,799,569
Other Retail 3,409,645 322,135 480 3,732,259
Exposure Weighted Average LGD (%)
RRE Financing 23% 26% 15%
QRRE 90% 90% -
Hire Purchase 54% 57% 58%
Other Retail 29% 60% 93%
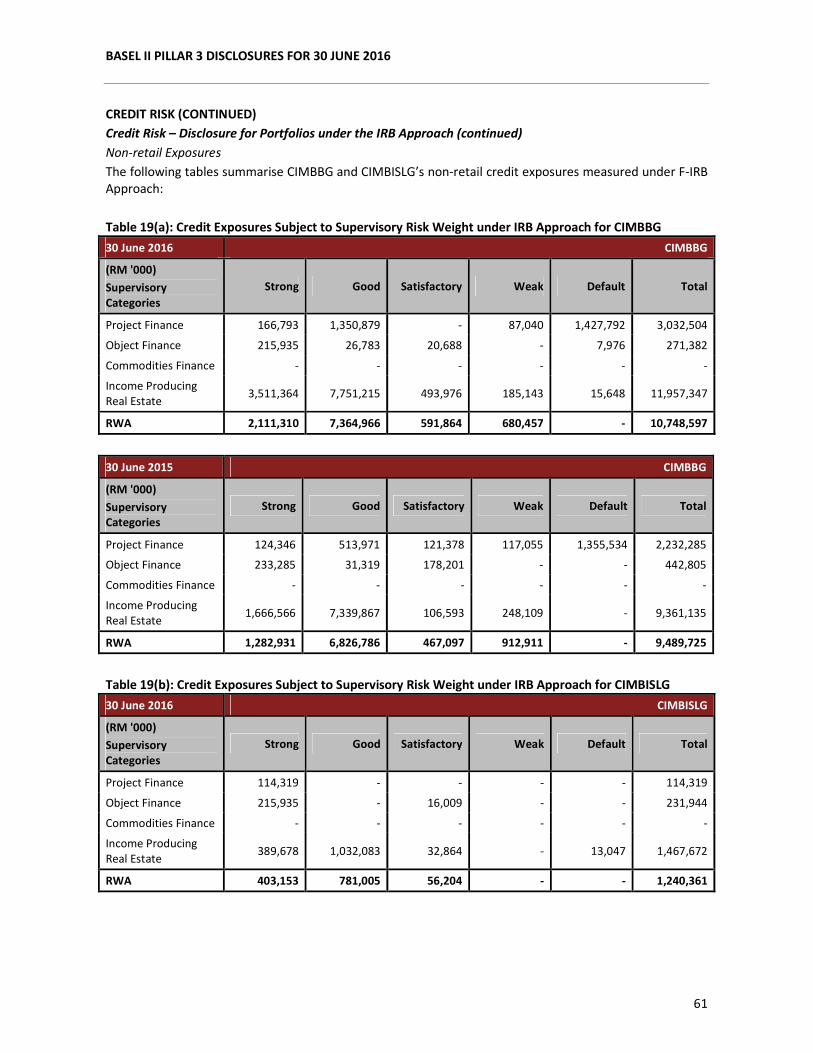
BASEL II PILLAR 3 DISCLOSURES FOR 30 JUNE 2016
61
CREDIT RISK (CONTINUED)
Credit Risk – Disclosure for Portfolios under the IRB Approach (continued)
Non-retail Exposures
The following tables summarise CIMBBG and CIMBISLG’s non-retail credit exposures measured under F-IRB
Approach:
Table 19(a): Credit Exposures Subject to Supervisory Risk Weight under IRB Approach for CIMBBG
30 June 2016 CIMBBG
(RM '000)
Supervisory
Categories
Strong Good Satisfactory Weak Default Total
Project Finance 166,793 1,350,879 - 87,040 1,427,792 3,032,504
Object Finance 215,935 26,783 20,688 - 7,976 271,382
Commodities Finance - - - - - -
Income Producing
Real Estate 3,511,364 7,751,215 493,976 185,143 15,648 11,957,347
RWA 2,111,310 7,364,966 591,864 680,457 - 10,748,597
30 June 2015 CIMBBG
(RM '000)
Supervisory
Categories
Strong Good Satisfactory Weak Default Total
Project Finance 124,346 513,971 121,378 117,055 1,355,534 2,232,285
Object Finance 233,285 31,319 178,201 - - 442,805
Commodities Finance - - - - - -
Income Producing
Real Estate 1,666,566 7,339,867 106,593 248,109 - 9,361,135
RWA 1,282,931 6,826,786 467,097 912,911 - 9,489,725
Table 19(b): Credit Exposures Subject to Supervisory Risk Weight under IRB Approach for CIMBISLG
30 June 2016 CIMBISLG
(RM '000)
Supervisory
Categories
Strong Good Satisfactory Weak Default Total
Project Finance 114,319 - - - - 114,319
Object Finance 215,935 - 16,009 - - 231,944
Commodities Finance - - - - - -
Income Producing
Real Estate 389,678 1,032,083 32,864 - 13,047 1,467,672
RWA 403,153 781,005 56,204 - - 1,240,361
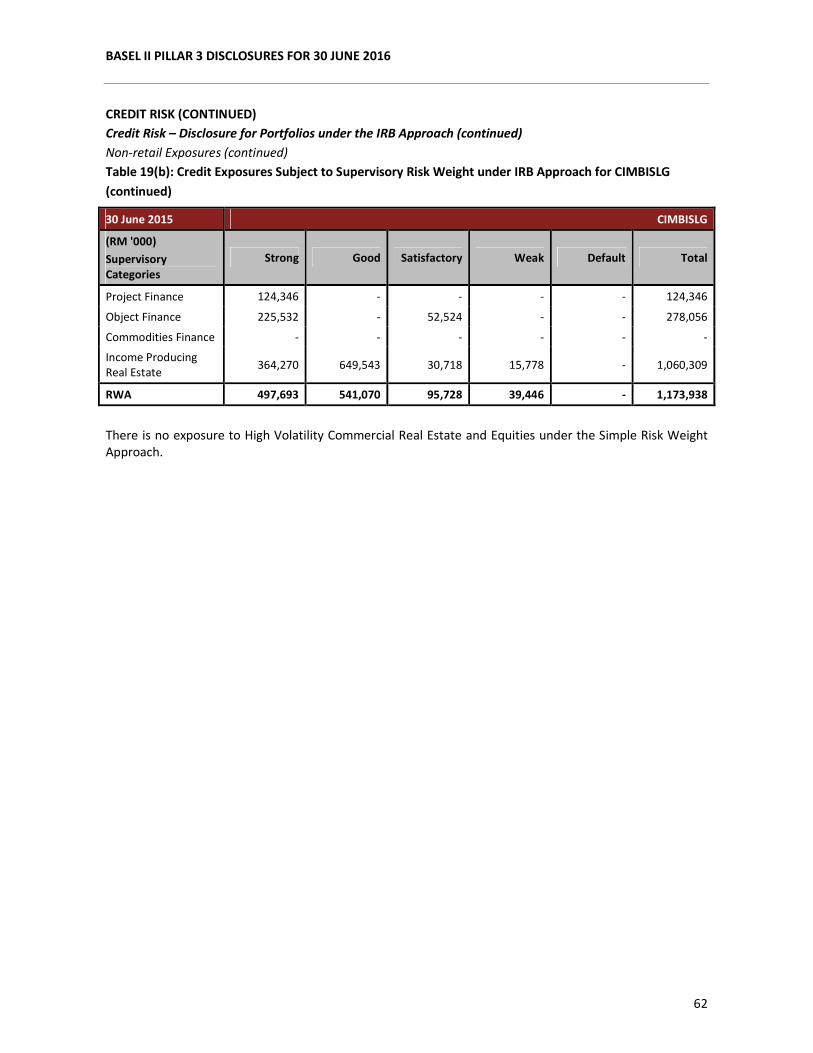
BASEL II PILLAR 3 DISCLOSURES FOR 30 JUNE 2016
62
CREDIT RISK (CONTINUED)
Credit Risk – Disclosure for Portfolios under the IRB Approach (continued)
Non-retail Exposures (continued)
Table 19(b): Credit Exposures Subject to Supervisory Risk Weight under IRB Approach for CIMBISLG
(continued)
30 June 2015 CIMBISLG
(RM '000)
Supervisory
Categories
Strong Good Satisfactory Weak Default Total
Project Finance 124,346 - - - - 124,346
Object Finance 225,532 - 52,524 - - 278,056
Commodities Finance - - - - - -
Income Producing
Real Estate 364,270 649,543 30,718 15,778 - 1,060,309
RWA 497,693 541,070 95,728 39,446 - 1,173,938
There is no exposure to High Volatility Commercial Real Estate and Equities under the Simple Risk Weight
Approach.
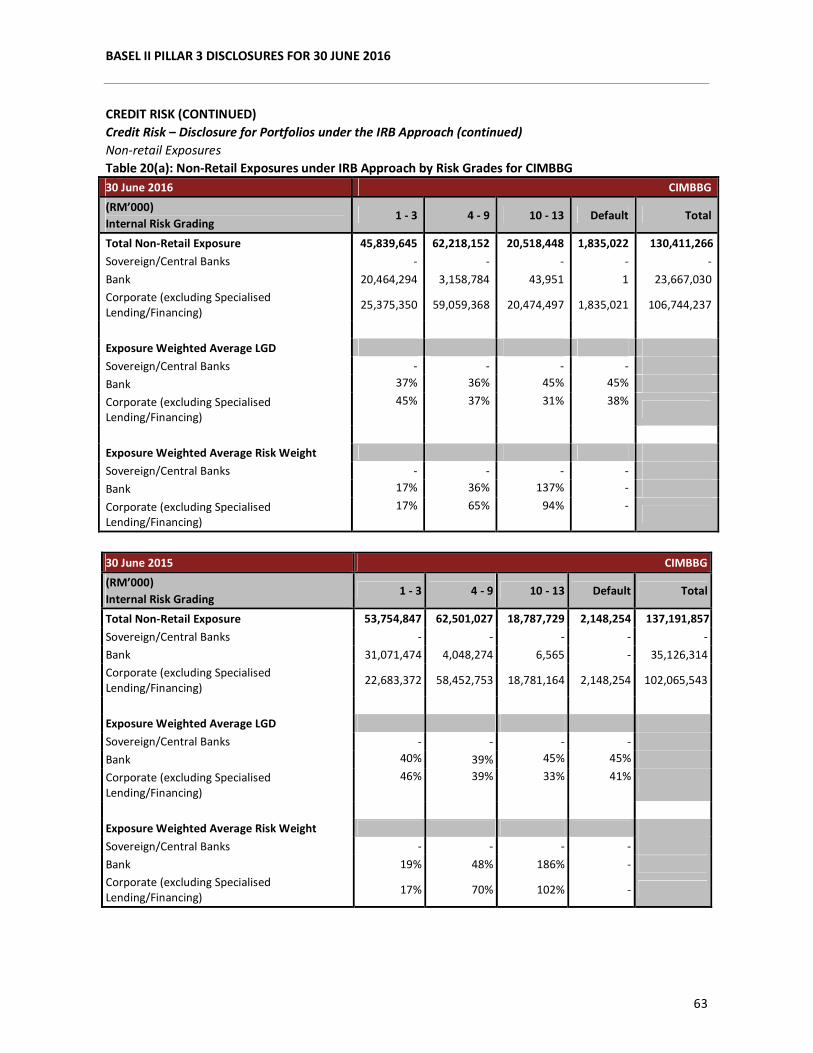
BASEL II PILLAR 3 DISCLOSURES FOR 30 JUNE 2016
63
CREDIT RISK (CONTINUED)
Credit Risk – Disclosure for Portfolios under the IRB Approach (continued)
Non-retail Exposures
Table 20(a): Non-Retail Exposures under IRB Approach by Risk Grades for CIMBBG
30 June 2016 CIMBBG
(RM’000)
Internal Risk Grading 1 - 3 4 - 9 10 - 13 Default Total
Total Non-Retail Exposure 45,839,645 62,218,152 20,518,448 1,835,022 130,411,266
Sovereign/Central Banks - - - - -
Bank 20,464,294 3,158,784 43,951 1 23,667,030
Corporate (excluding Specialised
Lending/Financing) 25,375,350 59,059,368 20,474,497 1,835,021 106,744,237
Exposure Weighted Average LGD
Sovereign/Central Banks - - - -
Bank 37% 36% 45% 45%
Corporate (excluding Specialised
Lending/Financing)
45% 37% 31% 38%
Exposure Weighted Average Risk Weight
Sovereign/Central Banks - - - -
Bank 17% 36% 137% -
Corporate (excluding Specialised
Lending/Financing)
17% 65% 94% -
30 June 2015 CIMBBG
(RM’000)
Internal Risk Grading 1 - 3 4 - 9 10 - 13 Default Total
Total Non-Retail Exposure 53,754,847 62,501,027 18,787,729 2,148,254 137,191,857
Sovereign/Central Banks - - - - -
Bank 31,071,474 4,048,274 6,565 - 35,126,314
Corporate (excluding Specialised
Lending/Financing) 22,683,372 58,452,753 18,781,164 2,148,254 102,065,543
Exposure Weighted Average LGD
Sovereign/Central Banks - - - -
Bank 40% 39% 45% 45%
Corporate (excluding Specialised
Lending/Financing)
46% 39% 33% 41%
Exposure Weighted Average Risk Weight
Sovereign/Central Banks - - - -
Bank 19% 48% 186% -
Corporate (excluding Specialised
Lending/Financing) 17% 70% 102% -
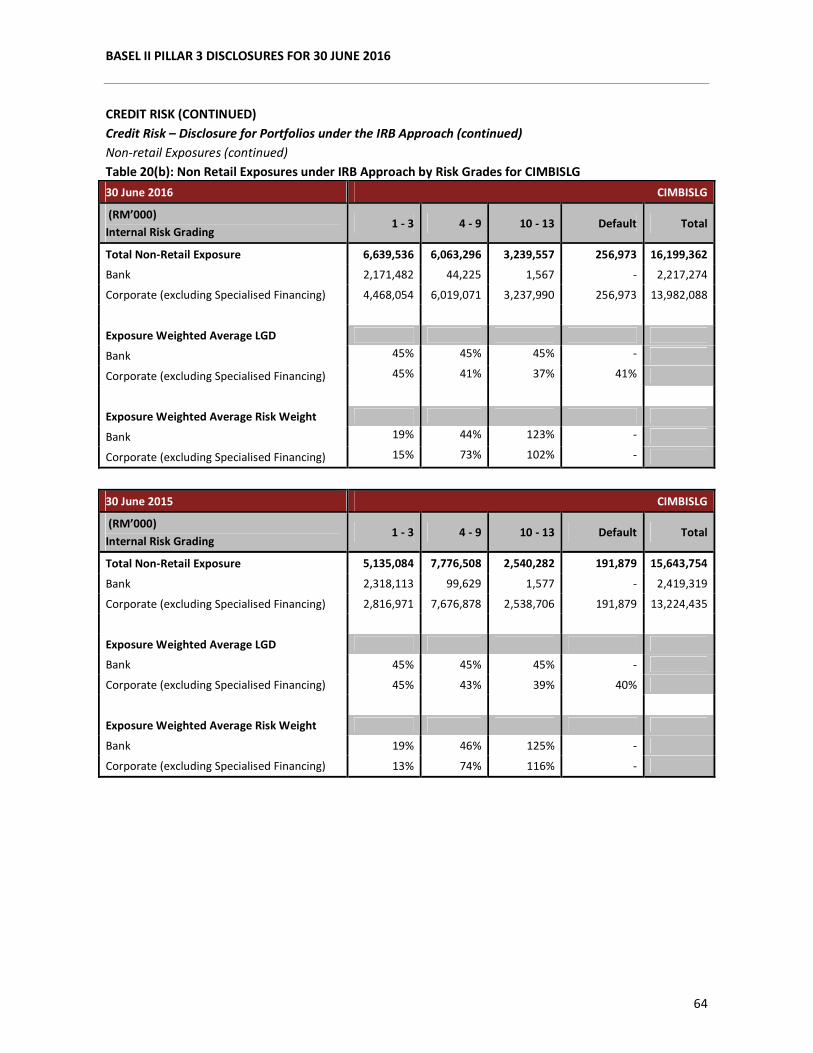
BASEL II PILLAR 3 DISCLOSURES FOR 30 JUNE 2016
64
CREDIT RISK (CONTINUED)
Credit Risk – Disclosure for Portfolios under the IRB Approach (continued)
Non-retail Exposures (continued)
Table 20(b): Non Retail Exposures under IRB Approach by Risk Grades for CIMBISLG
30 June 2016 CIMBISLG
(RM’000)
Internal Risk Grading 1 - 3 4 - 9 10 - 13 Default Total
Total Non-Retail Exposure 6,639,536 6,063,296 3,239,557 256,973 16,199,362
Bank 2,171,482 44,225 1,567 - 2,217,274
Corporate (excluding Specialised Financing) 4,468,054 6,019,071 3,237,990 256,973 13,982,088
Exposure Weighted Average LGD
Bank 45% 45% 45% -
Corporate (excluding Specialised Financing) 45% 41% 37% 41%
Exposure Weighted Average Risk Weight
Bank 19% 44% 123% -
Corporate (excluding Specialised Financing) 15% 73% 102% -
30 June 2015 CIMBISLG
(RM’000)
Internal Risk Grading 1 - 3 4 - 9 10 - 13 Default Total
Total Non-Retail Exposure 5,135,084 7,776,508 2,540,282 191,879 15,643,754
Bank 2,318,113 99,629 1,577 - 2,419,319
Corporate (excluding Specialised Financing) 2,816,971 7,676,878 2,538,706 191,879 13,224,435
Exposure Weighted Average LGD
Bank 45% 45% 45% -
Corporate (excluding Specialised Financing) 45% 43% 39% 40%
Exposure Weighted Average Risk Weight
Bank 19% 46% 125% -
Corporate (excluding Specialised Financing) 13% 74% 116% -
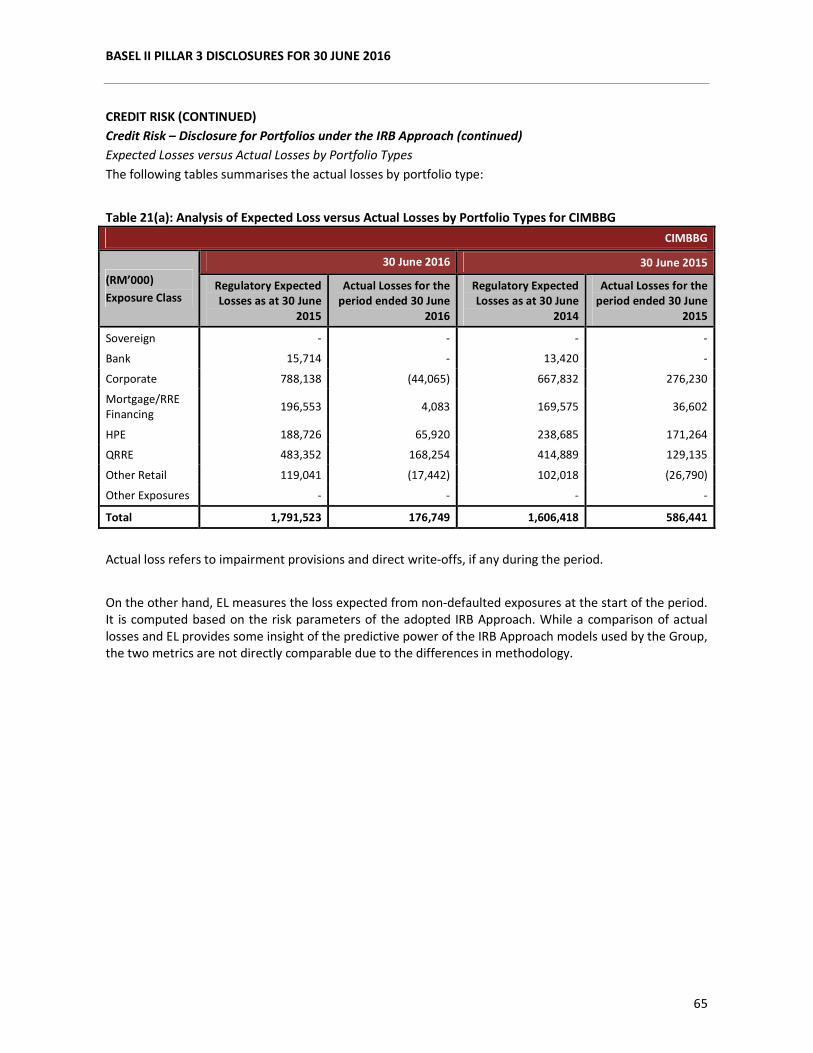
BASEL II PILLAR 3 DISCLOSURES FOR 30 JUNE 2016
65
CREDIT RISK (CONTINUED)
Credit Risk – Disclosure for Portfolios under the IRB Approach (continued)
Expected Losses versus Actual Losses by Portfolio Types
The following tables summarises the actual losses by portfolio type:
Table 21(a): Analysis of Expected Loss versus Actual Losses by Portfolio Types for CIMBBG
CIMBBG
(RM’000)
Exposure Class
30 June 2016 30 June 2015
Regulatory Expected
Losses as at 30 June
2015
Actual Losses for the
period ended 30 June
2016
Regulatory Expected
Losses as at 30 June
2014
Actual Losses for the
period ended 30 June
2015
Sovereign - - - -
Bank 15,714 - 13,420 -
Corporate 788,138 (44,065) 667,832 276,230
Mortgage/RRE
Financing 196,553 4,083 169,575 36,602
HPE 188,726 65,920 238,685 171,264
QRRE 483,352 168,254 414,889 129,135
Other Retail 119,041 (17,442) 102,018 (26,790)
Other Exposures - - - -
Total 1,791,523 176,749 1,606,418 586,441
Actual loss refers to impairment provisions and direct write-offs, if any during the period.
On the other hand, EL measures the loss expected from non-defaulted exposures at the start of the period.
It is computed based on the risk parameters of the adopted IRB Approach. While a comparison of actual
losses and EL provides some insight of the predictive power of the IRB Approach models used by the Group,
the two metrics are not directly comparable due to the differences in methodology.
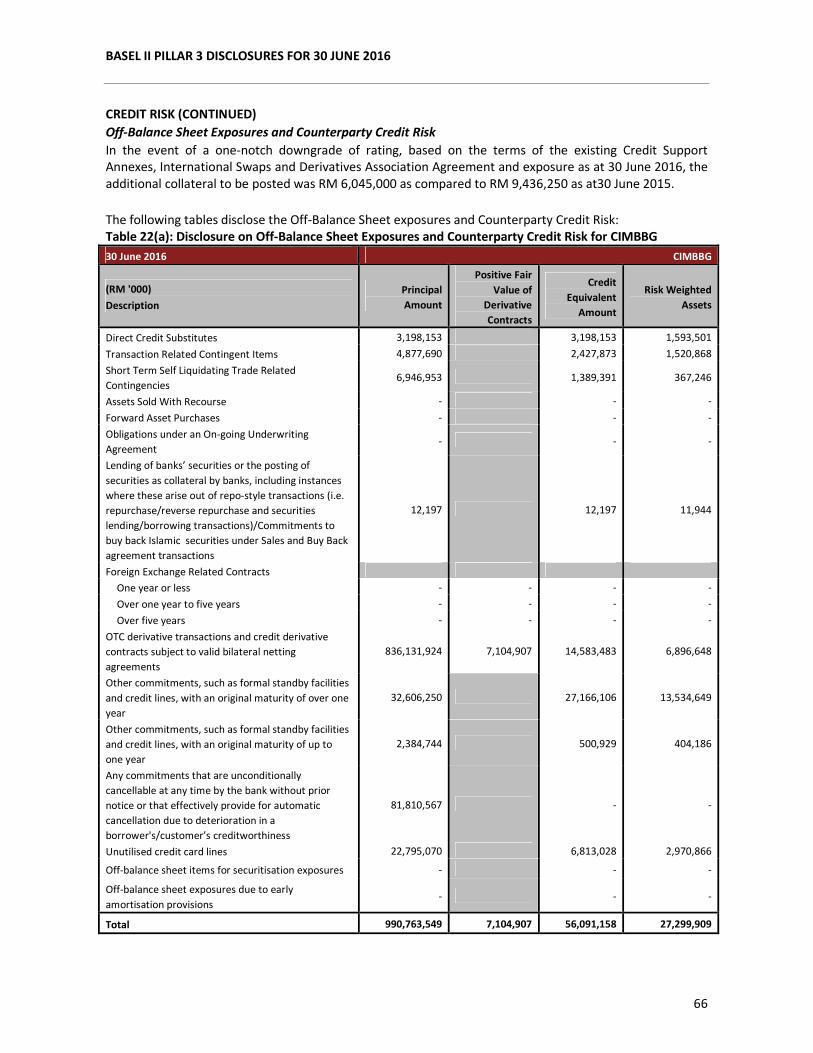
BASEL II PILLAR 3 DISCLOSURES FOR 30 JUNE 2016
66
CREDIT RISK (CONTINUED)
Off-Balance Sheet Exposures and Counterparty Credit Risk
In the event of a one-notch downgrade of rating, based on the terms of the existing Credit Support
Annexes, International Swaps and Derivatives Association Agreement and exposure as at 30 June 2016, the
additional collateral to be posted was RM 6,045,000 as compared to RM 9,436,250 as at30 June 2015.
The following tables disclose the Off-Balance Sheet exposures and Counterparty Credit Risk:
Table 22(a): Disclosure on Off-Balance Sheet Exposures and Counterparty Credit Risk for CIMBBG
30 June 2016 CIMBBG
(RM '000)
Description
Principal
Amount
Positive Fair
Value of
Derivative
Contracts
Credit
Equivalent
Amount
Risk Weighted
Assets
Direct Credit Substitutes 3,198,153 3,198,153 1,593,501
Transaction Related Contingent Items 4,877,690 2,427,873 1,520,868
Short Term Self Liquidating Trade Related
Contingencies 6,946,953 1,389,391 367,246
Assets Sold With Recourse - - -
Forward Asset Purchases - - -
Obligations under an On-going Underwriting
Agreement - - -
Lending of banks’ securities or the posting of
securities as collateral by banks, including instances
where these arise out of repo-style transactions (i.e.
repurchase/reverse repurchase and securities
lending/borrowing transactions)/Commitments to
buy back Islamic securities under Sales and Buy Back
agreement transactions
12,197 12,197 11,944
Foreign Exchange Related Contracts
One year or less - - - -
Over one year to five years - - - -
Over five years - - - -
OTC derivative transactions and credit derivative
contracts subject to valid bilateral netting
agreements
836,131,924 7,104,907 14,583,483 6,896,648
Other commitments, such as formal standby facilities
and credit lines, with an original maturity of over one
year
32,606,250 27,166,106 13,534,649
Other commitments, such as formal standby facilities
and credit lines, with an original maturity of up to
one year
2,384,744 500,929 404,186
Any commitments that are unconditionally
cancellable at any time by the bank without prior
notice or that effectively provide for automatic
cancellation due to deterioration in a
borrower's/customer’s creditworthiness
81,810,567 - -
Unutilised credit card lines 22,795,070 6,813,028 2,970,866
Off-balance sheet items for securitisation exposures - - -
Off-balance sheet exposures due to early
amortisation provisions - - -
Total 990,763,549 7,104,907 56,091,158 27,299,909
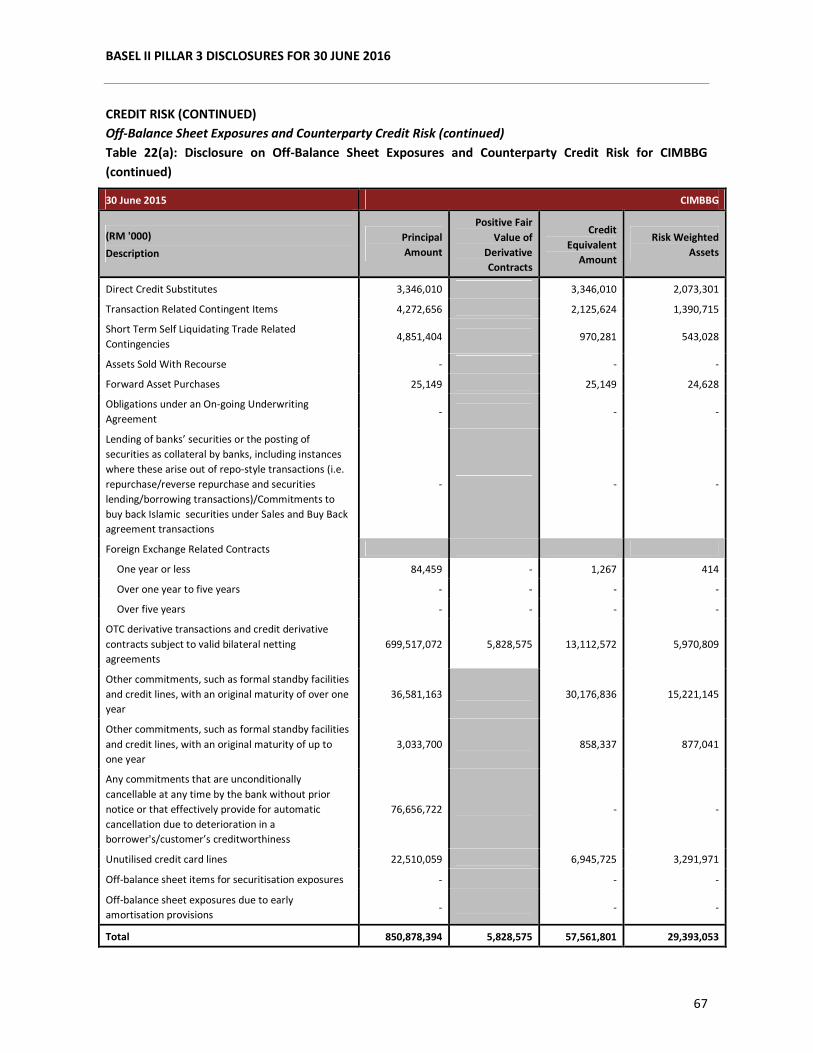
BASEL II PILLAR 3 DISCLOSURES FOR 30 JUNE 2016
67
CREDIT RISK (CONTINUED)
Off-Balance Sheet Exposures and Counterparty Credit Risk (continued)
Table 22(a): Disclosure on Off-Balance Sheet Exposures and Counterparty Credit Risk for CIMBBG
(continued)
30 June 2015 CIMBBG
(RM '000)
Description
Principal
Amount
Positive Fair
Value of
Derivative
Contracts
Credit
Equivalent
Amount
Risk Weighted
Assets
Direct Credit Substitutes 3,346,010 3,346,010 2,073,301
Transaction Related Contingent Items 4,272,656 2,125,624 1,390,715
Short Term Self Liquidating Trade Related
Contingencies 4,851,404 970,281 543,028
Assets Sold With Recourse - - -
Forward Asset Purchases 25,149 25,149 24,628
Obligations under an On-going Underwriting
Agreement - - -
Lending of banks’ securities or the posting of
securities as collateral by banks, including instances
where these arise out of repo-style transactions (i.e.
repurchase/reverse repurchase and securities
lending/borrowing transactions)/Commitments to
buy back Islamic securities under Sales and Buy Back
agreement transactions
- - -
Foreign Exchange Related Contracts
One year or less 84,459 - 1,267 414
Over one year to five years - - - -
Over five years - - - -
OTC derivative transactions and credit derivative
contracts subject to valid bilateral netting
agreements
699,517,072 5,828,575 13,112,572 5,970,809
Other commitments, such as formal standby facilities
and credit lines, with an original maturity of over one
year
36,581,163 30,176,836 15,221,145
Other commitments, such as formal standby facilities
and credit lines, with an original maturity of up to
one year
3,033,700 858,337 877,041
Any commitments that are unconditionally
cancellable at any time by the bank without prior
notice or that effectively provide for automatic
cancellation due to deterioration in a
borrower's/customer’s creditworthiness
76,656,722 - -
Unutilised credit card lines 22,510,059 6,945,725 3,291,971
Off-balance sheet items for securitisation exposures - - -
Off-balance sheet exposures due to early
amortisation provisions - - -
Total 850,878,394 5,828,575 57,561,801 29,393,053
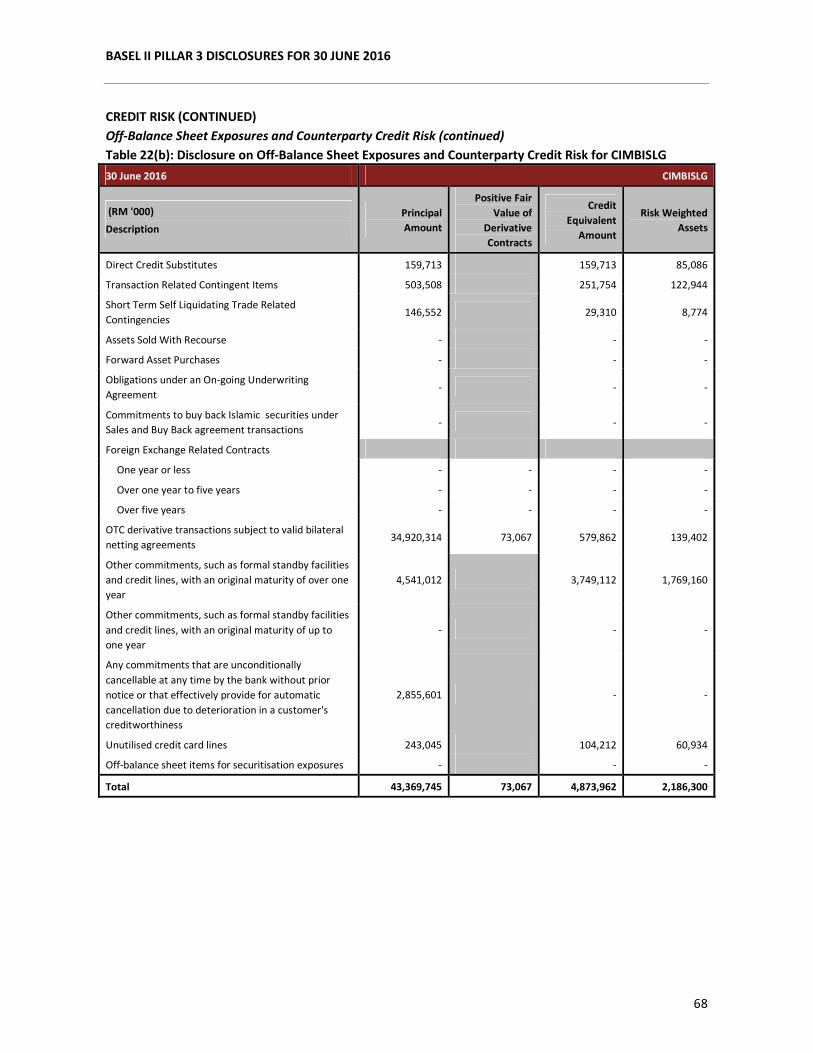
BASEL II PILLAR 3 DISCLOSURES FOR 30 JUNE 2016
68
CREDIT RISK (CONTINUED)
Off-Balance Sheet Exposures and Counterparty Credit Risk (continued)
Table 22(b): Disclosure on Off-Balance Sheet Exposures and Counterparty Credit Risk for CIMBISLG
30 June 2016 CIMBISLG
(RM '000)
Description
Principal
Amount
Positive Fair
Value of
Derivative
Contracts
Credit
Equivalent
Amount
Risk Weighted
Assets
Direct Credit Substitutes 159,713 159,713 85,086
Transaction Related Contingent Items 503,508 251,754 122,944
Short Term Self Liquidating Trade Related
Contingencies 146,552 29,310 8,774
Assets Sold With Recourse - - -
Forward Asset Purchases - - -
Obligations under an On-going Underwriting
Agreement - - -
Commitments to buy back Islamic securities under
Sales and Buy Back agreement transactions - - -
Foreign Exchange Related Contracts
One year or less - - - -
Over one year to five years - - - -
Over five years - - - -
OTC derivative transactions subject to valid bilateral
netting agreements 34,920,314 73,067 579,862 139,402
Other commitments, such as formal standby facilities
and credit lines, with an original maturity of over one
year
4,541,012 3,749,112 1,769,160
Other commitments, such as formal standby facilities
and credit lines, with an original maturity of up to
one year
- - -
Any commitments that are unconditionally
cancellable at any time by the bank without prior
notice or that effectively provide for automatic
cancellation due to deterioration in a customer's
creditworthiness
2,855,601 - -
Unutilised credit card lines 243,045 104,212 60,934
Off-balance sheet items for securitisation exposures - - -
Total 43,369,745 73,067 4,873,962 2,186,300
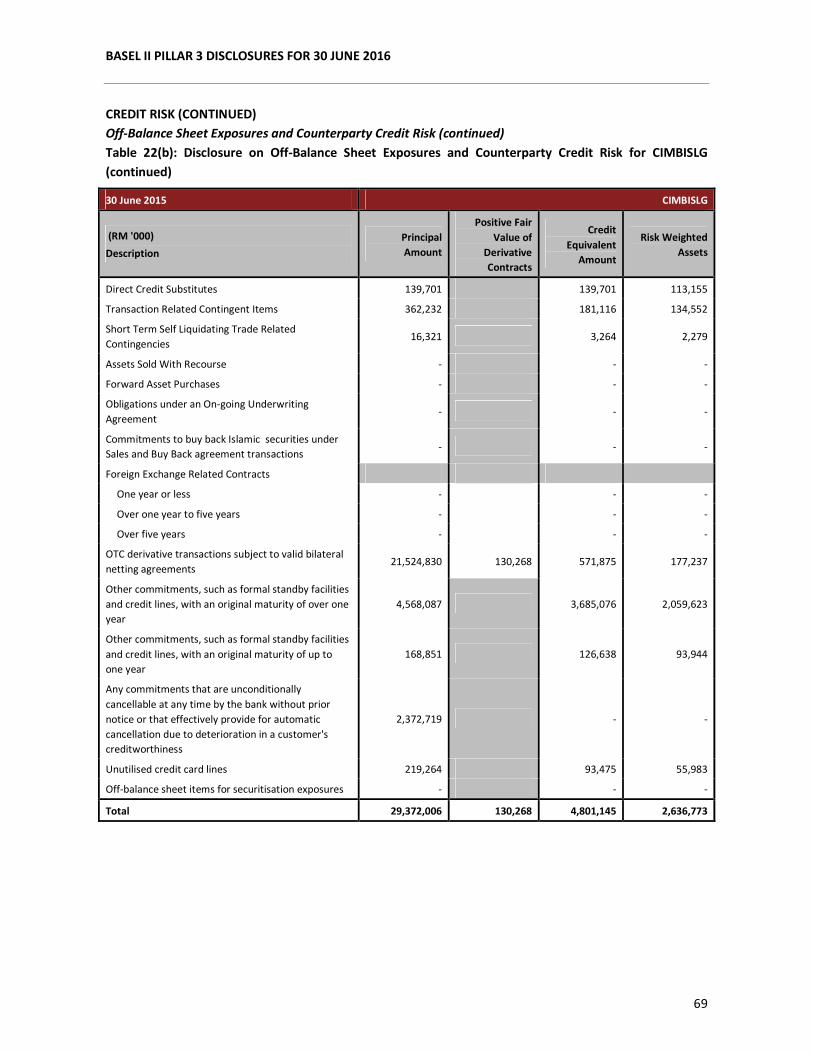
BASEL II PILLAR 3 DISCLOSURES FOR 30 JUNE 2016
69
CREDIT RISK (CONTINUED)
Off-Balance Sheet Exposures and Counterparty Credit Risk (continued)
Table 22(b): Disclosure on Off-Balance Sheet Exposures and Counterparty Credit Risk for CIMBISLG
(continued)
30 June 2015 CIMBISLG
(RM '000)
Description
Principal
Amount
Positive Fair
Value of
Derivative
Contracts
Credit
Equivalent
Amount
Risk Weighted
Assets
Direct Credit Substitutes 139,701 139,701 113,155
Transaction Related Contingent Items 362,232 181,116 134,552
Short Term Self Liquidating Trade Related
Contingencies 16,321 3,264 2,279
Assets Sold With Recourse - - -
Forward Asset Purchases - - -
Obligations under an On-going Underwriting
Agreement - - -
Commitments to buy back Islamic securities under
Sales and Buy Back agreement transactions - - -
Foreign Exchange Related Contracts
One year or less - - -
Over one year to five years - - -
Over five years - - -
OTC derivative transactions subject to valid bilateral
netting agreements 21,524,830 130,268 571,875 177,237
Other commitments, such as formal standby facilities
and credit lines, with an original maturity of over one
year
4,568,087 3,685,076 2,059,623
Other commitments, such as formal standby facilities
and credit lines, with an original maturity of up to
one year
168,851 126,638 93,944
Any commitments that are unconditionally
cancellable at any time by the bank without prior
notice or that effectively provide for automatic
cancellation due to deterioration in a customer's
creditworthiness
2,372,719 - -
Unutilised credit card lines 219,264 93,475 55,983
Off-balance sheet items for securitisation exposures - - -
Total 29,372,006 130,268 4,801,145 2,636,773
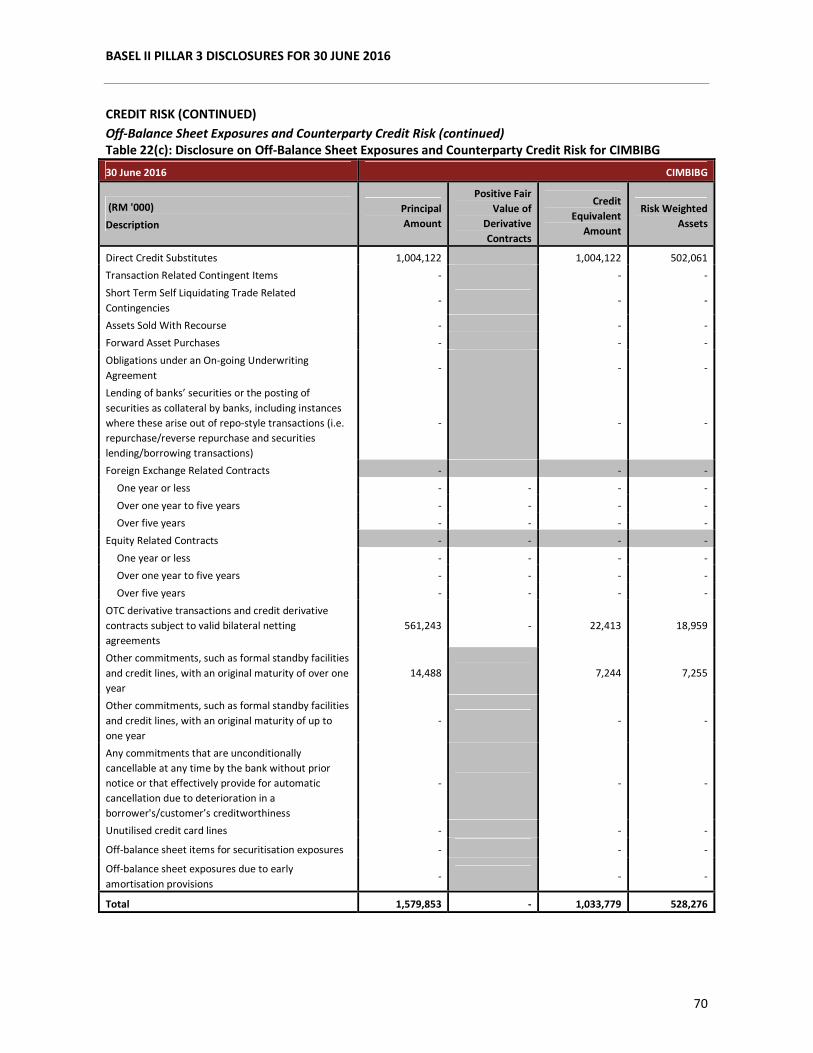
BASEL II PILLAR 3 DISCLOSURES FOR 30 JUNE 2016
70
CREDIT RISK (CONTINUED)
Off-Balance Sheet Exposures and Counterparty Credit Risk (continued)
Table 22(c): Disclosure on Off-Balance Sheet Exposures and Counterparty Credit Risk for CIMBIBG
30 June 2016 CIMBIBG
(RM '000)
Description
Principal
Amount
Positive Fair
Value of
Derivative
Contracts
Credit
Equivalent
Amount
Risk Weighted
Assets
Direct Credit Substitutes 1,004,122 1,004,122 502,061
Transaction Related Contingent Items - - -
Short Term Self Liquidating Trade Related
Contingencies - - -
Assets Sold With Recourse - - -
Forward Asset Purchases - - -
Obligations under an On-going Underwriting
Agreement - - -
Lending of banks’ securities or the posting of
securities as collateral by banks, including instances
where these arise out of repo-style transactions (i.e.
repurchase/reverse repurchase and securities
lending/borrowing transactions)
- - -
Foreign Exchange Related Contracts - - -
One year or less - - - -
Over one year to five years - - - -
Over five years - - - -
Equity Related Contracts - - - -
One year or less - - - -
Over one year to five years - - - -
Over five years - - - -
OTC derivative transactions and credit derivative
contracts subject to valid bilateral netting
agreements
561,243 - 22,413 18,959
Other commitments, such as formal standby facilities
and credit lines, with an original maturity of over one
year
14,488 7,244 7,255
Other commitments, such as formal standby facilities
and credit lines, with an original maturity of up to
one year
- - -
Any commitments that are unconditionally
cancellable at any time by the bank without prior
notice or that effectively provide for automatic
cancellation due to deterioration in a
borrower's/customer’s creditworthiness
- - -
Unutilised credit card lines - - -
Off-balance sheet items for securitisation exposures - - -
Off-balance sheet exposures due to early
amortisation provisions - - -
Total 1,579,853 - 1,033,779 528,276
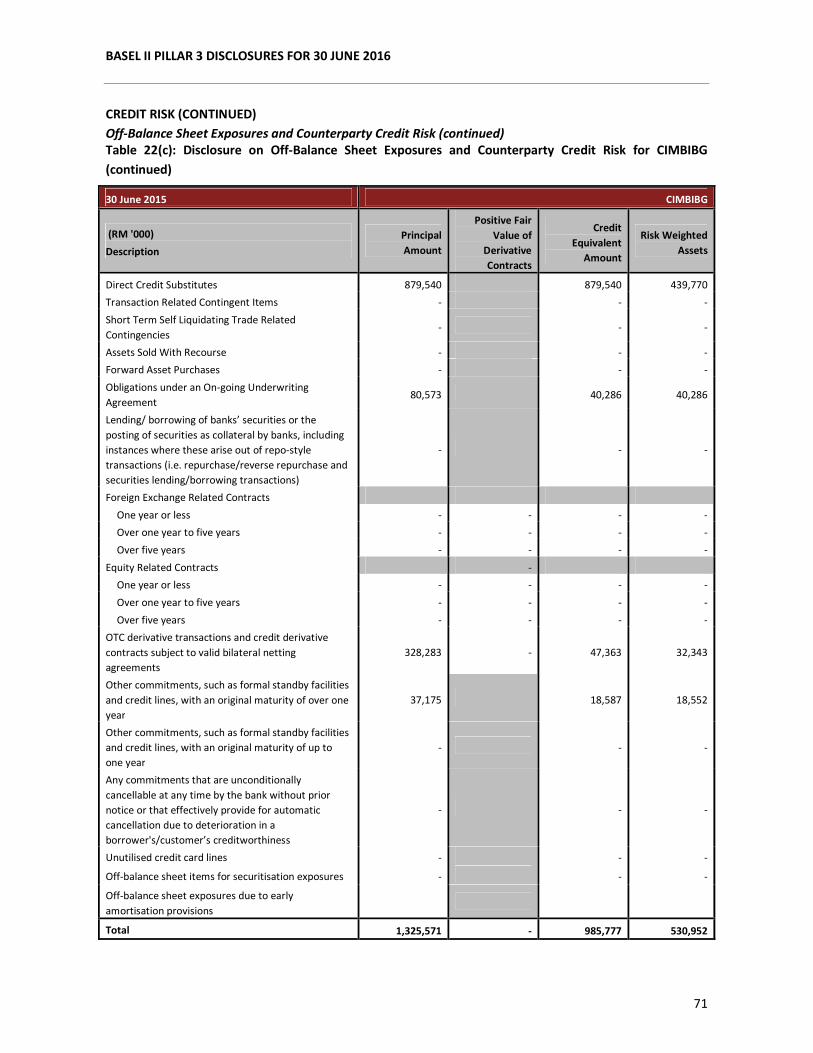
BASEL II PILLAR 3 DISCLOSURES FOR 30 JUNE 2016
71
CREDIT RISK (CONTINUED)
Off-Balance Sheet Exposures and Counterparty Credit Risk (continued)
Table 22(c): Disclosure on Off-Balance Sheet Exposures and Counterparty Credit Risk for CIMBIBG
(continued)
30 June 2015 CIMBIBG
(RM '000)
Description
Principal
Amount
Positive Fair
Value of
Derivative
Contracts
Credit
Equivalent
Amount
Risk Weighted
Assets
Direct Credit Substitutes 879,540 879,540 439,770
Transaction Related Contingent Items - - -
Short Term Self Liquidating Trade Related
Contingencies - - -
Assets Sold With Recourse - - -
Forward Asset Purchases - - -
Obligations under an On-going Underwriting
Agreement 80,573 40,286 40,286
Lending/ borrowing of banks’ securities or the
posting of securities as collateral by banks, including
instances where these arise out of repo-style
transactions (i.e. repurchase/reverse repurchase and
securities lending/borrowing transactions)
- - -
Foreign Exchange Related Contracts
One year or less - - - -
Over one year to five years - - - -
Over five years - - - -
Equity Related Contracts -
One year or less - - - -
Over one year to five years - - - -
Over five years - - - -
OTC derivative transactions and credit derivative
contracts subject to valid bilateral netting
agreements
328,283 - 47,363 32,343
Other commitments, such as formal standby facilities
and credit lines, with an original maturity of over one
year
37,175 18,587 18,552
Other commitments, such as formal standby facilities
and credit lines, with an original maturity of up to
one year
- - -
Any commitments that are unconditionally
cancellable at any time by the bank without prior
notice or that effectively provide for automatic
cancellation due to deterioration in a
borrower's/customer’s creditworthiness
- - -
Unutilised credit card lines - - -
Off-balance sheet items for securitisation exposures - - -
Off-balance sheet exposures due to early
amortisation provisions
Total 1,325,571 - 985,777 530,952
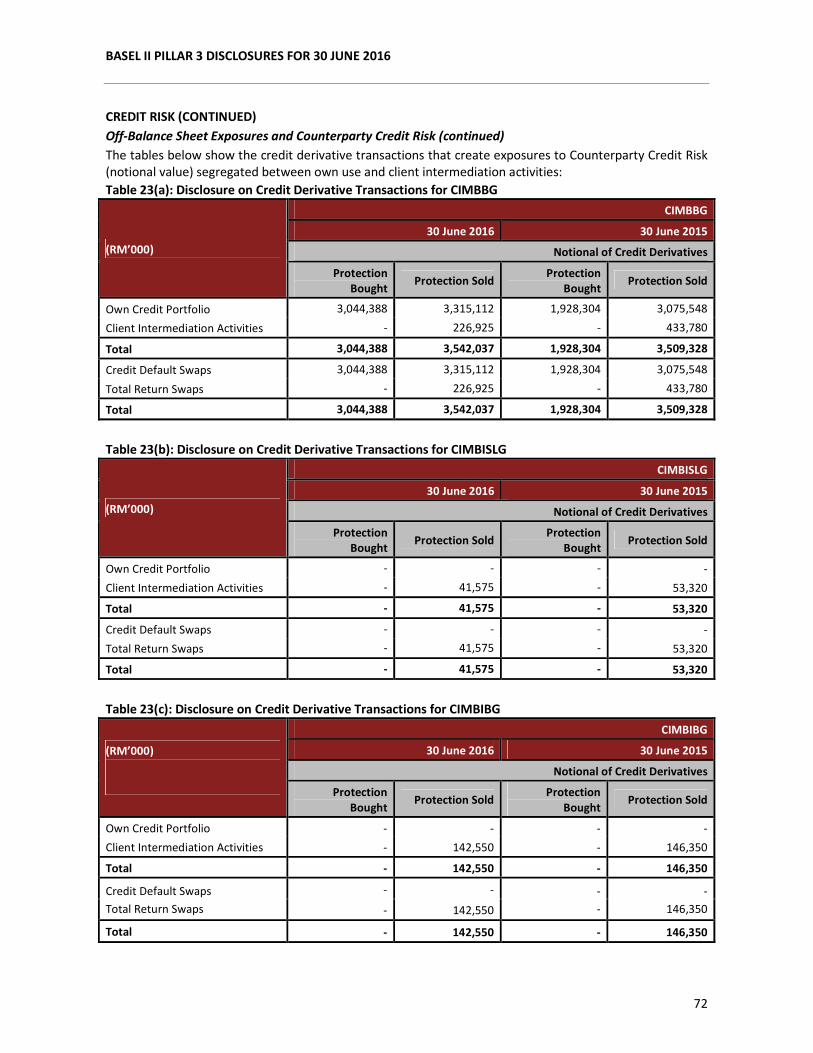
BASEL II PILLAR 3 DISCLOSURES FOR 30 JUNE 2016
72
CREDIT RISK (CONTINUED)
Off-Balance Sheet Exposures and Counterparty Credit Risk (continued)
The tables below show the credit derivative transactions that create exposures to Counterparty Credit Risk
(notional value) segregated between own use and client intermediation activities:
Table 23(a): Disclosure on Credit Derivative Transactions for CIMBBG
(RM’000)
CIMBBG
30 June 2016 30 June 2015
Notional of Credit Derivatives
Protection
Bought Protection Sold
Protection
Bought Protection Sold
Own Credit Portfolio 3,044,388 3,315,112 1,928,304 3,075,548
Client Intermediation Activities - 226,925 - 433,780
Total 3,044,388 3,542,037 1,928,304 3,509,328
Credit Default Swaps 3,044,388 3,315,112 1,928,304 3,075,548
Total Return Swaps - 226,925 - 433,780
Total 3,044,388 3,542,037 1,928,304 3,509,328
Table 23(b): Disclosure on Credit Derivative Transactions for CIMBISLG
(RM’000)
CIMBISLG
30 June 2016 30 June 2015
Notional of Credit Derivatives
Protection
Bought Protection Sold
Protection
Bought Protection Sold
Own Credit Portfolio - - - -
Client Intermediation Activities - 41,575 - 53,320
Total - 41,575 - 53,320
Credit Default Swaps - - - -
Total Return Swaps - 41,575 - 53,320
Total - 41,575 - 53,320
Table 23(c): Disclosure on Credit Derivative Transactions for CIMBIBG
(RM’000)
CIMBIBG
30 June 2016 30 June 2015
Notional of Credit Derivatives
Protection
Bought Protection Sold
Protection
Bought Protection Sold
Own Credit Portfolio - - - -
Client Intermediation Activities - 142,550 - 146,350
Total - 142,550 - 146,350
Credit Default Swaps
Total Return Swaps
- - -
-
-
146,350 - 142,550
Total - 142,550 - 146,350
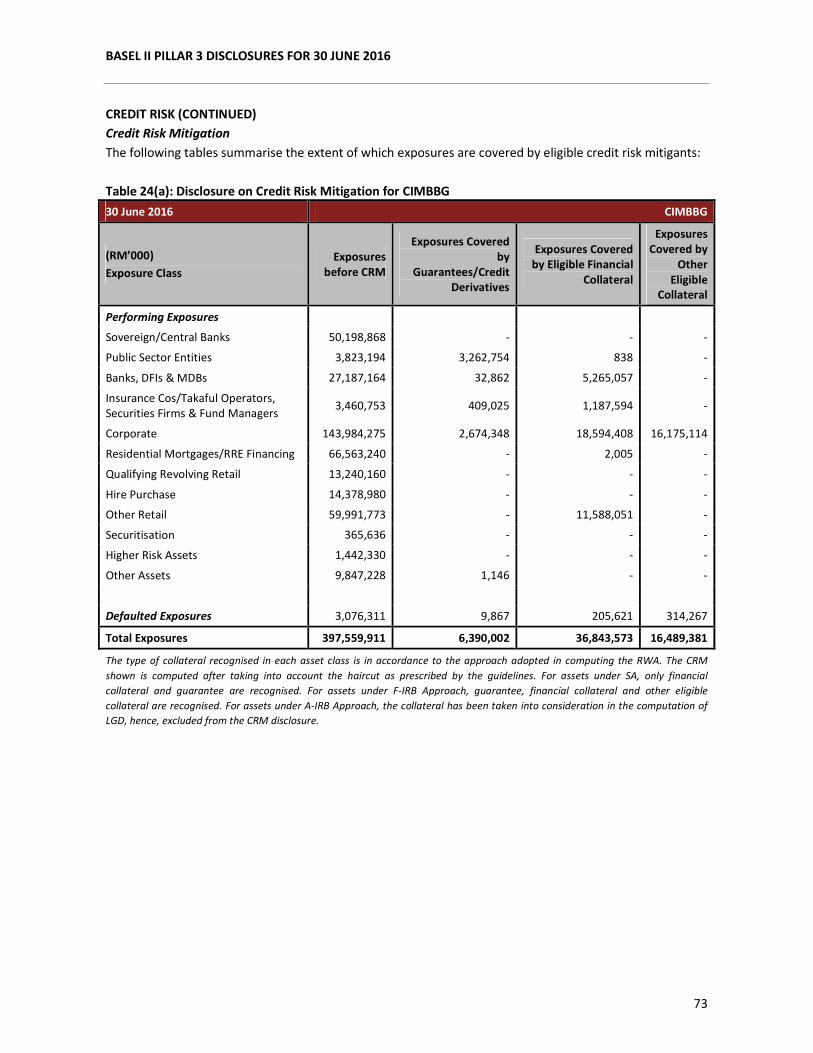
BASEL II PILLAR 3 DISCLOSURES FOR 30 JUNE 2016
73
CREDIT RISK (CONTINUED)
Credit Risk Mitigation
The following tables summarise the extent of which exposures are covered by eligible credit risk mitigants:
Table 24(a): Disclosure on Credit Risk Mitigation for CIMBBG
30 June 2016 CIMBBG
(RM’000)
Exposure Class
Exposures
before CRM
Exposures Covered
by
Guarantees/Credit
Derivatives
Exposures Covered
by Eligible Financial
Collateral
Exposures
Covered by
Other
Eligible
Collateral
Performing Exposures
Sovereign/Central Banks 50,198,868 - - -
Public Sector Entities 3,823,194 3,262,754 838 -
Banks, DFIs & MDBs 27,187,164 32,862 5,265,057 -
Insurance Cos/Takaful Operators,
Securities Firms & Fund Managers 3,460,753 409,025 1,187,594 -
Corporate 143,984,275 2,674,348 18,594,408 16,175,114
Residential Mortgages/RRE Financing 66,563,240 - 2,005 -
Qualifying Revolving Retail 13,240,160 - - -
Hire Purchase 14,378,980 - - -
Other Retail 59,991,773 - 11,588,051 -
Securitisation 365,636 - - -
Higher Risk Assets 1,442,330 - - -
Other Assets 9,847,228 1,146 - -
Defaulted Exposures 3,076,311 9,867 205,621 314,267
Total Exposures 397,559,911 6,390,002 36,843,573 16,489,381
The type of collateral recognised in each asset class is in accordance to the approach adopted in computing the RWA. The CRM
shown is computed after taking into account the haircut as prescribed by the guidelines. For assets under SA, only financial
collateral and guarantee are recognised. For assets under F-IRB Approach, guarantee, financial collateral and other eligible
collateral are recognised. For assets under A-IRB Approach, the collateral has been taken into consideration in the computation of
LGD, hence, excluded from the CRM disclosure.
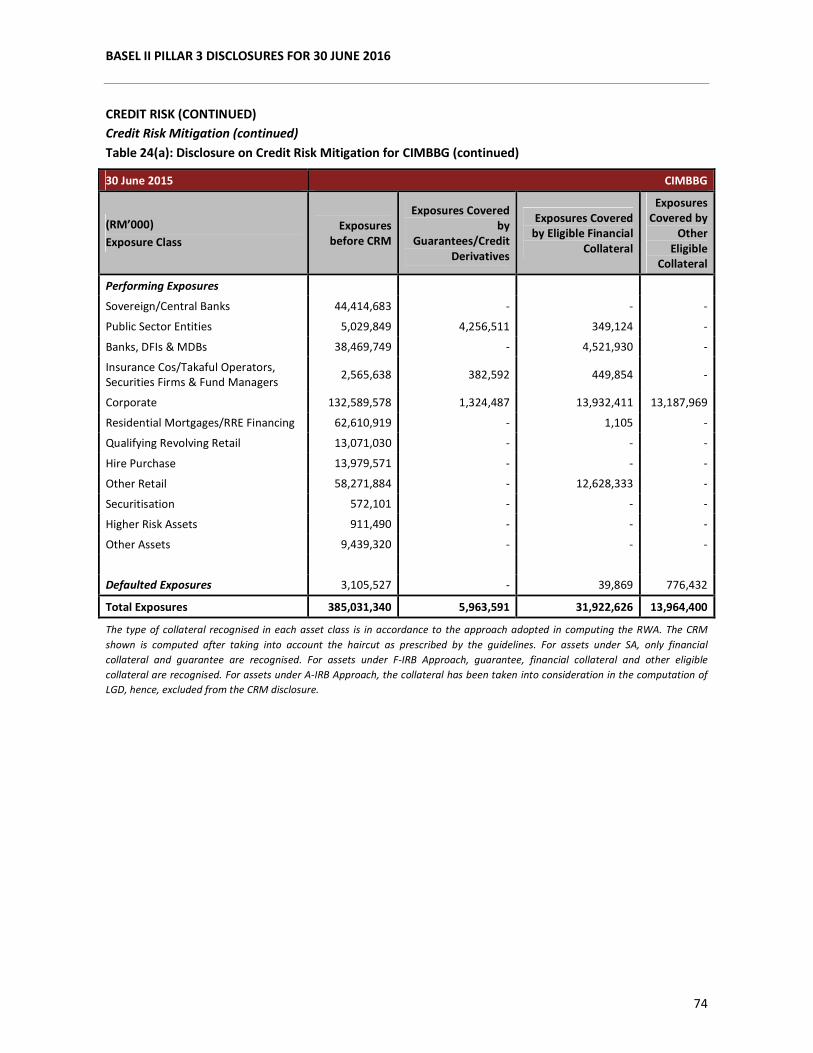
BASEL II PILLAR 3 DISCLOSURES FOR 30 JUNE 2016
74
CREDIT RISK (CONTINUED)
Credit Risk Mitigation (continued)
Table 24(a): Disclosure on Credit Risk Mitigation for CIMBBG (continued)
30 June 2015 CIMBBG
(RM’000)
Exposure Class
Exposures
before CRM
Exposures Covered
by
Guarantees/Credit
Derivatives
Exposures Covered
by Eligible Financial
Collateral
Exposures
Covered by
Other
Eligible
Collateral
Performing Exposures
Sovereign/Central Banks 44,414,683 - - -
Public Sector Entities 5,029,849 4,256,511 349,124 -
Banks, DFIs & MDBs 38,469,749 - 4,521,930 -
Insurance Cos/Takaful Operators,
Securities Firms & Fund Managers 2,565,638 382,592 449,854 -
Corporate 132,589,578 1,324,487 13,932,411 13,187,969
Residential Mortgages/RRE Financing 62,610,919 - 1,105 -
Qualifying Revolving Retail 13,071,030 - - -
Hire Purchase 13,979,571 - - -
Other Retail 58,271,884 - 12,628,333 -
Securitisation 572,101 - - -
Higher Risk Assets 911,490 - - -
Other Assets 9,439,320 - - -
Defaulted Exposures 3,105,527 - 39,869 776,432
Total Exposures 385,031,340 5,963,591 31,922,626 13,964,400
The type of collateral recognised in each asset class is in accordance to the approach adopted in computing the RWA. The CRM
shown is computed after taking into account the haircut as prescribed by the guidelines. For assets under SA, only financial
collateral and guarantee are recognised. For assets under F-IRB Approach, guarantee, financial collateral and other eligible
collateral are recognised. For assets under A-IRB Approach, the collateral has been taken into consideration in the computation of
LGD, hence, excluded from the CRM disclosure.
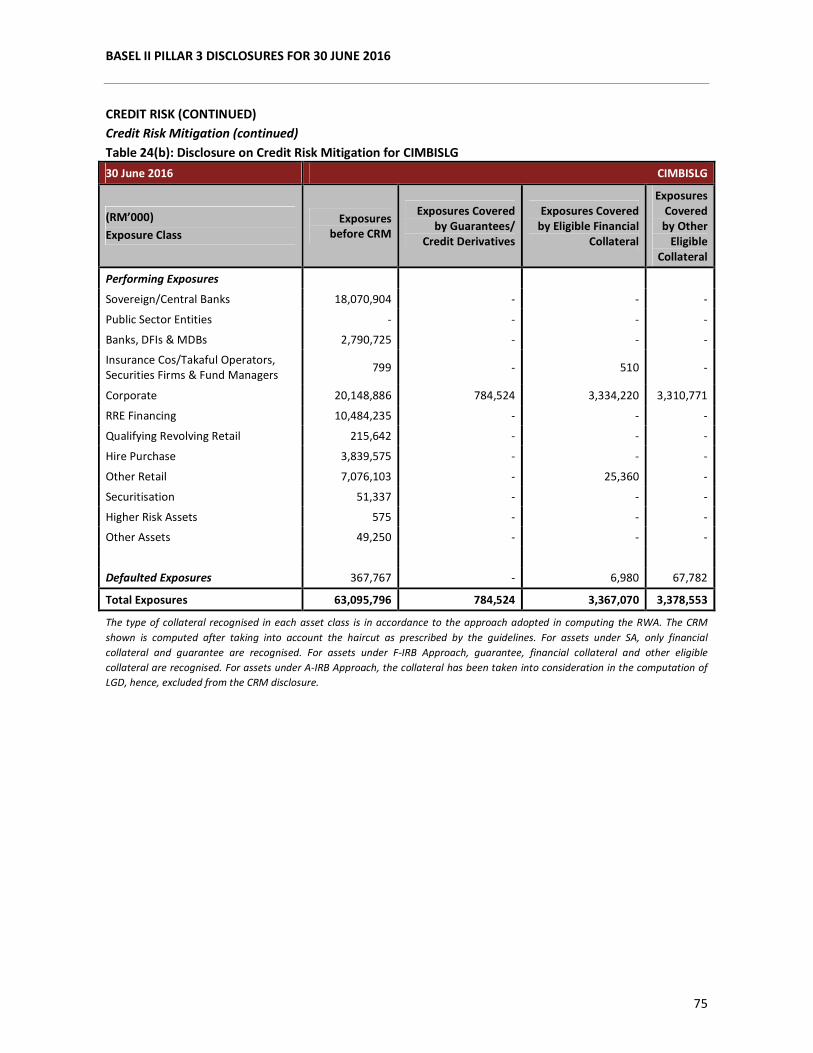
BASEL II PILLAR 3 DISCLOSURES FOR 30 JUNE 2016
75
CREDIT RISK (CONTINUED)
Credit Risk Mitigation (continued)
Table 24(b): Disclosure on Credit Risk Mitigation for CIMBISLG
30 June 2016 CIMBISLG
(RM’000)
Exposure Class
Exposures
before CRM
Exposures Covered
by Guarantees/
Credit Derivatives
Exposures Covered
by Eligible Financial
Collateral
Exposures
Covered
by Other
Eligible
Collateral
Performing Exposures
Sovereign/Central Banks 18,070,904 - - -
Public Sector Entities - - - -
Banks, DFIs & MDBs 2,790,725 - - -
Insurance Cos/Takaful Operators,
Securities Firms & Fund Managers 799 - 510 -
Corporate 20,148,886 784,524 3,334,220 3,310,771
RRE Financing 10,484,235 - - -
Qualifying Revolving Retail 215,642 - - -
Hire Purchase 3,839,575 - - -
Other Retail 7,076,103 - 25,360 -
Securitisation 51,337 - - -
Higher Risk Assets 575 - - -
Other Assets 49,250 - - -
Defaulted Exposures 367,767 - 6,980 67,782
Total Exposures 63,095,796 784,524 3,367,070 3,378,553
The type of collateral recognised in each asset class is in accordance to the approach adopted in computing the RWA. The CRM
shown is computed after taking into account the haircut as prescribed by the guidelines. For assets under SA, only financial
collateral and guarantee are recognised. For assets under F-IRB Approach, guarantee, financial collateral and other eligible
collateral are recognised. For assets under A-IRB Approach, the collateral has been taken into consideration in the computation of
LGD, hence, excluded from the CRM disclosure.
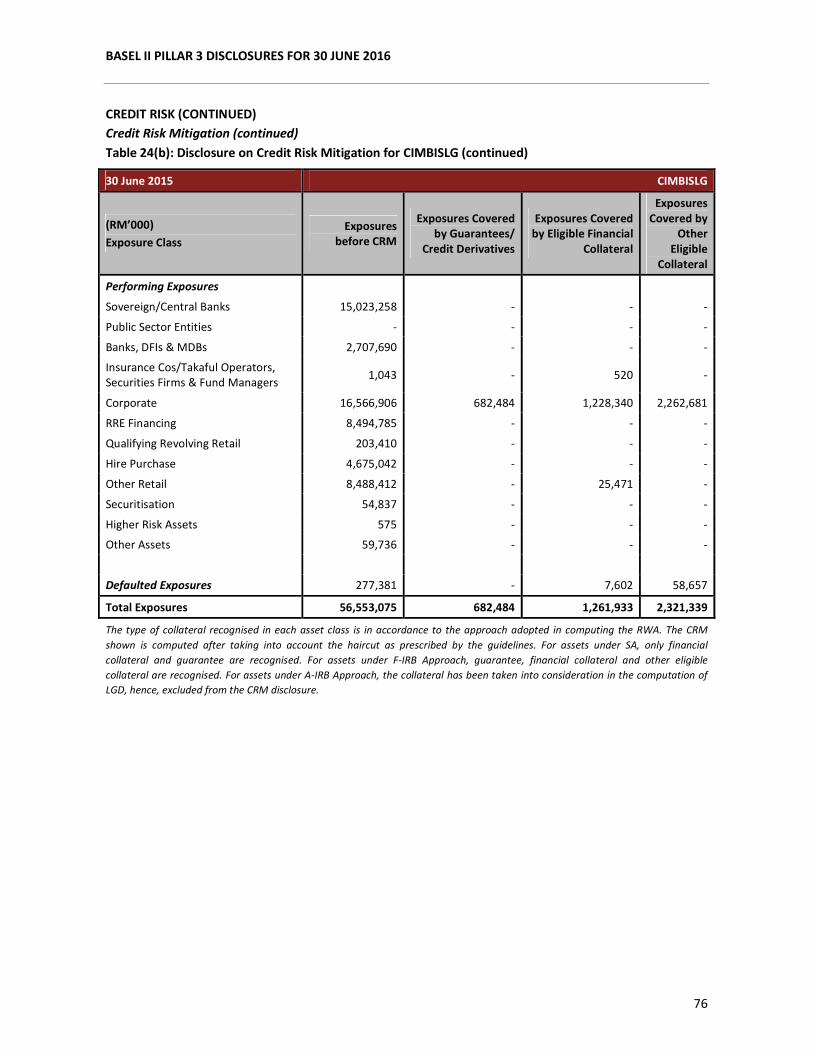
BASEL II PILLAR 3 DISCLOSURES FOR 30 JUNE 2016
76
CREDIT RISK (CONTINUED)
Credit Risk Mitigation (continued)
Table 24(b): Disclosure on Credit Risk Mitigation for CIMBISLG (continued)
30 June 2015 CIMBISLG
(RM’000)
Exposure Class
Exposures
before CRM
Exposures Covered
by Guarantees/
Credit Derivatives
Exposures Covered
by Eligible Financial
Collateral
Exposures
Covered by
Other
Eligible
Collateral
Performing Exposures
Sovereign/Central Banks 15,023,258 - - -
Public Sector Entities - - - -
Banks, DFIs & MDBs 2,707,690 - - -
Insurance Cos/Takaful Operators,
Securities Firms & Fund Managers 1,043 - 520 -
Corporate 16,566,906 682,484 1,228,340 2,262,681
RRE Financing 8,494,785 - - -
Qualifying Revolving Retail 203,410 - - -
Hire Purchase 4,675,042 - - -
Other Retail 8,488,412 - 25,471 -
Securitisation 54,837 - - -
Higher Risk Assets 575 - - -
Other Assets 59,736 - - -
Defaulted Exposures 277,381 - 7,602 58,657
Total Exposures 56,553,075 682,484 1,261,933 2,321,339
The type of collateral recognised in each asset class is in accordance to the approach adopted in computing the RWA. The CRM
shown is computed after taking into account the haircut as prescribed by the guidelines. For assets under SA, only financial
collateral and guarantee are recognised. For assets under F-IRB Approach, guarantee, financial collateral and other eligible
collateral are recognised. For assets under A-IRB Approach, the collateral has been taken into consideration in the computation of
LGD, hence, excluded from the CRM disclosure.
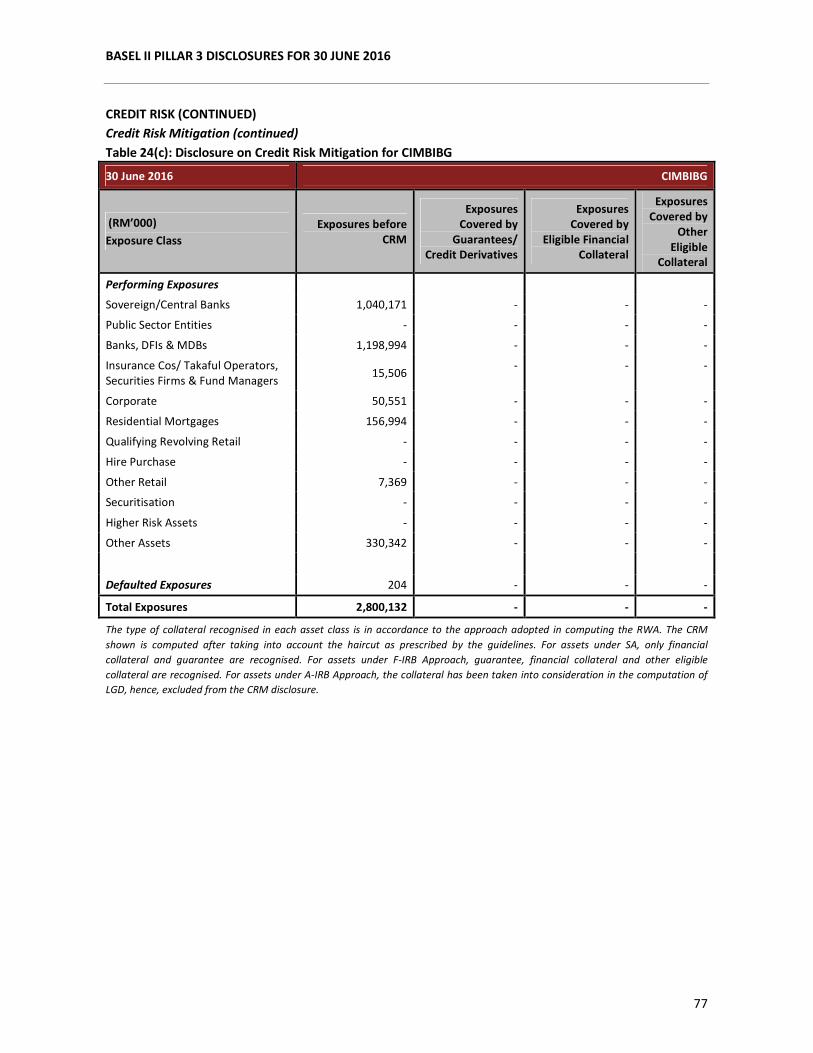
BASEL II PILLAR 3 DISCLOSURES FOR 30 JUNE 2016
77
CREDIT RISK (CONTINUED)
Credit Risk Mitigation (continued)
Table 24(c): Disclosure on Credit Risk Mitigation for CIMBIBG
30 June 2016 CIMBIBG
(RM’000)
Exposure Class
Exposures before
CRM
Exposures
Covered by
Guarantees/
Credit Derivatives
Exposures
Covered by
Eligible Financial
Collateral
Exposures
Covered by
Other
Eligible
Collateral
Performing Exposures
Sovereign/Central Banks 1,040,171 - - -
Public Sector Entities - - - -
Banks, DFIs & MDBs 1,198,994 - - -
Insurance Cos/ Takaful Operators,
Securities Firms & Fund Managers 15,506
- - -
Corporate 50,551 - - -
Residential Mortgages 156,994 - - -
Qualifying Revolving Retail - - - -
Hire Purchase - - - -
Other Retail 7,369 - - -
Securitisation - - - -
Higher Risk Assets - - - -
Other Assets 330,342 - - -
Defaulted Exposures 204 - - -
Total Exposures 2,800,132 - - -
The type of collateral recognised in each asset class is in accordance to the approach adopted in computing the RWA. The CRM
shown is computed after taking into account the haircut as prescribed by the guidelines. For assets under SA, only financial
collateral and guarantee are recognised. For assets under F-IRB Approach, guarantee, financial collateral and other eligible
collateral are recognised. For assets under A-IRB Approach, the collateral has been taken into consideration in the computation of
LGD, hence, excluded from the CRM disclosure.
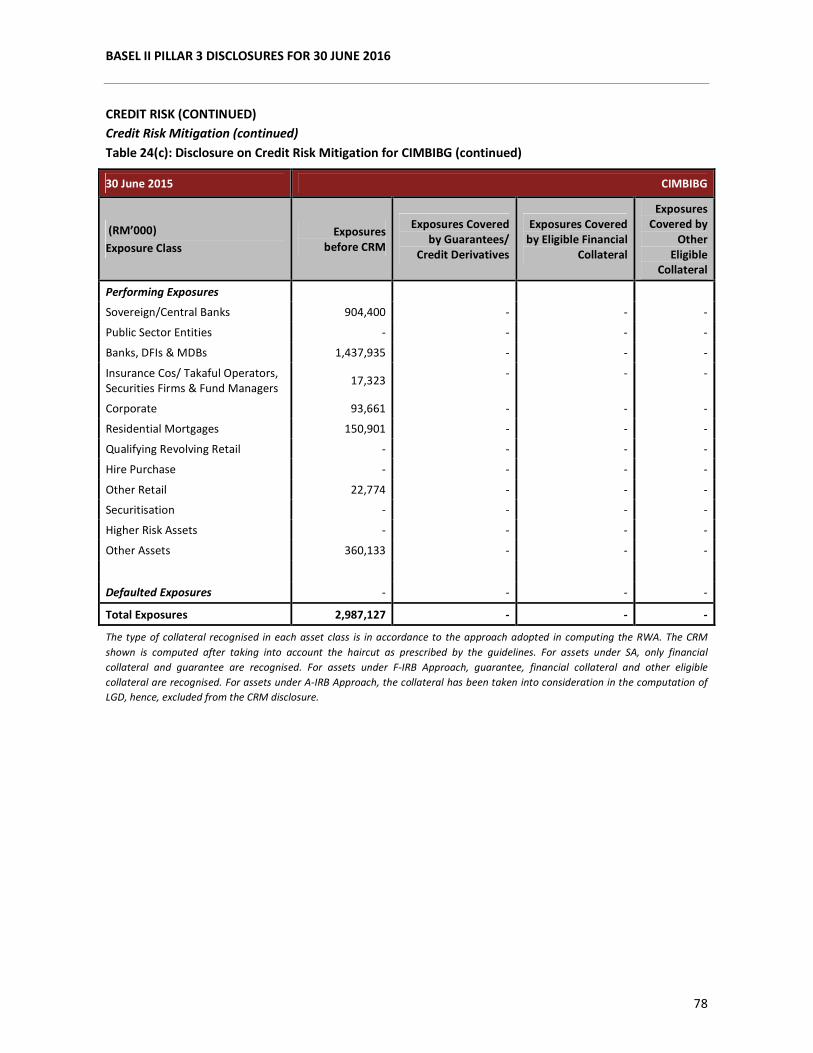
BASEL II PILLAR 3 DISCLOSURES FOR 30 JUNE 2016
78
CREDIT RISK (CONTINUED)
Credit Risk Mitigation (continued)
Table 24(c): Disclosure on Credit Risk Mitigation for CIMBIBG (continued)
30 June 2015 CIMBIBG
(RM’000)
Exposure Class
Exposures
before CRM
Exposures Covered
by Guarantees/
Credit Derivatives
Exposures Covered
by Eligible Financial
Collateral
Exposures
Covered by
Other
Eligible
Collateral
Performing Exposures
Sovereign/Central Banks 904,400 - - -
Public Sector Entities - - - -
Banks, DFIs & MDBs 1,437,935 - - -
Insurance Cos/ Takaful Operators,
Securities Firms & Fund Managers 17,323
- - -
Corporate 93,661 - - -
Residential Mortgages 150,901 - - -
Qualifying Revolving Retail - - - -
Hire Purchase - - - -
Other Retail 22,774 - - -
Securitisation - - - -
Higher Risk Assets - - - -
Other Assets 360,133 - - -
Defaulted Exposures - - - -
Total Exposures 2,987,127 - - -
The type of collateral recognised in each asset class is in accordance to the approach adopted in computing the RWA. The CRM
shown is computed after taking into account the haircut as prescribed by the guidelines. For assets under SA, only financial
collateral and guarantee are recognised. For assets under F-IRB Approach, guarantee, financial collateral and other eligible
collateral are recognised. For assets under A-IRB Approach, the collateral has been taken into consideration in the computation of
LGD, hence, excluded from the CRM disclosure.
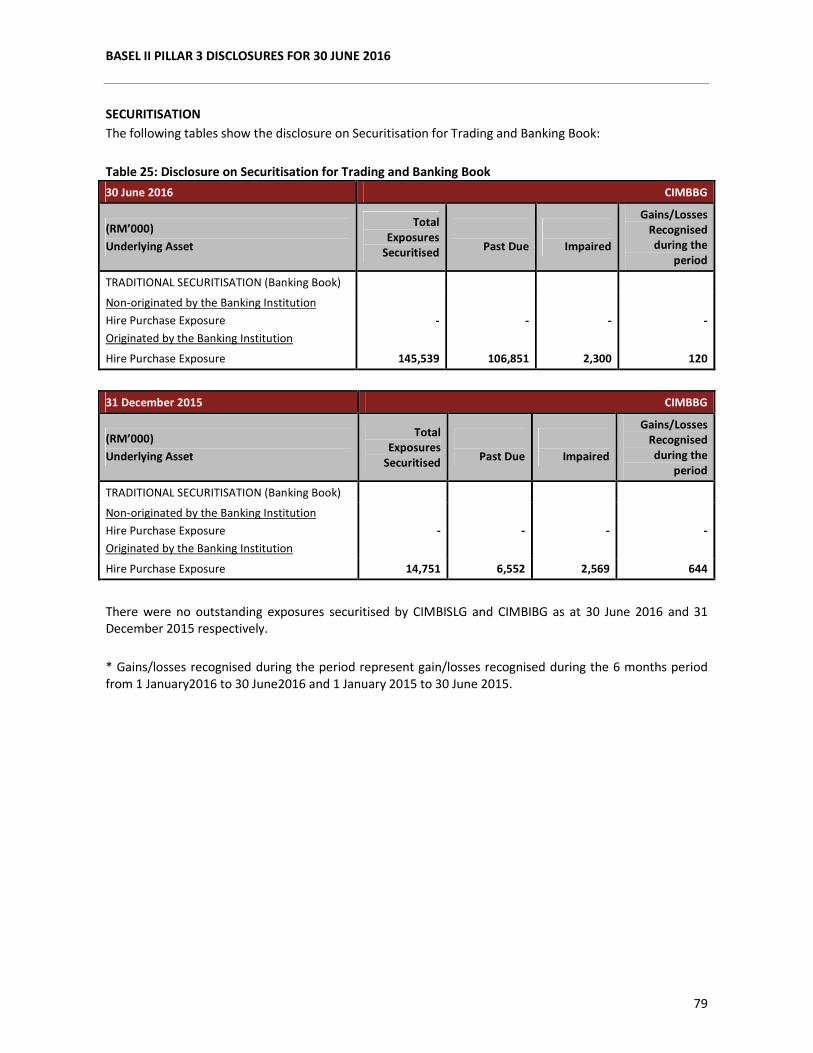
BASEL II PILLAR 3 DISCLOSURES FOR 30 JUNE 2016
79
SECURITISATION
The following tables show the disclosure on Securitisation for Trading and Banking Book:
Table 25: Disclosure on Securitisation for Trading and Banking Book
30 June 2016 CIMBBG
(RM’000)
Underlying Asset
Total
Exposures
Securitised
Past Due
Impaired
Gains/Losses
Recognised
during the
period
TRADITIONAL SECURITISATION (Banking Book)
Non-originated by the Banking Institution
Hire Purchase Exposure
Originated by the Banking Institution
- - - -
Hire Purchase Exposure 145,539 106,851 2,300 120
31 December 2015 CIMBBG
(RM’000)
Underlying Asset
Total
Exposures
Securitised
Past Due
Impaired
Gains/Losses
Recognised
during the
period
TRADITIONAL SECURITISATION (Banking Book)
Non-originated by the Banking Institution
Hire Purchase Exposure
Originated by the Banking Institution
- - - -
Hire Purchase Exposure 14,751 6,552 2,569 644
There were no outstanding exposures securitised by CIMBISLG and CIMBIBG as at 30 June 2016 and 31
December 2015 respectively.
* Gains/losses recognised during the period represent gain/losses recognised during the 6 months period
from 1 January2016 to 30 June2016 and 1 January 2015 to 30 June 2015.
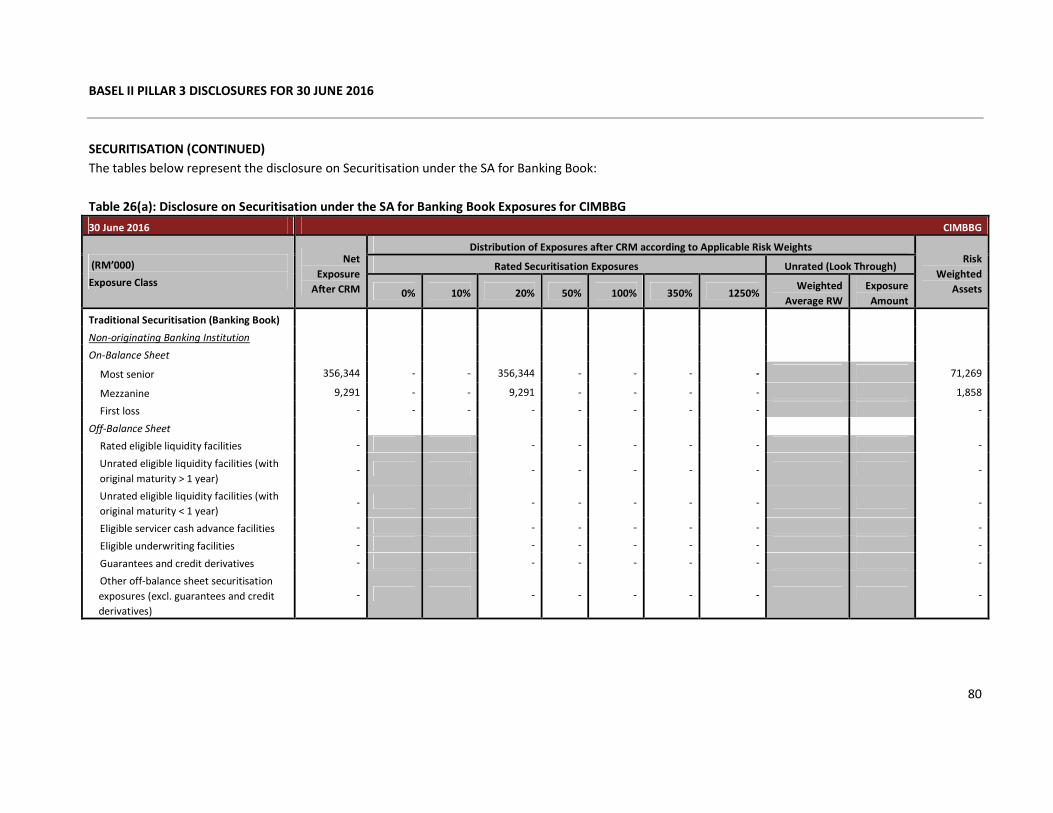
BASEL II PILLAR 3 DISCLOSURES FOR 30 JUNE 2016
80
SECURITISATION (CONTINUED)
The tables below represent the disclosure on Securitisation under the SA for Banking Book:
Table 26(a): Disclosure on Securitisation under the SA for Banking Book Exposures for CIMBBG
30 June 2016 CIMBBG
(RM’000)
Exposure Class
Net
Exposure
After CRM
Distribution of Exposures after CRM according to Applicable Risk Weights Risk
Weighted
Assets
Rated Securitisation Exposures Unrated (Look Through)
0% 10% 20% 50% 100% 350% 1250% Weighted
Average RW
Exposure
Amount
Traditional Securitisation (Banking Book)
Non-originating Banking Institution
On-Balance Sheet
Most senior 356,344 - - 356,344 - - - - 71,269
Mezzanine 9,291 - - 9,291 - - - - 1,858
First loss - - - - - - - - -
Off-Balance Sheet
Rated eligible liquidity facilities - - - - - - -
Unrated eligible liquidity facilities (with
original maturity > 1 year) - - - - - - -
Unrated eligible liquidity facilities (with
original maturity < 1 year) - - - - - - -
Eligible servicer cash advance facilities - - - - - - -
Eligible underwriting facilities - - - - - - -
Guarantees and credit derivatives - - - - - - -
Other off-balance sheet securitisation
exposures (excl. guarantees and credit
derivatives)
- - - - - - -

BASEL II PILLAR 3 DISCLOSURES FOR 30 JUNE 2016
81
SECURITISATION (CONTINUED)
Table 26(a): Disclosure on Securitisation under the SA for Banking Book Exposures for CIMBBG (continued)
30 June 2016 CIMBBG
(RM’000)
Exposure Class
Net
Exposure
After CRM
Distribution of Exposures after CRM according to Applicable Risk Weights
Risk
Weighted
Assets
Rated Securitisation Exposures Unrated (Look Through)
0% 10% 20% 50% 100% 350% 1250% Weighted
Average RW
Exposure
Amount
Originating Banking Institution
On-Balance Sheet
Most senior - - - - - - - - -
Mezzanine - - - - - - - - -
First loss - - - - - - - - -
Off-Balance Sheet
Rated eligible liquidity facilities - - - - - - -
Unrated eligible liquidity facilities (with
original maturity > 1 year) - - - - - - - - -
Unrated eligible liquidity facilities (with
original maturity < 1 year) - - - - - - -
Eligible servicer cash advance facilities - - - - - - -
Eligible underwriting facilities - - - - - - -
Guarantees and credit derivatives - - - - - - -
Other off-balance sheet securitisation
exposures (excl. guarantees and credit
derivatives)
- - - - - - -
Total Exposures 365,636 - - 365,636 - - - - - - 73,127
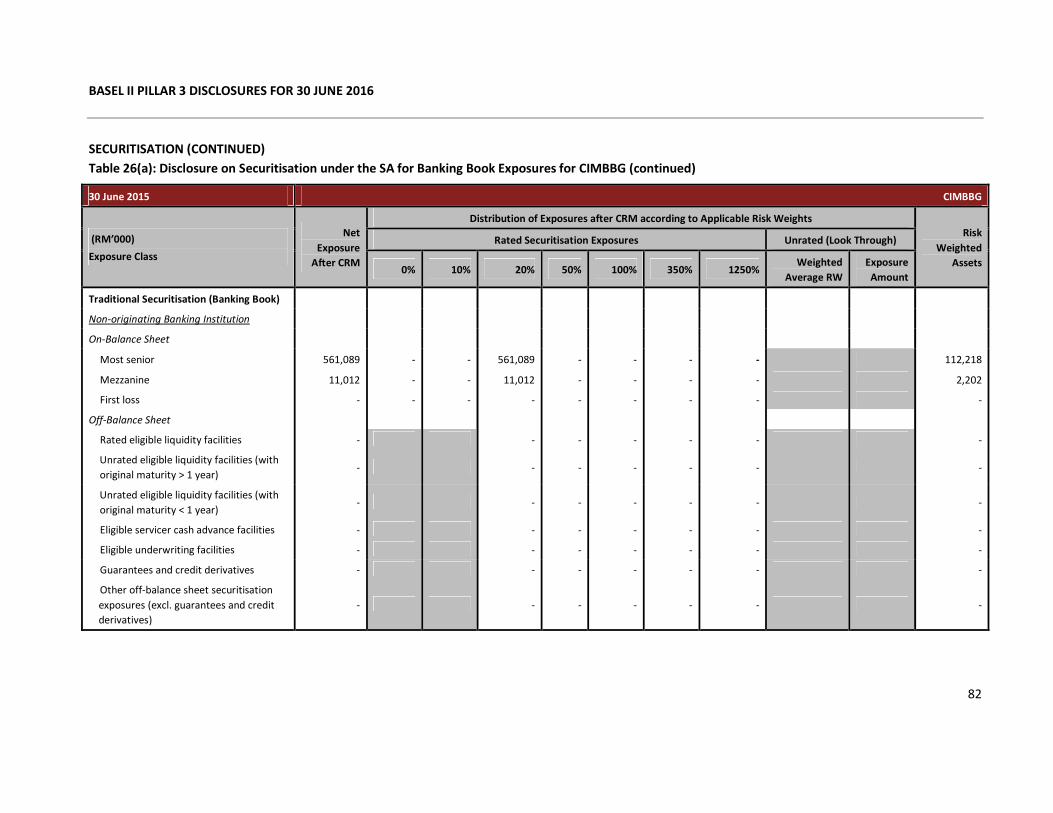
BASEL II PILLAR 3 DISCLOSURES FOR 30 JUNE 2016
82
SECURITISATION (CONTINUED)
Table 26(a): Disclosure on Securitisation under the SA for Banking Book Exposures for CIMBBG (continued)
30 June 2015 CIMBBG
(RM’000)
Exposure Class
Net
Exposure
After CRM
Distribution of Exposures after CRM according to Applicable Risk Weights
Risk
Weighted
Assets
Rated Securitisation Exposures Unrated (Look Through)
0% 10% 20% 50% 100% 350% 1250% Weighted
Average RW
Exposure
Amount
Traditional Securitisation (Banking Book)
Non-originating Banking Institution
On-Balance Sheet
Most senior 561,089 - - 561,089 - - - - 112,218
Mezzanine 11,012 - - 11,012 - - - - 2,202
First loss - - - - - - - - -
Off-Balance Sheet
Rated eligible liquidity facilities - - - - - - -
Unrated eligible liquidity facilities (with
original maturity > 1 year) - - - - - - -
Unrated eligible liquidity facilities (with
original maturity < 1 year) - - - - - - -
Eligible servicer cash advance facilities - - - - - - -
Eligible underwriting facilities - - - - - - -
Guarantees and credit derivatives - - - - - - -
Other off-balance sheet securitisation
exposures (excl. guarantees and credit
derivatives)
- - - - - - -
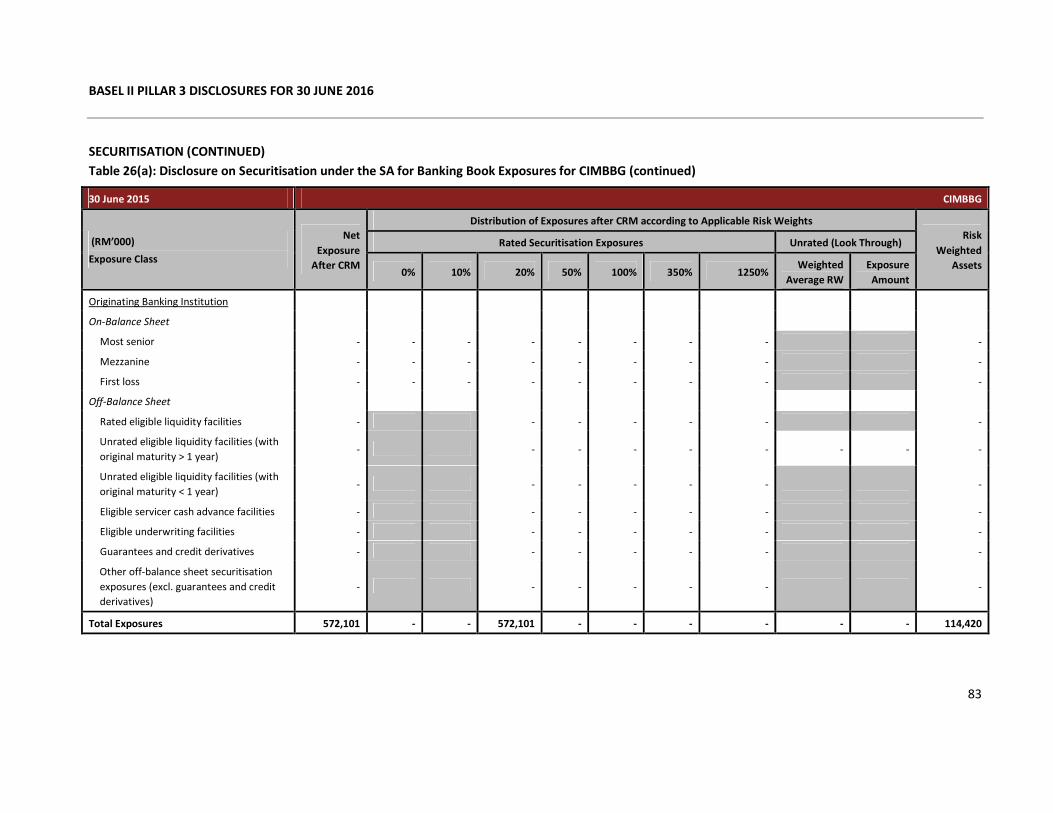
BASEL II PILLAR 3 DISCLOSURES FOR 30 JUNE 2016
83
SECURITISATION (CONTINUED)
Table 26(a): Disclosure on Securitisation under the SA for Banking Book Exposures for CIMBBG (continued)
30 June 2015 CIMBBG
(RM’000)
Exposure Class
Net
Exposure
After CRM
Distribution of Exposures after CRM according to Applicable Risk Weights
Risk
Weighted
Assets
Rated Securitisation Exposures Unrated (Look Through)
0% 10% 20% 50% 100% 350% 1250% Weighted
Average RW
Exposure
Amount
Originating Banking Institution
On-Balance Sheet
Most senior - - - - - - - - -
Mezzanine - - - - - - - - -
First loss - - - - - - - - -
Off-Balance Sheet
Rated eligible liquidity facilities - - - - - - -
Unrated eligible liquidity facilities (with
original maturity > 1 year) - - - - - - - - -
Unrated eligible liquidity facilities (with
original maturity < 1 year) - - - - - - -
Eligible servicer cash advance facilities - - - - - - -
Eligible underwriting facilities - - - - - - -
Guarantees and credit derivatives - - - - - - -
Other off-balance sheet securitisation
exposures (excl. guarantees and credit
derivatives)
- - - - - - -
Total Exposures 572,101 - - 572,101 - - - - - - 114,420
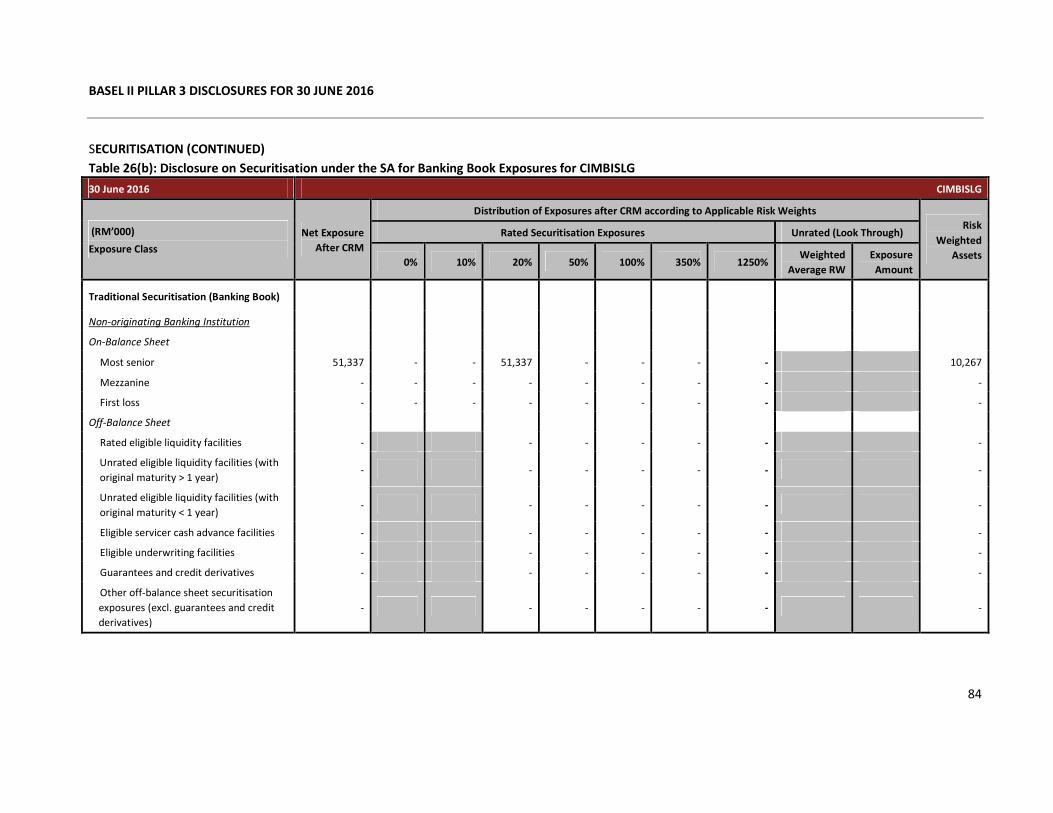
BASEL II PILLAR 3 DISCLOSURES FOR 30 JUNE 2016
84
SECURITISATION (CONTINUED)
Table 26(b): Disclosure on Securitisation under the SA for Banking Book Exposures for CIMBISLG
30 June 2016 CIMBISLG
(RM’000)
Exposure Class
Net Exposure
After CRM
Distribution of Exposures after CRM according to Applicable Risk Weights
Risk
Weighted
Assets
Rated Securitisation Exposures Unrated (Look Through)
0% 10% 20% 50% 100% 350% 1250% Weighted
Average RW
Exposure
Amount
Traditional Securitisation (Banking Book)
Non-originating Banking Institution
On-Balance Sheet
Most senior 51,337 - - 51,337 - - - - 10,267
Mezzanine - - - - - - - - -
First loss - - - - - - - - -
Off-Balance Sheet
Rated eligible liquidity facilities - - - - - - -
Unrated eligible liquidity facilities (with
original maturity > 1 year) - - - - - - -
Unrated eligible liquidity facilities (with
original maturity < 1 year) - - - - - - -
Eligible servicer cash advance facilities - - - - - - -
Eligible underwriting facilities - - - - - - -
Guarantees and credit derivatives - - - - - - -
Other off-balance sheet securitisation
exposures (excl. guarantees and credit
derivatives)
- - - - - - -
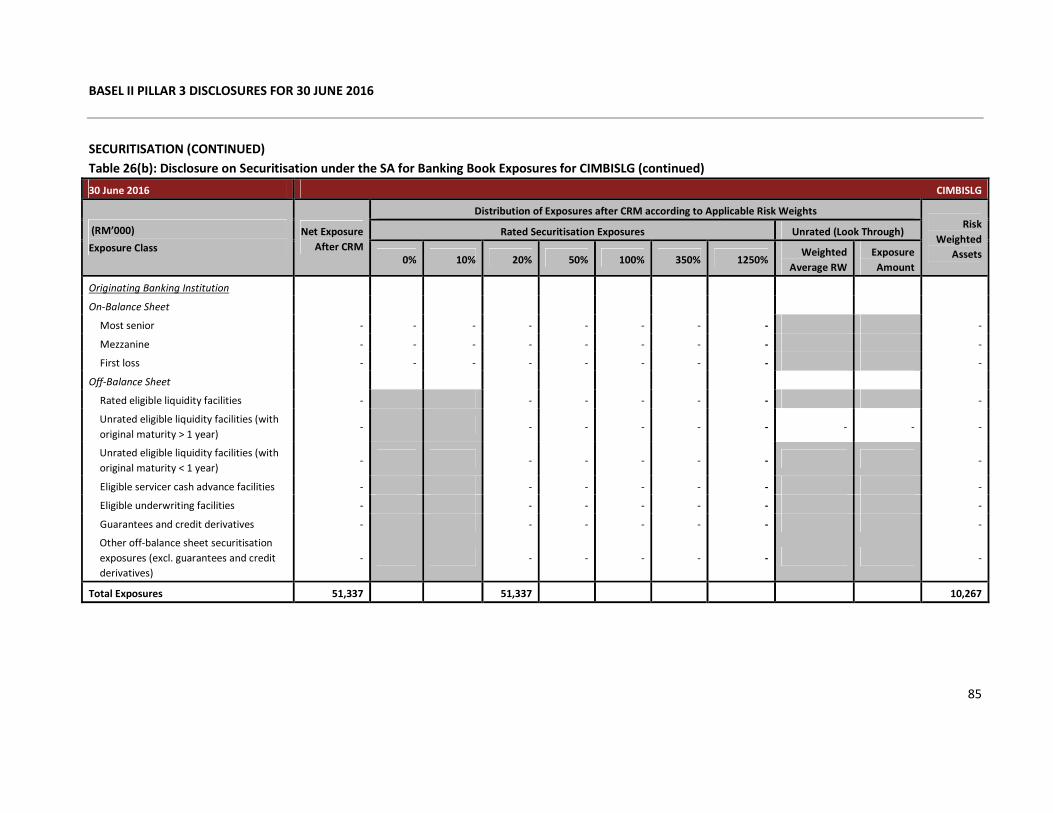
BASEL II PILLAR 3 DISCLOSURES FOR 30 JUNE 2016
85
SECURITISATION (CONTINUED)
Table 26(b): Disclosure on Securitisation under the SA for Banking Book Exposures for CIMBISLG (continued)
30 June 2016 CIMBISLG
(RM’000)
Exposure Class
Net Exposure
After CRM
Distribution of Exposures after CRM according to Applicable Risk Weights
Risk
Weighted
Assets
Rated Securitisation Exposures Unrated (Look Through)
0% 10% 20% 50% 100% 350% 1250% Weighted
Average RW
Exposure
Amount
Originating Banking Institution
On-Balance Sheet
Most senior - - - - - - - - -
Mezzanine - - - - - - - - -
First loss - - - - - - - - -
Off-Balance Sheet
Rated eligible liquidity facilities - - - - - - -
Unrated eligible liquidity facilities (with
original maturity > 1 year) - - - - - - - - -
Unrated eligible liquidity facilities (with
original maturity < 1 year) - - - - - - -
Eligible servicer cash advance facilities - - - - - - -
Eligible underwriting facilities - - - - - - -
Guarantees and credit derivatives - - - - - - -
Other off-balance sheet securitisation
exposures (excl. guarantees and credit
derivatives)
- - - - - - -
Total Exposures 51,337 51,337 10,267
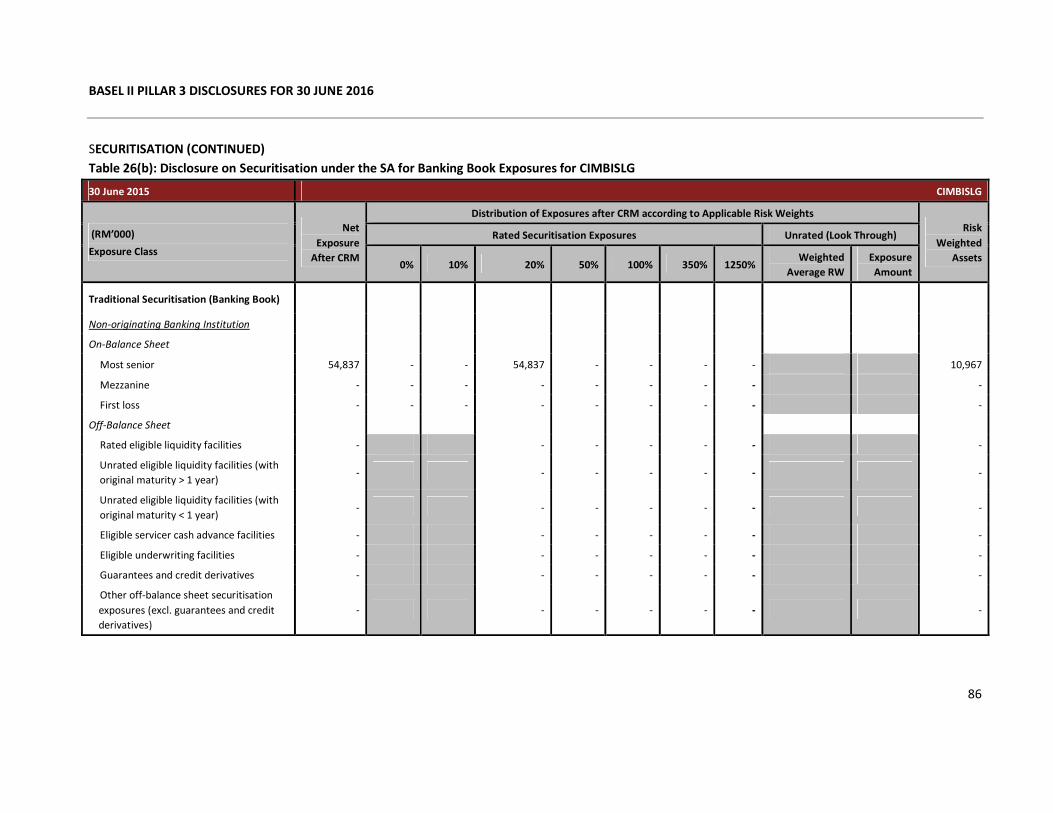
BASEL II PILLAR 3 DISCLOSURES FOR 30 JUNE 2016
86
SECURITISATION (CONTINUED)
Table 26(b): Disclosure on Securitisation under the SA for Banking Book Exposures for CIMBISLG
30 June 2015 CIMBISLG
(RM’000)
Exposure Class
Net
Exposure
After CRM
Distribution of Exposures after CRM according to Applicable Risk Weights
Risk
Weighted
Assets
Rated Securitisation Exposures Unrated (Look Through)
0% 10% 20% 50% 100% 350% 1250% Weighted
Average RW
Exposure
Amount
Traditional Securitisation (Banking Book)
Non-originating Banking Institution
On-Balance Sheet
Most senior 54,837 - - 54,837 - - - - 10,967
Mezzanine - - - - - - - - -
First loss - - - - - - - - -
Off-Balance Sheet
Rated eligible liquidity facilities - - - - - - -
Unrated eligible liquidity facilities (with
original maturity > 1 year) - - - - - - -
Unrated eligible liquidity facilities (with
original maturity < 1 year) - - - - - - -
Eligible servicer cash advance facilities - - - - - - -
Eligible underwriting facilities - - - - - - -
Guarantees and credit derivatives - - - - - - -
Other off-balance sheet securitisation
exposures (excl. guarantees and credit
derivatives)
- - - - - - -
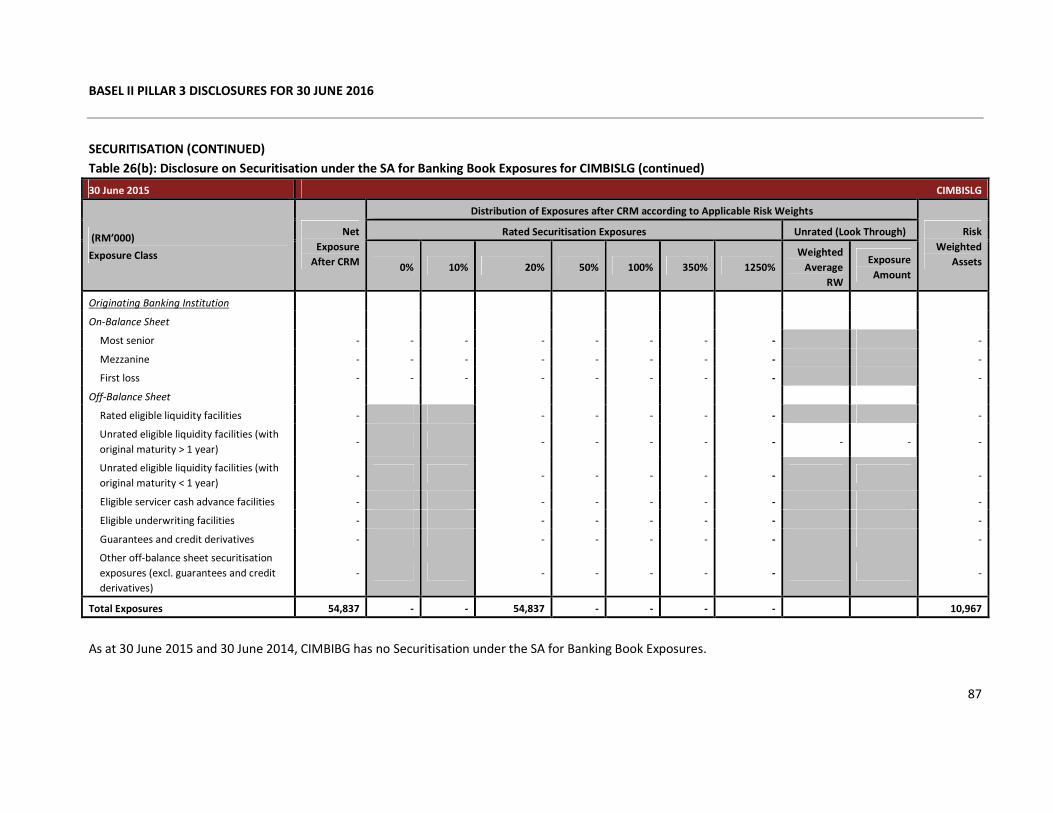
BASEL II PILLAR 3 DISCLOSURES FOR 30 JUNE 2016
87
SECURITISATION (CONTINUED)
Table 26(b): Disclosure on Securitisation under the SA for Banking Book Exposures for CIMBISLG (continued)
30 June 2015 CIMBISLG
(RM’000)
Exposure Class
Net
Exposure
After CRM
Distribution of Exposures after CRM according to Applicable Risk Weights
Risk
Weighted
Assets
Rated Securitisation Exposures Unrated (Look Through)
0% 10% 20% 50% 100% 350% 1250%
Weighted
Average
RW
Exposure
Amount
Originating Banking Institution
On-Balance Sheet
Most senior - - - - - - - - -
Mezzanine - - - - - - - - -
First loss - - - - - - - - -
Off-Balance Sheet
Rated eligible liquidity facilities - - - - - - -
Unrated eligible liquidity facilities (with
original maturity > 1 year) - - - - - - - - -
Unrated eligible liquidity facilities (with
original maturity < 1 year) - - - - - - -
Eligible servicer cash advance facilities - - - - - - -
Eligible underwriting facilities - - - - - - -
Guarantees and credit derivatives - - - - - - -
Other off-balance sheet securitisation
exposures (excl. guarantees and credit
derivatives)
- - - - - - -
Total Exposures 54,837 - - 54,837 - - - - 10,967
As at 30 June 2015 and 30 June 2014, CIMBIBG has no Securitisation under the SA for Banking Book Exposures.
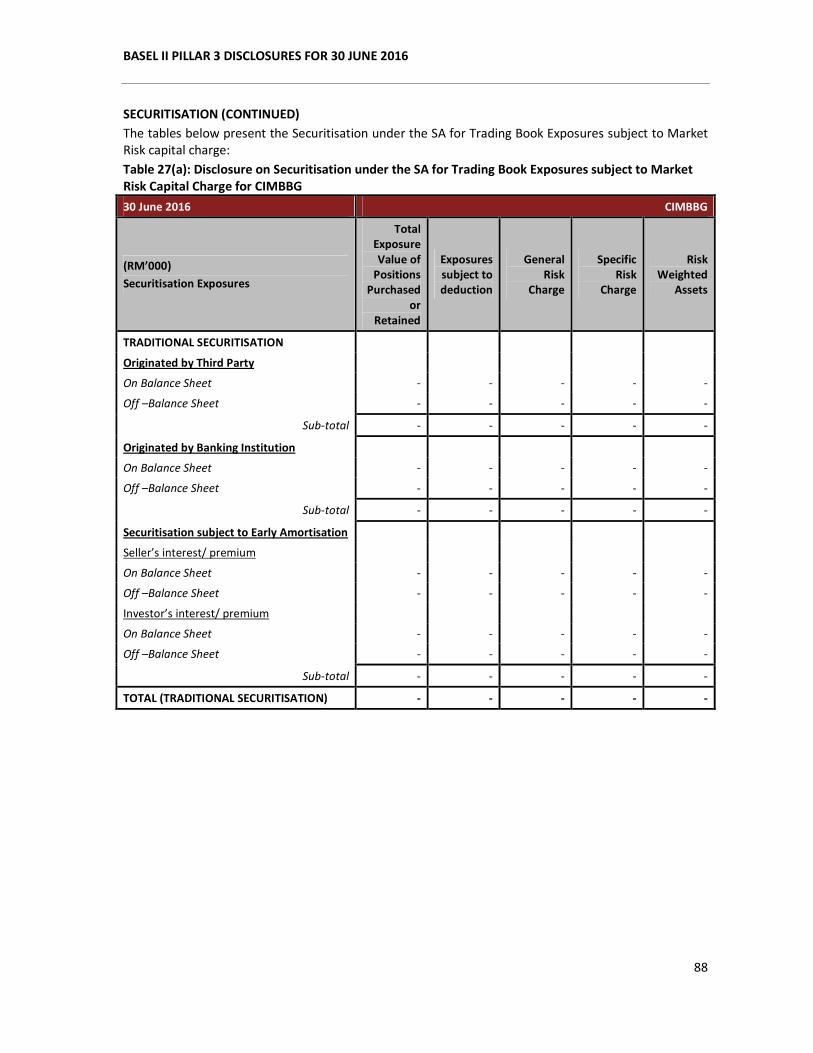
BASEL II PILLAR 3 DISCLOSURES FOR 30 JUNE 2016
88
SECURITISATION (CONTINUED)
The tables below present the Securitisation under the SA for Trading Book Exposures subject to Market
Risk capital charge:
Table 27(a): Disclosure on Securitisation under the SA for Trading Book Exposures subject to Market
Risk Capital Charge for CIMBBG
30 June 2016 CIMBBG
(RM’000)
Securitisation Exposures
Total
Exposure
Value of
Positions
Purchased
or
Retained
Exposures
subject to
deduction
General
Risk
Charge
Specific
Risk
Charge
Risk
Weighted
Assets
TRADITIONAL SECURITISATION
Originated by Third Party
On Balance Sheet - - - - -
Off –Balance Sheet - - - - -
Sub-total - - - - -
Originated by Banking Institution
On Balance Sheet - - - - -
Off –Balance Sheet - - - - -
Sub-total - - - - -
Securitisation subject to Early Amortisation
Seller’s interest/ premium
On Balance Sheet - - - - -
Off –Balance Sheet - - - - -
Investor’s interest/ premium
On Balance Sheet - - - - -
Off –Balance Sheet - - - - -
Sub-total - - - - -
TOTAL (TRADITIONAL SECURITISATION) - - - - -
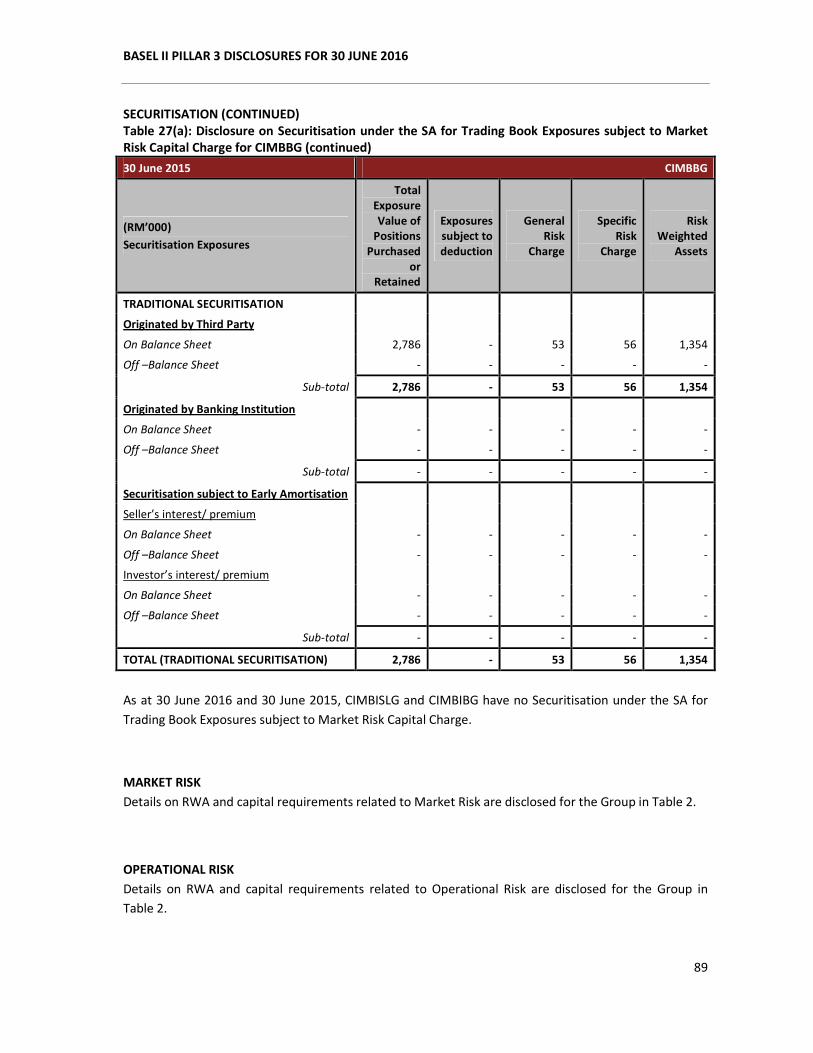
BASEL II PILLAR 3 DISCLOSURES FOR 30 JUNE 2016
89
SECURITISATION (CONTINUED)
Table 27(a): Disclosure on Securitisation under the SA for Trading Book Exposures subject to Market
Risk Capital Charge for CIMBBG (continued)
30 June 2015 CIMBBG
(RM’000)
Securitisation Exposures
Total
Exposure
Value of
Positions
Purchased
or
Retained
Exposures
subject to
deduction
General
Risk
Charge
Specific
Risk
Charge
Risk
Weighted
Assets
TRADITIONAL SECURITISATION
Originated by Third Party
On Balance Sheet 2,786 - 53 56 1,354
Off –Balance Sheet - - - - -
Sub-total 2,786 - 53 56 1,354
Originated by Banking Institution
On Balance Sheet - - - - -
Off –Balance Sheet - - - - -
Sub-total - - - - -
Securitisation subject to Early Amortisation
Seller’s interest/ premium
On Balance Sheet - - - - -
Off –Balance Sheet - - - - -
Investor’s interest/ premium
On Balance Sheet - - - - -
Off –Balance Sheet - - - - -
Sub-total - - - - -
TOTAL (TRADITIONAL SECURITISATION) 2,786 - 53 56 1,354
As at 30 June 2016 and 30 June 2015, CIMBISLG and CIMBIBG have no Securitisation under the SA for
Trading Book Exposures subject to Market Risk Capital Charge.
MARKET RISK
Details on RWA and capital requirements related to Market Risk are disclosed for the Group in Table 2.
OPERATIONAL RISK
Details on RWA and capital requirements related to Operational Risk are disclosed for the Group in
Table 2.
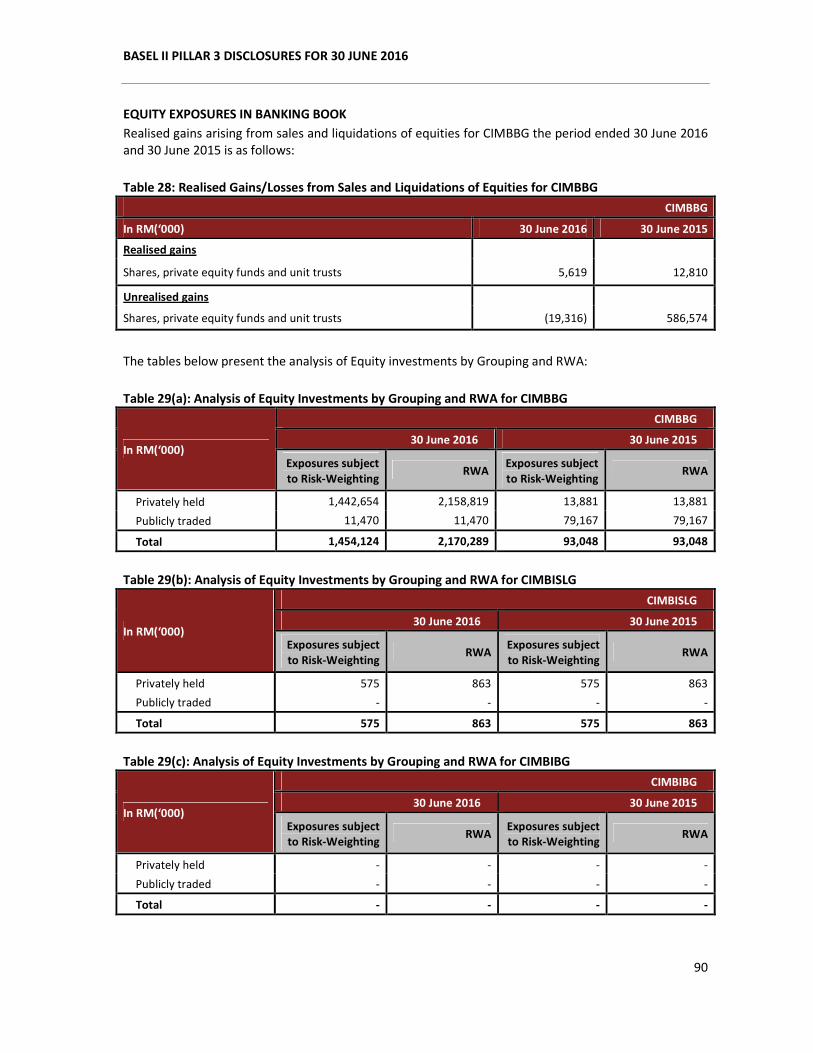
BASEL II PILLAR 3 DISCLOSURES FOR 30 JUNE 2016
90
EQUITY EXPOSURES IN BANKING BOOK
Realised gains arising from sales and liquidations of equities for CIMBBG the period ended 30 June 2016
and 30 June 2015 is as follows:
Table 28: Realised Gains/Losses from Sales and Liquidations of Equities for CIMBBG
CIMBBG
In RM(‘000) 30 June 2016 30 June 2015
Realised gains
Shares, private equity funds and unit trusts 5,619 12,810
Unrealised gains
Shares, private equity funds and unit trusts (19,316) 586,574
The tables below present the analysis of Equity investments by Grouping and RWA:
Table 29(a): Analysis of Equity Investments by Grouping and RWA for CIMBBG
In RM(‘000)
CIMBBG
30 June 2016 30 June 2015
Exposures subject
to Risk-Weighting RWA
Exposures subject
to Risk-Weighting RWA
Privately held 1,442,654 2,158,819 13,881 13,881
Publicly traded 11,470 11,470 79,167 79,167
Total 1,454,124 2,170,289 93,048 93,048
Table 29(b): Analysis of Equity Investments by Grouping and RWA for CIMBISLG
In RM(‘000)
CIMBISLG
30 June 2016 30 June 2015
Exposures subject
to Risk-Weighting RWA
Exposures subject
to Risk-Weighting RWA
Privately held 575 863 575 863
Publicly traded - - - -
Total 575 863 575 863
Table 29(c): Analysis of Equity Investments by Grouping and RWA for CIMBIBG
In RM(‘000)
CIMBIBG
30 June 2016 30 June 2015
Exposures subject
to Risk-Weighting RWA
Exposures subject
to Risk-Weighting RWA
Privately held - - - -
Publicly traded - - - -
Total - - - -
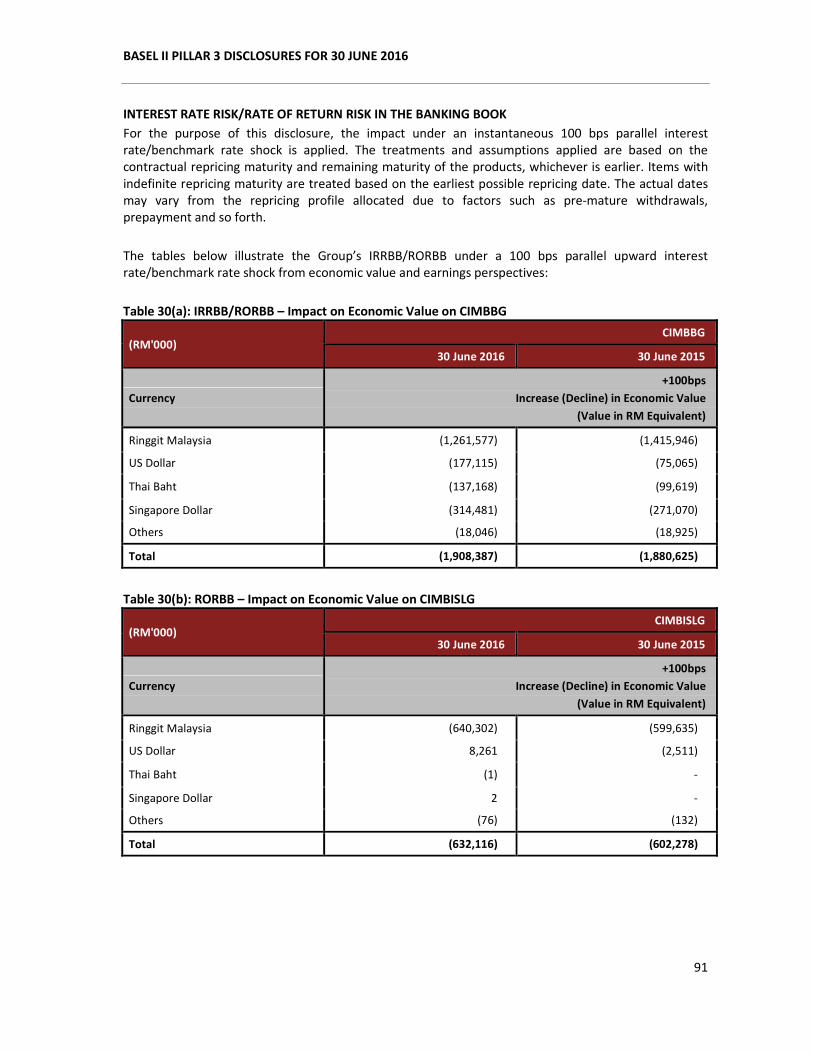
BASEL II PILLAR 3 DISCLOSURES FOR 30 JUNE 2016
91
INTEREST RATE RISK/RATE OF RETURN RISK IN THE BANKING BOOK
For the purpose of this disclosure, the impact under an instantaneous 100 bps parallel interest
rate/benchmark rate shock is applied. The treatments and assumptions applied are based on the
contractual repricing maturity and remaining maturity of the products, whichever is earlier. Items with
indefinite repricing maturity are treated based on the earliest possible repricing date. The actual dates
may vary from the repricing profile allocated due to factors such as pre-mature withdrawals,
prepayment and so forth.
The tables below illustrate the Group’s IRRBB/RORBB under a 100 bps parallel upward interest
rate/benchmark rate shock from economic value and earnings perspectives:
Table 30(a): IRRBB/RORBB – Impact on Economic Value on CIMBBG
(RM'000) CIMBBG
30 June 2016 30 June 2015
Currency
+100bps
Increase (Decline) in Economic Value
(Value in RM Equivalent)
Ringgit Malaysia (1,261,577) (1,415,946)
US Dollar (177,115) (75,065)
Thai Baht (137,168) (99,619)
Singapore Dollar (314,481) (271,070)
Others (18,046) (18,925)
Total (1,908,387) (1,880,625)
Table 30(b): RORBB – Impact on Economic Value on CIMBISLG
(RM'000) CIMBISLG
30 June 2016 30 June 2015
Currency
+100bps
Increase (Decline) in Economic Value
(Value in RM Equivalent)
Ringgit Malaysia (640,302) (599,635)
US Dollar 8,261 (2,511)
Thai Baht (1) -
Singapore Dollar 2 -
Others (76) (132)
Total (632,116) (602,278)
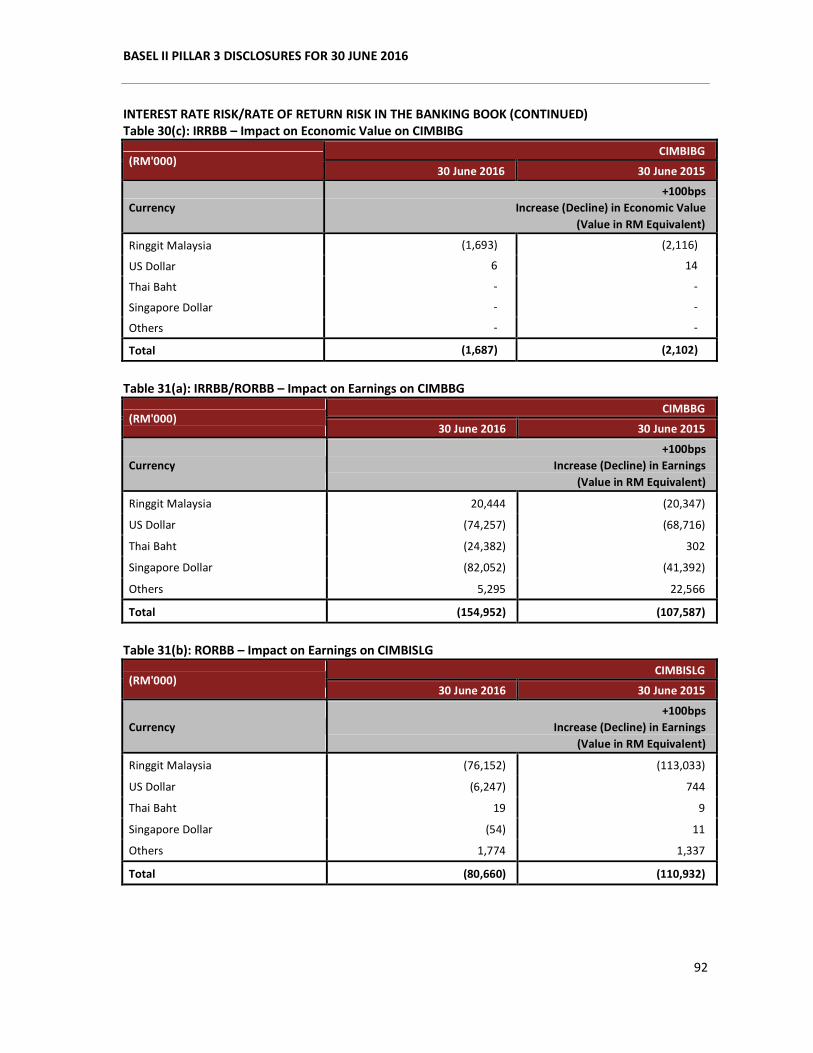
BASEL II PILLAR 3 DISCLOSURES FOR 30 JUNE 2016
92
INTEREST RATE RISK/RATE OF RETURN RISK IN THE BANKING BOOK (CONTINUED)
Table 30(c): IRRBB – Impact on Economic Value on CIMBIBG
(RM'000) CIMBIBG
30 June 2016 30 June 2015
Currency
+100bps
Increase (Decline) in Economic Value
(Value in RM Equivalent)
Ringgit Malaysia (1,693) (2,116)
US Dollar 6 14
Thai Baht - -
Singapore Dollar - -
Others - -
Total (1,687) (2,102)
Table 31(a): IRRBB/RORBB – Impact on Earnings on CIMBBG
(RM'000) CIMBBG
30 June 2016 30 June 2015
Currency
+100bps
Increase (Decline) in Earnings
(Value in RM Equivalent)
Ringgit Malaysia 20,444 (20,347)
US Dollar (74,257) (68,716)
Thai Baht (24,382) 302
Singapore Dollar (82,052) (41,392)
Others 5,295 22,566
Total (154,952) (107,587)
Table 31(b): RORBB – Impact on Earnings on CIMBISLG
(RM'000) CIMBISLG
30 June 2016 30 June 2015
Currency
+100bps
Increase (Decline) in Earnings
(Value in RM Equivalent)
Ringgit Malaysia (76,152) (113,033)
US Dollar (6,247) 744
Thai Baht 19 9
Singapore Dollar (54) 11
Others 1,774 1,337
Total (80,660) (110,932)
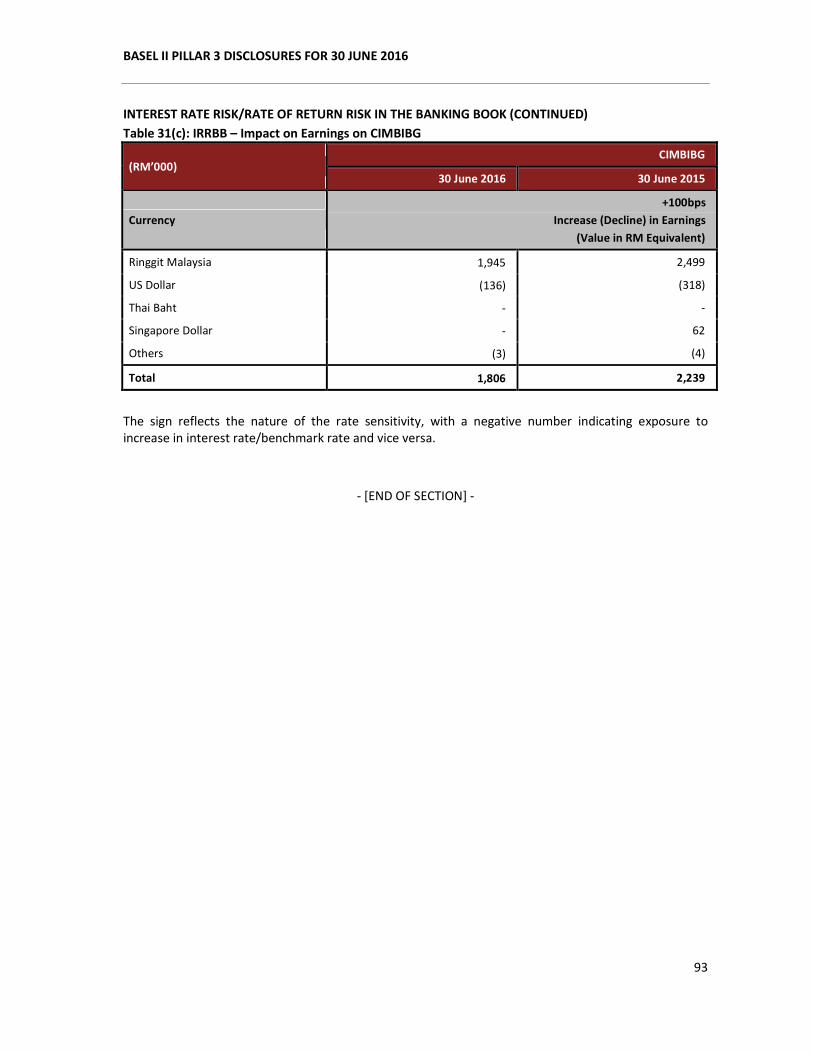
BASEL II PILLAR 3 DISCLOSURES FOR 30 JUNE 2016
93
INTEREST RATE RISK/RATE OF RETURN RISK IN THE BANKING BOOK (CONTINUED)
Table 31(c): IRRBB – Impact on Earnings on CIMBIBG
(RM’000) CIMBIBG
30 June 2016 30 June 2015
Currency
+100bps
Increase (Decline) in Earnings
(Value in RM Equivalent)
Ringgit Malaysia 1,945 2,499
US Dollar (136) (318)
Thai Baht - -
Singapore Dollar - 62
Others (3) (4)
Total 1,806 2,239
The sign reflects the nature of the rate sensitivity, with a negative number indicating exposure to
increase in interest rate/benchmark rate and vice versa.
- [END OF SECTION] -