Embed Size (px)
Citation preview

Basel II capital requirements for structuredcredit products and economic capital: a
comparative analysis
Luca Giaccherini∗, Giovanni Pepe†
September 2007(first draft August 2007)‡
Abstract
The huge development experienced by the market for structured creditproducts has occurred under a banks’ capital adequacy regime inadequateto deal with the complexity of these instruments. The new prudential frame-work (Basel II) contains a specific section devoted to the treatment of tranchedproducts, that put much store on public ratings. In this paper we try to eval-uate the reliability of the new rules, comparing the forthcoming charges forstructured products with an estimate of their risk. The analysis has been per-formed on the tranches of the iTraxx index, chosen as a proxy of CDOs builton corporate exposures. The results obtained cast some doubts about the ac-tual degree of conservatism of the choice to map from ratings to prudentialcharges.
Keywords: CDO, economic capital, regulatory capital, Value at Risk.
1 Introduction
For a long time the great success obtained by tranched securities has been regardedas a remarkable example of the capital arbitrage strategies flourished under theprevious version of the Basel Accord: a system of risk weights based on notionalamount of investments has proven to be a strong incentive for banks to reduce thecapital requirements without shedding a proportional amount of risk. In order tocurb this incentive the new regulatory treatment of structured credit products hasbeen designed along the principles of:
∗Banca d’Italia, Banking Supervision Department. E-mail: [email protected]†Banca d’Italia, Banking Supervision Department. E-mail: [email protected]‡The view expressed in the study are those of the authors and do not involve the responsibility of
the institution to which they belong.
1
• Capital neutrality
• Economic capital centrality
Capital neutrality implies that the amount of regulatory charges should be invariantto the decision to hold assets on the balance sheet or to securitize it; in addition,the prudential rules should align more closely regulatory and economic capital.
Under the new regulatory treatment of structured credit products internal riskestimates will not play a big role for prudential purposes, as regulators preferred tolink capital charges to public ratings, even for banks allowed to determine on theirown the prudential charges of traditional credit exposures (so-called IRB banks).
For IRB banks two alternative approaches have been introduced, dependingon the existence of a public rating for the structured credit product: should a rat-ing exist, the tranche capital charge comes from a coefficient to be applied to thenotional exposure (Rating Based Approach, RBA); for unrated products, instead,IRB banks must provide their internal estimate of probability of default (PD) andrecovery rate (LGD) for the underlying assets, as an input of a regulatory formulaset by regulators (Supervisory Formula Approach, SFA).
A number of studies has compared RBA and SFA approaches over a range ofstructured credit products [2]. It turned out that there is a clear capital advantagein using the RBA; this evidence could create an incentive for IRB banks to ob-tain an external assessment for transactions that otherwise wouldn’t be rated. Themagnitude of such a phenomenon should increase if the RBA charges were foundinadequate to fully cover the risk of these products.
This paper investigates the coherence between the economic capital absorbedby structured products and their regulatory treatment, focusing on iTraxx tranches,a stylized and actively traded version of ”corporate CDOs”, that can represent auseful boot camp for the forthcoming prudential regulation.
The paper is organized as follows: section 2 introduces synthetic CDOs, section3 provides an overview of the new prudential rules for tranched products, sections4 and 5 describe the methodologies used to obtain an estimate of the tranches’ risk-iness, section 6 illustrates a comparison between economic capital and prudentialrequirements whose results are sketched in section 7; the final section reports ourconclusions.
2 Single-Tranche CDOs
Collateralised Debt Obligations (CDOs) could be defined as fixed income securi-ties originated by engineering the risk of a portfolio of credit instruments. Mixingsecuritisation and credit derivative techniques, these products are used to transferthe risks arising from a portfolio of corporate exposures (bonds, loans or the like)or a pool of securitized retail credits conveyed by a collection of Asset Backed Se-curities. The former transactions are usually termed as ”corporate CDOs”, while
2
the latter are known as ”CDO of ABS”1.The original scheme of corporate CDOs has experienced continuous innova-
tion from its appearance at the beginning of ’90s; along this path of evolution theuse of credit derivatives to transfer the risk of the underlying portfolio has been astructural break-trough, which gave life to a class of product on its own: ”syntheticCDOs”.
In the traditional version of synthetic CDOs, a special-purpose vehicle (”SPV”)sells protection on an underlying pool by synthetically referencing a portfolio ofsingle-name credit default swaps (”CDS”), each referred to a specific company.The SPV offsets the risk by issuing notes that provide investors with exposure todifferent ”tranches” of the underlying reference portfolio.
Investors pay up-front the tranche’s notional amount and receive a recurringpremium for selling protection on the reference pool via the SPV. If one or moredefaults occur in the portfolio, the SPV will refund the swap counterparts for thelosses incurred on the defaulted assets using investors’ money.
A priority scheme governs the loss absorbtion: each tranche starts to suffer areduction of its notional amount when losses in the portfolio breach the tranche’sattachment point (Lb), expressed as a percentage of the total pool notional. Theinvestment will be wiped out should portfolio losses reach the tranche’s detachmentpoint (Hb). The thickness of each tranche is defined by the difference between Hb
and Lb.The first tranche to suffer losses is usually termed as the ”equity”, whose
Lb = 0; next comes the ”mezzanine”, and then one or more ”senior” tranches.Usually the credit enhacement enjoyed by a tranche does not depend only on itsposition in the capital structure, as the contractual rules that govern the allocation ofportfolio’s cash-flows (”cash-flow waterfall”) tend to relax the strict prioritizationscheme given by the sequence of Lb and Hb values.
Nevertheless, the distinctive feature of all CDOs is that the sequential allocationof portfolio losses along the tranches concentrates much of the pool credit riskin the equity and mezzanine tranches, often referenced as ”leveraged” products;senior tranches, instead, allow investors to get a ”deleveraged” exposure to thepool’s credit risk.
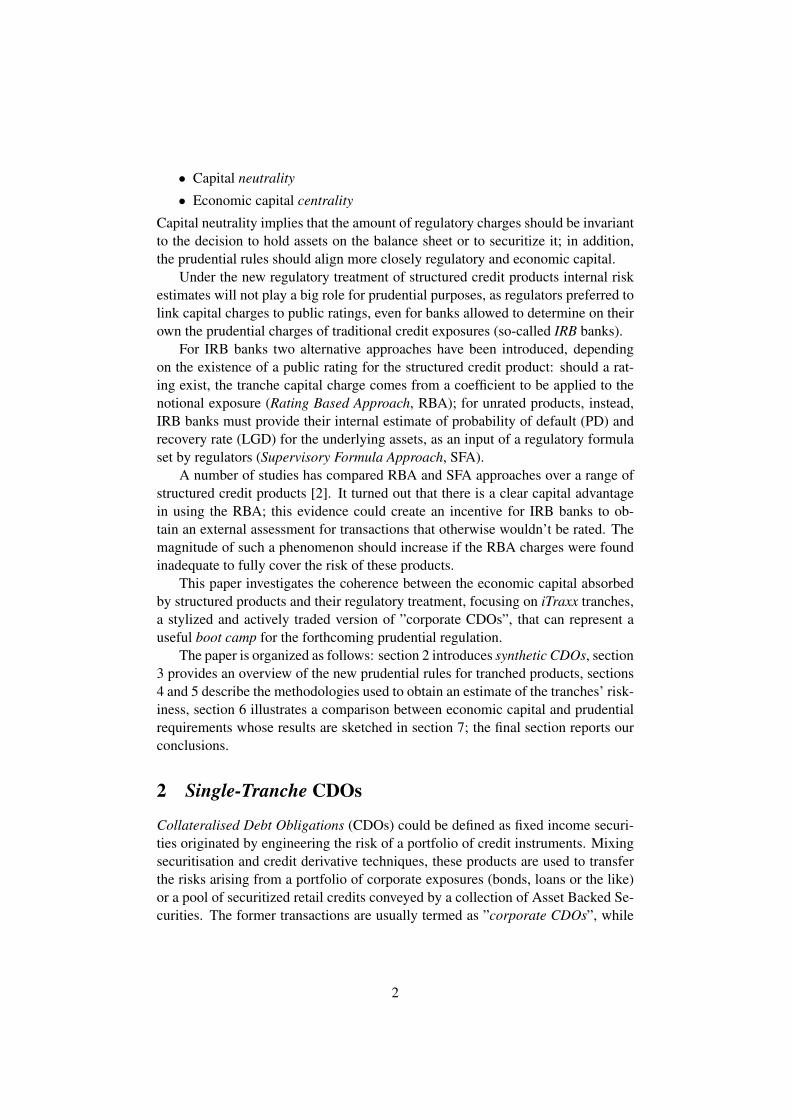
The appearance of CDS indexes (basically portfolios of single-name credit de-fault swaps) and the rapid development of default swaps referred to these portfo-lios, so-called index swaps, set the ground for the quotation by major investmentbanks of a bilateral derivative agreement whose mechanics mimics that of a realCDO: ”Single-Tranche CDOs”.
The great success achieved by this product, basically a standardized version ofCDOs contracts, has contributed to complete the market for credit risk, by allow-ing the emergence of a market for default correlation between the most important
1Although corporate exposures and ABS can be viewed as the most popular form of CDOs’collateral, many other assets have been used as underlying of these transactions comprising projectfinancing loans, private equity exposures, as well as other CDOs.
3

Figure 1: Single tranche CDOs.
corporations worldwide.Nowdays many investment banks operate as licensed delears of this product
quoting the four standard tranches of the Dow Jones indexes that equally weightthe 125 most liquid CDS referred to top European investment grade companies(iTraxx) and their American counterparties (CDX.IG)2.
In both cases most trades regard the index series that comprise CDS whosematurity is of 3, 5 and 7 years, with very tight bid-ask spreads for the ”on the run”series (lower than 1 bp per annum).
While in traditional CDOs there is a clear distinction between the arranger andthe investor, in this contract the difference is blurred, as it is possible to assumeeither short or long positions. Investment banks acting as market makers standready to buy protection from the ”protection sellers” and sell it to the ”protectionbuyers”.
Who enters into the deal as a protection seller is entitled to receive a quarterlyagreed spread from the counterpart that, as the buyer of protection, will pay therecovery-adjusted amount upon default of a name in the pool, once losses havebreached the tranche’s Lb.
If we look to the investor position, i.e. the seller of protection, we can isolatethree different sources of risk: one arising from changes of credit spreads on theunderlying portfolio (”market risk”); another linked to the eventual default of oneor more firms in the pool (”default risk”); the last one emerging from changes in
2A complete description of the rules governing the composition of both the iTraxx and CDX.IGindexes can be found at www.indexco.com, while the templates of the documentation used for tradingboth indexes and their tranches are available at www.markit.com
4

the level of expected correlation between defaults (”correlation risk”). The samerisks are faced by the buyer of protection, unless she had a long position on theunderlying portfolio and is able to place the entire capital structure (i.e. all CDO’stranches).
Both the seller and the buyer of protection can immunize themselves, by man-aging a hedge portfolio which will leave them exposed just to model and liquidityrisks. The simplest risk to hedge away is the market risk, which requires buyingprotection (for the protection seller) in CDS referenced to each company in thepool, or in the swap referenced to the index as a whole.
In both cases, the amount of protection traded is a multiple (the ”delta”) of thetranches notional value and is calculated using the CDO’s pricing model. Being ahedge ratio, the delta represents the sensitivity of the tranche value to a shift of thereference portfolio credit spreads and therefore can be interpreted as a measure ofthe leverage / deleverage of the transaction3.
3 Regulatory treatment
One of the most important objective of the new prudential framework was to ad-dress the capital arbitrage strategies that flourished under the 1988 Basel I CapitalAccord, often based on the use of structured credit products.
A comprehensive policy regarding this class of products is provided in a spe-cific section (Securitisation Framework) of the new Basel Accord. The Securi-tisation Framework contemplates a range of methods for banks to determine theregulatory capital charges of structured credit products, depending on whether thebank will implement the Internal Rating Based approach or the standardized onefor the underlying exposures4.
In both cases the regulators put great store on the evaluations released by ratingagencies, recognising the crucial role played by these institutions in the marketfor structured credit products, mainly due to the complex characteristic of manyproducts.
Under the standardized approach the capital charges are linked to the security’sexternal credit rating by a set of weights to be applied to the notional exposure(table 2). For unrated positions banks must hold one unit of capital for each unitof exposure (known as a ”dollar-by-dollar” capital charge), being a strong capitaldisincentive against holding unrated products.
Capital charges for IRB banks depend on whether the position held has a creditrating from a recognized credit rating agency:
3These hedging positions are frequently reported as one of the most important source of thebooming growth recently experienced by credit derivatives’ volume. It is worth to notice that theactual performance of these hedging strategies relies mainly on the stability of the parameters thatgovern the hedge ratio quantification; as example, the extreme movements experienced by defaultcorrelation during market turmoils have been disruptive for these strategies.
4Under the Internal Rating Based (IRB) approach, banks are allowed to calculate the prudentialcharges for credit exposures, according to the results of their rating system.
5
• For all tranches with a credit rating, IRB banks must use what is known asthe Rating Based Approach (RBA). Primarily targeted to banks that invest ina securitization they did not originate, RBA maps from the tranche’s externalrating to its capital charge via a specific look-up table (table 3). The weightsfor tranches of a given rating vary according to the tranche seniority and thepool granularity5. Further, if a tranche is the most senior in its structure andenjoys an investment grade rating, it attracts a lower risk weight than thebase case, as long its underlying pool is perceived to be sufficiently granular(N > 6).
• For unrated exposures, IRB banks must use a bottom up approach in whicha set of parameters related to the pool credit quality and to the contractualterms governing the cash flow waterfall are plugged into the SupervisoryFormula, SFA. The formula, conceived for banks that act as originators ofa securitization, depends on five inputs of which only one reflects banks’internal estimates (the Kirb, which is the capital charge that the bank wouldface if the exposures had been retained on balance sheet).
Decisions about the levels of structured credit product capital charges gener-ated by the RBA and SFA approaches have been strongly influenced by studiesperformed by analysts at the Federal Reserve Board and the Bank of England.
Peretyatkin and Perraudin [11] examined the robustness of RBA weights on aportfolio of stilyzed tranched products, checking the impact of different maturities,granularity and default correlation; for this purpose they developed a Monte Carlomodel aimed to calculate the marginal Value at Risk of tranches of stilyzed dealsheld into a well diversified portfolio.
Gordy and Jones [6] provided the financial engineering background to the SFA,devising a model (Uncertainty in Loss Prioritization) that smooths the step func-tion for capital charges that comes out when one employs a strict prioritization ruleto allocate the underlying’s capital charge along the tranches of a structured creditproduct.
Supervisory formula approachThe supervisory formula has been designed in order to allocate the capital requirement ofa given portfolio (Kirb) along the tranches of a structured credit product built on this poolof assets. As it is not practical for regulators to take into account the myriad possible deal-specific features of each product, the formula was developed on a limited set of informationregarding the cash-flow waterfall.
5A pool is said to be highly granular if it contains a large number of exposures, none of whichcontributes a large part of the total risk. As a measure of granularity it is used the statistic:
N =(∑
EADi)2
∑EADi
where EAD denotes the exposure at default of the ith exposure in the pool
6

Pykthin and Dev [8], [9] tried to summarize the waterfall for a particular tranche interms of its thickness T and credit enhancement level ζ6. They assumed the allocationof the pool’s economic losses to be governed deterministically, according to a strict lossprioritization rule (SLP).
Let ζ denote the tranche’s credit enhancement level and T its thickness (both valueseasily observable for a market participant), under the SLP rule the tranche absorbs poollosses only in excess of ζ, up to a maximum of T ; that is, if L denotes pool losses, then theloss for the tranche can be defined as min[L, ζ + T ]−min[L, ζ].
Notwithstanding its simplicity, the SLP approach brings an unsatisfactory knife-edgeproperty when used to determine capital requirements: for an infinitely grained pool, thecapital requirement for a tranche is dollar by dollar if ζ + T is less or equal to Kirb andzero thereafter7.
Gordy and Jones [6] generalized the SLP approach by adding a stochastic elementto the distribution of losses across tranches in order to address the uncertainty about thetrue characteristics of the cash-flow waterfall. In doing this they assumed that the creditenhancement ζi represents the ex-ante expected protection against losses in the pool, whilethe actual protection provided by the waterfall is randomly determinated (they indicatedwith Z(ζi) - where Z is a random variable - the unknown level of credit enhancement) andknown only at the horizon.
Based on this intuition they derived a model, called Uncertainty in Loss Prioritisation(ULP), which has been proven suitable for regulatory purposes.
The supervisory formula is indeed based on an approximation of the ULP along withsome ”supervisory overrides”, like a dollar for dollar capital requirements for trancheswhose credit enhancement fall short of Kirb, and an imposed floor level for most seniorpositions8.
4 The conditional loss distributionFrom the protection seller’s perspective the value of a single tranche CDO is simply thedifference between the discounted value at time t0 of the spread payments she expects to
6The thickness Ti is defined as the ratio between the i-th tranche notional Ci and that of theunderlying portfolio, Ti = Ci/ΣCi; the credit enhancement ζ is defined as the sum of the notionalvalues of all more-junior tranches.
7To have an idea about the unsatisfactoriness of this ”twice” allocation, one can just consider thatthe subordinated tranches are tipically entitled to some cash payouts prior to more senior investorsbeing paid out in full and hence do not deserve such a harsh treatment.
8To compute the capital charge via SFA we need to solve a function on the following sevenparameters:
• Kirb
• n: number of names on the pool
• LGD: exposure-weighted loss given default of the pool
• ζ: tranche’s credit enhancement
• T : tranche’s thickness
• τ : parameter that sets the level of uncertainty capital allocation between the tranches (fixedby regulators );
• γ: parameter that governs the LGD distribution.
7

receive (fee leg), and the present value at time t0 of the sum due when defaults affect thetranche (contingent leg):
V alue(t0) = MtM(t0) = fee(t0)− contingent(t0) (1)
The key input to evaluate both the fee and the contingent leg is the expected loss of theunderlying pool, which reflects the probability distribution of losses in the pool.
The market standard approach to generate the portfolio’s loss distribution relies onthe so-called One Factor Gaussian Copula Model based upon Vasicek’s model [13]. Toderive the portfolio loss distribution the normal copula is typically implemented usingeither Monte Carlo simulation or quasi-analytical methods, as that described by Gibson[4].
Under the One Factor Gaussian Copula Model9 we assume that a company defaultswhen the value of its assets (Ai) decreases below a threshold (α); in this conceptual frame-ork α could be thought to represent the level of the firm’s debt.
In the simplest version of the Merton approach [10] the evolution of the firm’s assetsis driven by a systematic factor X, that can be interpreted as a proxy of the general state ofeconomy, and a idiosyncratic component εi
Ai = wiX +√
1− w2i εi (2)
where X and εi are supposed to be uncorrelated standard normal variables (X ∼ N(0, 1),εi ∼ N(0, 1) and E[Xεi] = 0).
If we further assume uncorrelation (E[εiεj = 0]) between the idiosyncratic com-ponents and common dependence of all firms in the portfolio to the state of economy(wi = w), the pairwise ”default time correlation” between company i and j is equal to thesquare of the factor loading:
ρij = E[AiAj ] = w2 (3)
Given the default probability of the company i-th from (2) we can then recognize the thresh-old α as:
Ai = wX +√
1− w2εi < α ≡ Φ(PDi(t))
As for every other credit-related security, a critical choice regards the probability mea-sure to use: risk neutral or objective probabilities of default. If one is interested in pricing,modelling under the risk neutral measure is a natural choice; when estimating the capitalabsorbed by an investment, one could instead adopt an actuarial-like approach choosinghistorical probabilities.
Starting from both risk neutral and real world default probabilities, we can get theconditional default probability for the i-th exposure, given X, as:
qi(t|X = x) = Φ(
Φ−1(PDi(t))−√ρx√1− ρ
)(4)
Next we derive the entire default distribution of the pool from the conditional defaultprobabilities of its components. The computation of the distribution appears simpler ifwe recall that under the common dependence hypothesis (3) the defaults are independent,conditional to the realizations of the systematic factor X .
9The One Factor Gaussian Copula Model could be considered as an extension at a portfolio levelof the ”Merton approach” for evaluating the debt of a firm based on the option pricing theory.
8

An easy way to compute the entire default distribution p(l, t) is to implement the iter-ative algorithm proposed by Andersen, Basu and Sidenius [12].
Let pk(l, t|X) to denote the conditional probability to observe exactly l defaults at timet in a portfolio containing k credit exposures. If we know the entire distribution pk(l, t|X)(for l = 0, . . . , k), using the following iteration we get the default distribution for a k + 1portfolio:
pk+1(0, t|X) = pk(0, t|X)(1− qk+1(t|X))pk+1(l, t|X) = pk(l, t|X)(1− qk+1(t|X)) + pk(l − 1, t|X)qk+1(t|X)
pk+1(k + 1, t|X) = pk(l, t|X)qk+1(t|X) (5)
where qk+1(t|X) is the default probability of the k+1 exposure added to the k-portfolio.Starting from the degenerate default distribution for k = 0, p0(0, t|X) = 1, we can
then use the recursion (5) to solve for the default distribution of the reference portfolio ofN credits:
pN (l, t|X)l = 0, ..., N (6)
Once we have the conditional default distribution, the unconditional default distribu-tion p(l, T ) can be solved as10:
p(l, t) =∫ ∞
−∞pN (l, t|X)g(X)dX (7)
where g is the probability density of X. The integral is solved numerically.Obtained the distribution of defaults we need to move on to the distribution of portfolio
losses. To reduce the computational burden of this step some simplificative assumptionsabout the risk drivers are usually accepted.
A popular approach, so-called Large Homogeneous Pool (LHP), assumes that the port-folio exposures are homogeneous in terms of probability of default (PDi = PD) and re-covery rate (Ri = R); in addition it is assumed that the pool is composed by an infinitenumber of counterparties, all sharing the same weight (Ai = A). A more realistic versionof LHP, known as Homogeneous pool, is broadly used by market participants to get a quickestimate of tranches prices. The Homogenous pool diverges from the LHP with respect tothe number of counterparties, assumed equal to the true number of companies in the port-folio, while shares the assumptions about the common value of default probability (equalto the one obtained by the quoted index spread) and recovery rate, conventionally fixed at40%11.
From a risk management perspective, like that adopted in this paper, the so-calledHeterogenous Pool [1] approach looks more desirable as it relaxes the strong assumptionregarding the common value of firms’ default probability, allowing us to take into accountthe dispersion between the CDS spreads of the 125 portfolio companies.
It is worth noting that the shape of the portfolio loss distribution depends largely onthe strong assumption about defaults interdependence. In the framework so far describedthe uniform pairwise correlation impacts on the individual conditional default probability(4) and, by (5), affects the entire distribution, influencing the allocation of the risk alongthe capital structures (see section 7).
10To simplify the notation there on we omitted the suffix N11The 40% recovery rate is thought to be coherent with the historical rate observed on the US
unsecured bond market.
9

As the risk of different tranches varies with default time correlation so does their fairvalues: default correlation is indeed the most important parameter for Single-Tranche pric-ing, as highlighted by the market practice to quote the tranche’s implied correlation ratherthan its fair spread12.
4.1 The pricing modelLet fL(c, t) be the density of the cumulative portfolio loss13 at time t. Given fL(.) we cancompute the expected loss for a given tranche in a risk neutral world as:
EQt [CL(t)] =
∫ Hb
Lb
(c− Lb)fL(c, t)dc (8)
Provided that the index components share the same notional amount and hold for true theassumption of constant recovery rate across the pool, it is easy to see that the loss distri-bution will assume discrete values: let N denote the exposures comprised in the referenceportfolio, the loss distribution will assume N+1 values (from 0 to N defaults).
The (8) will then reduce to14:
Et[L] =N∑
l=0
p(l, t)max(min(lA(1−R),Hb)− Lb, 0) (9)
where p(l, t) is the probability to get l defaults by time t computed by (7) and N is thenumber of single name CDS composing the underlying portfolio.
The settlement convention to pay the contingent at the payment dates following thedefault further simplifies the pricing, as it allows us to determine the expected loss only ona quarterly basis.
From (9) the expected value of the payments due in case of defaults will be equal to
contingent =n∑
t=1
Dt(Et[L]− Lt−1[L]) (10)
while the fee leg could be expressed as
Fee = s
n∑t=1
Dt∆t(Hb − Lb)− Et[L] (11)
where ∆t = t− (t− 1) and s is the yearly spread due by the protection buyer.In (11) the amount (Hb − Lb)− Et[L] indicates the notional reduction caused by the
defaults and reflects the right of the investor (protection seller) to get payments only on theresidual amount of the tranche.
Like interest rate swaps, at inception synthetic CDO tranches will have their spreadsset to constrain the mark-to-market value to zero; setting MTM = 0 in (1) and using (10)and (11) to solve for s, the ”par spread” can be obtained as
spar =contingent∑n
t=1 Dt∆t(Hb − Lb)− Et[L](12)
12In the market jargon the implied correlation is the number that makes the fair or theoretical valueof a tranche equal to its market quote under the One Factor Gaussian Copula Model
13With c we refer to the cumulative loss of the tranche.14We omitted the Q since this quantity will be computed under both the risk neutral and real world
measures
10

5 Risk measures and economic capitalThe risk of a tranched product can be evaluated by different metrics. From now on wedescribe those we believe could be eligible as proxies of the economic capital absorbedby a corporate CDO, adopting the one year time horizon chosen by Basel II for all creditexposures.
We are aware that this holding period is clearly too extended for index tranches that,mostly held in the trading book, need a much shorter period to be closed or hedged. Whenadopting this ”regulatory constrained” time horizon we are therefore implementing the ideaof using the index tranches as a proxy of corporate CDOs, whose scarce liquidity can welljustify the regulators’ choice.
In line with the Value at Risk conceptual framework on which Basel II relies, wecomputed a first measure of the tranches economic capital using a VaR measure derivedfrom the Gaussian Copula model, taking the expected loss on the one year time horizonconditioned at the 99.9− th percentile of the systematic factor15.
In our framework that’s equivalent to solve the (9) considering the probability distri-bution conditioned to X = x99.9 (6). We indicate this measure as
Et[L|X = x99.9] =N∑
l=0
p(l, t|X = x99.9)max(min(lA(1−R),Hb)− Lb, 0) (13)
This approach fails to consider the Mark to Market effect, which arises every time the ma-turity of the product is longer than the chosen holding period horizon (t1): if we computethe VaR at t1 for two different tenor but otherwise identical tranches (i.e. one with one-yearmaturity and the other with five-years maturity) we end up with the same value. Further itdoesn’t consider the spreads cashed in by the protection seller.
To obtain a more comprehensive risk measure we calculated the total loss suffered byan hypothetical investor, which comprises both the cash flows expected during the holdingperiod and an estimate of the MtM effect suffered at the end of the holding period. We callthis measure Modified Unexpected Loss:
ULmod = E[CashF low(t0, t1)|X = x99.9] + |MtM(t1)| (14)
The first term is equivalent to the mark to market of a contract with maturity of 1 year,having observed a negative state of the economy during this time horizon (X = x99.9).
The second one accounts for the mismatch between the time horizon of the VaR mea-sure and the product maturity. Since its evaluation is equivalent to that of a 4-year CDOwritten on the original pool of names that starts at t1 and matures at t5, it resembles thepricing of a forward starting CDO, an issue recently studied by Hull & White [15].
Forward starting CDOs represent contracts that compel two counterparties to enter intoa CDO transaction at a specified future time on a given portfolio at an agreed spread; thecontract is canceled out if during the period between the deal date and the start date theportfolio experiences an amount of losses exceeding the tranche detachment point. In linewith standard CDOs, we define the forward CDO spread as the specific spread value thatdetermines a zero Mark to Market at the deal date.
15Gordy[5] shows that when dependence across exposures is driven by a single systematic riskfactor, and no exposure accounts for more than an arbitrarily small share of total portfolio (perfectgranularity), the loss distribution is completely described by the systematic factor distribution: thisallows to compute the VaR without generating the entire loss distribution.
11

Market participants distinguish the case where the underlying portfolio currently exists(specific forward start CDOs), and may have suffered defaults before the start date occurs,from the de novo portfolio which will come into existence at the start date (general forwardstart CDOs).
Hull & White have showed that specific forward CDOs can be priced in a consistentway by the One Factor Gaussian Copula Model, as it produces coherent results with thoseobtained by a more general dynamic model [14]. Accordingly, to compute the MtM(t1)in (14) we used the One Factor Gaussian Copula Model, considering the reduction of thenotional portfolio caused by losses incurred from t0 to t1.
In this respect we need to calculate the number of defaults (l) associated to the lossesincurred during the 1 year time horizon. To get l we compute the portfolio unexpected lossat time t1 by (13); hence, considering the equivalence
E1[L|X = x99.9] = lA(1−R)
we obtainl =
E1
A(1−R)(15)
Once we known l from (15) we can easily compute MtM(t1, T5) just evaluating (13)starting from l = l.
6 Comparative analysisBoth the regulatory approaches allowed to IRB banks (RBA and SFA) have been appliedto iTraxx tranches and compared with the two described risk measures.
The analysis has been performed with respect to the standard tranches quoted on thefifth series of the iTraxx index, using the market data as of September 15, 2006 for the fiveyears maturity.
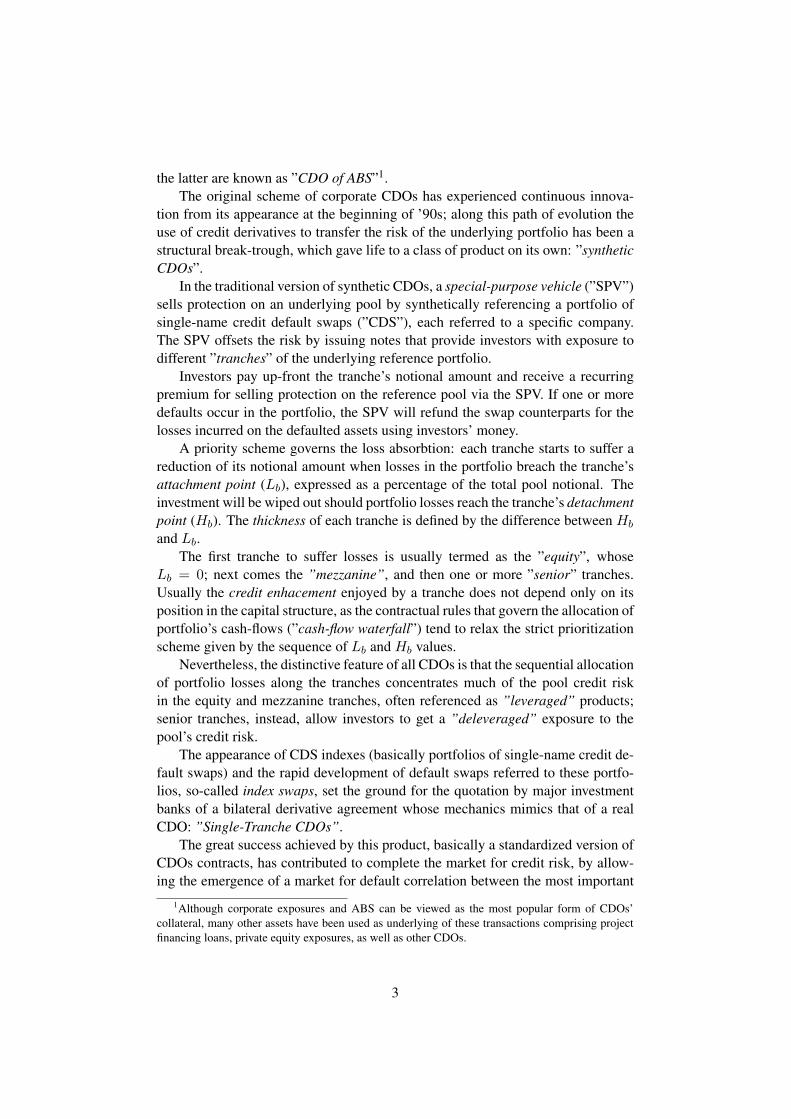
As first we checked the soundness of the pricing methodology calibrating the model(4-12) to correlation values and single-name CDS spreads quoted by dealers (see figure 2)so to obtain exactly the market spread of each tranche.
Then we computed economic capital for each position under the two proposed mea-sures using both risk neutral and real world probabilities.
Risk neutral probabilities have been derived from the CDS spreads. In doing so foreach name we derived the annual default intensity λ from the 5-years CDS spread quotedat the September 15; to keep the computation simple we assumed a flat term structure forthe default intensity and a constant recovery rate of 40%. To get the default probability weassumed a Poisson process for default, implying PDi = 1− exp(−λt).
The actual measures have been derived from the ratings that Fitch Ratings assignedto each of the 125 companies (”issuer ratings”) comprised in the fifth series of the iTraxxindex.
As a proxy of the probability of default of different rating classes we considered the5-years cumulative default rate (CRD) computed over a portfolio encompassing all thecorporate finance long-term debt issuer ratings assigned from 1990 to 2006 [3]. Fromthose figures we derived the constant intensity of default as λ = −log(1− CRD)/5.
Table (1) shows data about rating and probabilities used in the exercise. As highlightedby many studies real probabilities are on average lower that those backed out from CDSspreads, mainly due to scarcity of defaults occurred on the best rating classes. For theItraxx constituencies the average default probability on a five years time horizon reduces
12

Figure 2: iTraxx trading screen.
of half a percentage point (from 2.45% to 1.91%), if one chooses not to take into accountthe risk premia asked by investors and to adopt an objective measure based on historicalrate of default.
In order to evaluate the sensitivity of the two proposed risk measures to the correlationparameter we considered values of ρ ranging from 5% to 30%. We choose to use thesame correlation measure for all the tranche rather than the different tranche’s correlationsquoted in the market16, as the same idea of multiple correlation for the same pool lacksof logical background and should be viewed as a signal of the limited adequacy of thestandard pricing model to explain the equilibrium tranches’ prices.
The regulatory charges have been determined using both the approaches reserved toIRB banks: RBA and SFA. In implementing the Supervisory Formula we obtained theKirb parameter using the risk neutral PDs described before17 and a fixed LGD value of60%.
The RBA charges are instead based on the informal ”credit assessments” expressedby Fitch on the tranches of the fifth series of the iTraxx. Even if these credit opinionsshould be viewed as general assessments of the creditworthiness of different tranches andthere is no assurance that, if requested, an actual rating would have been the same as theassessment, we think that these evaluations represent a reliable proxy of ratings as they arebased on the results produced by the proprietary model used by Fitch for CDOs evaluations(VECTOR)18. Moreover, in our opinion the straightforward nature of the iTraxx tranchesdo not allow much room to modify the model results based on the qualitative characteristics
16On September 15 the implied compound correlation spanned from 13% of the 0-3% tranche to25% of the 12-22%.
17At this stage of the study we didn’t compute the SFA capital charge using the real world proba-bilities.
18The centerpiece of Fitch’s CDO rating methodology, VECTOR is a multirisk factor model thattakes as input rating based default probabilities, recovery rate assumptions and correlation to producedefault and loss distribution using a Monte Carlo simulation.
13

of the transaction.
7 ResultsPrevious studies reported the emergence of material differences between the charges gen-erated by the two approaches introduced to measure banks’ capital requirements for struc-tured credit products, with the Supervisory Formula being the tougher one.
Applying the new prudential regime to iTraxx tranches we found the gap between SFAand RBA to be quite conspicuous, as for mezzanine tranches the former approach bringsto capital requirements that are 27 times higher than those based on ratings (table 4)19.
Moreover, our exercise shows that under certain circumstances RBA charges do notfully cover the economic risk of tranches, particularly for mezzanine investments. Weobtained a better alignment between regulatory charges and risks with the SupervisoryFormula.
A key role in explaining differences between RBA charges and our risk estimates isplayed by the value of correlation between defaults of firms in the pool. Using risk neutralprobabilities of default and correlation of 10% or greater, our estimates of economic capitalabsorbtion (ULmod) tend to exceed the RBA charges for all tranches, but the equity 20.
The gap appear really wide for mezzanine tranches: considering a default correlationof 15% the regulatory charges becomes almost 8 times lower (table 6) than the capitalabsorbtion computed taking into account the Mark to Market effect.
It is worth noting that with a default correlation of 15% there is a large probabilitythat under extreme scenarios losses will wipe out the equity tranche (for ρ = 30% also themezzanine will be canceled out) and inflict some minor losses even to the senior tranche.
As one could expect the differences between regulatory and economic capital reducesmoving to actual probabilities of default. However, even under these measures the eco-nomic capital goes beyond the regulatory measure should default correlation assume valuesgreater than 15% (table 7).
The gap tends also to reduce a little bit if we discard the maturity effect, applying ameasure of risk that doesn’t take into account the cost of disposing the investment at the endof the one year holding period. As reported in table 9, if we adopt such a measure of riskusing actual default probabilities and a default correlation of 15% it emerges a substantialcoherence between RBA weights and risk estimates. Even in this case, however, movingto a risk neutral enviroment causes the emergence of a substantial gap between regulatoryand economic capital (table 8) and the same happens if we allow the default correlation toincrease.
8 ConclusionWe found a gap between RBA charges and those produced by SFA that for same kind ofinvestments looks can be defined too large, especially if one thinks of the possible reactionsof market participants.
Moreover, the magnitude of the gaps between RBA charges and economic capitalseems to be larger than those previously computed by Peretyatkin and Perraudin for styl-ized transactions [11].
19Probably the magnitude of the difference could reduce if the SFA charges were computed usingrisk neutral probabilities rather than real ones.
20Being unrated, the equity tranche is entitled of a dollar by dollar (100%) capital charge.
14

A major role in explaining these differences should be played the mono-dimensionalnature of ratings, mainly linked to a PD measure rather than to extreme values of the lossdistributions.
Moreover, bias can arise because the PDs underlying Fitch’s ratings are generated bya process which diverges from the One Factor Gaussian Copula model, especially withrespect to the assumption concerning the interdependence of defaults.
As highlighted, part of the gap depends on the use of risk neutral probabilities ofdefault; in this regard we are aware of the favour toward employing actual measures forrisk management purposes, but we think that failing to consider the information conveyedby the a deep and liquid market, like that of single-name CDS, could bring to unsatisfactoryresults, especially in the case of corporate CDOs.
Our analysis shows a sensible underestimation of risk when default correlation in-creases. This finding is quite relevant from a regulator’s perspective: many studies on assetreturns (e.g. [7]) show that correlation levels tend to increase during economic downturns,exactly the situations regulatory capital has to cope with.
We think that it could be useful to explore the robustness of RBA charges with respectto other structured credit products, as CDOs of ABS or less stylized corporate CDOs;should the same findings emerge even in these cases, it could be really questioned whetherthe Basel II choice of mapping from ratings to capital is the right one, or it is encouragingnew forms of regulatory arbitrage.
15

References[1] P. Allen E. Beinstein. Enhancing our framework for index tranche analysis. Credit
derivative research, JP Morgan, 2005.
[2] FitchRatings. Basel 2: Bottom-line impact on securitization markets. Special report,FitchRatings, 2005.
[3] FitchRatings. Fitch ratings global corporate finance 2006 transition and default study.Special report, FitchRatings, 2007.
[4] M. S. Gibson. Understanding the risk of synthetic cdos. Finance and EconomicsDiscussion Series 36, Federal Reserve Board of Governor, 2004.
[5] M. Gordy. A risk-factor model foundation for rating-based bank capital rules. Journalof financial intermediation, 12:199–232, 2003.
[6] M. Gordy D. Jones. Random tranches. Risk, march:78–83, 2003.
[7] V. K. Ng K. F. Kroner. Modelling asymmetric comovements of asset returns. Thereview of financial studies, 11-N.4:817–844, 1998.
[8] A. Dev M. Pykhtin. Credit risk in asset securitizations: an analytical model. Risk,may:s16–s20, 2002.
[9] A. Dev M. Pykhtin. Coarse-grained cdos. Risk, january:113–116, 2003.
[10] R.C. Merton. On the pricing of corporate debt: the risk structure of interest rates.Journal of finance, 29:449–470, 1974.
[11] V. Peretyatkin W. Perraudin. Capital for structured products. Mimeo 4-2, RiskContrl,2004.
[12] L. Andersen L. S. Basu J. Sidenius. All your hedge in one basket. Risk, November,2003.
[13] O. Vasicek. Probability of loss on loan portfolio. White papers, KMV, 1987.
[14] J. Hull A. White. Dynamic models of portfolio credit risk: A simplified approach.Working paper, University of Toronto, 2006.
[15] J. Hull A. White. Forwards and european options on cdo tranches. Working paper,University of Toronto, 2007.
16

Names Rating (Fitch) Real PD (%) Risk Neutral PD (%)Abn Amro AA- 0.03 0.93Accor BBB 3.74 3.15Adecco S.A. BBB- 4.76 3.58Aegon N.V. AA 0.15 1.21Akzo A- 1.42 2.00Allianz A+ 0.37 0.91Altadis BBB+ 2.24 2.56Arcelor BBB 3.74 3.31Auchan A 0.5 1.15Aviva A+ 0.37 1.19AXA AA- 0.03 1.24BAA A- 1.42 4.09BAE system BBB 3.74 2.36Banca BPI BBB 3.74 2.32Banca Intesa AA- 0.03 1.09Banca MPS A+ 0.37 1.32Banco Bilbao AA- 0.03 1.07Banco Comercial Portugues A+ 0.37 1.14Banco Espirito Santo A+ 0.37 1.24Banco Santander AA 0.15 1.28Barclays AA+ 0.03 0.79Bayer Aktiengesellschaft BBB+ 2.24 2.56Bayerische Motoren Werke A+ 0.37 1.11Bertelsmann BBB+ 2.24 2.76Boots BBB 3.74 2.64British American Tobacco A- 1.42 2.16British Telecommunications BBB+ 2.24 3.39Cadbury Schweppes BBB 3.74 2.84Capitalia A- 1.42 1.40Carrefour A 0.5 1.13Centrica A 0.5 1.96Ciba Specialty Chemicals BBB 3.74 3.89Commerzbank A 0.5 1.72Compagnie de Saint-Gobain A- 1.42 2.24Compagnie Financiere Michelin BBB+ 2.24 3.04Compass BBB+ 2.24 3.08Continental BBB+ 2.24 2.92DaimlerChrysler BBB+ 2.24 4.39Degussa BBB- 4.76 7.26Deutsche Lufthansa BBB- 4.76 3.93Deutsche Telekom A- 1.42 3.47Deutshe bank AA- 0.03 1.11Diageo A+ 0.37 1.24
17

Names Rating (Fitch) Real PD (%) Risk Neutral PD (%)Dsg International BBB+ 2.24 2.96E.ON AA- 0.03 0.99EADS A 0.5 1.76Edison BBB 3.74 1.44EDP - Energias de Portugal A 0.5 1.09Electrcite de France AA- 0.03 0.66Electrolux BBB+ 2.24 3.08EnBW Energie Baden-Wuerttemberg A- 1.42 0.99Endesa A- 1.42 1.17Enel A+ 0.37 0.99Finmeccanica BBB 3.74 1.72Fortum A+ 0.37 1.07France Telecom A- 1.42 2.88Gallaher Group BBB 3.74 2.52Gas Natural A+ 0.37 1.44Generali AA- 0.03 0.95GKN Holdings BBB- 4.76 4.59Glencore International BBB- 4.76 7.15GUS BBB+ 2.24 3.06Hannover Rueckversicherung A+ 0.37 2.08Hellenic Telecommunications BBB 3.74 3.35Henkel A- 1.42 1.36HVP A 0.5 1.07Iberdrola A+ 0.37 1.42Imperial Chemical Industries BBB 3.74 3.11Imperial Tobacco BBB 3.74 3.15ITV BBB- 4.76 2.41Kingfisher BBB 3.74 3.78Koninklijke A- 1.42 10.17Koninklijke Philips Electronics BBB+ 2.24 1.64Lafarge BBB 3.74 2.92Linde Aktiengesellschaft BBB- 4.76 3.94Louis Vuitton BBB 3.74 1.88Marks and Spencer BBB+ 2.24 2.60Metro BBB 3.74 2.52mmO2 BBB+ 2.24 2.08Muenchener Ruck AA- 0.03 1.58National Grid BBB+ 2.24 2.12Nestle AAA 0.03 0.33Nokia A+ 0.37 0.91Pearson BBB+ 2.24 3.11Peugeot A- 1.42 2.30
18

Names Rating (Fitch) Real PD (%) Risk Neutral PD (%)Portugal Telecom Internat. Finance BBB 3.74 3.94PPR BBB- 4.76 3.78Reed Elsevier A- 1.42 1.80Renault BBB+ 2.24 3.00Rentokil Initial 1972 BBB 3.74 1.88Repsol BBB+ 2.24 2.32Reuters A- 1.42 1.80RWE A+ 0.37 1.01Safeway BBB 3.74 3.55Sanofi Aventis AA- 0.03 1.60Sanpaolo Imi AA- 0.03 1.09Siemens AA- 0.03 0.91Sodexho Alliance BBB 3.74 2.12Stora Enso BBB 3.74 3.19Suez A 0.5 0.99Svenska Cellulosa Aktiebolaget BBB+ 2.24 2.12Swiss Reinsurance Company AA- 0.03 1.64Tate & Lyle BBB 3.74 2.44Technip BBB 3.74 2.00Telecom Italia BBB+ 2.24 5.64Telefonica BBB+ 2.24 3.47TeliaSonera A- 1.42 3.55Tesco A+ 0.37 1.07The Royal Bank o Scotland AA+ 0.03 0.75Thomsom BBB 3.74 5.23Unicredir A+ 0.37 1.30Unilever A+ 0.37 1.24Union Fenosa BBB+ 2.24 2.28United Utilities BBB+ 2.24 1.56UPM-Kymmene BBB 3.74 3.11Valleo BBB 3.74 7.80Vattenfall Aktiebolag A+ 0.37 1.07Veolia Environnement A- 1.42 2.12Vivendi Universal BBB 3.74 3.51Vodafone Group A- 1.42 2.56Volkswagen A- 1.42 1.96Volvo A- 1.42 2.82Wolters Kluwer BBB 3.74 3.78WPP 2005 BBB+ 2.24 2.44Zurich Insurance Company A 0.5 1.68
Table 1: Risk neutral vs Real world 5-years probabilities for the 125 names.
19

Rating classesCounterpart AAA A+ BBB+ BB+ B+
to AA- to A- to BBB- to BB- to B- below B- unratedSovereign 0% 20 % 50% 100% 100% 150% 100%Banks (options 1) 20% 50 % 100% 100% 100% 150% 100%Banks (options 2) 20% 50 % 50% 100% 100% 150% 100%Corporates 20% 50 % 100% 100% 150% 150% 100%Securitisation products 20% 50 % 100% 350% Capital Capital Capital
deduction deduction deduction
Table 2: Standard approach. Risk weights.
Tranche typeLong Term Rating Senior Base case Backed by non granular poolsAaa/AAA 7% 12% 20%Aa/AA 8% 15% 25%A1/A+ 10% 18%A2/A 12% 20% 35%A3/A 20% 35%Baa1/BBB+ 35% 50%Baa2/BBB 60% 50%Baa3/BBB- 100%Ba1/BB+ 250%Ba2/BB 425%Ba3/BB- 650%Ba3/BB-Unrated Deduction
Table 3: RBA risk weights.
Tranche Fitch Ratings Delta* RBA cc** FSA cc FSA/RBA0− 3 NA 26x 100.00 100.00 1.003− 6 BBB- 5x 8.00 92.61 11.586− 9 AAA 1.5x 0.56 15.51 27.709− 12 AAA 0.75x 0.56 1.30 2.3212− 22 AAA 0.3x 0.56 0.56 1.0022− 100 NA - 0.56 0.56 1
*Delta measures the sensitivity of the tranche’s MtM to a change in the index spread.** cc indicates capital charge. A 100% capital charge corresponds to 1250% RWA.
Table 4: Regulatory capital charge as percentage of tranche’s notional amount.
20

ULmod - Risk Neutral ProbabilitiesTranche RBA ρ
5% 10% 15% 20% 25% 30%0− 3 100 48.7 71.8 100 100 100 1003− 6 8.00 6 20.8 43.5 63.4 78.4 1006− 9 0.56 0 1 4.4 11 29 559− 12 0.56 0 0 0.6 2 4.5 912− 22 0.56 0 0 0 0 0.5 1.222− 100 - 0 0 0 0 0 0
Table 5: Economic capital charge as percentage of tranche’s notional amount.
ULmod vs RBA - Risk Neutral ProbabilitiesTranche ρ
5% 10% 15% 20% 25% 30%0− 3 0.5 0.7 1 1 1 13− 6 0.7 2.6 5.4 7.9 9.8 12.56− 9 0 1.9 7.8 19.4 51.8 98.59− 12 - - 1 3.2 8 16.312− 22 - - - 0.2 1 222− 100 - - - - - -
Table 6: Economic capital vs RBA. Capital charge ratio.
ULmod - Actual ProbabilitiesTranche RBA ρ
5% 10% 15% 20% 25% 30%0− 3 100 31 57.3 76.6 100 100 1003− 6 8.00 0 8 20 41.3 60 786− 9 0.56 0 0 0.8 3.2 8.4 20.49− 12 0.56 0 0 0 0.4 1.3 2.612− 22 0.56 0 0 0 0 0 0.322− 100 - 0 0 0 0 0 0
Table 7: Economic capital charge as percentage of tranche’s notional amount.
Et(L|x99.9) - Risk Neutral ProbabilitiesTranche RBA ρ
5% 10% 15% 20% 25% 30%0− 3 100 45 71.5 89.4 97.3 99.5 1003− 6 8.00 0.4 5 20.6 46.8 73.6 916− 9 0.56 0 0 0 3 13.8 37.19− 12 0.56 0 0 0 0 0 312− 22 0.56 0 0 0 0 0 022− 100 - 0 0 0 0 0 0
Table 8: Economic capital charge as percentage of tranche’s notional amount.
21

Et(L|x99.9) - Actual ProbabilitiesTranche RBA ρ
5% 10% 15% 20% 25% 30%0− 3 100 35.3 58.4 78.3 91.3 97.4 99.53− 6 8.00 0 1.5 8.4 24.2 47.4 71.16− 9 0.56 0 0 0 0.4 3 11.79− 12 0.56 0 0 0 0 0 012− 22 0.56 0 0 0 0 0 022− 100 - 0 0 0 0 0 0
Table 9: Economic capital charge as percentage of tranche’s notional amount.
22