Embed Size (px)
Citation preview
Basel II
Pillar 3 – disclosures
2009

For purposes of this report, unless the context otherwise
requires, the terms “Credit Suisse,” “the Group,” “we,” “us”
and “our” mean Credit Suisse Group AG and its consolidated
subsidiaries. The business of Credit Suisse AG, the Swiss bank
subsidiary of the Group, is substantially similar to the Group, and
we use these terms to refer to both when the subject is
the same or substantially similar. We use the term “the Bank”
when we are only referring to Credit Suisse AG, the Swiss bank
subsidiary of the Group, and its consolidated subsidiaries.
In various tables, use of “–” indicates not meaningful or not
applicable.
3 Basel II 1. Introduction
Pillar 3 – disclosures 2. Capital 4
2009 3. Risk exposure and assessment 7
4. Credit risk
5. Securitization risk
6. Market risk
7. Operational risk
8. Equity securities in the banking book
9. Interest rate risk in the banking book
List of abbreviations
7
23
28
29
29
30
32

2
3 Basel II – Pillar 3
1. Introduction
The purpose of this Pillar 3 report is to provide updated infor
mation as of December 31, 2009 on our implementation of
the Basel II framework and risk assessment processes in
accordance with the Pillar 3 requirements. This document
should be read in conjunction with the Credit Suisse Annual
Report 2009, which include important information on regula
tory capital and risk management (specific references have
been made herein to those documents). Since January 1,
2008, Credit Suisse has operated under the international cap
ital adequacy standards set forth by the Basel Committee on
Banking Supervision, known as Basel II, as implemented by
the Swiss Financial Market Supervisory Authority (FINMA).
In certain cases, the Pillar 3 disclosures differ from the
way we manage our risks for internal management purposes
and disclose them in the Annual Report. For further informa
tion regarding the way that we manage risk, refer to III – Trea
sury, Risk, Balance sheet and Off-balance sheet – Risk man
agement (pages 117 to 136) in the Credit Suisse Annual
Report 2009. For further information on economic capital, our
core Group-wide risk management tool, refer to III – Treasury,
Risk, Balance sheet and Off-balance sheet – Treasury man
agement (pages 113 to 115) in the Credit Suisse Annual
Report 2009.
Certain reclassifications have been made to prior periods
to conform to the current period’s presentation.
The Pillar 3 report is produced and published semi-annu
ally, in accordance with FINMA requirements.
This report has not been audited by the Group’s external
auditors. However, it also includes information that is con
tained within the audited consolidated financial statements as
reported in the Credit Suisse Annual Report 2009.
Scope of application
The highest consolidated entity in the Group to which Basel II
applies is Credit Suisse Group. For further information on reg
ulation, refer to I – Information on the company – Regulation
and supervision (pages 36 to 41) and to III – Treasury, Risk,
Balance sheet and Off-balance sheet – Treasury management
(pages 105 to 111) in the Credit Suisse Annual Report 2009.
Principles of consolidation
For financial reporting purposes, our consolidation principles
comply with accounting principles generally accepted in the
US (US GAAP). For capital adequacy reporting purposes,
however, entities that are not active in banking and finance are
not subject to consolidation (i.e. insurance, real estate and
commercial companies). These investments, which are not
material to the Group, are treated in accordance with the reg
ulatory rules and are either subject to a risk-weighted capital
requirement or a deduction from regulatory capital. FINMA has
advised the Group that it may continue to include equity from
special purpose entities that are deconsolidated under US
GAAP as tier 1 capital. We have also received an exemption
from FINMA not to consolidate private equity fund type vehi
cles.
For a list of significant subsidiaries and associated entities
of Credit Suisse, refer to Note 37 – Significant subsidiaries
and equity method investments in V – Consolidated financial
statements – Credit Suisse Group (pages 311 to 313) in the
Credit Suisse Annual Report 2009.
Restrictions on transfer of funds or regulatory capital
We do not believe that legal or regulatory restrictions consti
tute a material limitation on the ability of our subsidiaries to
pay dividends or our ability to transfer funds or regulatory cap
ital within the Group.
For information on our liquidity, funding and capital man
agement and dividends and dividend policy, refer to III – Trea
sury, Risk, Balance sheet and Off-Balance sheet – Treasury
management (pages 100 to 113) in the Credit Suisse Annual
Report 2009.
Capital deficiencies
The Group’s subsidiaries which are not included in the regula
tory consolidation did not report any capital deficiencies in
2009.
4
2. Capital
For information on our capital structure, eligible capital and
shareholders’ equity and capital adequacy refer to III – Trea
sury, Risk, Balance sheet and Off-Balance sheet – Treasury
management (pages 104 to 112) in the Credit Suisse Annual
Report 2009.
Regulatory capital is calculated and managed according to
Basel II and used to determine BIS ratios and, according to
the Swiss Capital Adequacy Ordinance, the FINMA capital
requirement covering ratio. The main differences between the
BIS and FINMA calculations are the multipliers used for cer
tain risk classes and additional FINMA requirements for mar
ket risk. The main impact of the multipliers is related to non-
counterparty-related risks, for which FINMA uses a multiplier
of 3.0 versus 1.0 for BIS. The additional FINMA requirements
for market risk are for Value-at-Risk (VaR) backtesting excep
tions, where FINMA imposes higher multipliers than BIS for
more than ten exceptions, and stress-test-based risk-
weighted assets for hedge funds.
BIS ratios compare eligible capital by tier 1 and total capi
tal with BIS risk-weighted assets whereas the FINMA capital
requirement covering ratio compares total capital with FINMA
required capital.
During the transition period from Basel I to Basel II, the
capital requirements include a floor adjustment that limits the
benefit received from conversion. For Credit Suisse Group, the
floor adjustment only had an impact on the FINMA capital
requirements.
Description of regulatory approaches
Basel II provides a range of options for determining the capital
requirements in order to allow banks and supervisors the abil
ity to select approaches that are most appropriate. In general,
Credit Suisse has adopted the most advanced approaches,
which align with the way that risk is internally managed and
provide the greatest risk sensitivity. Basel II focuses on credit
risk, market risk, operational risk, securitization risk and equity
and interest rate risk in the banking book. The regulatory
approaches for each of these risk exposures and the related
disclosures under Pillar 3 are set forth below.
Credit risk
Basel II permits banks a choice between two broad method
ologies in calculating their capital requirements for credit risk,
the internal ratings-based (IRB) approach or the standardized
approach. Off-balance-sheet items are converted into credit
exposure equivalents through the use of credit conversion fac
tors (CCF).
The majority of our credit risk is with institutional counter-
parties (sovereigns, other institutions, banks and corporates)
and arises from lending and trading activity in the Investment
Banking and Private Banking divisions. The remaining credit
risk is with retail counterparties and mostly arises in the Pri
vate Banking division from residential mortgage loans and
other secured lending, including loans collateralized by securi
ties.
Under the IRB approach, risk weights are determined by
using internal risk parameters. We have received approval from
FINMA to use, and have fully implemented, the advanced
internal ratings-based (A-IRB) approach whereby we provide
our own estimates for probability of default (PD), loss given
default (LGD) and exposure at default (EAD). We use the A
IRB approach to determine our institutional credit risk and
most of our retail credit risk.
PD parameters capture the risk of a counterparty default
ing over a one-year time horizon. PD estimates are based on
time-weighted averages of historical default rates by rating
grade, with low-default-portfolio estimation techniques applied
for higher quality rating grades. Each PD reflects the internal
rating for the relevant obligor.
LGD parameters consider seniority, collateral, counterparty
industry and in certain cases fair value markdowns. LGD esti
mates are based on an empirical analysis of historical loss
rates and are calibrated to reflect time and cost of recovery as
well as economic downturn conditions. For much of the Private
Banking loan portfolio, the LGD is primarily dependent upon
the type and amount of collateral pledged. For other retail
credit risk, predominantly loans secured by financial collateral,
pool LGDs differentiate between standard and higher risks, as
well as domestic and foreign transactions. The credit approval
and collateral monitoring process are based on loan-to-value
limits. For mortgages (residential or commercial), recovery
rates are differentiated by type of property.
EAD is either derived from balance sheet values or by
using models. EAD for a non-defaulted facility is an estimate
of the gross exposure upon default of the obligor. Estimates
are derived based on a CCF approach using default-weighted
averages of historical realized conversion factors on defaulted
loans by facility type. Estimates are calibrated to capture neg
ative operating environment effects.
We have received approval from FINMA to use the internal
model method for measuring counterparty risk for the majority
of our derivative and secured financing exposures.
5 Basel II – Pillar 3
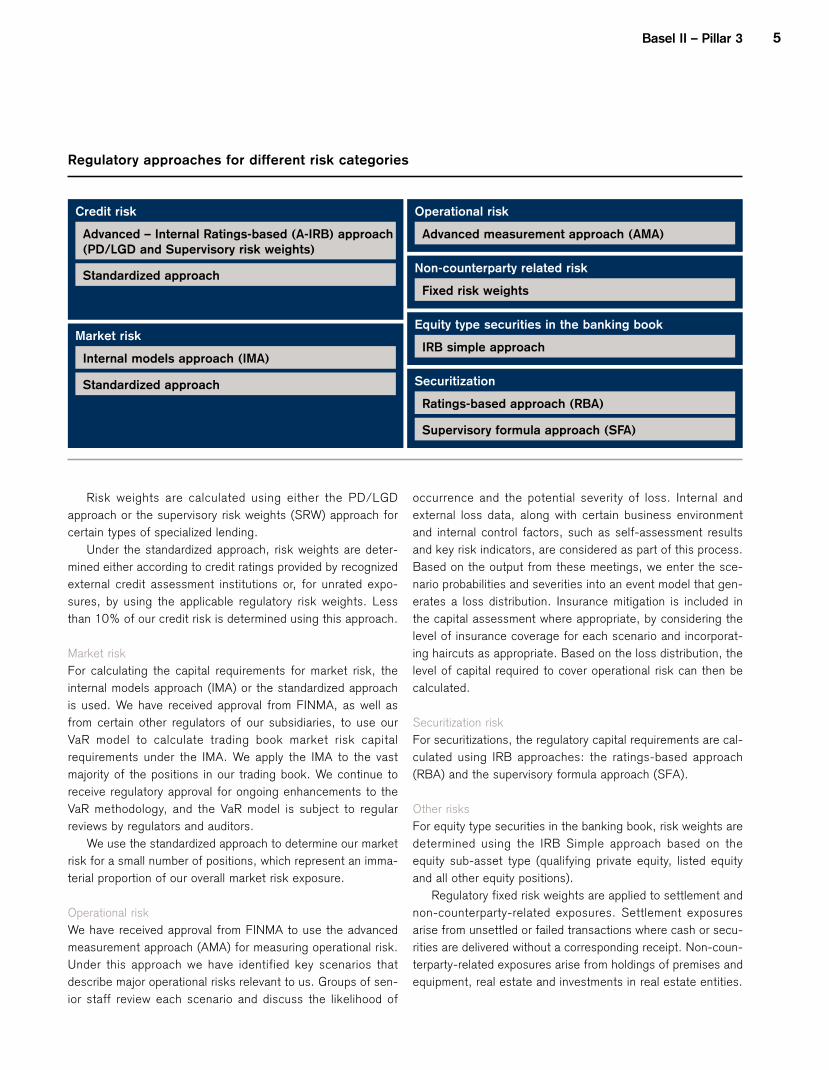
Regulatory approaches for different risk categories
Advanced – Internal Ratings-based (A-IRB) approach
(PD/LGD and Supervisory risk weights)
Standardized approach
Credit risk
Market risk
Operational risk
Advanced measurement approach (AMA)
Non-counterparty related risk
Fixed risk weights
Equity type securities in the banking book
IRB simple approach Internal models approach (IMA)
Standardized approach
Risk weights are calculated using either the PD/LGD
approach or the supervisory risk weights (SRW) approach for
certain types of specialized lending.
Under the standardized approach, risk weights are deter
mined either according to credit ratings provided by recognized
external credit assessment institutions or, for unrated expo
sures, by using the applicable regulatory risk weights. Less
than 10% of our credit risk is determined using this approach.
Market risk
For calculating the capital requirements for market risk, the
internal models approach (IMA) or the standardized approach
is used. We have received approval from FINMA, as well as
from certain other regulators of our subsidiaries, to use our
VaR model to calculate trading book market risk capital
requirements under the IMA. We apply the IMA to the vast
majority of the positions in our trading book. We continue to
receive regulatory approval for ongoing enhancements to the
VaR methodology, and the VaR model is subject to regular
reviews by regulators and auditors.
We use the standardized approach to determine our market
risk for a small number of positions, which represent an imma
terial proportion of our overall market risk exposure.
Operational risk
We have received approval from FINMA to use the advanced
measurement approach (AMA) for measuring operational risk.
Under this approach we have identified key scenarios that
describe major operational risks relevant to us. Groups of sen
ior staff review each scenario and discuss the likelihood of
Securitization
Ratings-based approach (RBA)
Supervisory formula approach (SFA)
occurrence and the potential severity of loss. Internal and
external loss data, along with certain business environment
and internal control factors, such as self-assessment results
and key risk indicators, are considered as part of this process.
Based on the output from these meetings, we enter the sce
nario probabilities and severities into an event model that gen
erates a loss distribution. Insurance mitigation is included in
the capital assessment where appropriate, by considering the
level of insurance coverage for each scenario and incorporat
ing haircuts as appropriate. Based on the loss distribution, the
level of capital required to cover operational risk can then be
calculated.
Securitization risk
For securitizations, the regulatory capital requirements are cal
culated using IRB approaches: the ratings-based approach
(RBA) and the supervisory formula approach (SFA).
Other risks
For equity type securities in the banking book, risk weights are
determined using the IRB Simple approach based on the
equity sub-asset type (qualifying private equity, listed equity
and all other equity positions).
Regulatory fixed risk weights are applied to settlement and
non-counterparty-related exposures. Settlement exposures
arise from unsettled or failed transactions where cash or secu
rities are delivered without a corresponding receipt. Non-coun
terparty-related exposures arise from holdings of premises and
equipment, real estate and investments in real estate entities.
6
For other items, we received approval from FINMA to apply immaterial portfolios.
a simplified Institute Specific Direct Risk Weight approach to
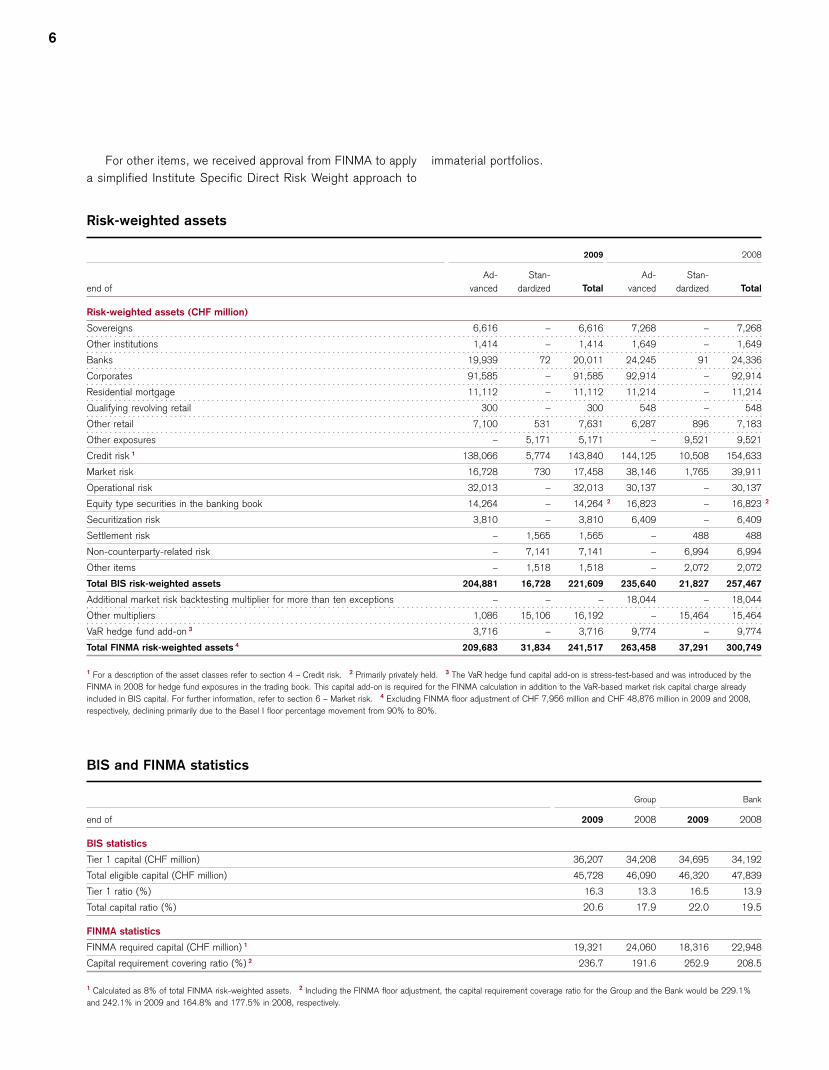
Risk-weighted assets
2009 2008
end of
Ad
vanced
Stan
dardized Total
Ad
vanced
Stan
dardized Total
Risk-weighted assets (CHF million)
Sovereigns 6,616 – 6,616 7,268 – 7,268
Other institutions 1,414 – 1,414 1,649 – 1,649
Banks 19,939 72 20,011 24,245 91 24,336
Corporates 91,585 – 91,585 92,914 – 92,914
Residential mortgage 11,112 – 11,112 11,214 – 11,214
Qualifying revolving retail 300 – 300 548 –
Other retail 7,100 531 7,631 6,287 896 7,183
Other exposures – 5,171 5,171 – 9,521 9,521
Credit risk 1 138,066 5,774 143,840 144,125 10,508 154,633
Market risk 16,728 730 17,458 38,146 1,765 39,911
Operational risk 32,013 – 32,013 30,137 – 30,137
Equity type securities in the banking book 14,264 – 14,264 2 16,823 – 16,823 2
Securitization risk 3,810 – 3,810 6,409 – 6,409
Settlement risk – 1,565 1,565 – 488 488
Non-counterparty-related risk – 7,141 7,141 – 6,994 6,994
Other items – 1,518 1,518 – 2,072 2,072
Total BIS risk-weighted assets 204,881 16,728 221,609 235,640 21,827 257,467
Additional market risk backtesting multiplier for more than ten exceptions – – – 18,044 – 18,044
Other multipliers 1,086 15,106 16,192 – 15,464 15,464
VaR hedge fund add-on 3 3,716 – 3,716 9,774 – 9,774
Total FINMA risk-weighted assets 4 209,683 31,834 241,517 263,458 37,291 300,749
1 For a description of the asset classes refer to section 4 – Credit risk. 2 Primarily privately held. 3 The VaR hedge fund capital add-on is stress-test-based and was introduced by the
FINMA in 2008 for hedge fund exposures in the trading book. This capital add-on is required for the FINMA calculation in addition to the VaR-based market risk capital charge already
included in BIS capital. For further information, refer to section 6 – Market risk. 4 Excluding FINMA floor adjustment of CHF 7,956 million and CHF 48,876 million in 2009 and 2008,
respectively, declining primarily due to the Basel I floor percentage movement from 90% to 80%.
BIS and FINMA statistics
Group Bank
end of 2009 2008 2009 2008
BIS statistics
Tier 1 capital (CHF million) 36,207 34,208 34,695 34,192
Total eligible capital (CHF million) 45,728 46,090 46,320 47,839
Tier 1 ratio (%) 16.3 13.3 16.5 13.9
Total capital ratio (%) 20.6 17.9 22.0 19.5
FINMA statistics
FINMA required capital (CHF million) 1 19,321 24,060 18,316 22,948
Capital requirement covering ratio (%) 2 236.7 191.6 252.9 208.5
1 Calculated as 8% of total FINMA risk-weighted assets. 2 Including the FINMA floor adjustment, the capital requirement coverage ratio for the Group and the Bank would be 229.1%
and 242.1% in 2009 and 164.8% and 177.5% in 2008, respectively.
548
7 Basel II – Pillar 3
3. Risk exposure and assessment
For information on risk governance, risk organization, risk sheet and Off-balance sheet – Risk management (pages 117
types and risk limits, refer to III – Treasury, Risk, Balance to 136) in the Credit Suisse Annual Report 2009.
4. Credit risk
General
For information on our credit risk management approach, rat
ings and risk mitigation and impaired exposures and
allowances, refer to III – Treasury, Risk, Balance sheet and
Off-balance sheet – Risk management (pages 126 to 135) in
the Credit Suisse Annual Report 2009.
For regulatory purposes, we categorize our exposures into
broad classes of assets with different underlying risk charac
teristics including type of counterparty, size of exposure and
type of collateral. The asset class categorization is driven by
Basel II regulatory rules. The credit asset classes under Basel
II are set forth below and are grouped as either institutional or
retail.
Institutional credit risk
p Sovereigns: exposures to central governments, central
banks, BIS, the International Monetary Fund, the Euro
pean Central Bank and eligible Multilateral Development
Banks (MDB).
p Other institutions: exposures to public bodies with the right
to raise taxes or whose liabilities are guaranteed by a pub
lic sector entity.
p Banks: exposures to banks, securities firms, stock
exchanges and those MDB that do not qualify for sover
eign treatment.
p Corporates: exposures to corporations (except small busi
nesses) and public sector entities with no right to raise
taxes and whose liabilities are not guaranteed by a public
entity. The Corporate asset class also includes specialized
lending, in which the lender looks primarily to a single
source of revenues to cover the repayment obligations and
where only the financed asset serves as security for the
exposure (e.g., income producing real estate or commodi
ties finance).
Retail credit risk
p Residential mortgages: includes exposures secured by
residential real estate collateral occupied or let by the bor
rower.
p Qualifying revolving retail: includes credit card receivables
and overdrafts.
p Other retail: includes loans collateralized by securities and
small business exposures.
Other credit risk
p Other exposures: includes exposures with insufficient
information to treat under the A-IRB approach or to allo
cate under the Standardized approach into any other asset
class.
8
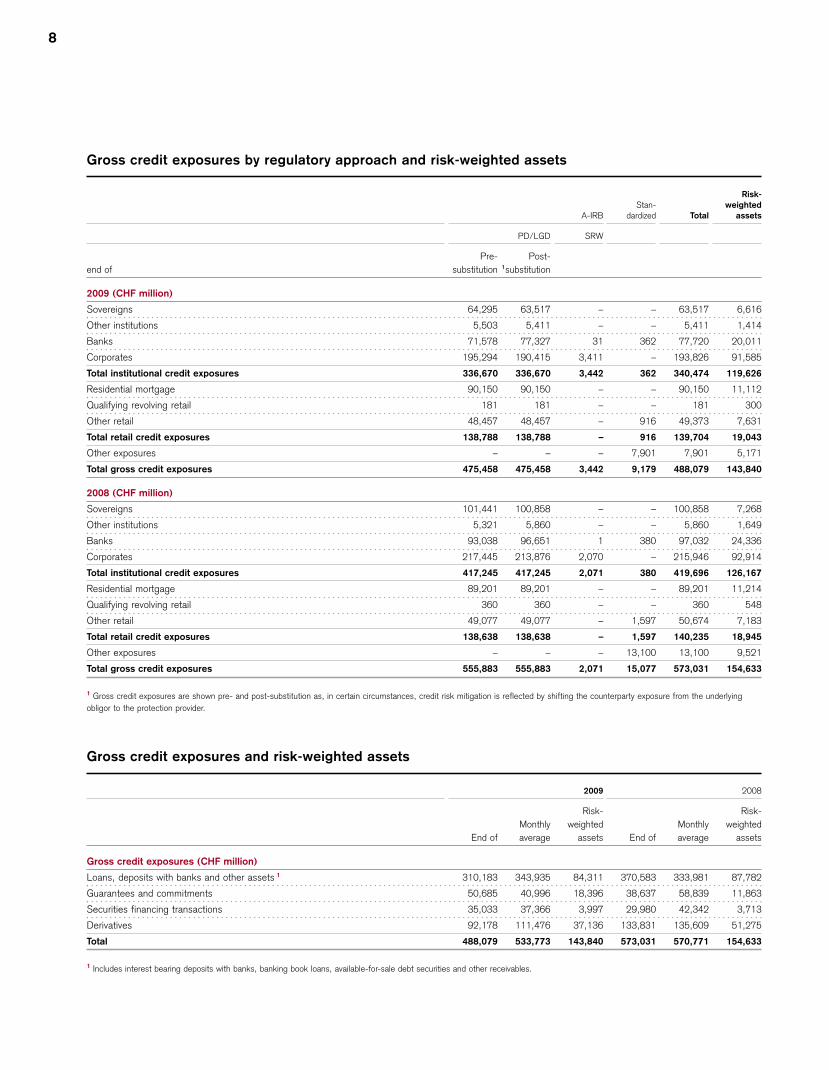
Gross credit exposures by regulatory approach and risk-weighted assets
A-IRB Stan
dardized Total
Risk-
weighted
assets
end of
PD/LGD
Pre- Post-
substitution 1substitution
SRW
2009 (CHF million)
Sovereigns 64,295 63,517 – – 63,517 6,616
Other institutions 5,503 5,411 – – 5,411 1,414
Banks 71,578 77,327 31 362 77,720 20,011
Corporates 195,294 190,415 3,411 – 193,826 91,585
Total institutional credit exposures 336,670 336,670 3,442 362 340,474 119,626
Residential mortgage 90,150 90,150 – – 90,150 11,112
Qualifying revolving retail 181 181 – – 181
Other retail 48,457 48,457 – 916 49,373 7,631
Total retail credit exposures 138,788 138,788 – 916 139,704 19,043
Other exposures – – – 7,901 7,901 5,171
Total gross credit exposures 475,458 475,458 3,442 9,179 488,079 143,840
2008 (CHF million)
Sovereigns 101,441 100,858 – – 100,858 7,268
Other institutions 5,321 5,860 – – 5,860 1,649
Banks 93,038 96,651 1 380 97,032 24,336
Corporates 217,445 213,876 2,070 – 215,946 92,914
Total institutional credit exposures 417,245 417,245 2,071 380 419,696 126,167
Residential mortgage 89,201 89,201 – – 89,201 11,214
Qualifying revolving retail 360 360 – – 360
Other retail 49,077 49,077 – 1,597 50,674 7,183
Total retail credit exposures 138,638 138,638 – 1,597 140,235 18,945
Other exposures – – – 13,100 13,100 9,521
Total gross credit exposures 555,883 555,883 2,071 15,077 573,031 154,633
1 Gross credit exposures are shown pre- and post-substitution as, in certain circumstances, credit risk mitigation is reflected by shifting the counterparty exposure from the underlying
obligor to the protection provider.
Gross credit exposures and risk-weighted assets
2009 2008
End of
Monthly
average
Risk-
weighted
assets End of
Monthly
average
Risk-
weighted
assets
Gross credit exposures (CHF million)
Loans, deposits with banks and other assets 1 310,183 343,935 84,311 370,583 333,981 87,782
Guarantees and commitments 50,685 40,996 18,396 38,637 58,839 11,863
Securities financing transactions 35,033 37,366 3,997 29,980 42,342 3,713
Derivatives 92,178 111,476 37,136 133,831 135,609 51,275
Total 488,079 533,773 143,840 573,031 570,771 154,633
1 Includes interest bearing deposits with banks, banking book loans, available-for-sale debt securities and other receivables.
300
548
9 Basel II – Pillar 3
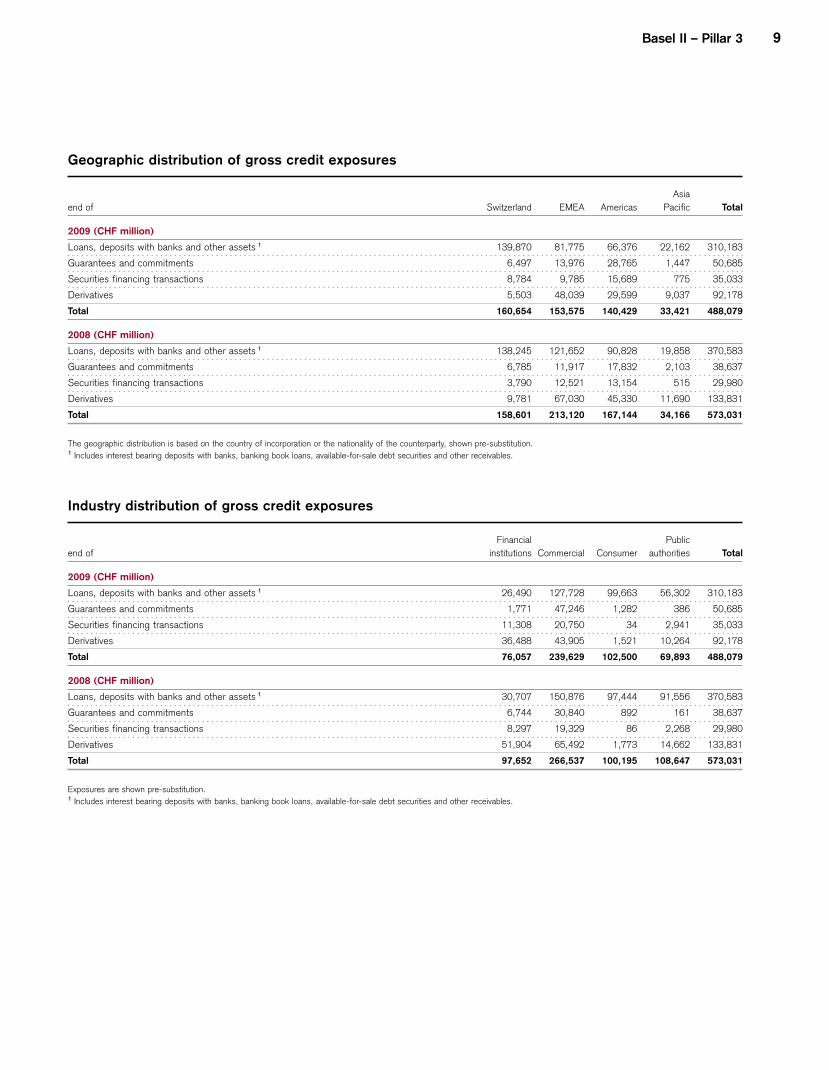
Geographic distribution of gross credit exposures
end of Switzerland EMEA Americas
Asia
Pacific Total
2009 (CHF million)
Loans, deposits with banks and other assets 1 139,870 81,775 66,376 22,162 310,183
Guarantees and commitments 6,497 13,976 28,765 1,447 50,685
Securities financing transactions 8,784 9,785 15,689 775 35,033
Derivatives 5,503 48,039 29,599 9,037 92,178
Total 160,654 153,575 140,429 33,421 488,079
2008 (CHF million)
Loans, deposits with banks and other assets 1 138,245 121,652 90,828 19,858 370,583
Guarantees and commitments 6,785 11,917 17,832 2,103 38,637
Securities financing transactions 3,790 12,521 13,154 515 29,980
Derivatives 9,781 67,030 45,330 11,690 133,831
Total 158,601 213,120 167,144 34,166 573,031
The geographic distribution is based on the country of incorporation or the nationality of the counterparty, shown pre-substitution. 1 Includes interest bearing deposits with banks, banking book loans, available-for-sale debt securities and other receivables.
Industry distribution of gross credit exposures
end of
Financial
institutions Commercial Consumer
Public
authorities Total
2009 (CHF million)
Loans, deposits with banks and other assets 1 26,490 127,728 99,663 56,302 310,183
Guarantees and commitments 1,771 47,246 1,282 386 50,685
Securities financing transactions 11,308 20,750 34 2,941 35,033
Derivatives 36,488 43,905 1,521 10,264 92,178
Total 76,057 239,629 102,500 69,893 488,079
2008 (CHF million)
Loans, deposits with banks and other assets 1 30,707 150,876 97,444 91,556 370,583
Guarantees and commitments 6,744 30,840 892 161 38,637
Securities financing transactions 8,297 19,329 86 2,268 29,980
Derivatives 51,904 65,492 1,773 14,662 133,831
Total 97,652 266,537 100,195 108,647 573,031
Exposures are shown pre-substitution. 1 Includes interest bearing deposits with banks, banking book loans, available-for-sale debt securities and other receivables.
10
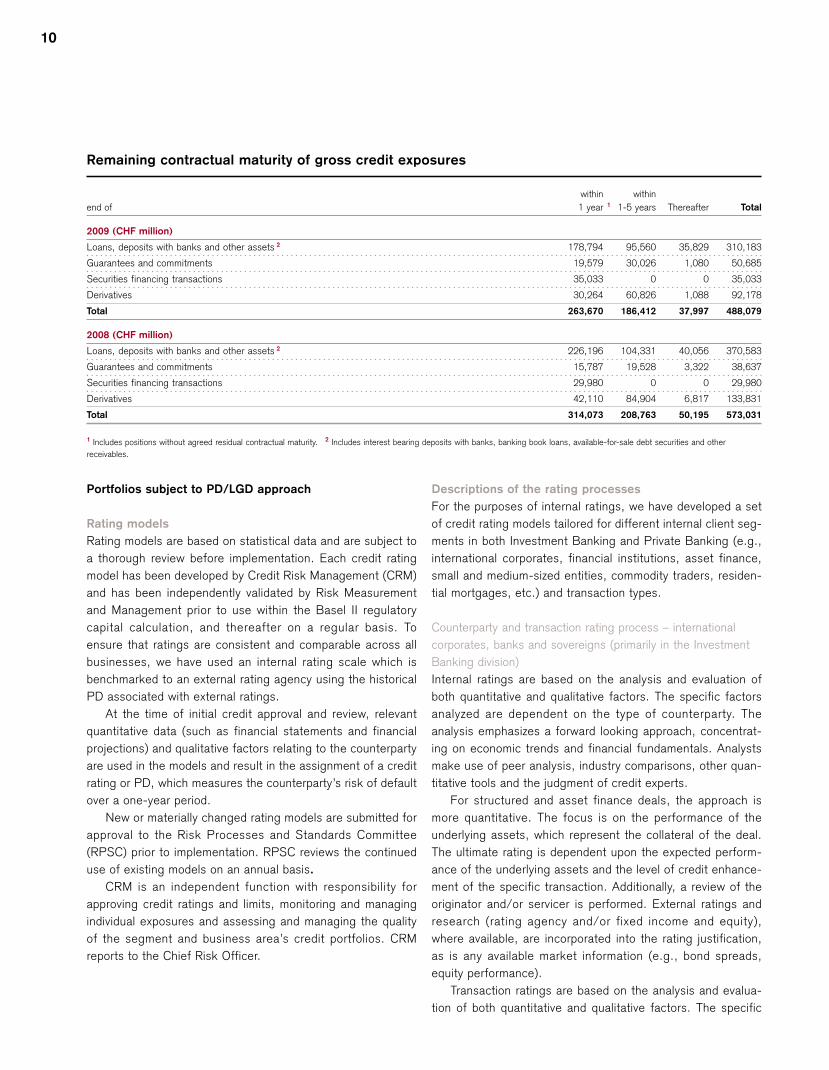
Remaining contractual maturity of gross credit exposures
end of
within
1 year 1
within
1-5 years Thereafter Total
2009 (CHF million)
Loans, deposits with banks and other assets 2 178,794 95,560 35,829 310,183
Guarantees and commitments 19,579 30,026 1,080 50,685
Securities financing transactions 35,033 0 0 35,033
Derivatives 30,264 60,826 1,088 92,178
Total 263,670 186,412 37,997 488,079
2008 (CHF million)
Loans, deposits with banks and other assets 2 226,196 104,331 40,056 370,583
Guarantees and commitments 15,787 19,528 3,322 38,637
Securities financing transactions 29,980 0 0 29,980
Derivatives 42,110 84,904 6,817 133,831
Total 314,073 208,763 50,195 573,031
1 Includes positions without agreed residual contractual maturity. 2 Includes interest bearing deposits with banks, banking book loans, available-for-sale debt securities and other
receivables.
Portfolios subject to PD/LGD approach
Rating models
Rating models are based on statistical data and are subject to
a thorough review before implementation. Each credit rating
model has been developed by Credit Risk Management (CRM)
and has been independently validated by Risk Measurement
and Management prior to use within the Basel II regulatory
capital calculation, and thereafter on a regular basis. To
ensure that ratings are consistent and comparable across all
businesses, we have used an internal rating scale which is
benchmarked to an external rating agency using the historical
PD associated with external ratings.
At the time of initial credit approval and review, relevant
quantitative data (such as financial statements and financial
projections) and qualitative factors relating to the counterparty
are used in the models and result in the assignment of a credit
rating or PD, which measures the counterparty’s risk of default
over a one-year period.
New or materially changed rating models are submitted for
approval to the Risk Processes and Standards Committee
(RPSC) prior to implementation. RPSC reviews the continued
use of existing models on an annual basis.
CRM is an independent function with responsibility for
approving credit ratings and limits, monitoring and managing
individual exposures and assessing and managing the quality
of the segment and business area’s credit portfolios. CRM
reports to the Chief Risk Officer.
Descriptions of the rating processes
For the purposes of internal ratings, we have developed a set
of credit rating models tailored for different internal client seg
ments in both Investment Banking and Private Banking (e.g.,
international corporates, financial institutions, asset finance,
small and medium-sized entities, commodity traders, residen
tial mortgages, etc.) and transaction types.
Counterparty and transaction rating process – international
corporates, banks and sovereigns (primarily in the Investment
Banking division)
Internal ratings are based on the analysis and evaluation of
both quantitative and qualitative factors. The specific factors
analyzed are dependent on the type of counterparty. The
analysis emphasizes a forward looking approach, concentrat
ing on economic trends and financial fundamentals. Analysts
make use of peer analysis, industry comparisons, other quan
titative tools and the judgment of credit experts.
For structured and asset finance deals, the approach is
more quantitative. The focus is on the performance of the
underlying assets, which represent the collateral of the deal.
The ultimate rating is dependent upon the expected perform
ance of the underlying assets and the level of credit enhance
ment of the specific transaction. Additionally, a review of the
originator and/or servicer is performed. External ratings and
research (rating agency and/or fixed income and equity),
where available, are incorporated into the rating justification,
as is any available market information (e.g., bond spreads,
equity performance).
Transaction ratings are based on the analysis and evalua
tion of both quantitative and qualitative factors. The specific
Basel II – Pillar 3 11
factors analyzed include seniority, industry and collateral. The
analysis emphasizes a forward looking approach.
Counterparty and transaction rating process – Swiss
corporates, mortgages and other retail (primarily in the Private
Banking division)
For Swiss corporates and mortgage lending, the statistically
derived rating models, which are based on internal data history
of quantitative and qualitative factors, are supplemented by the
judgment of credit experts. For mortgages, information about
the real estate property, including loan-to-value ratio, is also
considered. Collateral loans, which form the largest part of
“other retail”, are treated according to Basel II rules with pool
PD and pool LGD based on historical loss experience. Most of
the collateral loans are loans collateralized by securities.
As a rule, the allocation of exposures to institutional or
retail as outlined in the following tables is based on the differ
ent rating models, but also takes into account further explicit
regulatory rules.
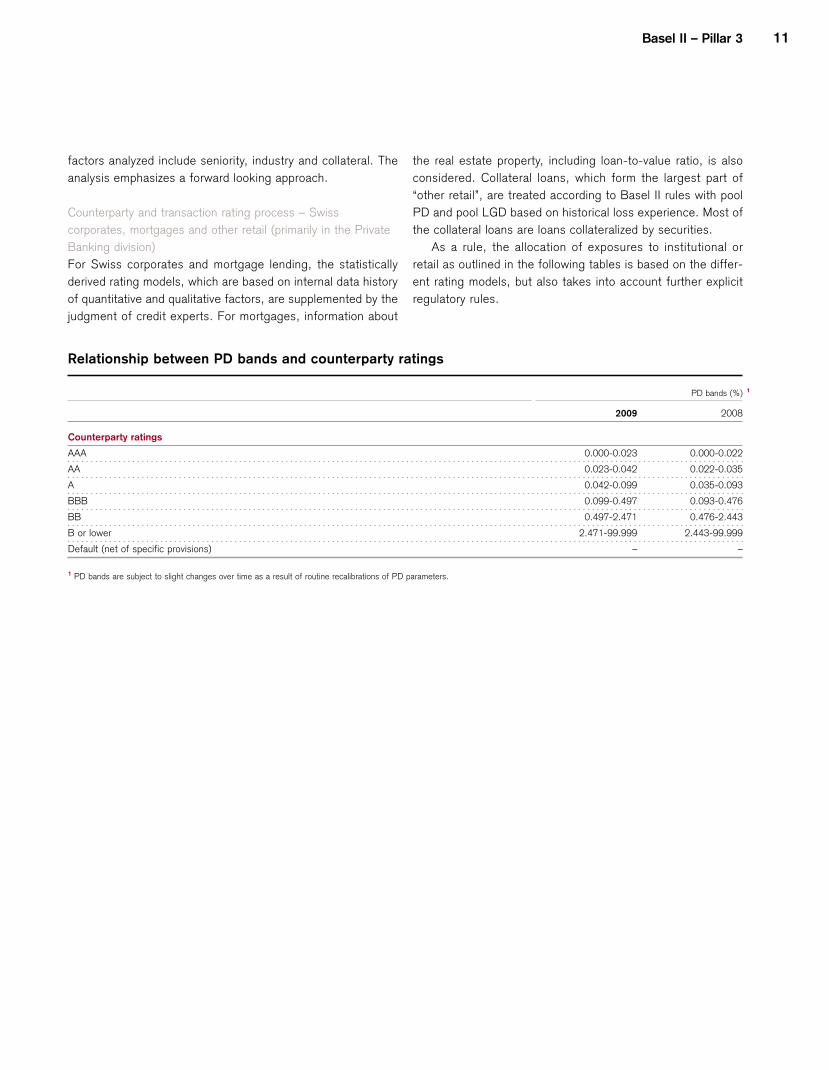
Relationship between PD bands and counterparty ratings
Counterparty ratings
PD bands (%) 1
2009 2008
AAA 0.000-0.023 0.000-0.022
AA 0.023-0.042 0.022-0.035
A 0.042-0.099 0.035-0.093
BBB 0.099-0.497 0.093-0.476
BB 0.497-2.471 0.476-2.443
B or lower 2.471-99.999 2.443-99.999
Default (net of specific provisions) – –
1 PD bands are subject to slight changes over time as a result of routine recalibrations of PD parameters.
12
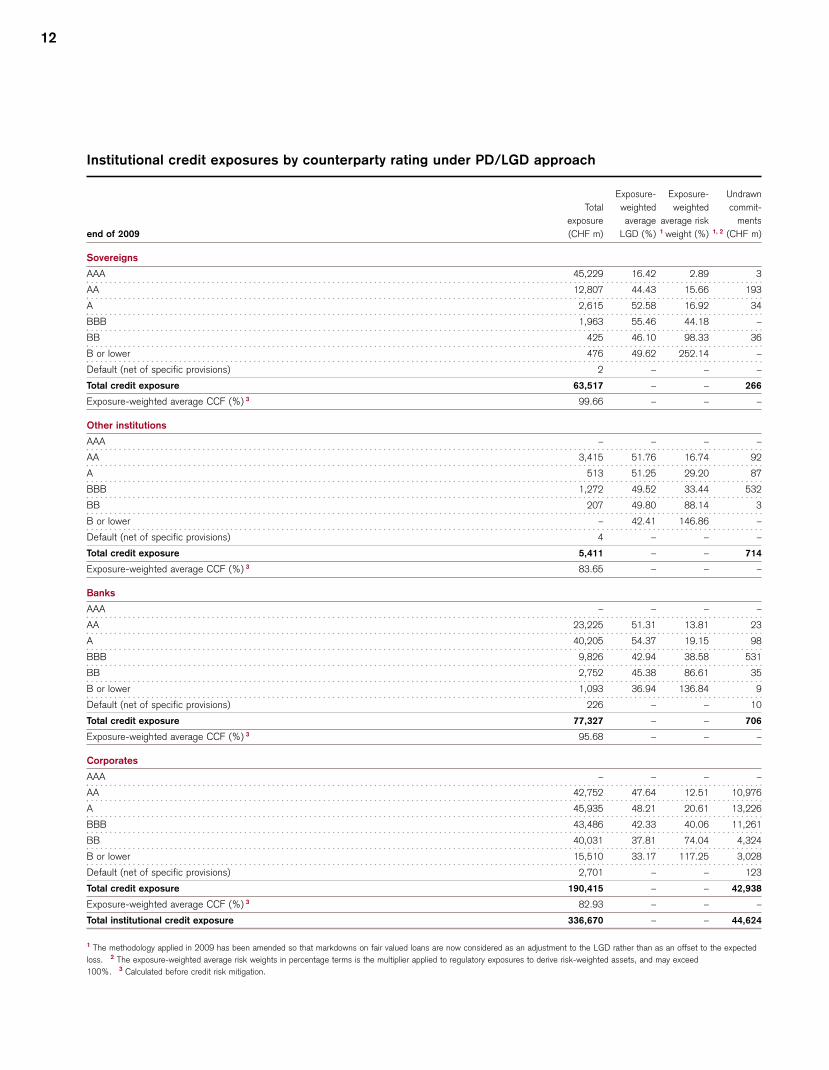
Institutional credit exposures by counterparty rating under PD/LGD approach
end of 2009
Total
exposure
(CHF m)
Exposure- Exposure- Undrawn
weighted weighted commit-
average average risk ments
LGD (%) 1 weight (%) 1, 2 (CHF m)
Sovereigns
AAA 45,229 16.42 2.89 3
AA 12,807 44.43 15.66 193
A 2,615 52.58 16.92 34
BBB 1,963 55.46 44.18 –
BB 425 46.10 98.33 36
B or lower 476 49.62 252.14 –
Default (net of specific provisions) 2 – – –
Total credit exposure 63,517 – – 266
Exposure-weighted average CCF (%) 3 99.66 – – –
Other institutions
AAA – – – –
AA 3,415 51.76 16.74 92
A 513 51.25 29.20 87
BBB 1,272 49.52 33.44 532
BB 207 49.80 88.14
B or lower – 42.41 146.86 –
Default (net of specific provisions) 4 – – –
Total credit exposure 5,411 – – 714
Exposure-weighted average CCF (%) 3 83.65 – – –
Banks
AAA – – – –
AA 23,225 51.31 13.81 23
A 40,205 54.37 19.15 98
BBB 9,826 42.94 38.58 531
BB 2,752 45.38 86.61 35
B or lower 1,093 36.94 136.84
Default (net of specific provisions) 226 – – 10
Total credit exposure 77,327 – – 706
Exposure-weighted average CCF (%) 3 95.68 – – –
Corporates
AAA – – – –
AA 42,752 47.64 12.51 10,976
A 45,935 48.21 20.61 13,226
BBB 43,486 42.33 40.06 11,261
BB 40,031 37.81 74.04 4,324
B or lower 15,510 33.17 117.25 3,028
Default (net of specific provisions) 2,701 – – 123
Total credit exposure 190,415 – – 42,938
Exposure-weighted average CCF (%) 3 82.93 – – –
Total institutional credit exposure 336,670 – – 44,624
1 The methodology applied in 2009 has been amended so that markdowns on fair valued loans are now considered as an adjustment to the LGD rather than as an offset to the expected
loss. 2 The exposure-weighted average risk weights in percentage terms is the multiplier applied to regulatory exposures to derive risk-weighted assets, and may exceed
100%. 3 Calculated before credit risk mitigation.
3
9
Basel II – Pillar 3 13
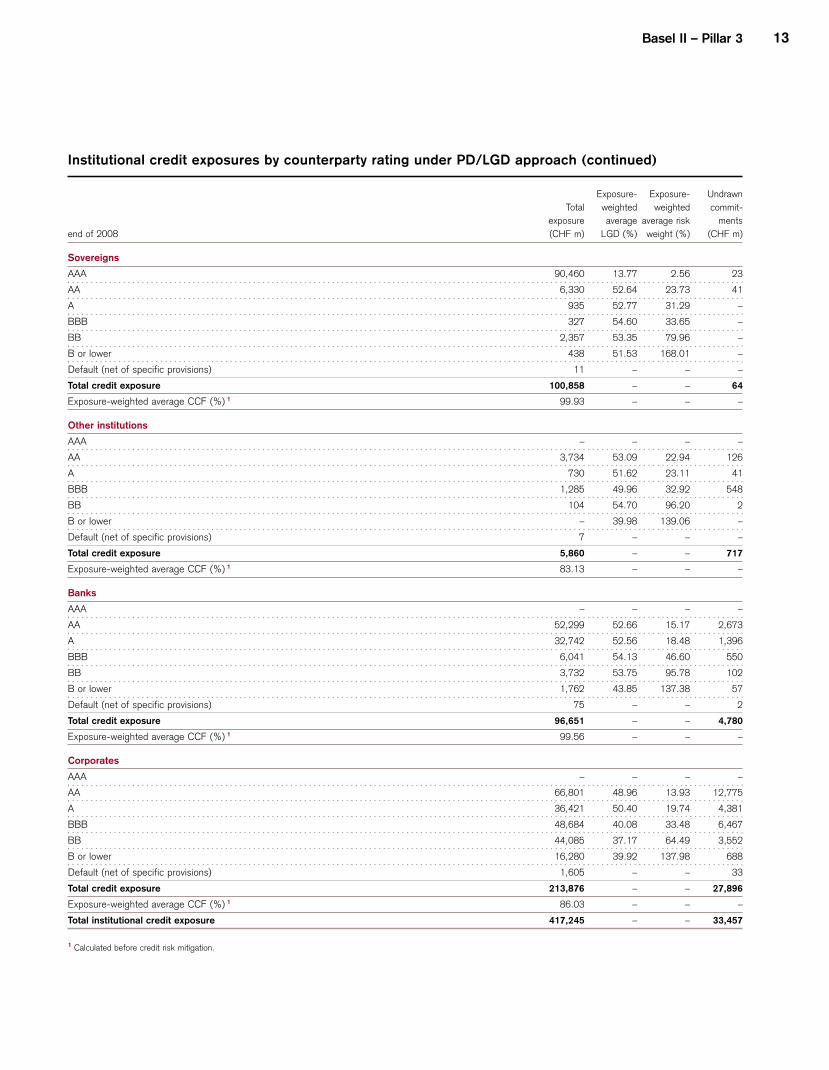
Institutional credit exposures by counterparty rating under PD/LGD approach (continued)
end of 2008
Total
exposure
(CHF m)
Exposure- Exposure-
weighted weighted
average average risk
LGD (%) weight (%)
Undrawn
commit
ments
(CHF m)
Sovereigns
AAA 90,460 13.77 2.56 23
AA 6,330 52.64 23.73 41
A 935 52.77 31.29 –
BBB 327 54.60 33.65 –
BB 2,357 53.35 79.96 –
B or lower 438 51.53 168.01 –
Default (net of specific provisions) 11 – – –
Total credit exposure 100,858 – – 64
Exposure-weighted average CCF (%) 1 99.93 – – –
Other institutions
AAA – – – –
AA 3,734 53.09 22.94 126
A 730 51.62 23.11 41
BBB 1,285 49.96 32.92 548
BB 104 54.70 96.20 2
B or lower – 39.98 139.06 –
Default (net of specific provisions) 7 – – –
Total credit exposure 5,860 – – 717
Exposure-weighted average CCF (%) 1 83.13 – – –
Banks
AAA – – – –
AA 52,299 52.66 15.17 2,673
A 32,742 52.56 18.48 1,396
BBB 6,041 54.13 46.60 550
BB 3,732 53.75 95.78 102
B or lower 1,762 43.85 137.38 57
Default (net of specific provisions) 75 – – 2
Total credit exposure 96,651 – – 4,780
Exposure-weighted average CCF (%) 1 99.56 – – –
Corporates
AAA – – – –
AA 66,801 48.96 13.93 12,775
A 36,421 50.40 19.74 4,381
BBB 48,684 40.08 33.48 6,467
BB 44,085 37.17 64.49 3,552
B or lower 16,280 39.92 137.98 688
Default (net of specific provisions) 1,605 – – 33
Total credit exposure 213,876 – – 27,896
Exposure-weighted average CCF (%) 1 86.03 – – –
Total institutional credit exposure 417,245 – – 33,457
1 Calculated before credit risk mitigation.
14
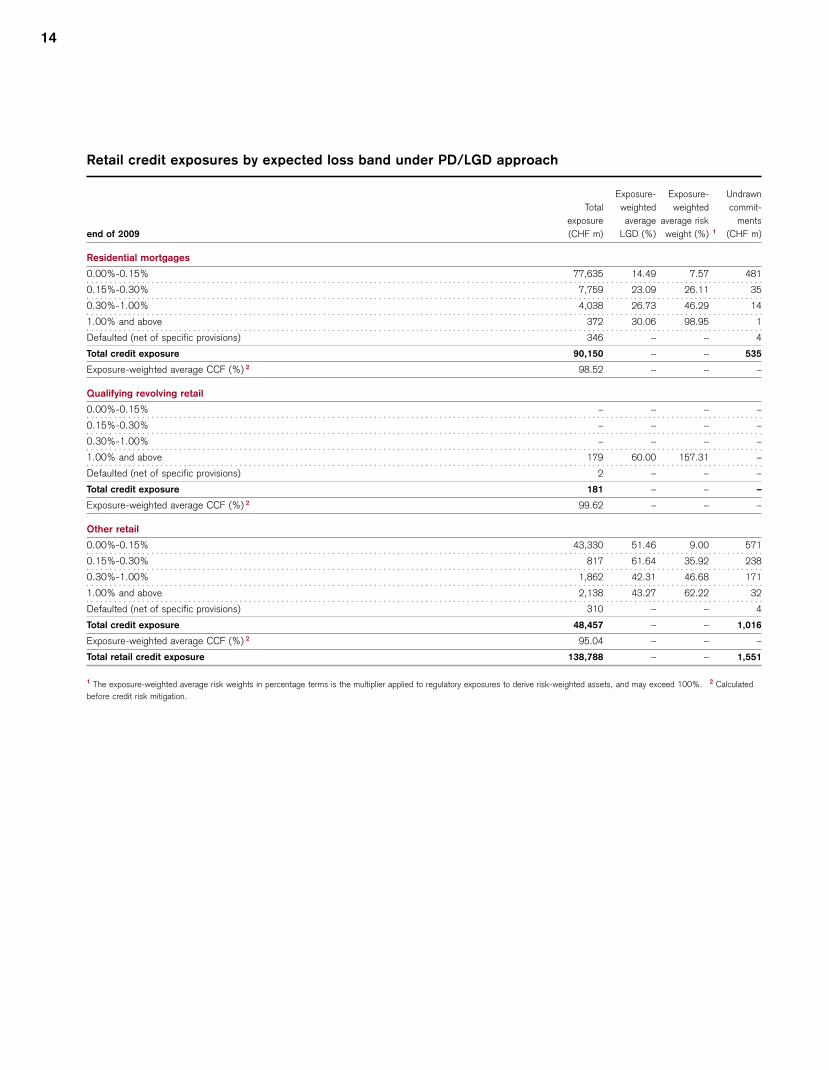
Retail credit exposures by expected loss band under PD/LGD approach
end of 2009
Total
exposure
(CHF m)
Exposure- Exposure-
weighted weighted
average average risk
LGD (%) weight (%) 1
Undrawn
commit
ments
(CHF m)
Residential mortgages
0.00%-0.15% 77,635 14.49 7.57 481
0.15%-0.30% 7,759 23.09 26.11 35
0.30%-1.00% 4,038 26.73 46.29 14
1.00% and above 372 30.06 98.95
Defaulted (net of specific provisions) 346 – – 4
Total credit exposure 90,150 – – 535
Exposure-weighted average CCF (%) 2 98.52 – – –
Qualifying revolving retail
0.00%-0.15% – – – –
0.15%-0.30% – – – –
0.30%-1.00% – – – –
1.00% and above 179 60.00 157.31 –
Defaulted (net of specific provisions) 2 – – –
Total credit exposure 181 – – –
Exposure-weighted average CCF (%) 2 99.62 – – –
Other retail
0.00%-0.15% 43,330 51.46 9.00 571
0.15%-0.30% 817 61.64 35.92 238
0.30%-1.00% 1,862 42.31 46.68 171
1.00% and above 2,138 43.27 62.22 32
Defaulted (net of specific provisions) 310 – – 4
Total credit exposure 48,457 – – 1,016
Exposure-weighted average CCF (%) 2 95.04 – – –
Total retail credit exposure 138,788 – – 1,551
1 The exposure-weighted average risk weights in percentage terms is the multiplier applied to regulatory exposures to derive risk-weighted assets, and may exceed 100%. 2 Calculated
before credit risk mitigation.
1
Basel II – Pillar 3 15
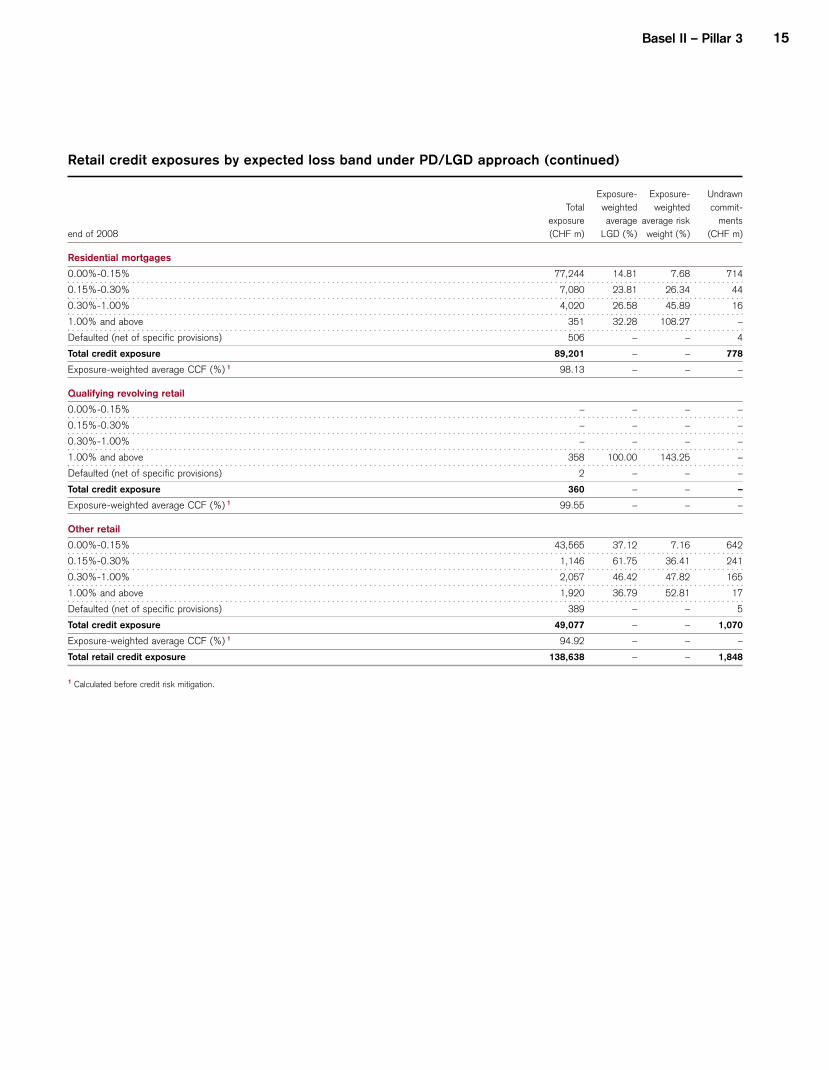
Retail credit exposures by expected loss band under PD/LGD approach (continued)
end of 2008
Total
exposure
(CHF m)
Exposure- Exposure-
weighted weighted
average average risk
LGD (%) weight (%)
Undrawn
commit
ments
(CHF m)
Residential mortgages
0.00%-0.15% 77,244 14.81 7.68 714
0.15%-0.30% 7,080 23.81 26.34 44
0.30%-1.00% 4,020 26.58 45.89 16
1.00% and above 351 32.28 108.27 –
Defaulted (net of specific provisions) 506 – – 4
Total credit exposure 89,201 – – 778
Exposure-weighted average CCF (%) 1 98.13 – – –
Qualifying revolving retail
0.00%-0.15% – – – –
0.15%-0.30% – – – –
0.30%-1.00% – – – –
1.00% and above 358 100.00 143.25 –
Defaulted (net of specific provisions) 2 – – –
Total credit exposure 360 – – –
Exposure-weighted average CCF (%) 1 99.55 – – –
Other retail
0.00%-0.15% 43,565 37.12 7.16 642
0.15%-0.30% 1,146 61.75 36.41 241
0.30%-1.00% 2,057 46.42 47.82 165
1.00% and above 1,920 36.79 52.81 17
Defaulted (net of specific provisions) 389 – – 5
Total credit exposure 49,077 – – 1,070
Exposure-weighted average CCF (%) 1 94.92 – – –
Total retail credit exposure 138,638 – – 1,848
1 Calculated before credit risk mitigation.
16
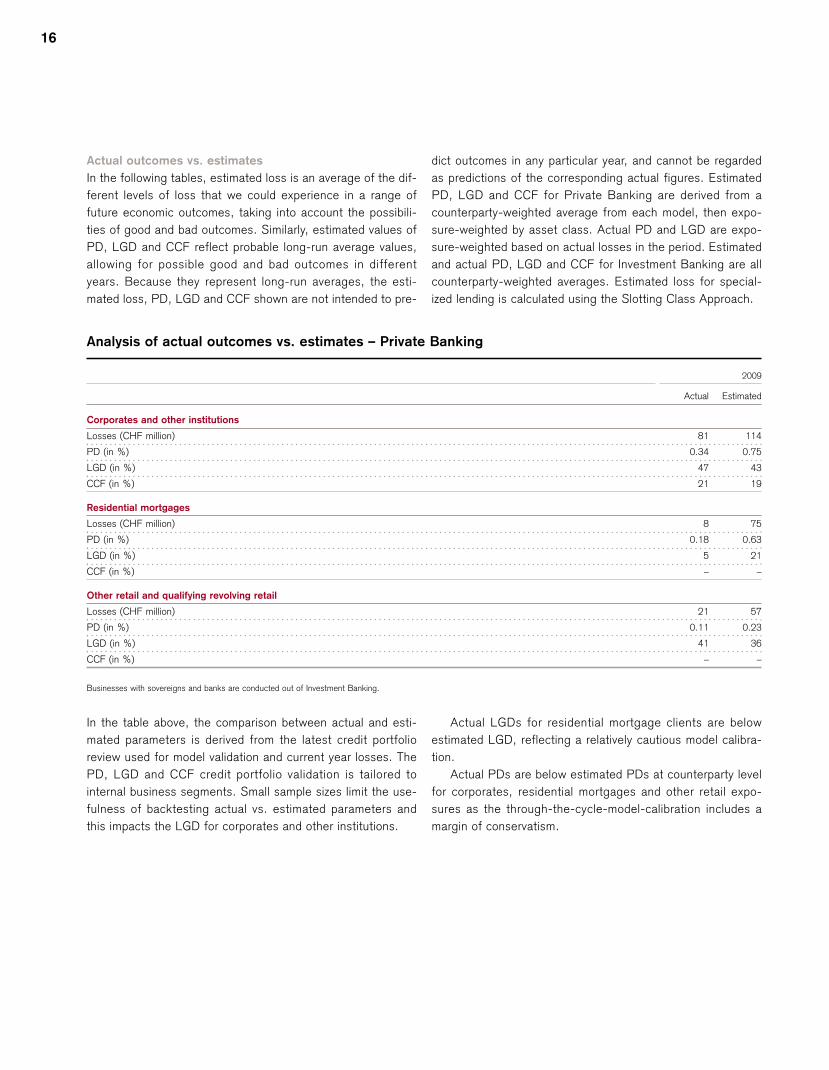
Actual outcomes vs. estimates
In the following tables, estimated loss is an average of the dif
ferent levels of loss that we could experience in a range of
future economic outcomes, taking into account the possibili
ties of good and bad outcomes. Similarly, estimated values of
PD, LGD and CCF reflect probable long-run average values,
allowing for possible good and bad outcomes in different
years. Because they represent long-run averages, the esti
mated loss, PD, LGD and CCF shown are not intended to pre
dict outcomes in any particular year, and cannot be regarded
as predictions of the corresponding actual figures. Estimated
PD, LGD and CCF for Private Banking are derived from a
counterparty-weighted average from each model, then expo
sure-weighted by asset class. Actual PD and LGD are expo
sure-weighted based on actual losses in the period. Estimated
and actual PD, LGD and CCF for Investment Banking are all
counterparty-weighted averages. Estimated loss for special
ized lending is calculated using the Slotting Class Approach.
Analysis of actual outcomes vs. estimates – Private Banking
Corporates and other institutions
Actual Estimated
Losses (CHF million) 81
PD (in %) 0.34 0.75
LGD (in %) 47
CCF (in %) 21 19
Residential mortgages
Losses (CHF million) 8 75
PD (in %) 0.18 0.63
LGD (in %) 5
CCF (in %) – –
Other retail and qualifying revolving retail
Losses (CHF million) 21 57
PD (in %) 0.11 0.23
LGD (in %) 41
CCF (in %) – –
Businesses with sovereigns and banks are conducted out of Investment Banking.
In the table above, the comparison between actual and esti
mated parameters is derived from the latest credit portfolio
review used for model validation and current year losses. The
PD, LGD and CCF credit portfolio validation is tailored to
internal business segments. Small sample sizes limit the use
fulness of backtesting actual vs. estimated parameters and
this impacts the LGD for corporates and other institutions.
Actual LGDs for residential mortgage clients are below
estimated LGD, reflecting a relatively cautious model calibra
tion.
Actual PDs are below estimated PDs at counterparty level
for corporates, residential mortgages and other retail expo
sures as the through-the-cycle-model-calibration includes a
margin of conservatism.
2009
114
43
21
36
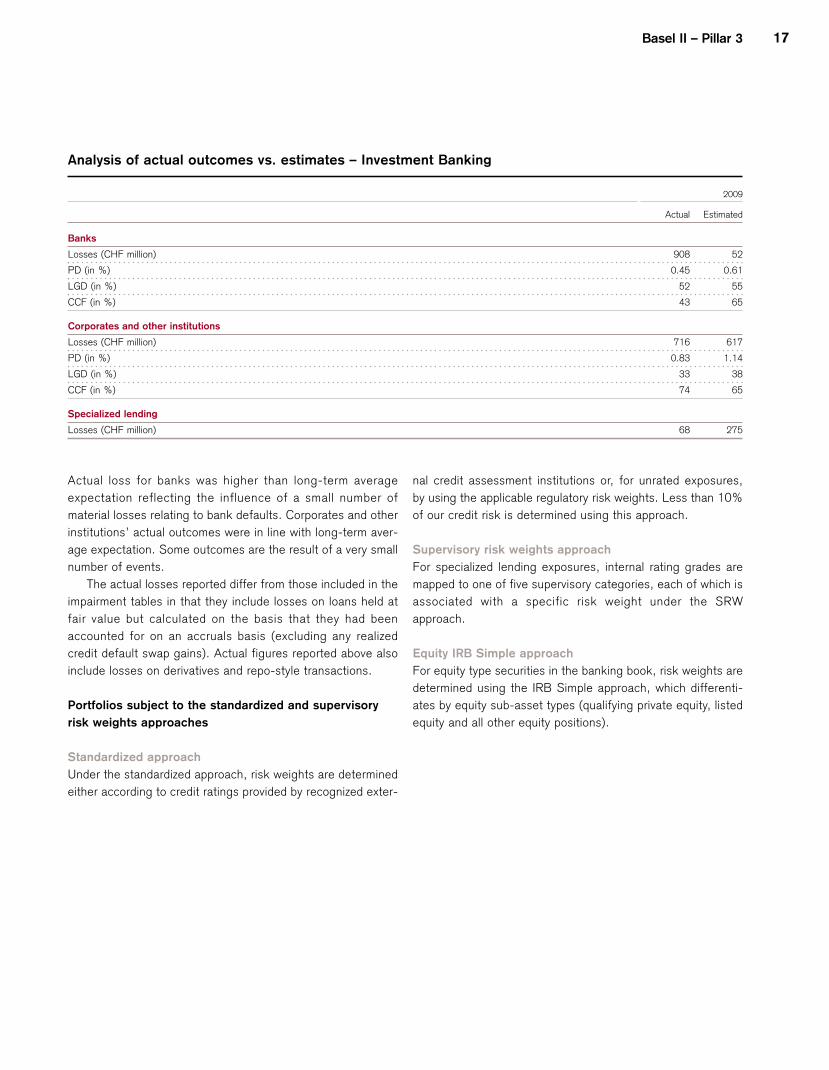
Analysis of actual outcomes vs. estimates – Investment Banking
Basel II – Pillar 3 17
2009
Actual Estimated
Banks
Losses (CHF million) 908 52
PD (in %) 0.45 0.61
LGD (in %) 52 55
CCF (in %) 43 65
Corporates and other institutions
Losses (CHF million) 716 617
PD (in %) 0.83 1.14
LGD (in %) 33 38
CCF (in %) 74 65
Specialized lending
Losses (CHF million) 68 275
Actual loss for banks was higher than long-term average
expectation reflecting the influence of a small number of
material losses relating to bank defaults. Corporates and other
institutions’ actual outcomes were in line with long-term aver
age expectation. Some outcomes are the result of a very small
number of events.
The actual losses reported differ from those included in the
impairment tables in that they include losses on loans held at
fair value but calculated on the basis that they had been
accounted for on an accruals basis (excluding any realized
credit default swap gains). Actual figures reported above also
include losses on derivatives and repo-style transactions.
Portfolios subject to the standardized and supervisory
risk weights approaches
Standardized approach
Under the standardized approach, risk weights are determined
either according to credit ratings provided by recognized exter
nal credit assessment institutions or, for unrated exposures,
by using the applicable regulatory risk weights. Less than 10%
of our credit risk is determined using this approach.
Supervisory risk weights approach
For specialized lending exposures, internal rating grades are
mapped to one of five supervisory categories, each of which is
associated with a specific risk weight under the SRW
approach.
Equity IRB Simple approach
For equity type securities in the banking book, risk weights are
determined using the IRB Simple approach, which differenti
ates by equity sub-asset types (qualifying private equity, listed
equity and all other equity positions).
18
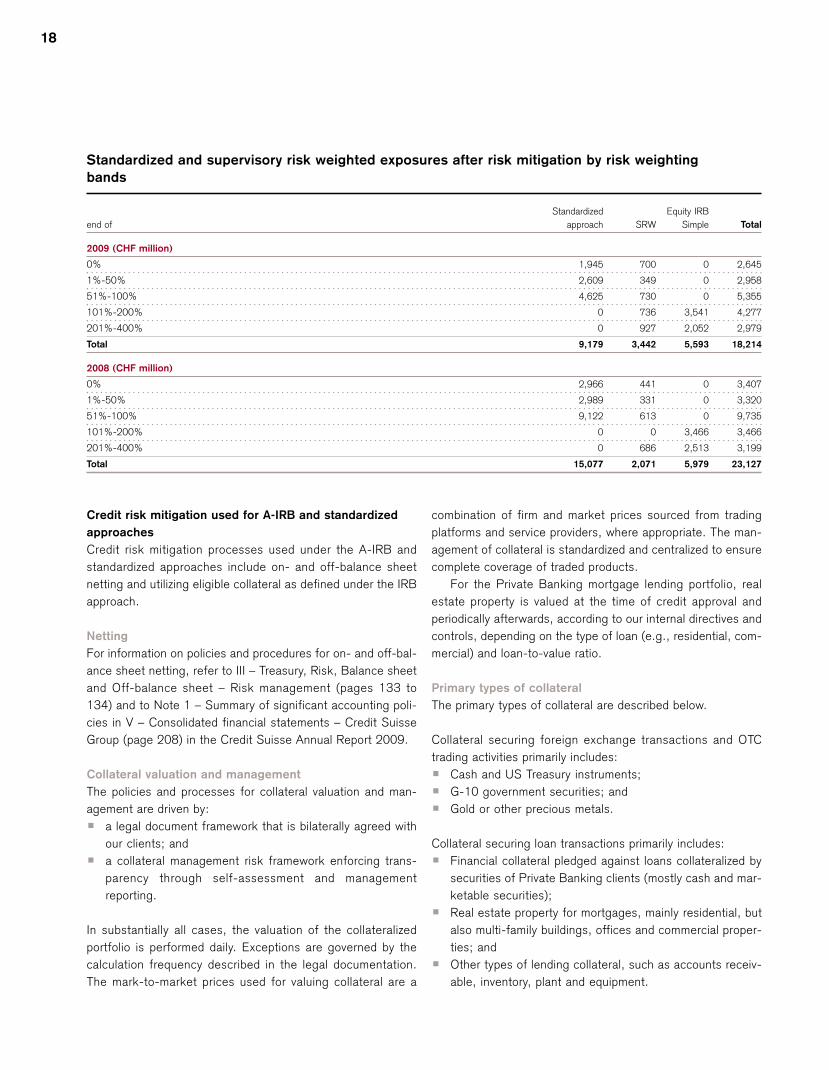
Standardized and supervisory risk weighted exposures after risk mitigation by risk weighting
bands
Standardized Equity IRB
end of approach SRW Simple Total
2009 (CHF million)
0% 1,945 700 0 2,645
1%-50% 2,609 349 0 2,958
51%-100% 4,625 730 0 5,355
101%-200% 0 736 3,541 4,277
201%-400% 0 927 2,052 2,979
Total 9,179 3,442 5,593 18,214
2008 (CHF million)
0% 2,966 441 0 3,407
1%-50% 2,989 331 0 3,320
51%-100% 9,122 613 0 9,735
101%-200% 0 0 3,466 3,466
201%-400% 0 686 2,513 3,199
Total 15,077 2,071 5,979 23,127
Credit risk mitigation used for A-IRB and standardized
approaches
Credit risk mitigation processes used under the A-IRB and
standardized approaches include on- and off-balance sheet
netting and utilizing eligible collateral as defined under the IRB
approach.
Netting
For information on policies and procedures for on- and off-bal
ance sheet netting, refer to III – Treasury, Risk, Balance sheet
and Off-balance sheet – Risk management (pages 133 to
134) and to Note 1 – Summary of significant accounting poli
cies in V – Consolidated financial statements – Credit Suisse
Group (page 208) in the Credit Suisse Annual Report 2009.
Collateral valuation and management
The policies and processes for collateral valuation and man
agement are driven by:
p a legal document framework that is bilaterally agreed with
our clients; and
p a collateral management risk framework enforcing trans
parency through self-assessment and management
reporting.
In substantially all cases, the valuation of the collateralized
portfolio is performed daily. Exceptions are governed by the
calculation frequency described in the legal documentation.
The mark-to-market prices used for valuing collateral are a
combination of firm and market prices sourced from trading
platforms and service providers, where appropriate. The man
agement of collateral is standardized and centralized to ensure
complete coverage of traded products.
For the Private Banking mortgage lending portfolio, real
estate property is valued at the time of credit approval and
periodically afterwards, according to our internal directives and
controls, depending on the type of loan (e.g., residential, com
mercial) and loan-to-value ratio.
Primary types of collateral
The primary types of collateral are described below.
Collateral securing foreign exchange transactions and OTC
trading activities primarily includes:
p Cash and US Treasury instruments;
p G-10 government securities; and
p Gold or other precious metals.
Collateral securing loan transactions primarily includes:
p Financial collateral pledged against loans collateralized by
securities of Private Banking clients (mostly cash and mar
ketable securities);
p Real estate property for mortgages, mainly residential, but
also multi-family buildings, offices and commercial proper
ties; and
p Other types of lending collateral, such as accounts receiv
able, inventory, plant and equipment.
Basel II – Pillar 3 19
Concentrations within risk mitigation The financial collateral used to secure loans collateralized by
Our Investment Banking division is an active participant in the securities worldwide is generally diversified and the portfolio is
credit derivatives market and trades with a variety of market regularly analyzed to identify any underlying concentrations,
participants, principally commercial banks and broker dealers. which may result in lower loan-to-value ratios. For further
Credit derivatives are primarily used to mitigate investment information on risk mitigation, refer to III – Treasury, Risk, Bal
grade counterparty exposures. ance sheet and Off-balance sheet – Risk management (pages
Concentrations in our Private Banking lending portfolio 128 to 129) in the Credit Suisse Annual Report 2009.
arise due to a significant volume of mortgages in Switzerland.
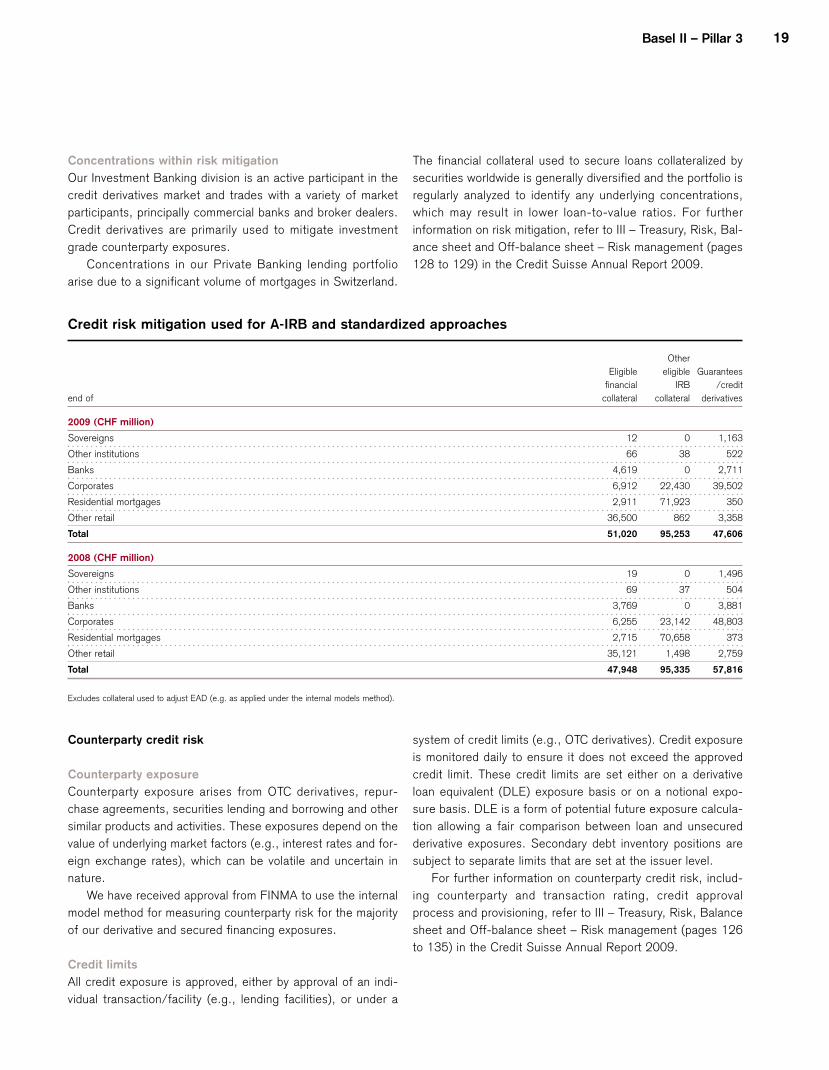
Credit risk mitigation used for A-IRB and standardized approaches
Other
Eligible eligible Guarantees
financial IRB /credit
end of collateral collateral derivatives
2009 (CHF million)
Sovereigns 12 0 1,163
Other institutions 66 38 522
Banks 4,619 0 2,711
Corporates 6,912 22,430 39,502
Residential mortgages 2,911 71,923 350
Other retail 36,500 862 3,358
Total 51,020 95,253 47,606
2008 (CHF million)
Sovereigns 19 0 1,496
Other institutions 69 37 504
Banks 3,769 0 3,881
Corporates 6,255 23,142 48,803
Residential mortgages 2,715 70,658 373
Other retail 35,121 1,498 2,759
Total 47,948 95,335 57,816
Excludes collateral used to adjust EAD (e.g. as applied under the internal models method).
Counterparty credit risk
Counterparty exposure
Counterparty exposure arises from OTC derivatives, repur
chase agreements, securities lending and borrowing and other
similar products and activities. These exposures depend on the
value of underlying market factors (e.g., interest rates and for
eign exchange rates), which can be volatile and uncertain in
nature.
We have received approval from FINMA to use the internal
model method for measuring counterparty risk for the majority
of our derivative and secured financing exposures.
Credit limits
All credit exposure is approved, either by approval of an indi
vidual transaction/facility (e.g., lending facilities), or under a
system of credit limits (e.g., OTC derivatives). Credit exposure
is monitored daily to ensure it does not exceed the approved
credit limit. These credit limits are set either on a derivative
loan equivalent (DLE) exposure basis or on a notional expo
sure basis. DLE is a form of potential future exposure calcula
tion allowing a fair comparison between loan and unsecured
derivative exposures. Secondary debt inventory positions are
subject to separate limits that are set at the issuer level.
For further information on counterparty credit risk, includ
ing counterparty and transaction rating, credit approval
process and provisioning, refer to III – Treasury, Risk, Balance
sheet and Off-balance sheet – Risk management (pages 126
to 135) in the Credit Suisse Annual Report 2009.
20
Wrong-way exposures
Correlation risk arises when we enter into a financial transac
tion where market rates are correlated to the financial health
of the counterparty. In a wrong-way trading situation, our
exposure to the counterparty increases while the counter
party’s financial health and its ability to pay on the transaction
diminishes.
Capturing wrong-way risk requires the establishment of
basic assumptions regarding correlations within a given trading
product. We have multiple processes that allow us to capture
and estimate wrong-way risk.
Credit approval and reviews
A primary responsibility of CRM is the approval of new coun
terparty trading relationships and the subsequent ongoing
review of the creditworthiness of the client. Part of the review
and approval process is an analysis and discussion to under
stand the motivation of the client and to identify the directional
nature of the trading in which the client is engaged. Credit lim
its are sized to the level of comfort the CRM officer has with
the strategy of the counterparty, the level of disclosure of
financial information and the amount of risk mitigation that is
present in the trading relationship (e.g., level of collateral).
Exposure adjusted risk calculation
Trades that feature correlation risk have higher risk weighting
built into the exposure calculation process compared to “right
way” trades.
p Purchased credit default swaps – Correlation exists where
the counterparty and the underlying reference asset
belong to the same group or where the seller of protection
has a similar or lower credit rating than the reference asset
and the same country of risk. In these cases, exposure is
calculated assuming default and applying the recovery
value of the underlying reference asset.
p Equity finance –If there is a high correlation between the
counterparty and the underlying equity, exposure is calcu
lated as full notional (i.e., zero equity recovery).
p Reverse repurchase agreements – Correlation exists
where the underlying issuer and the counterparty are affil
iated. In these cases, collateral used as an offset in the
exposure calculation process is lowered to its recovery
value.
Wrong-way risk monitoring
Regular reporting of wrong-way risk at both the individual
trade and portfolio level allows wrong-way risk to be monitored
and corrective action taken by CRM in the case of heightened
concern.
p Country exposure reporting – Exposure is reported against
country limits established for emerging market countries.
As part of the exposure reporting process, exposures that
exhibit wrong-way characteristics are given a higher risk
weighting versus non-correlated transactions. This weight
ing results in a greater amount of country limit usage for
wrong-way transactions.
p Counterparty exposure reporting – Transactions that con
tain wrong-way risk (e.g., repurchase agreements, equity
finance) are risk weighted as part of the daily exposure
calculation process. Correlated transactions utilize more of
the credit limit.
p Correlated repurchase and foreign exchange reports –
Monthly reports produced by CRM capture correlated
finance and foreign exchange positions for information and
review by CRM credit officers.
p Scenario risk reporting – In order to capture wrong-way
risk at the industry level, a set of defined scenarios are run
on the credit portfolio each month. The scenarios are
determined by CRM and involve stressing the underlying
risk drivers to determine where portfolios are sensitive to
these stressed parameters.
p Scenario risk reporting also covers client groups, particu
larly hedge funds, which are exposed to particular risk
sensitivities and also may have collateral concentrations
due to the direction and strategy of the fund.
Effect of a credit rating downgrade
On a daily basis, we monitor the level of incremental collateral
that would be required by derivative counterparties in the event
of a Credit Suisse ratings downgrade. Collateral triggers are
maintained by our collateral management department and vary
by counterparty. For further information on the effect of a one,
two or three notch downgrade as of December 31, 2009,
refer to III – Treasury, Risk, Balance sheet and Off-balance
sheet – Treasury management (page 104) in the Credit Suisse
Annual Report 2009.
The impact of downgrades in the Bank’s long-term debt
ratings are considered in the stress assumptions used to
determine the conservative funding profile of our balance
sheet and would not be material to our liquidity and funding
planning. For further information on liquidity and funding man
agement, refer to III – Treasury, Risk, Balance sheet and Off-
balance sheet – Treasury management (pages 100 to 104) in
the Credit Suisse Annual Report 2009.
Credit exposures on derivative instruments
We enter into derivative contracts in the normal course of busi
ness for market making, positioning and arbitrage purposes,
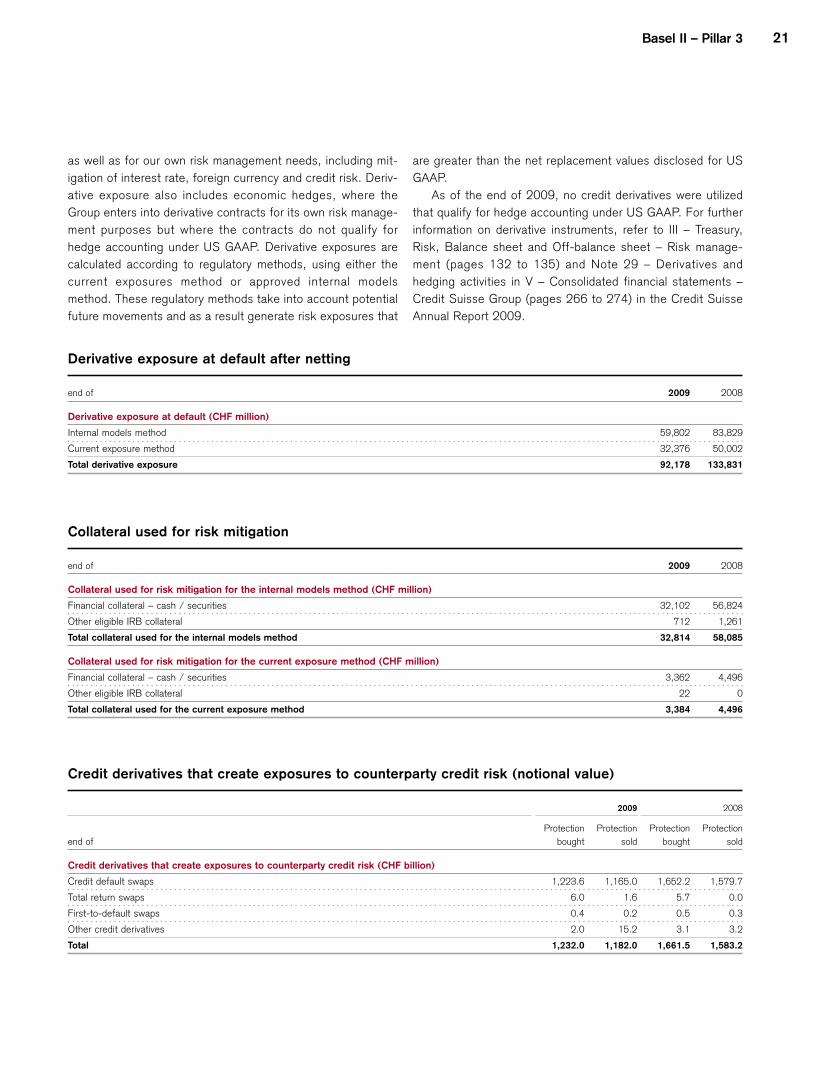
Basel II – Pillar 3 21
as well as for our own risk management needs, including mit
igation of interest rate, foreign currency and credit risk. Deriv
ative exposure also includes economic hedges, where the
Group enters into derivative contracts for its own risk manage
ment purposes but where the contracts do not qualify for
hedge accounting under US GAAP. Derivative exposures are
calculated according to regulatory methods, using either the
current exposures method or approved internal models
method. These regulatory methods take into account potential
future movements and as a result generate risk exposures that
Derivative exposure at default after netting
are greater than the net replacement values disclosed for US
GAAP.
As of the end of 2009, no credit derivatives were utilized
that qualify for hedge accounting under US GAAP. For further
information on derivative instruments, refer to III – Treasury,
Risk, Balance sheet and Off-balance sheet – Risk manage
ment (pages 132 to 135) and Note 29 – Derivatives and
hedging activities in V – Consolidated financial statements –
Credit Suisse Group (pages 266 to 274) in the Credit Suisse
Annual Report 2009.
end of 2009 2008
Derivative exposure at default (CHF million)
Internal models method 59,802 83,829
Current exposure method 32,376 50,002
Total derivative exposure 92,178 133,831
Collateral used for risk mitigation
end of 2009 2008
Collateral used for risk mitigation for the internal models method (CHF million)
Financial collateral – cash / securities
Other eligible IRB collateral
32,102
712
56,824
1,261
Total collateral used for the internal models method 32,814 58,085
Collateral used for risk mitigation for the current exposure method (CHF million)
Financial collateral – cash / securities 3,362 4,496
Other eligible IRB collateral 22 0
Total collateral used for the current exposure method 3,384 4,496
Credit derivatives that create exposures to counterparty credit risk (notional value)
2009 2008
end of
Protection
bought
Protection
sold
Protection
bought
Protection
sold
Credit derivatives that create exposures to counterparty credit risk (CHF billion)
Credit default swaps 1,223.6 1,165.0 1,652.2 1,579.7
Total return swaps 6.0 1.6 5.7 0.0
First-to-default swaps 0.4 0.2 0.5 0.3
Other credit derivatives 2.0 15.2 3.1 3.2
Total 1,232.0 1,182.0 1,661.5 1,583.2
22
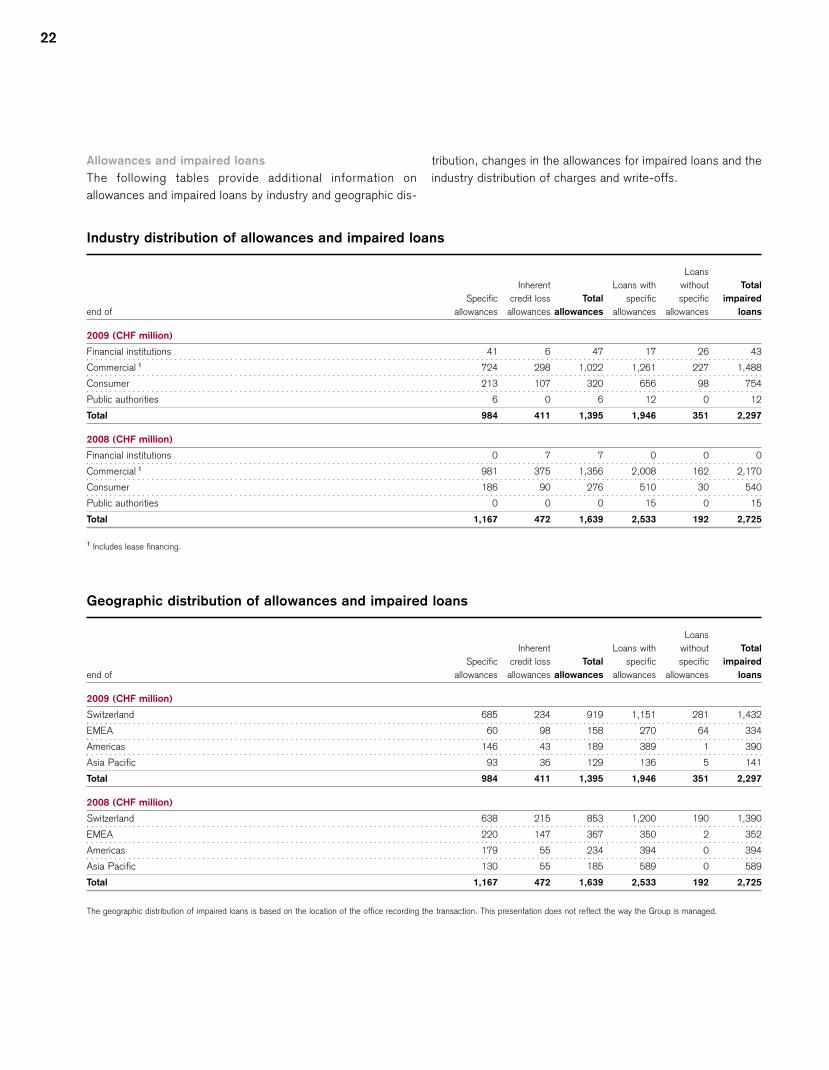
Allowances and impaired loans tribution, changes in the allowances for impaired loans and the
The following tables provide additional information on industry distribution of charges and write-offs.
allowances and impaired loans by industry and geographic dis-
Industry distribution of allowances and impaired loans
end of
Specific
allowances
Inherent
credit loss Total
allowances allowances
Loans with
specific
allowances
Loans
without
specific
allowances
Total
impaired
loans
2009 (CHF million)
Financial institutions 41 6 47 17 26 43
Commercial 1 724 298 1,022 1,261 227 1,488
Consumer 213 107 320 656 98
Public authorities 6 0 6 12 0 12
Total 984 411 1,395 1,946 351 2,297
2008 (CHF million)
Financial institutions 0 7 7 0 0 0
Commercial 1 981 375 1,356 2,008 162 2,170
Consumer 186 90 276 510 30
Public authorities 0 0 0 15 0 15
Total 1,167 472 1,639 2,533 192 2,725
1 Includes lease financing.
Geographic distribution of allowances and impaired loans
Loans
Inherent Loans with without Total
Specific credit loss Total specific specific impaired
end of allowances allowances allowances allowances allowances loans
2009 (CHF million)
Switzerland 685 234 919 1,151 281 1,432
EMEA 60 98 158 270 64
Americas 146 43 189 389 1
Asia Pacific 93 36 129 136 5 141
Total 984 411 1,395 1,946 351 2,297
2008 (CHF million)
Switzerland 638 215 853 1,200 190 1,390
EMEA 220 147 367 350 2 352
Americas 179 55 234 394 0 394
Asia Pacific 130 55 185 589 0 589
Total 1,167 472 1,639 2,533 192 2,725
The geographic distribution of impaired loans is based on the location of the office recording the transaction. This presentation does not reflect the way the Group is managed.
754
540
334
390
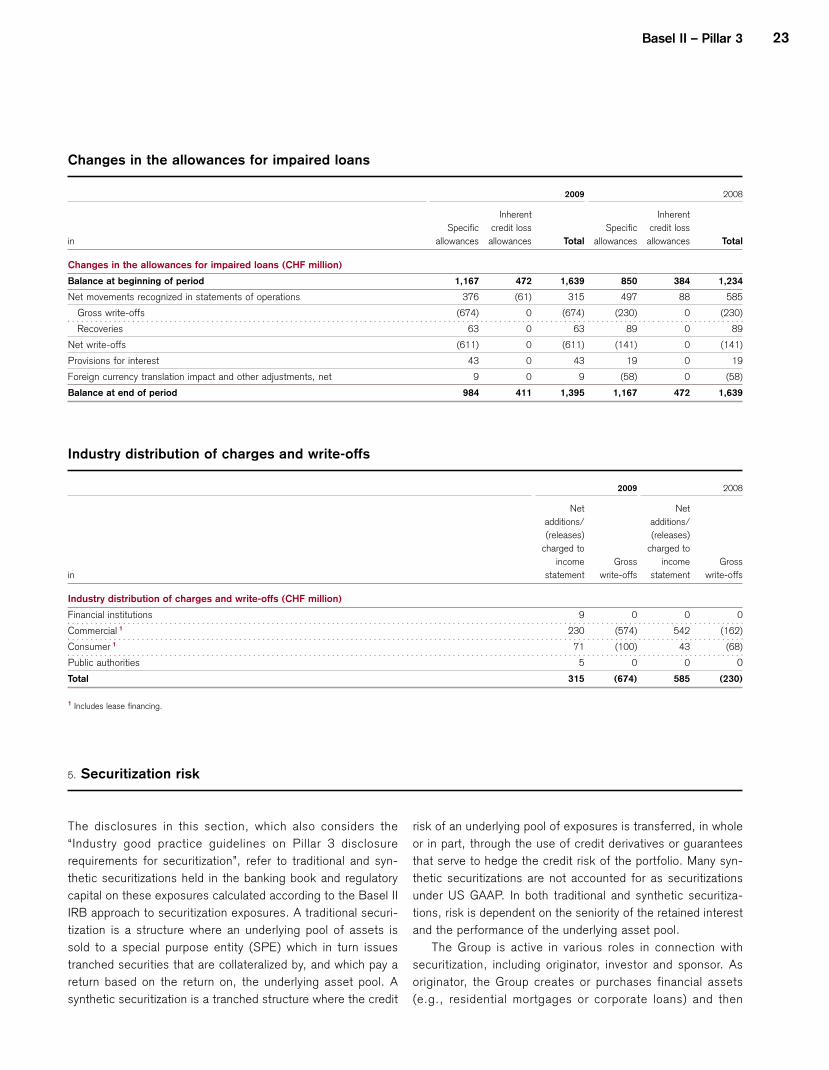
Changes in the allowances for impaired loans
Basel II – Pillar 3 23
2009 2008
Inherent Inherent
in
Specific
allowances
credit loss
allowances Total
Specific
allowances
credit loss
allowances Total
Changes in the allowances for impaired loans (CHF million)
Balance at beginning of period 1,167 472 1,639 850 384 1,234
Net movements recognized in statements of operations 376 (61) 315 497 88 585
Gross write-offs (674)
Recoveries 63
0
0
(674)
63
(230)
89
0 (230)
0 89
Net write-offs (611) 0 (611) (141) 0 (141)
Provisions for interest 43 0 43 19 0 19
Foreign currency translation impact and other adjustments, net 9 0 9 (58) 0 (58)
Balance at end of period 984 411 1,395 1,167 472 1,639
Industry distribution of charges and write-offs
2009 2008
Net Net
additions/ additions/
(releases) (releases)
charged to charged to
income Gross income Gross
in statement write-offs statement write-offs
Industry distribution of charges and write-offs (CHF million)
Financial institutions 9 0 0 0
Commercial 1 230 (574) 542 (162)
Consumer 1 71 (100) 43 (68)
Public authorities 5 0 0 0
Total 315 (674) 585 (230)
1 Includes lease financing.
5. Securitization risk
The disclosures in this section, which also considers the
“Industry good practice guidelines on Pillar 3 disclosure
requirements for securitization”, refer to traditional and syn
thetic securitizations held in the banking book and regulatory
capital on these exposures calculated according to the Basel II
IRB approach to securitization exposures. A traditional securi
tization is a structure where an underlying pool of assets is
sold to a special purpose entity (SPE) which in turn issues
tranched securities that are collateralized by, and which pay a
return based on the return on, the underlying asset pool. A
synthetic securitization is a tranched structure where the credit
risk of an underlying pool of exposures is transferred, in whole
or in part, through the use of credit derivatives or guarantees
that serve to hedge the credit risk of the portfolio. Many syn
thetic securitizations are not accounted for as securitizations
under US GAAP. In both traditional and synthetic securitiza
tions, risk is dependent on the seniority of the retained interest
and the performance of the underlying asset pool.
The Group is active in various roles in connection with
securitization, including originator, investor and sponsor. As
originator, the Group creates or purchases financial assets
(e.g., residential mortgages or corporate loans) and then
24
securitizes them in a traditional or synthetic transaction that
achieves significant risk transfer to third party investors. The
Group acts as liquidity provider to Alpine Securitization Corp.
(Alpine), a multi-seller CP conduit administered by Credit
Suisse. In addition, the Group invests in securitization-related
products created by third parties and provides interest rate and
currency swaps to SPEs involved in securitization activity.
For further information on all traditional securitizations,
including trading book, covering objectives, activities and
accounting policies, refer to Note 31 – Transfers of financial
assets and variable interest entities in V – Consolidated finan
cial statements – Credit Suisse Group (pages 279 to 291) in
the Credit Suisse Annual Report 2009.
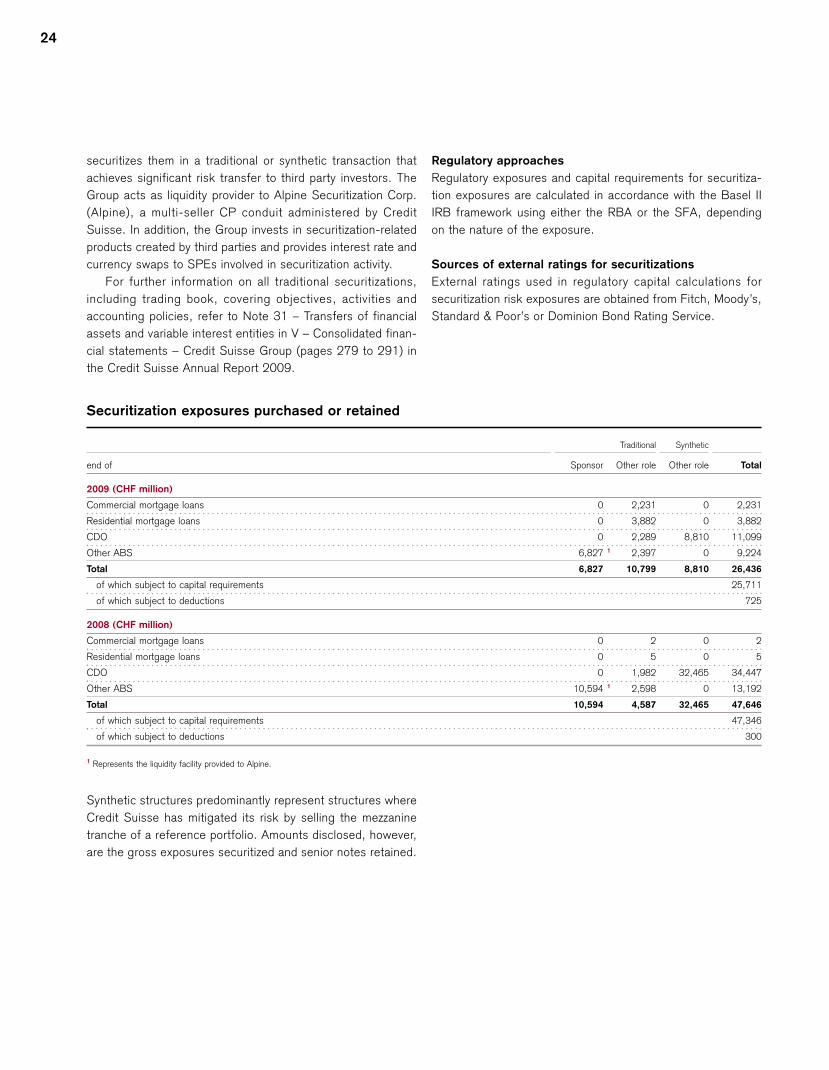
Securitization exposures purchased or retained
Regulatory approaches
Regulatory exposures and capital requirements for securitiza
tion exposures are calculated in accordance with the Basel II
IRB framework using either the RBA or the SFA, depending
on the nature of the exposure.
Sources of external ratings for securitizations
External ratings used in regulatory capital calculations for
securitization risk exposures are obtained from Fitch, Moody’s,
Standard & Poor’s or Dominion Bond Rating Service.
Traditional Synthetic
end of Sponsor Other role Other role Total
2009 (CHF million)
Commercial mortgage loans 0 2,231 0 2,231
Residential mortgage loans 0 3,882 0 3,882
CDO 0 2,289 8,810 11,099
Other ABS 6,827 1 2,397 0 9,224
Total 6,827 10,799 8,810 26,436
of which subject to capital requirements 25,711
of which subject to deductions
2008 (CHF million)
Commercial mortgage loans 0 2 0 2
Residential mortgage loans 0 5 0 5
CDO 0 1,982 32,465 34,447
Other ABS 10,594 1 2,598 0 13,192
Total 10,594 4,587 32,465 47,646
of which subject to capital requirements 47,346
of which subject to deductions
1 Represents the liquidity facility provided to Alpine.
Synthetic structures predominantly represent structures where
Credit Suisse has mitigated its risk by selling the mezzanine
tranche of a reference portfolio. Amounts disclosed, however,
are the gross exposures securitized and senior notes retained.
725
300
Basel II – Pillar 3 25
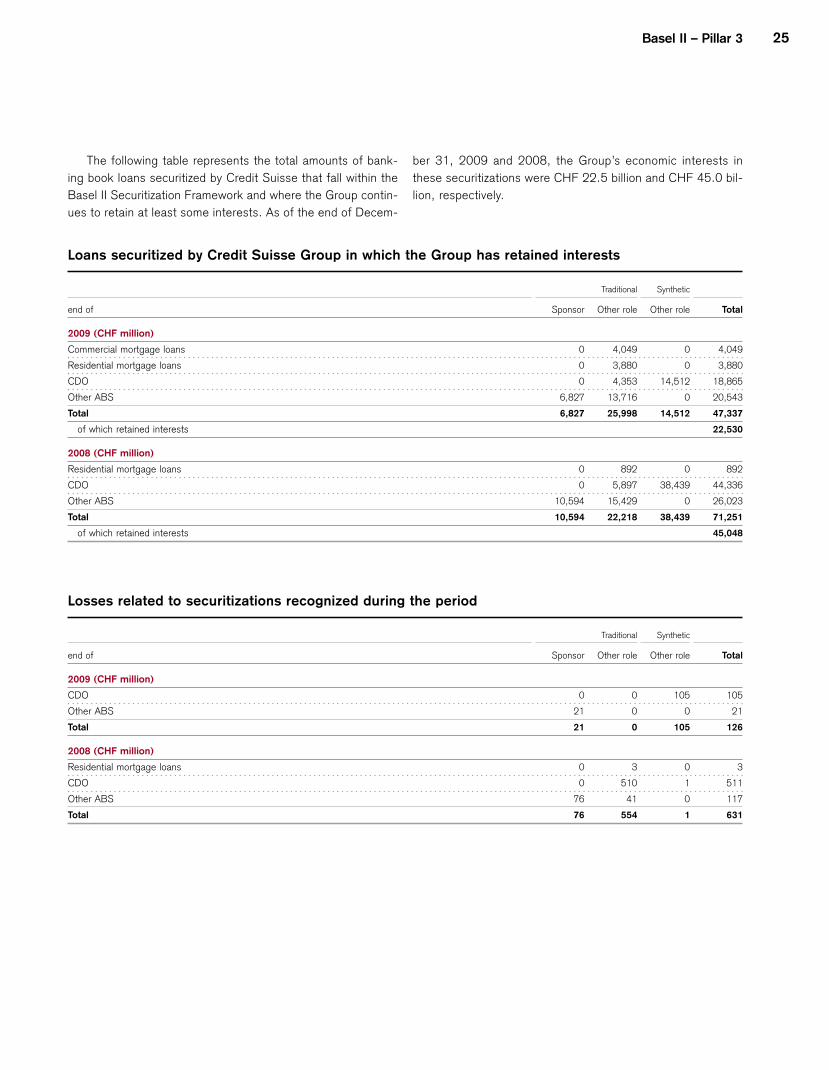
The following table represents the total amounts of bank ber 31, 2009 and 2008, the Group’s economic interests in
ing book loans securitized by Credit Suisse that fall within the these securitizations were CHF 22.5 billion and CHF 45.0 bil-
Basel II Securitization Framework and where the Group contin lion, respectively.
ues to retain at least some interests. As of the end of Decem-
Loans securitized by Credit Suisse Group in which the Group has retained interests
Traditional Synthetic
end of Sponsor Other role Other role Total
2009 (CHF million)
Commercial mortgage loans 0 4,049 0 4,049
Residential mortgage loans 0 3,880 0 3,880
CDO 0 4,353 14,512 18,865
Other ABS
Total
of which retained interests
6,827
6,827
13,716
25,998
0
14,512
20,543
47,337
22,530
2008 (CHF million)
Residential mortgage loans 0 892 0 892
CDO 0 5,897 38,439 44,336
Other ABS 10,594 15,429 0 26,023
Total 10,594 22,218 38,439 71,251
of which retained interests 45,048
Losses related to securitizations recognized during the period
Traditional Synthetic
end of Sponsor Other role Other role Total
2009 (CHF million)
CDO 0 0 105 105
Other ABS 21 0 0 21
Total 21 0 105 126
2008 (CHF million)
Residential mortgage loans 0 3 0 3
CDO 0 510 1 511
Other ABS 76 41 0 117
Total 76 554 1 631
26
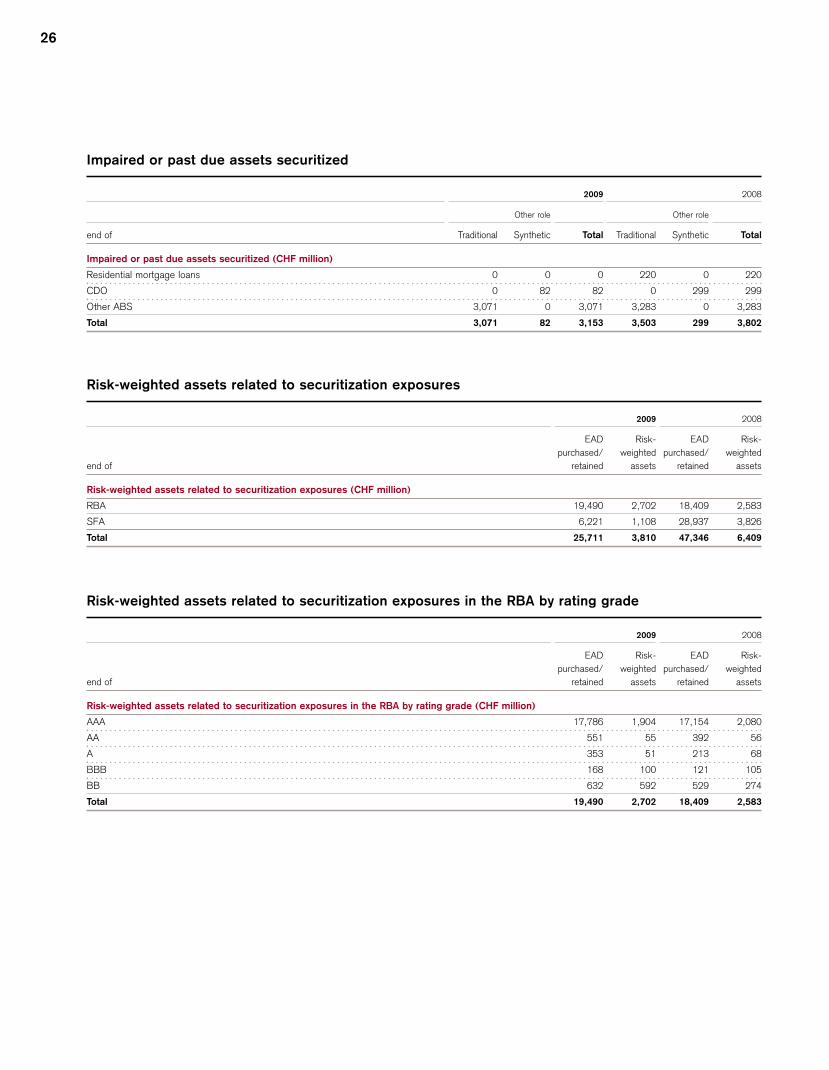
Impaired or past due assets securitized
2009 2008
Other role Other role
end of Traditional Synthetic Total Traditional Synthetic Total
Impaired or past due assets securitized (CHF million)
Residential mortgage loans 0 0 0 220 0 220
CDO 0 82 82 0 299
Other ABS 3,071 0 3,071 3,283 0 3,283
Total 3,071 82 3,153 3,503 299 3,802
Risk-weighted assets related to securitization exposures
2009 2008
EAD Risk- EAD Risk-
purchased/ weighted purchased/ weighted
end of retained assets retained assets
Risk-weighted assets related to securitization exposures (CHF million)
RBA 19,490 2,702 18,409 2,583
SFA 6,221 1,108 28,937 3,826
Total 25,711 3,810 47,346 6,409
Risk-weighted assets related to securitization exposures in the RBA by rating grade
2009 2008
EAD Risk- EAD Risk-
purchased/ weighted purchased/ weighted
end of retained assets retained assets
Risk-weighted assets related to securitization exposures in the RBA by rating grade (CHF million)
AAA 17,786 1,904 17,154 2,080
AA 551 55 392 56
A 353 51 213 68
BBB 168 100 121 105
BB 632 592 529 274
Total 19,490 2,702 18,409 2,583
299
Basel II – Pillar 3 27
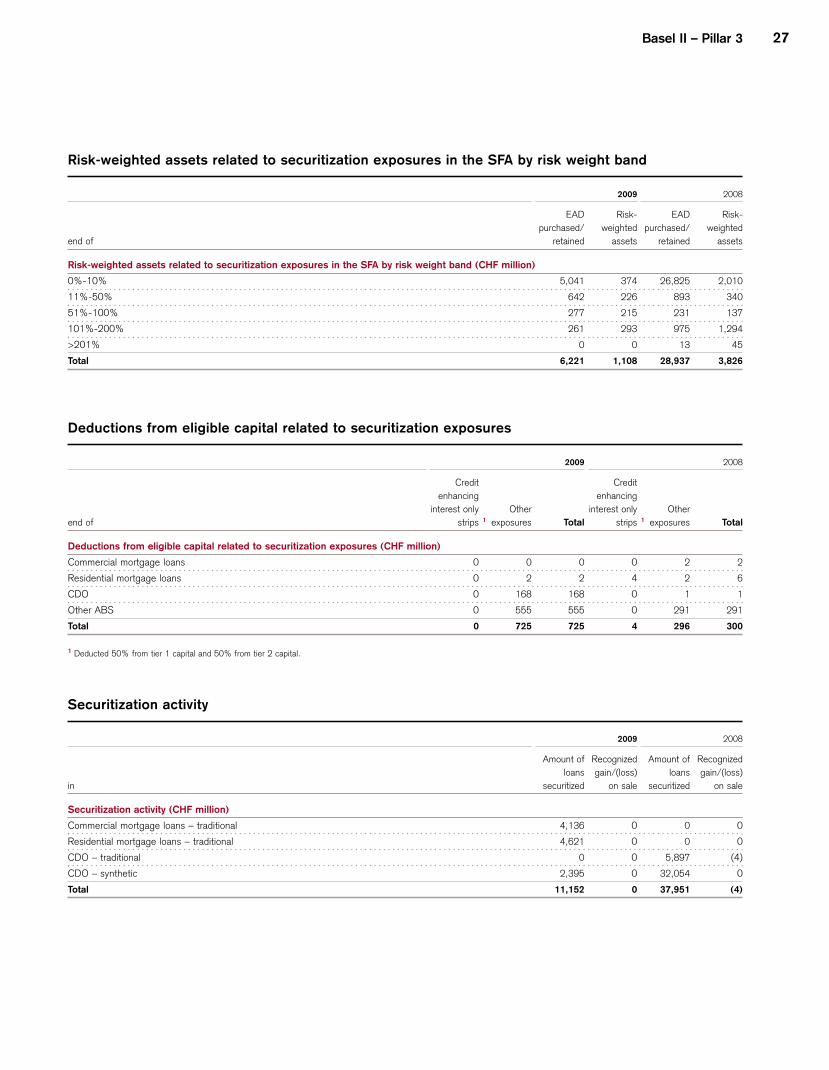
Risk-weighted assets related to securitization exposures in the SFA by risk weight band
2009 2008
EAD Risk- EAD Risk-
purchased/ weighted purchased/ weighted
end of retained assets retained assets
Risk-weighted assets related to securitization exposures in the SFA by risk weight band (CHF million)
0%-10% 5,041 374 26,825 2,010
11%-50% 642 226 893 340
51%-100% 277 215 231 137
101%-200% 261 293 975 1,294
>201% 0 0 13 45
Total 6,221 1,108 28,937 3,826
Deductions from eligible capital related to securitization exposures
2009 2008
end of
Credit
enhancing
interest only Other
strips 1 exposures
Credit
enhancing
interest only Other
Total strips 1 exposures Total
Deductions from eligible capital related to securitization exposures (CHF million)
Commercial mortgage loans 0 0 0 0 2 2
Residential mortgage loans 0 2 2 4 2 6
CDO 0 168 168 0 1 1
Other ABS 0 555 555 0 291 291
Total 0 725 725 4 296 300
1 Deducted 50% from tier 1 capital and 50% from tier 2 capital.
Securitization activity
2009 2008
in
Amount of
loans
securitized
Recognized
gain/(loss)
on sale
Amount of
loans
securitized
Recognized
gain/(loss)
on sale
Securitization activity (CHF million)
Commercial mortgage loans – traditional 4,136 0 0 0
Residential mortgage loans – traditional 4,621 0 0 0
CDO – traditional 0 0 5,897 (4)
CDO – synthetic 2,395 0 32,054 0
Total 11,152 0 37,951 (4)
28
6. Market risk
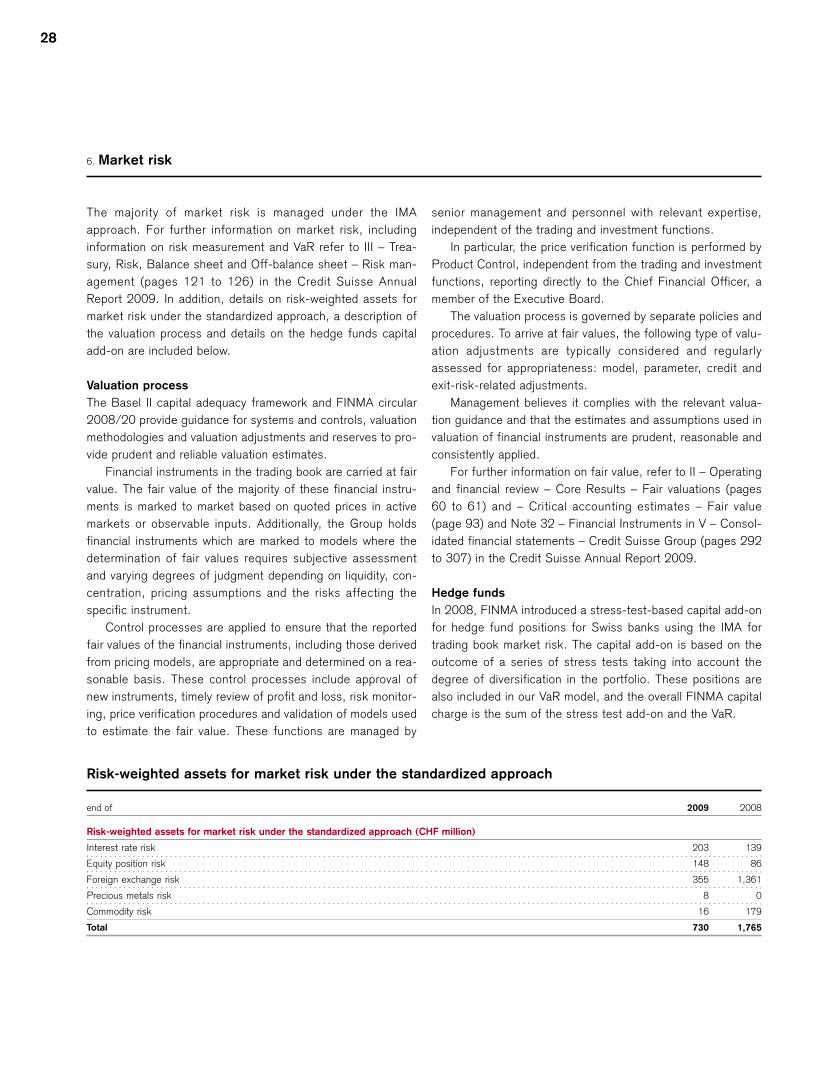
The majority of market risk is managed under the IMA
approach. For further information on market risk, including
information on risk measurement and VaR refer to III – Trea
sury, Risk, Balance sheet and Off-balance sheet – Risk man
agement (pages 121 to 126) in the Credit Suisse Annual
Report 2009. In addition, details on risk-weighted assets for
market risk under the standardized approach, a description of
the valuation process and details on the hedge funds capital
add-on are included below.
Valuation process
The Basel II capital adequacy framework and FINMA circular
2008/20 provide guidance for systems and controls, valuation
methodologies and valuation adjustments and reserves to pro
vide prudent and reliable valuation estimates.
Financial instruments in the trading book are carried at fair
value. The fair value of the majority of these financial instru
ments is marked to market based on quoted prices in active
markets or observable inputs. Additionally, the Group holds
financial instruments which are marked to models where the
determination of fair values requires subjective assessment
and varying degrees of judgment depending on liquidity, con
centration, pricing assumptions and the risks affecting the
specific instrument.
Control processes are applied to ensure that the reported
fair values of the financial instruments, including those derived
from pricing models, are appropriate and determined on a rea
sonable basis. These control processes include approval of
new instruments, timely review of profit and loss, risk monitor
ing, price verification procedures and validation of models used
to estimate the fair value. These functions are managed by
senior management and personnel with relevant expertise,
independent of the trading and investment functions.
In particular, the price verification function is performed by
Product Control, independent from the trading and investment
functions, reporting directly to the Chief Financial Officer, a
member of the Executive Board.
The valuation process is governed by separate policies and
procedures. To arrive at fair values, the following type of valu
ation adjustments are typically considered and regularly
assessed for appropriateness: model, parameter, credit and
exit-risk-related adjustments.
Management believes it complies with the relevant valua
tion guidance and that the estimates and assumptions used in
valuation of financial instruments are prudent, reasonable and
consistently applied.
For further information on fair value, refer to II – Operating
and financial review – Core Results – Fair valuations (pages
60 to 61) and – Critical accounting estimates – Fair value
(page 93) and Note 32 – Financial Instruments in V – Consol
idated financial statements – Credit Suisse Group (pages 292
to 307) in the Credit Suisse Annual Report 2009.
Hedge funds
In 2008, FINMA introduced a stress-test-based capital add-on
for hedge fund positions for Swiss banks using the IMA for
trading book market risk. The capital add-on is based on the
outcome of a series of stress tests taking into account the
degree of diversification in the portfolio. These positions are
also included in our VaR model, and the overall FINMA capital
charge is the sum of the stress test add-on and the VaR.
Risk-weighted assets for market risk under the standardized approach
end of 2009 2008
Risk-weighted assets for market risk under the standardized approach (CHF million)
Interest rate risk 203 139
Equity position risk 148 86
Foreign exchange risk 355 1,361
Precious metals risk 8 0
Commodity risk 16 179
Total 730 1,765
Basel II – Pillar 3 29
7. Operational risk
For information on operational risk, refer to III – Treasury, Risk, (page 135) in the Credit Suisse Annual Report 2009.
Balance sheet and Off-balance sheet – Risk management
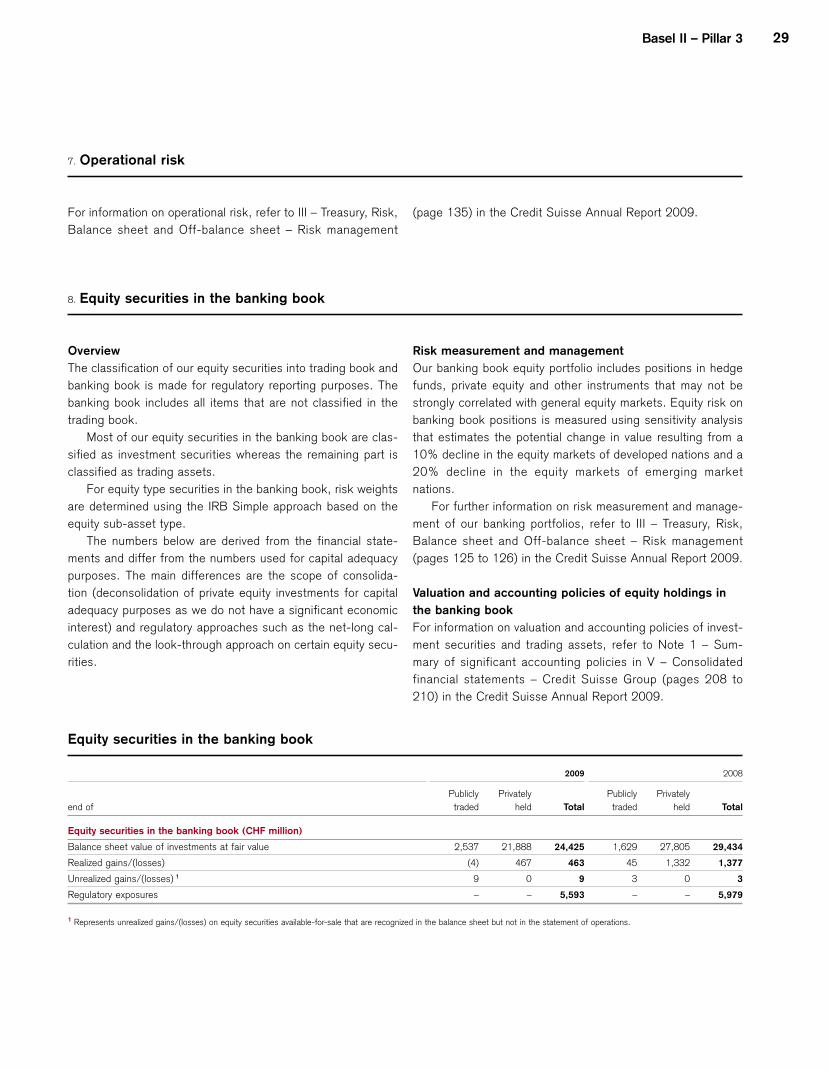
8. Equity securities in the banking book
Overview
The classification of our equity securities into trading book and
banking book is made for regulatory reporting purposes. The
banking book includes all items that are not classified in the
trading book.
Most of our equity securities in the banking book are clas
sified as investment securities whereas the remaining part is
classified as trading assets.
For equity type securities in the banking book, risk weights
are determined using the IRB Simple approach based on the
equity sub-asset type.
The numbers below are derived from the financial state
ments and differ from the numbers used for capital adequacy
purposes. The main differences are the scope of consolida
tion (deconsolidation of private equity investments for capital
adequacy purposes as we do not have a significant economic
interest) and regulatory approaches such as the net-long cal
culation and the look-through approach on certain equity secu
rities.
Equity securities in the banking book
Risk measurement and management
Our banking book equity portfolio includes positions in hedge
funds, private equity and other instruments that may not be
strongly correlated with general equity markets. Equity risk on
banking book positions is measured using sensitivity analysis
that estimates the potential change in value resulting from a
10% decline in the equity markets of developed nations and a
20% decline in the equity markets of emerging market
nations.
For further information on risk measurement and manage
ment of our banking portfolios, refer to III – Treasury, Risk,
Balance sheet and Off-balance sheet – Risk management
(pages 125 to 126) in the Credit Suisse Annual Report 2009.
Valuation and accounting policies of equity holdings in
the banking book
For information on valuation and accounting policies of invest
ment securities and trading assets, refer to Note 1 – Sum
mary of significant accounting policies in V – Consolidated
financial statements – Credit Suisse Group (pages 208 to
210) in the Credit Suisse Annual Report 2009.
2009 2008
Publicly Privately Publicly Privately
end of traded held Total traded held Total
Equity securities in the banking book (CHF million)
Balance sheet value of investments at fair value 2,537 21,888 24,425 1,629 27,805 29,434
Realized gains/(losses) (4) 467 463 45 1,332 1,377
Unrealized gains/(losses) 1 9 0 9 3 0 3
Regulatory exposures – – 5,593 – – 5,979
1 Represents unrealized gains/(losses) on equity securities available-for-sale that are recognized in the balance sheet but not in the statement of operations.
30
9. Interest rate risk in the banking book
Overview
We have systems and controls in place to manage interest rate
risk in the banking book. Risk sensitivity figures are provided
for the impact of a one basis point change in interest rates,
which is one of the primary ways in which these risks are
assessed for internal risk management purposes. In addition,
we confirm that the economic impacts of an adverse parallel
shift in interest rates of 200 basis points and a statistical 1
year, 99% confidence adverse change in yield curves are sig
nificantly below the threshold of 20% of eligible regulatory
capital used by regulators to identify banks that potentially run
excessive levels of non-trading interest rate risk. Given our low
levels of interest rate risk in the banking book, we do not have
any regulatory requirement to hold capital against this risk, nor
do we expect that the regulators will apply such a requirement
in the future.
Management strategy and process
The interest rate risk exposures in our non-trading portfolios
arise from a number of sources, including funding maturity
mismatches, money market activities, long-term debt
issuance, liquidity holdings, equity investment strategy and
exposures to credit spreads.
Most material non-trading interest rate risk arises from the
financial intermediation activities of the Private Banking divi
sion, resulting in non-trading directional interest rate risk
embedded in the balance sheet. Those risks are transferred
from the originating businesses to Treasury. Treasury then
manages the risk position centrally within approved limits using
hedging instruments such as interest rate swaps.
While the risks associated with fixed maturity transactions
are transferred to Treasury by individual back-to-back transac
tions, certain products such as variable rate mortgages or sav
ings deposits cannot be transferred in this way as those prod
ucts do not have direct market-linked interest rates or
contractual maturities. The interest rate risk associated with
these products, referred to as non-maturing products, is esti
mated using the methodology of replicating portfolios and
transferred to Treasury on a pooled basis. Based on the past
behavior of interest rates and volume changes, this methodol
ogy assigns the position balance associated with a non-matur
ing banking product to several time bands. The methodology is
based, where possible, on the principle of finding a stable
relationship between the changes of client rates of the non-
maturing product and an underlying investment portfolio.
Where this is not possible, the maturity of the product is
assessed based on volume stability only. These schedules can
then be used to evaluate the product’s interest rate sensitivity.
The structure and parameters of the replicating portfolios are
reviewed periodically to ensure continued relevance of the
portfolios in light of changing market conditions and client
behavior. The methodology, maximum tenor and allocation of
tranches in the replicating portfolios are ratified by the RPSC.
Interest rate risk also arises from the foreign exchange and
interest rate positioning strategy with respect to our equity bal
ance. The respective allocation strategy is defined by the
CARMC and implemented by Treasury.
While the majority of our non-trading interest rate risk
resides with Treasury or arises in conjunction with the interest
rate positioning of our equity balance, some branches, sub
sidiaries and businesses also take on non-trading interest rate
risk, which is managed within approved limits.
Risk measurement
The risks associated with the non-trading interest rate-sensi
tive portfolios are measured, monitored and limited using a
range of tools, including the following key measures:
p Interest rate sensitivity (DV01): Expresses the impact of a
one basis point (0.01%) parallel increase in interest rates
on a portfolio’s fair value. DV01 represents a transparent
and intuitive (non-statistical) indicator of outright direc
tional interest rate risk.
p Value-at-risk (VaR): Statistical indicator of the potential
fair value loss, taking into account the probability of inter
est rate movements and observed correlations across yield
curve tenors and currencies. In addition, VaR takes into
account yield curve risk, spread and basis risks, as well as
foreign exchange and equity risk. VaR is calibrated to a
10-day holding period with a 99% confidence level and
calculated using the historical simulation approach.
p Economic capital: Similar to VaR, economic capital repre
sents a statistical risk indicator, taking into account market
risks and other sources of risk, including counterparty
exposure. Economic capital is calibrated to a 1-year hold
ing period with a 99% confidence level.
p Economic value scenario analysis: Expresses the impact of
a severe instantaneous change in interest rates on a port
folio’s fair value. In particular, we assess compliance with
regulatory requirements regarding appropriate levels of
non-trading interest rate risk by estimating the economic
impact of adverse 200 basis point parallel moves in yield
curves and adverse interest rate moves calibrated to a 1
year holding period with a 99% confidence level and then
relating those impacts to the total eligible regulatory capi
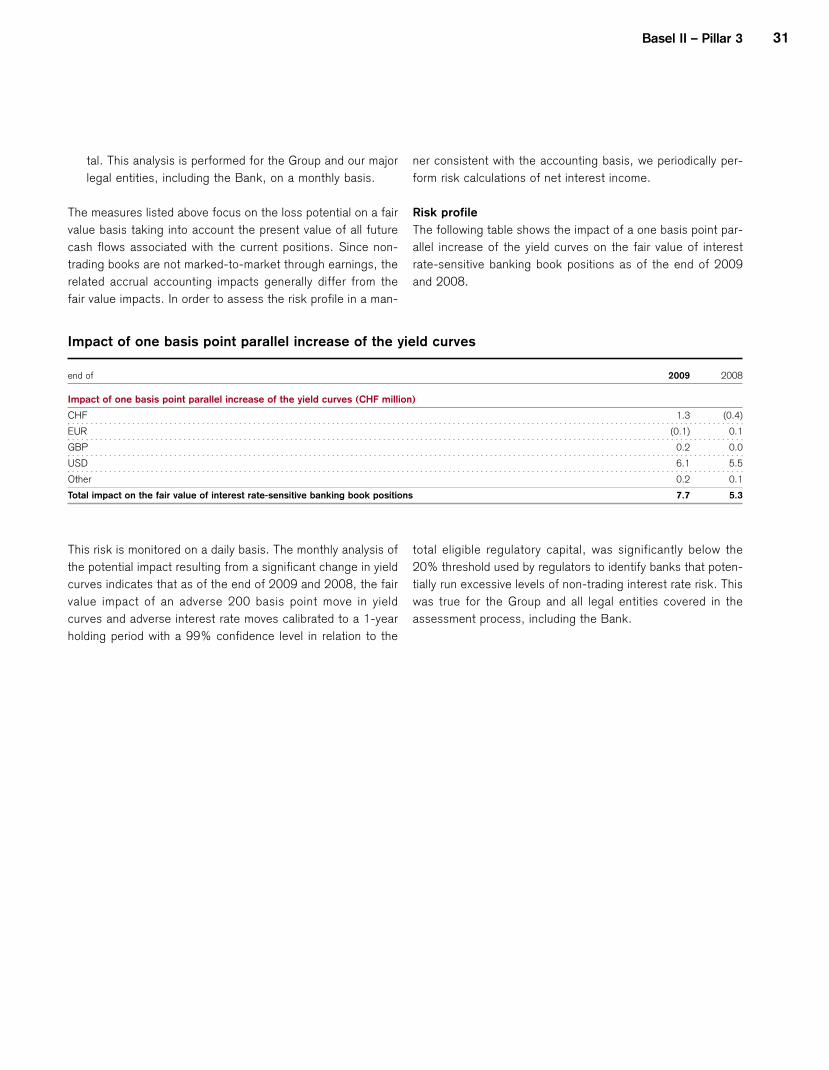
Basel II – Pillar 3 31
tal. This analysis is performed for the Group and our major
legal entities, including the Bank, on a monthly basis.
The measures listed above focus on the loss potential on a fair
value basis taking into account the present value of all future
cash flows associated with the current positions. Since non
trading books are not marked-to-market through earnings, the
related accrual accounting impacts generally differ from the
fair value impacts. In order to assess the risk profile in a man
ner consistent with the accounting basis, we periodically per
form risk calculations of net interest income.
Risk profile
The following table shows the impact of a one basis point par
allel increase of the yield curves on the fair value of interest
rate-sensitive banking book positions as of the end of 2009
and 2008.
Impact of one basis point parallel increase of the yield curves
end of 2009 2008
Impact of one basis point parallel increase of the yield curves (CHF million)
CHF 1.3 (0.4)
EUR (0.1) 0.1
GBP 0.2 0.0
USD 6.1 5.5
Other 0.2 0.1
Total impact on the fair value of interest rate-sensitive banking book positions 7.7 5.3
This risk is monitored on a daily basis. The monthly analysis of
the potential impact resulting from a significant change in yield
curves indicates that as of the end of 2009 and 2008, the fair
value impact of an adverse 200 basis point move in yield
curves and adverse interest rate moves calibrated to a 1-year
holding period with a 99% confidence level in relation to the
total eligible regulatory capital, was significantly below the
20% threshold used by regulators to identify banks that poten
tially run excessive levels of non-trading interest rate risk. This
was true for the Group and all legal entities covered in the
assessment process, including the Bank.

32
List of abbreviations
A L
ABCP Asset-backed commercial paper LGD Loss Given Default
ABS Asset-backed securities
A-IRB Advanced Internal Ratings-Based Approach M
AMA Advanced Measurement Approach MDB Multilateral Development Banks
B O
BIA
BIS
Basic Indicator Approach
Bank for International Settlements
OTC Over-the-counter
P
C PD Probability of Default
CARMC Capital Allocation & Risk Management Committee
CCF Credit Conversion Factor R
CRM Credit Risk Management RBA Ratings-Based Approach
RPSC Risk Processes and Standards Committee
D
DLE Derivative Loan Equivalent S
SFA Supervisory Formula Approach
E SPE Special purpose entity
EAD Exposure at Default SRW Supervisory Risk Weights Approach
U
US GAAP Accounting principles generally accepted in the US
F
FINMA Swiss Financial Market Supervisory Authority FINMA V
VaR Value-at-Risk
I
IAA Internal Assessment Approach
IMA Internal Models Approach
IRB Internal Ratings-Based Approach

Cautionary statement regarding forward-looking information
This report contains statements that constitute forward-looking
statements within the meaning of the Private Securities Litigation Reform
Act. In addition, in the future we, and others on our behalf, may make
statements that constitute forward-looking statements. Such forward-
looking statements may include, without limitation, statements relating to
the following:
p our plans, objectives or goals;
p our future economic performance or prospects;
p the potential effect on our future performance of certain contingencies; and
p assumptions underlying any such statements.
Words such as “believes,” “anticipates,” “expects,” “intends” and “plans”
and similar expressions are intended to identify forward-looking
statements but are not the exclusive means of identifying such
statements. We do not intend to update these forward-looking statements
except as may be required by applicable securities laws.
By their very nature, forward-looking statements involve inherent risks and
uncertainties, both general and specific, and risks exist that predictions,
forecasts, projections and other outcomes described or implied in forward-
looking statements will not be achieved. We caution you that a number of
important factors could cause results to differ materially from the plans,
objectives, expectations, estimates and intentions expressed in such forward-
looking statements. These factors include:
p the ability to maintain sufficient liquidity and access capital markets;
p market and interest rate fluctuations;
p the strength of the global economy in general and the strength of the
economies of the countries in which we conduct our operations, in
particular the risk of a continued US or global economic downturn in 2010
and beyond;
p the direct and indirect impacts of continuing deterioration of subprime and
other real estate markets;
p further adverse rating actions by credit rating agencies in respect of
structured credit products or other credit-related exposures or of monoline
insurers;
p the ability of counterparties to meet their obligations to us;
p the effects of, and changes in, fiscal, monetary, trade and tax policies, and
currency fluctuations;
p political and social developments, including war, civil unrest or terrorist
activity;
p the possibility of foreign exchange controls, expropriation, nationalization or
confiscation of assets in countries in which we conduct our operations;
p operational factors such as systems failure, human error, or the failure to
implement procedures properly;
p actions taken by regulators with respect to our business and practices in
one or more of the countries in which we conduct our operations;
p the effects of changes in laws, regulations or accounting policies or
practices;
p competition in geographic and business areas in which we conduct our
operations;
p the ability to retain and recruit qualified personnel;
p the ability to maintain our reputation and promote our brand;
p the ability to increase market share and control expenses;
p technological changes;
p the timely development and acceptance of our new products and services
and the perceived overall value of these products and services by users;
p acquisitions, including the ability to integrate acquired businesses
successfully, and divestitures, including the ability to sell non-core assets;
p the adverse resolution of litigation and other contingencies;
p the ability to achieve our cost efficiency goals and other cost targets; and
p our success at managing the risks involved in the foregoing.
We caution you that the foregoing list of important factors is not
exclusive. When evaluating forward-looking statements, you should
carefully consider the foregoing factors and other uncertainties and
events, as well as the information set forth in our Annual Report 2009 –
Additional Information – Risk Factors.

CREDIT SUISSE GROUP AG
Paradeplatz 8
8070 Zurich
Switzerland
Phone +41 44 212 16 16
www.credit-suisse.com