Embed Size (px)
Citation preview

*This view is a sample image of electricity consumption.
Supply-demand balance of electricity is indicated based on the comparison between actual demand updated every five minutes and the maximum supply capacity.
Demand forecast* is provided at around 8am, indicating hourly forecast of maximum demand from 9am to 9pm on weekdays. *The demand forecast Is updated every hour on the hour from 10am to 8 pm By the comparison with the maximum supply capacity you can check the demand forecast and the possibility of tightening of supply-demand balance in advance.

*This view is a sample image of electricity consumption.
Forecasted Maximum Demand Weather forecast (fine, cloudy, rain etc.) Temperature forecast (Highest/Lowest) Actual electricity demand in the past Characteristics of the days * Difference between weekdays and holidays etc. Maximum electricity demand in a day , forecasted by considering the impact from electricity saving and business condition
* Forecast for the next day is provided every day at around 6:00 pm. * Data is updated at 8:30 am on weekdays, posted at around 9:00 am.

*Sunshine hours are imaged by the reference of the sun rise and sunset time in Tokyo on Jul.23 which is the day with maximum demand in summer in 2011 [Reference] National Astronomical Observatory of Japan website

*Sunshine hours are imaged by the reference of the sun rise and sunset time in Tokyo on Jul.23 which is the day with maximum demand in summer in 2011 [Reference] National Astronomical Observatory of Japan website

*This view is a sample image of electricity consumption.
Maximum Supply Capacity
Maximum Supply Capacity is the maximum generation output available at the day,which can be obtained by deducting the capacity of outage plants for maintenance and the decreased capacity caused by decreased flow rate of rivers from the total generation capacity.
As flow rate of rivers and available generators vary every day, Maximum Supply Capacity accordingly change every day.
* Forecast for the next day is provided every day at around 6:00 pm.
* Data is updated at 8:30 am on weekdays, posted at around 9:00 am.


Installed capacity is the amount of electricity generated that each power plant is able to output when they can get full amount of permitted river flow*, though the volume fluctuates every day. *Permitted in-take volume of river flow : Each hydro generating facility has been permitted by the Government for how much water volume they can take from the river. The volume of river flow should be more than permitted.
The amount of electricity generated decreases, depending on the season and weather. It also decreases when the river flow is smaller or when fallen leaves or dusts pour into river water after a hurricane. For some reason the generating facilities sometimes become unable to take in river water.


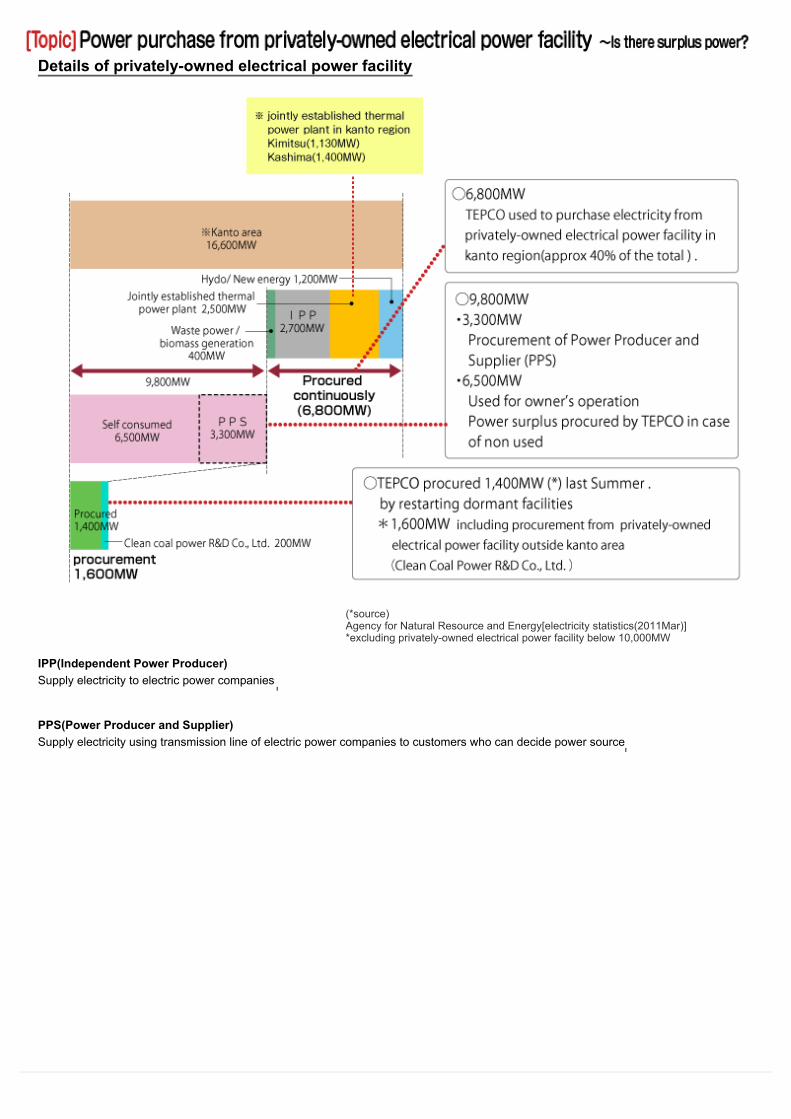
Details of privately-owned electrical power facility
(*source) Agency for Natural Resource and Energy[electricity statistics(2011Mar)] *excluding privately-owned electrical power facility below 10,000MW
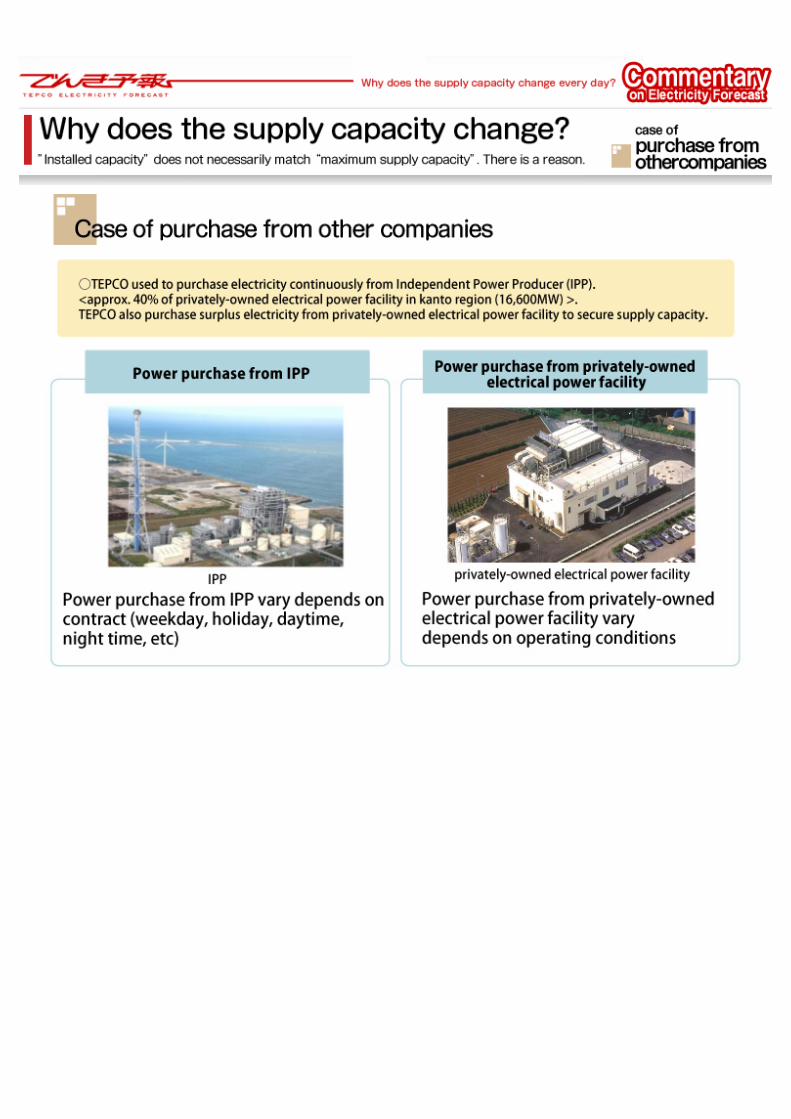
IPP(Independent Power Producer) Supply electricity to electric power companies
PPS(Power Producer and Supplier) Supply electricity using transmission line of electric power companies to customers who can decide power source


The center balances between demand (consumption) and supply (generating amount) to make them equal.

There are several power generation systems: hydroelectric power, thermal power, and nuclear power, etc. Electricity generation plans are worked out by taking into account the characteristics of each electricity generation system, such as thermal power generation capable of responding flexibly to fluctuating demand (consumption), and pumped storage hydroelectric power generation capable of responding quickly to demand during peak time. The output from each power station is adjusted based on this plan.

For ease of understanding how to adjust electricity generation output in response to the status of actual electricity demand, let's take an example of adjustment in the morning (7:00 am-9:00 am) …
This example is an operating plan for a certain day when peak time supply capacity is 130×10MW on 3 units of thermal power generators (A, B, C – 30×10MW each) and 2 units of pumped storage hydroelectric power generators (D, E – 20×10MW each).
※These output numbers differ from actual ones.
In fact, electricity is hardly consumed as forecasted. Taking into consideration the difference in response time at each plant before starting generation/increasing output, the output is adjusted in real time by monitoring electricity consumption.

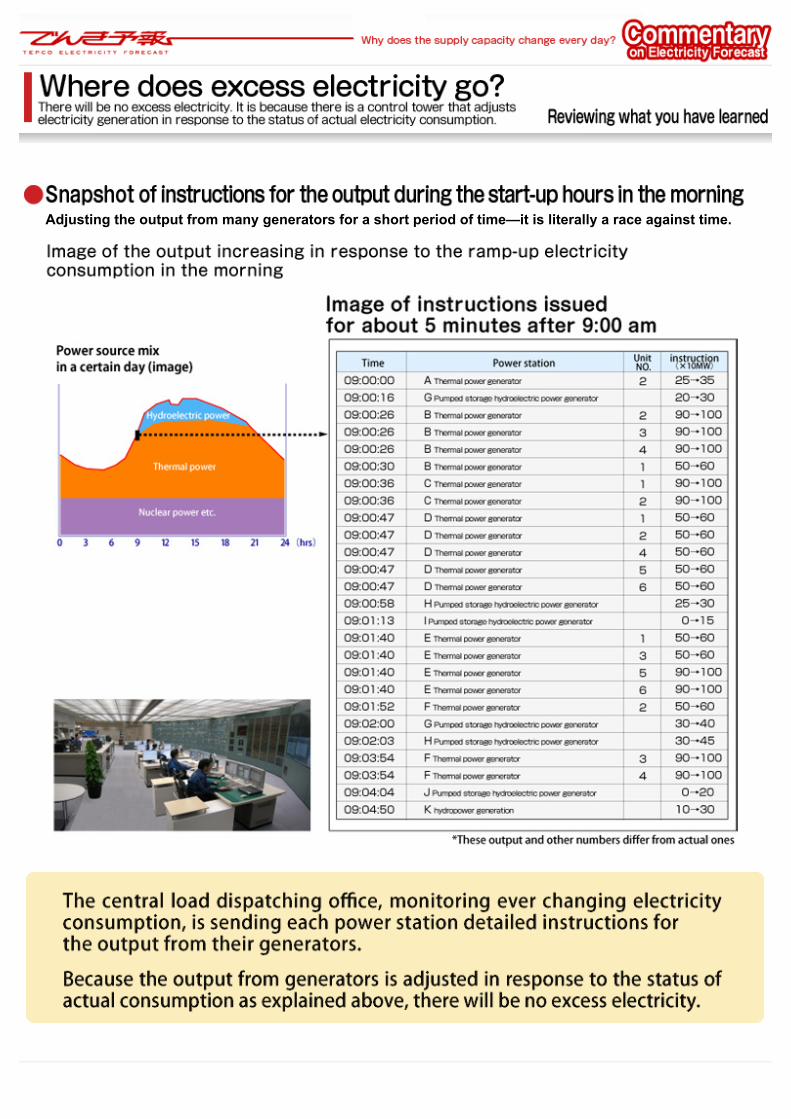
Adjusting the output from many generators for a short period of time—it is literally a race against time.


Electricity cannot be stored.
It is important to secure balance of generated amount and consumed amount.
If this balance is lost, frequency of 50 Hz, which accounts to the quality of electricity, cannot be maintained.
In order to maintain frequency, it is necessary to adjust generating capacity depending on the frequently changing demand (consumed amount), and to balance demand (consumed amount) and supply (generating amount).


"Last year's same day""Last year's same day" means the same day of the week of the same month and same week in a year ago, in principle.
Actual demand(1 hour)1 hour average of maximum actual power demand
Actual demand(5 minutes)Actual power demand in 5 minutes
Reference
The "Demand Forecast"The "Demand Forecast" will be posted from December 1st to February 29th for the hours between 9:00-20:59 except on Saturdays, Sundays and Holidays.


![Permitted Development for Householders_TechnicalGuidance[1]](https://img.pdfslide.us/doc/110x75/541615747bef0a7f3f8b4a82/permitted-development-for-householderstechnicalguidance1.jpg)
