Embed Size (px)
Citation preview
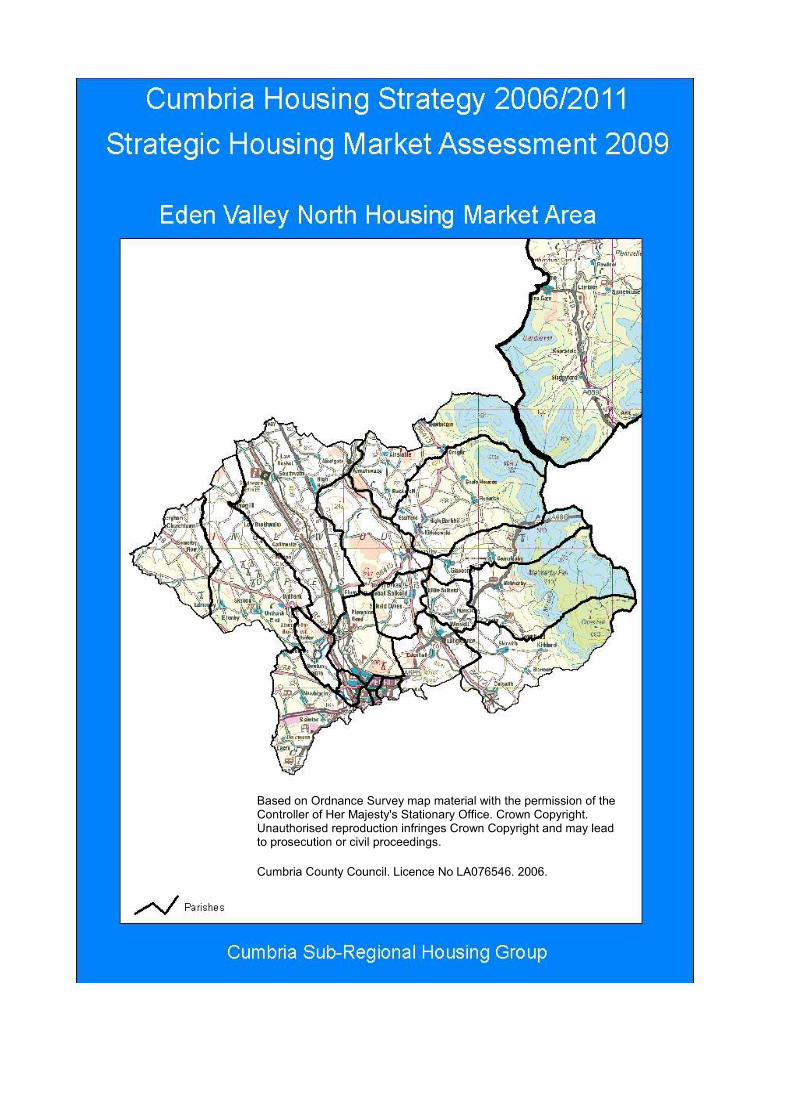
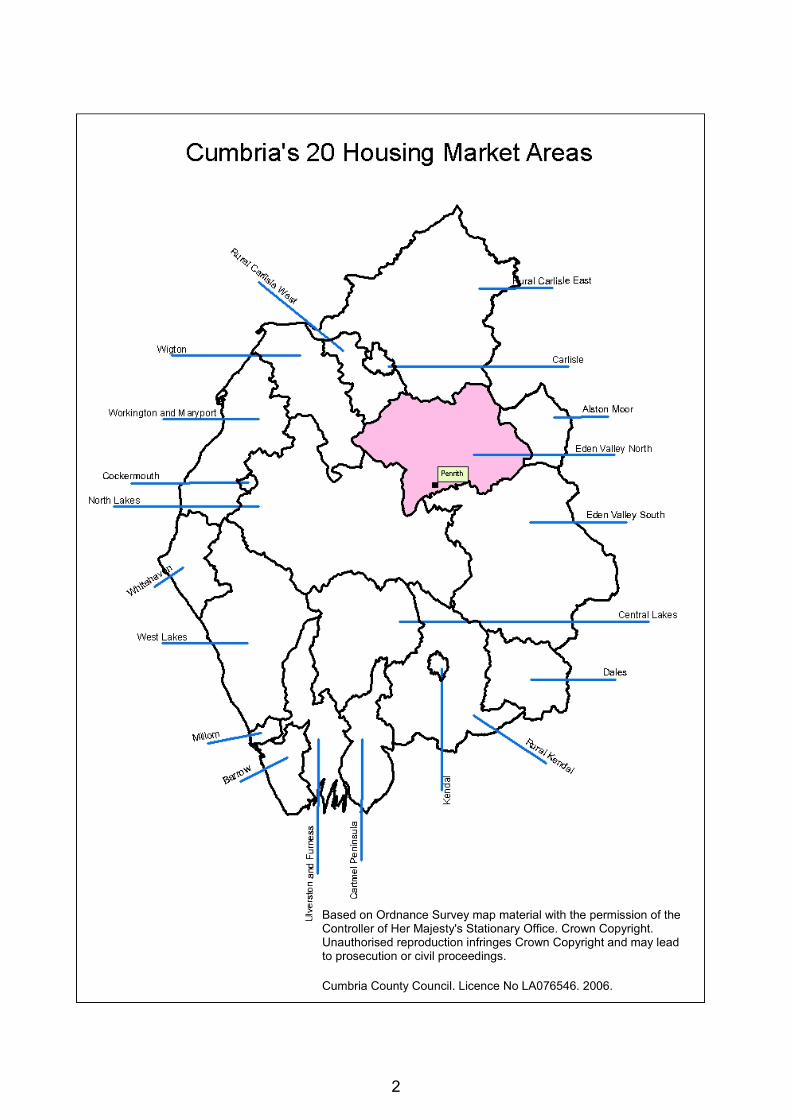
Based on Ordnance Survey map material with the permission of the Controller of Her Majesty's Stationary Office. Crown Copyright. Unauthorised reproduction infringes Crown Copyright and may lead to prosecution or civil proceedings.
Cumbria County Council. Licence No LA076546. 2006.
2
Based on Ordnance Survey map material with the permission of the Controller of Her Majesty's Stationary Office. Crown Copyright. Unauthorised reproduction infringes Crown Copyright and may lead to prosecution or civil proceedings.
Cumbria County Council. Licence No LA076546. 2006.
3
Eden Valley North Strategic Housing Market Assessment
List of Abbreviations ............................................................................................... 5
Current Market Profile ............................................................................................. 6
Headline Findings ...................................................................................................... 6
Targets ...................................................................................................................... 6
Key Issues ................................................................................................................. 7
Balanced Housing Market Indicators .................................................................... 9
The Current Housing Market ................................................................................ 10
Stage 1: The Demographic and Economic Context ................................................. 10
1.1 Demography and Household Types ......................................................... 10
1.2 National and Regional Economic Policy ................................................... 12
1.3 Employment Levels and Structure ............................................................ 20
1.4 Incomes and Earnings .............................................................................. 35
Stage 2: The Housing Stock .................................................................................... 41
2.1 The Dwelling Profile .................................................................................. 41
2.2 Stock Condition ........................................................................................ 44
2.3 Shared Housing and Communal Establishments ..................................... 44
Stage 3: The Active Market ..................................................................................... 45
3.1-3.2 The cost of buying or renting a property and affordability ......................... 45
3.3 Overcrowding and under-occupation ........................................................ 50
3.4 Vacancies, available supply and turnover by tenure................................. 51
3.5 Second Homes and Vacant Dwellings ...................................................... 52
Stage 4: Bringing the Evidence Together ................................................................ 53
4.1 Trends and Drivers ................................................................................... 53
4.2 Issues for Future Policy/ Strategy ............................................................. 54
The Future Housing Market .................................................................................. 56
Stage 1: Projecting changes in future numbers of households ................................ 56
Stage 2: Future Economic Performance .................................................................. 62
Stage 3: Future Affordability .................................................................................... 74
Stage 4: Bringing the Evidence Together ................................................................ 77
Housing Need (affordable housing) ..................................................................... 78
Stage 1: Current Housing Need ............................................................................... 78
Stage 2: Future Housing Need ................................................................................ 78
Stage 3: Affordable Housing Supply ........................................................................ 83
4
Permissions and Completions .................................................................... 84
Market led and affordable housing ..................................................................................... 84
Affordable housing only- permissions and completions ..................................................... 85
Stage 4: Housing Requirements of Households in Need ......................................... 86
Stage 5: Bringing the Evidence Together ................................................................ 87
Updated estimate of net annual housing need ................................................................... 87
Key issues for future policy/ strategy ................................................................................. 92
Housing Requirements of Specific Household Groups..................................... 93
Supported Housing .................................................................................................. 93
Older People ............................................................................................................ 96
Gypsy and Travellers ............................................................................................... 97
Homelessness ......................................................................................................... 97
Report Conclusions - Bringing the Evidence Together ..................................... 98
Bibliography ..................................................................................................................... 103
List of Tables........................................................................................................ 104
List of Graphs ...................................................................................................... 106
Appendices .................................................................................................................... 107
Appendix A - SHMA Report Methodology ............................................................. 107
Appendix B - Draft Local Housing Market Indicators 2009-10 ............................... 125
Appendix C - Additional Tables ............................................................................. 127
Appendix D - Definition and types of affordable housing ....................................... 129
Appendix E - Key Aspirational Scenario Assumptions .......................................... 132
Appendix F - Bed Space Allowances used for the 2006 Housing Needs Survey .. 134
5
Acknowledgements
Paula Kennerley, Cumbria County Council
Stuart Frank, Cumbria Vision
Note to the Strategic Housing Market Assessment
The SHMA documents have been prepared jointly by each Cumbria district in consultation with local and county stakeholders and have been compiled using the Governments‟ Strategic Housing Market Assessments Practice Guidance Version 2, August 2007. The documents are not intended to provide definitive estimates of housing need, demand and market conditions. However they aim to provide insights into how housing markets operate both now and in the future. They are intended to allow an evidence base upon which to develop planning and housing policies by considering the characteristics of the housing market, how key factors work together and the probable scale of change in future housing needs and demand (SHMA Guidance, 2007, pp7-9).
To allow ease of reference each stage of the assessment follows the same order as the Guidance. Data sources occasionally differ from those recommended in the Guidance where they have been unavailable or where more robust up to date information has been accessed. The following analysis looks at the housing market area and provides information on the wider District and Cumbrian level where this adds contextual information. For a full methodology and checklist of core outputs and process please see appendix A.
Abbreviations
EDC Eden District Council
HMA Housing market area
LDNP/A Lake District National Park/Authority
SHMA Strategic housing market assessment
TTWs Travel to work areas

6
1. Current Market Profile
This diverse Housing Market Area is strongly influenced both by Carlisle, lying at its northern boundary and the Lake District National Park to the south west, in addition to the Districts main service centre of Penrith in the south of the HMA.
There are strong commuting and migration connections within the radius of Penrith with many who live in the town and its hinterland also working there, and it has been noted that Penrith is a sustainable market town with a high degree of self-containment1. Penrith is both a base for industry and commuters with road and rail links running directly through it. A high proportion of Service industries are based in the area, with distribution, hotels and restaurants making up 28% of all industries in addition to the high proportion of public administration, education and health services. There are a number of attractive rural settlements within commuter distance from Penrith and Carlisle, and with comparatively lower house prices to the Lakes National Park this has made it a popular location for home owners. However house price to income ratios are generally high and affordability remains a problem for many local people.
Headline Findings
Penrith is a sustainable market town with the majority of migration and travel to work patterns falling within a 30km radius of the town.
There is a skilled workforce but in poorly paid jobs within the District and also professional people who can afford to live here but choose to commute to work.
To ensure continued sustainability and economic development there is a requirement for social housing and intermediate housing, particularly „family‟ homes for current residents, to support a balance housing market.
Housing Needs Survey indicates a decline in demand for large properties in outlying villages and an affordable need for smaller two-three bed houses.
Targets
The following targets have been devised for this market area. In order to achieve these appropriate actions from the Cumbria Housing Strategy Action Plan will be applied.
50 units of affordable housing per year for the next two years to be reviewed thereafter.
A target relating to floating support will be identified during the Supporting People review of Floating Support.
A target relating to move on accommodation will be identified within the Cumbria Move On Strategy, 2007/08.
100% of all social housing decent by 2010.
70% of private sector housing providing homes for vulnerable people to meet Decent Homes Standard by 2010.
At least one empty property returned to use through empty property grants per year.
1 Penrith Housing Study, Land Use Consultants and Jacqueline Blenkinship, March 2006
7
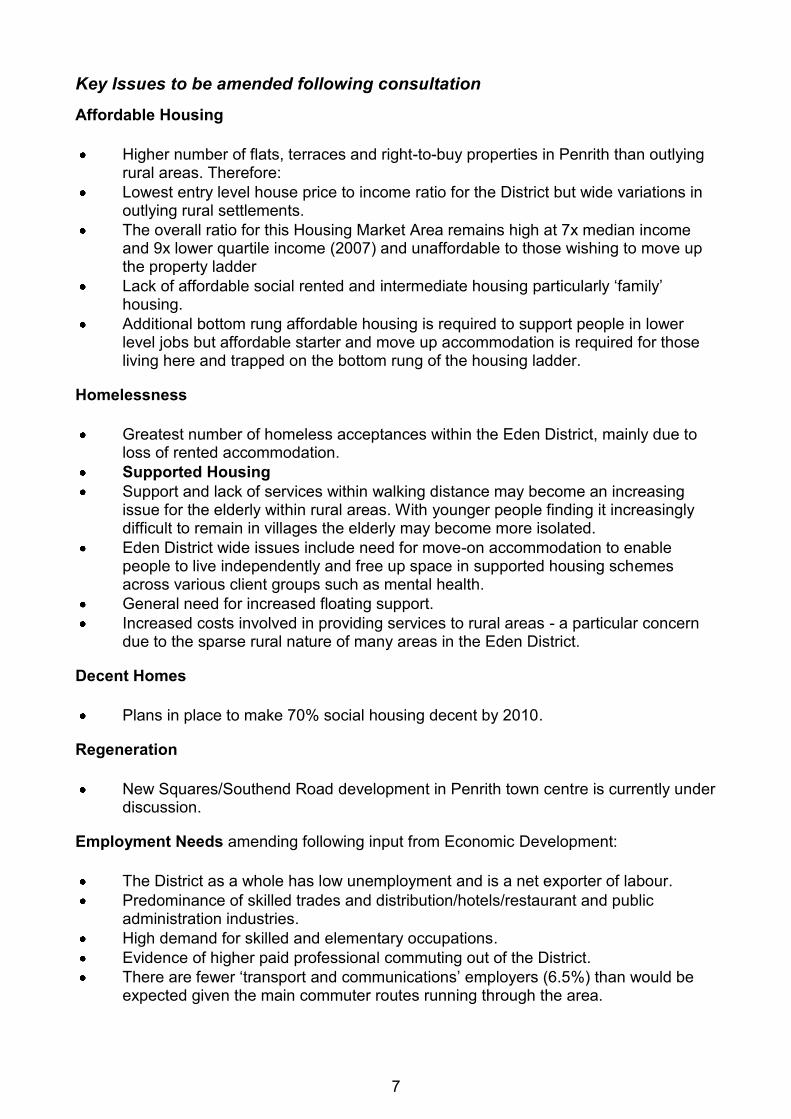
Key Issues to be amended following consultation
Affordable Housing
Higher number of flats, terraces and right-to-buy properties in Penrith than outlying rural areas. Therefore:
Lowest entry level house price to income ratio for the District but wide variations in outlying rural settlements.
The overall ratio for this Housing Market Area remains high at 7x median income and 9x lower quartile income (2007) and unaffordable to those wishing to move up the property ladder
Lack of affordable social rented and intermediate housing particularly „family‟ housing.
Additional bottom rung affordable housing is required to support people in lower level jobs but affordable starter and move up accommodation is required for those living here and trapped on the bottom rung of the housing ladder.
Homelessness
Greatest number of homeless acceptances within the Eden District, mainly due to loss of rented accommodation.
Supported Housing
Support and lack of services within walking distance may become an increasing issue for the elderly within rural areas. With younger people finding it increasingly difficult to remain in villages the elderly may become more isolated.
Eden District wide issues include need for move-on accommodation to enable people to live independently and free up space in supported housing schemes across various client groups such as mental health.
General need for increased floating support.
Increased costs involved in providing services to rural areas - a particular concern due to the sparse rural nature of many areas in the Eden District.
Decent Homes
Plans in place to make 70% social housing decent by 2010.
Regeneration
New Squares/Southend Road development in Penrith town centre is currently under discussion.
Employment Needs amending following input from Economic Development:
The District as a whole has low unemployment and is a net exporter of labour.
Predominance of skilled trades and distribution/hotels/restaurant and public administration industries.
High demand for skilled and elementary occupations.
Evidence of higher paid professional commuting out of the District.
There are fewer „transport and communications‟ employers (6.5%) than would be expected given the main commuter routes running through the area.
8
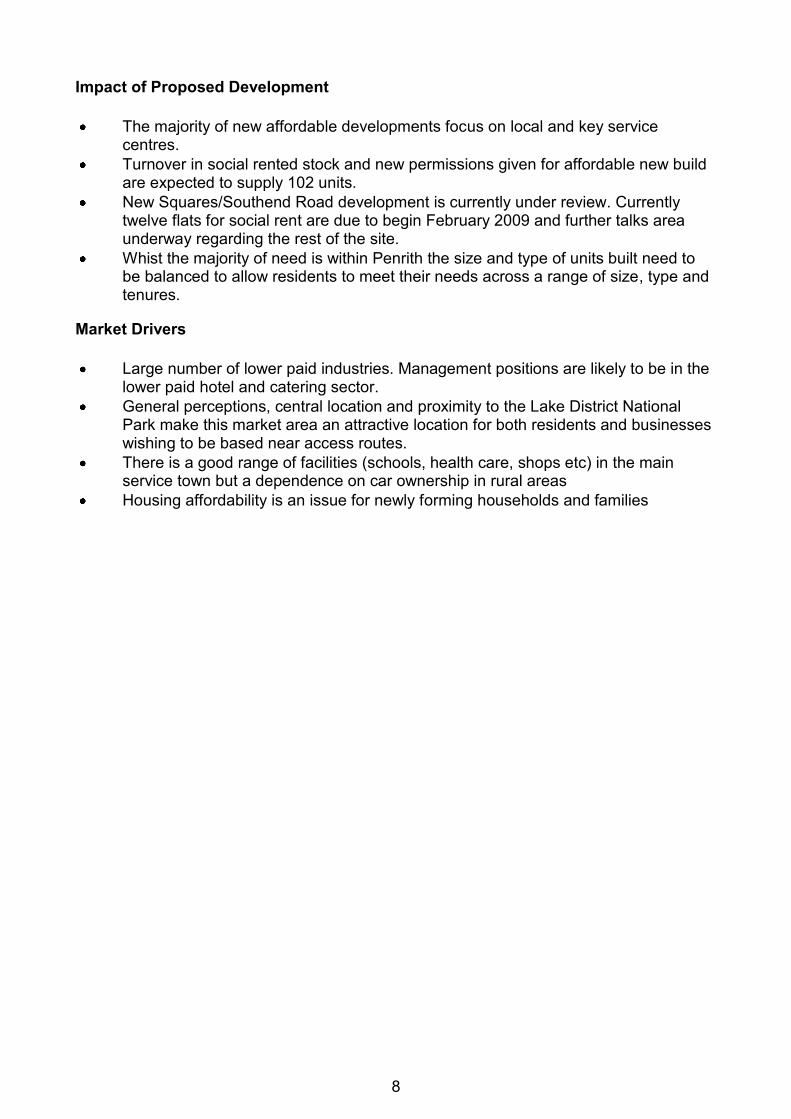
Impact of Proposed Development
The majority of new affordable developments focus on local and key service centres.
Turnover in social rented stock and new permissions given for affordable new build are expected to supply 102 units.
New Squares/Southend Road development is currently under review. Currently twelve flats for social rent are due to begin February 2009 and further talks area underway regarding the rest of the site.
Whist the majority of need is within Penrith the size and type of units built need to be balanced to allow residents to meet their needs across a range of size, type and tenures.
Market Drivers
Large number of lower paid industries. Management positions are likely to be in the lower paid hotel and catering sector.
General perceptions, central location and proximity to the Lake District National Park make this market area an attractive location for both residents and businesses wishing to be based near access routes.
There is a good range of facilities (schools, health care, shops etc) in the main service town but a dependence on car ownership in rural areas
Housing affordability is an issue for newly forming households and families

9
2. Balanced Housing Market Indicators
A set of local housing market indicators are in the process of being developed to assess the extent to which a housing market is balanced. Proposed indicators are contained in appendix B. Further work is needed to ensure the indicators can be monitored regularly and the information collected consistently across Cumbria. This will need the co-operation of social registered landlords, strategy and planning departments in collecting the data at housing market level.
10
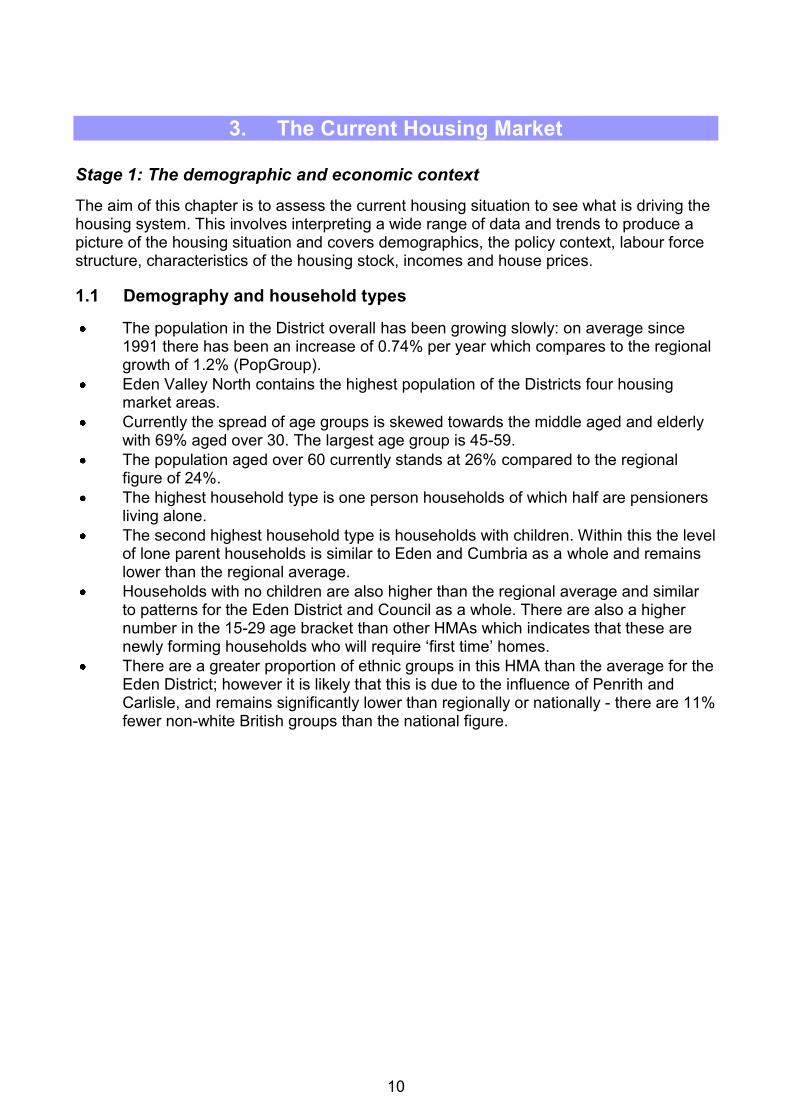
3. The Current Housing Market
Stage 1: The demographic and economic context
The aim of this chapter is to assess the current housing situation to see what is driving the housing system. This involves interpreting a wide range of data and trends to produce a picture of the housing situation and covers demographics, the policy context, labour force structure, characteristics of the housing stock, incomes and house prices.
1.1 Demography and household types
The population in the District overall has been growing slowly: on average since 1991 there has been an increase of 0.74% per year which compares to the regional growth of 1.2% (PopGroup).
Eden Valley North contains the highest population of the Districts four housing market areas.
Currently the spread of age groups is skewed towards the middle aged and elderly with 69% aged over 30. The largest age group is 45-59.
The population aged over 60 currently stands at 26% compared to the regional figure of 24%.
The highest household type is one person households of which half are pensioners living alone.
The second highest household type is households with children. Within this the level of lone parent households is similar to Eden and Cumbria as a whole and remains lower than the regional average.
Households with no children are also higher than the regional average and similar to patterns for the Eden District and Council as a whole. There are also a higher number in the 15-29 age bracket than other HMAs which indicates that these are newly forming households who will require „first time‟ homes.
There are a greater proportion of ethnic groups in this HMA than the average for the Eden District; however it is likely that this is due to the influence of Penrith and Carlisle, and remains significantly lower than regionally or nationally - there are 11% fewer non-white British groups than the national figure.
11
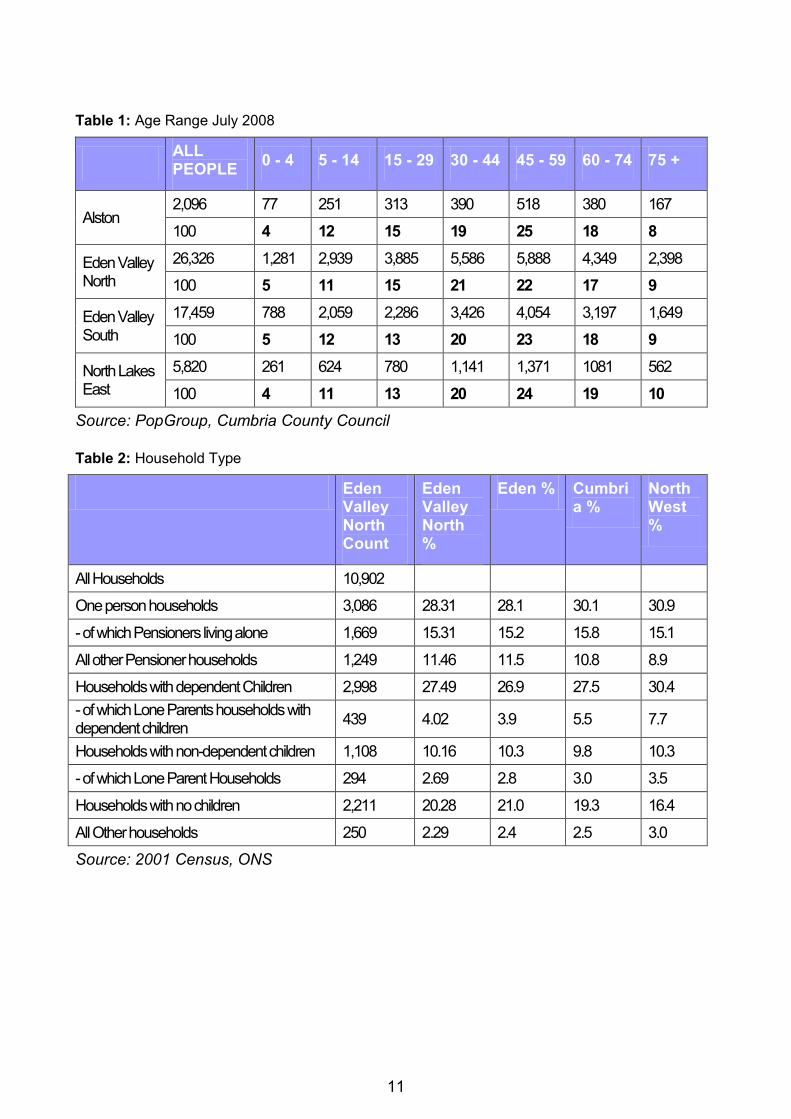
Table 1: Age Range July 2008
ALL PEOPLE
0 - 4 5 - 14 15 - 29 30 - 44 45 - 59 60 - 74 75 +
Alston 2,096 77 251 313 390 518 380 167
100 4 12 15 19 25 18 8
Eden Valley North
26,326 1,281 2,939 3,885 5,586 5,888 4,349 2,398
100 5 11 15 21 22 17 9
Eden Valley South
17,459 788 2,059 2,286 3,426 4,054 3,197 1,649
100 5 12 13 20 23 18 9
North Lakes East
5,820 261 624 780 1,141 1,371 1081 562
100 4 11 13 20 24 19 10
Source: PopGroup, Cumbria County Council
Table 2: Household Type
Eden Valley North Count
Eden Valley North %
Eden % Cumbria %
North West %
All Households 10,902
One person households 3,086 28.31 28.1 30.1 30.9
- of which Pensioners living alone 1,669 15.31 15.2 15.8 15.1
All other Pensioner households 1,249 11.46 11.5 10.8 8.9
Households with dependent Children 2,998 27.49 26.9 27.5 30.4
- of which Lone Parents households with dependent children
439 4.02 3.9 5.5 7.7
Households with non-dependent children 1,108 10.16 10.3 9.8 10.3
- of which Lone Parent Households 294 2.69 2.8 3.0 3.5
Households with no children 2,211 20.28 21.0 19.3 16.4
All Other households 250 2.29 2.4 2.5 3.0
Source: 2001 Census, ONS
12
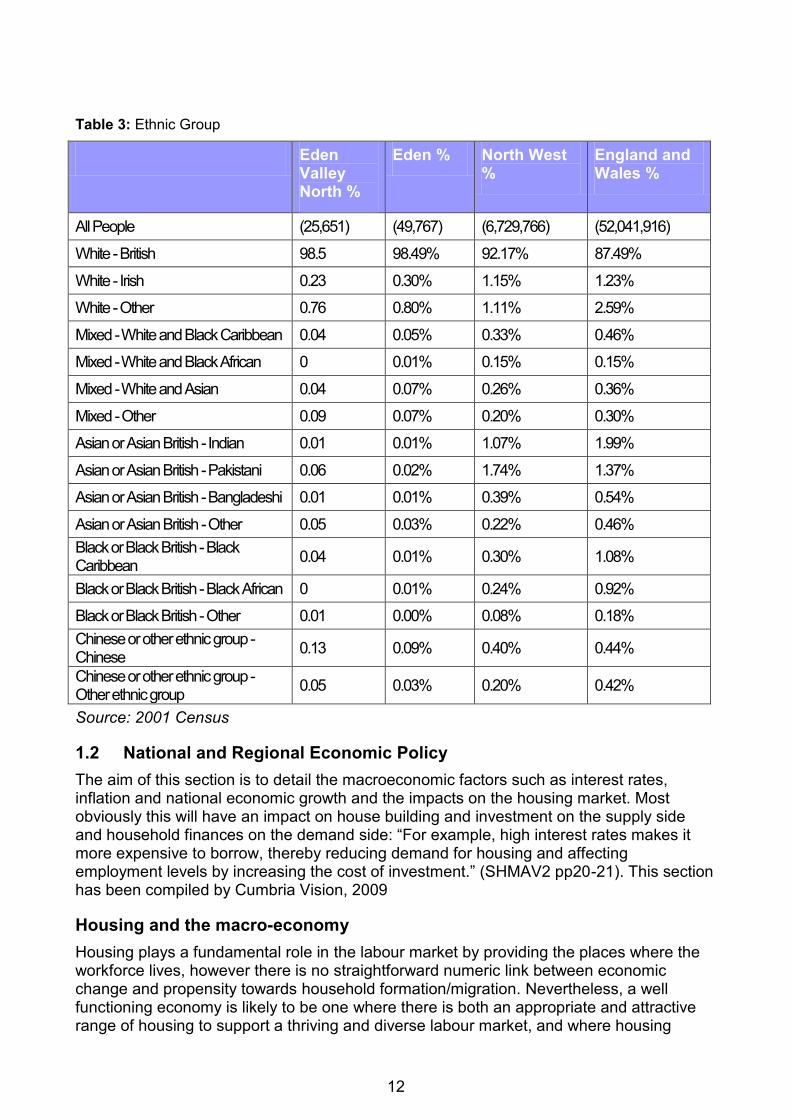
Table 3: Ethnic Group
Eden Valley North %
Eden % North West %
England and Wales %
All People (25,651) (49,767) (6,729,766) (52,041,916)
White - British 98.5 98.49% 92.17% 87.49%
White - Irish 0.23 0.30% 1.15% 1.23%
White - Other 0.76 0.80% 1.11% 2.59%
Mixed - White and Black Caribbean 0.04 0.05% 0.33% 0.46%
Mixed - White and Black African 0 0.01% 0.15% 0.15%
Mixed - White and Asian 0.04 0.07% 0.26% 0.36%
Mixed - Other 0.09 0.07% 0.20% 0.30%
Asian or Asian British - Indian 0.01 0.01% 1.07% 1.99%
Asian or Asian British - Pakistani 0.06 0.02% 1.74% 1.37%
Asian or Asian British - Bangladeshi 0.01 0.01% 0.39% 0.54%
Asian or Asian British - Other 0.05 0.03% 0.22% 0.46%
Black or Black British - Black Caribbean
0.04 0.01% 0.30% 1.08%
Black or Black British - Black African 0 0.01% 0.24% 0.92%
Black or Black British - Other 0.01 0.00% 0.08% 0.18%
Chinese or other ethnic group - Chinese
0.13 0.09% 0.40% 0.44%
Chinese or other ethnic group - Other ethnic group
0.05 0.03% 0.20% 0.42%
Source: 2001 Census
1.2 National and Regional Economic Policy
The aim of this section is to detail the macroeconomic factors such as interest rates, inflation and national economic growth and the impacts on the housing market. Most obviously this will have an impact on house building and investment on the supply side and household finances on the demand side: “For example, high interest rates makes it more expensive to borrow, thereby reducing demand for housing and affecting employment levels by increasing the cost of investment.” (SHMAV2 pp20-21). This section has been compiled by Cumbria Vision, 2009
Housing and the macro-economy
Housing plays a fundamental role in the labour market by providing the places where the workforce lives, however there is no straightforward numeric link between economic change and propensity towards household formation/migration. Nevertheless, a well functioning economy is likely to be one where there is both an appropriate and attractive range of housing to support a thriving and diverse labour market, and where housing
13
provision responds to changes in economic structure and performance. With this in mind, economic strategies and planning policy in the North West and across the UK now routinely highlight the impact that issues such as high prices, inadequate supply and poor quality housing might have on the capacity of an area to attract and retain a viable labour force.
National Context
Despite strong economic growth and broad stability since 1994/1995, current economic indications suggest that this position has changed significantly, brought about by high oil, utility and food costs, combined with a continued restriction on the availability of new mortgages brought on by the international „credit crunch‟ stemming from the USA, and the resultant loss of global business confidence. Most economists now agree that the UK economy will enter a recession in the forthcoming months, which could lead to increased levels of unemployment. As at September 2008, predictions are that average house prices will fall by up to 25%, and it will be 2010 before there may be signs of a recovery (Nationwide, September 2008). Other signals within the UK economy show that manufacturing output is declining as a further sign that the UK economy is entering a recession.
Recent news headlines would suggest that, with developers reducing staffing levels, the more alarming effects of the credit crunch, such as widespread job losses and large falls in land value are already being felt by the house building industry. Should a recession occur, it is likely that there would be further reductions in demand for housing, with resultant falls in house prices, until such time as a new equilibrium is reached between demand and supply and stability is achieved in the international markets. However, aside from the lending practices of major lenders, the underlying reasons behind the high house price inflation in recent years, is the fact that there has been insufficient housing provision to meet needs across the UK. Some economists predict that once the economy picks up again, there could be a further surge in house price inflation, which may be as serious as had been experienced in recent years. There is a need therefore to continue to build new houses in order to respond to underlying housing needs.
Monetary Policy
Interest rates reflect the effective cost of borrowing money and in the UK the base interest rate is set by the Bank of England‟s, Monetary Policy Committee (MPC). The Bank usually sets interest rates in order to try and meet an inflation target which is based on the Consumer Price Index (CPI) being equal to 2.0% ± 1. If inflation is forecast to rise above the target, the Bank is likely to raise interest rates in order to reduce spending in the economy, and therefore moderate inflationary pressures.
Following some significant price rises in the food and energy sectors over the last year, the CPI has soared above its target value peaking, in September, at 5.2%. However the CPI has now begun to fall back with the most recent data for January showing inflation at 3.1% (still well above the target value). Due largely to a recent fall in oil prices related to falling demand linked to declines in global production levels, inflation is currently expected to fall rapidly over the coming months.
Rather than responding impulsively in the short term, the Bank‟s overarching aim is to ensure inflation returns to target in the medium to long term. Thus principally as a result of the MPC‟s forecast that the currently high level of inflation is a temporary phenomenon, interest rates have remained low and below the 10 year average of 5.2%. Unsurprisingly, there are also a number of other factors which play an important role in the balancing act
14
between inflation and interest rates such as consumer confidence; time lags between rate changes and their effects on demand; the differential between the two rates and the ratio of fixed rate vs. variable rate mortgages (and in particular the proportion of sub-prime mortgages, where borrowers are paying a high proportion of their disposal income on repayments).
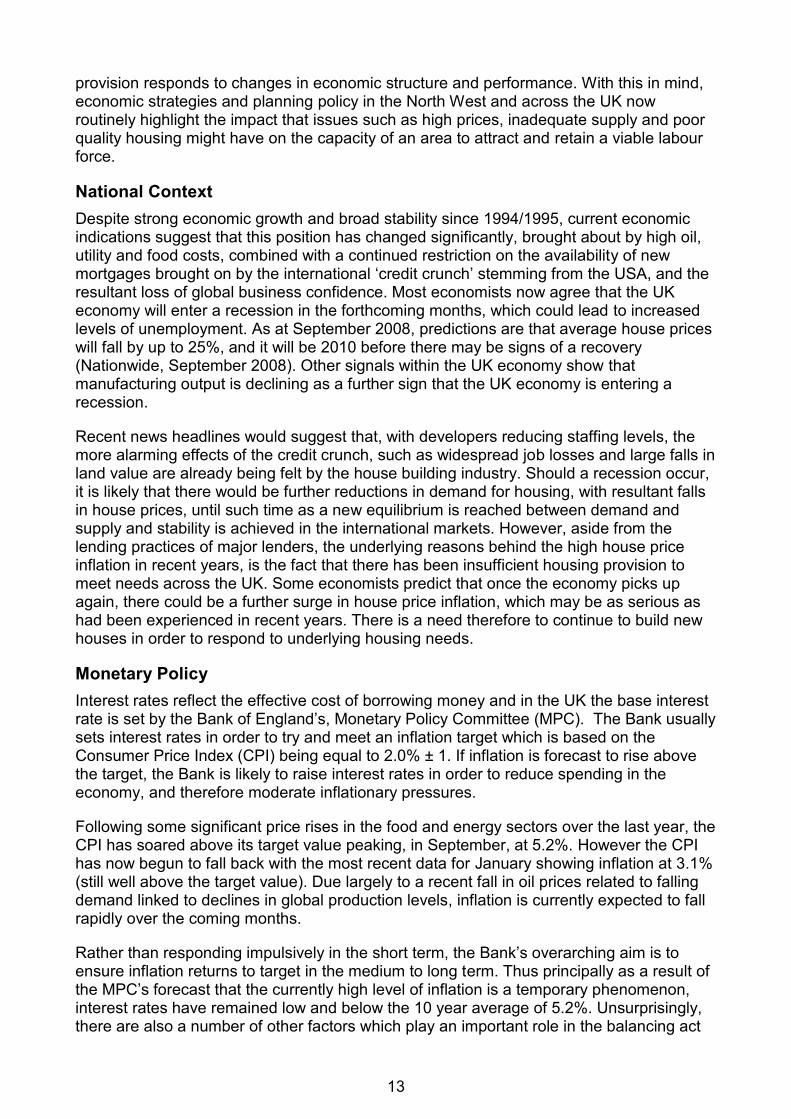
Responding to the severity of the global economic crisis and to help stimulate the British economy the Bank of England‟s official interest rate has been reduced significantly in recent months. A record monthly decline of 1.5 percentage points from 4.5% to 3.0% in November 2008 followed a 0.5% reduction in the interest rate in October. Subsequent reductions of 1.0% in December, 0.5% in January and a further 0.5% in February 2009 have brought the official Bank of England base rate to 1.0%, the lowest rate in the Bank‟s 315 year history. Financial markets believe the prospect of sharply lower growth and weakening inflation may prompt even further reductions, and some commentators believe the bank rate may drop to as low as 0.5% in the first half of 2009. Figure x below shows how interest rates have fluctuated since the early 1970s.
Graph 1: Historic Variation in the UK Interest Rate
Interest rates principally affect the housing market in one of two ways:
Mortgage Payments: An increase in interest rates will increase monthly mortgage payments on a variable mortgage. For example, a quarter point rise on a £140,000 mortgage will increase monthly payments by approximately £30.
Demand for Housing: A sustained rise in interest rates will affect the affordability of paying a mortgage. As interest rates rise, buying a house becomes less attractive and therefore demand falls. This can lead to falling house prices. For example, in the late 1980s interest rates rose to 15% causing house prices to collapse in the UK.
15
North West Regional Context
(Source: Northwest Regional Economic Forecasting Panel, Spring 2008)
The recent history of the regional economy includes a period of:
Very rapid jobs growth, especially between 2001 and 2004. This may be exceptional and unlikely to be seen again. It followed marked recent increases in public spending such that a third of the region‟s jobs are now in the public sector; and it also included the out-sourcing of jobs in financial and business services from higher cost places in the South, following a downturn in international financial markets in 2001.
Net migration shift, which explain why the region‟s population began to grow again from 2001. This also appears to have been closely related to this exceptional period of growth in job opportunities. While the growth in participation amongst men has remained low, a significant increase of the participation of women in the region‟s labour force appears to have been a further response to this same peak in job opportunities. Nevertheless, the underlying trend in the growth of jobs in the North West has still been running on average around 0.1 percentage points a year below that in the UK.
A fall in productivity, which accompanied the recent peak in jobs growth in the North West. Services now represent the bulk of jobs, and productivity levels in all broad service sectors in the region fell relative to the UK between 1995 and 2005. Also, there is little left of an advantage the region once enjoyed in the productivity stakes because of its once considerable concentration of employment in manufacturing, in which labour productivity, is generally higher than in services.
The relative decline in the region‟s productivity in services is attributed to:
A gradual fall in its price level relative to the UK, which is bound to have had a general effect on relative wages.
A shift in the balance between lower and higher level jobs in favour of the UK, and a widening disparity between earnings in higher-level jobs between London and other major cities, including Manchester and Liverpool. This effect has been particularly marked in top-end jobs in financial and business services, a sector that now provides almost half of GVA in London as against less than a fifth in the North West.
The output gap between the region and the UK has generally grown faster than the North West. The main influence has been the performance of London as a global city and as an international provider of high level services, together with consequential growth in the „super city region‟ around London. Its direct influence now expands into parts of the East Midlands, the West Midlands, and the South West, as well as into Eastern England and much of the South East.
16
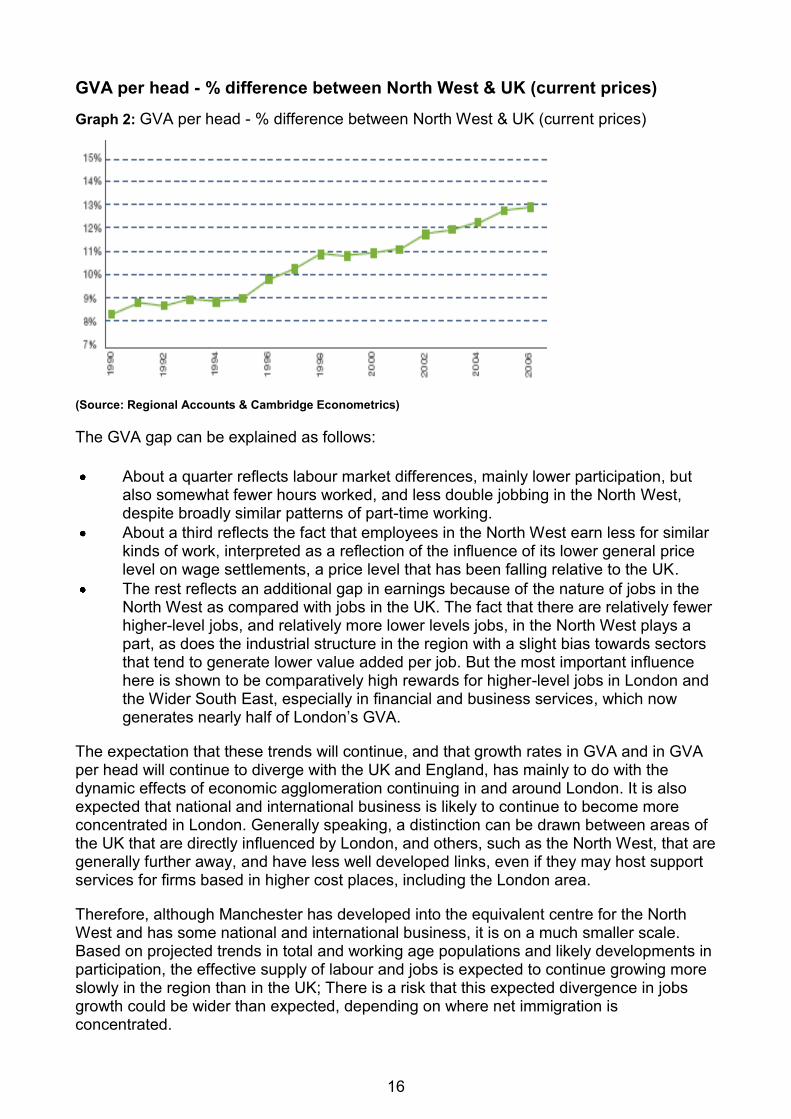
GVA per head - % difference between North West & UK (current prices)
Graph 2: GVA per head - % difference between North West & UK (current prices)
(Source: Regional Accounts & Cambridge Econometrics)
The GVA gap can be explained as follows:
About a quarter reflects labour market differences, mainly lower participation, but also somewhat fewer hours worked, and less double jobbing in the North West, despite broadly similar patterns of part-time working.
About a third reflects the fact that employees in the North West earn less for similar kinds of work, interpreted as a reflection of the influence of its lower general price level on wage settlements, a price level that has been falling relative to the UK.
The rest reflects an additional gap in earnings because of the nature of jobs in the North West as compared with jobs in the UK. The fact that there are relatively fewer higher-level jobs, and relatively more lower levels jobs, in the North West plays a part, as does the industrial structure in the region with a slight bias towards sectors that tend to generate lower value added per job. But the most important influence here is shown to be comparatively high rewards for higher-level jobs in London and the Wider South East, especially in financial and business services, which now generates nearly half of London‟s GVA.
The expectation that these trends will continue, and that growth rates in GVA and in GVA per head will continue to diverge with the UK and England, has mainly to do with the dynamic effects of economic agglomeration continuing in and around London. It is also expected that national and international business is likely to continue to become more concentrated in London. Generally speaking, a distinction can be drawn between areas of the UK that are directly influenced by London, and others, such as the North West, that are generally further away, and have less well developed links, even if they may host support services for firms based in higher cost places, including the London area.
Therefore, although Manchester has developed into the equivalent centre for the North West and has some national and international business, it is on a much smaller scale. Based on projected trends in total and working age populations and likely developments in participation, the effective supply of labour and jobs is expected to continue growing more slowly in the region than in the UK; There is a risk that this expected divergence in jobs growth could be wider than expected, depending on where net immigration is concentrated.
17
The central forecast of the most likely gap in GVA growth between the North West and the UK over the next twenty years is an average of 0.4 percentage points per annum, or a little more. The results of public policy initiatives are implicit in these trends and the Forecasting Panel think change is unlikely mainly because many programmes are similar to those that have been in place for some time and economic performance seems to have been driven mainly by structural change responding to market forces. This may change if firms and other bodies in the region take increased advantage of strategic opportunities in which the region has strengths (for instance in nuclear, energy, and environment-related industries) and if we saw public policy concentrating an increased proportion of resources on growth, especially on accommodating and underpinning agglomeration through appropriate policies, such as transport and housing.
It is nonetheless implicit in this view that the North West‟s economy will continue to grow more rapidly than in the 1990s, and also that living standards in the region will continue to improve on average even if the gap in GVA per head is expected to widen. Although the North West‟s growth corridor may flourish, and its influence will spread geographically, especially given effective transport and spatial policies, the corridor is simply different in character and scale, and less of an integrated whole at present, than is London and its surroundings.
Construction and Housing
Since the first quarter of 2007 the rate of increase in house prices in the region has declined, while in the final quarter of the year house price inflation in the UK declined for the first time in two years. Along with a fall in the numbers of housing transactions, this confirms that the housing market is weakening. The most recent national data to September 2008 shows that the annual rate at which house prices are falling continued to accelerate to hit a new record of 5.1 per cent. However, homes lost only 0.1 per cent of their value during September itself, well down on August's drop of 2.7 per cent.
Construction: Growth in 2007 was sustained by private commercial orders
Construction orders in the North West increased through the first half of 2007, but have since fallen back. In 2007 private sector new housing orders declined to below 2005 levels. However, the level of infrastructure and other public orders increased. Private industrial orders remained relatively unchanged from 2006; growth in private commercial orders was much more marked in the first half of the year, although they have since fallen back.
The value of construction output in 2007 was 12.8% higher than in 2006, due primarily to new public housing and other private sector repair and maintenance. Private commercial and industrial output growth more than offset a decline in infrastructure output.
GVA growth in construction was weak in 2006 at 1.0% but is estimated to have strengthened to 2.1% in 2007, although this was weaker than in the UK as a whole. Weaker growth is expected in 2008; 1.5% for the North West and 1.0% for the UK. GVA is then expected to fall in 2009 in response to the impact of the credit crisis and the weakening housing market, before recovering in 2010 and 2011.
18
House Prices: Inflation weakened through 2007
House price inflation slowed through 2007 despite reductions in interest rates during the year. At the end of 2007, prices were on average 5.0% higher than a year earlier in the North West compared with 9.9% in the UK. Along with slower price inflation since the beginning of 2007, figures (Q2 2007) for the number of transactions show a decline for both the North West and UK. This is consistent with the tightening of monetary policy during 2006/07 and tougher lending standards for mortgages after the recent difficulties in financial markets and points to a slowdown in the market.
Housing Investment: The outlook is for weaker activity in the short term
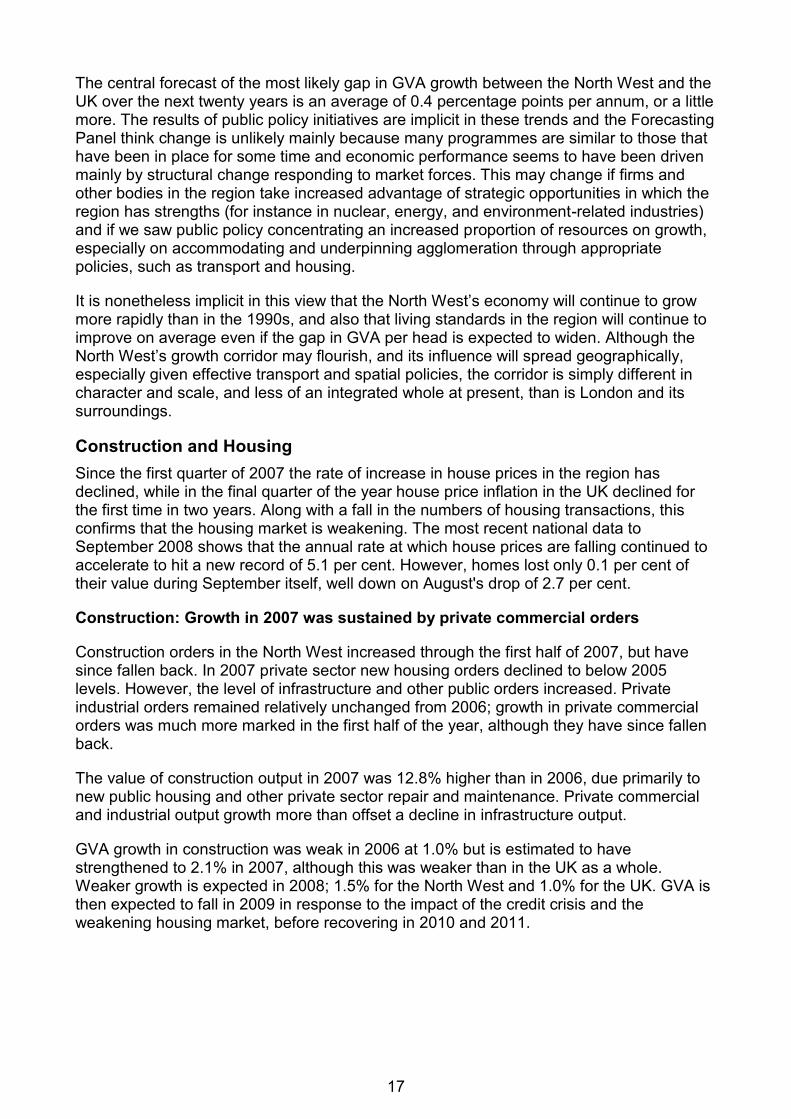
Short-term prospects for housing investment in the region are considerably less favourable than in recent years. The number of new dwellings started declined by 19.0% compared to 6.0% nationally, representing the first decline in four years. Housing starts across all categories (private enterprise, registered social landlords and local authorities) declined by a larger amount in the region than nationally in 2006/07. Potential downside risks to the housing market remain including the current liquidity issues in capital markets and resultant reductions in mortgage packages available on the high street and high levels of consumer debt.
There have been sharp falls in housing starts this year with some smaller house builders already in difficulties and large nationally organised concerns scaling back new build.
Graph 3: Recent development in the housing market
Cumbrian Context
“Whilst poor, GVA performance is showing improvement. Time will show how we perform in relation to other sub-regional economies due to the current recession; early indications are that we are not adversely affected…”
The numbers paint a mixed picture for the county depending on the timescale over which we assess change and the geographical area we focus on. The bullet points below identify the key points of relevance:
Over the long term (1995-2006) Cumbria remains the slowest growing of the 37 county-type areas in the UK, with an overall growth rate of 41.2% compared to 66.0% in the Northwest region and 80.0% for the UK as a whole.
19
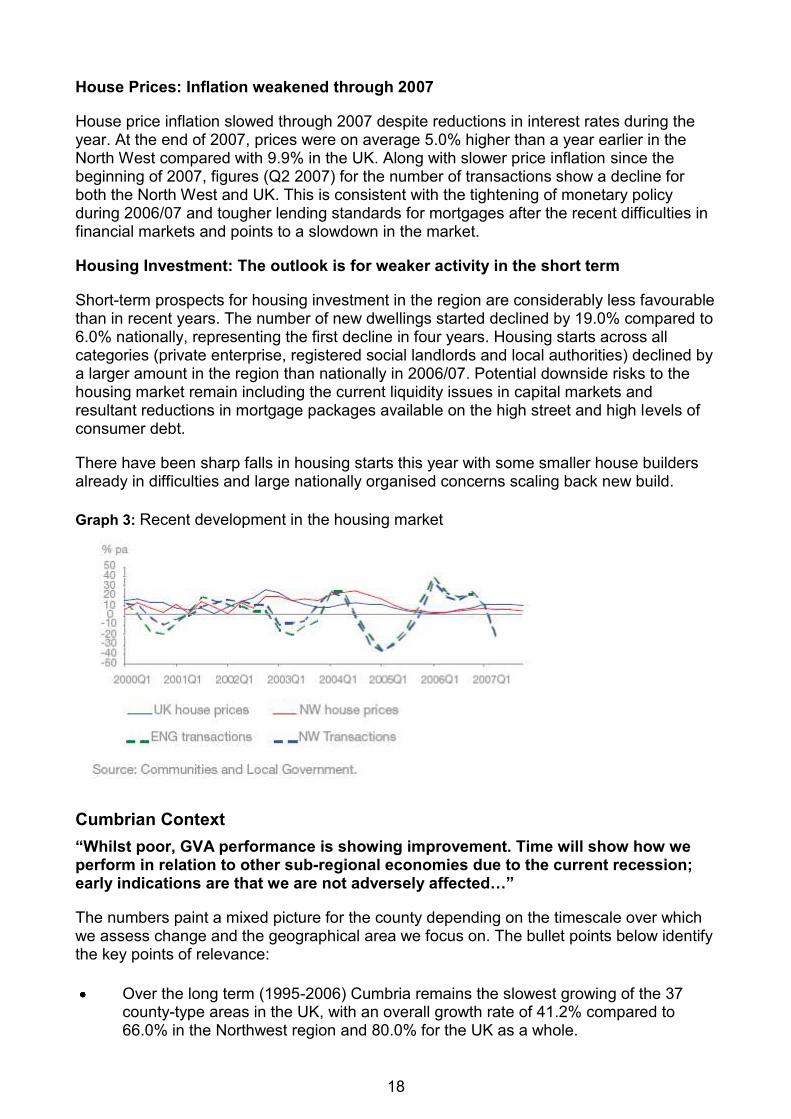
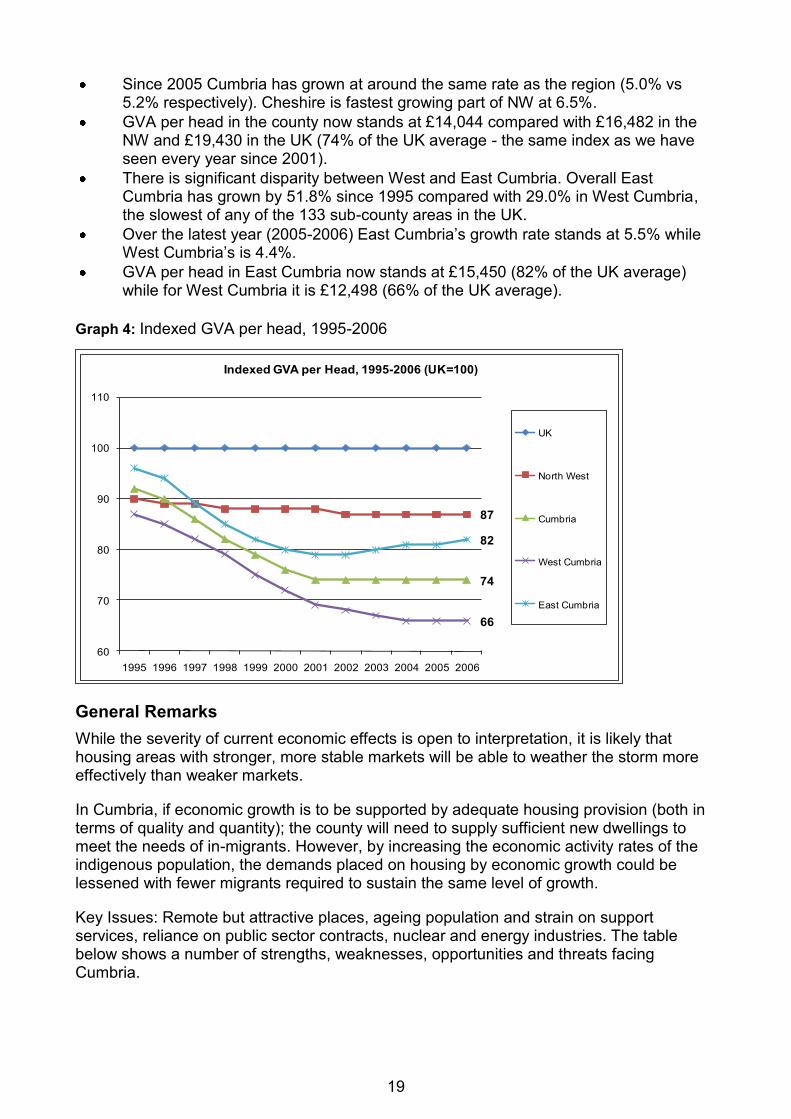
Since 2005 Cumbria has grown at around the same rate as the region (5.0% vs 5.2% respectively). Cheshire is fastest growing part of NW at 6.5%.
GVA per head in the county now stands at £14,044 compared with £16,482 in the NW and £19,430 in the UK (74% of the UK average - the same index as we have seen every year since 2001).
There is significant disparity between West and East Cumbria. Overall East Cumbria has grown by 51.8% since 1995 compared with 29.0% in West Cumbria, the slowest of any of the 133 sub-county areas in the UK.
Over the latest year (2005-2006) East Cumbria‟s growth rate stands at 5.5% while West Cumbria‟s is 4.4%.
GVA per head in East Cumbria now stands at £15,450 (82% of the UK average) while for West Cumbria it is £12,498 (66% of the UK average).
Graph 4: Indexed GVA per head, 1995-2006
87
74
66
82
60
70
80
90
100
110
1995 1996 1997 1998 1999 2000 2001 2002 2003 2004 2005 2006
Indexed GVA per Head, 1995-2006 (UK=100)
UK
North West
Cumbria
West Cumbria
East Cumbria
General Remarks
While the severity of current economic effects is open to interpretation, it is likely that housing areas with stronger, more stable markets will be able to weather the storm more effectively than weaker markets.
In Cumbria, if economic growth is to be supported by adequate housing provision (both in terms of quality and quantity); the county will need to supply sufficient new dwellings to meet the needs of in-migrants. However, by increasing the economic activity rates of the indigenous population, the demands placed on housing by economic growth could be lessened with fewer migrants required to sustain the same level of growth.
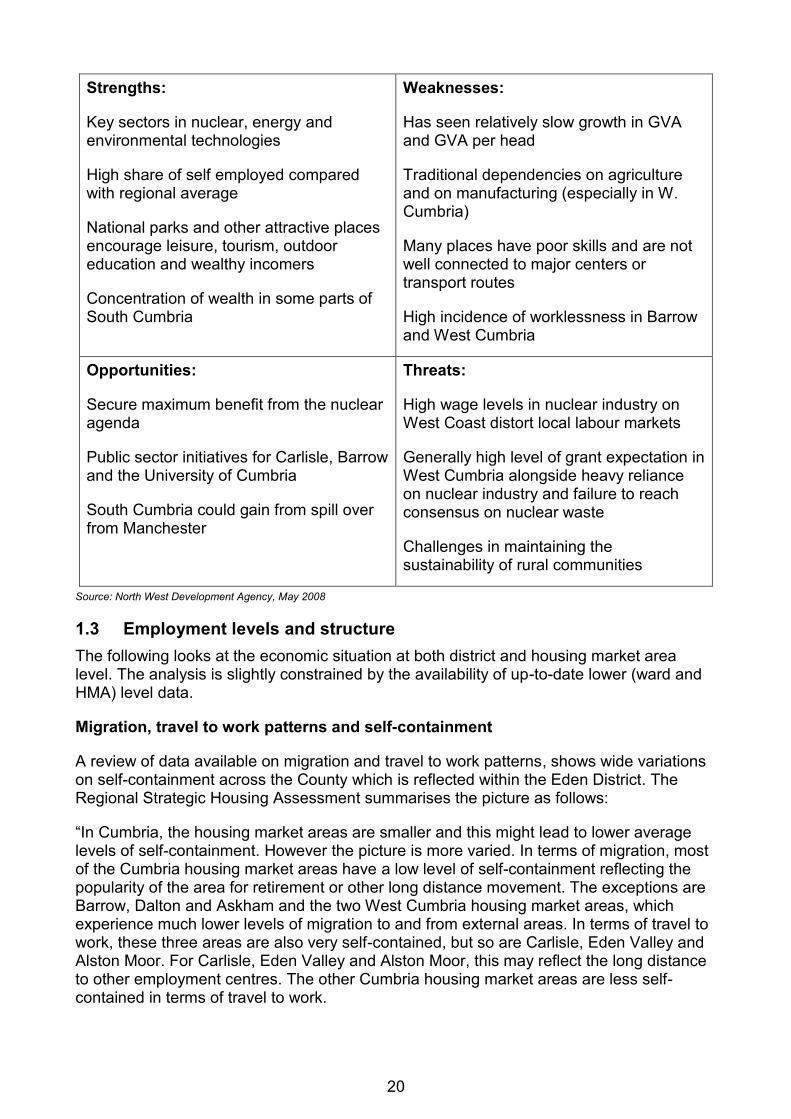
Key Issues: Remote but attractive places, ageing population and strain on support services, reliance on public sector contracts, nuclear and energy industries. The table below shows a number of strengths, weaknesses, opportunities and threats facing Cumbria.
20
Strengths:
Key sectors in nuclear, energy and environmental technologies
High share of self employed compared with regional average
National parks and other attractive places encourage leisure, tourism, outdoor education and wealthy incomers
Concentration of wealth in some parts of South Cumbria
Weaknesses:
Has seen relatively slow growth in GVA and GVA per head
Traditional dependencies on agriculture and on manufacturing (especially in W. Cumbria)
Many places have poor skills and are not well connected to major centers or transport routes
High incidence of worklessness in Barrow and West Cumbria
Opportunities:
Secure maximum benefit from the nuclear agenda
Public sector initiatives for Carlisle, Barrow and the University of Cumbria
South Cumbria could gain from spill over from Manchester
Threats:
High wage levels in nuclear industry on West Coast distort local labour markets
Generally high level of grant expectation in West Cumbria alongside heavy reliance on nuclear industry and failure to reach consensus on nuclear waste
Challenges in maintaining the sustainability of rural communities
Source: North West Development Agency, May 2008
1.3 Employment levels and structure
The following looks at the economic situation at both district and housing market area level. The analysis is slightly constrained by the availability of up-to-date lower (ward and HMA) level data.
Migration, travel to work patterns and self-containment
A review of data available on migration and travel to work patterns, shows wide variations on self-containment across the County which is reflected within the Eden District. The Regional Strategic Housing Assessment summarises the picture as follows:
“In Cumbria, the housing market areas are smaller and this might lead to lower average levels of self-containment. However the picture is more varied. In terms of migration, most of the Cumbria housing market areas have a low level of self-containment reflecting the popularity of the area for retirement or other long distance movement. The exceptions are Barrow, Dalton and Askham and the two West Cumbria housing market areas, which experience much lower levels of migration to and from external areas. In terms of travel to work, these three areas are also very self-contained, but so are Carlisle, Eden Valley and Alston Moor. For Carlisle, Eden Valley and Alston Moor, this may reflect the long distance to other employment centres. The other Cumbria housing market areas are less self-contained in terms of travel to work.
21
“In terms of linkages with other areas, because of its geographic position, Barrow, Dalton and Askham have strong links only with Ulverston/Cartmel. The West Cumbria housing market areas tend to have links with one another, and to some extent with Carlisle. For the remainder of Cumbria, there is a north-south split, with stronger links between Central Lakes, Dales/Rural Kendal and outside the sub region Lancaster, and a separate grouping of Eden Valley, North Lakes, Alston Moor and Carlisle.” (RSHA p32).
This self-containment is also present in migration patterns across the county:
“Geographical patterns of migration in Cumbria exhibit similar characteristics to that which we might expect; namely, most moves are of short distance and there is an inverse relationship between the magnitude of individual flows and the distance travelled…. Of the 814 flows involving Cumbria and/or other parts of the North West, 799 were moves within Cumbria, six were from Cumbria to Lancashire, five were from Lancashire to Cumbria and four were from Greater Manchester to Cumbria. Within Cumbria itself, there is a clear „geometry‟ of migration centred on key locations such as Carlisle, Penrith, Workington and Maryport, Whitehaven, Barrow-in-Furness, Windermere, and Kendal. Overall, the data suggests that there is a high degree of „self-containment‟ whereby these locations function as relatively independent housing market areas.” (Cumbria Economic Bulletin, 2007)
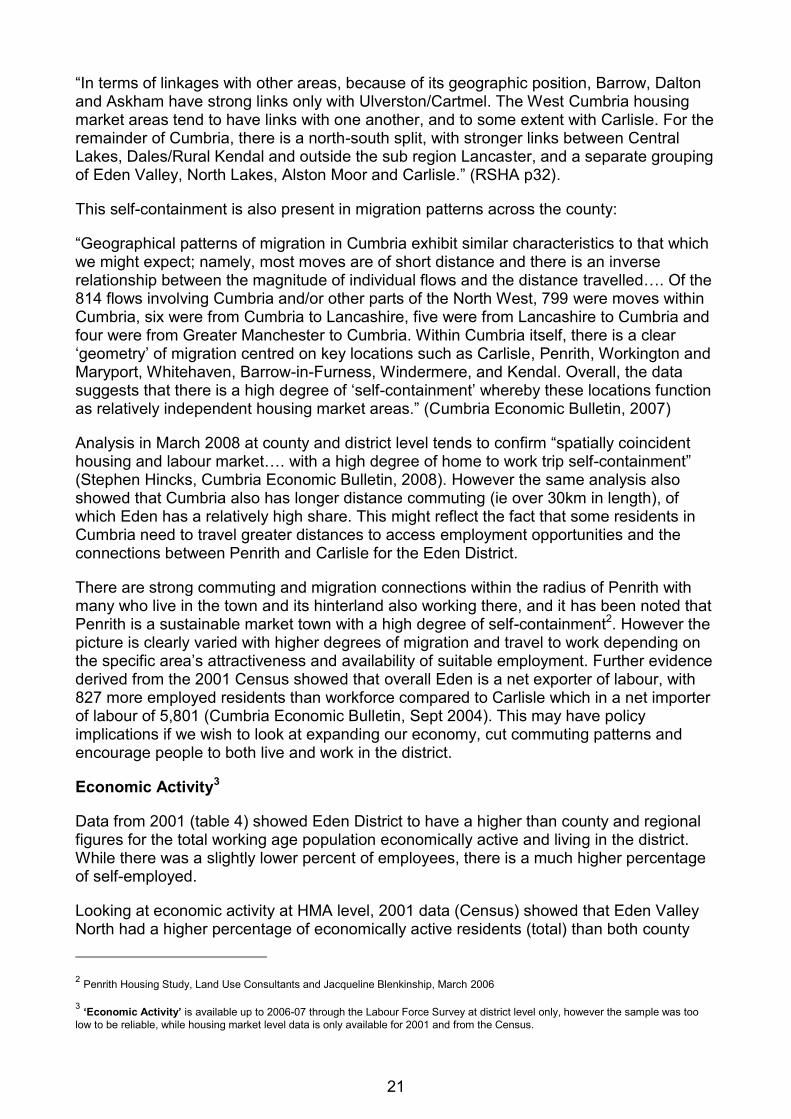
Analysis in March 2008 at county and district level tends to confirm “spatially coincident housing and labour market…. with a high degree of home to work trip self-containment” (Stephen Hincks, Cumbria Economic Bulletin, 2008). However the same analysis also showed that Cumbria also has longer distance commuting (ie over 30km in length), of which Eden has a relatively high share. This might reflect the fact that some residents in Cumbria need to travel greater distances to access employment opportunities and the connections between Penrith and Carlisle for the Eden District.
There are strong commuting and migration connections within the radius of Penrith with many who live in the town and its hinterland also working there, and it has been noted that Penrith is a sustainable market town with a high degree of self-containment2. However the picture is clearly varied with higher degrees of migration and travel to work depending on the specific area‟s attractiveness and availability of suitable employment. Further evidence derived from the 2001 Census showed that overall Eden is a net exporter of labour, with 827 more employed residents than workforce compared to Carlisle which in a net importer of labour of 5,801 (Cumbria Economic Bulletin, Sept 2004). This may have policy implications if we wish to look at expanding our economy, cut commuting patterns and encourage people to both live and work in the district.
Economic Activity3
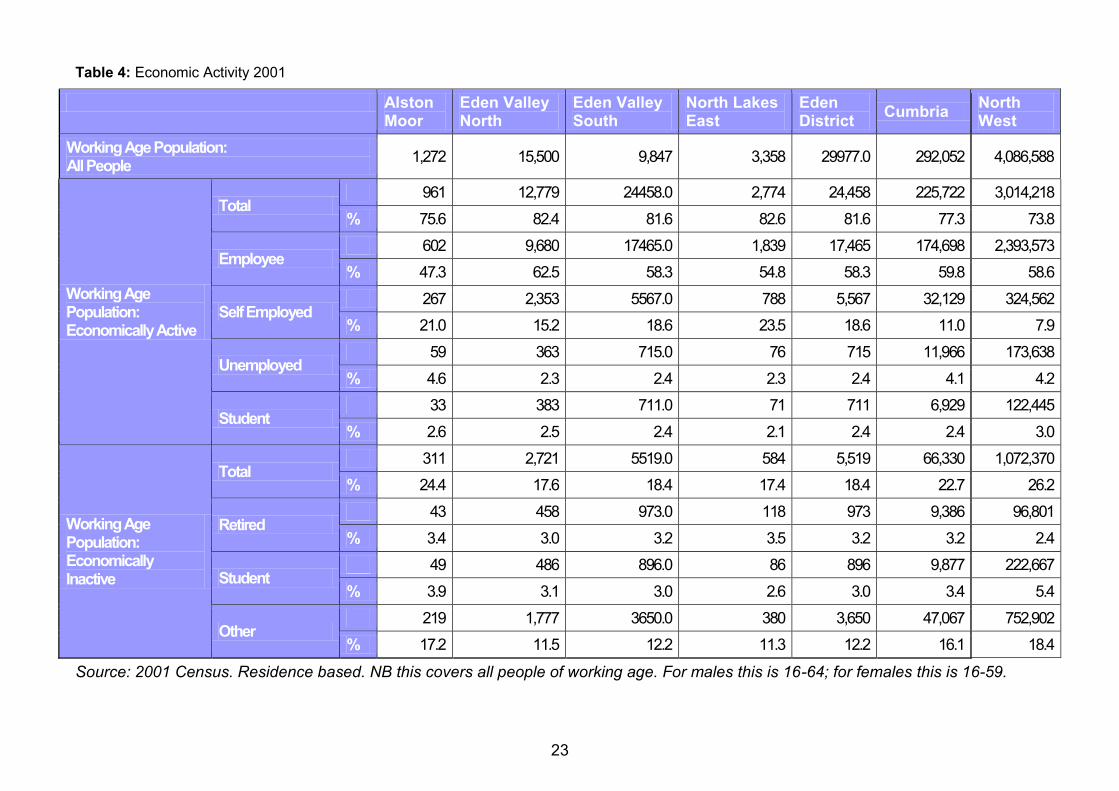
Data from 2001 (table 4) showed Eden District to have a higher than county and regional figures for the total working age population economically active and living in the district. While there was a slightly lower percent of employees, there is a much higher percentage of self-employed.
Looking at economic activity at HMA level, 2001 data (Census) showed that Eden Valley North had a higher percentage of economically active residents (total) than both county
2 Penrith Housing Study, Land Use Consultants and Jacqueline Blenkinship, March 2006
3 „Economic Activity‟ is available up to 2006-07 through the Labour Force Survey at district level only, however the sample was too
low to be reliable, while housing market level data is only available for 2001 and from the Census.
22
and regional levels. This was the second highest percentage in the District and the area contained by far the highest number of working age residents (15,500), reflecting both larger population and the ability to commute to the main employment hubs of Penrith and Carlisle. Conversely the area contained the second lowest percentage of economically inactive residents and the lowest percentage of retired people (of working age) in the District. Economically inactive includes those looking after a house, those in retirement but also includes those without work who are not actively seeking or available for employment. The HMA contains the highest number of self-employed people but this was still the lowest percentage in the District, and highlights Eden‟s overall higher than Regional and County levels. Unemployment was typical of the District and lower than the County and Regional percentages. Containing Newton Rigg University campus and the higher number of buy-to-let properties in Penrith this area also contained the concentration of students in the District. This figure is set to increase with the forthcoming expansion of the University (see chapter 6 „Requirements of Specific Household Groups‟).
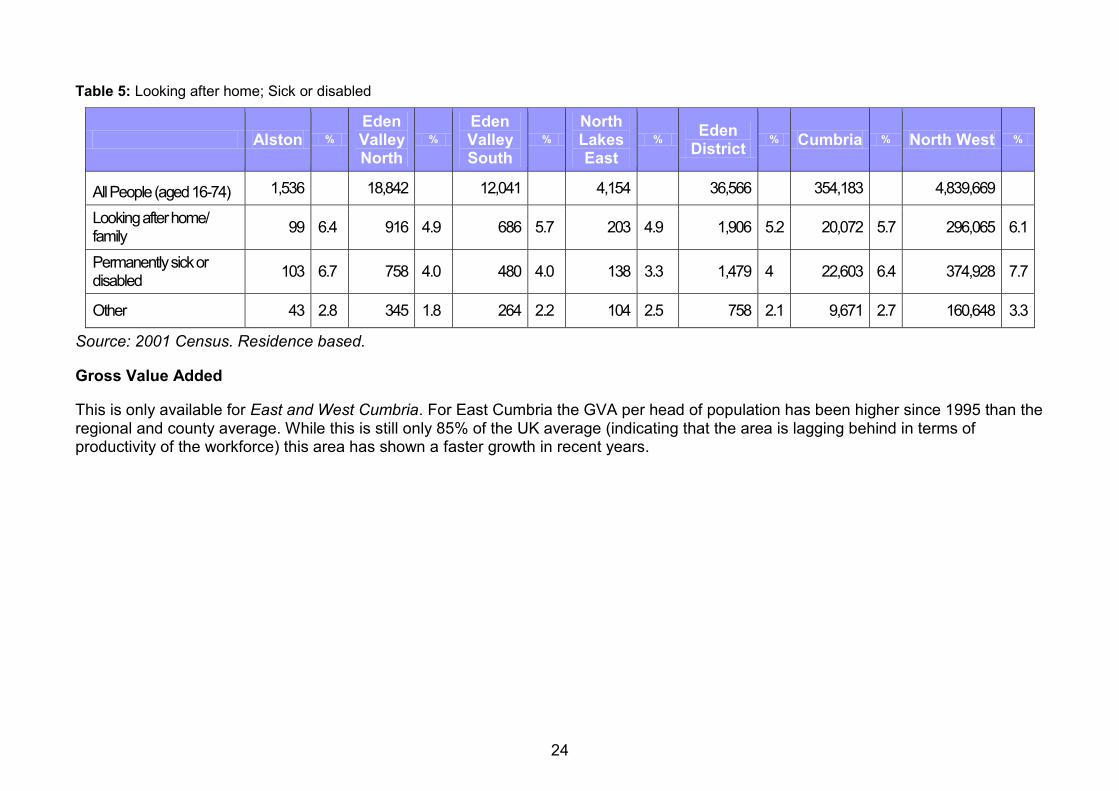
Looking specifically at those looking after the home or sick/disabled (table 5) there were a lower percentage of this group than County and Regional levels, although this was similar to the District picture.
23
Table 4: Economic Activity 2001
Alston Moor
Eden Valley North
Eden Valley South
North Lakes East
Eden District
Cumbria North West
Working Age Population: All People
1,272 15,500 9,847 3,358 29977.0 292,052 4,086,588
Working Age Population: Economically Active
Total 961 12,779 24458.0 2,774 24,458 225,722 3,014,218
% 75.6 82.4 81.6 82.6 81.6 77.3 73.8
Employee 602 9,680 17465.0 1,839 17,465 174,698 2,393,573
% 47.3 62.5 58.3 54.8 58.3 59.8 58.6
Self Employed 267 2,353 5567.0 788 5,567 32,129 324,562
% 21.0 15.2 18.6 23.5 18.6 11.0 7.9
Unemployed 59 363 715.0 76 715 11,966 173,638
% 4.6 2.3 2.4 2.3 2.4 4.1 4.2
Student 33 383 711.0 71 711 6,929 122,445
% 2.6 2.5 2.4 2.1 2.4 2.4 3.0
Working Age Population: Economically Inactive
Total 311 2,721 5519.0 584 5,519 66,330 1,072,370
% 24.4 17.6 18.4 17.4 18.4 22.7 26.2
Retired 43 458 973.0 118 973 9,386 96,801
% 3.4 3.0 3.2 3.5 3.2 3.2 2.4
Student 49 486 896.0 86 896 9,877 222,667
% 3.9 3.1 3.0 2.6 3.0 3.4 5.4
Other 219 1,777 3650.0 380 3,650 47,067 752,902
% 17.2 11.5 12.2 11.3 12.2 16.1 18.4
Source: 2001 Census. Residence based. NB this covers all people of working age. For males this is 16-64; for females this is 16-59.
24
Table 5: Looking after home; Sick or disabled
Alston % Eden Valley North
% Eden Valley South
% North Lakes East
% Eden District
% Cumbria % North West %
All People (aged 16-74) 1,536 18,842 12,041 4,154 36,566 354,183 4,839,669
Looking after home/ family
99 6.4 916 4.9 686 5.7 203 4.9 1,906 5.2 20,072 5.7 296,065 6.1
Permanently sick or disabled
103 6.7 758 4.0 480 4.0 138 3.3 1,479 4 22,603 6.4 374,928 7.7
Other 43 2.8 345 1.8 264 2.2 104 2.5 758 2.1 9,671 2.7 160,648 3.3
Source: 2001 Census. Residence based.
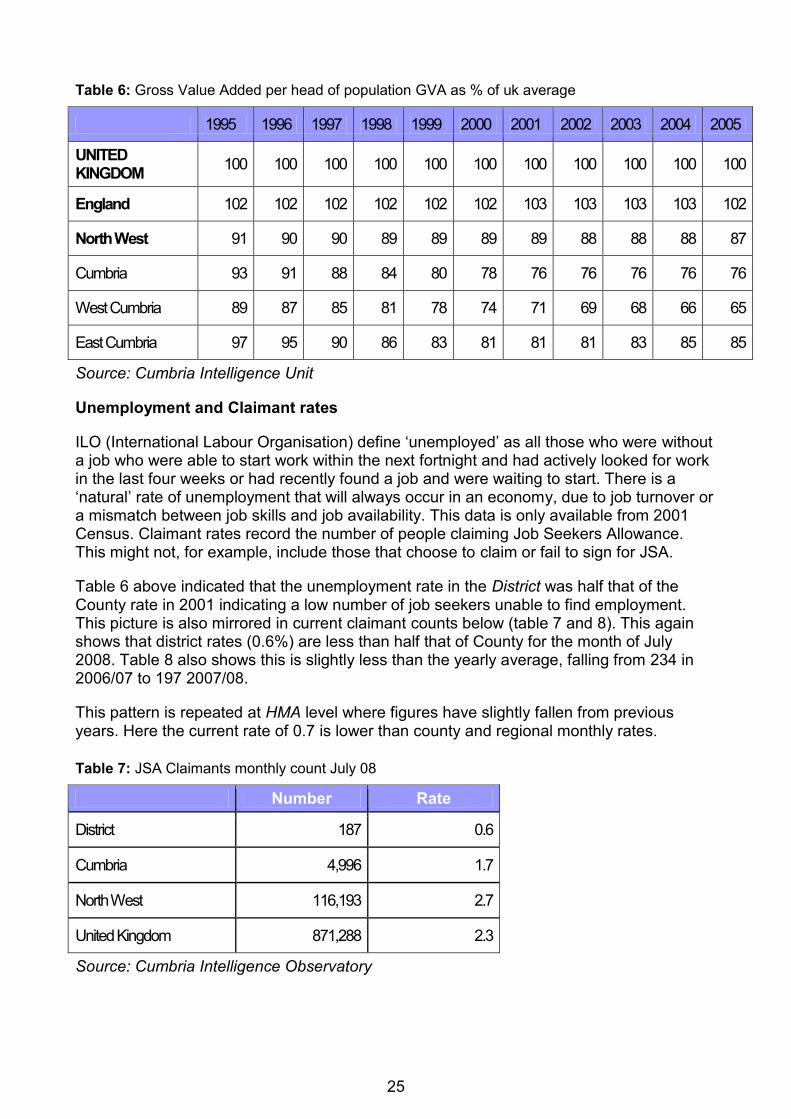
Gross Value Added
This is only available for East and West Cumbria. For East Cumbria the GVA per head of population has been higher since 1995 than the regional and county average. While this is still only 85% of the UK average (indicating that the area is lagging behind in terms of productivity of the workforce) this area has shown a faster growth in recent years.
25
Table 6: Gross Value Added per head of population GVA as % of uk average
1995 1996 1997 1998 1999 2000 2001 2002 2003 2004 2005
UNITED KINGDOM
100 100 100 100 100 100 100 100 100 100 100
England 102 102 102 102 102 102 103 103 103 103 102
North West 91 90 90 89 89 89 89 88 88 88 87
Cumbria 93 91 88 84 80 78 76 76 76 76 76
West Cumbria 89 87 85 81 78 74 71 69 68 66 65
East Cumbria 97 95 90 86 83 81 81 81 83 85 85
Source: Cumbria Intelligence Unit
Unemployment and Claimant rates
ILO (International Labour Organisation) define „unemployed‟ as all those who were without a job who were able to start work within the next fortnight and had actively looked for work in the last four weeks or had recently found a job and were waiting to start. There is a „natural‟ rate of unemployment that will always occur in an economy, due to job turnover or a mismatch between job skills and job availability. This data is only available from 2001 Census. Claimant rates record the number of people claiming Job Seekers Allowance. This might not, for example, include those that choose to claim or fail to sign for JSA.
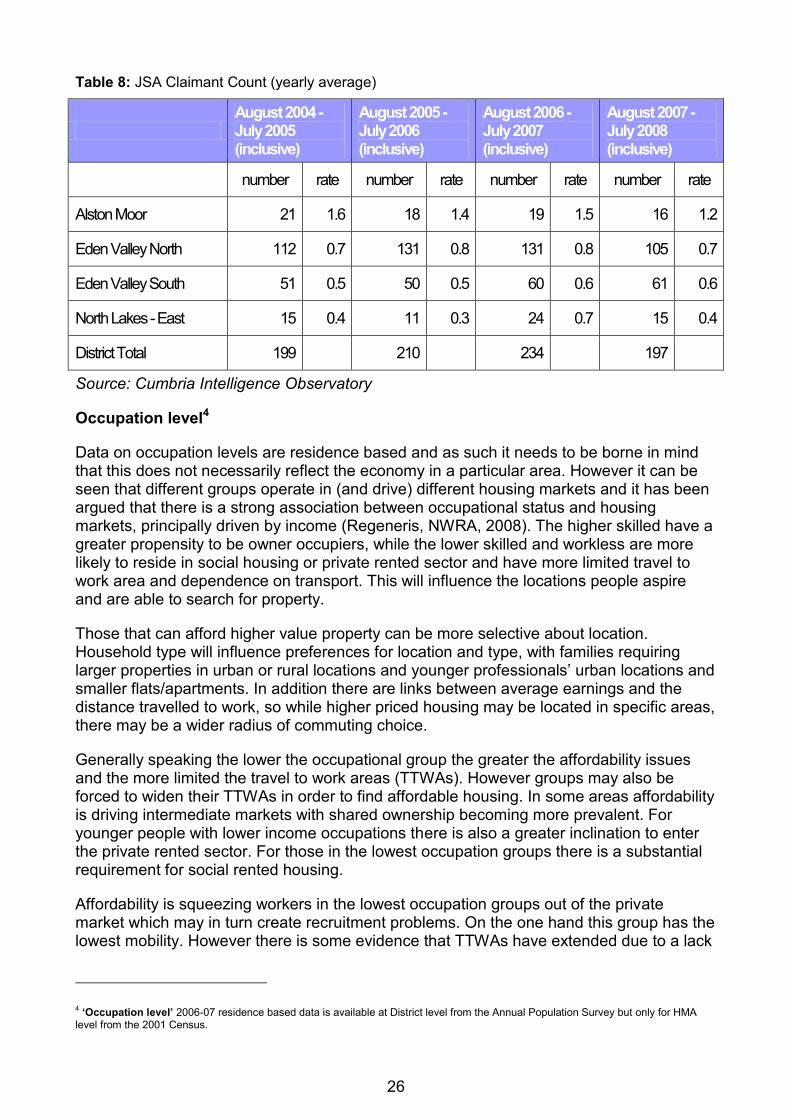
Table 6 above indicated that the unemployment rate in the District was half that of the County rate in 2001 indicating a low number of job seekers unable to find employment. This picture is also mirrored in current claimant counts below (table 7 and 8). This again shows that district rates (0.6%) are less than half that of County for the month of July 2008. Table 8 also shows this is slightly less than the yearly average, falling from 234 in 2006/07 to 197 2007/08.
This pattern is repeated at HMA level where figures have slightly fallen from previous years. Here the current rate of 0.7 is lower than county and regional monthly rates.
Table 7: JSA Claimants monthly count July 08
Number Rate
District 187 0.6
Cumbria 4,996 1.7
North West 116,193 2.7
United Kingdom 871,288 2.3
Source: Cumbria Intelligence Observatory
26
Table 8: JSA Claimant Count (yearly average)
August 2004 - July 2005 (inclusive)
August 2005 - July 2006 (inclusive)
August 2006 - July 2007 (inclusive)
August 2007 - July 2008 (inclusive)
number rate number rate number rate number rate
Alston Moor 21 1.6 18 1.4 19 1.5 16 1.2
Eden Valley North 112 0.7 131 0.8 131 0.8 105 0.7
Eden Valley South 51 0.5 50 0.5 60 0.6 61 0.6
North Lakes - East 15 0.4 11 0.3 24 0.7 15 0.4
District Total 199 210 234 197
Source: Cumbria Intelligence Observatory
Occupation level4
Data on occupation levels are residence based and as such it needs to be borne in mind that this does not necessarily reflect the economy in a particular area. However it can be seen that different groups operate in (and drive) different housing markets and it has been argued that there is a strong association between occupational status and housing markets, principally driven by income (Regeneris, NWRA, 2008). The higher skilled have a greater propensity to be owner occupiers, while the lower skilled and workless are more likely to reside in social housing or private rented sector and have more limited travel to work area and dependence on transport. This will influence the locations people aspire and are able to search for property.
Those that can afford higher value property can be more selective about location. Household type will influence preferences for location and type, with families requiring larger properties in urban or rural locations and younger professionals‟ urban locations and smaller flats/apartments. In addition there are links between average earnings and the distance travelled to work, so while higher priced housing may be located in specific areas, there may be a wider radius of commuting choice.
Generally speaking the lower the occupational group the greater the affordability issues and the more limited the travel to work areas (TTWAs). However groups may also be forced to widen their TTWAs in order to find affordable housing. In some areas affordability is driving intermediate markets with shared ownership becoming more prevalent. For younger people with lower income occupations there is also a greater inclination to enter the private rented sector. For those in the lowest occupation groups there is a substantial requirement for social rented housing.
Affordability is squeezing workers in the lowest occupation groups out of the private market which may in turn create recruitment problems. On the one hand this group has the lowest mobility. However there is some evidence that TTWAs have extended due to a lack
4 „Occupation level‟ 2006-07 residence based data is available at District level from the Annual Population Survey but only for HMA
level from the 2001 Census.
27
of affordable housing near their place of work. Some employers, for example, may need to provide transport for lower skilled employees. For these groups shared ownership may not be an option.
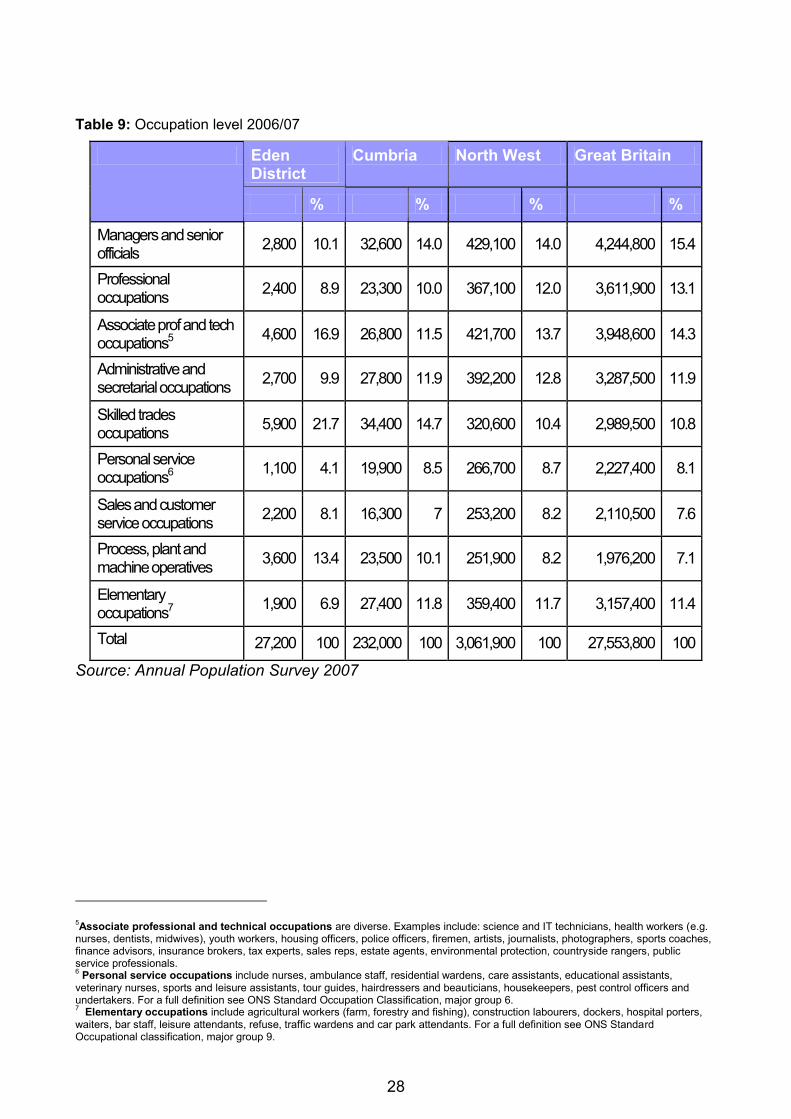
The Eden District and Cumbria has a lower proportion of its workforce in overall higher paid levels (professional, managerial and associated technical occupations) than the North West which in turn has less than the British percentage. There is a much higher incidence of skilled occupations, possibly low paid, in Cumbria than the North West and England and this is particularly so in the Eden District.
However comparing APS data and 2001 Census data also gives some indication that total overall upper level professions are increasing in Cumbria and the District. Within these upper professions there are differences in growth rates. Since 2001 there has been a District wide reduction in the proportion of manager/senior officer occupation levels from 14% to 10%. This fall in managers/senior officers in Eden does not match the figures for Cumbria and the North West, where this sector has shown an increase, and this could have implications for high value property demand, indicating a slow down in this end of the market for the Eden District. Along side this there has been a reduction in elementary occupations of 8% and a reduction in personal service occupations of 3%. Other occupations have remained the same or risen (typically by 2-3%), with associate professional and technical occupations showing the most significant increase of 7% up to 17%.
Eden has outstripped Cumbria and the North West in the proportional rise of these professional/technical occupations at the same time as seeing greater growth in the proportion of skilled trades occupations. Outside Eden there has been a reduction in these skilled trades but less growth in professional/technical occupations (see also Additional Tables, appendix C). This means the District now has a very slightly higher than county level of overall higher paid occupations. The District is catching up albeit due to rising associate professional/technical occupations rather than senior occupations, which could nonetheless signal a greater overall degree of mobility; People are able to work greater distances from their homes, and can afford to choose more affluent areas to live, which may also have fuelled house prices. A similar situation exists, for example, in South Lakeland, which has the highest percentage of residents with higher occupation levels and has some of the highest prices properties in Cumbria.
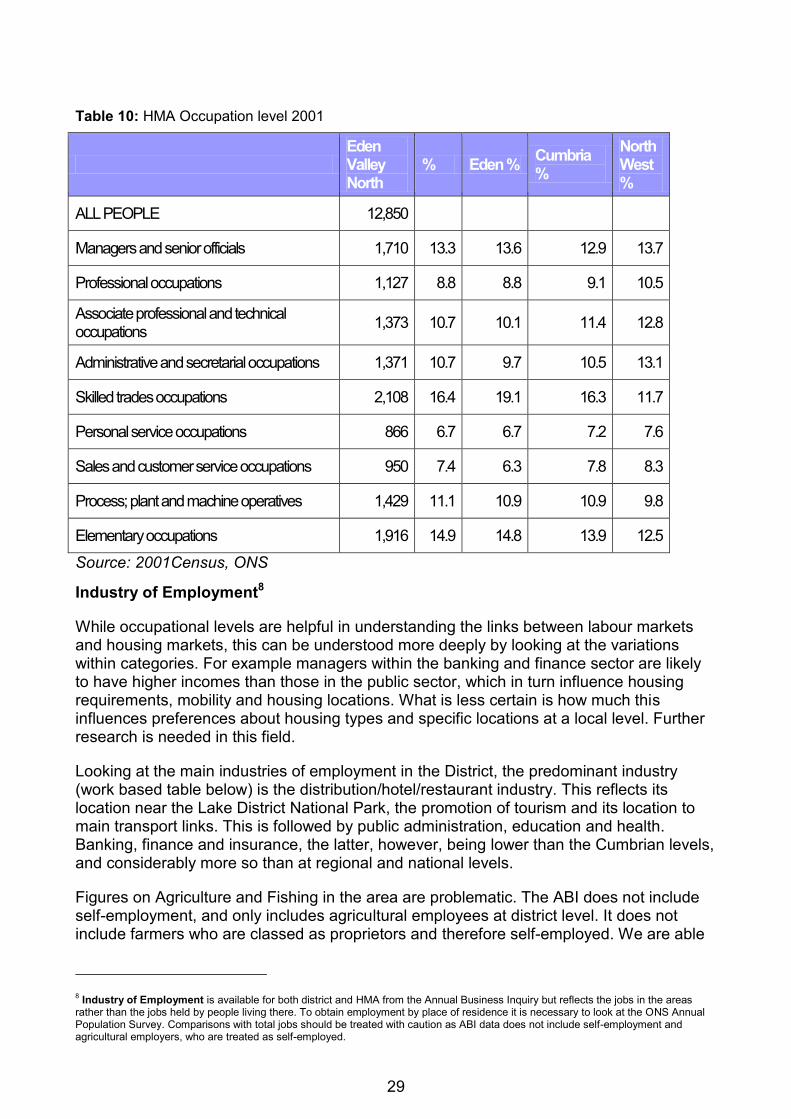
Census 2001 data showed the HMA had a predominance of residence with skilled trades although this was slightly lower than the District percentage. This was followed by elementary occupations, which may now have reduced if the area follows district trends. Overall the level of managers/senior officials, professional, associate professional mirrored the District and was at this point significantly lower than the region. However the District pattern indicates that whole still lower than regionally it may be catching up as commuting extends and people are willing to live further from work. This has been reflected in the income levels which were higher than district and Cumbrian levels in 2005 and remained so in 2007 (see 1.4 Income and earnings).
28
Table 9: Occupation level 2006/07
Eden District
Cumbria North West Great Britain
% % % %
Managers and senior officials
2,800 10.1 32,600 14.0 429,100 14.0 4,244,800 15.4
Professional occupations
2,400 8.9 23,300 10.0 367,100 12.0 3,611,900 13.1
Associate prof and tech occupations5
4,600 16.9 26,800 11.5 421,700 13.7 3,948,600 14.3
Administrative and secretarial occupations
2,700 9.9 27,800 11.9 392,200 12.8 3,287,500 11.9
Skilled trades occupations
5,900 21.7 34,400 14.7 320,600 10.4 2,989,500 10.8
Personal service occupations6
1,100 4.1 19,900 8.5 266,700 8.7 2,227,400 8.1
Sales and customer service occupations
2,200 8.1 16,300 7 253,200 8.2 2,110,500 7.6
Process, plant and machine operatives
3,600 13.4 23,500 10.1 251,900 8.2 1,976,200 7.1
Elementary occupations7
1,900 6.9 27,400 11.8 359,400 11.7 3,157,400 11.4
Total 27,200 100 232,000 100 3,061,900 100 27,553,800 100
Source: Annual Population Survey 2007
5Associate professional and technical occupations are diverse. Examples include: science and IT technicians, health workers (e.g.
nurses, dentists, midwives), youth workers, housing officers, police officers, firemen, artists, journalists, photographers, sports coaches, finance advisors, insurance brokers, tax experts, sales reps, estate agents, environmental protection, countryside rangers, public service professionals. 6 Personal service occupations include nurses, ambulance staff, residential wardens, care assistants, educational assistants,
veterinary nurses, sports and leisure assistants, tour guides, hairdressers and beauticians, housekeepers, pest control officers and undertakers. For a full definition see ONS Standard Occupation Classification, major group 6. 7 Elementary occupations include agricultural workers (farm, forestry and fishing), construction labourers, dockers, hospital porters,
waiters, bar staff, leisure attendants, refuse, traffic wardens and car park attendants. For a full definition see ONS Standard Occupational classification, major group 9.
29
Table 10: HMA Occupation level 2001
Eden Valley North
% Eden % Cumbria %
North West %
ALL PEOPLE 12,850
Managers and senior officials 1,710 13.3 13.6 12.9 13.7
Professional occupations 1,127 8.8 8.8 9.1 10.5
Associate professional and technical occupations
1,373 10.7 10.1 11.4 12.8
Administrative and secretarial occupations 1,371 10.7 9.7 10.5 13.1
Skilled trades occupations 2,108 16.4 19.1 16.3 11.7
Personal service occupations 866 6.7 6.7 7.2 7.6
Sales and customer service occupations 950 7.4 6.3 7.8 8.3
Process; plant and machine operatives 1,429 11.1 10.9 10.9 9.8
Elementary occupations 1,916 14.9 14.8 13.9 12.5
Source: 2001Census, ONS
Industry of Employment8
While occupational levels are helpful in understanding the links between labour markets and housing markets, this can be understood more deeply by looking at the variations within categories. For example managers within the banking and finance sector are likely to have higher incomes than those in the public sector, which in turn influence housing requirements, mobility and housing locations. What is less certain is how much this influences preferences about housing types and specific locations at a local level. Further research is needed in this field.
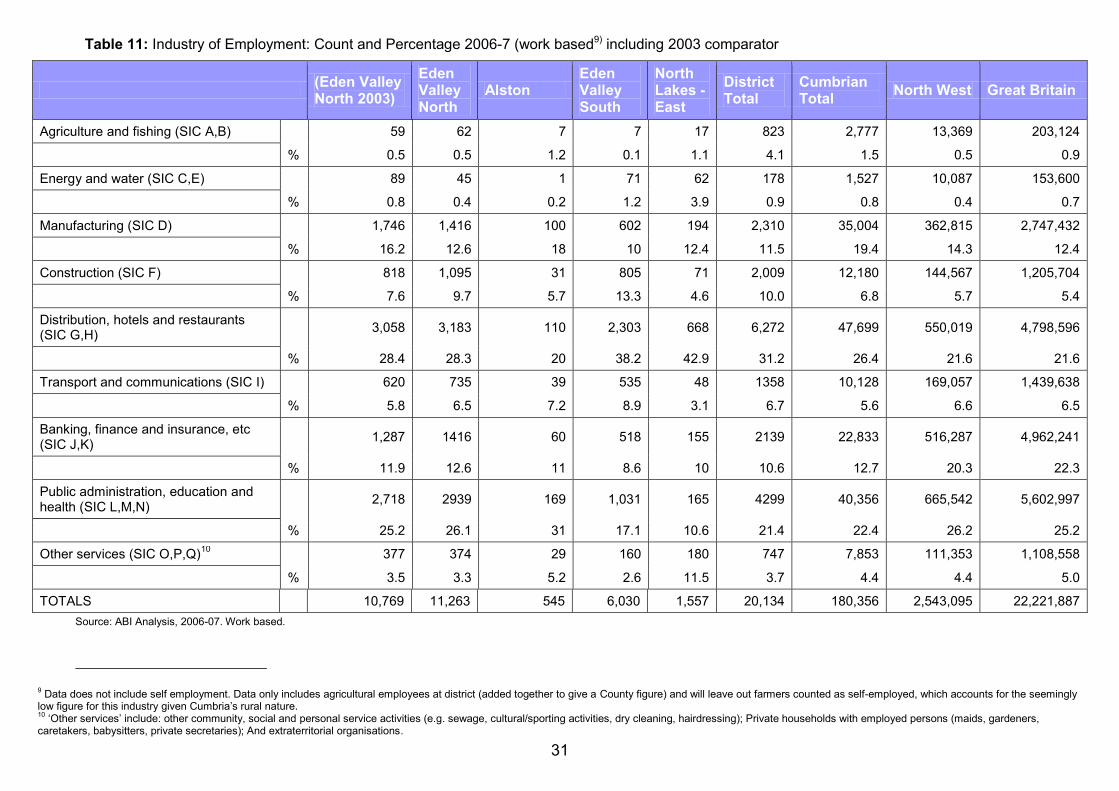
Looking at the main industries of employment in the District, the predominant industry (work based table below) is the distribution/hotel/restaurant industry. This reflects its location near the Lake District National Park, the promotion of tourism and its location to main transport links. This is followed by public administration, education and health. Banking, finance and insurance, the latter, however, being lower than the Cumbrian levels, and considerably more so than at regional and national levels.
Figures on Agriculture and Fishing in the area are problematic. The ABI does not include self-employment, and only includes agricultural employees at district level. It does not include farmers who are classed as proprietors and therefore self-employed. We are able
8 Industry of Employment is available for both district and HMA from the Annual Business Inquiry but reflects the jobs in the areas
rather than the jobs held by people living there. To obtain employment by place of residence it is necessary to look at the ONS Annual Population Survey. Comparisons with total jobs should be treated with caution as ABI data does not include self-employment and agricultural employers, who are treated as self-employed.
30
to say that for the district there is twice the Cumbrian percentage and four times the regional and national percentage of agricultural employees but not the extent of this industry for housing market areas from this source.
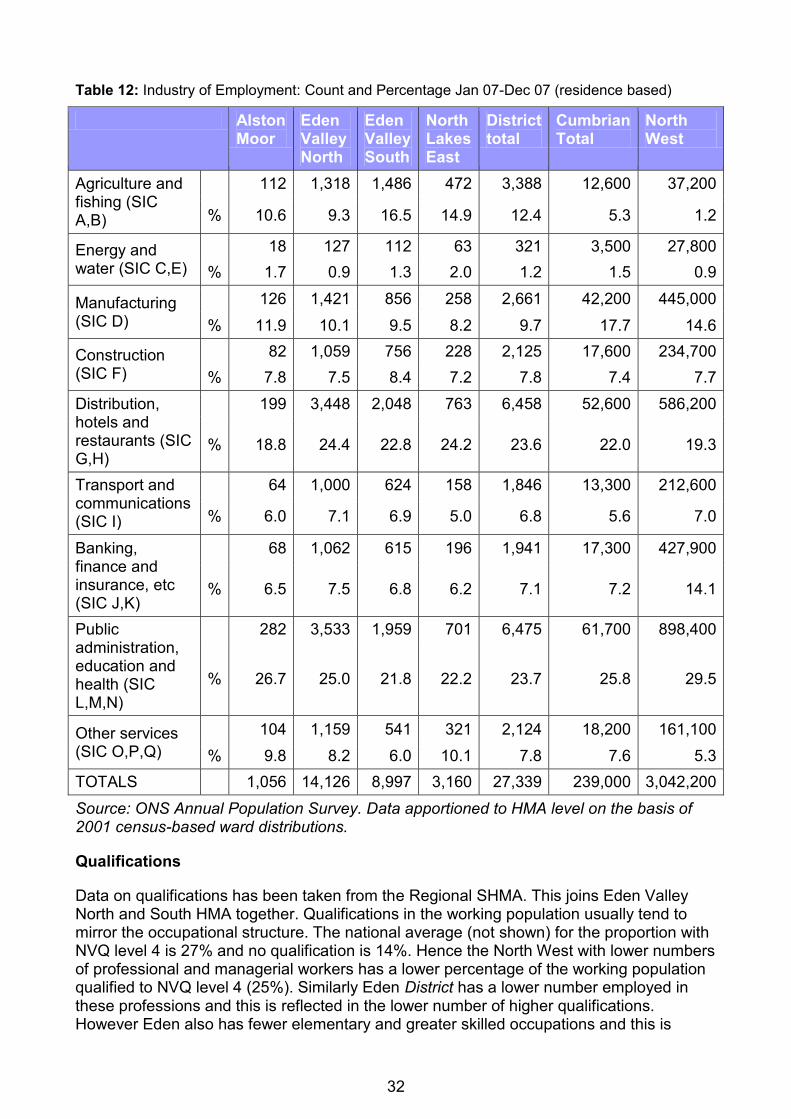
Residence based information (table 12) shows the jobs held by people living in the District. The highest proportion is in public administration, followed by the distribution/hotel/restaurants. This data also gives an indication of those residents working in agriculture, 3,388, the third largest industry, and it would seem reasonable to assume that many farmers and farm workers don‟t commute from outside the district to get to work and therefore these are also jobs based within the District.
At HMA level, Eden Valley North provides 11,263 jobs (not including farm owners) and 2,353 residence based self-employed (see Economic Activity table). At least 50% of all Eden‟s industries are based in this area, except for water and energy industries (see Additional tables) and is the District banking and public administration base. While it is not possible to say how many of these posts are filled by HMA residents, the information on travel to work areas indicates a degree of self containment in and around Penrith, and towards Carlisle. Further research into the level of industries in rural areas at a more local level is needed.
The highest level of industry within the area is distribution/hotels/restaurants with approximately 82% based in Penrith (based on 2003 ABI work based figures not shown). Further work is needed to break this category down further, although it is likely that the majority of this industry will be hotels and restaurants. This is followed by public administration/education/health; manufacturing; and banking/finance/insurance, with approximately 73% of the latter based in Penrith (2003 figures). Comparing this to the situation in 2003 shows a roughly similar pattern with slight rises in construction, transport, banking, public administration and other services.
Looking the type of industry in which the residents of the area work the patterns are very similar to the Districts, with the largest sector being public administration, followed by distribution/hotels/restaurants. While not the main industry for residence in the area, the highest number and percent of residents working in banking/finance/insurance in the District also lives here. Comparing this with 2001 Census data on occupational levels indicates that the levels are likely to be a higher scale overall than elsewhere in the District.
Comparing this with the data on occupation indicates that while there may be a relatively good level of managerial/professional levels these may not be in the highest paid sectors, but are rather hotel/catering and agriculture managers. Also while there was a high level of skilled trades, this includes agriculture workers and chefs/cooks, which are not necessarily the highest paid trades.
The high level of agriculture, hotel/catering, added to the high level of self-employment and skilled trades could just as easily indicate a high level of farming, bed and breakfast industries and smaller catering concerns as it could residents in well paid, high powered, highly mobile positions.
31
Table 11: Industry of Employment: Count and Percentage 2006-7 (work based9) including 2003 comparator
(Eden Valley North 2003)
Eden Valley North
Alston Eden Valley South
North Lakes - East
District Total
Cumbrian Total
North West Great Britain
Agriculture and fishing (SIC A,B) 59 62 7 7 17 823 2,777 13,369 203,124
% 0.5 0.5 1.2 0.1 1.1 4.1 1.5 0.5 0.9
Energy and water (SIC C,E) 89 45 1 71 62 178 1,527 10,087 153,600
% 0.8 0.4 0.2 1.2 3.9 0.9 0.8 0.4 0.7
Manufacturing (SIC D) 1,746 1,416 100 602 194 2,310 35,004 362,815 2,747,432
% 16.2 12.6 18 10 12.4 11.5 19.4 14.3 12.4
Construction (SIC F) 818 1,095 31 805 71 2,009 12,180 144,567 1,205,704
% 7.6 9.7 5.7 13.3 4.6 10.0 6.8 5.7 5.4
Distribution, hotels and restaurants (SIC G,H)
3,058 3,183 110 2,303 668 6,272 47,699 550,019 4,798,596
% 28.4 28.3 20 38.2 42.9 31.2 26.4 21.6 21.6
Transport and communications (SIC I) 620 735 39 535 48 1358 10,128 169,057 1,439,638
% 5.8 6.5 7.2 8.9 3.1 6.7 5.6 6.6 6.5
Banking, finance and insurance, etc (SIC J,K)
1,287 1416 60 518 155 2139 22,833 516,287 4,962,241
% 11.9 12.6 11 8.6 10 10.6 12.7 20.3 22.3
Public administration, education and health (SIC L,M,N)
2,718 2939 169 1,031 165 4299 40,356 665,542 5,602,997
% 25.2 26.1 31 17.1 10.6 21.4 22.4 26.2 25.2
Other services (SIC O,P,Q)10
377 374 29 160 180 747 7,853 111,353 1,108,558
% 3.5 3.3 5.2 2.6 11.5 3.7 4.4 4.4 5.0
TOTALS 10,769 11,263 545 6,030 1,557 20,134 180,356 2,543,095 22,221,887
Source: ABI Analysis, 2006-07. Work based.
9 Data does not include self employment. Data only includes agricultural employees at district (added together to give a County figure) and will leave out farmers counted as self-employed, which accounts for the seemingly
low figure for this industry given Cumbria‟s rural nature. 10
„Other services‟ include: other community, social and personal service activities (e.g. sewage, cultural/sporting activities, dry cleaning, hairdressing); Private households with employed persons (maids, gardeners, caretakers, babysitters, private secretaries); And extraterritorial organisations.
32
Table 12: Industry of Employment: Count and Percentage Jan 07-Dec 07 (residence based)
Alston Moor
Eden Valley North
Eden Valley South
North Lakes East
District total
Cumbrian Total
North West
Agriculture and fishing (SIC A,B)
112 1,318 1,486 472 3,388 12,600 37,200
% 10.6 9.3 16.5 14.9 12.4 5.3 1.2
Energy and water (SIC C,E)
18 127 112 63 321 3,500 27,800
% 1.7 0.9 1.3 2.0 1.2 1.5 0.9
Manufacturing (SIC D)
126 1,421 856 258 2,661 42,200 445,000
% 11.9 10.1 9.5 8.2 9.7 17.7 14.6
Construction (SIC F)
82 1,059 756 228 2,125 17,600 234,700
% 7.8 7.5 8.4 7.2 7.8 7.4 7.7
Distribution, hotels and restaurants (SIC G,H)
199 3,448 2,048 763 6,458 52,600 586,200
% 18.8 24.4 22.8 24.2 23.6 22.0 19.3
Transport and communications (SIC I)
64 1,000 624 158 1,846 13,300 212,600
% 6.0 7.1 6.9 5.0 6.8 5.6 7.0
Banking, finance and insurance, etc (SIC J,K)
68 1,062 615 196 1,941 17,300 427,900
% 6.5 7.5 6.8 6.2 7.1 7.2 14.1
Public administration, education and health (SIC L,M,N)
282 3,533 1,959 701 6,475 61,700 898,400
% 26.7 25.0 21.8 22.2 23.7 25.8 29.5
Other services (SIC O,P,Q)
104 1,159 541 321 2,124 18,200 161,100
% 9.8 8.2 6.0 10.1 7.8 7.6 5.3
TOTALS 1,056 14,126 8,997 3,160 27,339 239,000 3,042,200
Source: ONS Annual Population Survey. Data apportioned to HMA level on the basis of 2001 census-based ward distributions.
Qualifications
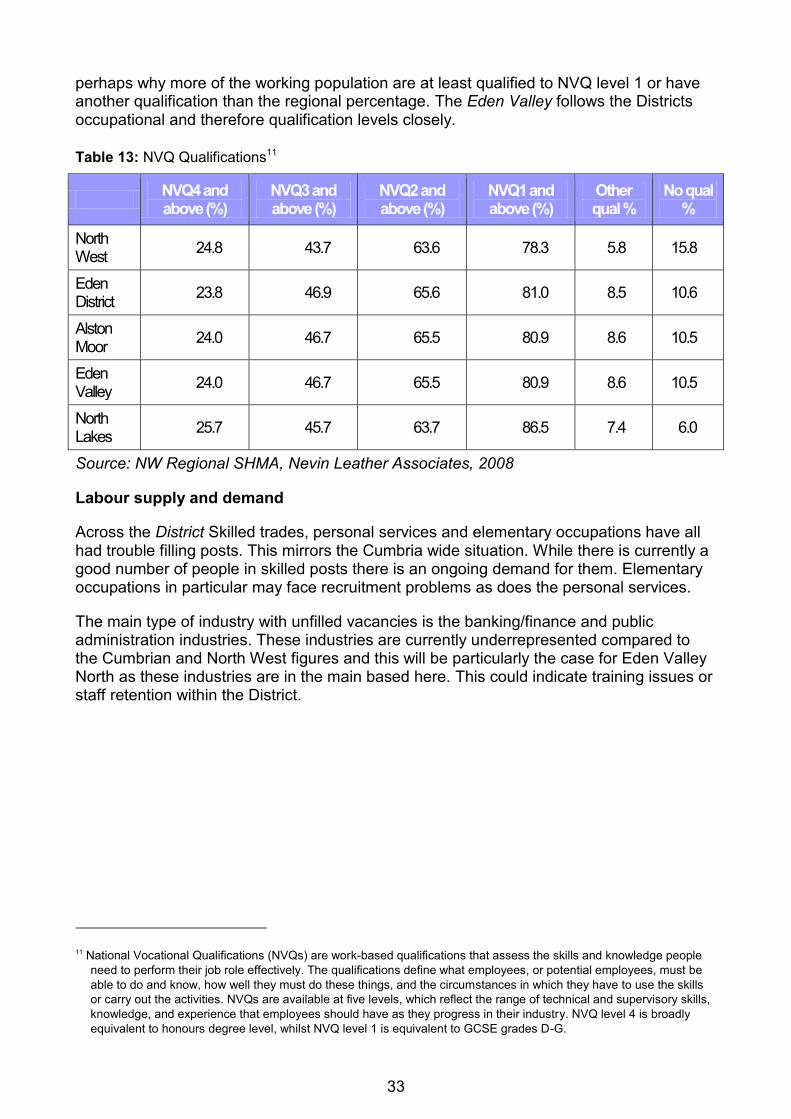
Data on qualifications has been taken from the Regional SHMA. This joins Eden Valley North and South HMA together. Qualifications in the working population usually tend to mirror the occupational structure. The national average (not shown) for the proportion with NVQ level 4 is 27% and no qualification is 14%. Hence the North West with lower numbers of professional and managerial workers has a lower percentage of the working population qualified to NVQ level 4 (25%). Similarly Eden District has a lower number employed in these professions and this is reflected in the lower number of higher qualifications. However Eden also has fewer elementary and greater skilled occupations and this is
33
perhaps why more of the working population are at least qualified to NVQ level 1 or have another qualification than the regional percentage. The Eden Valley follows the Districts occupational and therefore qualification levels closely.
Table 13: NVQ Qualifications11
NVQ4 and above (%)
NVQ3 and above (%)
NVQ2 and above (%)
NVQ1 and above (%)
Other qual %
No qual %
North West
24.8 43.7 63.6 78.3 5.8 15.8
Eden District
23.8 46.9 65.6 81.0 8.5 10.6
Alston Moor
24.0 46.7 65.5 80.9 8.6 10.5
Eden Valley
24.0 46.7 65.5 80.9 8.6 10.5
North Lakes
25.7 45.7 63.7 86.5 7.4 6.0
Source: NW Regional SHMA, Nevin Leather Associates, 2008
Labour supply and demand
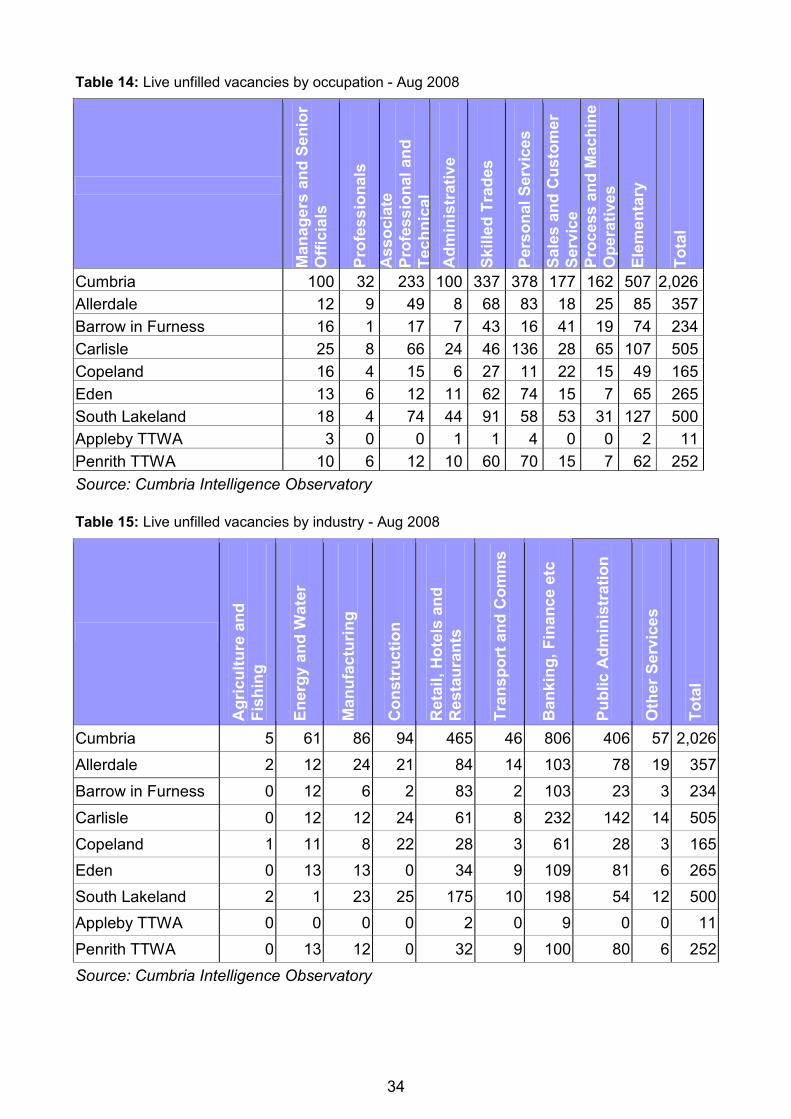
Across the District Skilled trades, personal services and elementary occupations have all had trouble filling posts. This mirrors the Cumbria wide situation. While there is currently a good number of people in skilled posts there is an ongoing demand for them. Elementary occupations in particular may face recruitment problems as does the personal services.
The main type of industry with unfilled vacancies is the banking/finance and public administration industries. These industries are currently underrepresented compared to the Cumbrian and North West figures and this will be particularly the case for Eden Valley North as these industries are in the main based here. This could indicate training issues or staff retention within the District.
11 National Vocational Qualifications (NVQs) are work-based qualifications that assess the skills and knowledge people
need to perform their job role effectively. The qualifications define what employees, or potential employees, must be
able to do and know, how well they must do these things, and the circumstances in which they have to use the skills
or carry out the activities. NVQs are available at five levels, which reflect the range of technical and supervisory skills,
knowledge, and experience that employees should have as they progress in their industry. NVQ level 4 is broadly
equivalent to honours degree level, whilst NVQ level 1 is equivalent to GCSE grades D-G.
34
Table 14: Live unfilled vacancies by occupation - Aug 2008
Ma
nag
ers
an
d S
en
ior
Off
icia
ls
Pro
fes
sio
na
ls
Ass
ocia
te
Pro
fes
sio
na
l a
nd
Tec
hn
ical
Ad
min
istr
ati
ve
Sk
ille
d T
rad
es
Pe
rso
nal
Serv
ice
s
Sa
les
an
d C
usto
me
r
Se
rvic
e
Pro
ce
ss
an
d M
ac
hin
e
Op
era
tive
s
Ele
me
nta
ry
To
tal
Cumbria 100 32 233 100 337 378 177 162 507 2,026
Allerdale 12 9 49 8 68 83 18 25 85 357
Barrow in Furness 16 1 17 7 43 16 41 19 74 234
Carlisle 25 8 66 24 46 136 28 65 107 505
Copeland 16 4 15 6 27 11 22 15 49 165
Eden 13 6 12 11 62 74 15 7 65 265
South Lakeland 18 4 74 44 91 58 53 31 127 500
Appleby TTWA 3 0 0 1 1 4 0 0 2 11
Penrith TTWA 10 6 12 10 60 70 15 7 62 252
Source: Cumbria Intelligence Observatory
Table 15: Live unfilled vacancies by industry - Aug 2008
Ag
ric
ult
ure
an
d
Fis
hin
g
En
erg
y a
nd
Wa
ter
Ma
nu
fac
turi
ng
Co
ns
tru
cti
on
Reta
il,
Ho
tels
an
d
Res
tau
ran
ts
Tra
nsp
ort
an
d C
om
ms
Ban
kin
g,
Fin
an
ce
etc
Pu
blic
Ad
min
istr
ati
on
Oth
er
Se
rvic
es
To
tal
Cumbria 5 61 86 94 465 46 806 406 57 2,026
Allerdale 2 12 24 21 84 14 103 78 19 357
Barrow in Furness 0 12 6 2 83 2 103 23 3 234
Carlisle 0 12 12 24 61 8 232 142 14 505
Copeland 1 11 8 22 28 3 61 28 3 165
Eden 0 13 13 0 34 9 109 81 6 265
South Lakeland 2 1 23 25 175 10 198 54 12 500
Appleby TTWA 0 0 0 0 2 0 9 0 0 11
Penrith TTWA 0 13 12 0 32 9 100 80 6 252
Source: Cumbria Intelligence Observatory
35
1.4 Incomes and earnings12
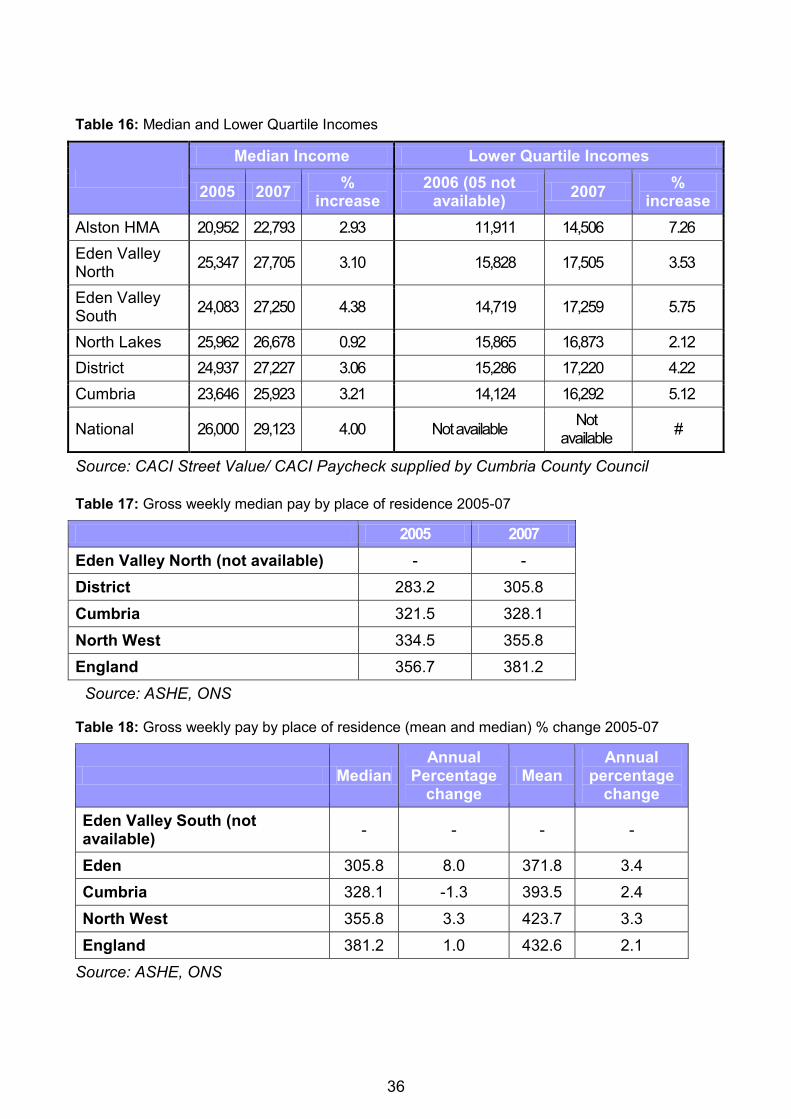
Government Guidance suggests that incomes and earnings are key drivers of demand. Studies suggest that households spend more on housing as incomes increase, though at a rate less than their growth in income, and as incomes rise demand for neighbourhood quality increases together with house size. In 2005 the median income for Eden District and Cumbria was lower than the National level, and this situation has not improved - in fact the gap has increase with the national levels increasing 4% and district and county 3%.
Within this Eden Valley North‟s median income was higher than the District and Cumbria‟s in 2005 but still lower than the National figure. This pattern had not changed by 2008. Looking at lower quartile incomes (from 2006) this was and still is higher than the District average and Cumbria. Also the area contains the widest gap between lower quartile and median income figures, indicating a wide range of marginally higher incomes. However while this has seen an annual increase of 3.53% in lower quartile incomes this growth is not as marked an increase as County‟s and is below growth in other parts of the District
It is not possible to say what proportion of this income is earned income and what may be from investments and pensions, though it is likely that the slightly higher income is influenced by employment in Carlisle. While the area contains the highest lower quartile incomes this does not necessarily mean that it has fewer numbers of people on lower incomes. As the area has the largest number of people it follows that within its bottom 25% there may be an equal or even greater number of people on £14,506 or below than in Alston with its lower population.
While the District wide unemployment rate may be low the gross weekly pay is lower than the median for Cumbria, the North West and England, and although the area has experienced increases earnings are still lower by between £22 and £75 per week. Therefore there are more people working in lower paid jobs despite the overall rise in upper occupational levels (see above). Earnings data is not available at HMA level.
12 Information on incomes is derived from CACI Paycheck. This utilises Census data and does not therefore householders if their
property is a second/holiday home. „Income‟ includes income from savings, investments, certain benefits and earnings. Earnings are salary only.
36
Table 16: Median and Lower Quartile Incomes
Median Income Lower Quartile Incomes
2005 2007 %
increase 2006 (05 not
available) 2007
% increase
Alston HMA 20,952 22,793 2.93 11,911 14,506 7.26
Eden Valley North
25,347 27,705 3.10 15,828 17,505 3.53
Eden Valley South
24,083 27,250 4.38 14,719 17,259 5.75
North Lakes 25,962 26,678 0.92 15,865 16,873 2.12
District 24,937 27,227 3.06 15,286 17,220 4.22
Cumbria 23,646 25,923 3.21 14,124 16,292 5.12
National 26,000 29,123 4.00 Not available Not
available #
Source: CACI Street Value/ CACI Paycheck supplied by Cumbria County Council
Table 17: Gross weekly median pay by place of residence 2005-07
2005 2007
Eden Valley North (not available) - -
District 283.2 305.8
Cumbria 321.5 328.1
North West 334.5 355.8
England 356.7 381.2
Source: ASHE, ONS
Table 18: Gross weekly pay by place of residence (mean and median) % change 2005-07
Median Annual
Percentage change
Mean Annual
percentage change
Eden Valley South (not available)
- - - -
Eden 305.8 8.0 371.8 3.4
Cumbria 328.1 -1.3 393.5 2.4
North West 355.8 3.3 423.7 3.3
England 381.2 1.0 432.6 2.1
Source: ASHE, ONS
37
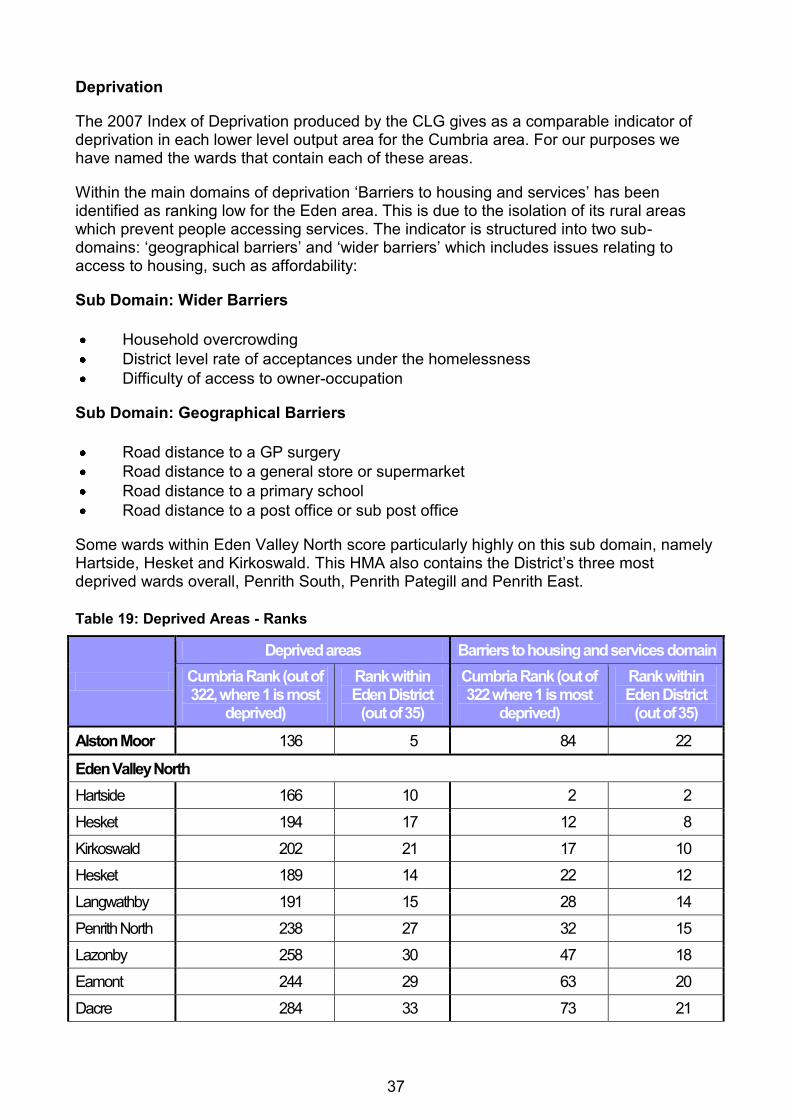
Deprivation
The 2007 Index of Deprivation produced by the CLG gives as a comparable indicator of deprivation in each lower level output area for the Cumbria area. For our purposes we have named the wards that contain each of these areas.
Within the main domains of deprivation „Barriers to housing and services‟ has been identified as ranking low for the Eden area. This is due to the isolation of its rural areas which prevent people accessing services. The indicator is structured into two sub-domains: „geographical barriers‟ and „wider barriers‟ which includes issues relating to access to housing, such as affordability:
Sub Domain: Wider Barriers
Household overcrowding
District level rate of acceptances under the homelessness
Difficulty of access to owner-occupation
Sub Domain: Geographical Barriers
Road distance to a GP surgery
Road distance to a general store or supermarket
Road distance to a primary school
Road distance to a post office or sub post office
Some wards within Eden Valley North score particularly highly on this sub domain, namely Hartside, Hesket and Kirkoswald. This HMA also contains the District‟s three most deprived wards overall, Penrith South, Penrith Pategill and Penrith East.
Table 19: Deprived Areas - Ranks
Deprived areas Barriers to housing and services domain
Cumbria Rank (out of 322, where 1 is most
deprived)
Rank within Eden District
(out of 35)
Cumbria Rank (out of 322 where 1 is most
deprived)
Rank within Eden District
(out of 35)
Alston Moor 136 5 84 22
Eden Valley North
Hartside 166 10 2 2
Hesket 194 17 12 8
Kirkoswald 202 21 17 10
Hesket 189 14 22 12
Langwathby 191 15 28 14
Penrith North 238 27 32 15
Lazonby 258 30 47 18
Eamont 244 29 63 20
Dacre 284 33 73 21
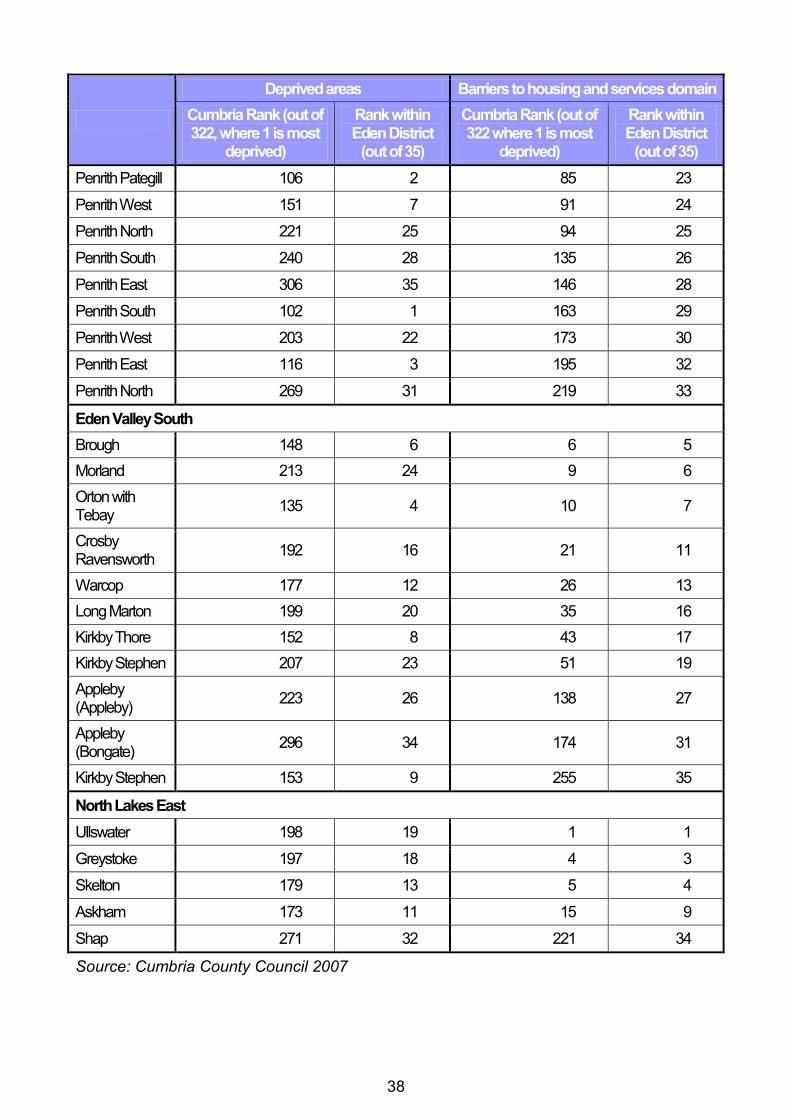
38
Deprived areas Barriers to housing and services domain
Cumbria Rank (out of 322, where 1 is most
deprived)
Rank within Eden District
(out of 35)
Cumbria Rank (out of 322 where 1 is most
deprived)
Rank within Eden District
(out of 35)
Penrith Pategill 106 2 85 23
Penrith West 151 7 91 24
Penrith North 221 25 94 25
Penrith South 240 28 135 26
Penrith East 306 35 146 28
Penrith South 102 1 163 29
Penrith West 203 22 173 30
Penrith East 116 3 195 32
Penrith North 269 31 219 33
Eden Valley South
Brough 148 6 6 5
Morland 213 24 9 6
Orton with Tebay
135 4 10 7
Crosby Ravensworth
192 16 21 11
Warcop 177 12 26 13
Long Marton 199 20 35 16
Kirkby Thore 152 8 43 17
Kirkby Stephen 207 23 51 19
Appleby (Appleby)
223 26 138 27
Appleby (Bongate)
296 34 174 31
Kirkby Stephen 153 9 255 35
North Lakes East
Ullswater 198 19 1 1
Greystoke 197 18 4 3
Skelton 179 13 5 4
Askham 173 11 15 9
Shap 271 32 221 34
Source: Cumbria County Council 2007

39
District Economic Development Team - commentary
The Vision for the economy of Eden as contained in the District Councils Economic Development Strategy (launched in June 2006) is that “by 2016 Eden will enjoy a diverse and sustainable economy providing opportunities for employment and continuous business development. By encouraging sustainable practises Eden will maintain a vibrant visitor destination whilst promoting the protection of the environment for future generations”. (Note: The strategy is due for review in 2009).
The vision of sustainability in the District Council Economic Development Strategy is reinforced in the Eden Community Strategy and also the Core Strategy of the Local Development Framework (LDF). Sustainability of the local economy is promoted within these documents as being achievable by concentrating new employment and residential development around „key‟ or „local‟ service centres.
The town of Penrith is strategically placed on Junction 40 of the M6 Motorway offering opportunities to attract new inward investment. In addition it is the principal town in Eden and acts as the economic engine for the rest of the District. It is the place to absorb a substantial proportion of new housing and employment as provided in the LDF. The LDF provides for up to 4300 new homes to be built in Eden up to 2021 with a substantial portion of these in Penrith. The District will need to work hard to create local high quality jobs for the occupants of these houses if the aim of a sustainable community is to be met.
In recognition of its role and functions together with comparably poor vitality and viability indicators Penrith has enjoyed a good deal of attention from public sources in the recent past. For example substantial effort has been made by the District Council to achieve a partnership agreement with Lowther Manelli in July 2008 to build out a £70m „mixed development‟ at Southend Road to bring improved vitality and viability to the town. The development was forecast to create approximately 950 new full and part time jobs. (At the time of writing the scheme was on hold in October 2008 as a result of dramatic changes in the world‟s financial markets).
Penrith attracted Market Town Initiative (MTI) funding from the North West Development Agency between 2005 and 2008 to carry out a range of functions including producing strategic planning documents linked to a Master Plan for the town and environs. In addition the MTI was able to support a range of projects including managing a grant scheme to encourage shop front improvements and attract support for the creation of a „cycle hub‟ aimed at ensuring cyclists stay longer and spend more in the town.
In recognition of the demographic data featured elsewhere in this document economic development effort is given to addressing the identified weaknesses in the Eden economy of:
Under employment
Exodus of talented young people
Limited public transport
Preponderance of low wage jobs
Key corporate priority areas for the District Council include focusing on the quality and range of jobs and ensuring affordable housing for the workforce.
The District Council has given a priority to „Support the Vitality of Penrith‟ in recognition of the regeneration initiatives taking place and the role of the town as the economic engine

40
for the Eden District. It is also necessary to focus on improving the range and quality of local jobs to provide employment for the occupants of the new houses and also meet the need of existing residents many of whom have aspirations to enter the property market and who are currently prevented from doing so because of the high ratio between wages and the cost of housing.
In the case of Penrith, the District Council has used its community leadership role to create a new partnership between public private and voluntary sectors to deliver projects which will result in the creation of new jobs and improve vitality and viability in the town centre. There are four main programme areas:
Marketing of Penrith;
Festival Feel to an Event(s);
Public Realm Improvements;
Road Extension to Eden Business Park
One of the main economic development and housing related projects is the planned extension of Eden Business Park (EBP). With the desired infrastructure in place, it will be possible to create up to 160 acres of land for employment development and around a further 50 acres of water created by flood attenuation. The water offers opportunities to create a world class site combining an attractive environment interspersed with quality buildings. The principal strategic aim in bringing forward the Eden Business Park for development is to progress a diverse and vibrant economy and encourage rural regeneration in the Eden area.
The Council's objectives in developing this site are:
Support the development of manufacturing and high tech industry.
Diversify the rural economy.
Encourage higher wage levels within the local economy.
Ensure that businesses have access to sites and premises they require.
Encourage sustainable business development.
The close proximity of the University of Cumbria Newton Rigg campus to the EBP will add further to the range of tantalising opportunities which it is anticipated will bring employers enticed by the prospect of a superb environment, a ready supply of graduates and other qualified workforce together with the prospects for „cluster developments‟ associated with the disciplines offered by the University. A bid for funding to carry out the necessary infrastructure investigations is being framed by the District Council as at November 2008 in the expectation of a formal submission for funding to North West Development Agency in 2009/10.
Consideration is also being given to bids to the NWDA, which will deliver improvements in public spaces as a means of increasing retail prospects and inspire a „sense of place‟.
The University of Cumbria Newton Rigg Campus wants to offer places for up to 3,000 students. This expansion whilst being welcomed on the one hand as an economic generator of wealth will create an impact on the housing market which will need to be carefully managed within the terms of the LDF to ensure maximum benefit with minimum disruption and „skewing‟ of the housing market.
In an effort to underpin the drive to improve the range and quality of jobs, a bid is to be made in 2009 by the local 14-19 Partnership to the Learning and Skills Council for funding
41
to create a „Hub and Spoke‟ system of vocational training throughout Eden District. The bid provides for the hub to be on the University Campus at Newton Rigg. Links with local employers will be developed to ensure the skills demanded by local employers will have complimentary training provision in the „hub‟.
The review of the Economic Development Strategy during 2009 will no doubt result in further initiatives throughout Eden and in the Eden Valley North SHMA area.
Stage 2: The housing stock
2.1 The dwelling profile
Please see Section 5 for number of housing completions
The Eden Valley North covers a diverse area which includes Penrith market town and deep rural locations. Consequently there are a wide range of dwellings that have built up as a result of the differing lifestyles and needs. The following highlights some of the main points:
Relatively high owner occupation, detached properties and number of rooms compared to Cumbria as a whole.
However significant differences exist within the HMA, with a greater concentration of smaller properties and social housing found in Penrith.
There are concentrations of social housing on the Pategill, Scaws and Raiselands Croft estates.
However overall there is a lower percent of social rented stock than the County and nearly half that of Region, which is also notable of the District as a whole. These differences are made up by greater owner occupation and a slightly higher level of private rental.
Data from the Housing Strategy Statistical Appendix (HSSA) 2008 shows that across the District social rented stock has risen from 2179 to 2295, a 5% increase while private sector (rented and owner occupied) has risen from 19,800 to 22,547, a 13% increase.
The 2001 data showed there was a slightly higher level of shared ownership in the HMA compared to the District, County and Region. A number of these developments have also taken place since the Census. Data available since 2003 shows 43 new shared ownership units completed.
Of note is the higher number of detached properties both within the District and this HMA compared to the County and Region. While the number of flats is only slightly less here there are much fewer terrace houses.
Compared to the County and Region this HMA and the Eden District have a greater number of properties with 7 or more rooms13 and fewer smaller ones.
13 Allowing for a kitchen, living room, bathroom and possibly separate dining room this means 3-4 bedrooms or more.
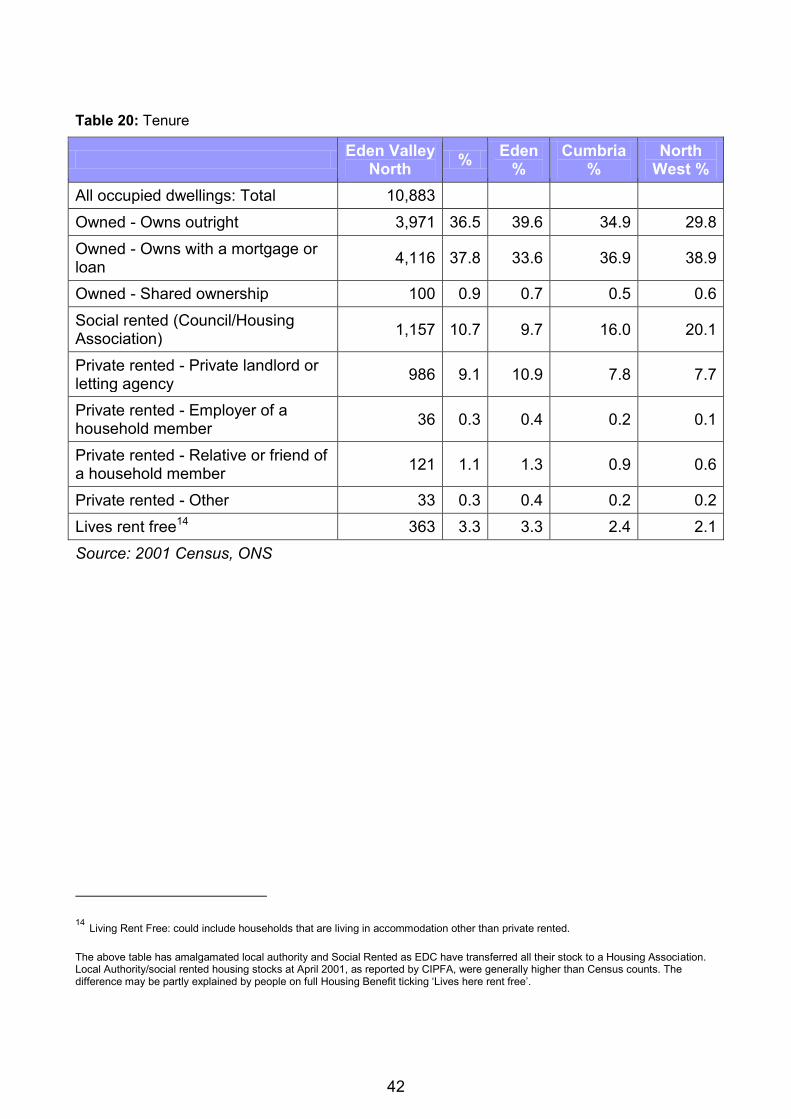
42
Table 20: Tenure
Eden Valley
North %
Eden %
Cumbria %
North West %
All occupied dwellings: Total 10,883
Owned - Owns outright 3,971 36.5 39.6 34.9 29.8
Owned - Owns with a mortgage or loan
4,116 37.8 33.6 36.9 38.9
Owned - Shared ownership 100 0.9 0.7 0.5 0.6
Social rented (Council/Housing Association)
1,157 10.7 9.7 16.0 20.1
Private rented - Private landlord or letting agency
986 9.1 10.9 7.8 7.7
Private rented - Employer of a household member
36 0.3 0.4 0.2 0.1
Private rented - Relative or friend of a household member
121 1.1 1.3 0.9 0.6
Private rented - Other 33 0.3 0.4 0.2 0.2
Lives rent free14 363 3.3 3.3 2.4 2.1
Source: 2001 Census, ONS
14 Living Rent Free: could include households that are living in accommodation other than private rented.
The above table has amalgamated local authority and Social Rented as EDC have transferred all their stock to a Housing Association. Local Authority/social rented housing stocks at April 2001, as reported by CIPFA, were generally higher than Census counts. The difference may be partly explained by people on full Housing Benefit ticking „Lives here rent free‟.
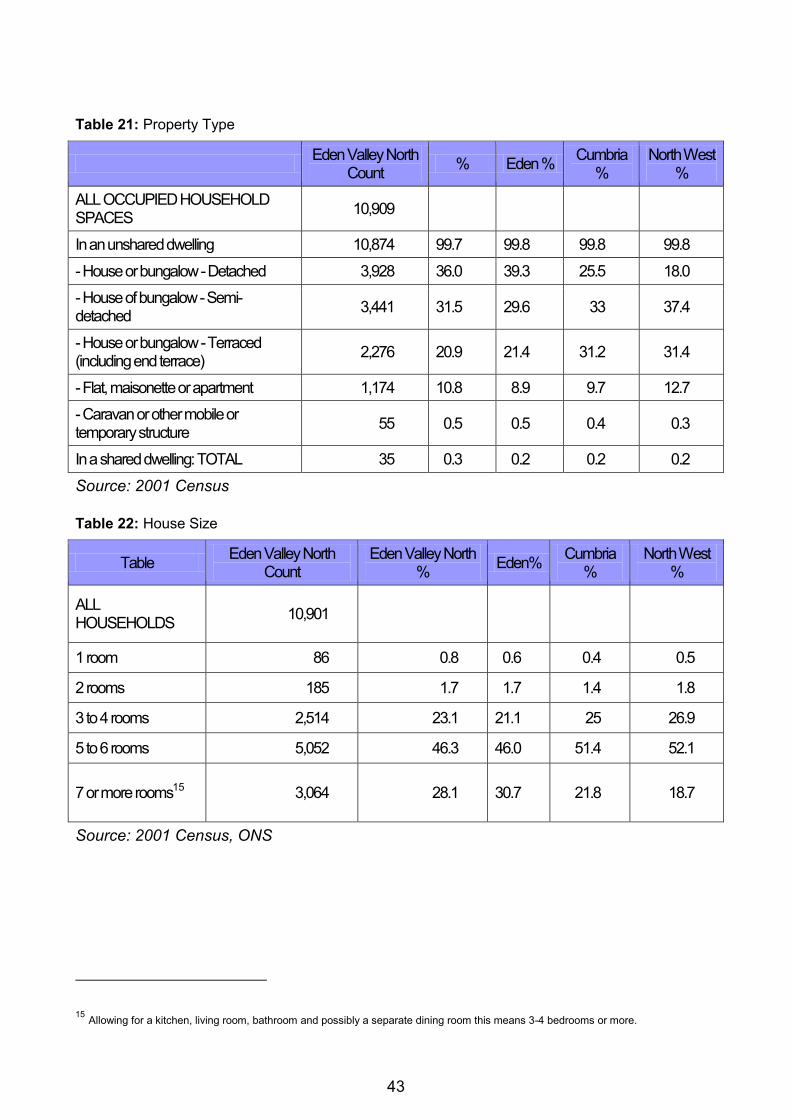
43
Table 21: Property Type
Eden Valley North
Count % Eden %
Cumbria %
North West %
ALL OCCUPIED HOUSEHOLD SPACES
10,909
In an unshared dwelling 10,874 99.7 99.8 99.8 99.8
- House or bungalow - Detached 3,928 36.0 39.3 25.5 18.0
- House of bungalow - Semi-detached
3,441 31.5 29.6 33 37.4
- House or bungalow - Terraced (including end terrace)
2,276 20.9 21.4 31.2 31.4
- Flat, maisonette or apartment 1,174 10.8 8.9 9.7 12.7
- Caravan or other mobile or temporary structure
55 0.5 0.5 0.4 0.3
In a shared dwelling: TOTAL 35 0.3 0.2 0.2 0.2
Source: 2001 Census
Table 22: House Size
Table Eden Valley North
Count Eden Valley North
% Eden%
Cumbria %
North West %
ALL HOUSEHOLDS
10,901
1 room 86 0.8 0.6 0.4 0.5
2 rooms 185 1.7 1.7 1.4 1.8
3 to 4 rooms 2,514 23.1 21.1 25 26.9
5 to 6 rooms 5,052 46.3 46.0 51.4 52.1
7 or more rooms15 3,064 28.1 30.7 21.8 18.7
Source: 2001 Census, ONS
15 Allowing for a kitchen, living room, bathroom and possibly a separate dining room this means 3-4 bedrooms or more.
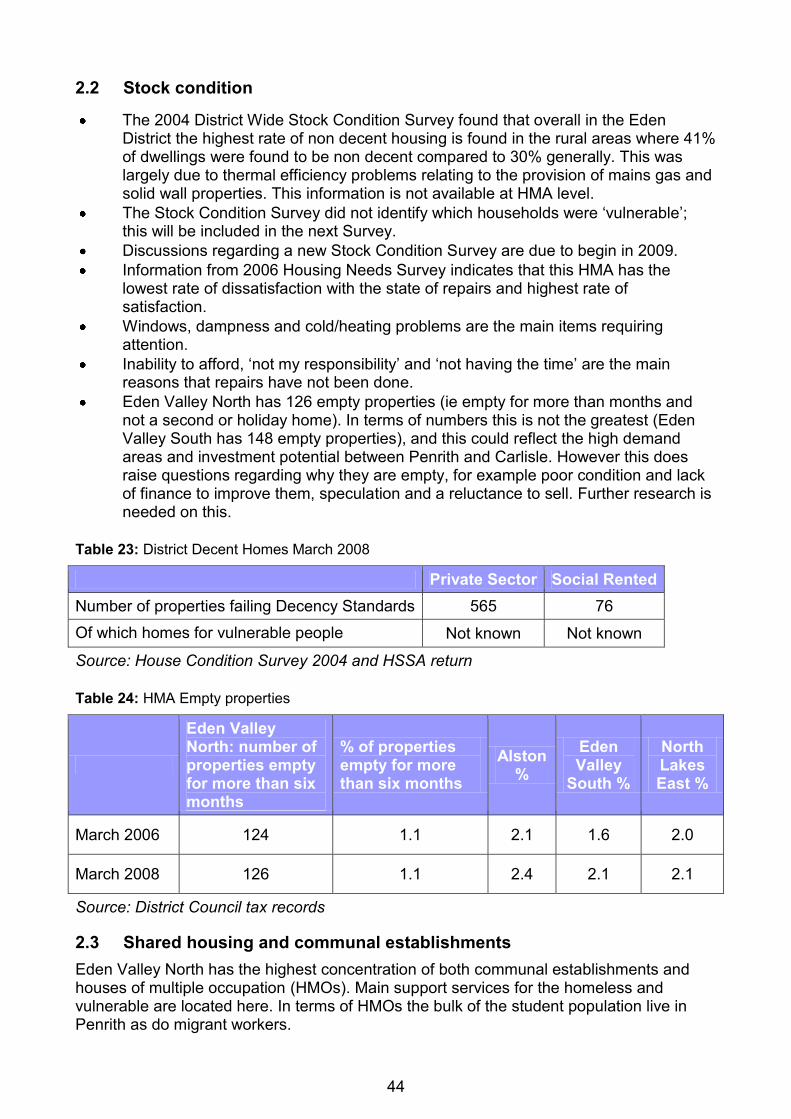
44
2.2 Stock condition
The 2004 District Wide Stock Condition Survey found that overall in the Eden District the highest rate of non decent housing is found in the rural areas where 41% of dwellings were found to be non decent compared to 30% generally. This was largely due to thermal efficiency problems relating to the provision of mains gas and solid wall properties. This information is not available at HMA level.
The Stock Condition Survey did not identify which households were „vulnerable‟; this will be included in the next Survey.
Discussions regarding a new Stock Condition Survey are due to begin in 2009.
Information from 2006 Housing Needs Survey indicates that this HMA has the lowest rate of dissatisfaction with the state of repairs and highest rate of satisfaction.
Windows, dampness and cold/heating problems are the main items requiring attention.
Inability to afford, „not my responsibility‟ and „not having the time‟ are the main reasons that repairs have not been done.
Eden Valley North has 126 empty properties (ie empty for more than months and not a second or holiday home). In terms of numbers this is not the greatest (Eden Valley South has 148 empty properties), and this could reflect the high demand areas and investment potential between Penrith and Carlisle. However this does raise questions regarding why they are empty, for example poor condition and lack of finance to improve them, speculation and a reluctance to sell. Further research is needed on this.
Table 23: District Decent Homes March 2008
Private Sector Social Rented
Number of properties failing Decency Standards 565 76
Of which homes for vulnerable people Not known Not known
Source: House Condition Survey 2004 and HSSA return
Table 24: HMA Empty properties
Eden Valley North: number of properties empty for more than six months
% of properties empty for more than six months
Alston %
Eden Valley
South %
North Lakes East %
March 2006 124 1.1 2.1 1.6 2.0
March 2008 126 1.1 2.4 2.1 2.1
Source: District Council tax records
2.3 Shared housing and communal establishments
Eden Valley North has the highest concentration of both communal establishments and houses of multiple occupation (HMOs). Main support services for the homeless and vulnerable are located here. In terms of HMOs the bulk of the student population live in Penrith as do migrant workers.
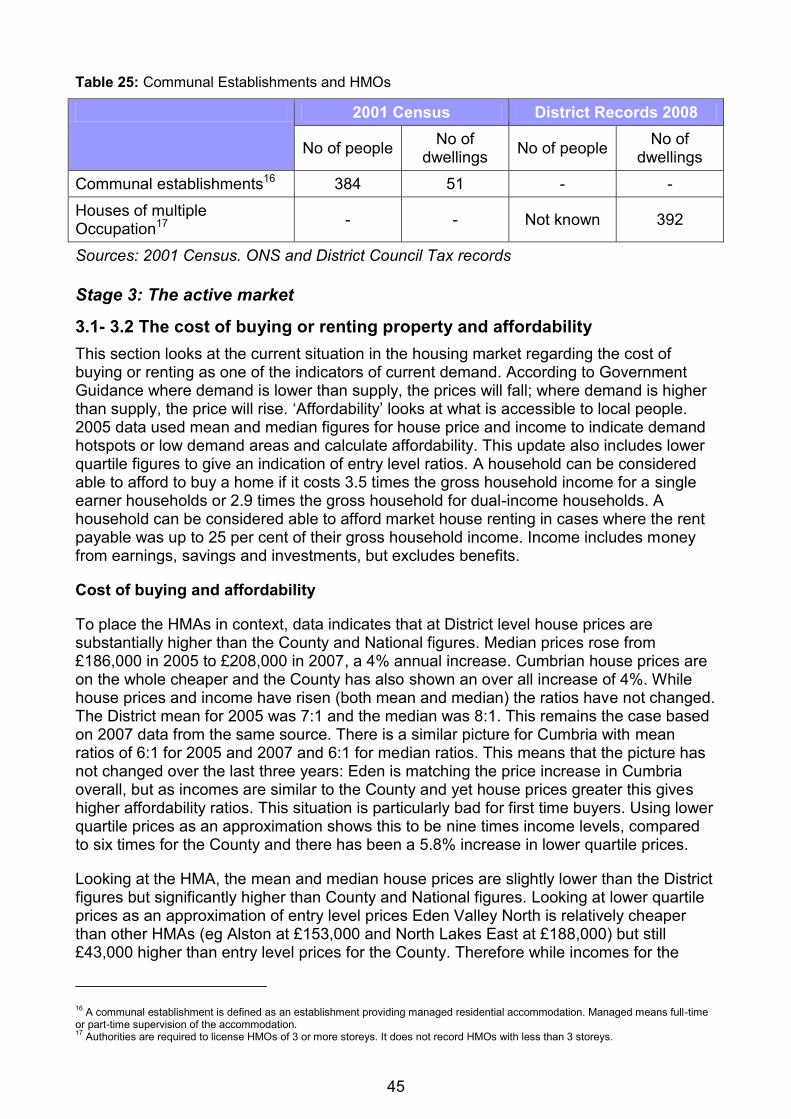
45
Table 25: Communal Establishments and HMOs
2001 Census District Records 2008
No of people No of
dwellings No of people
No of dwellings
Communal establishments16 384 51 - -
Houses of multiple Occupation17
- - Not known 392
Sources: 2001 Census. ONS and District Council Tax records
Stage 3: The active market
3.1- 3.2 The cost of buying or renting property and affordability
This section looks at the current situation in the housing market regarding the cost of buying or renting as one of the indicators of current demand. According to Government Guidance where demand is lower than supply, the prices will fall; where demand is higher than supply, the price will rise. „Affordability‟ looks at what is accessible to local people. 2005 data used mean and median figures for house price and income to indicate demand hotspots or low demand areas and calculate affordability. This update also includes lower quartile figures to give an indication of entry level ratios. A household can be considered able to afford to buy a home if it costs 3.5 times the gross household income for a single earner households or 2.9 times the gross household for dual-income households. A household can be considered able to afford market house renting in cases where the rent payable was up to 25 per cent of their gross household income. Income includes money from earnings, savings and investments, but excludes benefits.
Cost of buying and affordability
To place the HMAs in context, data indicates that at District level house prices are substantially higher than the County and National figures. Median prices rose from £186,000 in 2005 to £208,000 in 2007, a 4% annual increase. Cumbrian house prices are on the whole cheaper and the County has also shown an over all increase of 4%. While house prices and income have risen (both mean and median) the ratios have not changed. The District mean for 2005 was 7:1 and the median was 8:1. This remains the case based on 2007 data from the same source. There is a similar picture for Cumbria with mean ratios of 6:1 for 2005 and 2007 and 6:1 for median ratios. This means that the picture has not changed over the last three years: Eden is matching the price increase in Cumbria overall, but as incomes are similar to the County and yet house prices greater this gives higher affordability ratios. This situation is particularly bad for first time buyers. Using lower quartile prices as an approximation shows this to be nine times income levels, compared to six times for the County and there has been a 5.8% increase in lower quartile prices.
Looking at the HMA, the mean and median house prices are slightly lower than the District figures but significantly higher than County and National figures. Looking at lower quartile prices as an approximation of entry level prices Eden Valley North is relatively cheaper than other HMAs (eg Alston at £153,000 and North Lakes East at £188,000) but still £43,000 higher than entry level prices for the County. Therefore while incomes for the
16 A communal establishment is defined as an establishment providing managed residential accommodation. Managed means full-time
or part-time supervision of the accommodation. 17
Authorities are required to license HMOs of 3 or more storeys. It does not record HMOs with less than 3 storeys.
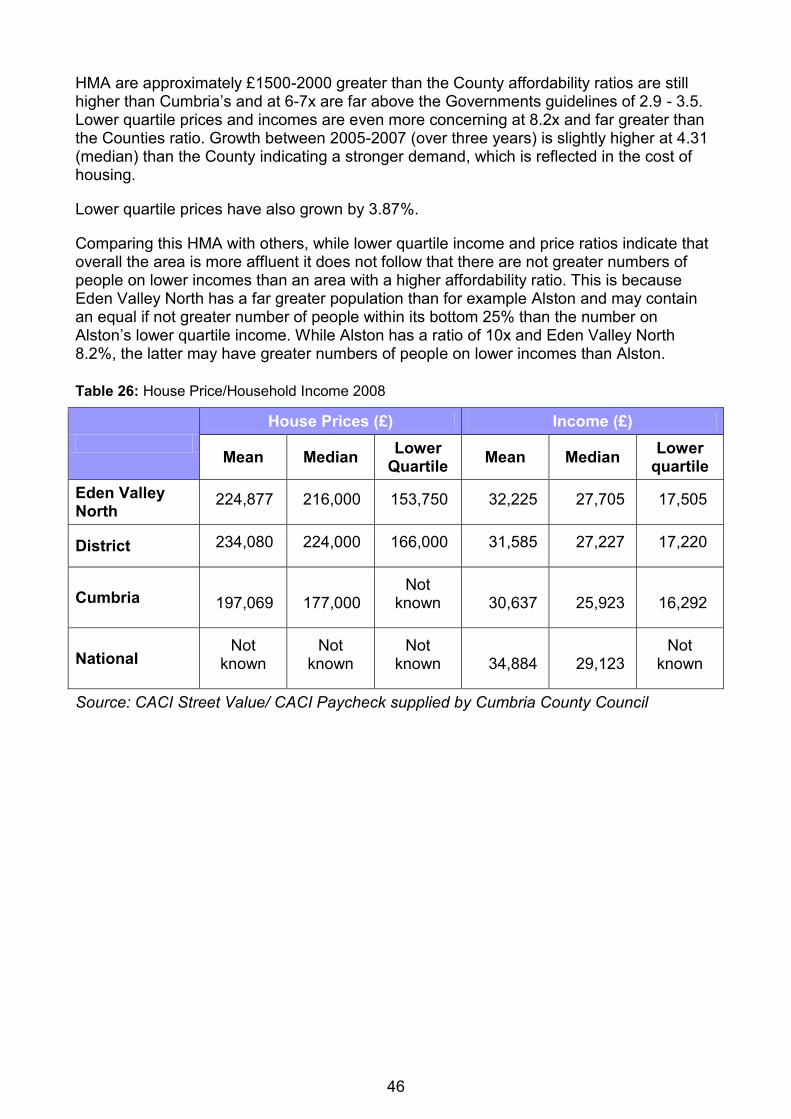
46
HMA are approximately £1500-2000 greater than the County affordability ratios are still higher than Cumbria‟s and at 6-7x are far above the Governments guidelines of 2.9 - 3.5. Lower quartile prices and incomes are even more concerning at 8.2x and far greater than the Counties ratio. Growth between 2005-2007 (over three years) is slightly higher at 4.31 (median) than the County indicating a stronger demand, which is reflected in the cost of housing.
Lower quartile prices have also grown by 3.87%.
Comparing this HMA with others, while lower quartile income and price ratios indicate that overall the area is more affluent it does not follow that there are not greater numbers of people on lower incomes than an area with a higher affordability ratio. This is because Eden Valley North has a far greater population than for example Alston and may contain an equal if not greater number of people within its bottom 25% than the number on Alston‟s lower quartile income. While Alston has a ratio of 10x and Eden Valley North 8.2%, the latter may have greater numbers of people on lower incomes than Alston.
Table 26: House Price/Household Income 2008
House Prices (£) Income (£)
Mean Median Lower
Quartile Mean Median
Lower quartile
Eden Valley North
224,877 216,000 153,750 32,225 27,705 17,505
District 234,080 224,000 166,000 31,585 27,227 17,220
Cumbria 197,069 177,000 Not
known 30,637 25,923 16,292
National Not
known Not
known Not
known 34,884 29,123 Not
known
Source: CACI Street Value/ CACI Paycheck supplied by Cumbria County Council
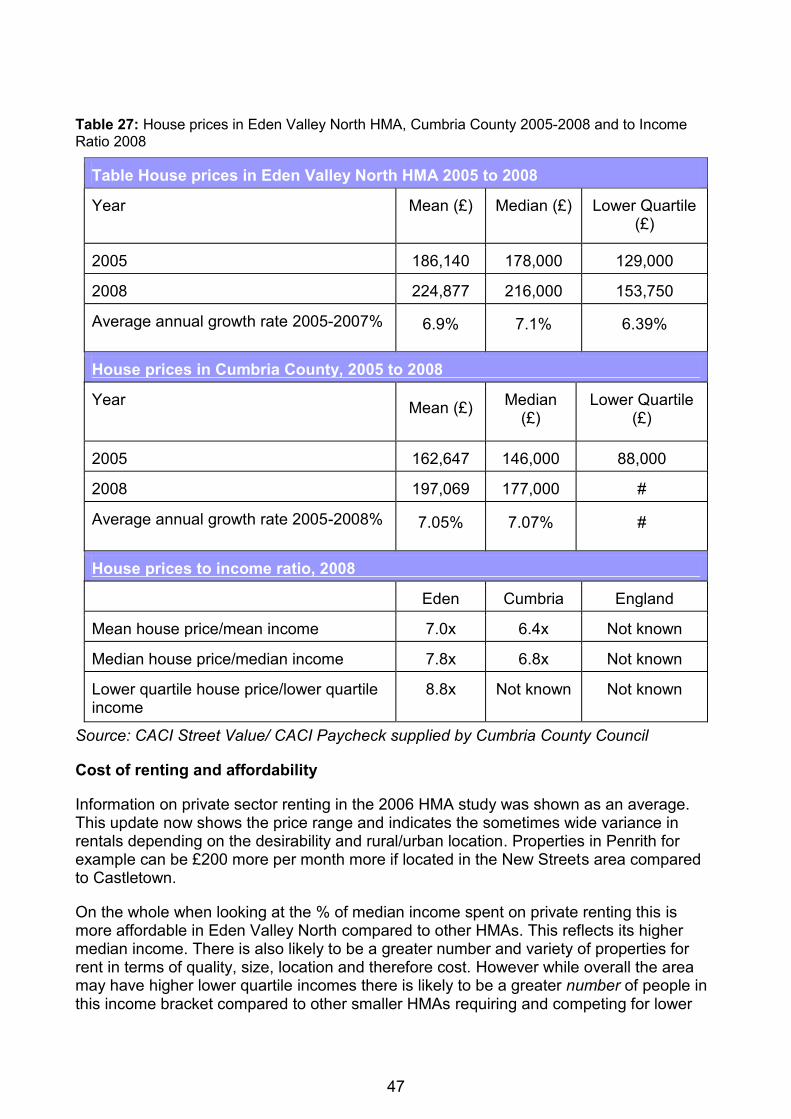
47
Table 27: House prices in Eden Valley North HMA, Cumbria County 2005-2008 and to Income Ratio 2008
Table House prices in Eden Valley North HMA 2005 to 2008
Year Mean (£) Median (£) Lower Quartile (£)
2005 186,140 178,000 129,000
2008 224,877 216,000 153,750
Average annual growth rate 2005-2007% 6.9% 7.1% 6.39%
House prices in Cumbria County, 2005 to 2008
Year Mean (£)
Median (£)
Lower Quartile (£)
2005 162,647 146,000 88,000
2008 197,069 177,000 #
Average annual growth rate 2005-2008% 7.05% 7.07% #
House prices to income ratio, 2008
Eden Valley North
Cumbria England
Mean house price/mean income 7.0x 6.4x Not known
Median house price/median income 7.8x 6.8x Not known
Lower quartile house price/lower quartile income
8.8x Not known Not known
Source: CACI Street Value/ CACI Paycheck supplied by Cumbria County Council
Cost of renting and affordability
Information on private sector renting in the 2006 HMA study was shown as an average. This update now shows the price range and indicates the sometimes wide variance in rentals depending on the desirability and rural/urban location. Properties in Penrith for example can be £200 more per month more if located in the New Streets area compared to Castletown.
On the whole when looking at the % of median income spent on private renting this is more affordable in Eden Valley North compared to other HMAs. This reflects its higher median income. There is also likely to be a greater number and variety of properties for rent in terms of quality, size, location and therefore cost. However while overall the area may have higher lower quartile incomes there is likely to be a greater number of people in this income bracket compared to other smaller HMAs requiring and competing for lower
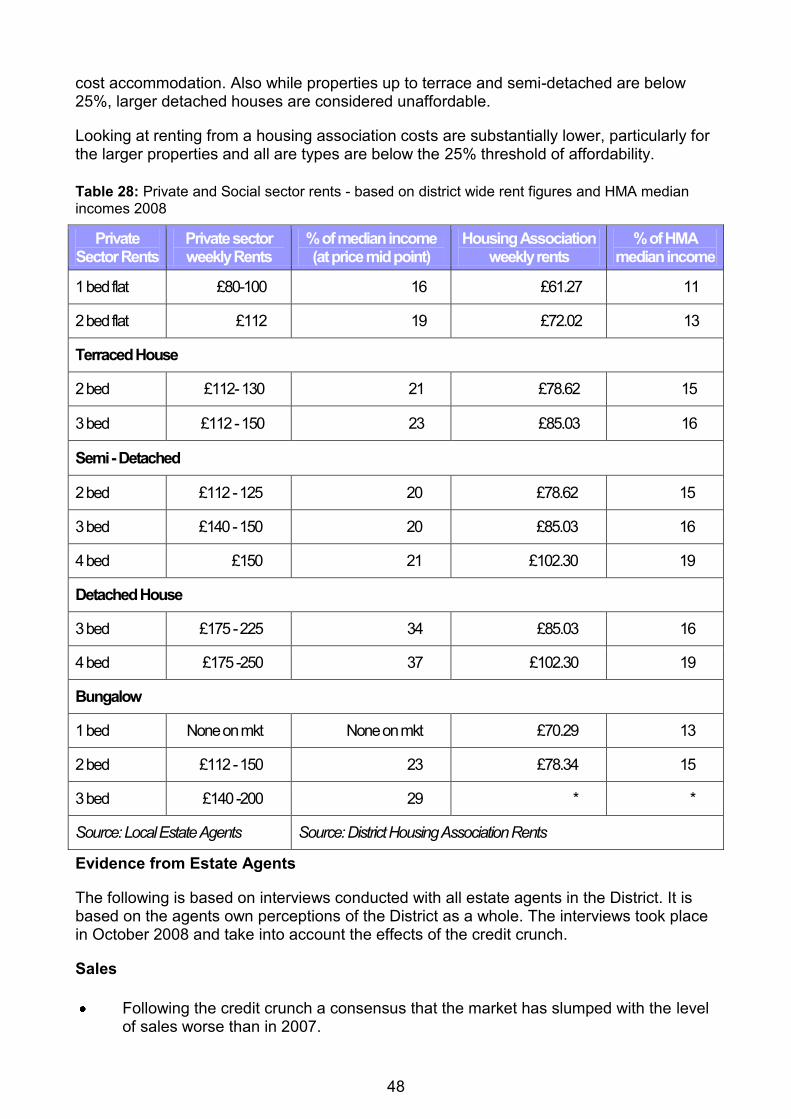
48
cost accommodation. Also while properties up to terrace and semi-detached are below 25%, larger detached houses are considered unaffordable.
Looking at renting from a housing association costs are substantially lower, particularly for the larger properties and all are types are below the 25% threshold of affordability.
Table 28: Private and Social sector rents - based on district wide rent figures and HMA median incomes 2008
Private Sector Rents
Private sector weekly Rents
% of median income (at price mid point)
Housing Association weekly rents
% of HMA median income
1 bed flat £80-100 16 £61.27 11
2 bed flat £112 19 £72.02 13
Terraced House
2 bed £112- 130 21 £78.62 15
3 bed £112 - 150 23 £85.03 16
Semi - Detached
2 bed £112 - 125 20 £78.62 15
3 bed £140 - 150 20 £85.03 16
4 bed £150 21 £102.30 19
Detached House
3 bed £175 - 225 34 £85.03 16
4 bed £175 -250 37 £102.30 19
Bungalow
1 bed None on mkt None on mkt £70.29 13
2 bed £112 - 150 23 £78.34 15
3 bed £140 -200 29 * *
Source: Local Estate Agents Source: District Housing Association Rents
Evidence from Estate Agents
The following is based on interviews conducted with all estate agents in the District. It is based on the agents own perceptions of the District as a whole. The interviews took place in October 2008 and take into account the effects of the credit crunch.
Sales
Following the credit crunch a consensus that the market has slumped with the level of sales worse than in 2007.
49
Prices have greatly reduced from the early 2000s and properties that were taking a week to sell are now taking months. Even if ideally appointed and located can still take two months or more. Less desirable properties can take up to and over two years to sell.
Some agents are optimistic that the market will pick up in the spring/summer 2009. However they also say there will be further decreases until then.
Agents report lenders are unwilling to give mortgages due to affordability, and others are willing to repossess properties faster as they are less tolerant of arrears.
There are too many large, expensive houses for sale that local people and those working here cannot afford. There is an insufficient supply of property at the lower end of the market.
Family properties with three bedrooms and a garden within reach of the town are in demand. 1-2 bed flats or 2-3 bed terraces are sought after by younger single working people. Properties with no chains are particularly popular.
Shared ownership is always in high demand.
However demand is simply dependant on what is available within people‟s price range. Modern housing is generally more popular with younger people. And holder homes with older and second home buyers.
First time buyers typically have £100k to spend.
The level of holiday home sales has started to tailor off. Second home owners are still coming mainly from the South and London. Many are willing to spend up to £500k, but recently many are looking for a „bargain‟ between £300-400k.
Town locations are the most popular. However some are forced to move away for lower priced properties.
Many people are having to look in areas where property is cheaper, eg Carlisle, and commuting each day, but generally people try to live and work in the same area. There is some commuting to Lancaster, Newcastle and Manchester.
Penrith town remains in high demand with the Beacon Edge/New Streets being the most desirable, followed by Wetheriggs, Castletown, Scaws and Town Head areas.
Popular village locations include Greystoke and Salkeld, with demand increasing closer to the Lakes National Park.
Purchasers consider schools as an important factor, which along with sports facilities, countryside, rail and motorway links are all promoted by estate agents when marketing the area.
Purchasers are generally older retirees or younger families with children. There are a few young professionals but generally they prefer locations in cities.
There are a greater number of first time buyers seeking accommodation with their partners as couples and families rather than single people seeking flats, and generally seeking at least two beds.
New developments are hindered by the price of land and build costs so that developers can‟t build what‟s really required.
Lettings
The letting market has increased rapidly over the last few months. There has been an increase in motivated sellers needing to move areas but unable to sell their property so they rent them out. One estate agent reported a ten fold increase since last year. It is now a „renters market‟.
The length of time it takes to let a property depends on its desirability - if it‟s in the right location at the right price it can let in days. However it‟s more common to take 2-4 weeks.
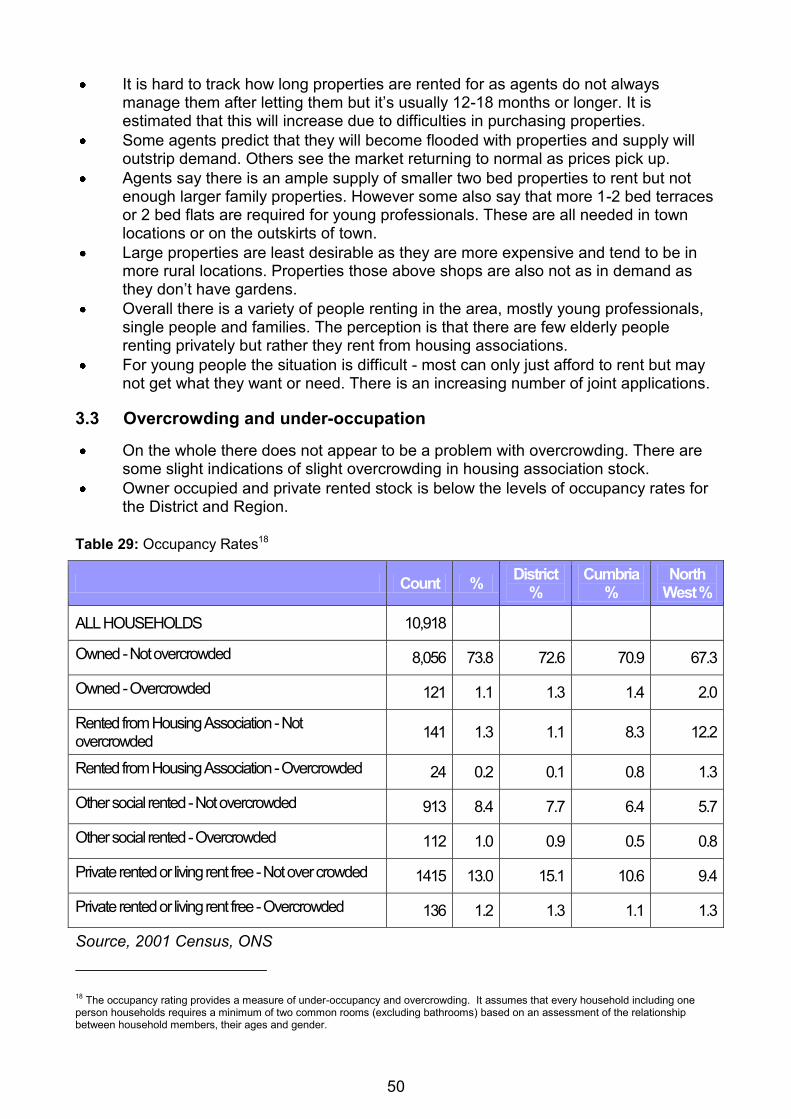
50
It is hard to track how long properties are rented for as agents do not always manage them after letting them but it‟s usually 12-18 months or longer. It is estimated that this will increase due to difficulties in purchasing properties.
Some agents predict that they will become flooded with properties and supply will outstrip demand. Others see the market returning to normal as prices pick up.
Agents say there is an ample supply of smaller two bed properties to rent but not enough larger family properties. However some also say that more 1-2 bed terraces or 2 bed flats are required for young professionals. These are all needed in town locations or on the outskirts of town.
Large properties are least desirable as they are more expensive and tend to be in more rural locations. Properties those above shops are also not as in demand as they don‟t have gardens.
Overall there is a variety of people renting in the area, mostly young professionals, single people and families. The perception is that there are few elderly people renting privately but rather they rent from housing associations.
For young people the situation is difficult - most can only just afford to rent but may not get what they want or need. There is an increasing number of joint applications.
3.3 Overcrowding and under-occupation
On the whole there does not appear to be a problem with overcrowding. There are some slight indications of slight overcrowding in housing association stock.
Owner occupied and private rented stock is below the levels of occupancy rates for the District and Region.
Table 29: Occupancy Rates18
Count % District
% Cumbria
% North
West %
ALL HOUSEHOLDS 10,918
Owned - Not overcrowded 8,056 73.8 72.6 70.9 67.3
Owned - Overcrowded 121 1.1 1.3 1.4 2.0
Rented from Housing Association - Not overcrowded
141 1.3 1.1 8.3 12.2
Rented from Housing Association - Overcrowded 24 0.2 0.1 0.8 1.3
Other social rented - Not overcrowded 913 8.4 7.7 6.4 5.7
Other social rented - Overcrowded 112 1.0 0.9 0.5 0.8
Private rented or living rent free - Not over crowded 1415 13.0 15.1 10.6 9.4
Private rented or living rent free - Overcrowded 136 1.2 1.3 1.1 1.3
Source, 2001 Census, ONS
18 The occupancy rating provides a measure of under-occupancy and overcrowding. It assumes that every household including one
person households requires a minimum of two common rooms (excluding bathrooms) based on an assessment of the relationship between household members, their ages and gender.
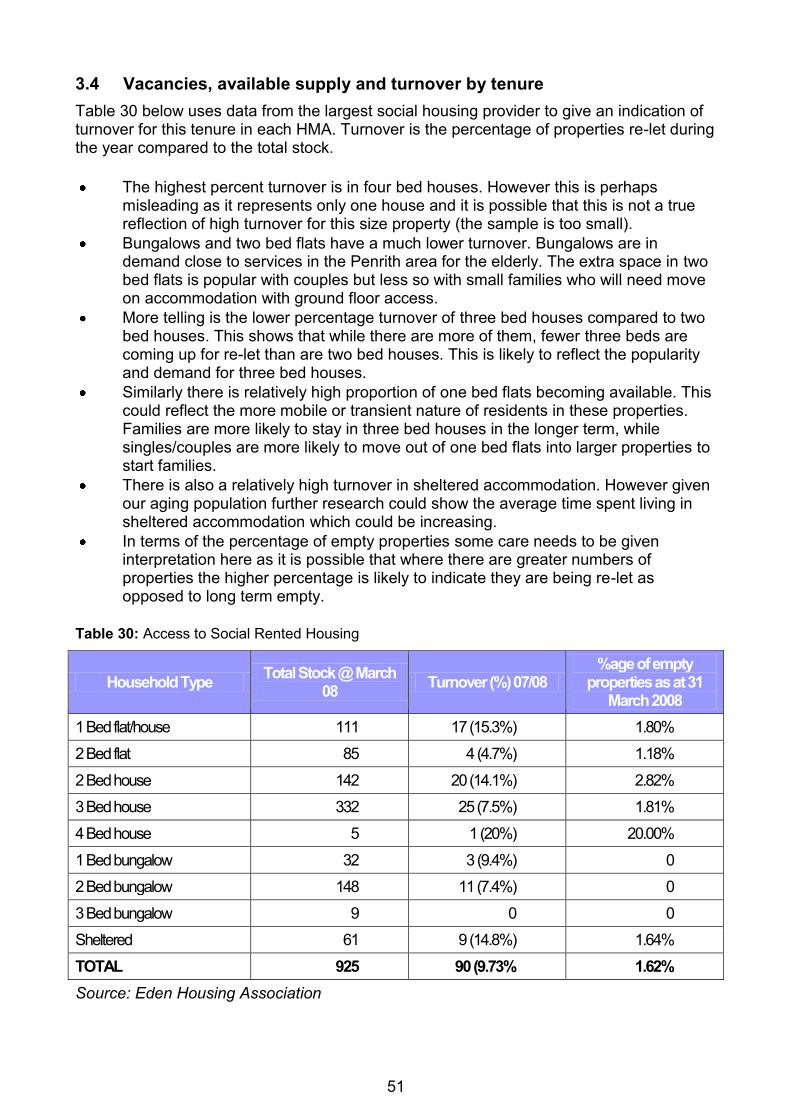
51
3.4 Vacancies, available supply and turnover by tenure
Table 30 below uses data from the largest social housing provider to give an indication of turnover for this tenure in each HMA. Turnover is the percentage of properties re-let during the year compared to the total stock.
The highest percent turnover is in four bed houses. However this is perhaps misleading as it represents only one house and it is possible that this is not a true reflection of high turnover for this size property (the sample is too small).
Bungalows and two bed flats have a much lower turnover. Bungalows are in demand close to services in the Penrith area for the elderly. The extra space in two bed flats is popular with couples but less so with small families who will need move on accommodation with ground floor access.
More telling is the lower percentage turnover of three bed houses compared to two bed houses. This shows that while there are more of them, fewer three beds are coming up for re-let than are two bed houses. This is likely to reflect the popularity and demand for three bed houses.
Similarly there is relatively high proportion of one bed flats becoming available. This could reflect the more mobile or transient nature of residents in these properties. Families are more likely to stay in three bed houses in the longer term, while singles/couples are more likely to move out of one bed flats into larger properties to start families.
There is also a relatively high turnover in sheltered accommodation. However given our aging population further research could show the average time spent living in sheltered accommodation which could be increasing.
In terms of the percentage of empty properties some care needs to be given interpretation here as it is possible that where there are greater numbers of properties the higher percentage is likely to indicate they are being re-let as opposed to long term empty.
Table 30: Access to Social Rented Housing
Household Type Total Stock @ March
08 Turnover (%) 07/08
%age of empty properties as at 31
March 2008
1 Bed flat/house 111 17 (15.3%) 1.80%
2 Bed flat 85 4 (4.7%) 1.18%
2 Bed house 142 20 (14.1%) 2.82%
3 Bed house 332 25 (7.5%) 1.81%
4 Bed house 5 1 (20%) 20.00%
1 Bed bungalow 32 3 (9.4%) 0
2 Bed bungalow 148 11 (7.4%) 0
3 Bed bungalow 9 0 0
Sheltered 61 9 (14.8%) 1.64%
TOTAL 925 90 (9.73% 1.62%
Source: Eden Housing Association
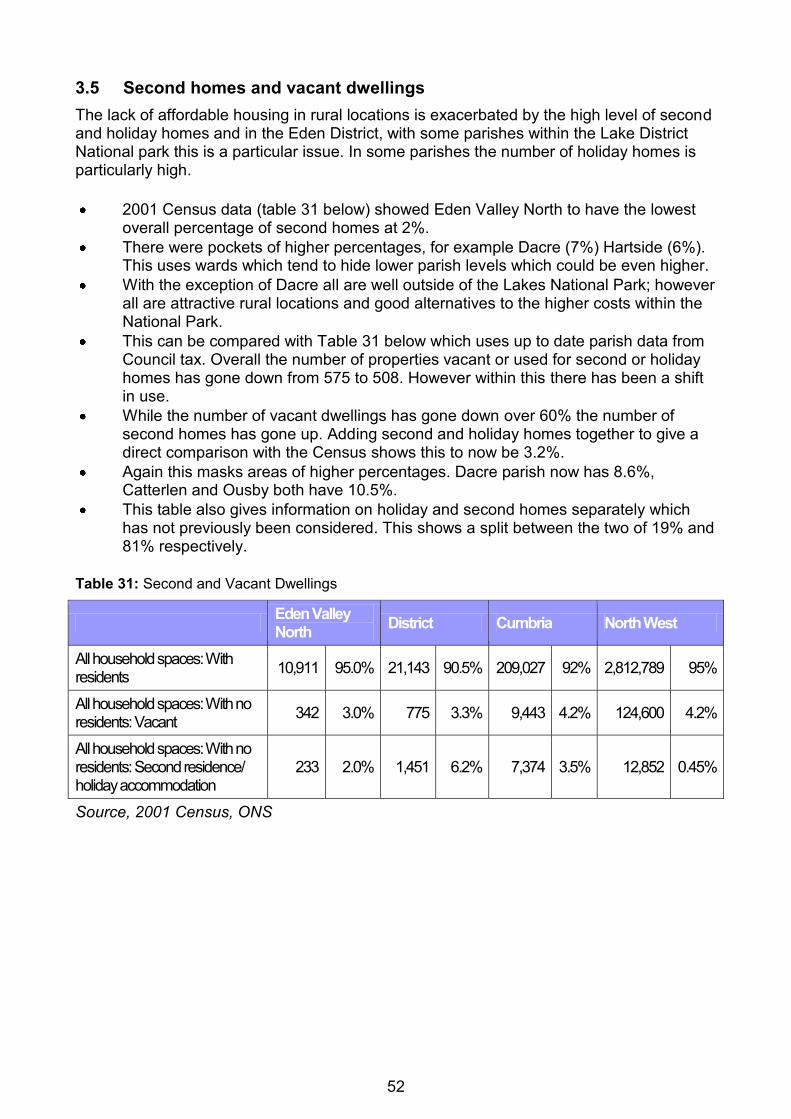
52
3.5 Second homes and vacant dwellings
The lack of affordable housing in rural locations is exacerbated by the high level of second and holiday homes and in the Eden District, with some parishes within the Lake District National park this is a particular issue. In some parishes the number of holiday homes is particularly high.
2001 Census data (table 31 below) showed Eden Valley North to have the lowest overall percentage of second homes at 2%.
There were pockets of higher percentages, for example Dacre (7%) Hartside (6%). This uses wards which tend to hide lower parish levels which could be even higher.
With the exception of Dacre all are well outside of the Lakes National Park; however all are attractive rural locations and good alternatives to the higher costs within the National Park.
This can be compared with Table 31 below which uses up to date parish data from Council tax. Overall the number of properties vacant or used for second or holiday homes has gone down from 575 to 508. However within this there has been a shift in use.
While the number of vacant dwellings has gone down over 60% the number of second homes has gone up. Adding second and holiday homes together to give a direct comparison with the Census shows this to now be 3.2%.
Again this masks areas of higher percentages. Dacre parish now has 8.6%, Catterlen and Ousby both have 10.5%.
This table also gives information on holiday and second homes separately which has not previously been considered. This shows a split between the two of 19% and 81% respectively.
Table 31: Second and Vacant Dwellings
Eden Valley North
District Cumbria North West
All household spaces: With residents
10,911 95.0% 21,143 90.5% 209,027 92% 2,812,789 95%
All household spaces: With no residents: Vacant
342 3.0% 775 3.3% 9,443 4.2% 124,600 4.2%
All household spaces: With no residents: Second residence/ holiday accommodation
233 2.0% 1,451 6.2% 7,374 3.5% 12,852 0.45%
Source, 2001 Census, ONS
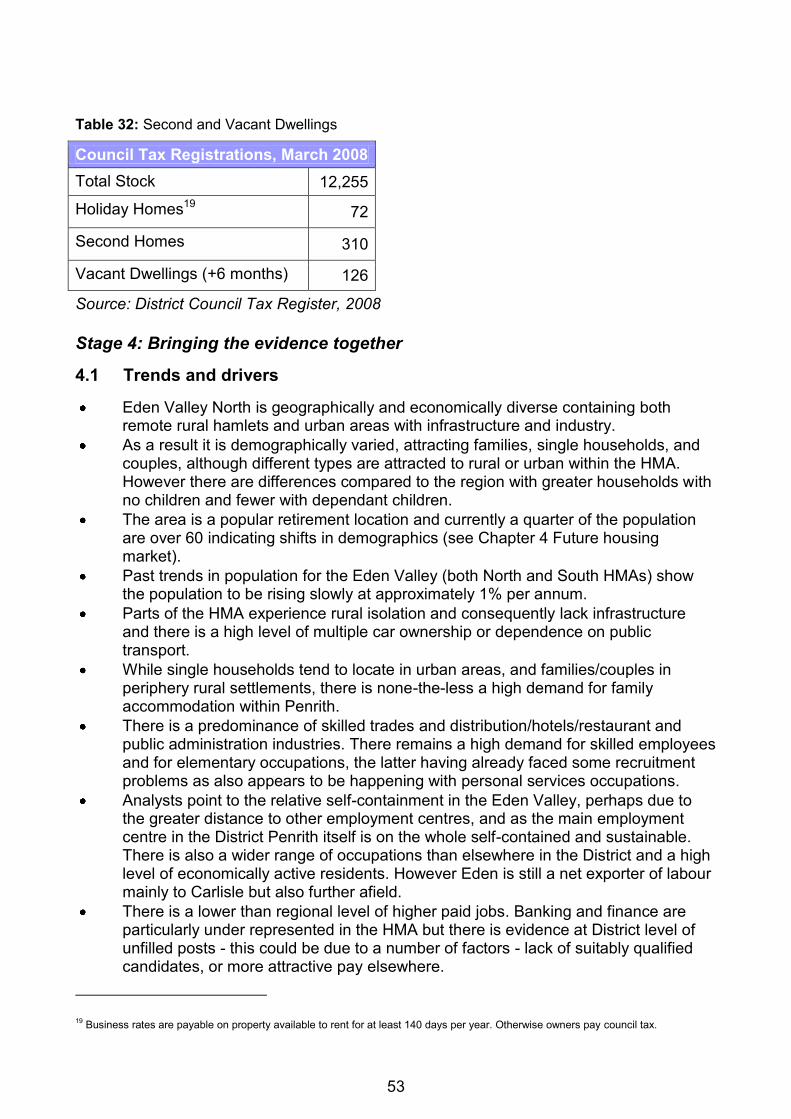
53
Table 32: Second and Vacant Dwellings
Council Tax Registrations, March 2008
Total Stock 12,255
Holiday Homes19 72
Second Homes 310
Vacant Dwellings (+6 months) 126
Source: District Council Tax Register, 2008
Stage 4: Bringing the evidence together
4.1 Trends and drivers
Eden Valley North is geographically and economically diverse containing both remote rural hamlets and urban areas with infrastructure and industry.
As a result it is demographically varied, attracting families, single households, and couples, although different types are attracted to rural or urban within the HMA. However there are differences compared to the region with greater households with no children and fewer with dependant children.
The area is a popular retirement location and currently a quarter of the population are over 60 indicating shifts in demographics (see Chapter 4 Future housing market).
Past trends in population for the Eden Valley (both North and South HMAs) show the population to be rising slowly at approximately 1% per annum.
Parts of the HMA experience rural isolation and consequently lack infrastructure and there is a high level of multiple car ownership or dependence on public transport.
While single households tend to locate in urban areas, and families/couples in periphery rural settlements, there is none-the-less a high demand for family accommodation within Penrith.
There is a predominance of skilled trades and distribution/hotels/restaurant and public administration industries. There remains a high demand for skilled employees and for elementary occupations, the latter having already faced some recruitment problems as also appears to be happening with personal services occupations.
Analysts point to the relative self-containment in the Eden Valley, perhaps due to the greater distance to other employment centres, and as the main employment centre in the District Penrith itself is on the whole self-contained and sustainable. There is also a wider range of occupations than elsewhere in the District and a high level of economically active residents. However Eden is still a net exporter of labour mainly to Carlisle but also further afield.
There is a lower than regional level of higher paid jobs. Banking and finance are particularly under represented in the HMA but there is evidence at District level of unfilled posts - this could be due to a number of factors - lack of suitably qualified candidates, or more attractive pay elsewhere.
19 Business rates are payable on property available to rent for at least 140 days per year. Otherwise owners pay council tax.
54
There is some evidence of the HMA catching up in terms of the increase in people employed in higher level jobs and incomes have improved. However there is also evidence that some in the higher paid professions are commuting out of the District (mainly Carlisle, but also Newcastle and Lancaster) and the increase could be due to a willingness to commute for higher pay.
On the whole the area is not deprived but there are pockets of deprivation, notably Penrith South, East and Pategill wards. Furthermore within the indices the HMA scores highly on the „barriers to housing and services‟ domain.
The greatest concentration of one bed accommodation is in Penrith which also contains the majority of the Districts communal houses. However overall the HMA has a higher proportion of detached properties compared to the County and Region.
There is a concentration of social housing in Penrith and to a lesser extent pockets within the rural periphery.
Existing stock suffers from poor thermal insulation, particularly those in rural locations.
Housing affordability is a long standing issue for the HMA despite being relatively cheaper than other areas. Income levels indicate the area is slightly more affluent than elsewhere in the District and Cumbria. However affordability ratios are double the Government guidelines and there are likely to be more people within the lower quartile band for this HMA than elsewhere in the District simply because of the larger population.
Cost and growth levels indicate the area is maintaining its strong demand. Renting is often the only option and again is relatively cheaper than other HMAs, although this is still a high proportion of income and larger detached properties are not affordable.
The current „credit crunch‟ appears to have slowed the market down and reduced prices to some extent where owners have to sell. However even with reductions prices are unaffordable. Furthermore those who can do so are tending sit on the current property and wait it out, which also means those in private rent or smaller homes cannot move up.
4.2 Issues for future policy/strategy
The HMA has a skilled workforce but in poorly paid jobs, and also professional people who can afford to live here but choose to commute to work. Historically this has driven the demand for family accommodation which outstrips supply and this has fuelled price increases.
The implication is that to some extent the well qualified workforce already exists and lives within the District. Housing supply should be directed at bottom rung affordable housing to support people in lower level jobs but also starter homes and move up accommodation for the population currently living here, employed here, but trapped on the bottom rung of the housing ladder.
Economic development centres on improving the range of local jobs and encourage higher level employers into the area. This may encourage people who already live here to also work here, improving the areas economic base and also reducing out-commuting.
More affordable rent/low cost home ownership in villages is required to prevent younger generations moving away.
Affordable rental and starter homes are required to retain younger people and support families. Coupled with economic measures this would encourage people to both live and work here.

55
Discussion and planning needs to take place with housing providers regarding accommodation for the elderly.
56
4. The Future Housing Market
This chapter estimates the total number of new dwellings that may be required in the future in response to various scenarios reflecting the scale of housing demand. The scenarios have been generated using POPGROUP, a forecasting tool supplied by the University of Manchester. The analysis is only available down to a district level.
The analysis has four stages:
Stage 1: Projecting changes in population and future numbers of households
Stage 2: Future economic performance
Stage 3: Future affordability
Stage 4: Bringing the evidence together
Stage 1: Projecting changes in future numbers of households
This stage gives projections of population, households and dwellings at a district level. POPGROUP population forecasting software has been used to create all the scenario‟s contained in both this section (population led and dwelling led) and also section 4.4 (labour force led). All these scenarios contain estimates of local information to provide likely scenario‟s for growth into the future. Like all population forecasting outputs, the results are simply a representation of what might happen in the future if various trends are played out as we expect. As a result, they cannot be relied upon as fact, and actual results may end up being significantly different to what the scenarios suggest will happen. This should be kept in mind at all times when using the outputs, and caution should be used when incorporating the outputs into any decision making process.
Three types of scenario have been generated for this document:
1. Population Led Scenarios
2. Dwelling Led Scenarios
3. Labour Force Led Scenarios
Within each table below, population, households and dwellings are shown as the level they would be in that particular year (shown in 5 year bands). However the net migration (in migration minus out migration) and net change (births minus deaths plus migration) is shown for the previous 5 years. For example, net migration shown under 2011 is the total net migration experienced over the 5 years 2006-2010. Annualised dwelling figures are shown in the same way, so the annualised dwelling figure shown under 2011 is the annual requirement for each of the years 2006-2010. Finally, an average annualised dwelling requirement has been supplied which shows the average number of dwellings required per year across the full time period 2006-2031.
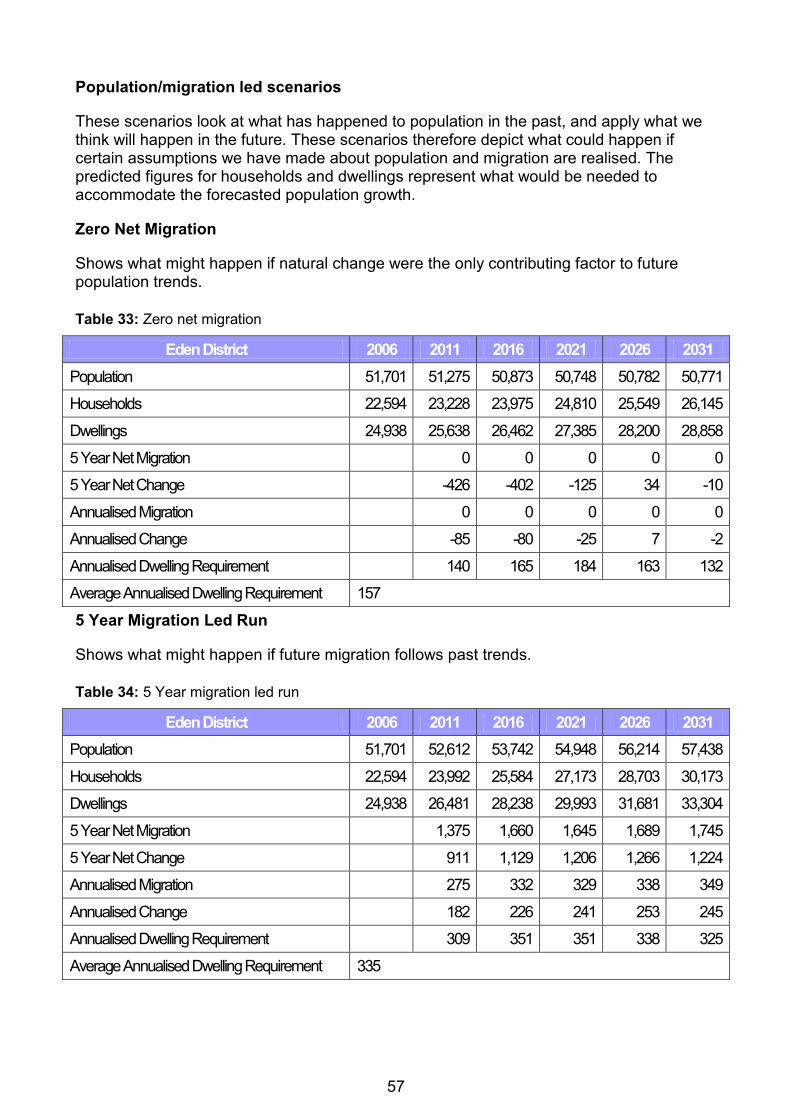
57
Population/migration led scenarios
These scenarios look at what has happened to population in the past, and apply what we think will happen in the future. These scenarios therefore depict what could happen if certain assumptions we have made about population and migration are realised. The predicted figures for households and dwellings represent what would be needed to accommodate the forecasted population growth.
Zero Net Migration
Shows what might happen if natural change were the only contributing factor to future population trends.
Table 33: Zero net migration
Eden District 2006 2011 2016 2021 2026 2031
Population 51,701 51,275 50,873 50,748 50,782 50,771
Households 22,594 23,228 23,975 24,810 25,549 26,145
Dwellings 24,938 25,638 26,462 27,385 28,200 28,858
5 Year Net Migration 0 0 0 0 0
5 Year Net Change -426 -402 -125 34 -10
Annualised Migration 0 0 0 0 0
Annualised Change -85 -80 -25 7 -2
Annualised Dwelling Requirement 140 165 184 163 132
Average Annualised Dwelling Requirement 157
5 Year Migration Led Run
Shows what might happen if future migration follows past trends.
Table 34: 5 Year migration led run
Eden District 2006 2011 2016 2021 2026 2031
Population 51,701 52,612 53,742 54,948 56,214 57,438
Households 22,594 23,992 25,584 27,173 28,703 30,173
Dwellings 24,938 26,481 28,238 29,993 31,681 33,304
5 Year Net Migration 1,375 1,660 1,645 1,689 1,745
5 Year Net Change 911 1,129 1,206 1,266 1,224
Annualised Migration 275 332 329 338 349
Annualised Change 182 226 241 253 245
Annualised Dwelling Requirement 309 351 351 338 325
Average Annualised Dwelling Requirement 335
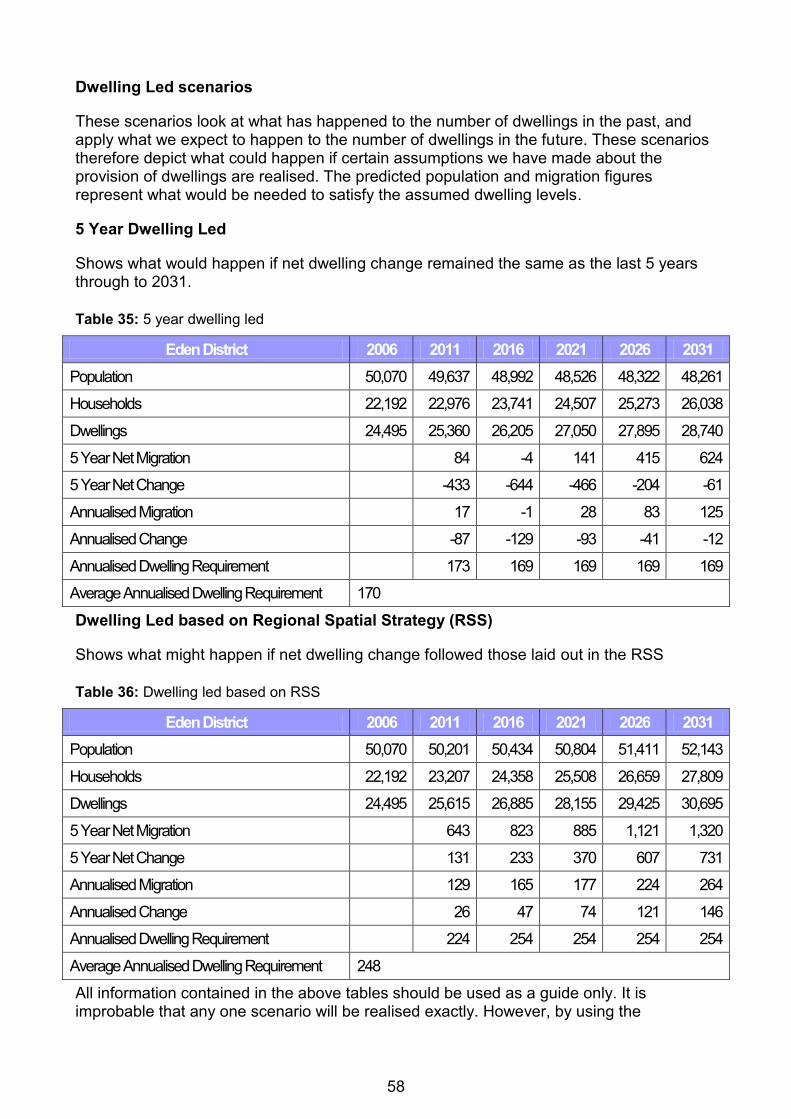
58
Dwelling Led scenarios
These scenarios look at what has happened to the number of dwellings in the past, and apply what we expect to happen to the number of dwellings in the future. These scenarios therefore depict what could happen if certain assumptions we have made about the provision of dwellings are realised. The predicted population and migration figures represent what would be needed to satisfy the assumed dwelling levels.
5 Year Dwelling Led
Shows what would happen if net dwelling change remained the same as the last 5 years through to 2031.
Table 35: 5 year dwelling led
Eden District 2006 2011 2016 2021 2026 2031
Population 50,070 49,637 48,992 48,526 48,322 48,261
Households 22,192 22,976 23,741 24,507 25,273 26,038
Dwellings 24,495 25,360 26,205 27,050 27,895 28,740
5 Year Net Migration 84 -4 141 415 624
5 Year Net Change -433 -644 -466 -204 -61
Annualised Migration 17 -1 28 83 125
Annualised Change -87 -129 -93 -41 -12
Annualised Dwelling Requirement 173 169 169 169 169
Average Annualised Dwelling Requirement 170
Dwelling Led based on Regional Spatial Strategy (RSS)
Shows what might happen if net dwelling change followed those laid out in the RSS
Table 36: Dwelling led based on RSS
Eden District 2006 2011 2016 2021 2026 2031
Population 50,070 50,201 50,434 50,804 51,411 52,143
Households 22,192 23,207 24,358 25,508 26,659 27,809
Dwellings 24,495 25,615 26,885 28,155 29,425 30,695
5 Year Net Migration 643 823 885 1,121 1,320
5 Year Net Change 131 233 370 607 731
Annualised Migration 129 165 177 224 264
Annualised Change 26 47 74 121 146
Annualised Dwelling Requirement 224 254 254 254 254
Average Annualised Dwelling Requirement 248
All information contained in the above tables should be used as a guide only. It is improbable that any one scenario will be realised exactly. However, by using the
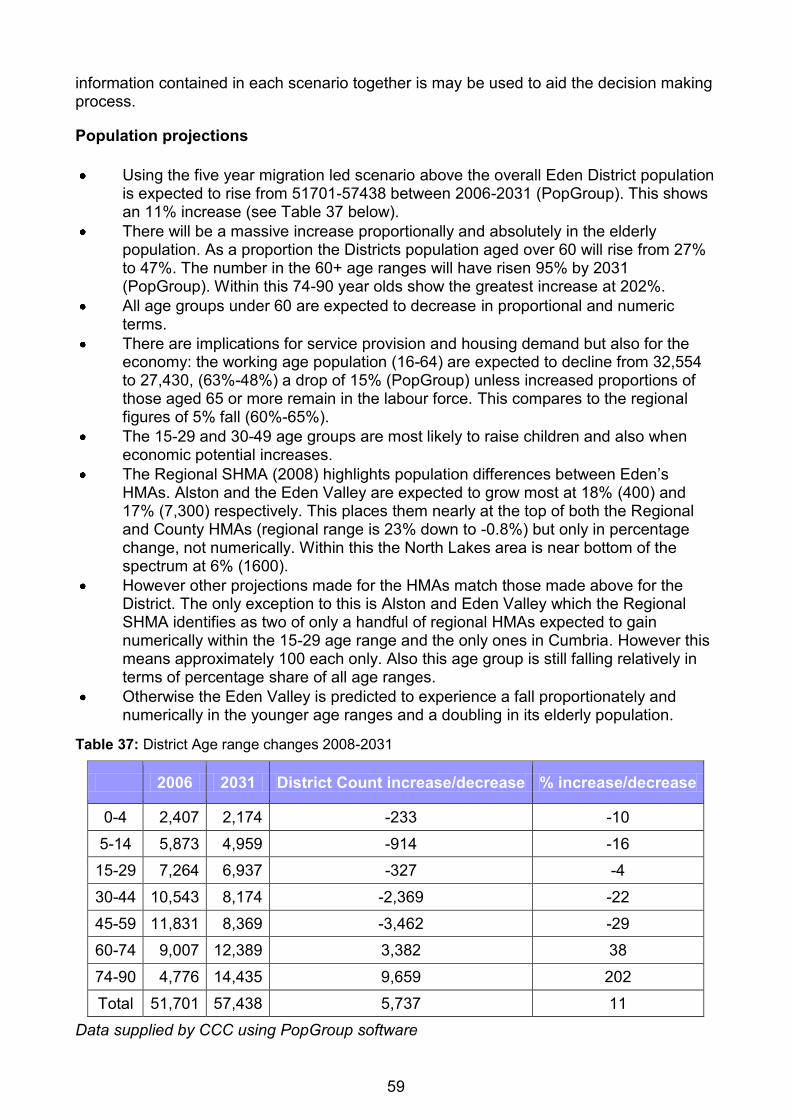
59
information contained in each scenario together is may be used to aid the decision making process.
Population projections
Using the five year migration led scenario above the overall Eden District population is expected to rise from 51701-57438 between 2006-2031 (PopGroup). This shows an 11% increase (see Table 37 below).
There will be a massive increase proportionally and absolutely in the elderly population. As a proportion the Districts population aged over 60 will rise from 27% to 47%. The number in the 60+ age ranges will have risen 95% by 2031 (PopGroup). Within this 74-90 year olds show the greatest increase at 202%.
All age groups under 60 are expected to decrease in proportional and numeric terms.
There are implications for service provision and housing demand but also for the economy: the working age population (16-64) are expected to decline from 32,554 to 27,430, (63%-48%) a drop of 15% (PopGroup) unless increased proportions of those aged 65 or more remain in the labour force. This compares to the regional figures of 5% fall (60%-65%).
The 15-29 and 30-49 age groups are most likely to raise children and also when economic potential increases.
The Regional SHMA (2008) highlights population differences between Eden‟s HMAs. Alston and the Eden Valley are expected to grow most at 18% (400) and 17% (7,300) respectively. This places them nearly at the top of both the Regional and County HMAs (regional range is 23% down to -0.8%) but only in percentage change, not numerically. Within this the North Lakes area is near bottom of the spectrum at 6% (1600).
However other projections made for the HMAs match those made above for the District. The only exception to this is Alston and Eden Valley which the Regional SHMA identifies as two of only a handful of regional HMAs expected to gain numerically within the 15-29 age range and the only ones in Cumbria. However this means approximately 100 each only. Also this age group is still falling relatively in terms of percentage share of all age ranges.
Otherwise the Eden Valley is predicted to experience a fall proportionately and numerically in the younger age ranges and a doubling in its elderly population.
Table 37: District Age range changes 2008-2031
2006 2031 District Count increase/decrease % increase/decrease
0-4 2,407 2,174 -233 -10
5-14 5,873 4,959 -914 -16
15-29 7,264 6,937 -327 -4
30-44 10,543 8,174 -2,369 -22
45-59 11,831 8,369 -3,462 -29
60-74 9,007 12,389 3,382 38
74-90 4,776 14,435 9,659 202
Total 51,701 57,438 5,737 11
Data supplied by CCC using PopGroup software
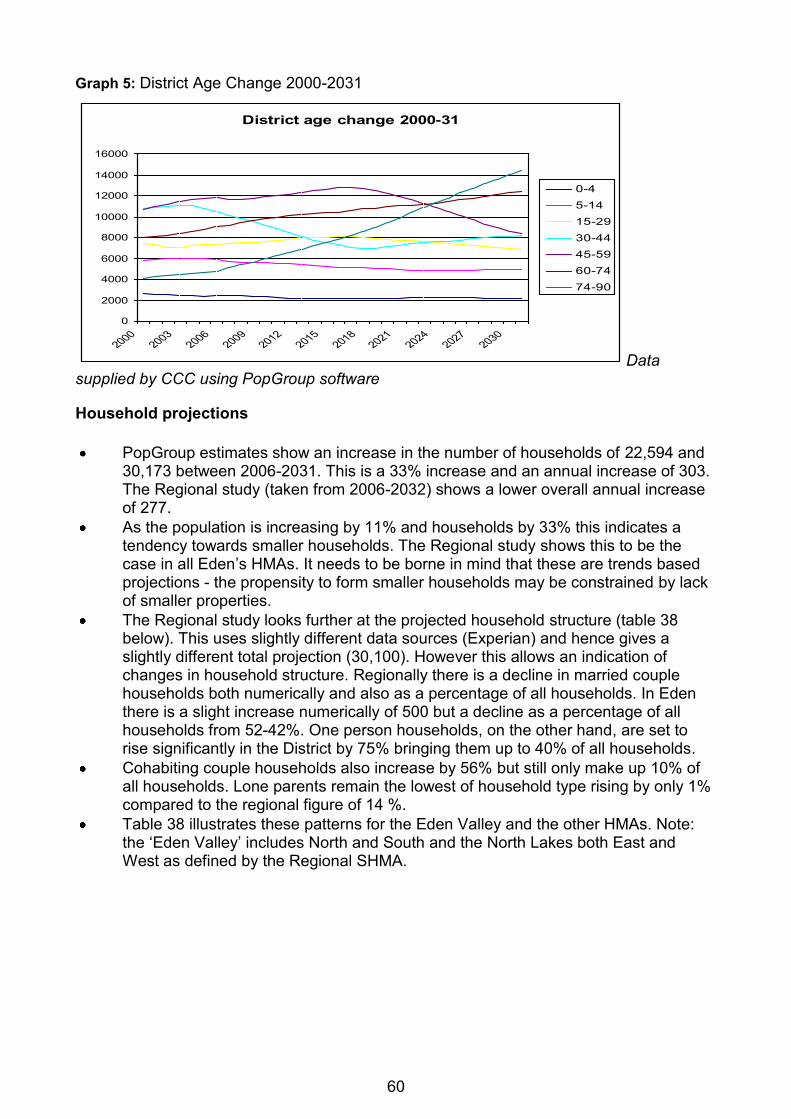
60
Graph 5: District Age Change 2000-2031
District age change 2000-31
0
2000
4000
6000
8000
10000
12000
14000
16000
20002003
20062009
20122015
20182021
20242027
2030
0-4
5-14
15-29
30-44
45-59
60-74
74-90
Data supplied by CCC using PopGroup software
Household projections
PopGroup estimates show an increase in the number of households of 22,594 and 30,173 between 2006-2031. This is a 33% increase and an annual increase of 303. The Regional study (taken from 2006-2032) shows a lower overall annual increase of 277.
As the population is increasing by 11% and households by 33% this indicates a tendency towards smaller households. The Regional study shows this to be the case in all Eden‟s HMAs. It needs to be borne in mind that these are trends based projections - the propensity to form smaller households may be constrained by lack of smaller properties.
The Regional study looks further at the projected household structure (table 38 below). This uses slightly different data sources (Experian) and hence gives a slightly different total projection (30,100). However this allows an indication of changes in household structure. Regionally there is a decline in married couple households both numerically and also as a percentage of all households. In Eden there is a slight increase numerically of 500 but a decline as a percentage of all households from 52-42%. One person households, on the other hand, are set to rise significantly in the District by 75% bringing them up to 40% of all households.
Cohabiting couple households also increase by 56% but still only make up 10% of all households. Lone parents remain the lowest of household type rising by only 1% compared to the regional figure of 14 %.
Table 38 illustrates these patterns for the Eden Valley and the other HMAs. Note: the „Eden Valley‟ includes North and South and the North Lakes both East and West as defined by the Regional SHMA.
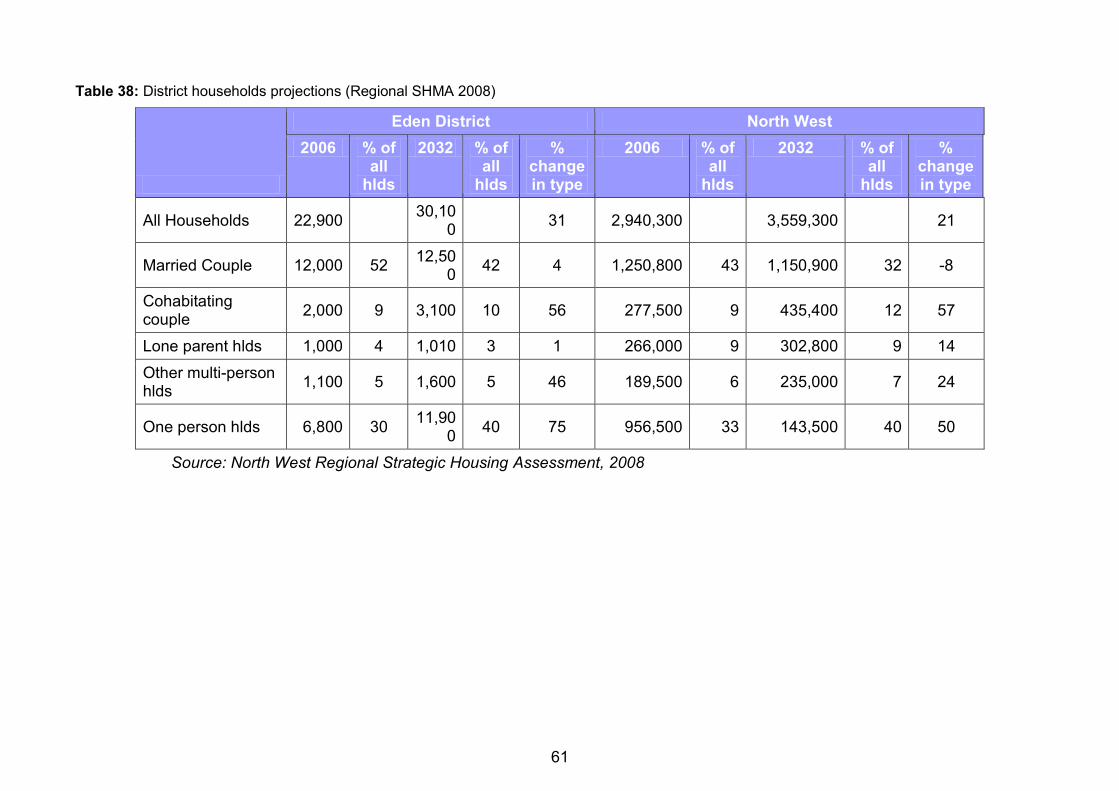
61
Table 38: District households projections (Regional SHMA 2008)
Eden District North West
2006 % of all
hlds
2032 % of all
hlds
% change in type
2006 % of all
hlds
2032 % of all
hlds
% change in type
All Households 22,900 30,10
0 31 2,940,300 3,559,300 21
Married Couple 12,000 52 12,50
0 42 4 1,250,800 43 1,150,900 32 -8
Cohabitating couple
2,000 9 3,100 10 56 277,500 9 435,400 12 57
Lone parent hlds 1,000 4 1,010 3 1 266,000 9 302,800 9 14
Other multi-person hlds
1,100 5 1,600 5 46 189,500 6 235,000 7 24
One person hlds 6,800 30 11,90
0 40 75 956,500 33 143,500 40 50
Source: North West Regional Strategic Housing Assessment, 2008
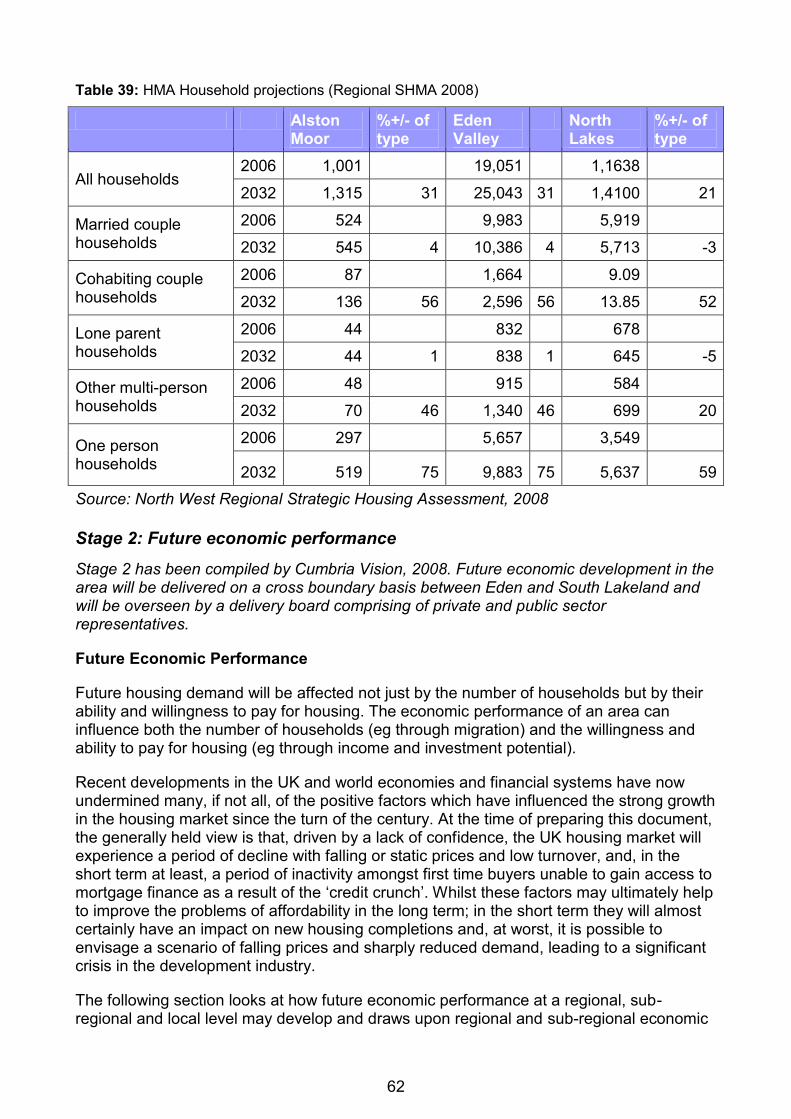
62
Table 39: HMA Household projections (Regional SHMA 2008)
Alston Moor
%+/- of type
Eden Valley
North Lakes
%+/- of type
All households 2006 1,001 19,051 1,1638
2032 1,315 31 25,043 31 1,4100 21
Married couple households
2006 524 9,983 5,919
2032 545 4 10,386 4 5,713 -3
Cohabiting couple households
2006 87 1,664 9.09
2032 136 56 2,596 56 13.85 52
Lone parent households
2006 44 832 678
2032 44 1 838 1 645 -5
Other multi-person households
2006 48 915 584
2032 70 46 1,340 46 699 20
One person households
2006 297 5,657 3,549
2032 519 75 9,883 75 5,637 59
Source: North West Regional Strategic Housing Assessment, 2008
Stage 2: Future economic performance
Stage 2 has been compiled by Cumbria Vision, 2008. Future economic development in the area will be delivered on a cross boundary basis between Eden and South Lakeland and will be overseen by a delivery board comprising of private and public sector representatives.
Future Economic Performance
Future housing demand will be affected not just by the number of households but by their ability and willingness to pay for housing. The economic performance of an area can influence both the number of households (eg through migration) and the willingness and ability to pay for housing (eg through income and investment potential).
Recent developments in the UK and world economies and financial systems have now undermined many, if not all, of the positive factors which have influenced the strong growth in the housing market since the turn of the century. At the time of preparing this document, the generally held view is that, driven by a lack of confidence, the UK housing market will experience a period of decline with falling or static prices and low turnover, and, in the short term at least, a period of inactivity amongst first time buyers unable to gain access to mortgage finance as a result of the „credit crunch‟. Whilst these factors may ultimately help to improve the problems of affordability in the long term; in the short term they will almost certainly have an impact on new housing completions and, at worst, it is possible to envisage a scenario of falling prices and sharply reduced demand, leading to a significant crisis in the development industry.
The following section looks at how future economic performance at a regional, sub-regional and local level may develop and draws upon regional and sub-regional economic
63
forecasts to help show how future housing demand may be influenced by economic performance.
Regional Economic Outlook
According to the Spring 2008 report from the Northwest Regional Economic Forecasting Panel, GVA is expected to grow more slowly in the North West than nationally by an average of some 0.4 percentage points a year. Thus, if growth in the UK turns out to average 2.7% a year as predicted, the North West should average 2.3% which is still substantially better than GVA growth of 1.8% achieved per annum on average in the region in the 1990s (mainly because the region‟s population and working age population are expected to grow rather than fall, as they did then). GVA per resident head is expected to grow on average over the next twenty years by 1.6 percent a year, as compared with 1.9 percent in the UK. As a result, the gap in the level of GVA per head in the region, which presently stands at around 13.5 percent lower than in the UK, is likely to widen further.
Gross Value Added (GVA) growth in construction is estimated to have picked up in 2007 to 2.1%, but in 2008 growth is expected to weaken to 1.5%. GVA in construction is then expected to fall in 2009 before recovering in 2010 and 2011.
Cumbrian Economic Outlook to 2016
In conjunction with the North West Regional Development Agency, Cumbria Vision has undertaken a process of economic modelling to determine how the economy of Cumbria may grow during the period to 2016. Using a forecasting model developed by Experian, three scenarios have been developed.
1. The first scenario takes a purely econometric approach to modelling and projects the future based on historic trends and assumes a „policy-off‟ response. As such, this scenario forecasts a relatively low level of growth. This scenario has been developed by Experian in consultation with regional and sub-regional partners and is held within the Experian forecasting model as the “baseline” scenario.
2. The second scenario includes employment growth assumptions based on local knowledge of committed, proposed and potential future developments and programmes. As such the second scenario paints a more positive picture being responsive to local policies and ambitions and forms the “aspirational” scenario. This scenario has been developed within the sub-region and through consultation with regional partners.
3. The third scenario attempts to estimate the potential effects of the national and global economic downturn on the Cumbrian economy. A particularly pessimistic view has been taken when devising the assumptions underlining this forecast in an attempt to create a “worst case” scenario. This scenario has been developed with the sub-region.
These three scenarios illustrate how Cumbria‟s economy may develop over the coming years provided certain conditions are met. In each case the forecast is employment led with each new employment opportunity being filled by a new member to the workforce, in other words the employment growth figures represent net job gains. However it is not possible to accurately determine what proportion of this employment growth represents true incomers to the county that will be requiring homes and what proportion is filled by, for
64
example, a return to employment amongst the indigenous workless population or how much is attributable to the 60-70 age groups remaining in employment for longer. In the case of the latter example, current indications such as a declining working age population and recent falls in the value of pension funds suggest that this factor may be particularly acute in the coming years.
It is worth adding a caveat here. Econometric modelling is inherently based upon the observation of past events and the extrapolation of baseline trends from the past into the future. As such, any forecasting model relies upon an accurate baseline from which any scenarios manually inputted by a user subsequently depart. However, due to the fact that the baseline data contained within forecasting models generally lags behind the present by six months to a year, it is extremely difficult in times such as these where economic conditions are changing on a weekly basis, to be completely confident in the validity of the scenario outputs. Unfortunately no systems yet exist which can accurately predict external shocks to the economy and as such the results of this, and indeed any, scenario modelling, should be treated with an element of caution. This is true at any time, but the issue is particularly acute at the moment due to the degree of instability in current macroeconomic conditions.
The forecasts provided below must, therefore, be taken with this same element of caution as they are posited upon baseline trends which do not yet take into account the downturn in the UK (and World) economy which began to emerge in 2008 and which is predicted to last well into 2010 or beyond. Within the scenarios a certain amount of artistic license has therefore been taken in an attempt to estimate, on the one hand, the possible outputs of an aspirational vision for employment growth in Cumbria and, on the other hand, the potential effects of the downturn on the economy of Cumbria if the worst were to happen. It must be stressed however that the scenarios have been formed from assumptions based on the collective judgment of a number of individuals and that any semblance to events as they subsequently unfold owes only to the experience of the group of individuals involved in the design of the scenarios.
Employment Growth Forecast:
The table below shows how total employment and the numbers of full time equivalents (FTEs) may grow over a ten year period from an initial position in 2006 to 2016.
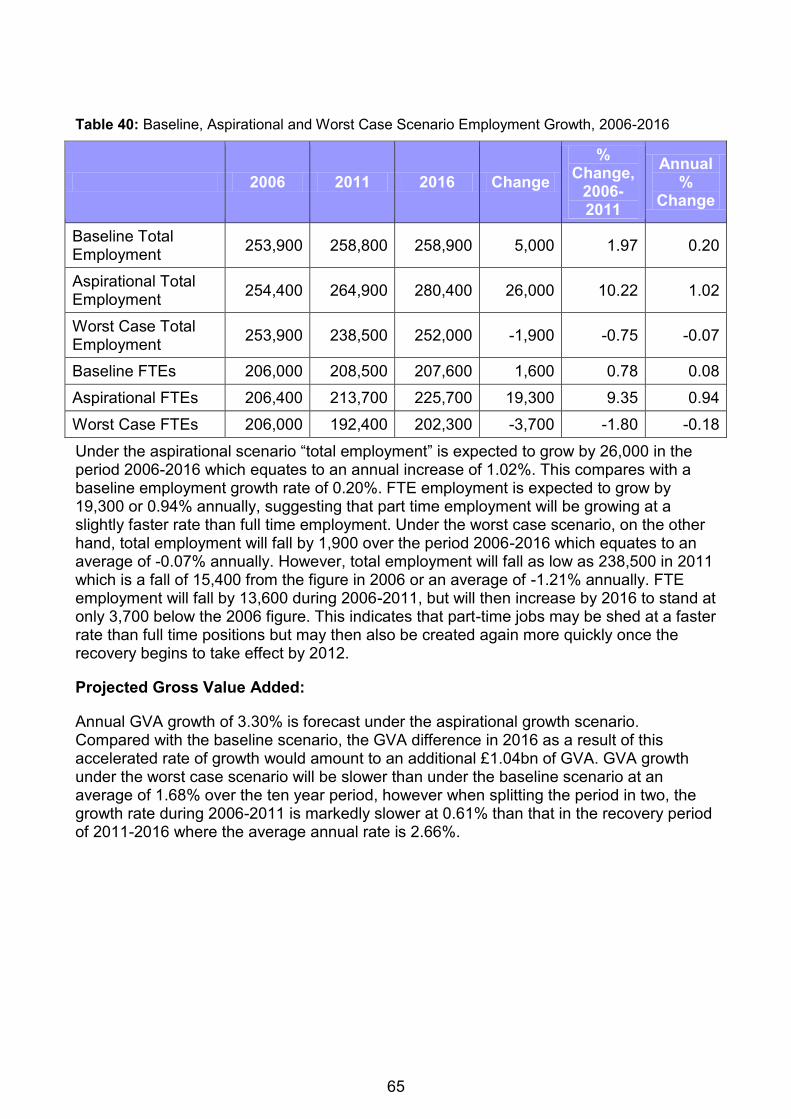
65
Table 40: Baseline, Aspirational and Worst Case Scenario Employment Growth, 2006-2016
2006 2011 2016 Change
% Change,
2006-2011
Annual %
Change
Baseline Total Employment
253,900 258,800 258,900 5,000 1.97 0.20
Aspirational Total Employment
254,400 264,900 280,400 26,000 10.22 1.02
Worst Case Total Employment
253,900 238,500 252,000 -1,900 -0.75 -0.07
Baseline FTEs 206,000 208,500 207,600 1,600 0.78 0.08
Aspirational FTEs 206,400 213,700 225,700 19,300 9.35 0.94
Worst Case FTEs 206,000 192,400 202,300 -3,700 -1.80 -0.18
Under the aspirational scenario “total employment” is expected to grow by 26,000 in the period 2006-2016 which equates to an annual increase of 1.02%. This compares with a baseline employment growth rate of 0.20%. FTE employment is expected to grow by 19,300 or 0.94% annually, suggesting that part time employment will be growing at a slightly faster rate than full time employment. Under the worst case scenario, on the other hand, total employment will fall by 1,900 over the period 2006-2016 which equates to an average of -0.07% annually. However, total employment will fall as low as 238,500 in 2011 which is a fall of 15,400 from the figure in 2006 or an average of -1.21% annually. FTE employment will fall by 13,600 during 2006-2011, but will then increase by 2016 to stand at only 3,700 below the 2006 figure. This indicates that part-time jobs may be shed at a faster rate than full time positions but may then also be created again more quickly once the recovery begins to take effect by 2012.
Projected Gross Value Added:
Annual GVA growth of 3.30% is forecast under the aspirational growth scenario. Compared with the baseline scenario, the GVA difference in 2016 as a result of this accelerated rate of growth would amount to an additional £1.04bn of GVA. GVA growth under the worst case scenario will be slower than under the baseline scenario at an average of 1.68% over the ten year period, however when splitting the period in two, the growth rate during 2006-2011 is markedly slower at 0.61% than that in the recovery period of 2011-2016 where the average annual rate is 2.66%.
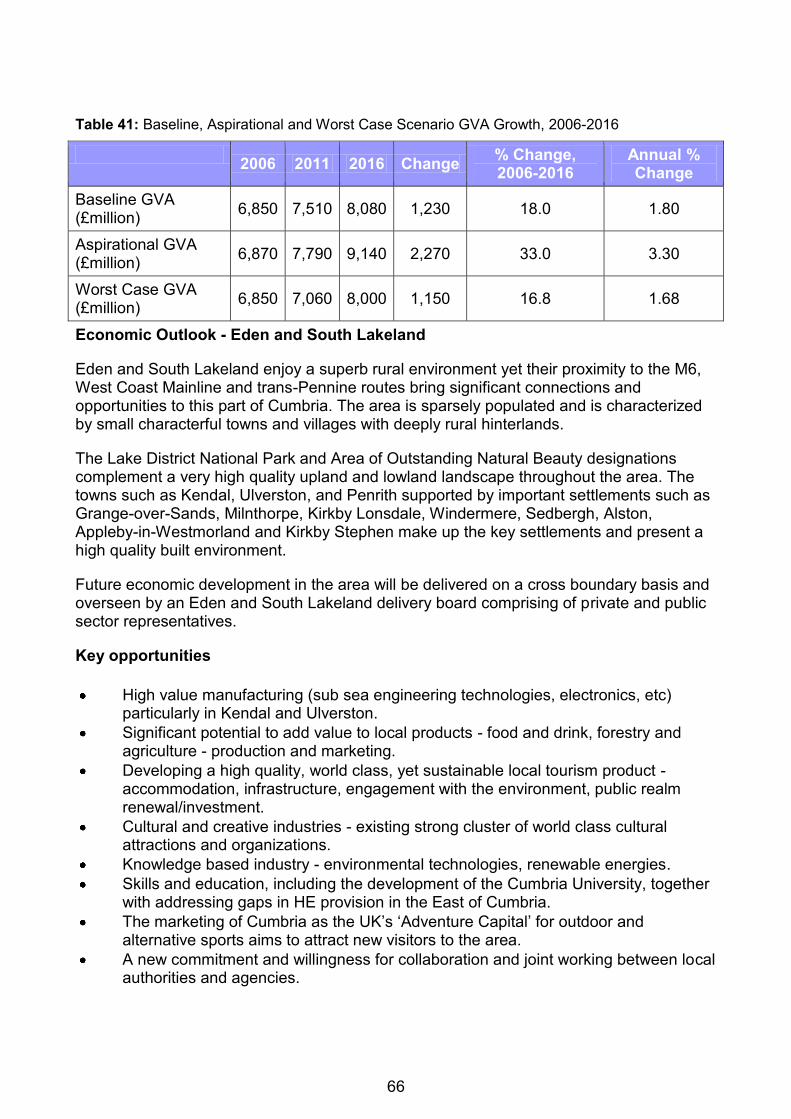
66
Table 41: Baseline, Aspirational and Worst Case Scenario GVA Growth, 2006-2016
2006 2011 2016 Change
% Change, 2006-2016
Annual % Change
Baseline GVA (£million)
6,850 7,510 8,080 1,230 18.0 1.80
Aspirational GVA (£million)
6,870 7,790 9,140 2,270 33.0 3.30
Worst Case GVA (£million)
6,850 7,060 8,000 1,150 16.8 1.68
Economic Outlook - Eden and South Lakeland
Eden and South Lakeland enjoy a superb rural environment yet their proximity to the M6, West Coast Mainline and trans-Pennine routes bring significant connections and opportunities to this part of Cumbria. The area is sparsely populated and is characterized by small characterful towns and villages with deeply rural hinterlands.
The Lake District National Park and Area of Outstanding Natural Beauty designations complement a very high quality upland and lowland landscape throughout the area. The towns such as Kendal, Ulverston, and Penrith supported by important settlements such as Grange-over-Sands, Milnthorpe, Kirkby Lonsdale, Windermere, Sedbergh, Alston, Appleby-in-Westmorland and Kirkby Stephen make up the key settlements and present a high quality built environment.
Future economic development in the area will be delivered on a cross boundary basis and overseen by an Eden and South Lakeland delivery board comprising of private and public sector representatives.
Key opportunities
High value manufacturing (sub sea engineering technologies, electronics, etc) particularly in Kendal and Ulverston.
Significant potential to add value to local products - food and drink, forestry and agriculture - production and marketing.
Developing a high quality, world class, yet sustainable local tourism product - accommodation, infrastructure, engagement with the environment, public realm renewal/investment.
Cultural and creative industries - existing strong cluster of world class cultural attractions and organizations.
Knowledge based industry - environmental technologies, renewable energies.
Skills and education, including the development of the Cumbria University, together with addressing gaps in HE provision in the East of Cumbria.
The marketing of Cumbria as the UK‟s „Adventure Capital‟ for outdoor and alternative sports aims to attract new visitors to the area.
A new commitment and willingness for collaboration and joint working between local authorities and agencies.

67
Key Issues
Limited supply of sites for modern business premises - addressing constraints and market failure in delivering sites.
Supply of housing sites.
Labour supply issues - tight labour market with low levels of unemployment/ worklessness - constraints by education, skills and affordable housing.
A significantly ageing population (much higher than the national average) driven by in-migration of wealthy retirees, which in turn helps drive up house prices making them unattainable to the local population.
A loss of young people from the area due to absence of job opportunity and prohibitive house prices.
High proportion of part-time working, with more than one job in Eden.
High dependency on car travel and difficulties in providing public transport to a largely rural area. Parking is of particular concern in both Kendal and Penrith.
Future sustainability of agriculture and primary production largely dependent on external forces, eg raw material prices, EU subsidies, etc…
Despite impressive statistics on business survival, new enterprise rates are low and there are a high proportion of micro businesses with limited potential and aspirations for growth.
High proportions of migrant workers, particularly in tourism and food production sectors. This reliance could become a threat to growth if circumstances dictate that the economic gains to migrants working in Cumbria rather than their home countries diminish.
Sustainability of key and local service centres (loss of services).
Rurality of area with pockets of deprivation.
Under-investment - absence of public sector investment in realizing the opportunities that the south and east offer.
Future Economic Potential - Eden and South Lakeland
The results from Cumbria Vision‟s modelling of future economic performance can also be interrogated at a district level. The tables below show how employment and GVA in Eden and South Lakeland could grow under the baseline, aspirational and worst case scenarios.
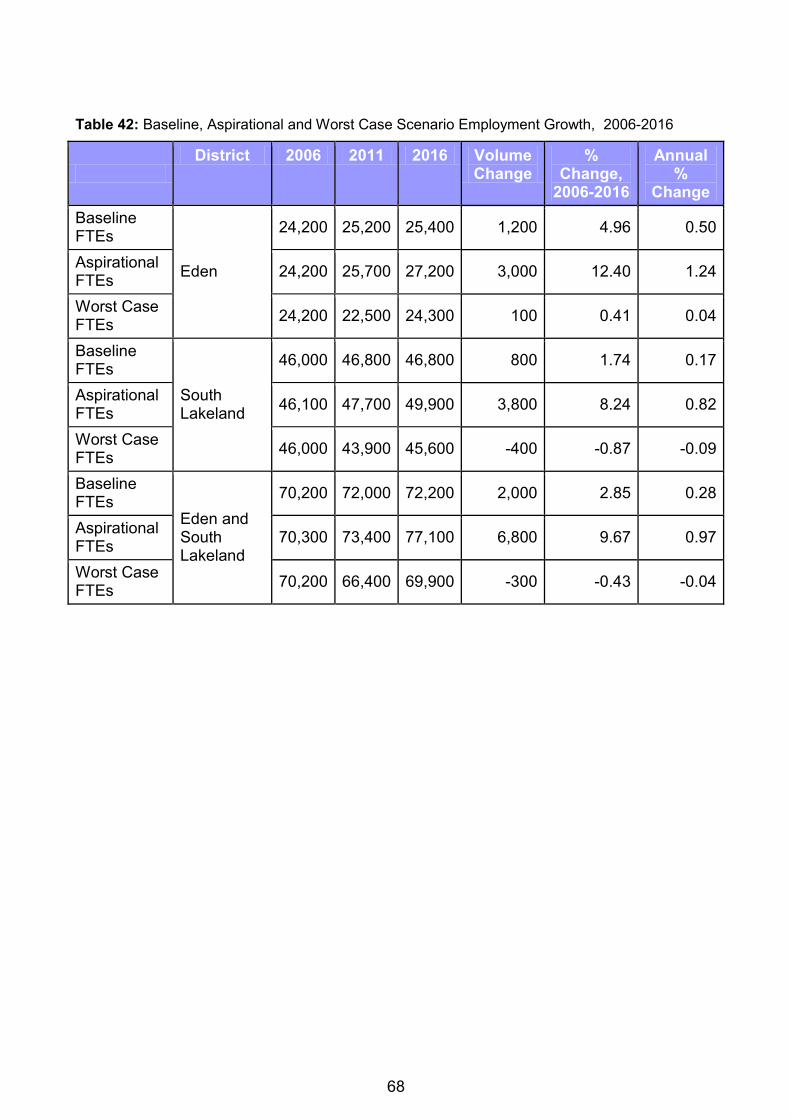
68
Table 42: Baseline, Aspirational and Worst Case Scenario Employment Growth, 2006-2016
District 2006 2011 2016 Volume
Change %
Change, 2006-2016
Annual %
Change
Baseline FTEs
Eden
24,200 25,200 25,400 1,200 4.96 0.50
Aspirational FTEs
24,200 25,700 27,200 3,000 12.40 1.24
Worst Case FTEs
24,200 22,500 24,300 100 0.41 0.04
Baseline FTEs
South Lakeland
46,000 46,800 46,800 800 1.74 0.17
Aspirational FTEs
46,100 47,700 49,900 3,800 8.24 0.82
Worst Case FTEs
46,000 43,900 45,600 -400 -0.87 -0.09
Baseline FTEs
Eden and South Lakeland
70,200 72,000 72,200 2,000 2.85 0.28
Aspirational FTEs
70,300 73,400 77,100 6,800 9.67 0.97
Worst Case FTEs
70,200 66,400 69,900 -300 -0.43 -0.04
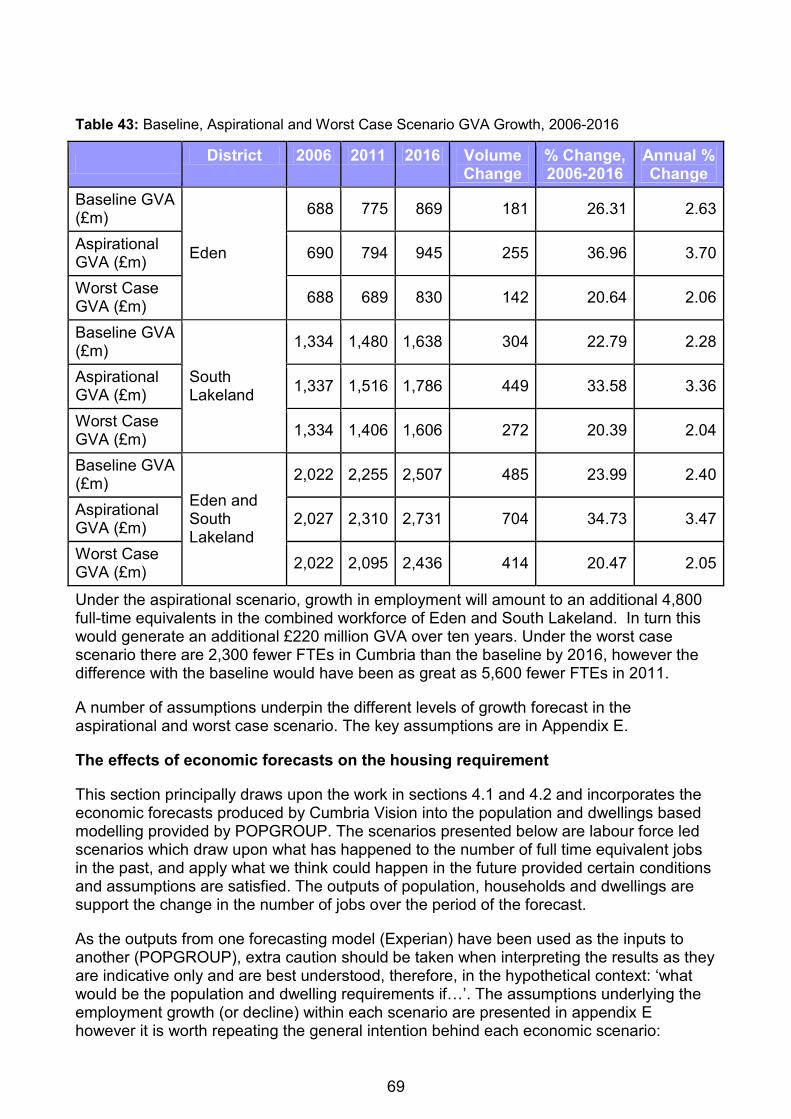
69
Table 43: Baseline, Aspirational and Worst Case Scenario GVA Growth, 2006-2016
District 2006 2011 2016 Volume
Change % Change, 2006-2016
Annual % Change
Baseline GVA (£m)
Eden
688 775 869 181 26.31 2.63
Aspirational GVA (£m)
690 794 945 255 36.96 3.70
Worst Case GVA (£m)
688 689 830 142 20.64 2.06
Baseline GVA (£m)
South Lakeland
1,334 1,480 1,638 304 22.79 2.28
Aspirational GVA (£m)
1,337 1,516 1,786 449 33.58 3.36
Worst Case GVA (£m)
1,334 1,406 1,606 272 20.39 2.04
Baseline GVA (£m)
Eden and South Lakeland
2,022 2,255 2,507 485 23.99 2.40
Aspirational GVA (£m)
2,027 2,310 2,731 704 34.73 3.47
Worst Case GVA (£m)
2,022 2,095 2,436 414 20.47 2.05
Under the aspirational scenario, growth in employment will amount to an additional 4,800 full-time equivalents in the combined workforce of Eden and South Lakeland. In turn this would generate an additional £220 million GVA over ten years. Under the worst case scenario there are 2,300 fewer FTEs in Cumbria than the baseline by 2016, however the difference with the baseline would have been as great as 5,600 fewer FTEs in 2011.
A number of assumptions underpin the different levels of growth forecast in the aspirational and worst case scenario. The key assumptions are in Appendix E.
The effects of economic forecasts on the housing requirement
This section principally draws upon the work in sections 4.1 and 4.2 and incorporates the economic forecasts produced by Cumbria Vision into the population and dwellings based modelling provided by POPGROUP. The scenarios presented below are labour force led scenarios which draw upon what has happened to the number of full time equivalent jobs in the past, and apply what we think could happen in the future provided certain conditions and assumptions are satisfied. The outputs of population, households and dwellings are support the change in the number of jobs over the period of the forecast.
As the outputs from one forecasting model (Experian) have been used as the inputs to another (POPGROUP), extra caution should be taken when interpreting the results as they are indicative only and are best understood, therefore, in the hypothetical context: „what would be the population and dwelling requirements if…‟. The assumptions underlying the employment growth (or decline) within each scenario are presented in appendix E however it is worth repeating the general intention behind each economic scenario:
70
Scenario 1: Labour Force Led, No Change - The first scenario is a control scenario which assumes that no additional jobs are inputted to the model. Accordingly, any fluctuations in employment under this scenario are purely a result of natural and migratory change in the workforce. This scenario uses the labour force as a constraint and forecasts what the population, household and dwellings requirement would need to be to satisfy specified job levels. In this case, it is assumed that the net gain in jobs, year on year, is nil. Prior to 2006 actual population is used as a constraint.
Scenario 2: Labour Force Led, Experian Baseline - this scenario takes a purely econometric approach to modelling and projects the future based on historic trends and assumes a „policy-off‟ response. As such, this scenario forecasts a relatively low level of growth. This scenario has been developed by Experian in consultation with regional and sub-regional partners and is held within the Experian forecasting model as the “baseline” scenario. This scenario uses the labour force as a constraint and forecasts what the population, household and dwellings requirement would need to be to satisfy specified job levels. In this case, we have specified a net annual change in number of jobs by district which is based on information from the Experian model baseline forecast provided by Cumbria Vision. Prior to 2006 actual population is used as a constraint.
Scenario 3: Labour Force Led, Aspirational Growth - the third scenario includes employment growth assumptions based on local knowledge of committed, proposed and potential future developments and programmes. As such the second scenario paints a more positive picture being responsive to local policies and ambitions and forms the “aspirational” scenario. This scenario has been developed within the sub-region and through consultation with regional partners. This scenario uses the labour force as a constraint and forecasts what the population, household and dwellings requirement would need to be to satisfy specified job levels. In this case, we have specified a net annual change in number of jobs by district which is based on information from the aspirational growth scenario provided by Cumbria Vision. Prior to 2006 actual population is used as a constraint.
Scenario 4: Labour Force Led, Worst Case Scenario - the forth scenario attempts to estimate the potential effects of the national and global economic downturn on the Cumbrian economy. A particularly pessimistic view has been taken when devising the assumptions underlining this forecast in an attempt to create a “worst case” scenario. This scenario has been developed within the sub-region. This scenario uses the labour force as a constraint and forecasts what the population, household and dwellings requirement would need to be to satisfy specified job levels. In this case, we have specified a net annual change in number of jobs by district which is based on information from the worst case scenario provided by Cumbria Vision. Prior to 2006 actual population is used as a constraint.
Scenario 5: Migration Led, Labour Force Impact - The fifth scenario is the 5 year migration-led run from stage 4.1. The inclusion of this scenario here will help tie these labour force led forecasts to the population and dwelling led forecasts from stage 4.1. This scenario uses population as a constraint and is consistent with the 5 year migration forecast provided in stage 4.1. The scenario shows the number of households and dwellings required to satisfy the growing population.
These scenarios illustrate how Cumbria‟s economy may develop over the coming years provided certain conditions are met. The forecasts are employment led with each new employment opportunity being filled by a new member to the workforce and the employment growth figures representing net job gains.
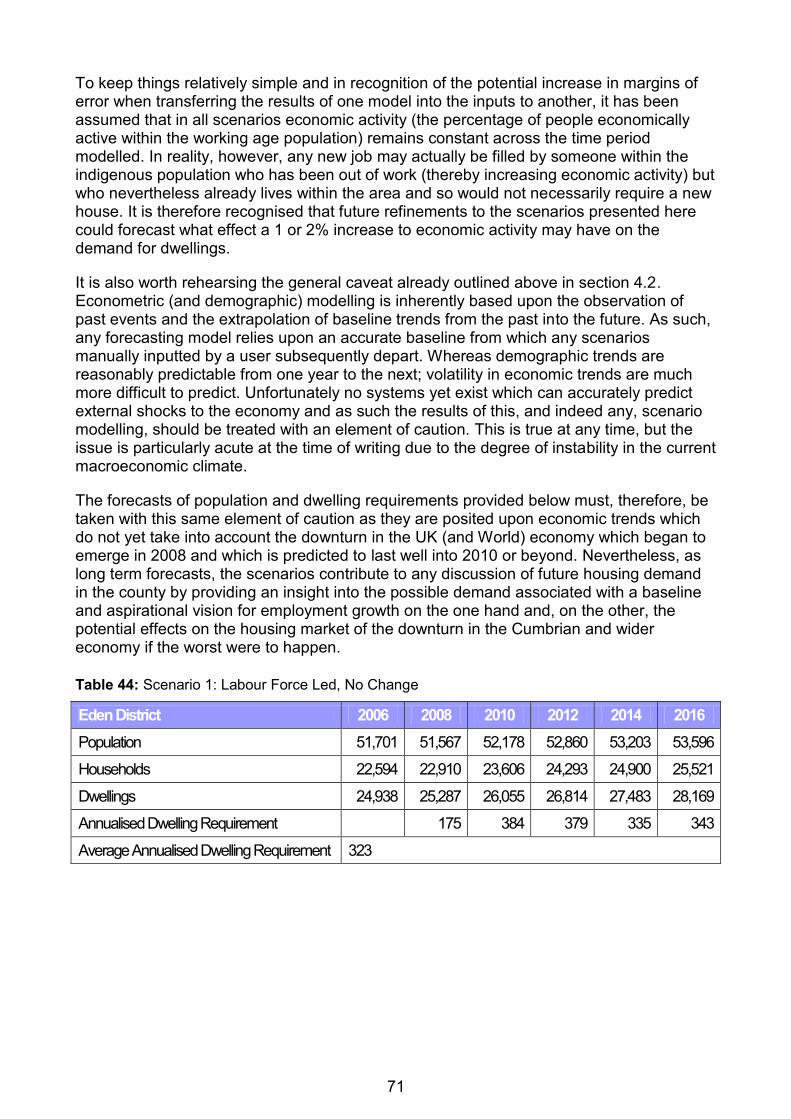
71
To keep things relatively simple and in recognition of the potential increase in margins of error when transferring the results of one model into the inputs to another, it has been assumed that in all scenarios economic activity (the percentage of people economically active within the working age population) remains constant across the time period modelled. In reality, however, any new job may actually be filled by someone within the indigenous population who has been out of work (thereby increasing economic activity) but who nevertheless already lives within the area and so would not necessarily require a new house. It is therefore recognised that future refinements to the scenarios presented here could forecast what effect a 1 or 2% increase to economic activity may have on the demand for dwellings.
It is also worth rehearsing the general caveat already outlined above in section 4.2. Econometric (and demographic) modelling is inherently based upon the observation of past events and the extrapolation of baseline trends from the past into the future. As such, any forecasting model relies upon an accurate baseline from which any scenarios manually inputted by a user subsequently depart. Whereas demographic trends are reasonably predictable from one year to the next; volatility in economic trends are much more difficult to predict. Unfortunately no systems yet exist which can accurately predict external shocks to the economy and as such the results of this, and indeed any, scenario modelling, should be treated with an element of caution. This is true at any time, but the issue is particularly acute at the time of writing due to the degree of instability in the current macroeconomic climate.
The forecasts of population and dwelling requirements provided below must, therefore, be taken with this same element of caution as they are posited upon economic trends which do not yet take into account the downturn in the UK (and World) economy which began to emerge in 2008 and which is predicted to last well into 2010 or beyond. Nevertheless, as long term forecasts, the scenarios contribute to any discussion of future housing demand in the county by providing an insight into the possible demand associated with a baseline and aspirational vision for employment growth on the one hand and, on the other, the potential effects on the housing market of the downturn in the Cumbrian and wider economy if the worst were to happen.
Table 44: Scenario 1: Labour Force Led, No Change
Eden District 2006 2008 2010 2012 2014 2016
Population 51,701 51,567 52,178 52,860 53,203 53,596
Households 22,594 22,910 23,606 24,293 24,900 25,521
Dwellings 24,938 25,287 26,055 26,814 27,483 28,169
Annualised Dwelling Requirement 175 384 379 335 343
Average Annualised Dwelling Requirement 323
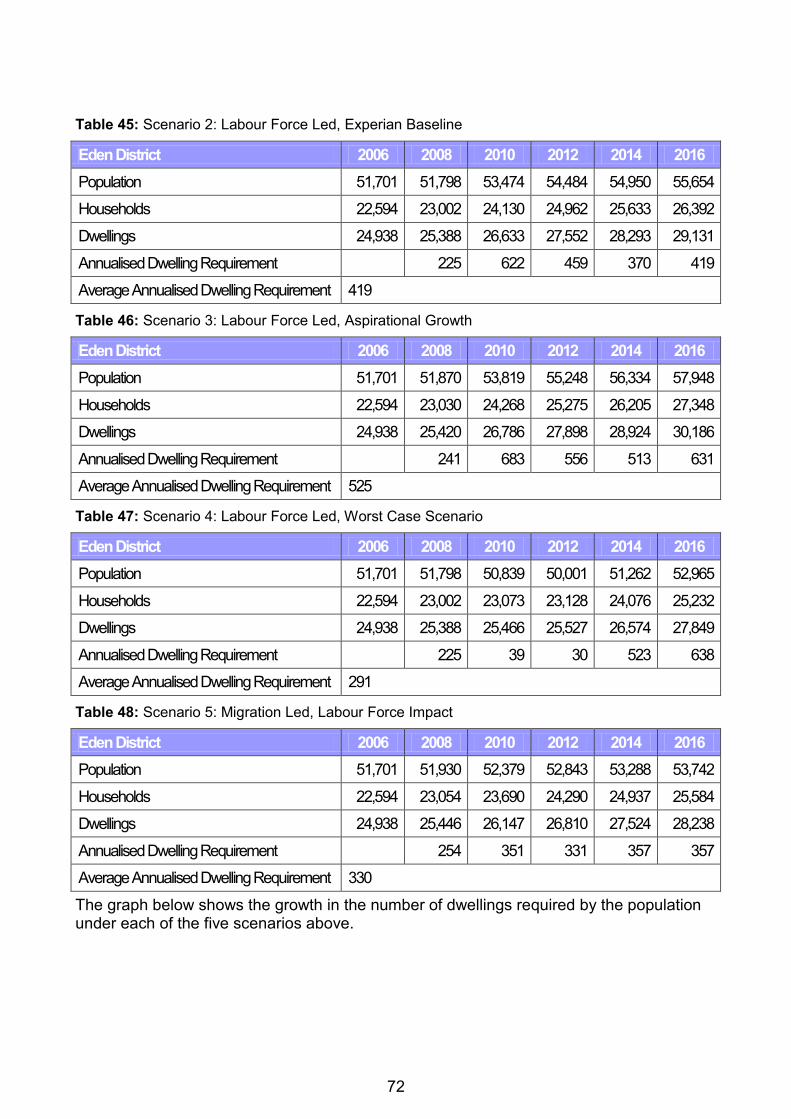
72
Table 45: Scenario 2: Labour Force Led, Experian Baseline
Eden District 2006 2008 2010 2012 2014 2016
Population 51,701 51,798 53,474 54,484 54,950 55,654
Households 22,594 23,002 24,130 24,962 25,633 26,392
Dwellings 24,938 25,388 26,633 27,552 28,293 29,131
Annualised Dwelling Requirement 225 622 459 370 419
Average Annualised Dwelling Requirement 419
Table 46: Scenario 3: Labour Force Led, Aspirational Growth
Eden District 2006 2008 2010 2012 2014 2016
Population 51,701 51,870 53,819 55,248 56,334 57,948
Households 22,594 23,030 24,268 25,275 26,205 27,348
Dwellings 24,938 25,420 26,786 27,898 28,924 30,186
Annualised Dwelling Requirement 241 683 556 513 631
Average Annualised Dwelling Requirement 525
Table 47: Scenario 4: Labour Force Led, Worst Case Scenario
Eden District 2006 2008 2010 2012 2014 2016
Population 51,701 51,798 50,839 50,001 51,262 52,965
Households 22,594 23,002 23,073 23,128 24,076 25,232
Dwellings 24,938 25,388 25,466 25,527 26,574 27,849
Annualised Dwelling Requirement 225 39 30 523 638
Average Annualised Dwelling Requirement 291
Table 48: Scenario 5: Migration Led, Labour Force Impact
Eden District 2006 2008 2010 2012 2014 2016
Population 51,701 51,930 52,379 52,843 53,288 53,742
Households 22,594 23,054 23,690 24,290 24,937 25,584
Dwellings 24,938 25,446 26,147 26,810 27,524 28,238
Annualised Dwelling Requirement 254 351 331 357 357
Average Annualised Dwelling Requirement 330
The graph below shows the growth in the number of dwellings required by the population under each of the five scenarios above.
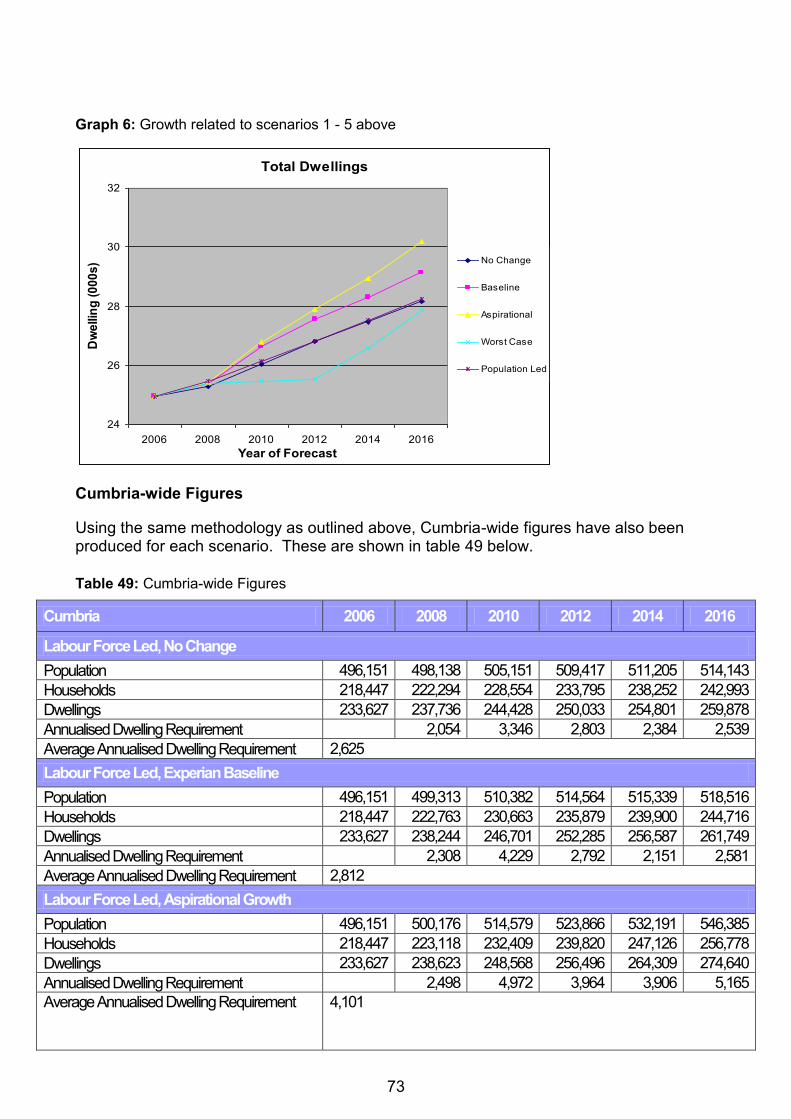
73
Graph 6: Growth related to scenarios 1 - 5 above
Total Dwellings
24
26
28
30
32
2006 2008 2010 2012 2014 2016
Year of Forecast
Dw
ellin
g (
00
0s
) No Change
Baseline
Aspirational
Worst Case
Population Led
Cumbria-wide Figures
Using the same methodology as outlined above, Cumbria-wide figures have also been produced for each scenario. These are shown in table 49 below.
Table 49: Cumbria-wide Figures
Cumbria 2006 2008 2010 2012 2014 2016
Labour Force Led, No Change
Population 496,151 498,138 505,151 509,417 511,205 514,143
Households 218,447 222,294 228,554 233,795 238,252 242,993
Dwellings 233,627 237,736 244,428 250,033 254,801 259,878
Annualised Dwelling Requirement 2,054 3,346 2,803 2,384 2,539
Average Annualised Dwelling Requirement 2,625
Labour Force Led, Experian Baseline
Population 496,151 499,313 510,382 514,564 515,339 518,516
Households 218,447 222,763 230,663 235,879 239,900 244,716
Dwellings 233,627 238,244 246,701 252,285 256,587 261,749
Annualised Dwelling Requirement 2,308 4,229 2,792 2,151 2,581
Average Annualised Dwelling Requirement 2,812
Labour Force Led, Aspirational Growth
Population 496,151 500,176 514,579 523,866 532,191 546,385
Households 218,447 223,118 232,409 239,820 247,126 256,778
Dwellings 233,627 238,623 248,568 256,496 264,309 274,640
Annualised Dwelling Requirement 2,498 4,972 3,964 3,906 5,165
Average Annualised Dwelling Requirement 4,101
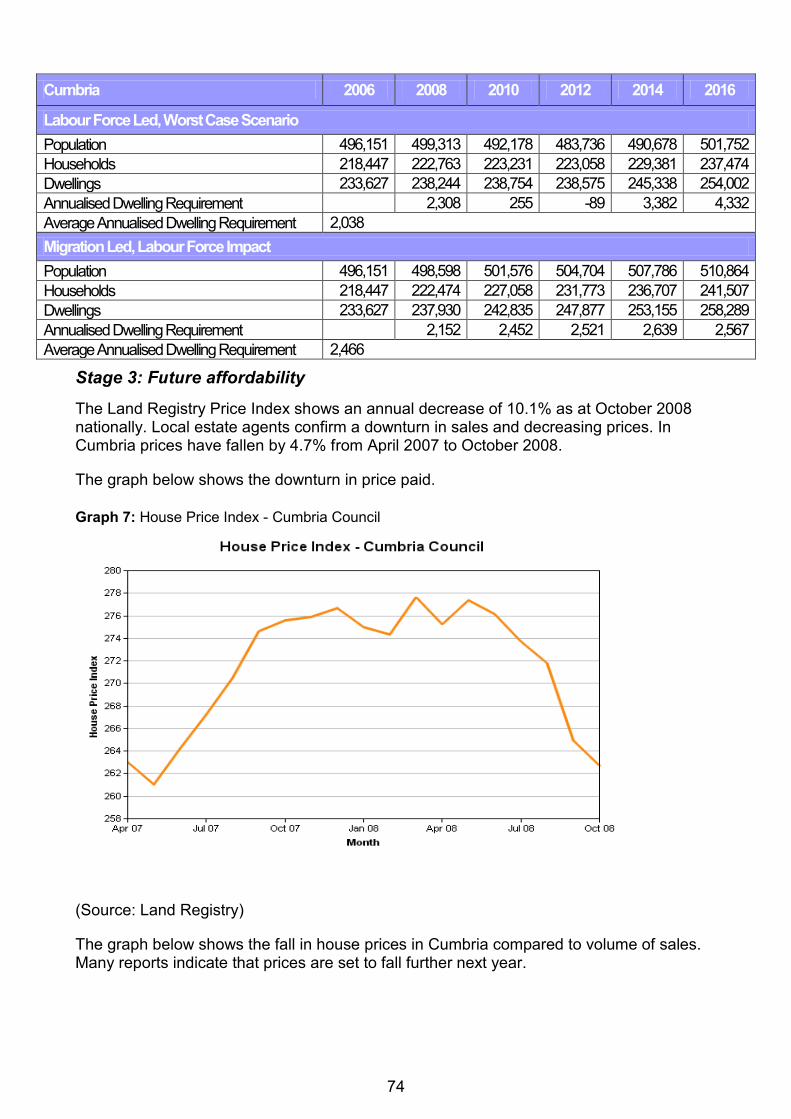
74
Cumbria 2006 2008 2010 2012 2014 2016
Labour Force Led, Worst Case Scenario
Population 496,151 499,313 492,178 483,736 490,678 501,752
Households 218,447 222,763 223,231 223,058 229,381 237,474
Dwellings 233,627 238,244 238,754 238,575 245,338 254,002
Annualised Dwelling Requirement 2,308 255 -89 3,382 4,332
Average Annualised Dwelling Requirement 2,038
Migration Led, Labour Force Impact
Population 496,151 498,598 501,576 504,704 507,786 510,864
Households 218,447 222,474 227,058 231,773 236,707 241,507
Dwellings 233,627 237,930 242,835 247,877 253,155 258,289
Annualised Dwelling Requirement 2,152 2,452 2,521 2,639 2,567
Average Annualised Dwelling Requirement 2,466
Stage 3: Future affordability
The Land Registry Price Index shows an annual decrease of 10.1% as at October 2008 nationally. Local estate agents confirm a downturn in sales and decreasing prices. In Cumbria prices have fallen by 4.7% from April 2007 to October 2008.
The graph below shows the downturn in price paid.
Graph 7: House Price Index - Cumbria Council
(Source: Land Registry)
The graph below shows the fall in house prices in Cumbria compared to volume of sales. Many reports indicate that prices are set to fall further next year.
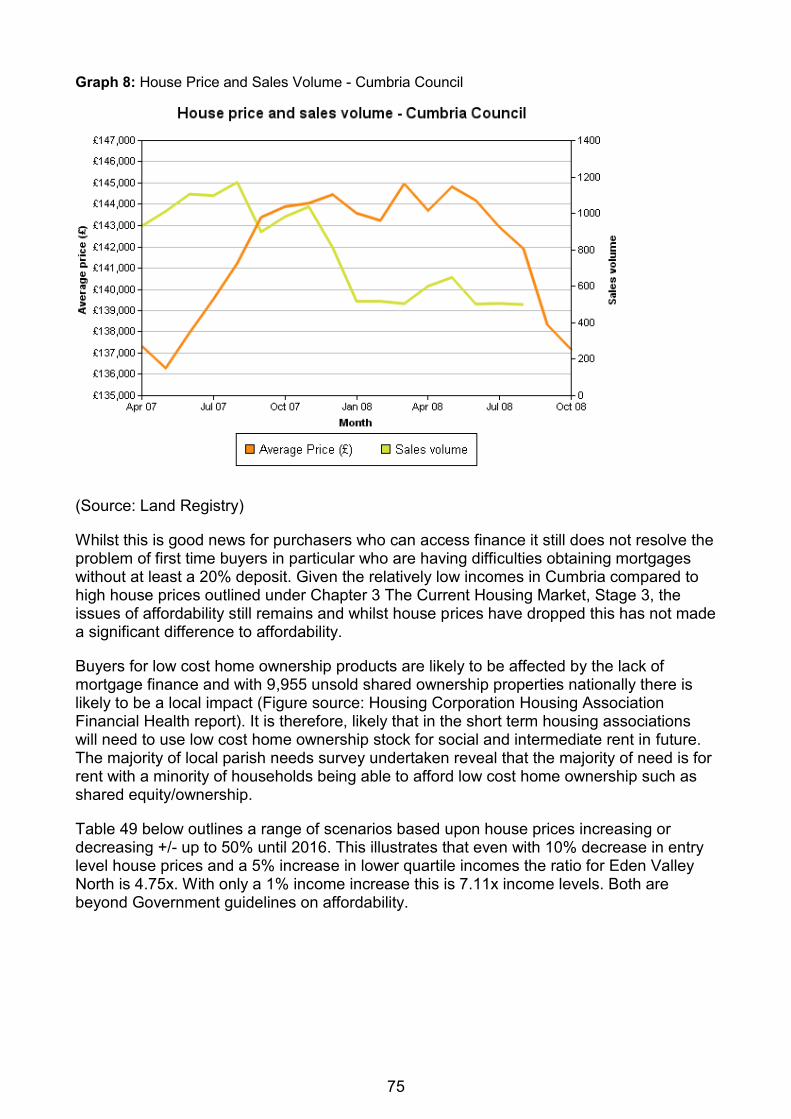
75
Graph 8: House Price and Sales Volume - Cumbria Council
(Source: Land Registry)
Whilst this is good news for purchasers who can access finance it still does not resolve the problem of first time buyers in particular who are having difficulties obtaining mortgages without at least a 20% deposit. Given the relatively low incomes in Cumbria compared to high house prices outlined under Chapter 3 The Current Housing Market, Stage 3, the issues of affordability still remains and whilst house prices have dropped this has not made a significant difference to affordability.
Buyers for low cost home ownership products are likely to be affected by the lack of mortgage finance and with 9,955 unsold shared ownership properties nationally there is likely to be a local impact (Figure source: Housing Corporation Housing Association Financial Health report). It is therefore, likely that in the short term housing associations will need to use low cost home ownership stock for social and intermediate rent in future. The majority of local parish needs survey undertaken reveal that the majority of need is for rent with a minority of households being able to afford low cost home ownership such as shared equity/ownership.
Table 49 below outlines a range of scenarios based upon house prices increasing or decreasing +/- up to 50% until 2016. This illustrates that even with 10% decrease in entry level house prices and a 5% increase in lower quartile incomes the ratio for Eden Valley North is 4.75x. With only a 1% income increase this is 7.11x income levels. Both are beyond Government guidelines on affordability.
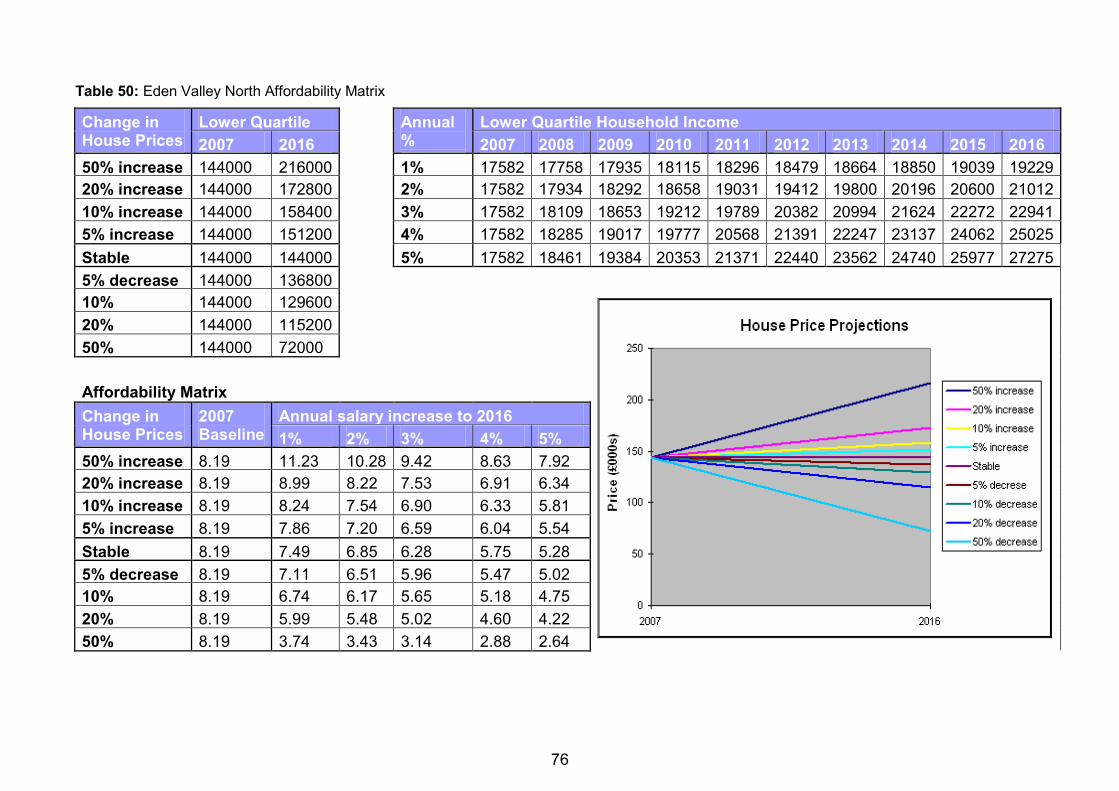
76
Table 50: Eden Valley North Affordability Matrix
Change in House Prices
Lower Quartile House Prices
Annual % Salary Increase
Lower Quartile Household Income
2007 2016 2007 2008 2009 2010 2011 2012 2013 2014 2015 2016
50% increase 144000 216000 1% 17582 17758 17935 18115 18296 18479 18664 18850 19039 19229
20% increase 144000 172800 2% 17582 17934 18292 18658 19031 19412 19800 20196 20600 21012
10% increase 144000 158400 3% 17582 18109 18653 19212 19789 20382 20994 21624 22272 22941
5% increase 144000 151200 4% 17582 18285 19017 19777 20568 21391 22247 23137 24062 25025
Stable 144000 144000 5% 17582 18461 19384 20353 21371 22440 23562 24740 25977 27275
5% decrease 144000 136800
10% decrease
144000 129600
20% decrease
144000 115200
50% decrease
144000 72000
Affordability Matrix
Change in House Prices
2007 Baseline
Annual salary increase to 2016
1% 2% 3% 4% 5%
50% increase 8.19 11.23 10.28 9.42 8.63 7.92
20% increase 8.19 8.99 8.22 7.53 6.91 6.34
10% increase 8.19 8.24 7.54 6.90 6.33 5.81
5% increase 8.19 7.86 7.20 6.59 6.04 5.54
Stable 8.19 7.49 6.85 6.28 5.75 5.28
5% decrease 8.19 7.11 6.51 5.96 5.47 5.02
10% decrease
8.19 6.74 6.17 5.65 5.18 4.75
20% decrease
8.19 5.99 5.48 5.02 4.60 4.22
50% decrease
8.19 3.74 3.43 3.14 2.88 2.64
77
Stage 4: Bringing the Evidence Together
Across the District there is a projected population increase 11% from 51,701 to 57,438 between 2006 and 2031 and annual dwelling requirement of 309 based on population projections (PopGroup). For Eden Valley North the population is expected to rise by 17%. Based on previous trends this could alter depending on any policy changes.
There is set to be a massive increase in elderly population and decreases for other age groups. There are virtually no increases in 15-29 year old group (approximately 200 spread across Alston and the Eden Valley). This will have implications for service provision including requirements for specialised housing and adaptations.
Households are set to increase by 33%. Taken together with population growth this indicates a tendency towards smaller households. There is proportionate decline in married households, and a rise in cohabiting households and one person households.
Cumbria prices have fallen by 4.7%. However this is not likely to have an impact on affordability. First time buyers are likely to have problems obtaining mortgages.
Housing Associations may need to use low cost home ownership stock for social and intermediate rent. Surveys indicate that the majority of need is going to be for social rent.
Recent economic performance and the effects of the „credit crunch‟ will effect the willingness to pay for housing and place further pressure on affordable housing supply. There is also expected to be a weakened GVA growth in construction at least in the short term.
The „aspirational‟ growth scenario which forecasts 3000 additional jobs across the District (2006-2016) paints a positive picture. It is based on a number of opportunities and assumptions that need to be met before this employment forecast can be realised.
However there are a number of issues that may undermine this - supply of business and housing sites, an aging population, dependence of agriculture on external forces, and pockets of rural deprivation etc. Supply of labour is an important issue and under Section 3 we found evidence that a skilled workforce may already live here but prefer to commute out of the area. If they were encouraged to work here for better pay rewards this might mitigate the undersupply of labour, but the evidence in Section 4 also highlights the acute decline in the working age population. Affordable housing for younger families is therefore vital to prevent out-migration and achieve sustainable economic growth.
78
5. Housing Need (affordable housing)
The requirement for affordable housing is based on the 2006 Housing Needs Survey. This presents data at Housing Market Area level. For Planning and development purposes further evidence may be required at a lower area level, for example based on parish or settlement needs. This data may be available for local authorities or from Cumbria Rural Housing Trust. Please see appendix D for definitions of Affordable Housing.
Stage 1 and 2: Updated housing requirements
The 2006 Housing Needs Survey gave housing requirements for the next 5 years. Government Guidance suggests that a comprehensive assessment exercise should not be required within this period, but that updating should be undertaken „regularly‟. The table below uses the past trends on household increases derived from the PopGroup analysis to update previous estimates of affordable housing need. The percentage increase in households from 2006 - 2016 based on the „5 year migration led run‟ has been used to give an average annual increase. This has also been applied to the figures for overall demand which will later be used to up date market led housing.
The „overall demand‟ figure shows how many respondents to the original 2006 Housing Needs Survey said that they wished to move within five years. Within this a proportion were deemed to be in „unsuitable housing‟ (overcrowded, requiring disabled access etc.) of which some could afford their own housing solution on the open market while others required affordable housing. This stage of the analysis does not include supply side figures as the purpose here is to give an overall gross annual needs figure that can be worked towards before deductions are made for new build or social re-lets to give a net housing requirement. The update includes new figures for homeless households as these have shown a large decrease from a district annual average of 51 down to 20.
The analysis shows the updated gross requirement for affordable housing in the District as a whole as 434 per annum. This represents 40% of total housing demand.
Overall of all those wishing to move 49% are deemed to be in unsuitable housing, of which 83% are in need of affordable housing.
The overall split between gross affordable need and market led housing demand for the District is 40.5% affordable and 59.5% market led.
The analysis is then split down into housing market area using the same methodology. For Eden Valley North this shows a gross requirement for affordable housing as 221 units per annum with a split of 40% affordable and 60% market led.
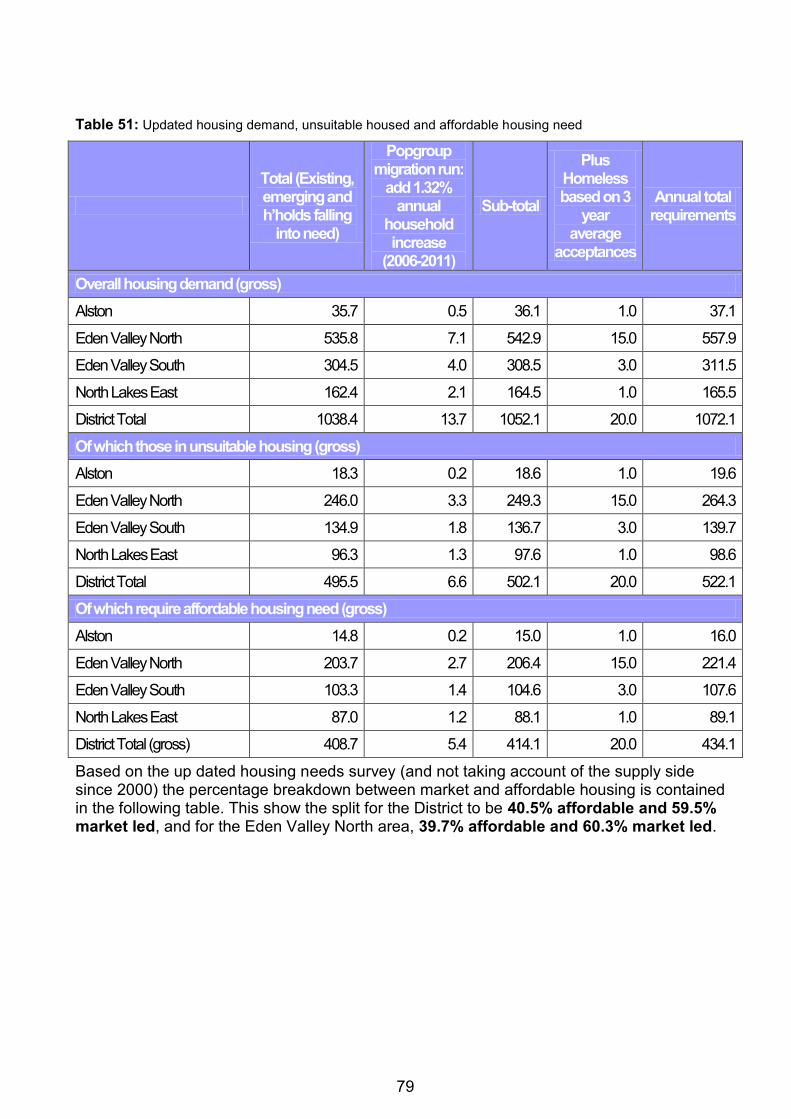
79
Table 51: Updated housing demand, unsuitable housed and affordable housing need
Total (Existing, emerging and h‟holds falling
into need)
Popgroup migration run:
add 1.32% annual
household increase
(2006-2011)
Sub-total
Plus Homeless based on 3
year average
acceptances
Annual total requirements
Overall housing demand (gross)
Alston 35.7 0.5 36.1 1.0 37.1
Eden Valley North 535.8 7.1 542.9 15.0 557.9
Eden Valley South 304.5 4.0 308.5 3.0 311.5
North Lakes East 162.4 2.1 164.5 1.0 165.5
District Total 1038.4 13.7 1052.1 20.0 1072.1
Of which those in unsuitable housing (gross)
Alston 18.3 0.2 18.6 1.0 19.6
Eden Valley North 246.0 3.3 249.3 15.0 264.3
Eden Valley South 134.9 1.8 136.7 3.0 139.7
North Lakes East 96.3 1.3 97.6 1.0 98.6
District Total 495.5 6.6 502.1 20.0 522.1
Of which require affordable housing need (gross)
Alston 14.8 0.2 15.0 1.0 16.0
Eden Valley North 203.7 2.7 206.4 15.0 221.4
Eden Valley South 103.3 1.4 104.6 3.0 107.6
North Lakes East 87.0 1.2 88.1 1.0 89.1
District Total (gross) 408.7 5.4 414.1 20.0 434.1
Based on the up dated housing needs survey (and not taking account of the supply side since 2000) the percentage breakdown between market and affordable housing is contained in the following table. This show the split for the District to be 40.5% affordable and 59.5% market led, and for the Eden Valley North area, 39.7% affordable and 60.3% market led.
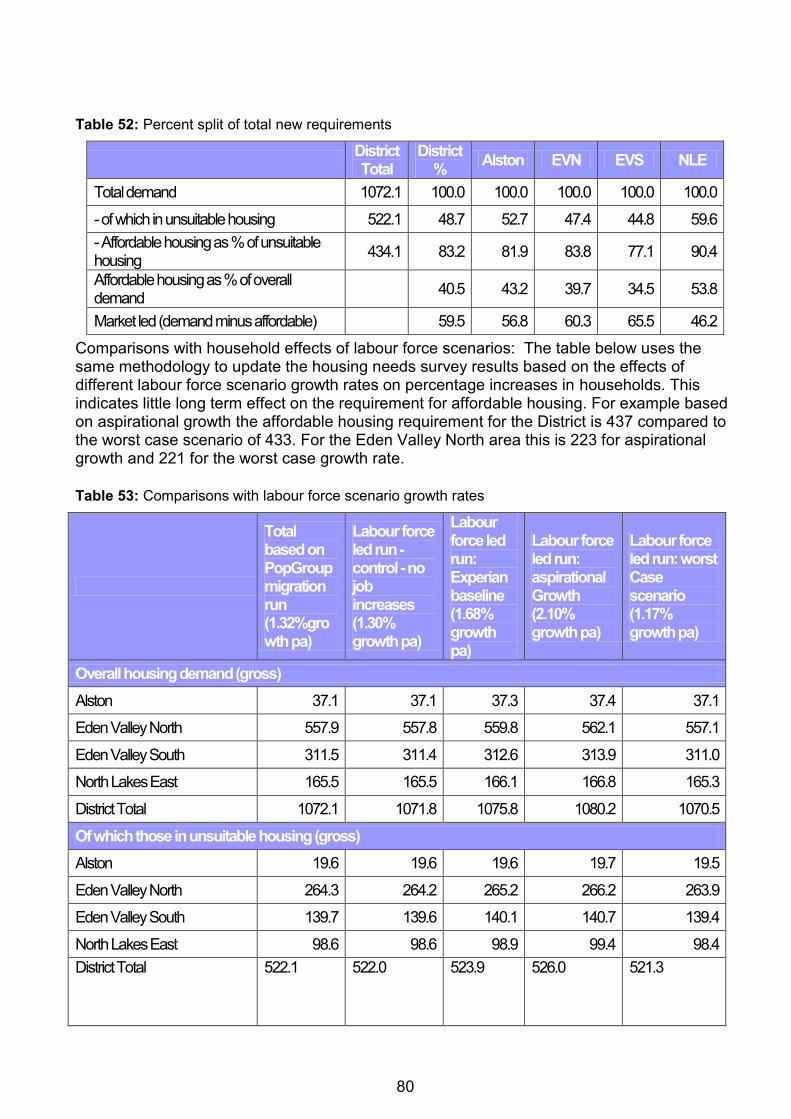
80
Table 52: Percent split of total new requirements
District Total
District %
Alston EVN EVS NLE
Total demand 1072.1 100.0 100.0 100.0 100.0 100.0
- of which in unsuitable housing 522.1 48.7 52.7 47.4 44.8 59.6
- Affordable housing as % of unsuitable housing
434.1 83.2 81.9 83.8 77.1 90.4
Affordable housing as % of overall demand
40.5 43.2 39.7 34.5 53.8
Market led (demand minus affordable) 59.5 56.8 60.3 65.5 46.2
Comparisons with household effects of labour force scenarios: The table below uses the same methodology to update the housing needs survey results based on the effects of different labour force scenario growth rates on percentage increases in households. This indicates little long term effect on the requirement for affordable housing. For example based on aspirational growth the affordable housing requirement for the District is 437 compared to the worst case scenario of 433. For the Eden Valley North area this is 223 for aspirational growth and 221 for the worst case growth rate.
Table 53: Comparisons with labour force scenario growth rates
Total based on PopGroup migration run (1.32%growth pa)
Labour force led run - control - no job increases (1.30% growth pa)
Labour force led run: Experian baseline (1.68% growth pa)
Labour force led run: aspirational Growth (2.10% growth pa)
Labour force led run: worst Case scenario (1.17% growth pa)
Overall housing demand (gross)
Alston 37.1 37.1 37.3 37.4 37.1
Eden Valley North 557.9 557.8 559.8 562.1 557.1
Eden Valley South 311.5 311.4 312.6 313.9 311.0
North Lakes East 165.5 165.5 166.1 166.8 165.3
District Total 1072.1 1071.8 1075.8 1080.2 1070.5
Of which those in unsuitable housing (gross)
Alston 19.6 19.6 19.6 19.7 19.5
Eden Valley North 264.3 264.2 265.2 266.2 263.9
Eden Valley South 139.7 139.6 140.1 140.7 139.4
North Lakes East 98.6 98.6 98.9 99.4 98.4
District Total 522.1 522.0 523.9 526.0 521.3
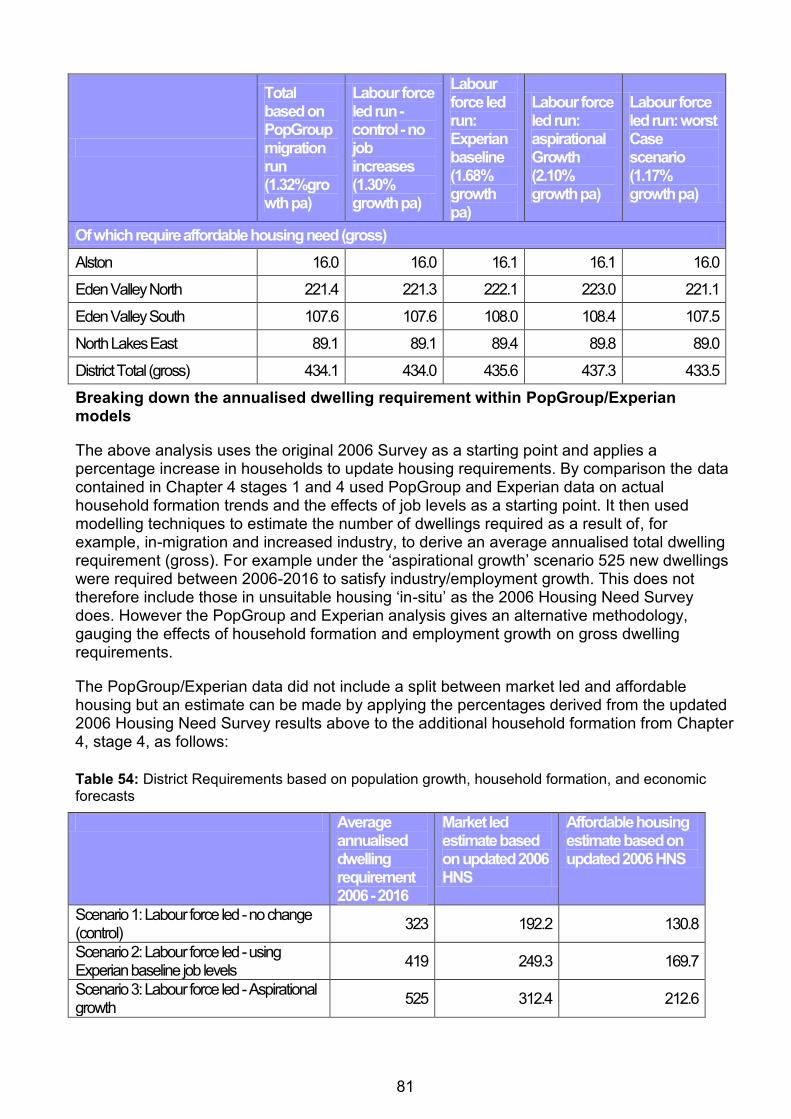
81
Total based on PopGroup migration run (1.32%growth pa)
Labour force led run - control - no job increases (1.30% growth pa)
Labour force led run: Experian baseline (1.68% growth pa)
Labour force led run: aspirational Growth (2.10% growth pa)
Labour force led run: worst Case scenario (1.17% growth pa)
Of which require affordable housing need (gross)
Alston 16.0 16.0 16.1 16.1 16.0
Eden Valley North 221.4 221.3 222.1 223.0 221.1
Eden Valley South 107.6 107.6 108.0 108.4 107.5
North Lakes East 89.1 89.1 89.4 89.8 89.0
District Total (gross) 434.1 434.0 435.6 437.3 433.5
Breaking down the annualised dwelling requirement within PopGroup/Experian models
The above analysis uses the original 2006 Survey as a starting point and applies a percentage increase in households to update housing requirements. By comparison the data contained in Chapter 4 stages 1 and 4 used PopGroup and Experian data on actual household formation trends and the effects of job levels as a starting point. It then used modelling techniques to estimate the number of dwellings required as a result of, for example, in-migration and increased industry, to derive an average annualised total dwelling requirement (gross). For example under the „aspirational growth‟ scenario 525 new dwellings were required between 2006-2016 to satisfy industry/employment growth. This does not therefore include those in unsuitable housing „in-situ‟ as the 2006 Housing Need Survey does. However the PopGroup and Experian analysis gives an alternative methodology, gauging the effects of household formation and employment growth on gross dwelling requirements.
The PopGroup/Experian data did not include a split between market led and affordable housing but an estimate can be made by applying the percentages derived from the updated 2006 Housing Need Survey results above to the additional household formation from Chapter 4, stage 4, as follows:
Table 54: District Requirements based on population growth, household formation, and economic forecasts
Average annualised dwelling requirement 2006 - 2016
Market led estimate based on updated 2006 HNS
Affordable housing estimate based on updated 2006 HNS
Scenario 1: Labour force led - no change (control)
323 192.2 130.8
Scenario 2: Labour force led - using Experian baseline job levels
419 249.3 169.7
Scenario 3: Labour force led - Aspirational growth
525 312.4 212.6
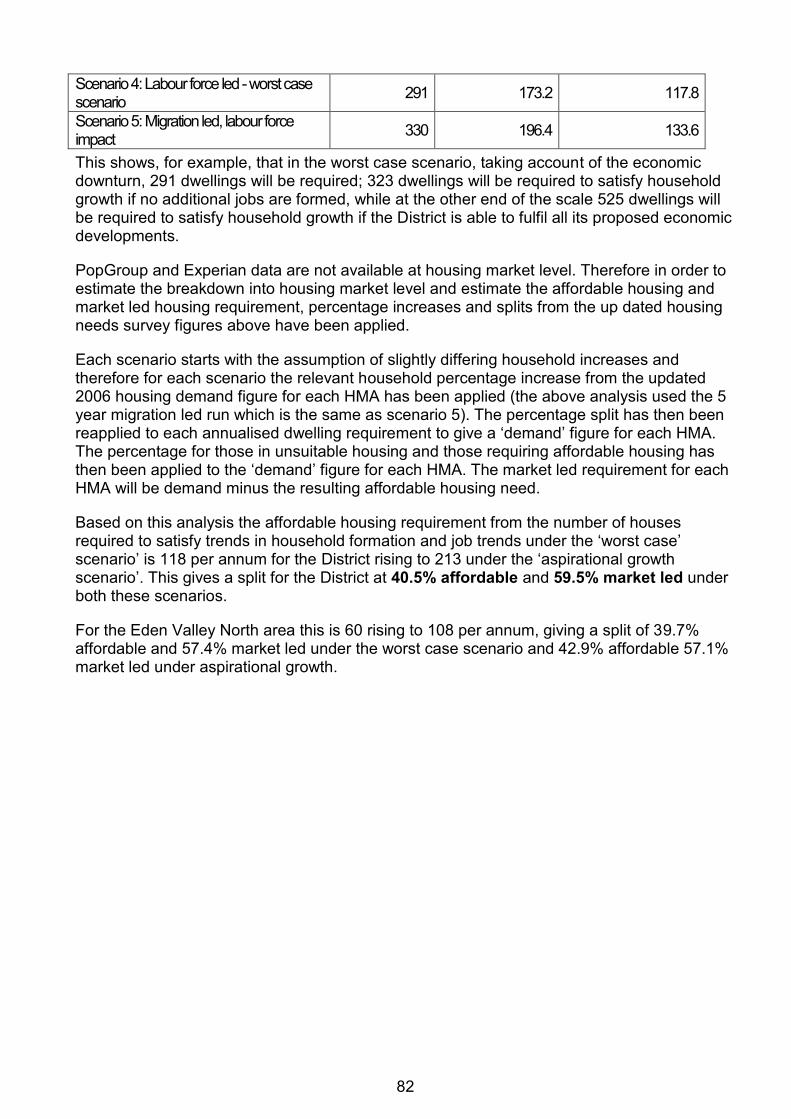
82
Scenario 4: Labour force led - worst case scenario
291 173.2 117.8
Scenario 5: Migration led, labour force impact
330 196.4 133.6
This shows, for example, that in the worst case scenario, taking account of the economic downturn, 291 dwellings will be required; 323 dwellings will be required to satisfy household growth if no additional jobs are formed, while at the other end of the scale 525 dwellings will be required to satisfy household growth if the District is able to fulfil all its proposed economic developments.
PopGroup and Experian data are not available at housing market level. Therefore in order to estimate the breakdown into housing market level and estimate the affordable housing and market led housing requirement, percentage increases and splits from the up dated housing needs survey figures above have been applied.
Each scenario starts with the assumption of slightly differing household increases and therefore for each scenario the relevant household percentage increase from the updated 2006 housing demand figure for each HMA has been applied (the above analysis used the 5 year migration led run which is the same as scenario 5). The percentage split has then been reapplied to each annualised dwelling requirement to give a „demand‟ figure for each HMA. The percentage for those in unsuitable housing and those requiring affordable housing has then been applied to the „demand‟ figure for each HMA. The market led requirement for each HMA will be demand minus the resulting affordable housing need.
Based on this analysis the affordable housing requirement from the number of houses required to satisfy trends in household formation and job trends under the „worst case‟ scenario‟ is 118 per annum for the District rising to 213 under the „aspirational growth scenario‟. This gives a split for the District at 40.5% affordable and 59.5% market led under both these scenarios.
For the Eden Valley North area this is 60 rising to 108 per annum, giving a split of 39.7% affordable and 57.4% market led under the worst case scenario and 42.9% affordable 57.1% market led under aspirational growth.
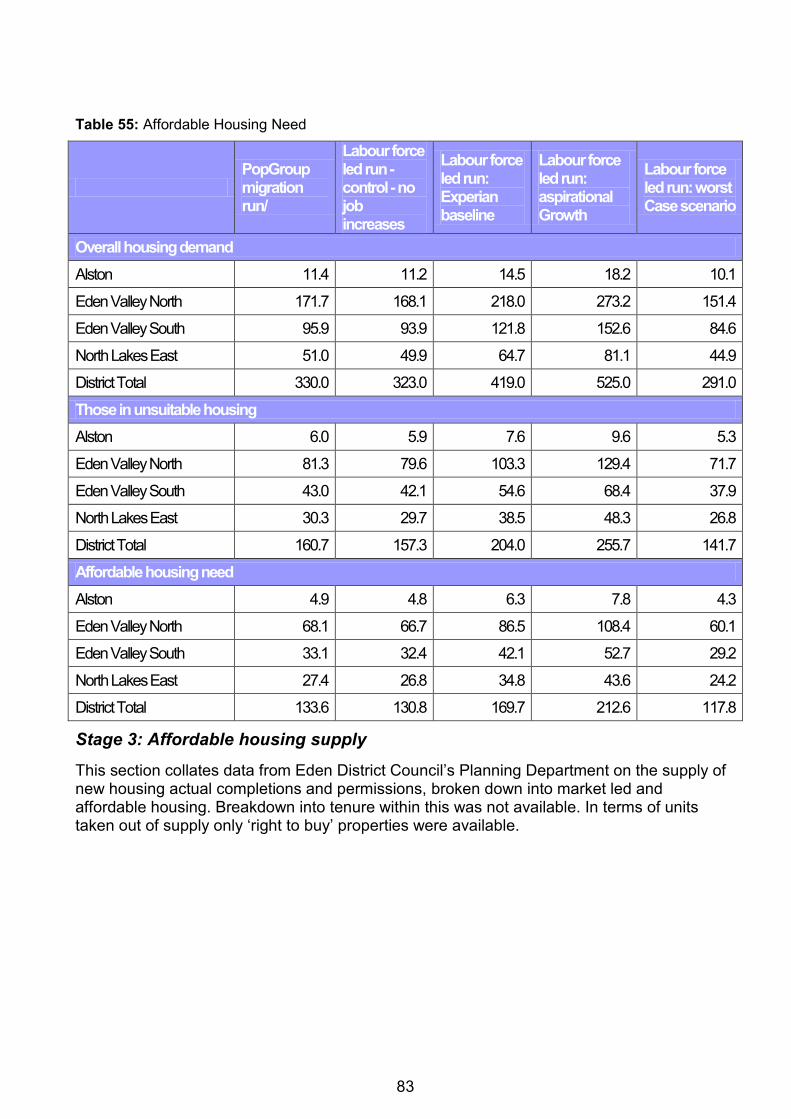
83
Table 55: Affordable Housing Need
PopGroup migration run/
Labour force led run - control - no job increases
Labour force led run: Experian baseline
Labour force led run: aspirational Growth
Labour force led run: worst Case scenario
Overall housing demand
Alston 11.4 11.2 14.5 18.2 10.1
Eden Valley North 171.7 168.1 218.0 273.2 151.4
Eden Valley South 95.9 93.9 121.8 152.6 84.6
North Lakes East 51.0 49.9 64.7 81.1 44.9
District Total 330.0 323.0 419.0 525.0 291.0
Those in unsuitable housing
Alston 6.0 5.9 7.6 9.6 5.3
Eden Valley North 81.3 79.6 103.3 129.4 71.7
Eden Valley South 43.0 42.1 54.6 68.4 37.9
North Lakes East 30.3 29.7 38.5 48.3 26.8
District Total 160.7 157.3 204.0 255.7 141.7
Affordable housing need
Alston 4.9 4.8 6.3 7.8 4.3
Eden Valley North 68.1 66.7 86.5 108.4 60.1
Eden Valley South 33.1 32.4 42.1 52.7 29.2
North Lakes East 27.4 26.8 34.8 43.6 24.2
District Total 133.6 130.8 169.7 212.6 117.8
Stage 3: Affordable housing supply
This section collates data from Eden District Council‟s Planning Department on the supply of new housing actual completions and permissions, broken down into market led and affordable housing. Breakdown into tenure within this was not available. In terms of units taken out of supply only „right to buy‟ properties were available.
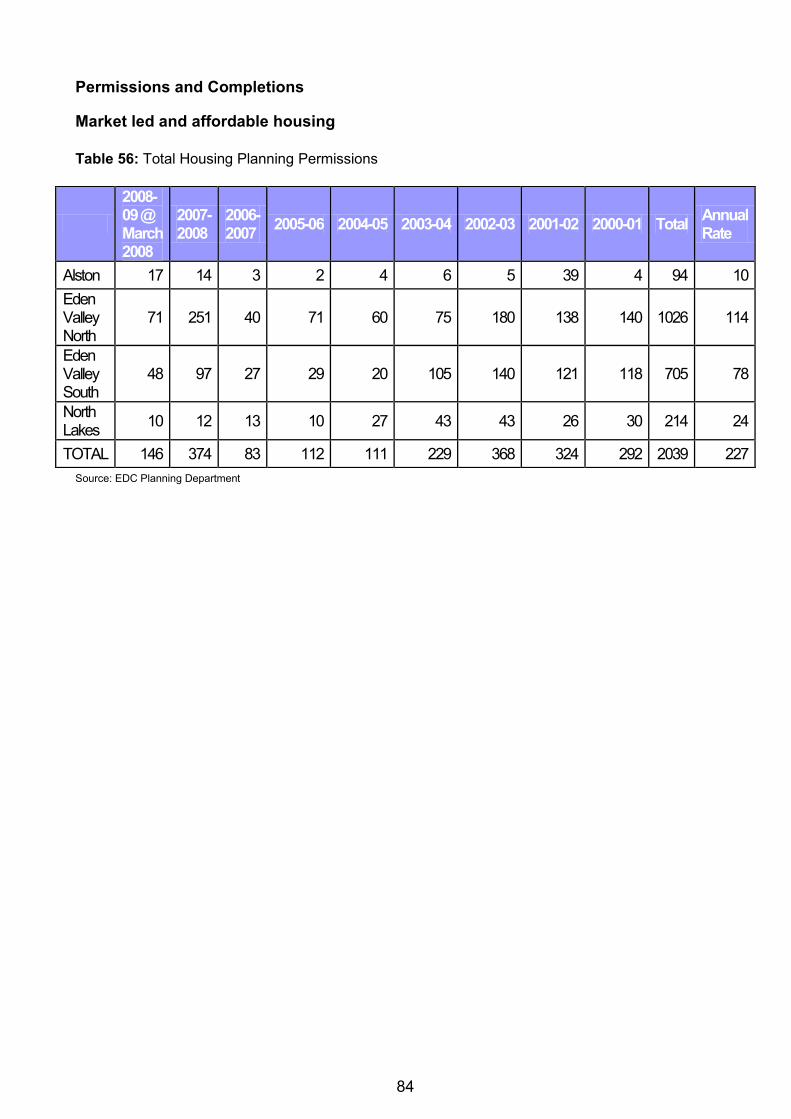
84
Permissions and Completions
Market led and affordable housing
Table 56: Total Housing Planning Permissions
Source: EDC Planning Department
2008-09 @ March 2008
2007-2008
2006-2007
2005-06 2004-05 2003-04 2002-03 2001-02 2000-01 Total Annual Rate
Alston 17 14 3 2 4 6 5 39 4 94 10
Eden Valley North
71 251 40 71 60 75 180 138 140 1026 114
Eden Valley South
48 97 27 29 20 105 140 121 118 705 78
North Lakes
10 12 13 10 27 43 43 26 30 214 24
TOTAL 146 374 83 112 111 229 368 324 292 2039 227
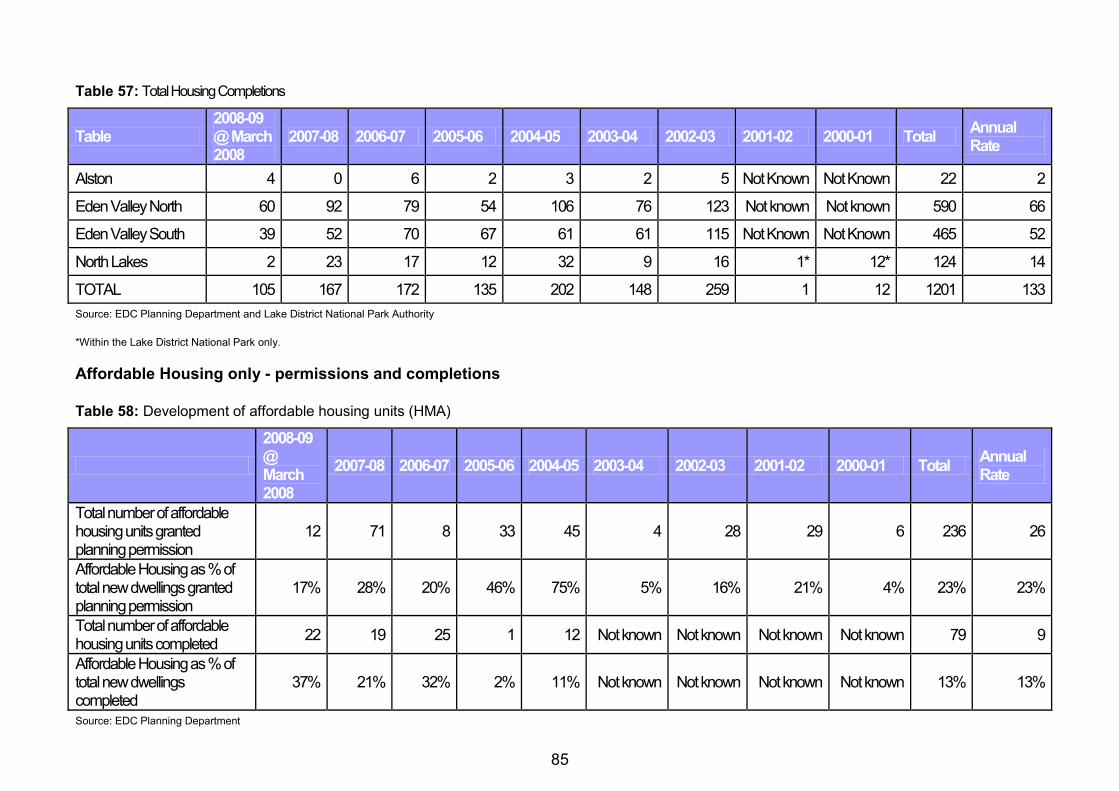
85
Table 57: Total Housing Completions
Table 2008-09 @ March 2008
2007-08 2006-07 2005-06 2004-05 2003-04 2002-03 2001-02 2000-01 Total Annual Rate
Alston 4 0 6 2 3 2 5 Not Known Not Known 22 2
Eden Valley North 60 92 79 54 106 76 123 Not known Not known 590 66
Eden Valley South 39 52 70 67 61 61 115 Not Known Not Known 465 52
North Lakes 2 23 17 12 32 9 16 1* 12* 124 14
TOTAL 105 167 172 135 202 148 259 1 12 1201 133
Source: EDC Planning Department and Lake District National Park Authority
*Within the Lake District National Park only.
Affordable Housing only - permissions and completions
Table 58: Development of affordable housing units (HMA)
2008-09 @ March 2008
2007-08 2006-07 2005-06 2004-05 2003-04 2002-03 2001-02 2000-01 Total Annual Rate
Total number of affordable housing units granted planning permission
12 71 8 33 45 4 28 29 6 236 26
Affordable Housing as % of total new dwellings granted planning permission
17% 28% 20% 46% 75% 5% 16% 21% 4% 23% 23%
Total number of affordable housing units completed
22 19 25 1 12 Not known Not known Not known Not known 79 9
Affordable Housing as % of total new dwellings completed
37% 21% 32% 2% 11% Not known Not known Not known Not known 13% 13%
Source: EDC Planning Department
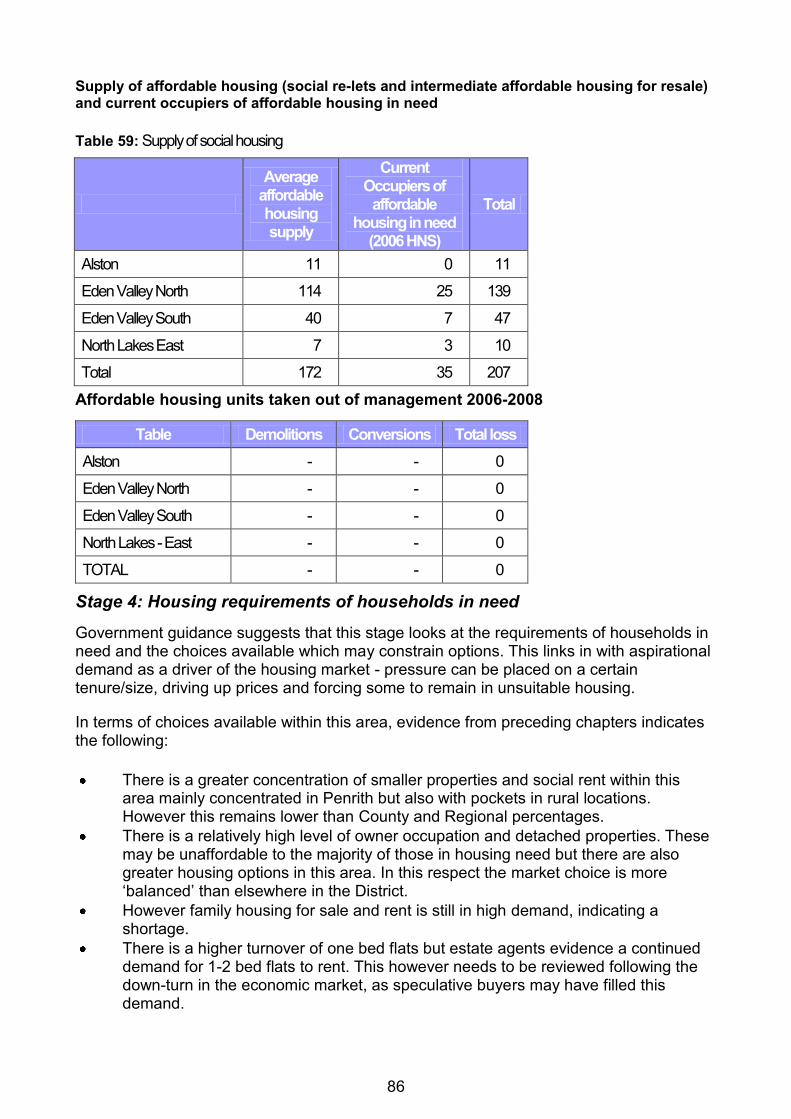
86
Supply of affordable housing (social re-lets and intermediate affordable housing for resale) and current occupiers of affordable housing in need
Table 59: Supply of social housing
Average affordable housing supply
Current Occupiers of
affordable housing in need
(2006 HNS)
Total
Alston 11 0 11
Eden Valley North 114 25 139
Eden Valley South 40 7 47
North Lakes East 7 3 10
Total 172 35 207
Affordable housing units taken out of management 2006-2008
Table Demolitions Conversions Total loss
Alston - - 0
Eden Valley North - - 0
Eden Valley South - - 0
North Lakes - East - - 0
TOTAL - - 0
Stage 4: Housing requirements of households in need
Government guidance suggests that this stage looks at the requirements of households in need and the choices available which may constrain options. This links in with aspirational demand as a driver of the housing market - pressure can be placed on a certain tenure/size, driving up prices and forcing some to remain in unsuitable housing.
In terms of choices available within this area, evidence from preceding chapters indicates the following:
There is a greater concentration of smaller properties and social rent within this area mainly concentrated in Penrith but also with pockets in rural locations. However this remains lower than County and Regional percentages.
There is a relatively high level of owner occupation and detached properties. These may be unaffordable to the majority of those in housing need but there are also greater housing options in this area. In this respect the market choice is more „balanced‟ than elsewhere in the District.
However family housing for sale and rent is still in high demand, indicating a shortage.
There is a higher turnover of one bed flats but estate agents evidence a continued demand for 1-2 bed flats to rent. This however needs to be reviewed following the down-turn in the economic market, as speculative buyers may have filled this demand.
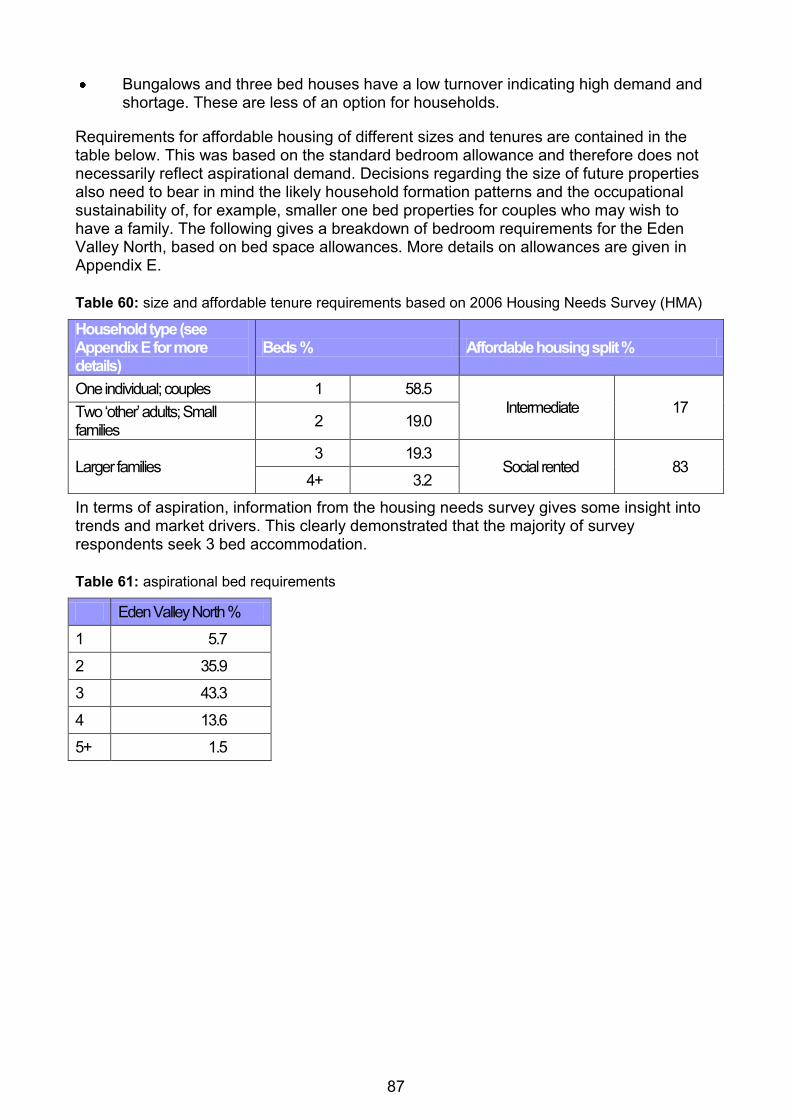
87
Bungalows and three bed houses have a low turnover indicating high demand and shortage. These are less of an option for households.
Requirements for affordable housing of different sizes and tenures are contained in the table below. This was based on the standard bedroom allowance and therefore does not necessarily reflect aspirational demand. Decisions regarding the size of future properties also need to bear in mind the likely household formation patterns and the occupational sustainability of, for example, smaller one bed properties for couples who may wish to have a family. The following gives a breakdown of bedroom requirements for the Eden Valley North, based on bed space allowances. More details on allowances are given in Appendix E.
Table 60: size and affordable tenure requirements based on 2006 Housing Needs Survey (HMA)
Household type (see Appendix E for more details)
Beds % Affordable housing split %
One individual; couples 1 58.5 Intermediate 17 Two „other‟ adults; Small
families 2 19.0
Larger families 3 19.3
Social rented 83 4+ 3.2
In terms of aspiration, information from the housing needs survey gives some insight into trends and market drivers. This clearly demonstrated that the majority of survey respondents seek 3 bed accommodation.
Table 61: aspirational bed requirements
Eden Valley North %
1 5.7
2 35.9
3 43.3
4 13.6
5+ 1.5
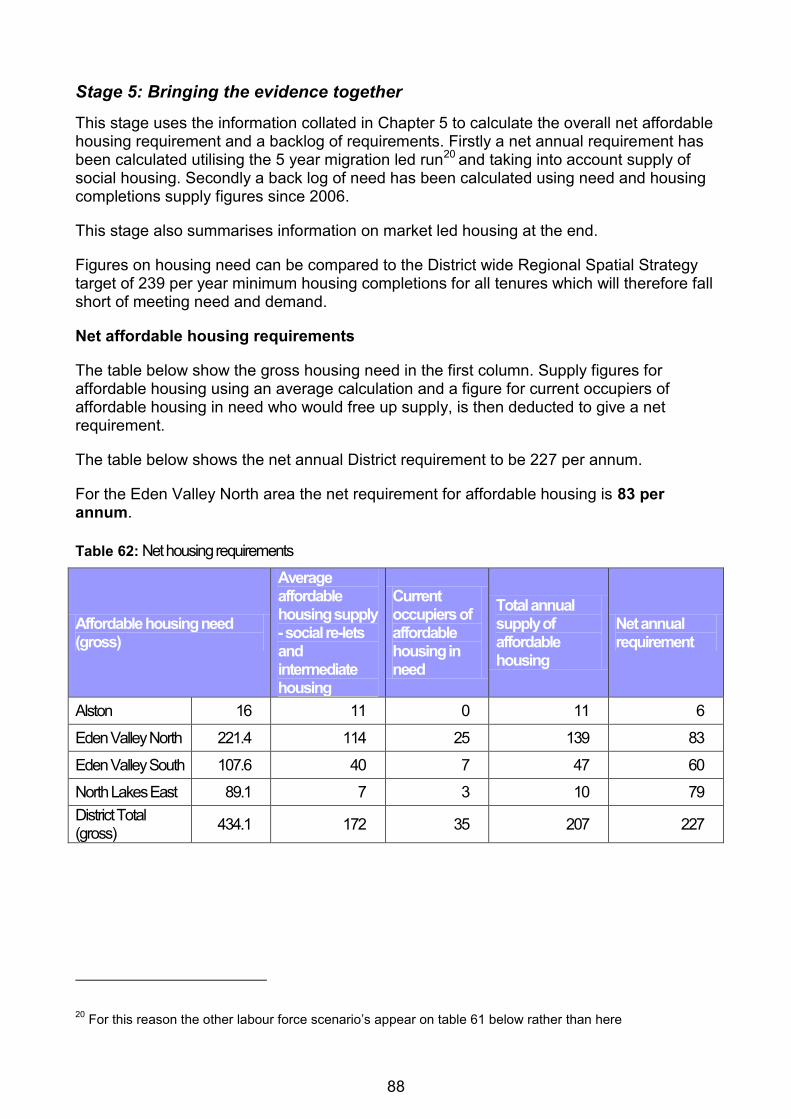
88
Stage 5: Bringing the evidence together
This stage uses the information collated in Chapter 5 to calculate the overall net affordable housing requirement and a backlog of requirements. Firstly a net annual requirement has been calculated utilising the 5 year migration led run20 and taking into account supply of social housing. Secondly a back log of need has been calculated using need and housing completions supply figures since 2006.
This stage also summarises information on market led housing at the end.
Figures on housing need can be compared to the District wide Regional Spatial Strategy target of 239 per year minimum housing completions for all tenures which will therefore fall short of meeting need and demand.
Net affordable housing requirements
The table below show the gross housing need in the first column. Supply figures for affordable housing using an average calculation and a figure for current occupiers of affordable housing in need who would free up supply, is then deducted to give a net requirement.
The table below shows the net annual District requirement to be 227 per annum.
For the Eden Valley North area the net requirement for affordable housing is 83 per annum.
Table 62: Net housing requirements
Affordable housing need (gross)
Average affordable housing supply - social re-lets and intermediate housing
Current occupiers of affordable housing in need
Total annual supply of affordable housing
Net annual requirement
Alston 16 11 0 11 6
Eden Valley North 221.4 114 25 139 83
Eden Valley South 107.6 40 7 47 60
North Lakes East 89.1 7 3 10 79
District Total (gross)
434.1 172 35 207 227
20 For this reason the other labour force scenario‟s appear on table 61 below rather than here
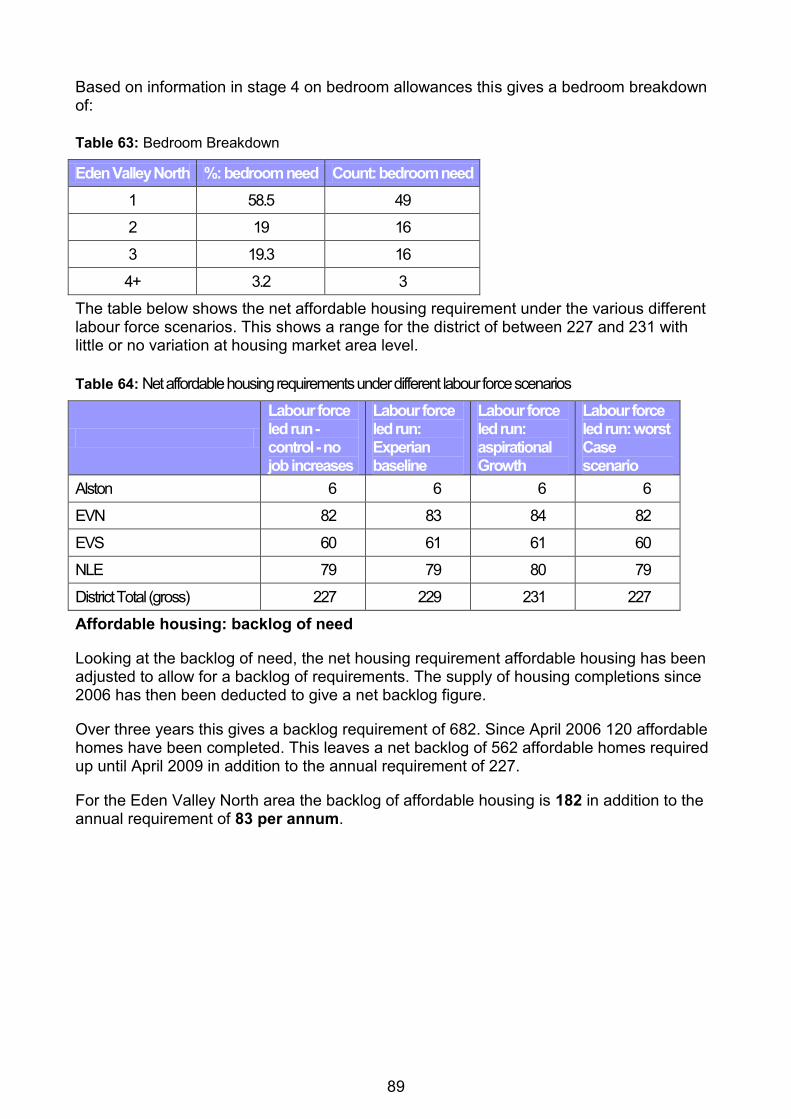
89
Based on information in stage 4 on bedroom allowances this gives a bedroom breakdown of:
Table 63: Bedroom Breakdown
Eden Valley North %: bedroom need Count: bedroom need
1 58.5 49
2 19 16
3 19.3 16
4+ 3.2 3
The table below shows the net affordable housing requirement under the various different labour force scenarios. This shows a range for the district of between 227 and 231 with little or no variation at housing market area level.
Table 64: Net affordable housing requirements under different labour force scenarios
Labour force led run - control - no job increases
Labour force led run: Experian baseline
Labour force led run: aspirational Growth
Labour force led run: worst Case scenario
Alston 6 6 6 6
EVN 82 83 84 82
EVS 60 61 61 60
NLE 79 79 80 79
District Total (gross) 227 229 231 227
Affordable housing: backlog of need
Looking at the backlog of need, the net housing requirement affordable housing has been adjusted to allow for a backlog of requirements. The supply of housing completions since 2006 has then been deducted to give a net backlog figure.
Over three years this gives a backlog requirement of 682. Since April 2006 120 affordable homes have been completed. This leaves a net backlog of 562 affordable homes required up until April 2009 in addition to the annual requirement of 227.
For the Eden Valley North area the backlog of affordable housing is 182 in addition to the annual requirement of 83 per annum.
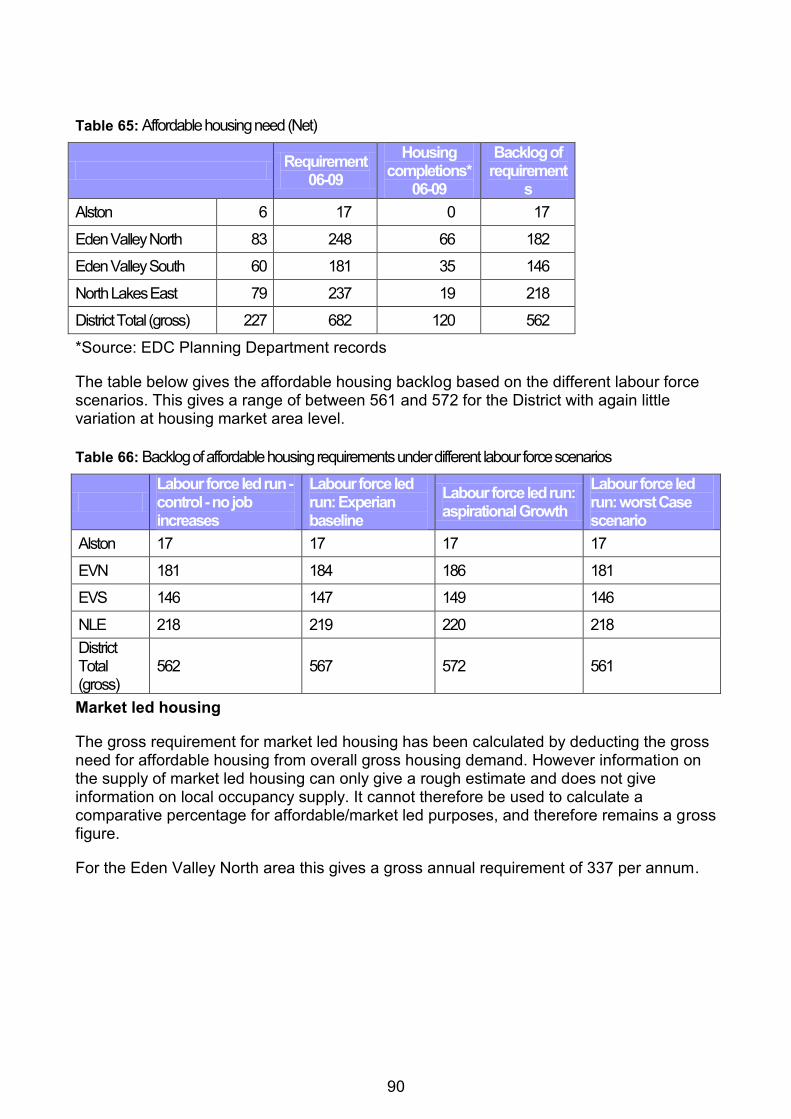
90
Table 65: Affordable housing need (Net)
Requirement
06-09
Housing completions*
06-09
Backlog of requirement
s
Alston 6 17 0 17
Eden Valley North 83 248 66 182
Eden Valley South 60 181 35 146
North Lakes East 79 237 19 218
District Total (gross) 227 682 120 562
*Source: EDC Planning Department records
The table below gives the affordable housing backlog based on the different labour force scenarios. This gives a range of between 561 and 572 for the District with again little variation at housing market area level.
Table 66: Backlog of affordable housing requirements under different labour force scenarios
Labour force led run - control - no job increases
Labour force led run: Experian baseline
Labour force led run: aspirational Growth
Labour force led run: worst Case scenario
Alston 17 17 17 17
EVN 181 184 186 181
EVS 146 147 149 146
NLE 218 219 220 218
District Total (gross)
562 567 572 561
Market led housing
The gross requirement for market led housing has been calculated by deducting the gross need for affordable housing from overall gross housing demand. However information on the supply of market led housing can only give a rough estimate and does not give information on local occupancy supply. It cannot therefore be used to calculate a comparative percentage for affordable/market led purposes, and therefore remains a gross figure.
For the Eden Valley North area this gives a gross annual requirement of 337 per annum.
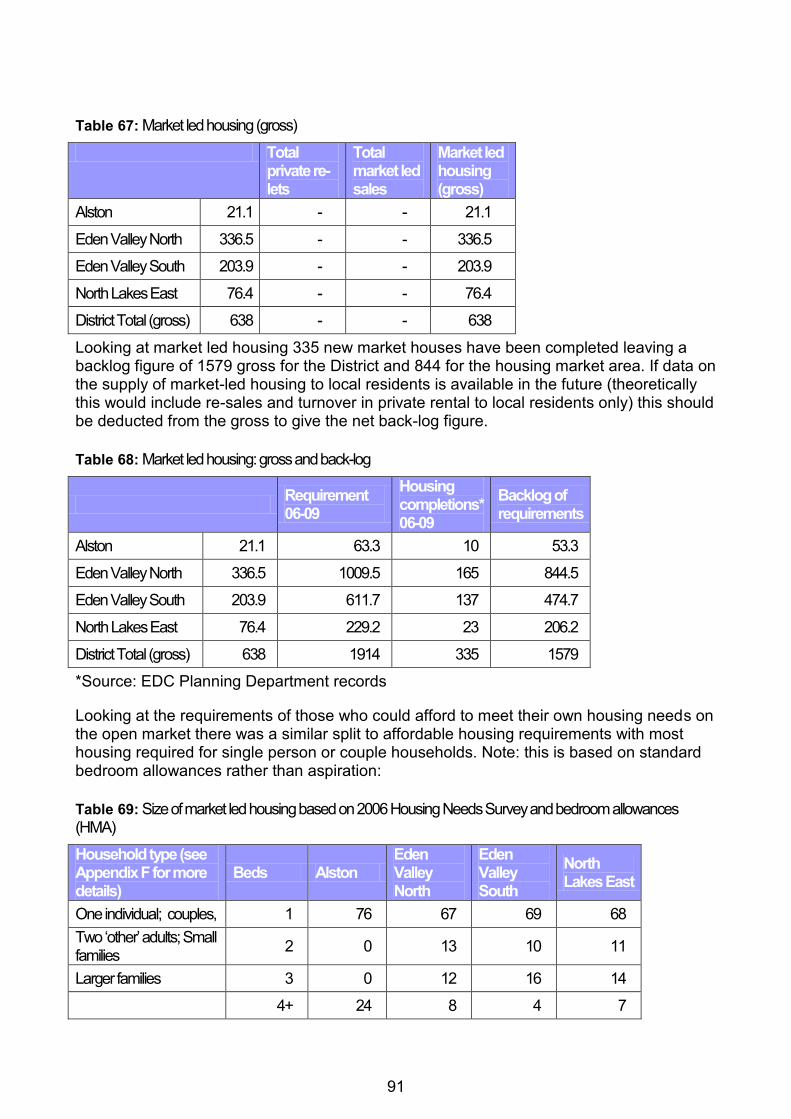
91
Table 67: Market led housing (gross)
Total private re-lets
Total market led sales
Market led housing (gross)
Alston 21.1 - - 21.1
Eden Valley North 336.5 - - 336.5
Eden Valley South 203.9 - - 203.9
North Lakes East 76.4 - - 76.4
District Total (gross) 638 - - 638
Looking at market led housing 335 new market houses have been completed leaving a backlog figure of 1579 gross for the District and 844 for the housing market area. If data on the supply of market-led housing to local residents is available in the future (theoretically this would include re-sales and turnover in private rental to local residents only) this should be deducted from the gross to give the net back-log figure.
Table 68: Market led housing: gross and back-log
Requirement 06-09
Housing completions* 06-09
Backlog of requirements
Alston 21.1 63.3 10 53.3
Eden Valley North 336.5 1009.5 165 844.5
Eden Valley South 203.9 611.7 137 474.7
North Lakes East 76.4 229.2 23 206.2
District Total (gross) 638 1914 335 1579
*Source: EDC Planning Department records
Looking at the requirements of those who could afford to meet their own housing needs on the open market there was a similar split to affordable housing requirements with most housing required for single person or couple households. Note: this is based on standard bedroom allowances rather than aspiration:
Table 69: Size of market led housing based on 2006 Housing Needs Survey and bedroom allowances (HMA)
Household type (see Appendix F for more details)
Beds Alston Eden Valley North
Eden Valley South
North Lakes East
One individual; couples, 1 76 67 69 68
Two „other‟ adults; Small families
2 0 13 10 11
Larger families 3 0 12 16 14
4+ 24 8 4 7
92
Key issues for future policy strategy and joining up across the assessment
Based on the issues presented in preceding chapter‟s policy responses to the above evidence of need for new housing will need to address issues:
High need for affordable housing.
Requirement for starter homes and move-up family accommodation.
The rise in single person households.
Aspirational housing demand for 3 bed accommodation.
Some younger persons accommodation to retain them in the area.
Rise in elderly population and likely accommodation required.
Need to take full account of the availability and suitability of the private market to local residents including vacant dwellings when data is available. Greater intelligence on market data is required.

93
6. Housing Requirements of Specific Household Groups
Supported Housing
This covers homes and housing services for people who need help and support to be able to live as independently as possible within the community. Supported housing is concerned with the housing needs of a diverse range of people based on client groups identified in the Supporting People Strategy, but also those who require accommodation with particular facilities.
Cumbria as a whole has a shortage of supported and move-on accommodation for many client groups, which means that individuals who are ready to progress to more independent living, perhaps with floating support, are often unable to do so. This in turn prevents supported accommodation from being accessed by other people in housing need. There is also a need for more floating support across the county, both generic and in relation to specific client groups.
The provision of housing related support services is increasingly determined by the availability of Supporting People funding. Over the last year the Commissioning Body has agreed a strategy and implemented a review process to ensure resources are targeted and used effectively.
Demand for disabled facilities grants continues to grow. This represents one area in which providing additional facilities to people allows them to remain in their own home and makes better use of existing housing stock.
Current provision is summarised in the tables below.
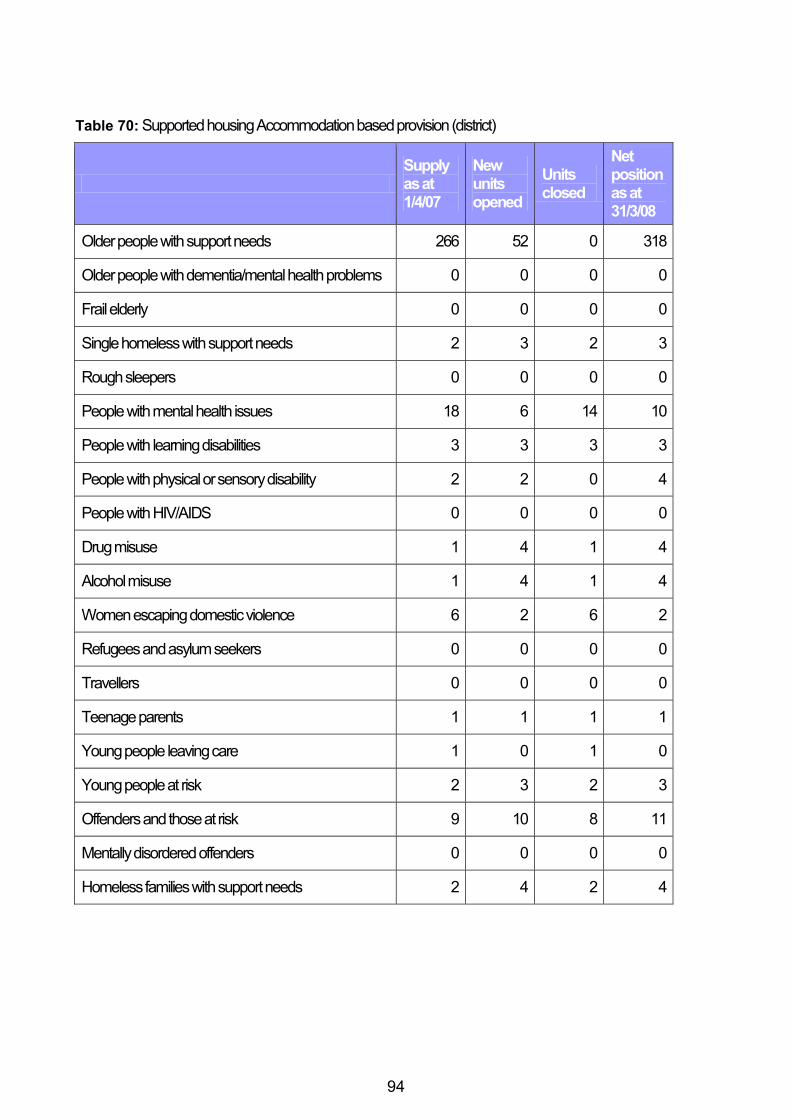
94
Table 70: Supported housing Accommodation based provision (district)
Supply as at 1/4/07
New units opened
Units closed
Net position as at 31/3/08
Older people with support needs 266 52 0 318
Older people with dementia/mental health problems 0 0 0 0
Frail elderly 0 0 0 0
Single homeless with support needs 2 3 2 3
Rough sleepers 0 0 0 0
People with mental health issues 18 6 14 10
People with learning disabilities 3 3 3 3
People with physical or sensory disability 2 2 0 4
People with HIV/AIDS 0 0 0 0
Drug misuse 1 4 1 4
Alcohol misuse 1 4 1 4
Women escaping domestic violence 6 2 6 2
Refugees and asylum seekers 0 0 0 0
Travellers 0 0 0 0
Teenage parents 1 1 1 1
Young people leaving care 1 0 1 0
Young people at risk 2 3 2 3
Offenders and those at risk 9 10 8 11
Mentally disordered offenders 0 0 0 0
Homeless families with support needs 2 4 2 4
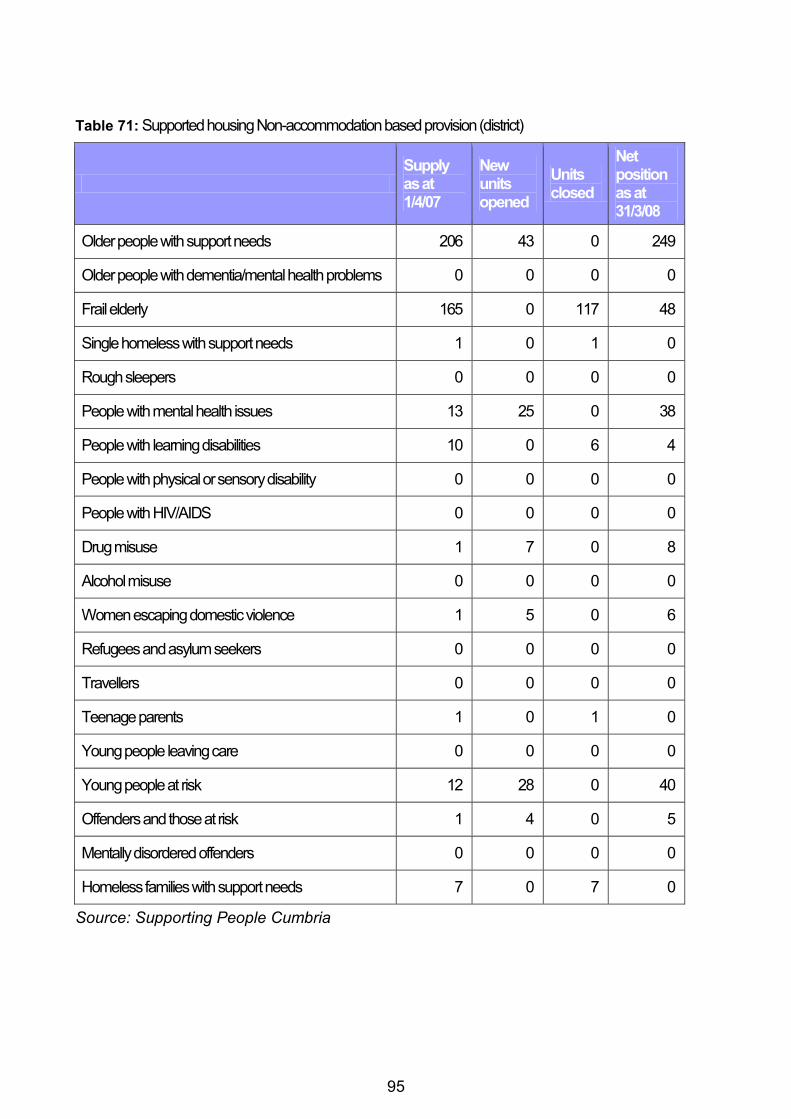
95
Table 71: Supported housing Non-accommodation based provision (district)
Supply as at 1/4/07
New units opened
Units closed
Net position as at 31/3/08
Older people with support needs 206 43 0 249
Older people with dementia/mental health problems 0 0 0 0
Frail elderly 165 0 117 48
Single homeless with support needs 1 0 1 0
Rough sleepers 0 0 0 0
People with mental health issues 13 25 0 38
People with learning disabilities 10 0 6 4
People with physical or sensory disability 0 0 0 0
People with HIV/AIDS 0 0 0 0
Drug misuse 1 7 0 8
Alcohol misuse 0 0 0 0
Women escaping domestic violence 1 5 0 6
Refugees and asylum seekers 0 0 0 0
Travellers 0 0 0 0
Teenage parents 1 0 1 0
Young people leaving care 0 0 0 0
Young people at risk 12 28 0 40
Offenders and those at risk 1 4 0 5
Mentally disordered offenders 0 0 0 0
Homeless families with support needs 7 0 7 0
Source: Supporting People Cumbria
96
The Cumbria Supporting People „Housing Related Support Needs Analysis‟ (May 2008) identified the following client groups as priorities:
Physical Disabilities/sensory impairment
Complex Needs
Alcohol specific
Within this the District Council Priorities have been identified as:
Develop and implement a specialist floating support service.
To work with Social services and other partners to ensure that Disabled Facilities funding is targeted appropriately.
Investigate the need for priority to be given to the development of adapted, accessible housing for people with physical disabilities and learning disabilities.
Further investigate housing options for physically disabled people with care needs as alternatives to residential care.
Ensure all housing association homes are built to lifetime home standards and are wheelchair accessible.
Increase security, on a dispersed basis, the development of new adapted housing association homes where need exists.
At District level questions have been raised regarding the methodology behind the research, and some conclusions were felt to be inconsistent with local knowledge. Further understanding at district level is therefore required to substantiate these findings. The research covers Supporting People funded supply and there are thought to be charitable organisations providing support outside this framework. A full assessment to identify provision is required.
The consultation exercise also raised the need to look at specific client groups such as those with visual impairment, who might have specific needs and where the size, location and design of housing needs to be tailored towards those needs. There is a need to carry out further research into these client-specific issues, in order that needs are not „lost‟ or not identified within wider „disability‟ or „medical need‟ statements (Action for Blind People, SHMA feedback).
Older People
The evidence presented in this report emphasises the need to plan for our increasingly aging population. This will have consequences for the level of services and suitable housing provision. There is likely to be an increase in the number of one person pensioner households in part due to the death of a partner but also due to the increase in separation and divorce. Older people may find it more difficult to live independently because they lack the support of a partner and because their income may be lower. This implies that changes in the situations for elderly people will be come more frequent as this group starts to grow.
In the past many elderly people sought specialised housing in the social rented sector. However given the high incidence of owner occupation in the Eden District it is likely that peoples needs will differ from the current older generation. This will mean an increasing emphasis on helping people to remain in their own homes in the form of adaptations and support services. With the growth of one person households and of pensioner households within this, there may be a demand for small units. However assumptions regarding the

97
size of accommodation need to be treated with caution as there may be an expectation for larger property to accommodate carers and visitors.
There is evidence that older people are disproportionately represented in poor physical housing conditions (Regional Housing Study) and policies to address non-decency standards are therefore required to enable the elderly to remain in their homes in the longer term.
Discussions with housing providers need to explore current provision and likely demand and this is an area where more in depth analysis needs to take place.
Gypsy and Travellers
We specifically need to meet the needs of hard to reach groups and ethnic minorities within the District. Two such groups whose needs are often not met are Gypsies and Travellers.
The Council together with Cumbria County Council and the other Districts carried out a Gypsy and Traveller Accommodation Assessment in 2008. This looked at needs in terms of both static and transient sites. This identified the need for 8 extra residential pitches within the District and thirty-five transit pitches across the County. Detailed proposals and specific policies to address this need will be included as part of the Primary Development Control Policies DPD. Policy CS11 below sets out the criteria for the assessment of any potential site search proposals.
CS11 Provision for Gypsies and Travellers
Appropriate provision for Gypsies and Travellers will be made by identifying specific sites. The suitability of sites will be tested against the following criteria:
Access to schools, shops and other community facilities are within reasonable travelling distance, and can be reached by foot, cycle or public transport.
The site is served (or can be served) by adequate water and sewerage connections.
The amenity of nearby residents or operations of adjoining land uses would not be materially harmed.
The siting and landscaping ensure that any impact upon the character and appearance of the countryside is minimised, and the development can be assimilated into its surroundings.
The development would not materially harm the natural or historic environmental assets of the District.
Homelessness
There is limited data available at housing market level. While it is possible to break data for presentations and acceptances down by HMA, it is not possible to do so for causes of homelessness. The tables below show cases by District, reasons for homelessness by District and number of cases by HMA.
Over all homelessness presentations and acceptances in the District have substantially reduced since the beginning of 2006. Since 2005 the Council has funded a part time Prevention Officer post at Eden Housing Association to provide a first port of call for advice, negotiation with landlords and help securing accommodation in the private sector
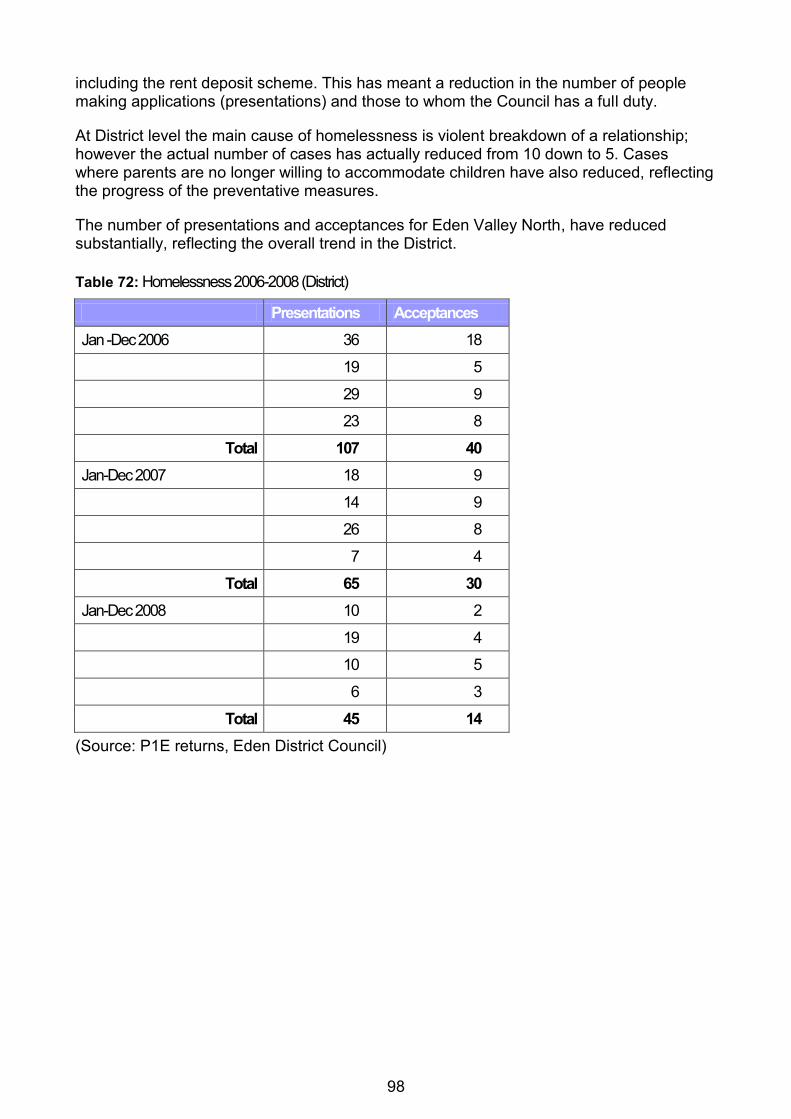
98
including the rent deposit scheme. This has meant a reduction in the number of people making applications (presentations) and those to whom the Council has a full duty.
At District level the main cause of homelessness is violent breakdown of a relationship; however the actual number of cases has actually reduced from 10 down to 5. Cases where parents are no longer willing to accommodate children have also reduced, reflecting the progress of the preventative measures.
The number of presentations and acceptances for Eden Valley North, have reduced substantially, reflecting the overall trend in the District.
Table 72: Homelessness 2006-2008 (District)
Presentations Acceptances
Jan -Dec 2006 36 18
19 5
29 9
23 8
Total 107 40
Jan-Dec 2007 18 9
14 9
26 8
7 4
Total 65 30
Jan-Dec 2008 10 2
19 4
10 5
6 3
Total 45 14
(Source: P1E returns, Eden District Council)
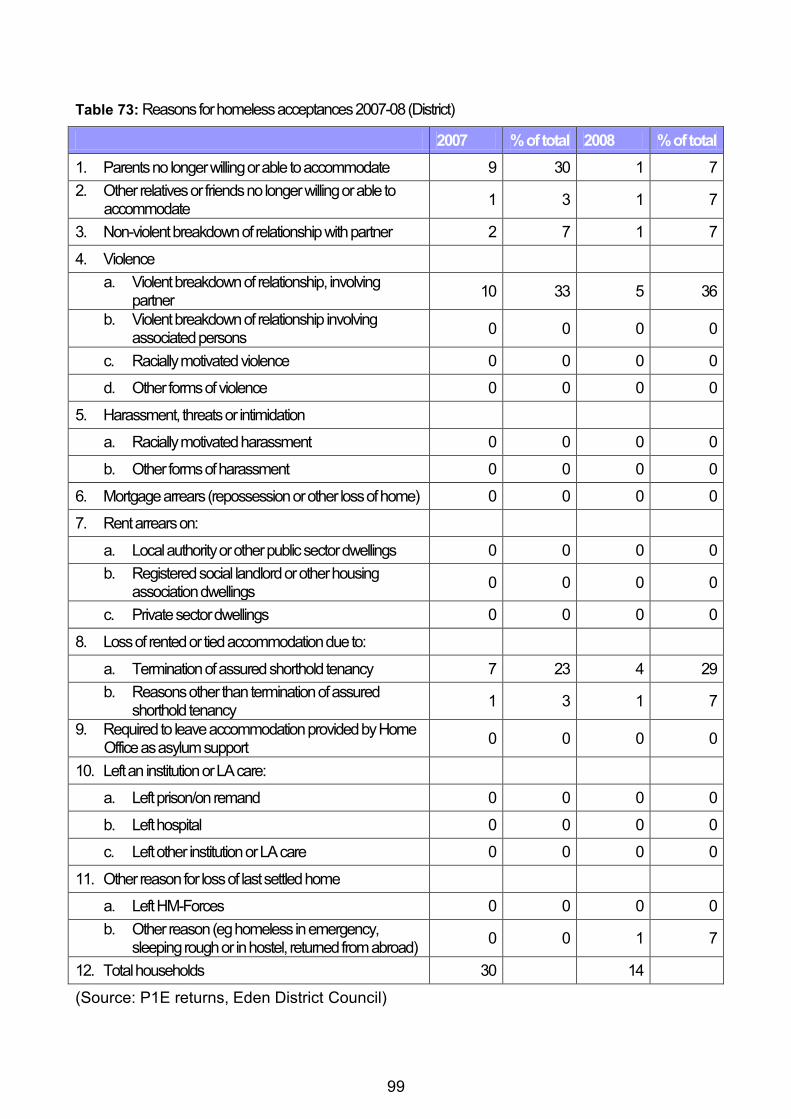
99
Table 73: Reasons for homeless acceptances 2007-08 (District)
2007 % of total 2008 % of total
1. Parents no longer willing or able to accommodate 9 30 1 7
2. Other relatives or friends no longer willing or able to accommodate
1 3 1 7
3. Non-violent breakdown of relationship with partner 2 7 1 7
4. Violence
a. Violent breakdown of relationship, involving partner
10 33 5 36
b. Violent breakdown of relationship involving associated persons
0 0 0 0
c. Racially motivated violence 0 0 0 0
d. Other forms of violence 0 0 0 0
5. Harassment, threats or intimidation
a. Racially motivated harassment 0 0 0 0
b. Other forms of harassment 0 0 0 0
6. Mortgage arrears (repossession or other loss of home) 0 0 0 0
7. Rent arrears on:
a. Local authority or other public sector dwellings 0 0 0 0
b. Registered social landlord or other housing association dwellings
0 0 0 0
c. Private sector dwellings 0 0 0 0
8. Loss of rented or tied accommodation due to:
a. Termination of assured shorthold tenancy 7 23 4 29
b. Reasons other than termination of assured shorthold tenancy
1 3 1 7
9. Required to leave accommodation provided by Home Office as asylum support
0 0 0 0
10. Left an institution or LA care:
a. Left prison/on remand 0 0 0 0
b. Left hospital 0 0 0 0
c. Left other institution or LA care 0 0 0 0
11. Other reason for loss of last settled home
a. Left HM-Forces 0 0 0 0
b. Other reason (eg homeless in emergency, sleeping rough or in hostel, returned from abroad)
0 0 1 7
12. Total households 30 14
(Source: P1E returns, Eden District Council)
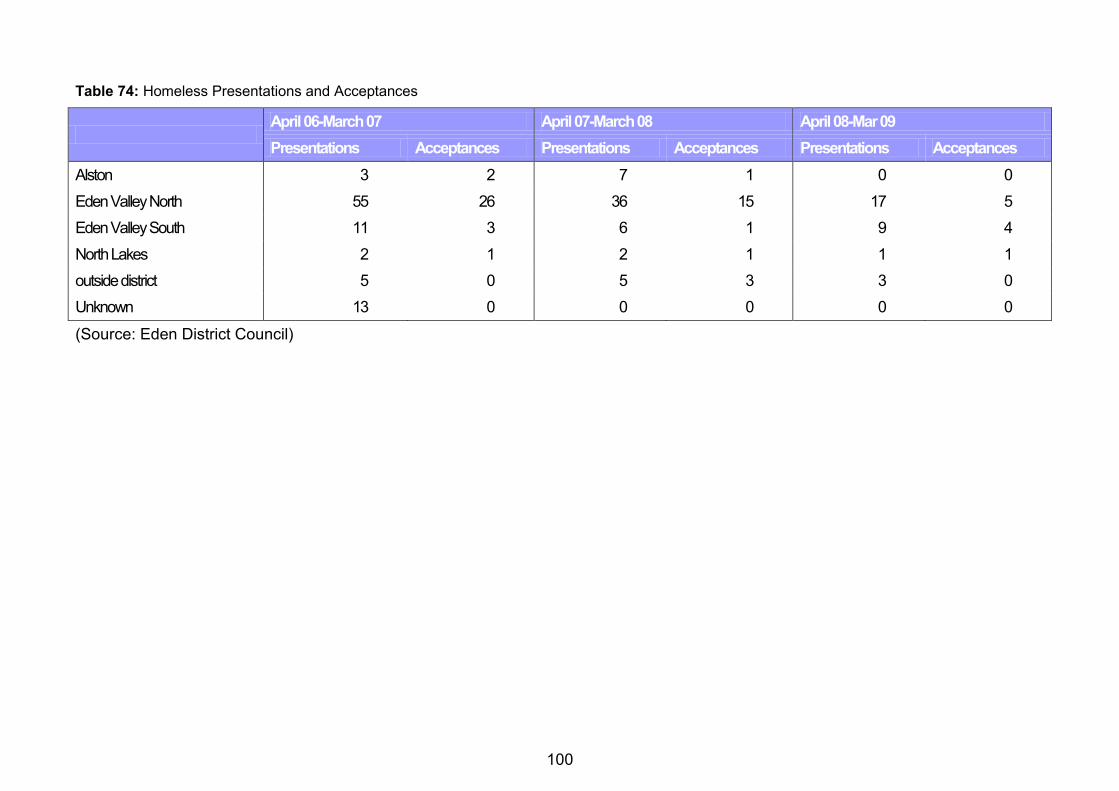
100
Table 74: Homeless Presentations and Acceptances
April 06-March 07 April 07-March 08 April 08-Mar 09
Presentations Acceptances Presentations Acceptances Presentations Acceptances
Alston 3 2 7 1 0 0
Eden Valley North 55 26 36 15 17 5
Eden Valley South 11 3 6 1 9 4
North Lakes 2 1 2 1 1 1
outside district 5 0 5 3 3 0
Unknown 13 0 0 0 0 0
(Source: Eden District Council)
101
7. Report Conclusions - Bringing the evidence together
This report has examined recent trends in the Eden Valley North housing market area and placed this in the context of Cumbria and the Eden District. It has looked at possible developments in the market and the effects of economic changes. From this an estimate of housing requirements has been made broken down by size, tenure and type. Further examination of specific groups has also been made. The following brings together the evidence in preceding chapters to draw overall conclusions regarding housing needs that will influence the direction of future policy and strategy.
Cumbria is often seen as an affluent area but the local housing market assessments highlight areas of deprivation. While property prices are high and there are high wage earners living here this masks problems of affordability for local resident‟s dependant on local wages.
The Regional study points to factors including drivers pushing migration out from larger centres and factors pulling people to more rural areas and it is the most affluent who are moving out. Historically this has certainly been felt within the Eden District housing markets with the in-immigration of more affluent households and retirees choosing to relocate here.
The study further characterises the housing markets in Cumbria as follows:
Generally weak local economies expressed through low incomes, except for those people not dependant on the local labour market for resources.
An aging population fuelled by out-migration of younger people (caused by lack of higher education institutions, graduate employment opportunities, and affordable housing) and continuing in migration of older retirees/people seeking a high quality lifestyle.
High proportions of second and holiday homes, reducing the size of the effectively available housing stock.
Large social housing waiting lists, and high proportions of concealed households, brought about not only by high demand from those on low incomes but by a very limited supply.
A significant degree of difference between the core and the periphery of the sub-region. The central area has a function based around tourism and retirement migration. The western coastal strip from Barrow, Dalton and Askham to Carlisle is struggling to establish a new economic function following the decline of older mining and manufacturing industries, and contains some areas of intense deprivation. The eastern periphery has high demand from tourism and in migration, but also a significant agricultural sector.
Current trends across the North West point to a continuing fall in house prices which may continue for the next two to three years. In some areas in the Eden District there is clear evidence of some falling house prices. However even with a 10% reduction entry level prices remain unaffordable to people on lower incomes. Furthermore in areas where the property market has been strong and stable in the past, people are reluctant to sell at a reduced value and are tending to „sit out‟ the current economic climate - the picture here is one of a static rather than falling housing market. This may change if people need to sell urgently to move for employment opportunities, but this is unlikely to impact sufficiently on the supply of affordable housing and in the short term the effects of the „credit crunch‟ will

102
impact negatively on people unable to access finance and therefore increase the immediate pressure on the social and private rented stock.
The extent of the current economic climate on investors and property developers in the Penrith area is uncertain but it is possible that speculative investors may take advantage of reduced prices. This makes it harder for those on lower incomes to enter home ownership, and therefore face longer period in private and social rented sectors or intermediate housing if this is an option. In addition the town in particular may feel the effects of the University expansion which may further reduce the availability of low cost private rental.
In the long term there are clear linkages between housing supply and economic development. The economy needs a sufficient workforce in order to grow which in term needs suitable accommodation. In this sense economic development and housing are mutually supportive. This has the most direct effect on Penrith and the Eden Valley North area but its effects and implications are felt throughout the District.
The evidence presented here points to a skilled workforce in poorly paid jobs and also to residents in professional occupations commuting out of the District. There is also some evidence of recruitment problems in elementary occupations. An insufficient workforce to maximise full economic growth opportunities is likely to be compounded by out migration of younger people and an aging workforce. While this may be mitigated by better pay awards to encourage residents to work here and the choice to continue working past retirement age, the extent and long term effect of these factors are not known. In the immediate future affordable housing for people on low incomes wishing to remain in the District and start families is required to discourage further out migration.
Given the evidence on incomes the majority of affordable housing needs to be initially pitched towards social rental. However while the Penrith area represents a more balanced housing ladder with lower cost housing for home ownership than elsewhere in the District some low cost home ownership is required to maintain the „middle rung‟ and prevent the increasing number of people on the bottom rung from being trapped even as their economic prospects improve.
Perhaps most significantly the population will age over the next two decades with crucial implications for specialised housing and services. Property that is or can be adapted to enable independent living is required in locations that are accessible. It has been noted above that the rise in one person households is in part due to the aging population through the death of a partner but also through increasing levels of separation and divorce. Therefore while the current level of single person households headed by pensioners over sixty is 15% this element is likely to rise. However assumptions regarding the size of units for the elderly needs further evidence as expectations may be for larger two bed properties to accommodate carers and visitors. Given the higher proportion of homes owned outright in the District as a whole it is possible people will be able to afford additional space but discussions with housing providers should begin to explore options.
The propensity to form smaller households might lead to the conclusion that there is a need to focus on one bed units. However this trend does not necessarily reflect a younger generation remaining in the area - there has also been an out migration of smaller, younger households as they move for employment or education. There is also a high turnover of one bed flats which indicates that these properties do not suit occupants in the long term. Furthermore the propensity to form co-habiting households and later families needs consideration. Longer term sustainability is more likely to be achieved by the concentration on two bedroom accommodation that would be more appealing, have
103
greater flexibility for changing life styles and a longer occupation expectancy which applies to both affordable and market led housing. This would support economic growth measures by encouraging people to remain in the District, maintain the workforce, and which in turn would benefit residents.
Further research is needed on:
The level of industries based in rural areas within the HMAs at a more local level.
Further cross analysis on employment structure and incomes - are the skilled trades well or poorly paid?
Monitoring of the supply side effects of Southend Road.
Local evidence (village level) on the incidence of holiday/second homes.
The housing and support needs of elderly residents.
Further research into the supply and needs for supported accommodation.
Monitoring and updating of the assessment
The SHMA Guidance recommends that partnerships undertake a comprehensive assessment no more than every five years but that trends and activities in the market areas should be monitored regularly against policy aims. In addition the information contained in the SHMAs should be updated. This will be carried out in conjunction with Planning departments/authorities. To achieve this aim and provide a framework for updating SHMAs a set of indicators have been developed listed in appendix B.
Bibliography
Cumbria Economic Bulletin, 2007, Cumbria Intelligence Unit.
Regeneris, NWRA, 2008
Penrith Housing Study, Land Use Consultants and Jacqueline Blenkinship, March 2006.
North West Regional Strategic Housing Assessment, (Philip Leather Associates) 4NW, 2008.
104
List of Tables
Table 1: Age Range July 2008 ................................................................................... 11
Table 2: Household Type ............................................................................................ 11
Table 3: Ethnic Group ................................................................................................. 12
Table 4: Economic Activity 2001 ................................................................................. 23
Table 5: Looking after home, Sick or disabled ............................................................ 24
Table 6: Gross Value Added per head of population GVA as % of UK average ........................................................................................... 25
Table 7: JSA Claimants monthly count July 2008 ....................................................... 25
Table 8: JSA Claimant Count (yearly average) ........................................................... 26
Table 9: Occupation level 2006/2007 ......................................................................... 28
Table 10: HMA Occupation level 2001 ......................................................................... 29
Table 11: Industry of Employment: Count and Percentage 2006-7 (work based) including 2003 comparator ...................................................... 31
Table 12: Industry of Employment: Count and Percentage Jan 07-Dec 07 (residence based) ......................................................................................... 32
Table 13: NVQ Qualifications ....................................................................................... 32
Table 14: Live unfilled vacancies by occupation - Aug 2008 ........................................ 34
Table 15: Live unfilled vacancies by industry - Aug 2008 ............................................. 34
Table 16: Median and Lower Quartile Incomes ............................................................ 36
Table 17: Gross weekly median pay by place of residence 2005-07 ............................ 36
Table 18: Gross weekly pay by place of residence (mean and median) % change 2005-07 ........................................................................................ 36
Table 19 Deprived Areas - Ranks ................................................................................ 37
Table 20: Tenure .......................................................................................................... 42
Table 21: Property Type ............................................................................................... 43
Table 22: House Size ................................................................................................... 43
Table 23: District Decent Homes March 2008 .............................................................. 44
Table 24: HMA Empty properties .................................................................................. 44
Table 25: Communal Establishments and HMOs ......................................................... 45
Table 26: House Price/Household Income 2008 .......................................................... 46
Table 27: House prices in Eden Valley North HMA, Cumbria County 2005-2008 and to Income Ratio 2008 ............................................................................. 47
Table 28: Private and Social sector rents - based on district wide rent figures and HMA median incomes 2008 ................................................................... 48
Table 29: Occupancy Rates ......................................................................................... 50
Table 30: Access to Social Rented Housing ................................................................. 51
Table 31: Second and Vacant Dwellings ...................................................................... 52
Table 32: Second and Vacant Dwellings (Council Tax Registrations 2008) ................. 52
Table 33: Zero net migration ......................................................................................... 57
Table 34: 5 Year migration led run ............................................................................... 57
Table 35: 5 Year dwelling led ....................................................................................... 58
Table 36: Dwelling led based on RSS .......................................................................... 58
105
Table 37: District Age range changes 2008-2031 ......................................................... 59
Table 38: District households projections (Regional SHMA 2008) ............................... 61
Table 39: HMA Household projections (Regional SHMA 2008) .................................... 62
Table 40: Baseline, Aspirational and Worst Case Scenario Employment Growth, 2006-2016 .................................................................. 65
Table 41: Baseline, Aspirational and Worst Case Scenario GVA Growth, 2006-2016 .............................................................................. 66
Table 42: Baseline, Aspirational and Worst Case Scenario Employment Growth, 2006-2016 .................................................................. 68
Table 43: Baseline, Aspirational and Worst Case Scenario GVA Growth, 2006-2016 .............................................................................. 69
Table 44: Scenario 1: Labour Force Led, No Change .................................................. 71
Table 45: Scenario 2: Labour Force Led, Experian Baseline........................................ 72
Table 46: Scenario 3: Labour Force Led, Aspirational Growth ..................................... 72
Table 47: Scenario 4: Labour Force Led, Worst Case Scenario ................................... 72
Table 48: Scenario 5: Migration Led, Labour Force Impact .......................................... 72
Table 49: Cumbria-wide Figures ................................................................................... 73
Table 50: Eden Valley North Affordability Matrix .......................................................... 76
Table 51: Updated housing demand, unsuitable housed and affordable housing need ............................................................................... 79
Table 52: Percent split of total new requirements ......................................................... 80
Table 53: Comparisons with labour force scenario growth rates .................................. 80
Table 54: District Requirements based on population growth, household formation, and economic forecasts ............................................. 82
Table 55: Affordable Housing Need .............................................................................. 83
Table 56: Total Housing Planning Permissions ............................................................ 84
Table 57: Total Housing Completions ........................................................................... 85
Table 58: Development of affordable housing units (HMA) .......................................... 85
Table 59: Supply of social housing ............................................................................... 86
Table 60: Size and affordable tenure requirements based on 2006 Housing Needs Survey (HMA) ...................................................................... 87
Table 61: Aspirational bed requirements ...................................................................... 87
Table 62: Net housing requirements ............................................................................. 87
Table 63: Bedroom Breakdown .................................................................................... 89
Table 64: Net affordable housing requirements under different labour force scenarios .................................................................................. 89
Table 65: Affordable housing need (Net) ...................................................................... 90
Table 66: Backlog of affordable housing requirements under different labour force scenarios .................................................................................. 90
Table 67: Market led housing (gross) ........................................................................... 91
Table 68: Market led housing: gross and back-log ....................................................... 91
Table 69: Size of market led housing based on 2006 Housing Needs Survey and bedroom allowances (HMA) ................................................................... 91
Table 70: Supported housing Accommodation based provision (district) ..................... 94
Table 71: Supported housing Non-accommodation based provision (district) .............. 95
106
Table 72: Homelessness 2006-2008 (District) .............................................................. 98
Table 73: Reasons for homeless acceptances 2007-08 (District) ................................. 99
Table 74: Homeless Presentations and Acceptances ................................................ 100
Table 75: Occupation level % 2006-07 ....................................................................... 128
Table 76: Industry of employment 2006-07 (work based) ........................................... 129
Table 77: Breakdown of household types and bedroom requirements for the 2006 Housing Needs Survey ................................................................ 135
List of Graphs
Graph 1: Historic Variation in the UK Interest Rate ..................................................... 14
Graph 2: GVA per head - % difference between North West & UK (current prices) .............................................................................................. 16
Graph 3: Recent development in the housing market .................................................. 18
Graph 4: Indexed GVA per head, 1995-2006 .............................................................. 19
Graph 5: District Age Change 2000-2031 .................................................................... 60
Graph 6: Growth related to scenarios .......................................................................... 73
Graph 7: House Price Index - Cumbria Council ........................................................... 74
Graph 8: House Price and Sales Volume - Cumbria Council ....................................... 75
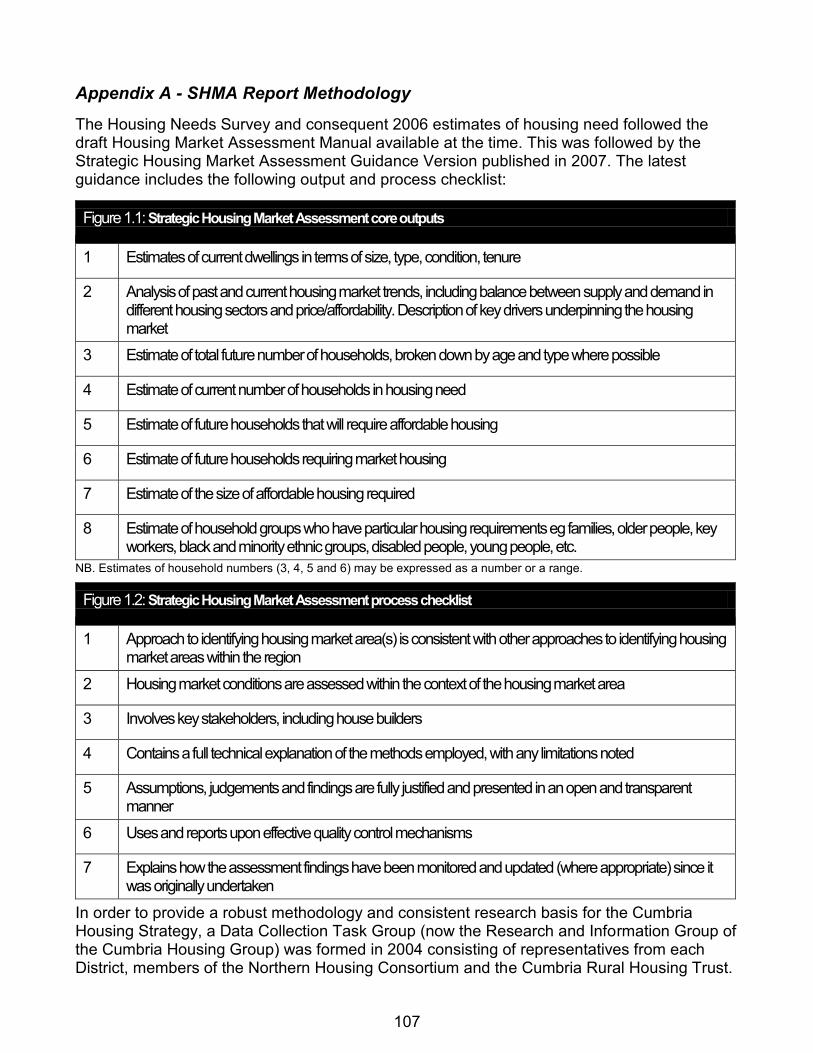
107
Appendix A - SHMA Report Methodology
The Housing Needs Survey and consequent 2006 estimates of housing need followed the draft Housing Market Assessment Manual available at the time. This was followed by the Strategic Housing Market Assessment Guidance Version published in 2007. The latest guidance includes the following output and process checklist:
Figure 1.1: Strategic Housing Market Assessment core outputs
1 Estimates of current dwellings in terms of size, type, condition, tenure
2 Analysis of past and current housing market trends, including balance between supply and demand in different housing sectors and price/affordability. Description of key drivers underpinning the housing market
3 Estimate of total future number of households, broken down by age and type where possible
4 Estimate of current number of households in housing need
5 Estimate of future households that will require affordable housing
6 Estimate of future households requiring market housing
7 Estimate of the size of affordable housing required
8 Estimate of household groups who have particular housing requirements eg families, older people, key workers, black and minority ethnic groups, disabled people, young people, etc.
NB. Estimates of household numbers (3, 4, 5 and 6) may be expressed as a number or a range.
Figure 1.2: Strategic Housing Market Assessment process checklist
1 Approach to identifying housing market area(s) is consistent with other approaches to identifying housing market areas within the region
2 Housing market conditions are assessed within the context of the housing market area
3 Involves key stakeholders, including house builders
4 Contains a full technical explanation of the methods employed, with any limitations noted
5 Assumptions, judgements and findings are fully justified and presented in an open and transparent manner
6 Uses and reports upon effective quality control mechanisms
7 Explains how the assessment findings have been monitored and updated (where appropriate) since it was originally undertaken
In order to provide a robust methodology and consistent research basis for the Cumbria Housing Strategy, a Data Collection Task Group (now the Research and Information Group of the Cumbria Housing Group) was formed in 2004 consisting of representatives from each District, members of the Northern Housing Consortium and the Cumbria Rural Housing Trust.
108
This Group was tasked with the following:
1) Agree common methodology and data sources to enable following surveys to be undertaken:
Local Housing Assessments to include
o Local Housing Needs (affordable, general and special needs clients in a form that also provides evidence for Section 106 agreements
o Housing Market and Affordability Assessment
o Interventions to balance housing market
2) Review information required and carry out countywide assessments of
Household projections
Demographic Structure and projections
Economic Activity and working patterns
3) Produce and agree terms and definitions
4) Any other work to underpin Cumbria Sub Regional Housing Requirement or other themed working groups as advised.
The assessment begun in April 2005, at which point the ODPM issued the Local Housing Assessment: A Practice Guide, Draft, March 2005. A further refined, but still draft Housing Market Assessments: Draft Practice Guidance was issued in December, 2005, and as far as possible was incorporated into the methodology.
Following Guidance, Housing Market Areas were identified with regard to functioning housing markets defined as „the geographical area in which a substantial majority of the employed population both live and work and where those moving house without changing employment choose to stay.‟ (Maclennan et al, 1998 Cited in LHA, ODPM 2005). A number of considerations were taken into account including:
Patterns of relocation within local areas and the degree of self-containment
Travel to work patterns and commuting to centres of employment
Areas of high and low demand
Other information such as recent structure plans and local plans
Group discussion on the appropriate boundaries
Having established Housing Market Areas an assessment of the local housing system was then undertaken, by analysing secondary and primary information within the following stages:
A. Analysis of local housing system (secondary data) B. Assessing future change in household numbers (secondary data) C. Assessing housing need, including the Housing Needs Survey (secondary & primary
data) D. Bringing together a robust evidence base
109
These stages are outlined briefly below, and given in more detail in Appendix 1.
A. Analysis of local housing system
Stage 1: Factors affecting the current housing system
Impact of national and regional economic policy
Demographic structure
Size and structure of local labour force
Local incomes
The cost of buying and renting a property and how this has changed
Output
Trends in employment and occupational structure in the local economy over last 10 years
Population and household numbers and household characteristics in their local housing market and how these have changed over the last 10 years
The main trends in local incomes; and
Recent changes in the relative costs of housing in different tenures
Stage 2: Assessing the current stock of housing
Total number of dwellings
Tenure
House size/type
Condition of stock by tenure
Levels of shared housing and communal establishments
Output
the nature of the current stock of housing, by size, type, location and tenure
the location of current housing stock; and
how the stock has adjusted over the last decade
Stage 3 Indicators of housing demand, pressure and potential housing supply
relative house prices and rents
affordability of housing
occupancy by tenure
vacancy rates by tenure
turnover or churn
assessing available housing supply
Stage 4 Bringing evidence together
understand the balance of the overall stock of dwellings and households and how this has changed in recent years
110
provide evidence of the existing housing stock by size, type, tenure and location
provide evidence of changing house prices and housing demand by size type and location
indicate the extent to which some areas within the local housing market are less popular and/or raise issues of low demand/over supply and why
indicate the extent of demand pressure in terms of market and social housing stock
estimate current affordability by tenure and household incomes; and
identify other issues including stock condition, turnover and over crowding.
B. Assessing future change in household numbers
Stage 1: projecting the future change in household numbers: basic method or other methods
Output
An estimate of the projected household change in terms of age, gender, ethnicity and type
A more sophisticated projection that takes account of local differences
C. Assessing housing need
Stage 1 Defining housing need
what is affordable? Add in ratios
defining unsuitable Add in standards
measuring affordability
assessing household income
assessing whether a household can afford to buy a home Add in example
assessing whether a household can afford to rent a home
assessing whether a household can afford a shared equity property
assessing where should a household be able to live
the needs assessment table (quantitative assessment of housing need for affordable housing)
Stage 2 using secondary and survey data
Output
estimates of the levels of household need; and
estimates of the shortages or surplus of affordable housing needed in terms of different sized units
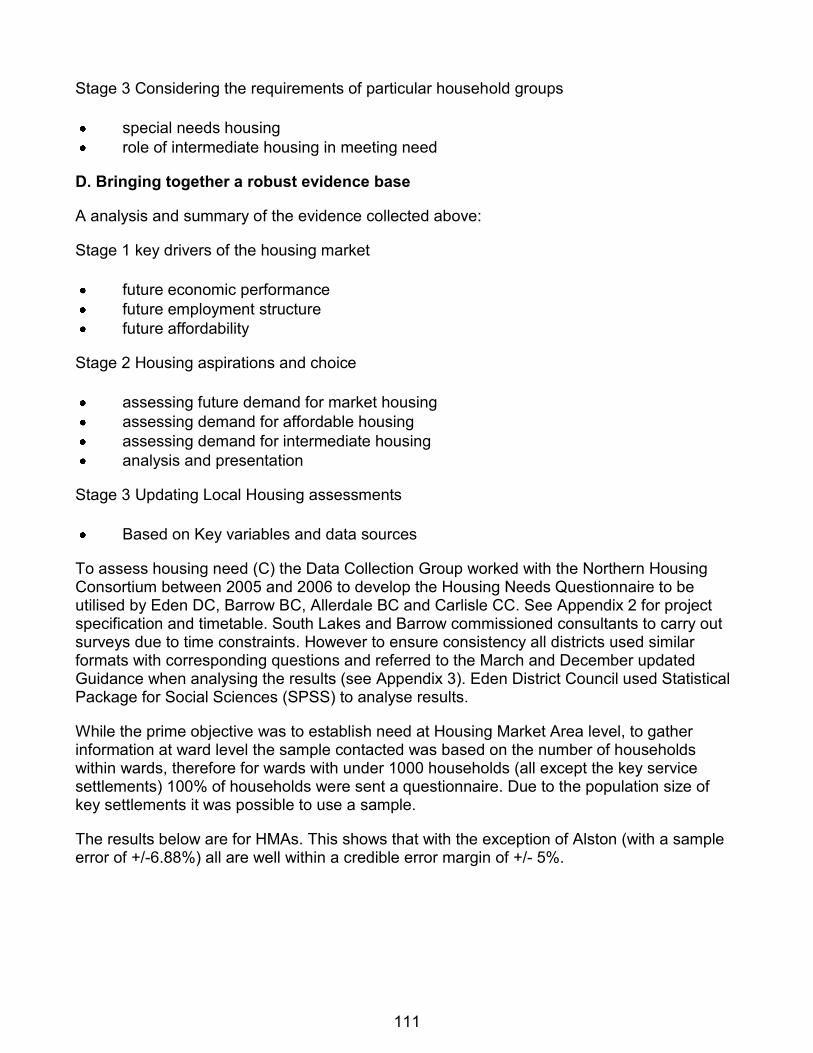
111
Stage 3 Considering the requirements of particular household groups
special needs housing
role of intermediate housing in meeting need
D. Bringing together a robust evidence base
A analysis and summary of the evidence collected above:
Stage 1 key drivers of the housing market
future economic performance
future employment structure
future affordability
Stage 2 Housing aspirations and choice
assessing future demand for market housing
assessing demand for affordable housing
assessing demand for intermediate housing
analysis and presentation
Stage 3 Updating Local Housing assessments
Based on Key variables and data sources
To assess housing need (C) the Data Collection Group worked with the Northern Housing Consortium between 2005 and 2006 to develop the Housing Needs Questionnaire to be utilised by Eden DC, Barrow BC, Allerdale BC and Carlisle CC. See Appendix 2 for project specification and timetable. South Lakes and Barrow commissioned consultants to carry out surveys due to time constraints. However to ensure consistency all districts used similar formats with corresponding questions and referred to the March and December updated Guidance when analysing the results (see Appendix 3). Eden District Council used Statistical Package for Social Sciences (SPSS) to analyse results.
While the prime objective was to establish need at Housing Market Area level, to gather information at ward level the sample contacted was based on the number of households within wards, therefore for wards with under 1000 households (all except the key service settlements) 100% of households were sent a questionnaire. Due to the population size of key settlements it was possible to use a sample.
The results below are for HMAs. This shows that with the exception of Alston (with a sample error of +/-6.88%) all are well within a credible error margin of +/- 5%.
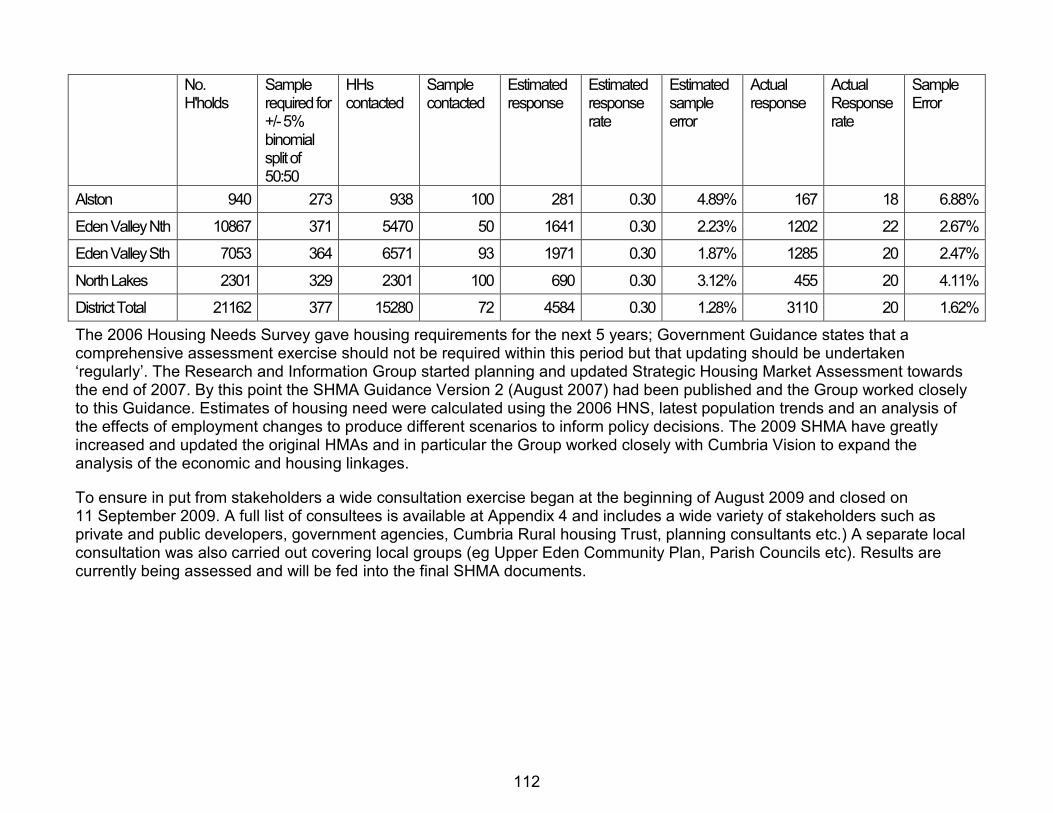
112
No. H'holds
Sample required for +/- 5% binomial split of 50:50
HHs contacted
Sample contacted
Estimated response
Estimated response rate
Estimated sample error
Actual response
Actual Response rate
Sample Error
Alston 940 273 938 100 281 0.30 4.89% 167 18 6.88%
Eden Valley Nth 10867 371 5470 50 1641 0.30 2.23% 1202 22 2.67%
Eden Valley Sth 7053 364 6571 93 1971 0.30 1.87% 1285 20 2.47%
North Lakes 2301 329 2301 100 690 0.30 3.12% 455 20 4.11%
District Total 21162 377 15280 72 4584 0.30 1.28% 3110 20 1.62%
The 2006 Housing Needs Survey gave housing requirements for the next 5 years; Government Guidance states that a comprehensive assessment exercise should not be required within this period but that updating should be undertaken „regularly‟. The Research and Information Group started planning and updated Strategic Housing Market Assessment towards the end of 2007. By this point the SHMA Guidance Version 2 (August 2007) had been published and the Group worked closely to this Guidance. Estimates of housing need were calculated using the 2006 HNS, latest population trends and an analysis of the effects of employment changes to produce different scenarios to inform policy decisions. The 2009 SHMA have greatly increased and updated the original HMAs and in particular the Group worked closely with Cumbria Vision to expand the analysis of the economic and housing linkages.
To ensure in put from stakeholders a wide consultation exercise began at the beginning of August 2009 and closed on 11 September 2009. A full list of consultees is available at Appendix 4 and includes a wide variety of stakeholders such as private and public developers, government agencies, Cumbria Rural housing Trust, planning consultants etc.) A separate local consultation was also carried out covering local groups (eg Upper Eden Community Plan, Parish Councils etc). Results are currently being assessed and will be fed into the final SHMA documents.
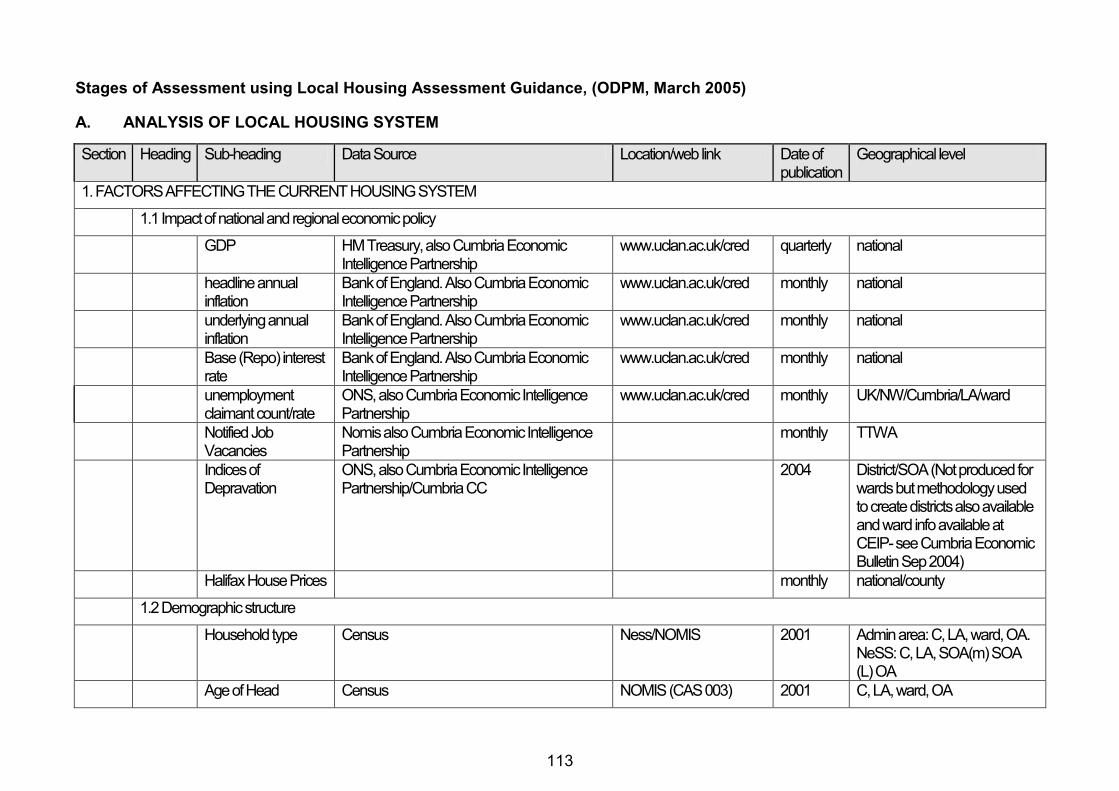
113
Stages of Assessment using Local Housing Assessment Guidance, (ODPM, March 2005)
A. ANALYSIS OF LOCAL HOUSING SYSTEM
Section Heading Sub-heading Data Source Location/web link Date of publication
Geographical level
1. FACTORS AFFECTING THE CURRENT HOUSING SYSTEM
1.1 Impact of national and regional economic policy
GDP HM Treasury, also Cumbria Economic Intelligence Partnership
www.uclan.ac.uk/cred quarterly national
headline annual inflation
Bank of England. Also Cumbria Economic Intelligence Partnership
www.uclan.ac.uk/cred monthly national
underlying annual inflation
Bank of England. Also Cumbria Economic Intelligence Partnership
www.uclan.ac.uk/cred monthly national
Base (Repo) interest rate
Bank of England. Also Cumbria Economic Intelligence Partnership
www.uclan.ac.uk/cred monthly national
unemployment claimant count/rate
ONS, also Cumbria Economic Intelligence Partnership
www.uclan.ac.uk/cred monthly UK/NW/Cumbria/LA/ward
Notified Job Vacancies
Nomis also Cumbria Economic Intelligence Partnership
monthly TTWA
Indices of Depravation
ONS, also Cumbria Economic Intelligence Partnership/Cumbria CC
2004 District/SOA (Not produced for wards but methodology used to create districts also available and ward info available at CEIP- see Cumbria Economic Bulletin Sep 2004)
Halifax House Prices monthly national/county
1.2 Demographic structure
Household type Census Ness/NOMIS 2001 Admin area: C, LA, ward, OA. NeSS: C, LA, SOA(m) SOA (L) OA
Age of Head Census NOMIS (CAS 003) 2001 C, LA, ward, OA
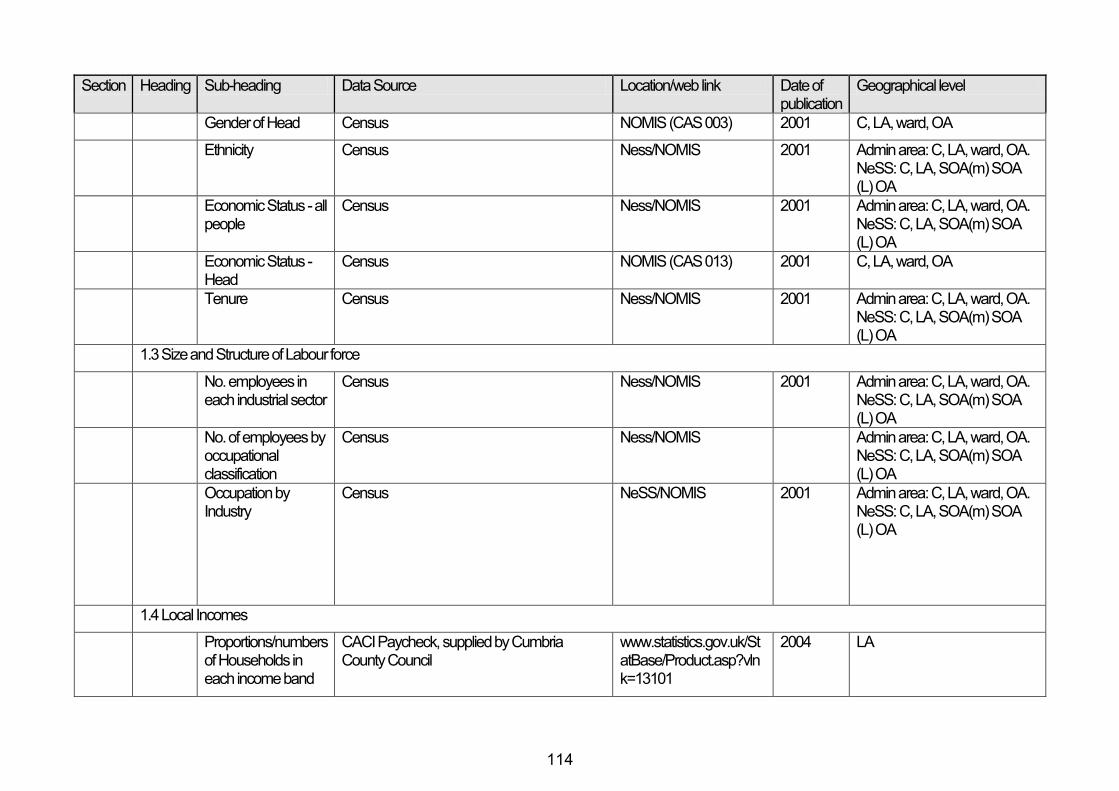
114
Section Heading Sub-heading Data Source Location/web link Date of publication
Geographical level
Gender of Head Census NOMIS (CAS 003) 2001 C, LA, ward, OA
Ethnicity Census Ness/NOMIS 2001 Admin area: C, LA, ward, OA. NeSS: C, LA, SOA(m) SOA (L) OA
Economic Status - all people
Census Ness/NOMIS 2001 Admin area: C, LA, ward, OA. NeSS: C, LA, SOA(m) SOA (L) OA
Economic Status - Head
Census NOMIS (CAS 013) 2001 C, LA, ward, OA
Tenure Census Ness/NOMIS 2001 Admin area: C, LA, ward, OA. NeSS: C, LA, SOA(m) SOA (L) OA
1.3 Size and Structure of Labour force
No. employees in each industrial sector
Census Ness/NOMIS 2001 Admin area: C, LA, ward, OA. NeSS: C, LA, SOA(m) SOA (L) OA
No. of employees by occupational classification
Census Ness/NOMIS Admin area: C, LA, ward, OA. NeSS: C, LA, SOA(m) SOA (L) OA
Occupation by Industry
Census NeSS/NOMIS 2001 Admin area: C, LA, ward, OA. NeSS: C, LA, SOA(m) SOA (L) OA
1.4 Local Incomes
Proportions/numbers of Households in each income band
CACI Paycheck, supplied by Cumbria County Council
www.statistics.gov.uk/StatBase/Product.asp?vlnk=13101
2004 LA
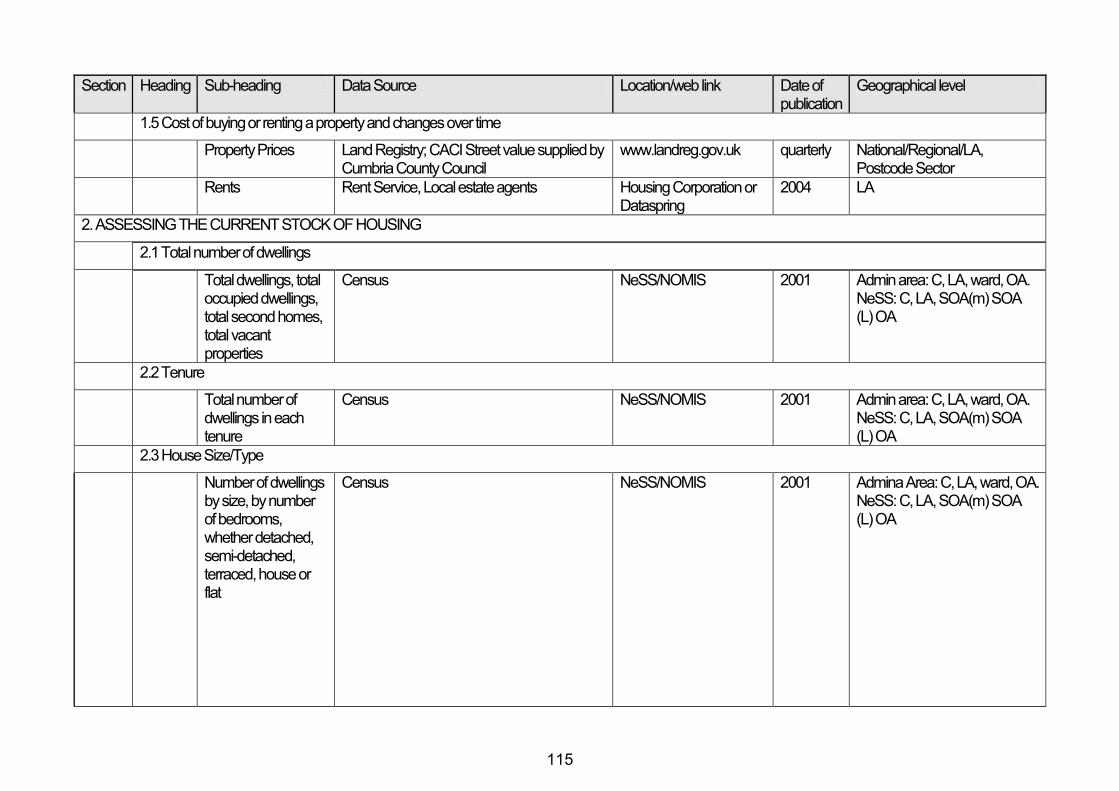
115
Section Heading Sub-heading Data Source Location/web link Date of publication
Geographical level
1.5 Cost of buying or renting a property and changes over time
Property Prices Land Registry; CACI Street value supplied by Cumbria County Council
www.landreg.gov.uk quarterly National/Regional/LA, Postcode Sector
Rents Rent Service, Local estate agents Housing Corporation or Dataspring
2004 LA
2. ASSESSING THE CURRENT STOCK OF HOUSING
2.1 Total number of dwellings
Total dwellings, total occupied dwellings, total second homes, total vacant properties
Census NeSS/NOMIS 2001 Admin area: C, LA, ward, OA. NeSS: C, LA, SOA(m) SOA (L) OA
2.2 Tenure
Total number of dwellings in each tenure
Census NeSS/NOMIS 2001 Admin area: C, LA, ward, OA. NeSS: C, LA, SOA(m) SOA (L) OA
2.3 House Size/Type
Number of dwellings by size, by number of bedrooms, whether detached, semi-detached, terraced, house or flat
Census NeSS/NOMIS 2001 Admina Area: C, LA, ward, OA. NeSS: C, LA, SOA(m) SOA (L) OA
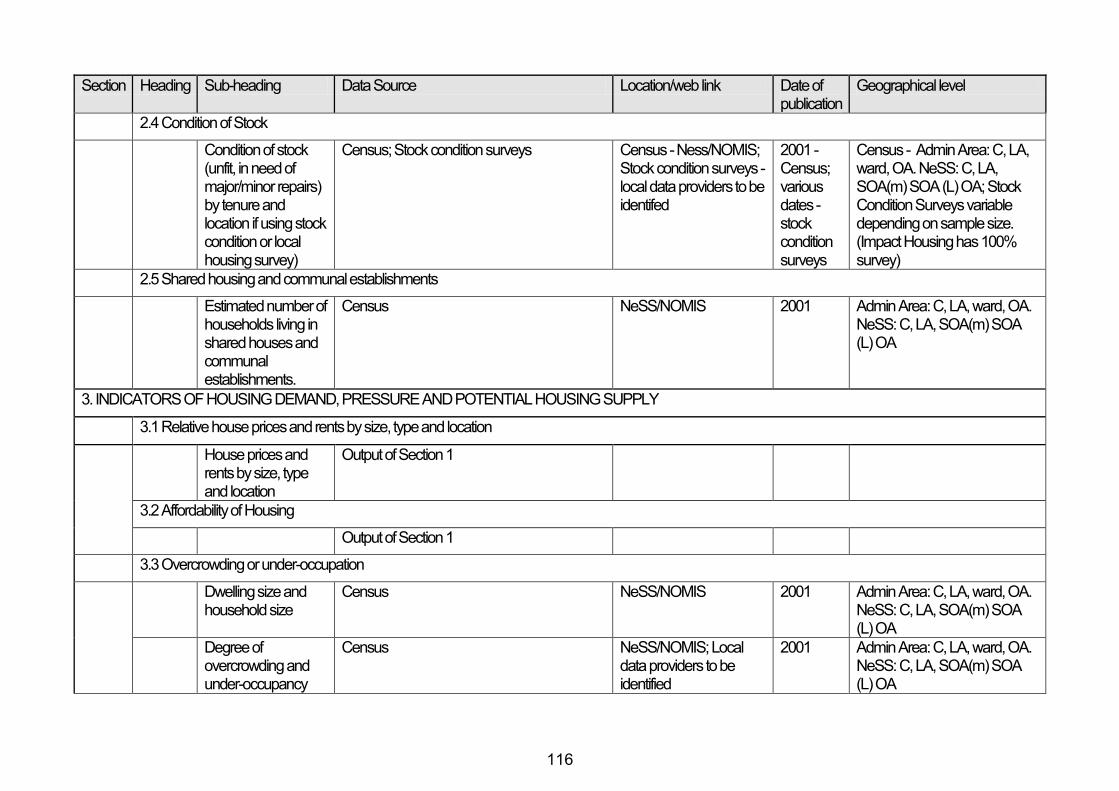
116
Section Heading Sub-heading Data Source Location/web link Date of publication
Geographical level
2.4 Condition of Stock
Condition of stock (unfit, in need of major/minor repairs) by tenure and location if using stock condition or local housing survey)
Census; Stock condition surveys Census - Ness/NOMIS; Stock condition surveys - local data providers to be identifed
2001 - Census; various dates - stock condition surveys
Census - Admin Area: C, LA, ward, OA. NeSS: C, LA, SOA(m) SOA (L) OA; Stock Condition Surveys variable depending on sample size. (Impact Housing has 100% survey)
2.5 Shared housing and communal establishments
Estimated number of households living in shared houses and communal establishments.
Census NeSS/NOMIS 2001 Admin Area: C, LA, ward, OA. NeSS: C, LA, SOA(m) SOA (L) OA
3. INDICATORS OF HOUSING DEMAND, PRESSURE AND POTENTIAL HOUSING SUPPLY
3.1 Relative house prices and rents by size, type and location
House prices and rents by size, type and location
Output of Section 1
3.2 Affordability of Housing
Output of Section 1
3.3 Overcrowding or under-occupation
Dwelling size and household size
Census NeSS/NOMIS 2001 Admin Area: C, LA, ward, OA. NeSS: C, LA, SOA(m) SOA (L) OA
Degree of overcrowding and under-occupancy
Census NeSS/NOMIS; Local data providers to be identified
2001 Admin Area: C, LA, ward, OA. NeSS: C, LA, SOA(m) SOA (L) OA
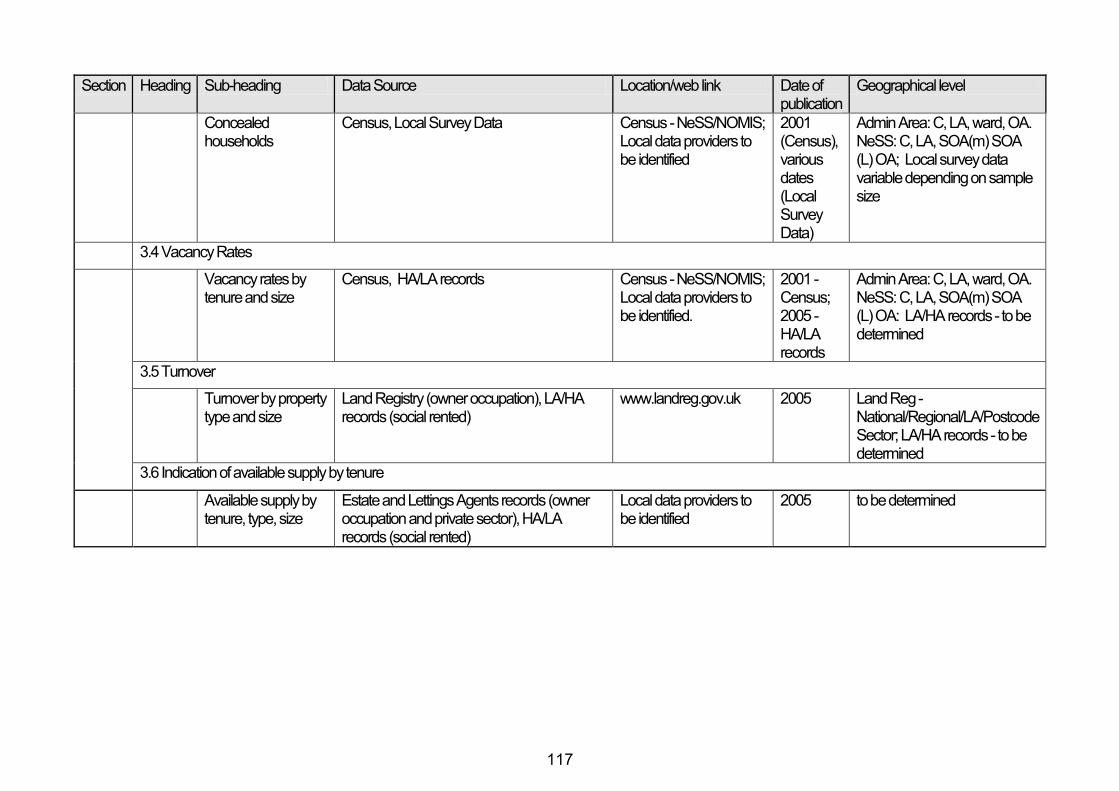
117
Section Heading Sub-heading Data Source Location/web link Date of publication
Geographical level
Concealed households
Census, Local Survey Data Census - NeSS/NOMIS; Local data providers to be identified
2001 (Census), various dates (Local Survey Data)
Admin Area: C, LA, ward, OA. NeSS: C, LA, SOA(m) SOA (L) OA; Local survey data variable depending on sample size
3.4 Vacancy Rates
Vacancy rates by tenure and size
Census, HA/LA records Census - NeSS/NOMIS; Local data providers to be identified.
2001 - Census; 2005 - HA/LA records
Admin Area: C, LA, ward, OA. NeSS: C, LA, SOA(m) SOA (L) OA: LA/HA records - to be determined
3.5 Turnover
Turnover by property type and size
Land Registry (owner occupation), LA/HA records (social rented)
www.landreg.gov.uk 2005 Land Reg - National/Regional/LA/Postcode Sector; LA/HA records - to be determined
3.6 Indication of available supply by tenure
Available supply by tenure, type, size
Estate and Lettings Agents records (owner occupation and private sector), HA/LA records (social rented)
Local data providers to be identified
2005 to be determined
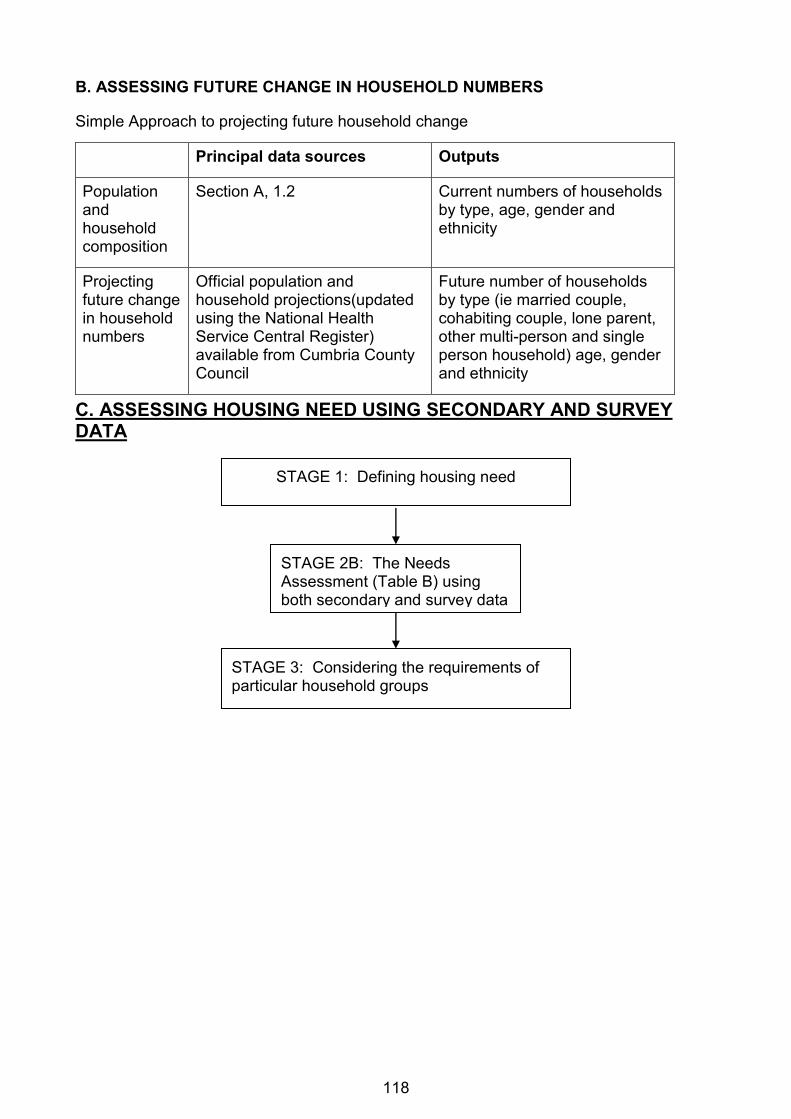
118
B. ASSESSING FUTURE CHANGE IN HOUSEHOLD NUMBERS
Simple Approach to projecting future household change
Principal data sources Outputs
Population and household composition
Section A, 1.2 Current numbers of households by type, age, gender and ethnicity
Projecting future change in household numbers
Official population and household projections(updated using the National Health Service Central Register) available from Cumbria County Council
Future number of households by type (ie married couple, cohabiting couple, lone parent, other multi-person and single person household) age, gender and ethnicity
C. ASSESSING HOUSING NEED USING SECONDARY AND SURVEY DATA
STAGE 2B: The Needs Assessment (Table B) using both secondary and survey data
STAGE 3: Considering the requirements of particular household groups
STAGE 1: Defining housing need
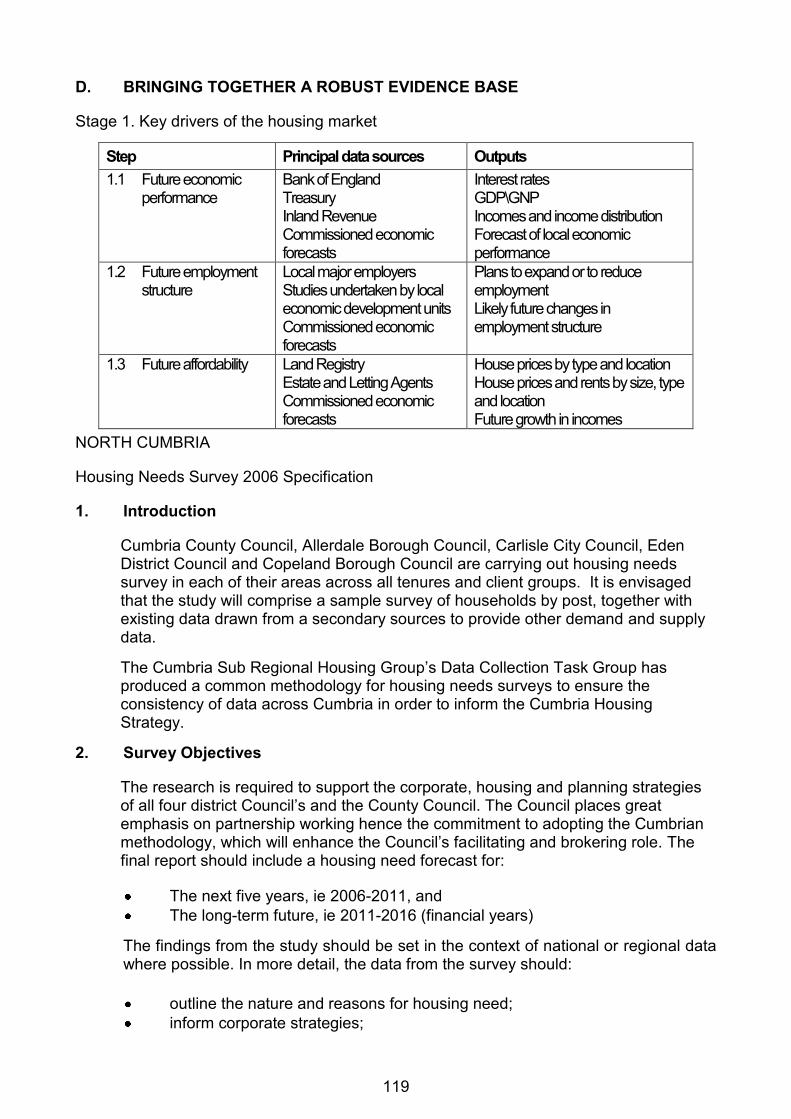
119
D. BRINGING TOGETHER A ROBUST EVIDENCE BASE
Stage 1. Key drivers of the housing market
Step Principal data sources Outputs
1.1 Future economic performance
Bank of England Treasury Inland Revenue Commissioned economic forecasts
Interest rates GDP\GNP Incomes and income distribution Forecast of local economic performance
1.2 Future employment structure
Local major employers Studies undertaken by local economic development units Commissioned economic forecasts
Plans to expand or to reduce employment Likely future changes in employment structure
1.3 Future affordability Land Registry Estate and Letting Agents Commissioned economic forecasts
House prices by type and location House prices and rents by size, type and location Future growth in incomes
NORTH CUMBRIA
Housing Needs Survey 2006 Specification
1. Introduction
Cumbria County Council, Allerdale Borough Council, Carlisle City Council, Eden District Council and Copeland Borough Council are carrying out housing needs survey in each of their areas across all tenures and client groups. It is envisaged that the study will comprise a sample survey of households by post, together with existing data drawn from a secondary sources to provide other demand and supply data.
The Cumbria Sub Regional Housing Group‟s Data Collection Task Group has produced a common methodology for housing needs surveys to ensure the consistency of data across Cumbria in order to inform the Cumbria Housing Strategy.
2. Survey Objectives
The research is required to support the corporate, housing and planning strategies of all four district Council‟s and the County Council. The Council places great emphasis on partnership working hence the commitment to adopting the Cumbrian methodology, which will enhance the Council‟s facilitating and brokering role. The final report should include a housing need forecast for:
The next five years, ie 2006-2011, and
The long-term future, ie 2011-2016 (financial years)
The findings from the study should be set in the context of national or regional data where possible. In more detail, the data from the survey should:
outline the nature and reasons for housing need;
inform corporate strategies;
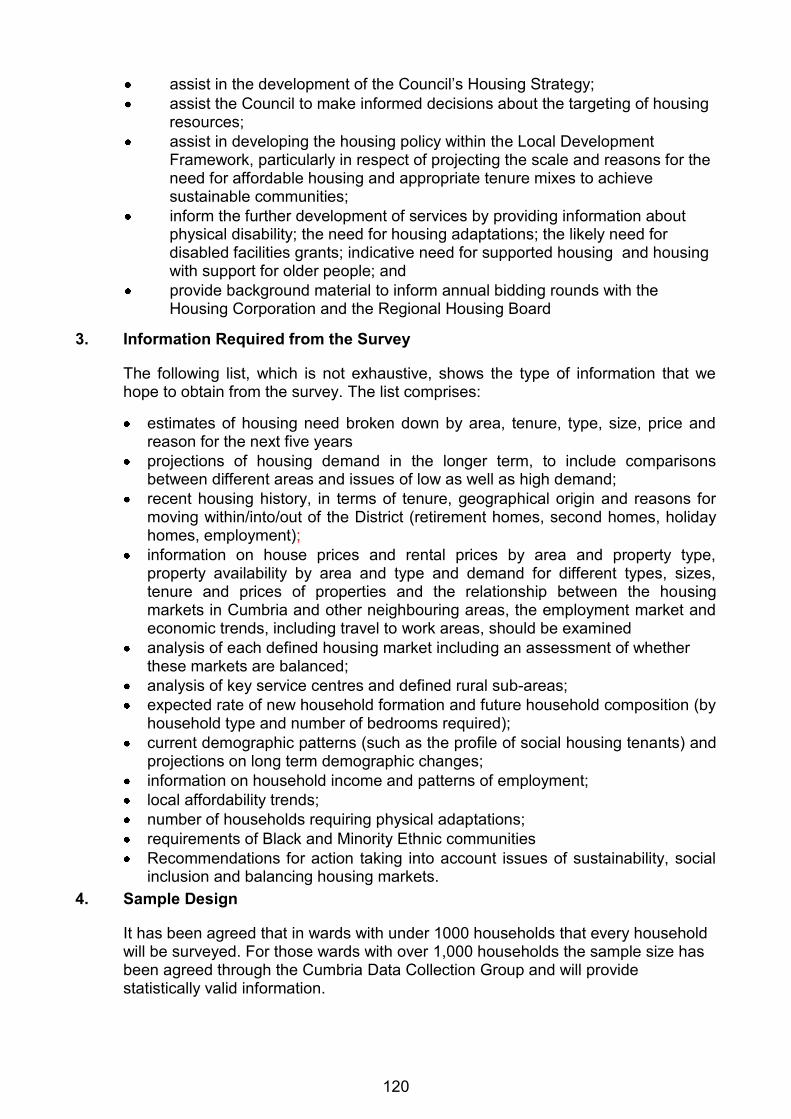
120
assist in the development of the Council‟s Housing Strategy;
assist the Council to make informed decisions about the targeting of housing resources;
assist in developing the housing policy within the Local Development Framework, particularly in respect of projecting the scale and reasons for the need for affordable housing and appropriate tenure mixes to achieve sustainable communities;
inform the further development of services by providing information about physical disability; the need for housing adaptations; the likely need for disabled facilities grants; indicative need for supported housing and housing with support for older people; and
provide background material to inform annual bidding rounds with the Housing Corporation and the Regional Housing Board
3. Information Required from the Survey
The following list, which is not exhaustive, shows the type of information that we hope to obtain from the survey. The list comprises:
estimates of housing need broken down by area, tenure, type, size, price and reason for the next five years
projections of housing demand in the longer term, to include comparisons between different areas and issues of low as well as high demand;
recent housing history, in terms of tenure, geographical origin and reasons for moving within/into/out of the District (retirement homes, second homes, holiday homes, employment);
information on house prices and rental prices by area and property type, property availability by area and type and demand for different types, sizes, tenure and prices of properties and the relationship between the housing markets in Cumbria and other neighbouring areas, the employment market and economic trends, including travel to work areas, should be examined
analysis of each defined housing market including an assessment of whether these markets are balanced;
analysis of key service centres and defined rural sub-areas;
expected rate of new household formation and future household composition (by household type and number of bedrooms required);
current demographic patterns (such as the profile of social housing tenants) and projections on long term demographic changes;
information on household income and patterns of employment;
local affordability trends;
number of households requiring physical adaptations;
requirements of Black and Minority Ethnic communities
Recommendations for action taking into account issues of sustainability, social inclusion and balancing housing markets.
4. Sample Design
It has been agreed that in wards with under 1000 households that every household will be surveyed. For those wards with over 1,000 households the sample size has been agreed through the Cumbria Data Collection Group and will provide statistically valid information.
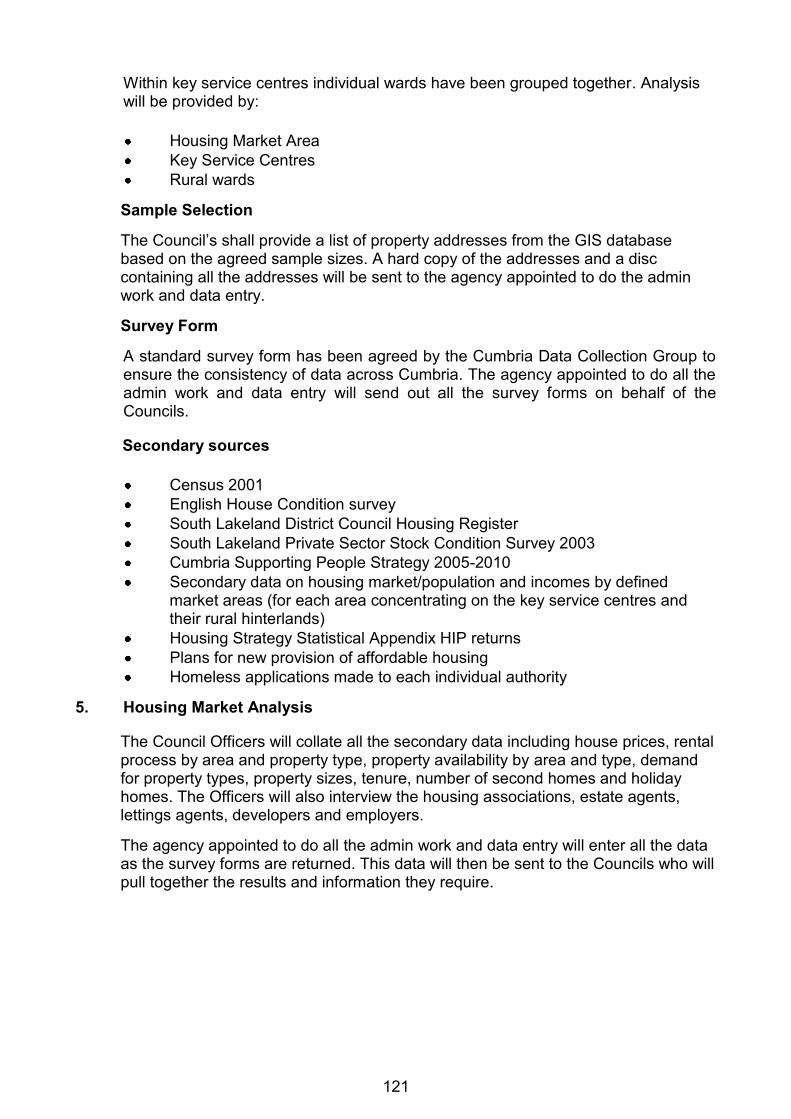
121
Within key service centres individual wards have been grouped together. Analysis will be provided by:
Housing Market Area
Key Service Centres
Rural wards
Sample Selection
The Council‟s shall provide a list of property addresses from the GIS database based on the agreed sample sizes. A hard copy of the addresses and a disc containing all the addresses will be sent to the agency appointed to do the admin work and data entry.
Survey Form
A standard survey form has been agreed by the Cumbria Data Collection Group to ensure the consistency of data across Cumbria. The agency appointed to do all the admin work and data entry will send out all the survey forms on behalf of the Councils.
Secondary sources
Census 2001
English House Condition survey
South Lakeland District Council Housing Register
South Lakeland Private Sector Stock Condition Survey 2003
Cumbria Supporting People Strategy 2005-2010
Secondary data on housing market/population and incomes by defined market areas (for each area concentrating on the key service centres and their rural hinterlands)
Housing Strategy Statistical Appendix HIP returns
Plans for new provision of affordable housing
Homeless applications made to each individual authority
5. Housing Market Analysis
The Council Officers will collate all the secondary data including house prices, rental process by area and property type, property availability by area and type, demand for property types, property sizes, tenure, number of second homes and holiday homes. The Officers will also interview the housing associations, estate agents, lettings agents, developers and employers.
The agency appointed to do all the admin work and data entry will enter all the data as the survey forms are returned. This data will then be sent to the Councils who will pull together the results and information they require.

122
6. Production and presentation of interim and final reports
The Council‟s will produce a draft report and draft tables which will be passed to the Housing Strategy group, by mid-April 2006.
The proposed timetable is:
Research commences January 2006 Postal survey commences January 2006 Fieldwork Completion by mid February 2006 Draft report and tables to CHS Group by mid April
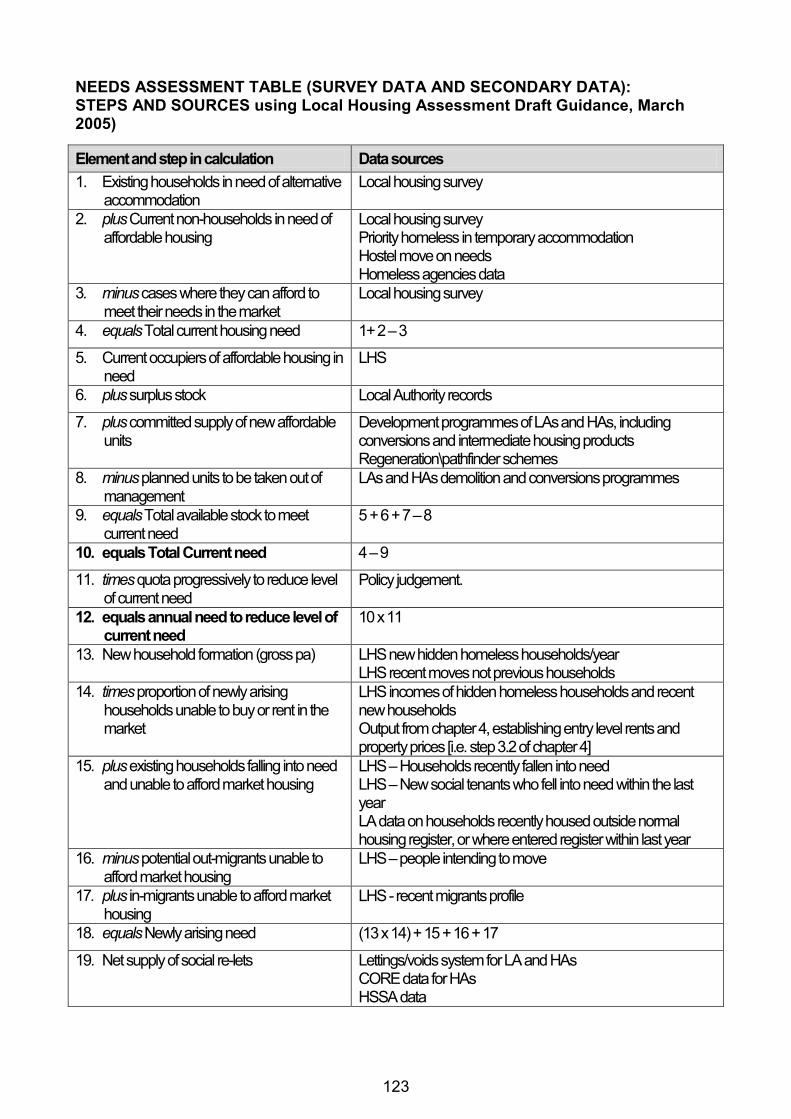
123
NEEDS ASSESSMENT TABLE (SURVEY DATA AND SECONDARY DATA): STEPS AND SOURCES using Local Housing Assessment Draft Guidance, March 2005)
Element and step in calculation Data sources
1. Existing households in need of alternative accommodation
Local housing survey
2. plus Current non-households in need of affordable housing
Local housing survey Priority homeless in temporary accommodation Hostel move on needs Homeless agencies data
3. minus cases where they can afford to meet their needs in the market
Local housing survey
4. equals Total current housing need 1+ 2 – 3
5. Current occupiers of affordable housing in need
LHS
6. plus surplus stock Local Authority records
7. plus committed supply of new affordable units
Development programmes of LAs and HAs, including conversions and intermediate housing products Regeneration\pathfinder schemes
8. minus planned units to be taken out of management
LAs and HAs demolition and conversions programmes
9. equals Total available stock to meet current need
5 + 6 + 7 – 8
10. equals Total Current need 4 – 9
11. times quota progressively to reduce level of current need
Policy judgement.
12. equals annual need to reduce level of current need
10 x 11
13. New household formation (gross pa) LHS new hidden homeless households/year LHS recent moves not previous households
14. times proportion of newly arising households unable to buy or rent in the market
LHS incomes of hidden homeless households and recent new households Output from chapter 4, establishing entry level rents and property prices [i.e. step 3.2 of chapter 4]
15. plus existing households falling into need and unable to afford market housing
LHS – Households recently fallen into need LHS – New social tenants who fell into need within the last year LA data on households recently housed outside normal housing register, or where entered register within last year
16. minus potential out-migrants unable to afford market housing
LHS – people intending to move
17. plus in-migrants unable to afford market housing
LHS - recent migrants profile
18. equals Newly arising need (13 x 14) + 15 + 16 + 17
19. Net supply of social re-lets Lettings/voids system for LA and HAs CORE data for HAs HSSA data

124
Element and step in calculation Data sources
20. plus supply of intermediate housing available for re-let or resale at sub market levels
LA and HA Lettings/voids system and data on re-sales of sub-market LCHO or shared equity schemes
21. equals affordable supply 19 + 20
NET SHORTFALL OR SURPLUS
22. Overall shortfall or surplus 12 + 18 – 21
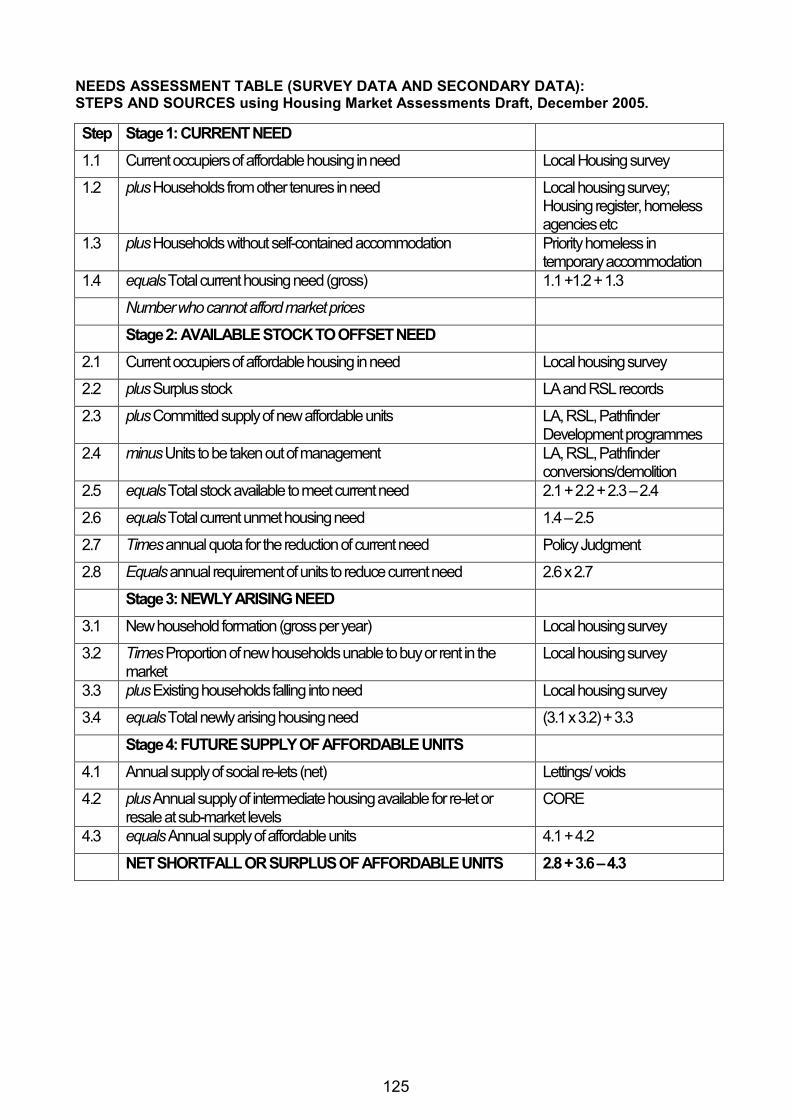
125
NEEDS ASSESSMENT TABLE (SURVEY DATA AND SECONDARY DATA): STEPS AND SOURCES using Housing Market Assessments Draft, December 2005.
Step Stage 1: CURRENT NEED
1.1 Current occupiers of affordable housing in need Local Housing survey
1.2 plus Households from other tenures in need Local housing survey; Housing register, homeless agencies etc
1.3 plus Households without self-contained accommodation Priority homeless in temporary accommodation
1.4 equals Total current housing need (gross) 1.1 +1.2 + 1.3
Number who cannot afford market prices
Stage 2: AVAILABLE STOCK TO OFFSET NEED
2.1 Current occupiers of affordable housing in need Local housing survey
2.2 plus Surplus stock LA and RSL records
2.3 plus Committed supply of new affordable units LA, RSL, Pathfinder Development programmes
2.4 minus Units to be taken out of management LA, RSL, Pathfinder conversions/demolition
2.5 equals Total stock available to meet current need 2.1 + 2.2 + 2.3 – 2.4
2.6 equals Total current unmet housing need 1.4 – 2.5
2.7 Times annual quota for the reduction of current need Policy Judgment
2.8 Equals annual requirement of units to reduce current need 2.6 x 2.7
Stage 3: NEWLY ARISING NEED
3.1 New household formation (gross per year) Local housing survey
3.2 Times Proportion of new households unable to buy or rent in the market
Local housing survey
3.3 plus Existing households falling into need Local housing survey
3.4 equals Total newly arising housing need (3.1 x 3.2) + 3.3
Stage 4: FUTURE SUPPLY OF AFFORDABLE UNITS
4.1 Annual supply of social re-lets (net) Lettings/ voids
4.2 plus Annual supply of intermediate housing available for re-let or resale at sub-market levels
CORE
4.3 equals Annual supply of affordable units 4.1 + 4.2
NET SHORTFALL OR SURPLUS OF AFFORDABLE UNITS 2.8 + 3.6 – 4.3
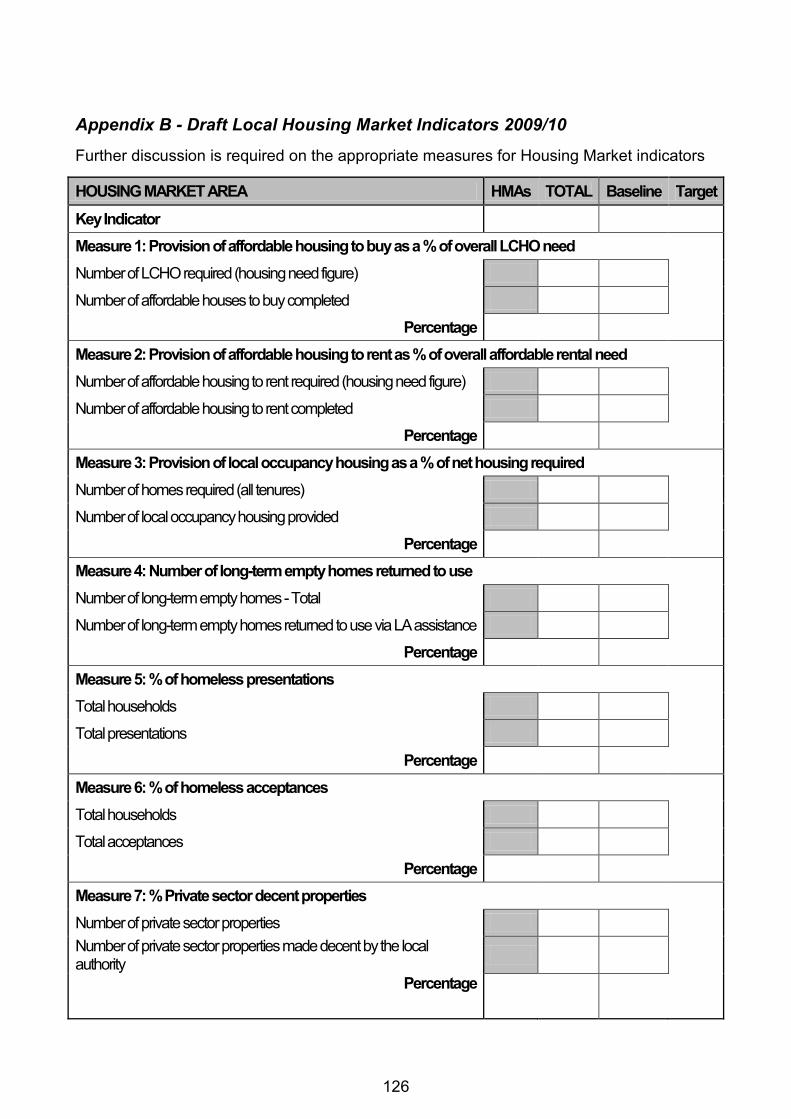
126
Appendix B - Draft Local Housing Market Indicators 2009/10
Further discussion is required on the appropriate measures for Housing Market indicators
HOUSING MARKET AREA HMAs TOTAL Baseline Target
Key Indicator
Measure 1: Provision of affordable housing to buy as a % of overall LCHO need
Number of LCHO required (housing need figure)
Number of affordable houses to buy completed
Percentage
Measure 2: Provision of affordable housing to rent as % of overall affordable rental need
Number of affordable housing to rent required (housing need figure)
Number of affordable housing to rent completed
Percentage
Measure 3: Provision of local occupancy housing as a % of net housing required
Number of homes required (all tenures)
Number of local occupancy housing provided
Percentage
Measure 4: Number of long-term empty homes returned to use
Number of long-term empty homes - Total
Number of long-term empty homes returned to use via LA assistance
Percentage
Measure 5: % of homeless presentations
Total households
Total presentations
Percentage
Measure 6: % of homeless acceptances
Total households
Total acceptances
Percentage
Measure 7: % Private sector decent properties
Number of private sector properties
Number of private sector properties made decent by the local authority
Percentage
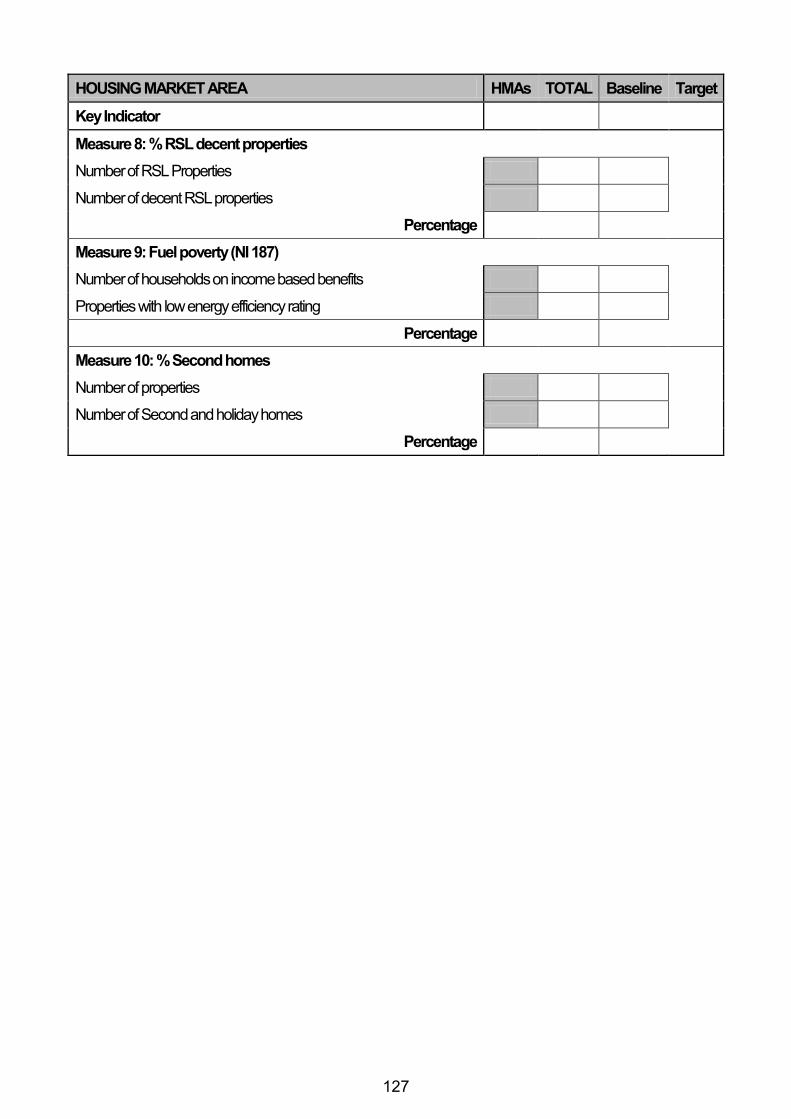
127
HOUSING MARKET AREA HMAs TOTAL Baseline Target
Key Indicator
Measure 8: % RSL decent properties
Number of RSL Properties
Number of decent RSL properties
Percentage
Measure 9: Fuel poverty (NI 187)
Number of households on income based benefits
Properties with low energy efficiency rating
Percentage
Measure 10: % Second homes
Number of properties
Number of Second and holiday homes
Percentage
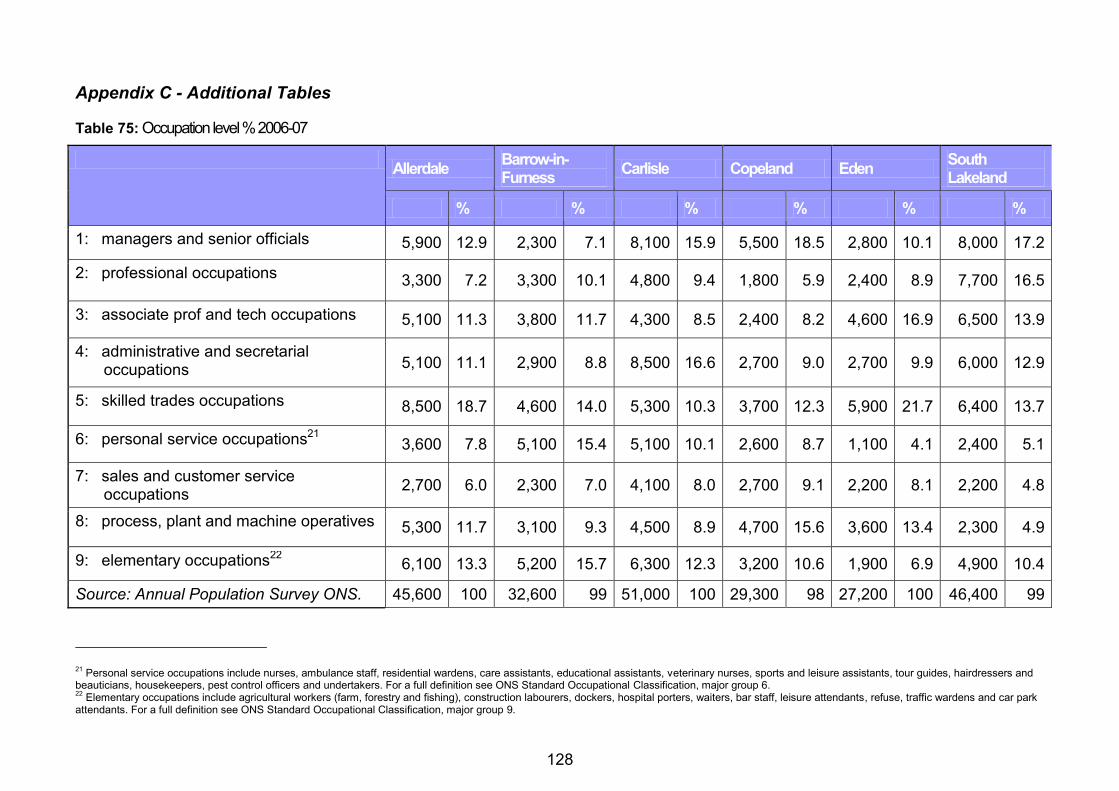
128
Appendix C - Additional Tables
Table 75: Occupation level % 2006-07
Allerdale
Barrow-in-Furness
Carlisle Copeland Eden South Lakeland
% % % % % %
1: managers and senior officials 5,900 12.9 2,300 7.1 8,100 15.9 5,500 18.5 2,800 10.1 8,000 17.2
2: professional occupations 3,300 7.2 3,300 10.1 4,800 9.4 1,800 5.9 2,400 8.9 7,700 16.5
3: associate prof and tech occupations 5,100 11.3 3,800 11.7 4,300 8.5 2,400 8.2 4,600 16.9 6,500 13.9
4: administrative and secretarial occupations 5,100 11.1 2,900 8.8 8,500 16.6 2,700 9.0 2,700 9.9 6,000 12.9
5: skilled trades occupations 8,500 18.7 4,600 14.0 5,300 10.3 3,700 12.3 5,900 21.7 6,400 13.7
6: personal service occupations21 3,600 7.8 5,100 15.4 5,100 10.1 2,600 8.7 1,100 4.1 2,400 5.1
7: sales and customer service occupations
2,700 6.0 2,300 7.0 4,100 8.0 2,700 9.1 2,200 8.1 2,200 4.8
8: process, plant and machine operatives 5,300 11.7 3,100 9.3 4,500 8.9 4,700 15.6 3,600 13.4 2,300 4.9
9: elementary occupations22 6,100 13.3 5,200 15.7 6,300 12.3 3,200 10.6 1,900 6.9 4,900 10.4
Source: Annual Population Survey ONS. 45,600 100 32,600 99 51,000 100 29,300 98 27,200 100 46,400 99
21 Personal service occupations include nurses, ambulance staff, residential wardens, care assistants, educational assistants, veterinary nurses, sports and leisure assistants, tour guides, hairdressers and
beauticians, housekeepers, pest control officers and undertakers. For a full definition see ONS Standard Occupational Classification, major group 6. 22
Elementary occupations include agricultural workers (farm, forestry and fishing), construction labourers, dockers, hospital porters, waiters, bar staff, leisure attendants, refuse, traffic wardens and car park attendants. For a full definition see ONS Standard Occupational Classification, major group 9.
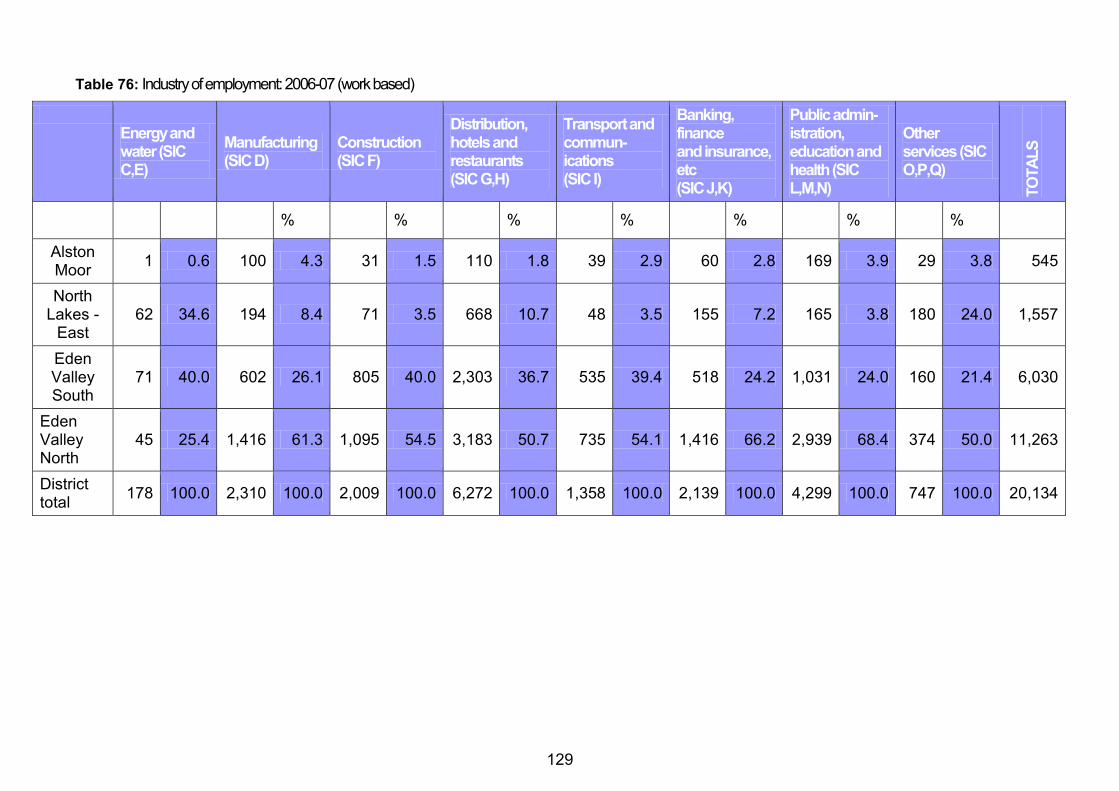
129
Table 76: Industry of employment: 2006-07 (work based)
Energy and water (SIC C,E)
Manufacturing (SIC D)
Construction (SIC F)
Distribution, hotels and restaurants (SIC G,H)
Transport and commun-ications (SIC I)
Banking, finance and insurance, etc (SIC J,K)
Public admin-istration, education and health (SIC L,M,N)
Other services (SIC O,P,Q)
TO
TA
LS
% % % % % % %
Alston Moor
1 0.6 100 4.3 31 1.5 110 1.8 39 2.9 60 2.8 169 3.9 29 3.8 545
North Lakes -
East 62 34.6 194 8.4 71 3.5 668 10.7 48 3.5 155 7.2 165 3.8 180 24.0 1,557
Eden Valley South
71 40.0 602 26.1 805 40.0 2,303 36.7 535 39.4 518 24.2 1,031 24.0 160 21.4 6,030
Eden Valley North
45 25.4 1,416 61.3 1,095 54.5 3,183 50.7 735 54.1 1,416 66.2 2,939 68.4 374 50.0 11,263
District total
178 100.0 2,310 100.0 2,009 100.0 6,272 100.0 1,358 100.0 2,139 100.0 4,299 100.0 747 100.0 20,134
130
Appendix D - Definition and types of affordable housing
Excerpt from Delivering Affordable Housing, Annex B: Definition and types of affordable housing, Communities and Local Government, November 2006
Definitions
30. Affordable housing includes social rented and intermediate housing, provided to specified eligible households whose needs are not met by the market. Affordable housing should:
- meet the needs of eligible households including availability at a cost low enough for them to afford, determined with regard to local incomes and local house prices; and - include provisions for:
(i) the home to be retained for future eligible households; or
(ii) if these restrictions are lifted, for any subsidy to be recycled for alternative affordable housing provision.
31. Social rented housing is rented housing owned and managed by local authorities and RSLs, for which guideline target rents are determined through the national rent regime. The proposals set out in the Three Year Review of Rent Restructuring (July 2004) were implemented as policy in April 2006. It may also include rented housing owned or managed by other persons and provided under equivalent rental arrangements to the above, as agreed with the local authority or with the Housing Corporation as a condition of grant.
32. Intermediate affordable housing is housing at prices and rents above those of social rent but below market price or rents, and which meet the criteria set out above. These can include shared equity (eg HomeBuy) and other low cost homes for sale, and intermediate rent.
Context of the definitions
33. The definitions above replace the guidance given in PPG 3 Housing (2000) and Circular 6/98 Planning and Affordable Housing. They are set out in Annex B of Planning Policy Statement 3 (PPS3): Housing.
34. The Government has adopted this definition of affordable housing because it wishes to ensure that developer contributions are used to help provide genuinely affordable housing for households in need over the long term. The definition includes homes owned or managed by private sector bodies and provided without Government grant, and new models of affordable housing. It is not essential that all affordable homes are offered under identical conditions.
Social rented housing
35. Normally, only households on local authority and RSL registers are eligible for social rented housing. Target rents are set under a national rent regime; are well below market levels; and, are normally based on relative property values, local earning levels and property size. When a household ceases to occupy a social rented home, it is normally made available to other households eligible for social rented housing. Social rented homes are normally owned and/or managed by a
131
RSL (or other body agreed by the Housing Corporation), and will be required by regulation or contract to meet the criteria.
36. Some tenants have the legal right to purchase at a discount the social rented home in which they live, eg RSL tenants with a Right to Acquire and local authority tenants with Right to Buy. Where these rights are exercised the home itself ceases to be affordable, but procedures are in place to reuse receipts. Receipts from Right to Acquire sales are recycled to provide more social rented housing to help other eligible households. Receipts from Right to Buy are partly (25 per cent) retained by the local authority for use however the authority chooses; the remaining 75 per cent is kept by Government to be reinvested in new supply.
37. Local authority homes which are let in connection with the tenant‟s employment, or are particularly suitable for occupation by disabled or elderly persons are exempted from Right to Buy. Publicly funded housing in small rural settlements23 is exempt from Right to Acquire, as replacing them with other affordable homes would be extremely difficult. (It is not exempt from the Right to Buy, but the landlord may require that properties sold under that scheme can only be resold to people who live or work locally). Landlords will also usually have a right of first refusal to buy back any homes sold under the Right to Acquire and Right to Buy, if they are resold within ten years.
Intermediate affordable housing
38. Types of housing between market and social rented housing include:
- Intermediate rented homes are provided at rent levels above those of social rented but below private rented. The Government offers these to some key workers who do not wish to buy.
- Discounted sale homes have a simple discount for the purchaser on its market price, so the purchaser buys the whole home at a reduced rate.
- Shared equity is where more than one party has an interest in the value of the home eg an equity loan arrangement or a shared ownership lease. There may be a charge on the loan, and restrictions on price, access and resale.
- Shared ownership is a form of shared equity under which the purchaser buys an initial share in a home from a housing provider, who retains the remainder and may charge a rent. The purchaser may buy additional shares („staircasing‟), and this payment should be „recycled‟ for more affordable housing. In most cases, a purchaser may buy the final share („staircase out‟) and own the whole home, though this may be restricted in some rural areas.
39. Homes of any of these types should only be considered intermediate affordable housing if they meet the criteria in the definition. If they do not, even if offered at
23 Small rural settlements have been designated for enfranchisement and right to acquire purposes (under Section 17 of the Housing
Act 1996) by SI 1997/620-25 inclusive and 1999/1307).
132
less than market price, they should be considered „low cost market housing‟, outside the definition of affordable housing.
40. For example, a shared ownership home is likely to be affordable if access is restricted to households from a target group at a price they can afford. The purchaser may staircase out, but there should be secure arrangements for subsidy to be recycled to provide more affordable homes or buy back the home if needed.
41. Low cost market housing is not part of the Government‟s definition of affordable housing although it can play an important role in meeting housing demand. Local authorities should consider the potential to provide low cost market housing as part of their approach to achieving a mix of housing (PPS3, paragraph 26).

133
Appendix E - Key Aspirational Scenario Assumptions
Growth in the agricultural and forestry sector due to significant potential for improvements in the management of woodland areas. In turn, this would lead to significant potential for biomass production helping to fuel a low carbon economy in the future.
Linked to growth in agriculture there is potential to grow the size of the food and drink sector both in terms of jobs and profitability due to focus on good quality, local, higher added value produce. Cumbrian branding will help streamline the marketing of local produce. Off the back of developments in West Cumbria relating to energy and environmental technologies, the area will become a desirable location for businesses related to this sphere of work but who do not want to locate themselves in the relatively more isolated areas of West Cumbria or Barrow.
Assuming provision of decent land and premises there is significant potential for growth along the M6 corridor.
The area is particularly reliant on the retail and hospitality industry which exhibit significant growth potential despite being traditionally low value sectors. Nevertheless higher added value will be achieved in the future, particularly in the hospitality sector, through improvements to customer service and widespread take-up a recognised scheme of accreditation.
Eden
The New Squares development in Penrith will bring substantial job gains (up to 950 created).
The University of Cumbria will expand its offering at Newton Rigg leading to the creation of many new jobs.
The new Eden skills centre with headquarters at Newton Rigg and smaller centres based in Appleby, Kirkby Stephen and Alston will lead to the creation of new jobs.
Expansion at Penrith hospital and job creation through the NHS‟s closer to home initiative.
Lowther Castle and Gardens development employing specialist heritage construction workers and leading to the creation of 150+ jobs (most of them indirect) once opened.
Regeneration of Penrith town centre (including cultural projects) through the Penrith Master plan should bring increases in visitor numbers and spend to the town.
Key Worst Case Scenario Assumptions
Due to constant demand for food and a shifting emphasis on buying local produce it is expected that job losses will be minimal within the agriculture, forestry and fishing sector; nevertheless, the sector will fail to live up to its potential for growth. The worst case scenario is only marginally worse than the baseline.
Manufacturing was already expected to decline even under the aspirational scenario, so it is not surprising that this will be one of the hardest hit sectors. Particular pressure will come from rising cost of imports, although some firms dealing mainly in exports may be more fortunate. However the vast majority of small-medium sized firms operating mainly within localised markets will come under pressure from all sides as both upper tier companies and retailers attempt to retain their profit margins. Declining consumer spending and lack of buyer confidence will
134
lead to falls in output and pressure on managers to either reduce the number of working hours or, where this fails, reduce the size of the workforce.
As in other forms of manufacturing, the food and drink sector will be squeezed as a result of the downturn albeit to a more limited extent due to the size of the sector. Demand for food will not decline as markedly as other products although there may be a move from luxury products to shops own brands with farm shops and higher added value produce likely to be worst hit.
The extent of any change in the retail and hospitality sector is difficult to predict, however it is expected that job losses in retail will be widespread due to a decrease in consumer confidence/spending and a number of national stores going into administration. Within hospitality, any job losses may be absorbed by the migrant workforce returning to their country of origin due to the fall in the value of sterling. However there is a counter-argument which suggests tourism based revenue may actually increase in the Lake District as more people decide to holiday in the UK rather than abroad.
The construction industry has been severely hit due to the stalling of new housing and commercial projects, falling land prices and difficulty in accessing finance. The knock-on effects are now taking hold with many smaller businesses in the supply chain facing difficult times. The coming years are predicted to be especially difficult for the construction industry until confidence returns to the housing market and credit conditions improve.
Financial and business services are under-represented across Cumbria as a whole, so any potential job losses within the sector as a proportion of total job losses within Cumbria are likely to be less pronounced than for across the UK. However, a number of high profile job losses have been announced by global firms in recent months and it is very possible that rationalisation of services and associated downsizing will affect businesses operating in Cumbria.
As a result of contraction elsewhere, it is possible that employment in the public sector may actually increase rather than decline in an attempt to stem rising unemployment. However it is still expected that any increase will be at a slower rate than that of the baseline trend. Investment in skills and education infrastructure is likely to remain strong, as is expenditure in the health sector.
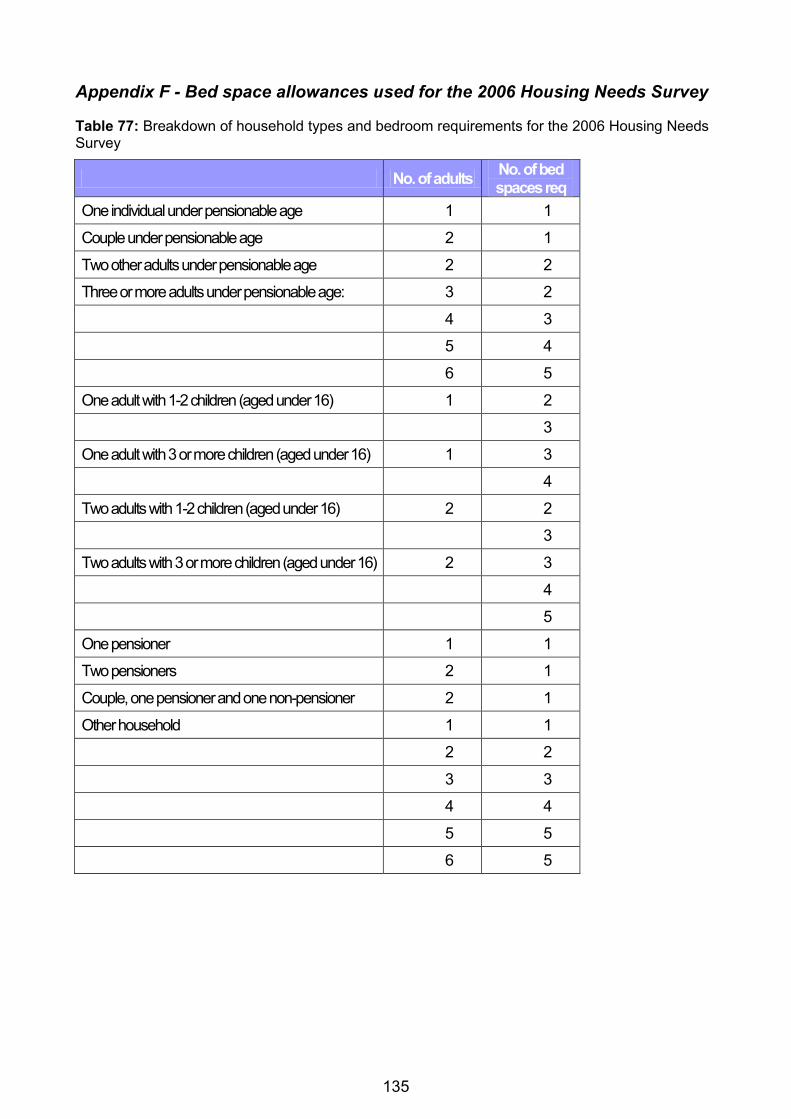
135
Appendix F - Bed space allowances used for the 2006 Housing Needs Survey
Table 77: Breakdown of household types and bedroom requirements for the 2006 Housing Needs Survey
No. of adults No. of bed spaces req
One individual under pensionable age 1 1
Couple under pensionable age 2 1
Two other adults under pensionable age 2 2
Three or more adults under pensionable age: 3 2
4 3
5 4
6 5
One adult with 1-2 children (aged under 16) 1 2
3
One adult with 3 or more children (aged under 16) 1 3
4
Two adults with 1-2 children (aged under 16) 2 2
3
Two adults with 3 or more children (aged under 16) 2 3
4
5
One pensioner 1 1
Two pensioners 2 1
Couple, one pensioner and one non-pensioner 2 1
Other household 1 1
2 2
3 3
4 4
5 5
6 5