Embed Size (px)
Citation preview

MOBILIZATION OF OXYANION FORMING TRACE ELEMENTS FROM FLY ASH
BASED GEOPOLYMER CONCRETE
by
Olanrewaju Abdur-Rahman Sanusi
A dissertation submitted to the faculty of
The University of North Carolina at Charlotte
in partial fulfillment of the requirements
for the degree of Doctor of Philosophy in
Infrastructure and Environmental Systems
Charlotte
2012
Approved by:
_____________________________
Dr. Vincent Ogunro
_____________________________
Dr. John Daniels
_____________________________
Dr. Brett Tempest
_____________________________
Dr. Miguel Pando
_____________________________
Dr. Ertunga Ozelkan
_____________________________
Dr. Carlos Orozco

ii
©2012
Olanrewaju Abdur-Rahman Sanusi
ALL RIGHTS RESERVED

iii
ABSTRACT
OLANREWAJU ABDUR-RAHMAN SANUSI. Mobilization of oxyanion forming trace
elements from fly ash based geopolymer concrete (Under the direction of Dr. VINCENT
OGUNRO)
The suitability of fly ash based geopolymer concrete as a replacement for ordinary
Portland cement (OPC) concrete depends on the mobility of elements from the material. Due
to the alkaline nature of geopolymer concrete, there is a potential for the release of oxyanion
forming elements such as As, Cr and Se which are characterized by their high mobility in the
alkaline environment. In this study, geopolymer concretes were produced with varying
amount of hydrated lime and subjected to tests that include pH dependence test, Dutch
availability test, tank test, water leach test, mineralogical, microstructural analysis and
geochemical modeling using PHREEQC/PHREEPLOT. The results of this study confirmed
that As and Se and other oxyanion forming elements exhibit higher mobility in the alkaline
pH. Further investigation using the Dutch availability and tank test showed that As have the
highest mobility from all the geopolymer concretes. It also reveals that the mobility of As and
Se reduces with time as the element becomes depleted in the matrix. Mobility of the two
elements was observed to be lowest in the geopolymer concrete with 1% hydrated lime which
suggest that the addition of 1% hydrated lime lead to reduction in the mobility of As and Se.
Cr on the other hand have the same low mobility from all the geopolymer, this suggest that
hydrated lime addition has no effect on the mobility the element. Finally,
PHREEQC/PHREEPLOT identifies species of leached elements as As (5), Se (6) and Cr (6).
These species of As and Se have low toxicity whereas the species of Cr is of the more toxic
form, but it is released in level far below the Maximum Concentration Level (MCL) set by
EPA for drinking water.

iv
DEDICATION
This dissertation is dedicated to my parents, siblings and friends.

v
ACKNOWLEDGMENTS
My sincere gratitude goes to my advisor, Dr. Vincent Ogunro for his guidance,
valuable suggestions and encouragement throughout my doctoral studies. I would like to
extend my appreciation to members of my committee – Drs. Brett Tempest, John Daniels,
Miguel Pando, Ertunga Ozelkan and Carlos Orozco – for their time, support and
constructive comments.
A big thank you to Marge Galvin-Karr of Duke Energy laboratory for her
assistance in analyzing all leachates from my leaching tests. Many thanks to Claire
Chadwick for giving me the freedom to impose on her for assistance with analysis of
samples and use of instruments at the department of Geography and Earth Sciences.
Special thanks to Mike Moss for his help in various ways in the workshop. I would also
like to thank Alec Martin for teaching me how to use the XRD and SEM. Sincere
appreciation to Elizabeth Scott and Erin Morant for their assistance with various
administrative tasks related to my study.
My deepest appreciation is due to my parents, siblings (Diran, Titi, Tope, Tayo,
Iyabo, Latifah and Gary), lab buddies (Yogesh and Ari), friends (Onyewuchi, Femi,
Appolo, Ayoola, Amanda, Toyin) and others too numerous to mention. Thank you all for
having confidence and believing in me. Finally, I acknowledge the support of the
department of civil and environmental engineering and the graduate school for awarding
me the graduate assistant support plan (GASP) fellowship.

vi
TABLE OF CONTENTS
LIST OF FIGURES xi
LIST OF TABLES xv
LIST OF ABBREVIATIONS xvii
CHAPTER 1: INTRODUCTION 1
1.1 Background 1
1.2 Problem Description 5
1.3 Significance and Benefit of the Study 6
1.4 Research Goal and Objectives 6
1.5 Research Hypotheses 7
1.6 Scope of Work 8
1.7 Organization of the Dissertation 8
CHAPTER 2: LITERATURE REVIEW 10
2.1 Historical Development of Geopolymer as Alternative Binder 10
2.2 Basic Concept of Geopolymer 11
2.2.1 Source Materials for Geopolymer Synthesis 12
2.2.2 Chemistry and Reaction Mechanisms 15
2.2.3 Structure of Geopolymer 17
2.4 Characteristics and Application of Geopolymer 19
2.5 Background on Leaching and Mobility of Elements 20
2.5.1 Mobility of Elements from Geopolymer 21
2.6 Oxyanion Forming Trace Elements 25
2.6.1 Occurrence and Chemistry of Arsenic, Chromium and Selenium 26
2.6.2 Environmental Aspect and Toxicity of As, Cr and Se 27

vii
2.7 Methods of Immobilizing the Leaching of Oxyanion Elements 28
2.7.1 Incorporation into Ettringite Structure 29
2.7.2 Incorporation into Hydrocalumite Structure 30
2.7.3 Incorporation into Monosulfoaluminate Structure 31
2.7.4 Incorporation into Calcium Silicate Hydrate (CSH) 31
2.7.5 Formation of Precipitates 32
2.8 Mineralogical and Microstructural Characterization of Geopolymer 32
2.9 Geochemical Modeling 33
2.10 Summary 35
CHAPTER 3: EXPERIMENTAL PROTOCOL 37
3.1 Research Approach 37
3.2 Materials 37
3.2.1 Coal Fly Ash (CFA) 37
3.2.2 Silica Fume (SF) 37
3.2.3 Sodium Hydroxide (NaOH) 38
3.2.4 Hydrated lime (Ca(OH)2) 38
3.2.5 Aggregates 38
3.3 Experimental Method 38
3.4 Quality Assurance and Quality Control 40
3.5 Statistical Analysis of Data 41
3.6 Pilot Study 41
3.6.1 Element Mobility from Fly Ash Based Geopolymer Paste 41
3.6.2 Leaching of Oxyanion Forming Elements from Fly Ash Based 45
Geopolymer Paste
3.6.3 Mitigating Leachability from Geopolymer Concrete using RCA 47

viii
3.6.4 Influence of Lime on Strength and mobility of Elements from 49
Geopolymer Paste
CHAPTER 4: SYNTHESIS OF GEOPOLYMER CONCRETE AND SAMPLE 52
PREPARATION
4.1 Synthesis and Preparation of the Geopolymer Concretes 52
4.2 Sampling and Sample Preparation 53
4.3 Summary 56
CHAPTER 5: CHARACTERIZATION OF THE MATERIALS 58
5.1 Chemical Composition of X-Ray Fluorescence (XRF) Analysis 58
5.2 Particle Size Distribution (PSD) 59
5.3 Compressive Strength of the Geopolymer Concrete 62
5.4 Acid and Base Neutralization Capacity (ANC/BNC) 65
5.5 Material Natural pH 68
5.6 Moisture Content and Bulk Density 69
5.7 Summary 69
CHAPTER 6: LABORATORY LEACHING TEST METHODS 71
6.1 Introduction 71
6.2 pH Dependence Leaching test 72
6.3 Dutch Availability Test 80
6.4 Tank Test 83
6.4.1 Leachability Index (LX) of the Elements 89
6.4.2 Depletion of the Elements in Relation to Availability 91
6.5 Water Leach Test 94
6.6 Risk Associated with Release of the Oxyanion Elements 97
6.7 Summary 99

ix
CHAPTER 7: MINERALOGICAL AND MICROSTRUCTURAL 101
CHARACTERIZATION
7.1 Mineralogical and Microstructural Analysis 101
7.2 X-Ray Diffraction (XRD) Analysis 101
7.3 Scanning Electron Microscope (SEM) Analysis 108
7.4 Energy Dispersive X-Ray Spectroscopy (EDX) Analysis 112
7.5 Summary 116
CHAPTER 8: SPECIATION MODELING USING PHREEQC/PHREEPLOT 117
8.1 Background on PHREEQC/PHREEPLOT 117
8.1.1 The PHREEPLOT Database 118
8.1.2 Description of the PHREEPLOT Input File 119
8.2 Procedure for the PHREEPLOT Speciation Modeling 121
8.3 Model Simulation Results and Interpretation 123
8.4 Validation of the Model Output 126
8.5 Summary 127
CHAPTER 9: CONCLUSIONS AND RECOMMENDATIONS 128
9.1 Conclusions 128
9.1.1 Synthesis of Geopolymer Concrete 128
9.1.2 Leaching of Elements from Geopolymer Concrete 130
9.1.3 XRD and SEM/EDX Analysis of the Geopolymer Concretes 133
9.1.4 Distributions of Species of As, Cr and Se 134
9.1.5 Overall Conclusions 134
9.2 Limitations of the Study 136
9.3 Recommendations for Future Work 137
x
REFERENCES 138
APPENDIX A: MIX DESIGN FOR THE GEOPOLYMER CONCRETE 150
APPENDIX B: COMPRESSIVE STRENGTH MEASUREMENTS FOR THE 151
GEOPOLYMER CONCRETE MIXES
APPENDIX C: STATISTICAL ANALYSIS OF THE GEOPOLYMER 152
CONCRETE COMPRESSIVE STRENGTH
APPENDIX D: PH DEPENDENCE LEACHING TEST RESULTS FOR 160
OTHER ELEMENTS
APPENDIX E: ENLARGED CUMULATIVE PLOT OF THE ELEMENTS 165
APPENDIX F: INPUT FILE FOR PHREEQC/PHREEPLOT 167
APPENDIX G: OUTPUT FILE FOR PHREEQC/PHREEPLOT 170
APPENDIX H: MOLAL CONCENTRATION OF ELEMENTS OBTAINED 181
FROM THE MODEL

xi
LIST OF FIGURES
FIGURE 2-1: Simplified representation of geopolymer reaction mechanism. 17
FIGURE 2-2: Polymeric precursor that form geopolymers 18
FIGURE 2-3: Conceptual structure of Na-PSS geopolymer 19
FIGURE 2-4: Schematics of ettringite crystal structure 29
FIGURE 2-5: Oxyanion substituted ettringite structure 30
FIGURE 2-6: Schematics of hydrocalumite structure 30
FIGURE 2-7: Schematics of monosulfoaluminate structure 31
FIGURE 3-1: Mobility of elements from the geopolymer paste (category 1) 43
FIGURE 3-2: Mobility of elements from the geopolymer paste (category 2) 43
FIGURE 3-3: Mobility of elements from the geopolymer paste (category 3) 44
FIGURE 3-4: Mobility of elements from the geopolymer paste (category 4) 44
FIGURE 3-5: Compressive strength of the fly ash based geopolymer concretes 48
FIGURE 3-6: Concentration of the leached oxyanion forming elements 48
FIGURE 4-1: Schematics of the geopolymer concrete production 54
FIGURE 4-2: Steel pestle and mortar used in crushing the geopolymer concrete 54
FIGURE 4-3: Cone and quartering process 55
FIGURE 4-4: Crushed and size reduced geopolymer concrete sample 55
FIGURE 4-5: Rocklab ring grinder used in grinding the geopolymer concrete samples 56
FIGURE 4-6: Cured geopolymer concrete a) cured without heat, b) heat cured 57
FIGURE 5-1: Particle size distribution of the aggregates 59
FIGURE 5-2: Laser diffraction particle size analyzer 60
FIGURE 5-3: Particle size distribution of CFA and SF (volume % ) 61

xii
FIGURE 5-4: Particle size distribution of CFA and SF (cumulative volume %) 61
FIGURE 5-5: Compressive strength of the geopolymer concrete cured with heat 62
FIGURE 5-6: Compressive strength of geopolymer concrete cured without heat 64
FIGURE 5-7: ANC/BNC curve of CFA 65
FIGURE 5-8: ANC/BNC curve of SF 66
FIGURE 5-9: ANC/BNC curve of GPC 66
FIGURE 5-10: ANC/BNC curve of GP1 67
FIGURE 5-11: ANC/BNC curve of GP2 67
FIGURE 5-12: ANC/BNC curve of GP3 68
FIGURE 6-1: pH dependence test experimental setup 73
FIGURE 6-2: pH dependence mobility of As from the CFA and SF 74
FIGURE 6-3: pH dependence mobility of Cr leached from the CFA and SF 75
FIGURE 6-4: pH dependence mobility of Se from the CFA and SF 76
FIGURE 6-5: pH dependence mobility of As from the geopolymer concretes 77
FIGURE 6-6: pH dependence mobility of Cr from the geopolymer concretes 78
FIGURE 6-7: pH dependence mobility of Se from the geopolymer concretes 79
FIGURE 6-8: Schematics of the Dutch availability test 81
FIGURE 6-9: Availability of As, Se and Cr from the starting materials 81
FIGURE 6-10: Availability of As, Cr and Se from geopolymer concrete samples 82
FIGURE 6-11: Schematic of the tank leaching test 84
FIGURE 6-12: the tank leaching test setup 84
FIGURE 6-13: Release of As from the geopolymer concrete samples 85
FIGURE 6-14: Release of Se from the geopolymer concrete samples 87

xiii
FIGURE 6-15: Release of Cr from the geopolymer concrete samples 88
FIGURE 6-16: As availability in tank test in relation to total availability 92
FIGURE 6-17: Se availability in tank test in relation to total availability 92
FIGURE 6-18: Cr availability in tank test in relation to total availability 93
FIGURE 7-1: Schematic of the XRD setup 102
FIGURE 7-2: XRD diffractogram for the CFA and SF used 103
FIGURE 7-3: XRD diffractogram for the GPC geopolymer concrete 104
FIGURE 7-4: XRD diffractogram for the GP1 geopolymer concrete 105
FIGURE 7-5: XRD diffractogram for the GP2 geopolymer concrete 106
FIGURE 7-6: XRD diffractogram for the GP3 geopolymer concrete 107
FIGURE 7-7: JOEL SEM equipped with energy dispersive spectrometry (EDX) 108
FIGURE 7-8: SEM micrograph of CFA and SF 109
FIGURE 7-9: SEM micrograph of the GPC geopolymer concrete 110
FIGURE 7-10: SEM micrograph of the GP1 geopolymer concrete 110
FIGURE 7-11: SEM micrograph of the GP2 geopolymer concrete 111
FIGURE 7-12: SEM micrograph of the GP3 geopolymer concrete 111
FIGURE 7-13: EDX spectrum of CFA 113
FIGURE 7-14: EDX spectrum of SF 113
FIGURE 7-15: EDX spectrum of GPC 113
FIGURE 7-16: EDX spectrum of GP1 114
FIGURE 7-17: EDX spectrum of GP2 114
FIGURE 7-18: EDX spectrum of GP3 114
FIGURE 8-1: Typical distribution of As species from the PHREEPLOT simulation 124

xiv
FIGURE 8-2: Typical distribution of Se species from the PHREEPLOT simulation 125
FIGURE 8-3: Typical distribution of Cr species from the PHREEPLOT simulation 126
FIGURE D-1: pH dependence mobility of elements from CFA and SF 160
FIGURE D-2: pH dependence mobility of elements from CFA and SF 161
FIGURE D-3: pH dependence mobility of Mo and V from the CFA and SF 162
FIGURE D-4: pH dependence mobility of Mo and V from the geopolymer concretes 162
FIGURE D-5: pH dependence mobility of elements from the geopolymer concretes 163
FIGURE D-6: pH dependence mobility of elements from the geopolymer concretes 164
FIGURE E-1: Plot showing enlarged cumulative release of As 165
FIGURE E-2: Plot showing enlarged cumulative release of Se 165
FIGURE E-3: Plot showing enlarged cumulative release of Cr 166

xv
LIST OF TABLES
TABLE 2-1: Chemical requirement for fly ash classification (% mass) 14
TABLE 2-2: Typical chemical composition of coal fly ash and cement (%) 14
TABLE 2-3: Typical total amount of some trace elements present in CFA 15
TABLE 2-4: Summary of various leaching test methods 22
TABLE 2-5: Chemical properties and MCL of As, Cr and Se 27
TABLE 2-6: Redox states of the oxyanions in alkaline environment 28
TABLE 3-1: Experimental phases for the dissertation 39
TABLE 3-2: Experimental conditions for the availability tests 46
TABLE 4-1: Mix design for the geopolymer concrete (kg/m3) 53
TABLE 5-1: Chemical composition of the CFA and SF (mass %) 58
TABLE 5-2: Natural pH of the materials 68
TABLE 5-3: Moisture content and bulk density of the materials 69
TABLE 6-1: Relevant leaching test during life cycle of cementitious materials 72
TABLE 6-2: Leachability index (LX) of As, Se and Cr from geopolymer concrete 90
TABLE 6-3 :The LX range for different rate of mobility 91
TABLE 6-4: Percentage depletion in relation to total available fraction 94
TABLE 6-5: Temp and pH of the water leach test leachates 94
TABLE 6-6: concentration of cations in the water leach test leachates 95
TABLE 6-7: Concentration of anions in the water leach test leachate 96
TABLE 6-8: TCLP Regulatory limits of As, Cr and Se 97
TABLE 6-9: Comparison of amount leached from geopolymer (mg/kg) 98
TABLE 6-10: Residential risk based screening levels 99

xvi
TABLE 7-1: Mineral phases detected in the geopolymer concretes 107
TABLE 7-2: Elemental composition of the geopolymer concretes 115
TABLE 8-1: Databases associated with PHREEPLOT 118
TABLE 8-2: Mineral phases manually added to the simulation 122
TABLE 8-3: Comparison of input and PHREEPLOT model output concentration 127
TABLE A-1: Mix design for the geopolymer concrete (kg/m3) 150
TABLE A-2: Percentage of each component in the geopolymer concrete (%) 150
TABLE A-3: Explanation of notations used in mix design 150
TABLE B-1: Compressive strength of the geopolymer concrete (psi) 151
TABLE B-2: Compressive strength of geopolymer concrete (MPa) 151
TABLE H-1: Molal concentration from simulation at pH 11.588 181

xvii
LIST OF ABBREVIATIONS
AMSCD American mineralogist crystal structure database
ANC acid neutralization capacity
As arsenic
ASTM American society for testing and materials
BNC base neutralization capacity
CA coarse aggregate
CASH calcium aluminosilicate hydrate
Cd cadmium
CFA coal fly ash
Cr chromium
Cs cesium
CSH calcium silicate hydrate
Cu copper
De effective diffusion coefficient
DI deionized water
DL detection limit
EDX energy dispersive x-ray spectroscopy
ELT equilibrium leach test
EP Tox extraction procedure toxicity test
FA fine aggregate
Fe iron
Gt gigaton

xviii
Hg mercury
IC ion chromatography
ICP-AES inductively coupled plasma atomic emission spectrometer
ICP-MS inductively coupled plasma mass spectrometer
L/S liquid to solid ratio
LOI loss on ignition
LX leachability index
MCL maximum contaminant level
MEP multiple extraction procedure
Mo molybdenum
MPa megapascal
Mt megaton
NEN Netherlands standardization institute
OPC ordinary Portland cement
Pb lead
ppm part per million
PS polysialate
PSD particle size distribution
PSDS polysialate disiloxo
PSS polysialate siloxo
RCA recycled concrete aggregate
Sb antimony
SCM supplementary cementitious materials

xix
Se selenium
SEM scanning electron microscope
SF silica fume
SI saturation index
SPLP synthesis precipitation leach procedure
TCLP toxicity characteristics leaching procedure
USEPA united states environmental protection agency
V vanadium
W tungsten
WLT water leach test
XRD x-ray diffraction
XRF x-ray fluorescence
Zn zinc

CHAPTER 1: INTRODUCTION
This chapter presents the main research problem addressed in this PhD
dissertation together with the main research objectives and hypotheses. The chapter starts
with a brief background section related to concrete and geopolymer concrete to provide
the reader with the right context used to formulate the problem statement and associated
objectives, hypotheses and work plan.
1.1 Background
Concrete is the most widely used material in the world after water (van Oss and
Padovani, 2002; Hardjito and Rangan, 2005; Damtoft et al., 2008), and a very important
construction material used in many civil engineering applications such as buildings,
sidewalks, bridges, dams and industrial plants. The material is typically manufactured
from components that include approximately 65% to 80% aggregates (fine and coarse),
between 10% to 12% cement, a maximum of 21% water and between 0.5% to 8% air
content (van Oss and Padovani, 2003; Quiroga and Fowler, 2004). All these components
are in percentage by weight of the total. Cement is the major component of concrete
because it is the binding agent holding the aggregates together thereby giving the
conglomerate its characteristic strength and durability. Fine aggregates utilized in
concrete are typically natural sand or fine crushed stones with particle size that range
from 150 µm to a maximum of 4.75 mm while coarse aggregates are typically natural

2
gravel or granitic stones with a minimum particle size of 4.75 mm (Badur and
Chaudhary, 2008).
Aggregates are a very important component of the concrete mix that has a great
effect on the resulting concrete physical properties. In order to obtain concrete of specific
characteristics, other components such as superplasticizers and retarders can be added
during the mixing process to respectively improve the workability and reduce the setting
time of the concrete (Badur and Chaudhary, 2008). Ordinary Portland Cement (OPC) is
the most commonly used type of cement; it sets and hardens in the presence of water due
to hydration reaction. In making construction grade concrete, cement usage can typically
be either 100% OPC or a mixture of OPC and other supplementary cementitious
materials (SCM) such as steel slag and fly ash (Struble and Godfrey, 2004).
Manufacturing of OPC involves mining limestone and shale, heating the mixture
(limestone and shale) in a rotary kiln to convert the limestone into lime via a process
known as calcination, and finally grinding the resulting cement clinker with gypsum
(Struble and Godfrey, 2004). This production process is very energy intensive and
involves the release of greenhouse gases such as CO2 and N2O into the atmosphere. For
every metric ton of cement produced, there is approximately 0.8 metric ton CO2 released
to the atmosphere (Gartner, 2004). An estimated 80.2 megatons (Mt) CO2 per year were
generated from cement production in the United States between 1996-2000 (van Oss and
Padovani, 2002). Apart from the emission of CO2, other environmental issues associated
with cement production are dust, noise, and vibration.
One way of reducing CO2 emission associated with concrete usage is to reduce
the amount of cement utilized in making concrete by increasing the use of SCM

3
(Bremner, 2001). There have been up to 35% replacement of OPC in concrete with SCM
such as fly ash (Tempest, 2010), which is a pozzolan that reacts with Ca(OH)2 from OPC
hydration to form additional calcium silicate hydrate (CSH) gel thereby improving the
later day strength of concrete (Hardjito and Rangan, 2005). Most of the fly ash used as
SCM in concrete comes from coal fired power plants. According to the American Coal
Ash Association, about 72 million tons of coal fly ash is produced in the United States
annually, with only 44% being re-utilized in various applications and the remaining
disposed in landfills (ACAA, 2008). This huge abundance of fly ash created an
opportunity for achieving high replacement of OPC in concrete with the material.
Coal fly ash (CFA) is a highly heterogeneous material that is enriched with major
elements such as silicon (Si), aluminum (Al), calcium (Ca) and iron (Fe) accounting for
nearly 90% of the fly ash composition (Jankowski et al., 2006; Jegadeesan et al., 2008;
Izquierdo and Querol, 2011). Other elements present in CFA include trace elements such
as antimony (Sb), arsenic (As), boron (B), cadmium (Cd) chromium (Cr), cobalt (Co),
lead (Pb), selenium (Se), nickel (Ni), zinc (Zn) and copper (Cu) which account for a
small percentage of the bulk composition (Dogan and Kobya, 2006; Izquierdo and
Querol, 2011). The composition of elements present in CFA varies greatly mainly due to
the coal source, particle size of the coal, combustion process and type of ash collector
(Jankowski et al., 2006; Jegadeesan et al., 2008). The presence of the high content of Si,
Al and Ca makes coal fly ash a suitable SCM and source aluminosilicate material for
synthesis of alkali activated binder. But the presence of trace elements that are
susceptible to leaching from the material into the environment may impact the suitability
of coal fly ash for beneficial reuse (Jegadeesan et al., 2008).

4
In the 1970s, Prof Davidovits pioneered the development of a new binder termed
―geopolymer‖ (Davidovits, 1991) which can completely replace Portland cement in
concrete. This new binder is an inorganic three-dimensional (3D) polymeric material
made from the reaction of any material rich in silica and alumina (aluminosilicate) with a
strong alkaline solution (activator) that contains sodium silicate and or sodium hydroxide
(Duxson et al., 2007; Komnitsas and Zaharaki, 2007; Provis and van Deventer, 2009).
Aluminosilicate materials such as metakaolin, kaolinite, steel slag, coal fly ash and rice
husk ash also have been successfully used in the production of geopolymer (Nazari et al.,
2011).
Studies have shown that geopolymer possesses excellent properties that include
high compressive strength, acid and heat resistance, low shrinkage and the potential or
ability to immobilize hazardous contaminants within its matrix (Davidovits, 1991;
Komnitsas and Zaharaki, 2007; Tempest, 2010), making it a suitable replacement for
cement in concrete and waste stabilization. In the past years, there has been rapid
progress in the development of geopolymer from coal fly ash, research groups from
Curtin University of Technology and the University of Melbourne in Australia which are
leading in this area of research. Hardjito and Rangan (2005) from Curtin University of
Technology pioneered the production of concrete specimens using fly ash based
geopolymer as binder instead of OPC. In 2008, our materials research team at the
University of North Carolina at Charlotte led by Dr. Brett Tempest with support of Drs.
Janos Gergely and Vincent Ogunro started work on fly ash based geopolymer concrete.
The majority of the work to date completed focused on engineering characterization of

5
geopolymer concrete for structural components like columns, reinforced beams, and large
scale girders (Tempest, 2010).
Most of the research that has been done on geopolymer paste, mortar and concrete
to date has been extensively on understanding their chemistry and reaction mechanism,
curing conditions, durability, mineralogy, microstructure and other engineering
properties. In contrast, there has been very little environmental related characterization
such as the leaching of potentially hazardous elements.
1.2 Problem Description
The limited environmental characterization conducted on geopolymer have shown
that potentially toxic elements can leach out when the material is exposed to aqueous
environment (Bankowski et al., 2004; Xu et al., 2006; Izquierdo et al., 2009), which
might be harmful to human and the environment when released in high concentrations.
The majority of these environmental characterization have focused primarily on cationic
elements (Xu et al., 2006; Izquierdo et al., 2009) such as lead (Pb), copper (Cu), mercury
(Hg), cesium (Cs), zinc (Zn), cadmium (Cd) and iron (Fe), and very limited study on
elements that form oxyanionic species (Bankowski et al., 2004; Izquierdo et al., 2010)
such as arsenic (As), selenium (Se), chromium (Cr), vanadium (V), antimony (Sb),
molybdenum (Mo), and tungsten (W) which are characterized by their high mobility at
neutral to alkaline pH.
Due to the alkaline nature of geopolymer, and the known high mobility of
oxyanion forming elements (As, Cr, Se) at high pH, their potential release from
geopolymer make them elements of great environmental concern. In order to demonstrate
the suitability of fly ash based geopolymer concrete as an everyday construction material,

6
there is a need to minimize the mobility of these elements during the service life and at
end of life of a geopolymer concrete product.
1.3 Significance and Benefit of the Study
Oxyanion forming trace elements (e.g As, Cr, Se) are toxic at very low
concentration thereby making their potential immobilization or decreased mobility
through addition of lime an important factor in the determination of geopolymer as a safe
alternative to cement in construction and waste stabilization. The success of this research
would add to the knowledge of reducing any concern regarding potential environmental
impact of geopolymer which has not been sufficiently investigated by many researchers,
and would produce important parameters for life cycle analysis that could important in
selecting the most environmentally responsible manner of utilizing the product.
1.4 Research Goal and Objectives
The overall goal of the research is to assess/characterize the leaching mechanisms
of oxyanion forming trace elements from coal fly ash based geopolymer concrete/mortar
and investigate the effect of additives such as lime on reduction of element mobility from
the geopolymer concrete by rendering the element partially insoluble. The specific
objectives of the research are:
1. To determine the release of oxyanion elements (As, Cr, Se) from fly ash based
geopolymer concrete under service life (monolithic) and end of service life
(granular) conditions using appropriate tests.
2. To assess the potential to decrease mobility, or even total immobilization of
oxyanion elements (As, Cr, Se) in geopolymer concrete by means of using
hydrated lime as an admixture.

7
3. To determine the maximum amount of oxyanion forming elements that would be
released under the worst case scenario when the material is pulverized.
4. To determine if there is formation of calcium containing mineral phases, calcium
precipitates or calcium metalates in the produced geopolymer concrete.
5. To identify probable mechanisms responsible for immobilization of the oxyanion
forming elements (if there is any immobilization).
6. To determine the species of the oxyanion elements (As, Cr, Se) released from fly
ash based geopolymer concrete and their potential environmental impacts.
1.5 Research Hypotheses
In conducting this study, the following hypotheses were formulated to address the
goal and specific objectives of the research:
1. Oxyanion elements (As, Cr, Se) are present in leachates from fly ash based
geopolymer concrete.
2. Oxyanion forming trace elements exhibit different leaching behavior than other
elements that are leached from the alkaline fly ash based geopolymer.
3. Standard leaching test methods conducted at a neutral pH are adequate for
predicting the leaching of oxyanion forming elements.
4. Calcium containing mineral phases such as ettringite, hydrocalumite,
monosulfoaluminate, calcium metalates and calcium silicate hydrates (CSH) are
effective for immobilizing oxyanion forming elements via ion substitution.
5. Leaching of these oxyanion forming elements can be mitigated by the addition of
extra calcium in the form of lime during the geopolymer synthesis, which would
lead to the formation of oxyanion substituted calcium containing mineral phases
8
in addition to the geopolymer phase without affecting the durability of the
geopolymer.
1.6 Scope of Work
This dissertation focuses mainly on geopolymer concrete produced from class F
fly ash (low calcium), silica fume (as the additional silica source), hydrated lime
(Ca(OH)2) as source of additional calcium and aggregates that make up not more than
70% of the concrete mix that has a target 28 days compressive strength of 41 MPa (6000
psi). The study was based solely on laboratory investigation that focuses on the service
life condition (monolith state) and end of life condition (granular state) of the
geopolymer. Laboratory speciation analysis was not performed to determine the species
of the elements leached from the geopolymer concrete. Geochemical modeling using
PHREEQC/PHREEPLOT was employed in predicting the species of the elements in the
leachates.
1.7 Organization of the Dissertation
The dissertation is organized into nine chapters. Chapter 1 describes the impetus
for the study of the mobility of oxyanion forming trace elements from fly ash based
geopolymer concrete. Chapter 2 presents review of relevant literature on geopolymer and
leaching of elements. Topics covered in this chapter include the historical development of
geopolymer as an alternative binder, source material used for geopolymer synthesis, and
mobility/immobilization of the oxyanion forming trace elements.
Chapter 3 describes the research approach used, the starting materials, summary
of the experimental methods, preliminary investigation completed, procedures for quality
assurance and quality control, and statistical tools employed for data analysis.

9
Geopolymer concrete synthesis is presented in Chapter 4. The chapter also describes
sample preparation methods used in the study. Chapter 5 focuses on materials
characterization such as particle size distribution (PSD), X-Ray fluorescence (XRF)
analysis, and acid/base neutralization capacity (ANC/BNC). The entire laboratory
leaching test methods employed and results obtained are presented in Chapter 6.
Chapter 7 contains the mineralogical and microstructural characterization of the
starting materials and produced geopolymer concrete samples using X-Ray diffraction
(XRD) and scanning electron microscope (SEM)/energy dispersive spectroscopy (EDX)
analysis. Chapter 8 describes the application of PHREEQC/PHREEPLOT to predict the
speciation of oxyanion elements from the geopolymer concrete leachates. The last
chapter of the dissertation, Chapter 9 presents the conclusions drawn from this
investigation and presents recommendations for future research work.

CHAPTER 2: LITERATURE REVIEW
2.1 Historical Development of Geopolymer as Alternative Binder
Portland cement has been the dominant binder used in concrete and mortar since
it was developed by Joseph Aspdin in the early 19th century. It is the most abundant
building material due to its versatility and economic values, with annual worldwide
production estimated to be around 3 gigatons (Gt) (Juenger et al., 2010). However, there
are environmental issues such as huge energy consumption, particulate emission and
enormous release of CO2 arising from the manufacturing of this binder. Infact, it is
considered one of the largest industrial emitter of CO2, a greenhouse gas that causes
global warming (van Oss and Padovani, 2002). With the growing concern about threats
posed by increased release of CO2 to the atmosphere, attempts have been made at
reducing the percentage of cement used in making concrete by replacing them with SCM
such as coal fly ash, ground blast furnace slag and silica fume in the hope of reducing the
overall environmental impact (Juenger et al., 2010). Researchers also seek to find
alternative binders with reduced energy use and low CO2 emission that can completely
replace cement which led to the development of alkali activated binders.
Alkali activated binders were considered as an alternative binder due to their
durability, low energy and reduced CO2 emission, hence resulting in reduced
environmental impacts. These binders are sometimes referred to as inorganic polymer,
geopolymer, alkali activated cement, geocement and soil silicate, with geopolymer being

11
the most commonly used name (Duxson et al., 2007; Komnitsas and Zaharaki, 2007;
Juenger et al., 2010). They are produced from the reaction of aluminosilicate raw
materials with an alkaline solution.
Although the term geopolymer was coined by Joseph Davidovits in the 1970s to
describe an alkali activated binder developed from metakaolin with the hope of producing
a fire resistant plastic material (Davidovits, 1991), similar alkali activated binders have
been described earlier by Purdon in the 1940s and Glukhovsky in the 1950s (Roy, 1999;
Komnitsas and Zaharaki, 2007; Škvára, 2007; Pacheco-Torgal et al., 2008b). The
aluminosilicate source material used by most of the earlier researchers was ground blast
furnace slag. It was reported that activation of blast furnace slag led to an alkali activated
systems that contains both calcium silicate hydrate gel (CSH) and aluminosilicate phase
since the blast furnace slag is rich in calcium (Komnitsas and Zaharaki, 2007), while the
activation of metakaolin produced only a zeolite-like aluminosilicate phase (Sakulich,
2009).
2.2 Basic Concept of Geopolymer
As discussed in the previous section, geopolymer is a generic name used to
describe all alkali activated binders synthesized from the reaction of an aluminosilicate
source with a strong alkali activating solution that contains a mixture of Na2SiO3 and
NaOH or KOH solution (Pacheco-Torgal et al., 2008a). The aluminosilicate material is
dissolved by the alkali solution which also provides additional silicate required for the
geopolymerization process. Silica fume is sometimes used instead of Na2SiO3 as the
source of additional reactive silica (Tempest, 2010). Geopolymer gel formation is
achieved by the application of mild heat at a temperature less than 100oC.

12
Many curing regime have been implemented for geopolymer, Kong and Sanjayan
(2010) cured geopolymer specimens at ambient temperature for 24 hours before oven
curing at 80oC for additional 24 hours. Similar curing regime was employed by Tempest
(2010) but the temperature of the oven was set to 75oC. Perera at al. (2007) used a curing
schedule that involves oven curing of several specimens at 22oC, 40
oC, 60
oC, and 80
oC in
order to investigate the effect of temperature on geopolymerization and reported that at
higher temperature, the chemical reactions are accelerated leading to the formation of
higher strength geopolymer concrete. The optimal curing temperature for the formation
of geopolymer was reported to be 75oC (Pacheco-Torgal et al., 2008a).
2.2.1 Source Materials for Geopolymer Synthesis
Metakaolin, granulated blast furnace slag, and coal fly ash are the most commonly
used source materials in geopolymer synthesis. Metakaolin is obtained by the calcination
of kaolinite at high temperature (Cioffi et al., 2003) while blast furnace slag is a
byproduct of iron production. Coal fly ash on the other hand is obtained as a byproduct of
the combustion process in coal fired power plants.
Komnitsas and Zaharaki (2007) reported that geopolymer made from metakaolin
are too soft for construction purposes due to high porosity as a result of high water
requirement, thereby hindering further use of this starting material.
Blast furnace slag based geopolymer on the other hand have been reported as
containing calcium silicate hydrates (CSH) and calcium aluminosilicate hydrates (CASH)
in addition to the geopolymer phase as a result of the high content of calcium in the
starting material (Pacheco-Torgal et al., 2008b).

13
Fly ash based geopolymer provides significant advantage over other alternative
binders (Provis et al., 2009) due to the cheaper cost associated with coal fly ash when
compared to other source material like metakaolin which resulted in porous and soft
geopolymer.
In recent years, many researchers have focused on using coal fly ash as the main
aluminosilicate source for geopolymer synthesis due to its high silica content and its
abundance as a waste product. But due to variability of fly ash as a result of
characteristics such as their amorphous content, chemical composition, fineness, calcium
content and unburned organic content, producing geopolymer of consistent and
acceptable quality might be a big challenge (Tempest, 2010). These led to the
investigation of coal fly ash characteristics that can make them suitable for producing
geopolymer of acceptable quality. Khale and Chaudhary (2007) reported that fineness is
one important characteristic that affect strength development in geopolymer. Tempest
(2010) stated that loss on ignition (LOI), chemical composition, calcium and amorphous
content of the coal fly ash are also important characteristics that contribute to the quality
of the produced geopolymer. It is thus necessary to select coal fly ash that possessed
these characteristics that would lead to an acceptable geopolymer.
Coal fly ash is classified based on chemical composition as either Class F and
Class C ash (ASTM, 2008) as shown in TABLE 2-1. Class C ash are referred to as high
calcium ash because they contain more than 20% CaO, a minimum of 50% SiO2 + Al2O3
+Fe2O3 and self-cementing properties while Class F ash are referred to as low calcium
ash due to the low content of CaO (<10%), a minimum of 70% SiO2 + Al2O3 + Fe2O3 and
non self-cementing properties (ASTM, 2008). Class F fly ash is mostly used in the

14
production of geopolymer due to higher content of silica and alumina and low amount of
CaO since the amount of CaO in the starting material significantly affect the properties of
hardened geopolymer (Diaz et al., 2010). Higher content of CaO contained in Class C fly
ash would alter the microstructure of the produced geopolymer leading to formation of
more hydration products such as CSH instead of the geopolymer phase (Temuujin et al.,
2009). TABLE 2-2 shows the typical chemical composition of the two main types of coal
fly ash. For comparison purpose, this table also shows composition of Portland cement
TABLE 2-1: Chemical requirement for fly ash classification (% mass)
Class F Class C
SiO2 + Al2O3 + Fe2O3, (min %) 70 50
SO3, (max %) 5.0 5.0
Moisture content, (max %) 3.0 3.0
Loss on ignition (LOI), (max %) 6.0 6.0
Available alkali as Na2O, (max%) 1.5 1.5
Source: ASTM (2008)
TABLE 2-2: Typical chemical composition of coal fly ash and cement (%)
SiO2 Al2O3 Fe2O3 CaO MgO SO3
Class F 55 26 7 9 2 1
Class C 40 17 6 24 5 3
Portland cement 23 4 2 64 2 2
Source: ACAA (2003)
15
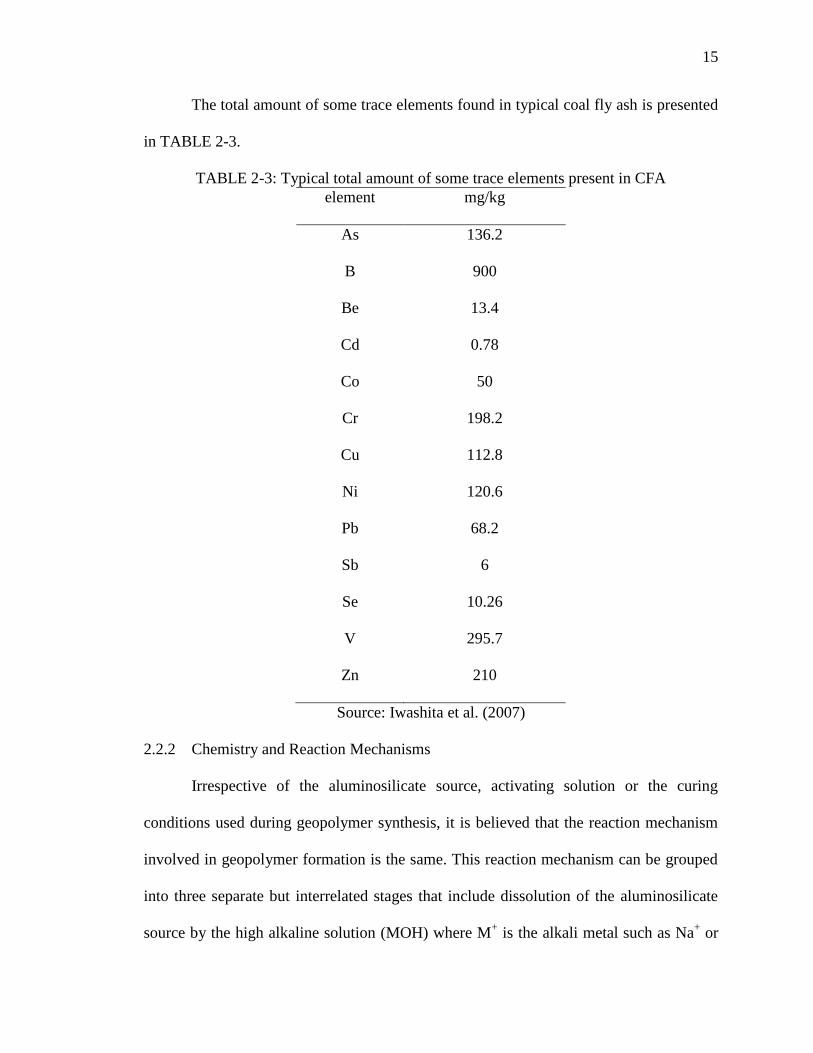
The total amount of some trace elements found in typical coal fly ash is presented
in TABLE 2-3.
TABLE 2-3: Typical total amount of some trace elements present in CFA
element mg/kg
As 136.2
B 900
Be 13.4
Cd 0.78
Co 50
Cr 198.2
Cu 112.8
Ni 120.6
Pb 68.2
Sb 6
Se 10.26
V 295.7
Zn 210
Source: Iwashita et al. (2007)
2.2.2 Chemistry and Reaction Mechanisms
Irrespective of the aluminosilicate source, activating solution or the curing
conditions used during geopolymer synthesis, it is believed that the reaction mechanism
involved in geopolymer formation is the same. This reaction mechanism can be grouped
into three separate but interrelated stages that include dissolution of the aluminosilicate
source by the high alkaline solution (MOH) where M+ is the alkali metal such as Na
+ or

16
K+, followed by reorientation/reorganization of the dissolved species and later
polycondensation to form the hardened geopolymer (Xu and Van Deventer, 2000;
Tempest, 2010). FIGURE 2-1 shows a simplified representation of the reaction
mechanisms involved in geopolymer synthesis.
Dissolution of the aluminosilicate is believed to be initiated by the presence of
hydroxyl ion (OH-) from the alkali hydroxide, leading to the production of aluminate and
silicate monomers (Komnitsas and Zaharaki, 2007). Production of these monomers is
strongly dependent on the reactivity of the source aluminosilicate material, type and
amount of the alkali hydroxide used. Reactivity of aluminosilicate material used in
geopolymer synthesis decreases in the following order: metakaolin > slag> fly ash>
kaolin (Panagiotopoulou et al., 2007; Tempest, 2010). According to Komnitsas and
Zaharaki (2007), higher amount of hydroxyl ions facilitate the production of different
silicates and aluminate species which would lead to further geopolymerization.
During the reorientation stage, free aluminate and silicate monomers in addition
to silicate present in the activation solution come together to form oligomers of varying
polymeric structure. These polymeric units then undergo polycondensation reaction in
which they are joined together by oxygen bond formed from the reaction of adjacent
hydroxyl ions, leading to the formation of the rigid oxygen bonded silica and alumina
tetrahedral structure of geopolymer.
The reaction mechanism revealed that the alkali hydroxide (NaOH or KOH) act as
catalyst that aid the dissolution and condensation stages. Most of the water is expelled
during the high temperature curing since they are not actually involved in geopolymer
formation (Khale and Chaudhary, 2007).

17
FIGURE 2-1: Simplified representation of geopolymer reaction mechanism.
Adapted from Duxson et al. (2007) and Yao et al. (2009)
2.2.3 Structure of Geopolymer
Geopolymer structure as suggested by Davidovits is a poly(sialate) network
consisting of silica (SiO2) and alumina (Al2O3) tetrahedral connected together by sharing
oxygen atoms (FIGURE 2-2). Sialate is an abbreviation for silicon-oxo-aluminate (Si-O-
Al) which form the basic polymeric precursor (Komnitsas and Zaharaki, 2007). Structure
of the polymeric precursor formed depends on the ratio of silica to alumina (Si/Al) in the
starting materials and can be classified according to this ratio. FIGURE 2-2 shows an
illustration of the three polymeric structures that form geopolymers.
M+ (aq)
OH- (aq)
Polycondensation
Reorientation &
reorganization
Aluminosilicate source
3D aluminosilicate network
H2O Silicate
Dissolution H2O
H2O
Aluminate and silicate
Si-O-Al= PS PSS
PSDS Polymeric units
Geopolymer

18
FIGURE 2-2: Polymeric precursor that form geopolymers.(Škvára, 2007)
Higher amount of silicate is required to form the higher order poly(sialate-siloxo)
and poly(sialate-disiloxo) structure. Increase in the Si/Al ratio can be achieved by the
addition of extra reactive silica using Na2SiO3 or silica fume in order to form these
precursors. The polymeric precursors form chain and ring network united by Si-O-Al
bridges with the silicon and aluminum atoms in 4-fold coordination with oxygen.
Metallic cations such as K and Na help keep the formed geopolymer structure neutral by
balancing the charge of Al atoms present in the structure. FIGURE 2-3 shows the
conceptual model of sodium-poly(sialate-siloxo) (Na-PSS) geopolymer.
Equation 2.1 shows the empirical formula that can be used to characterize the
formed geopolymer structure (Komnitsas and Zaharaki, 2007; Pacheco-Torgal et al.,
2008a).
Mn [-(SiO2)z-AlO2]n .wH2O (2.1)
Where M is the alkali cation, n is the degree of polycondenation, z is 1, 2 or 3, and w ≤ 3.
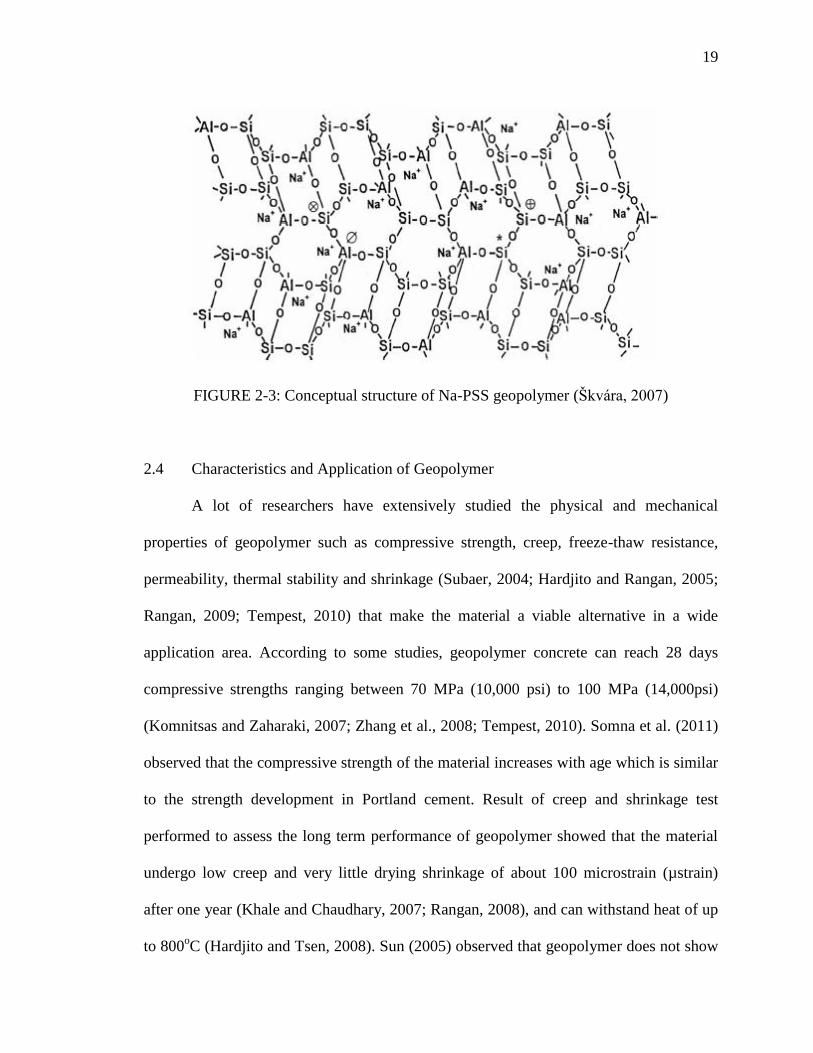
19
FIGURE 2-3: Conceptual structure of Na-PSS geopolymer (Škvára, 2007)
2.4 Characteristics and Application of Geopolymer
A lot of researchers have extensively studied the physical and mechanical
properties of geopolymer such as compressive strength, creep, freeze-thaw resistance,
permeability, thermal stability and shrinkage (Subaer, 2004; Hardjito and Rangan, 2005;
Rangan, 2009; Tempest, 2010) that make the material a viable alternative in a wide
application area. According to some studies, geopolymer concrete can reach 28 days
compressive strengths ranging between 70 MPa (10,000 psi) to 100 MPa (14,000psi)
(Komnitsas and Zaharaki, 2007; Zhang et al., 2008; Tempest, 2010). Somna et al. (2011)
observed that the compressive strength of the material increases with age which is similar
to the strength development in Portland cement. Result of creep and shrinkage test
performed to assess the long term performance of geopolymer showed that the material
undergo low creep and very little drying shrinkage of about 100 microstrain (µstrain)
after one year (Khale and Chaudhary, 2007; Rangan, 2008), and can withstand heat of up
to 800oC (Hardjito and Tsen, 2008). Sun (2005) observed that geopolymer does not show

20
any mass loss after about 300 freeze-thaw cycles, thus having a better freeze-thaw
performance than Portland cement. Permeability of the material was found to be between
10-9
– 10-12
cm/s (Giannopoulou and Panias, 2007) which happens to be a very low value
when compared to other cementitious material.
Due to the excellent properties possessed by geopolymer, the material has been
employed in applications that include thermal insulation, high strength concrete, and
hazardous waste management (Davidovits, 1991; Sun, 2005). Precast structures like
railway sleepers, sewer pipes, box culverts and reinforced beams have been produced
from geopolymer (Lloyd and Rangan, 2010; Tempest, 2010). Other reported areas of
geopolymer application is in waste encapsulation, high strength concrete, thermal
insulation and fire protection of structures (Davidovits, 1991; Provis and van Deventer,
2009). To demonstrate the environmental compatibility of geopolymer in the different
areas of applications, leaching of environmentally relevant trace elements are usually
studied but there are not too many studies. The following subsection summarizes relevant
leachability studies found in the literature.
2.5 Background on Leaching and Mobility of Elements
Leaching tests are techniques used to investigate environmental properties or
characteristics of any material, which can also be used for geopolymer. Leaching is a
process where constituents present in a solid material dissolves into the pore water of the
material when that material is in contact with an aqueous media. The liquid that contains
the released constituent is called the leachate. Some factors such as amount of liquid that
get in contact with the solid (L/S ratio), solubility of the elements, adsorption of the
elements, pH of the pore water, state of the material, redox conditions and reaction

21
kinetics can potentially affect leaching from any material (Bin-Shafique, 2002; Schuwirth
and Hofmann, 2006; Das, 2008).
There are a number of standard leaching test methods that have been developed to
assess mobility of elements from solid materials. A good understanding of the material
and their environment is necessary in order to choose the most appropriate leaching test.
These test methods can be categorized into three types as shown in TABLE 2-4. In
equilibrium oriented leaching test methods, equilibrium between the material and
leaching solution is achieved by agitation of the mixture, while capacity oriented leaching
test examines the maximum amount of each contaminants that can be released from the
material under the worst case scenario (Schwantes and Batchelor, 2006). Dynamic
oriented tests are used to investigate the mechanism responsible for release of
contaminants from the solid material.
The most widely used leaching test methods in the United States are TCLP, WLT,
SPLP, EP Tox, while the use of tests such as pH stat, NEN 7341, 7343 and 7345 are
common in Europe. All the different tests are used to assess leachability of different
material at different exposure scenarios. Results from the various leaching tests are
expressed either as leachates concentration (mg/l) or as constituent released in mg/kg dry
mass for granular material and mg/m2 for the monolith materials.
2.5.1 Mobility of Elements from Geopolymer
Leaching test methods such as TCLP, NEN 7375, NEN 7341 have been used to
assess mobility of elements from geopolymer (Bankowski et al., 2004; Izquierdo et al.,
2010), NEN 7341 have been specifically used to assess the mobility of oxyanion forming
elements.
22
TABLE 2-4: Summary of various leaching test methods
TABLE 2-4 (continued)
Type Leaching test Leaching
medium
L/S Particle
size
Leaching
duration
Reference
Equilibrium
oriented
Toxicity
Characteristics
Leaching
Procedure
(TCLP)
Acetic
acid
20 <9.5mm 18 hours Schwantes
and
Batchelor
(2006)
Extraction
Procedure
Toxicity test
(EP Tox)
0.04 M
acetic
acid (pH
5)
16 <9.5mm 24 hours Schwantes
and
Batchelor
(2006)
Water Leach
Tests (WLT)
Deionized
water
20 <9.5mm 18 hours ASTM
(2006c)
Equilibrium
Leach Tests
(ELT)
Deionized
water
4 <150 µm 7 days Schwantes
and
Batchelor
(2006)
Multiple
Extraction
Procedure
(MEP)
0.04 M
acetic acid
(pH 3)
20 <9.5 mm 24 hours
per stage
(9
extractio
n stages)
USEPA
(1986)

23
TABLE 2-4 (continued)
Type Leaching test Leaching
medium
L/S Particle
size
Leaching
duration
Reference
Synthesis
Precipitation
Leach
Procedure
(SPLP)
Deionized
water
adjusted to
pH 4-5
20 <9.5 mm 18 hours USEPA
(1994)
pH Static
leaching test
Deionized
water
adjusted to
pH 4-13
by HNO3
and NaOH
5 <4 mm 24 hours Schwantes
and
Batchelor
(2006)
USEPA draft
method 1313
Deionized
water
adjusted to
pH 3-13
by HNO3
and NaOH
10 <5 mm 24 hours USEPA
(2009b)
Capacity
oriented
Availability
test
Two steps:
pH 4 and
7
100 <150 µm 3 hours
each step
EA
(2005a)
24
TABLE 2-4 (continued)
Type Leaching test Leaching
medium
L/S Particle
size
Leaching
duration
Reference
Nordtest
availability test
Two steps:
pH 4 and
7
100 <125 µm 1st : 3
hours
2nd
: 18
hours
Nordtest
(1995)
Dynamic
oriented
American
Nuclear
Society (ANS)
leach test 16.1
Sequential
extraction
by
deionized
water
5 -
10
Monolith Sample
at 1, 2, 4,
8, 16, 32,
64 days
Schwantes
and
Batchelor
(2006)
Column test
(NEN 7343)
Systematic
L/S ratio
increase
0.1
-10
<4 mm Schwantes
and
Batchelor
(2006)
Tank test Deionized
water at
pH 4
Monolith Samples
collected
at 0.25,
1, 2.25,
4, 9, 16,
36, 64
days
EA
(2005b)

25
TABLE 2-4 (continued)
Type Leaching test Leaching
medium
L/S Particle
size
Leaching
duration
Reference
USEPA draft
method 1315
Deionized
water
Monolith Samples
collected
at 0.08,
1, 2, 7,
14, 28,
42, 49
and 63
days
USEPA
(2009c)
2.6 Oxyanion Forming Trace Elements
Oxyanions are negatively charged polyatomic species that contain oxygen ions
(Cornelis et al., 2008). Common oxyanions are SO42-
, NO3-, AsO4
3-, and PO4
3-. Trace
elements that form oxyanionic species include boron (B), arsenic (As), chromium (Cr),
selenium (Se), vanadium (V), molybdenum (Mo), tungsten (W) and antimony (Sb).
These elements can form different species of oxyanion depending on pH and redox
potential. Among the elements, As, Cr and Se are considered elements of concern due to
their toxicity and mobility at alkaline pH (Zhang, 2000; Wang, 2007; Izquierdo et al.,
2010), and are listed by the USEPA as priority pollutants in drinking water (Min, 1997;
USEPA, 2009a). Since most elements that form oxyanion exhibit similar behavior,
understanding the behavior of As, Cr and Se would lead to understanding the behavior of
the other elements.

26
2.6.1 Occurrence and Chemistry of Arsenic, Chromium and Selenium
Arsenic is a metalloid found in group 15 and period 4 of the periodic table, it
occurs in association with sulfur containing minerals such as realgar (AsS), orpiment
(As2S3) or arsenopyrite (FeAsS) (Magalhães, 2002). The element is released into the
environment via weathering, volcanism, agricultural applications and waste stream of
industrial process with high concentration in coal fly ash (Jackson, 1998; Moon et al.,
2004). Its abundant in the earth crust is between 1.5 - 2.0 ppm (NAS, 1977).
Selenium is a non-metallic element found in group 16 and period 4 of the periodic
table. This element is not abundant in the earth crust, comprising only 0.05 ppm of the
earth crust (Zhang, 2000). Selenium is a micronutrient required by humans and animals
to maintain good health, and considered a necessary constituent of human diets for many
years (B'Hymer and Caruso, 2006). Deficiency of these micronutrient might inhibit
growth and too much of it can also lead to death. Bond (2000) stated that due to the
narrow range between the beneficial and harmful level of selenium, the USEPA listed the
element among element of concern in drinking water and specified the maximum amount
of the element allowed in drinking water (USEPA, 2009a).
Chromium is a transition element that occur in group 6 and period 4 of the
periodic table, it is the 21st most abundant element in the earth crust with concentration of
about 100 ppm (Barnhart, 1997). It occurs in nature as the mineral chromites (FeCr2O4)
and crocoites (PbCrO4) (Zhang, 2000). The chemical properties and maximum
contaminant level (MCL) of these elements are summarized in TABLE 2-5.

27
TABLE 2-5: Chemical properties and MCL of As, Cr and Se.
Elements Group Atomic
no
Atomic
mass
Electron
configuration
Oxidation
states
MCL
µg/l
As 15 33 74.92 [Ar]4s23d
104p
3 -3, 0,+3,+5 10
Cr 6 24 52.00 [Ar]3d5 4s
1 0,+3,+6 100
Se 16 34 78.96 [Ar]4s2 3d
104p
4 -2,0, +4,+6 50
Sources: Zhang (2000); Paoletti (2002); Cornelis et al. (2008); USEPA (2009a)
In nature, Arsenic (As) occurs mainly in the As+3
(arsenite) and As+5
(arsenate)
oxidation states (Alexandratos et al., 2007), with As+3
being more mobile and reported to
be 25 - 60 times more toxic than As+5
(Moon et al., 2004). Cr+3
and Cr+6
oxidation state
are the most abundant form of chromium (Cr) in nature, with Cr+6
being about 100 times
more toxic and soluble than Cr+3
(Shtiza et al., 2009). Selenium (Se) exist in nature as
Se+4
and Se+6
forming SeO32-
(selenite) and SeO42-
(selenate) oxyanionic species (Bond,
2000).
2.6.2 Environmental Aspect and Toxicity of As, Cr and Se
Oxyanions of As, Cr and Se are very mobile in high alkaline environment and
have low mobility in the acidic environment due to bonding with metal oxyhydroxides
(Zhang, 2000). TABLE 2-6 shows the redox states of As, Cr and Se oxyanionic species
and their form of occurrence in alkaline environment. In this type of environment, As+3
,
As+5
, Cr+3
, Cr+6
, Se+4
and Se+6
are the most predominant redox state because they are
more soluble than those occurring in their elemental and reduced states (Cornelis et al.,
2008).

28
TABLE 2-6: Redox states of the oxyanions in alkaline environment
Element Oxidation states
-2 0 +3 +4 +5 +6
As As0 H2AsO3
- AsO4
2-
Cr Cr0 Cr(OH)4
- CrO4
2-
Se HSe- Se
0 SeO3
2- SeO4
Source: Cornelis et al. (2008)
Arsenic in the trivalent form is more toxic and a known carcinogen that causes
cancer of the liver skin and kidney (Magalhães, 2002). Chromium on the other hand is
most toxic in the hexavalent form and possess mutagenic properties that can damage
circulatory system and cause carcinogenic changes in human (Soco and Kalembkiewicz,
2009).
2.7 Methods of Immobilizing the Leaching of Oxyanion Elements
According to Cornelis et al. (2008), calcium containing mineral phases and
metalate precipitation exert control over the leaching of oxyanions. The authors stated
that minerals such as CSH, ettringite, monosulfoaluminate and hydrocalumite can
partially or fully replace their anions (OH- or SO4
2-) with oxyanions thereby causing
reduction in mobility of these oxyanion forming elements (Cornelis et al., 2008). Several
studies have demonstrated this by showing that mobility of As and other oxyanions in
alkaline environment can be reduced by the addition of lime, which would result in the
formation of either an insoluble calcium precipitate or oxyanion substituted calcium
mineral phases (Moon et al., 2004; Zhu et al., 2006; Alexandratos et al., 2007; Wang et
al., 2007).

29
2.7.1 Incorporation into Ettringite Structure
Ettringite is a hydrated calcium aluminum sulfate hydroxide mineral with
chemical formula (Ca6Al2(SO4)3(OH)12•26H2O) and a needle like crystal structure
depicted in FIGURE 2-4. It is an example of an AFt (alumina ferric oxide tri sulfate)
phase present in cement system whose structure favors extensive ionic substitution
potential that can make the immobilization of oxyanions possible. Substitution of SO42-
present in ettringite structure by oxyanions such as CrO42-
, AsO43-
, SeO42-
, CO32-
, and
NO3- have been reported by Bone et al. (2004) and Cornelis et al. (2008). FIGURE 2-5
depicts an oxyanion substituted ettringite crystal structure.
FIGURE 2-4: Schematics of ettringite crystal structure (Klemm, 1998)

30
FIGURE 2-5: Oxyanion substituted ettringite structure (Cornelis et al., 2008)
2.7.2 Incorporation into Hydrocalumite Structure
Hydrocalumite is an anionic clay mineral composed of stacked portlandite-like
octahedral layers where one third of the Ca2+
sites is occupied by Al3+
(Zhang and
Reardon, 2003). The mineral has a chemical formula Ca4Al2(OH)2(OH)12•6H2O and
structure shown in FIGURE 2-6 which have interlayer water molecule and anions.
FIGURE 2-6: Schematics of hydrocalumite structure (Zhang and Reardon, 2003)
Zhang and Reardon (2003) reported that the substitution of Ca2+
with Al3+
result
in net positive charges on the layers that enable incorporation of anion or oxyanion (Xn-
)
in order to balance the charges on the octahedral layers. Zhang and Reardon (2005)

31
demonstrated the incorporation of oxyanions such as Cr and Se which led to reduction in
leaching of the elements.
2.7.3 Incorporation into Monosulfoaluminate Structure
Monosulfoaluminate is a mineral that can be found in products of cement
hydration, it is an AFm (aluminiate ferric oxide monosulfate) phase that has chemical
formula Ca4Al2SO4(OH)12•6H2O and a lamellar hexagonal platey structure shown in
FIGURE 2-7.
FIGURE 2-7: Schematics of monosulfoaluminate structure (Baur et al., 2004)
Monosulfoaluminate also exhibits similar anionic substitution as ettringite; in this
case the SO42-
and OH- in the structure are replaced by anions or oxyanions. Saikia et al.
(2006) reported that oxyanions can also be incorporated between layers of
monosulfoaluminate structure serving as interlayer anions.
2.7.4 Incorporation into Calcium Silicate Hydrate (CSH)
CSH is a principal hydration product formed during the hydration of alite and
belite phases of Portland cement (Gougar et al., 1996). According to Yip and van
Deventer (2003), CSH gel coexists with geopolymeric gel in geopolymer system if there
is enough calcium present in the system. This CSH gel has positive charged surfaces
which have the potential for adsorbing oxyanions such as, AsO43-
, AsO33-
, SeO32-
and

32
CrO42-
(Cornelis et al., 2008). The successful immobilization of Cr by CSH was reported
by Gougar et al. (1996).
2.7.5 Formation of Precipitates
At pH of around 12.6, the formation of calcium metalate precipitates is reported
to be effective at immobilizing oxyanion forming elements (Bone et al., 2004).
According to Moon et al. (2004), formation of calcium metalate precipitate have been
successful at immobilizing arsenic which occurs in the As+3
form as HAsO32-
and As+5
as
HAsO42-
. Magalhães (2002) stated that calcium arsenates such as weilite (CaHAsO4),
pharmacolite (CaHAsO4•2H2O), haidingerite (CaHAsO4•H2O), phaunouxite
(Ca3(AsO4)2•11H2O) are particularly formed.
2.8 Mineralogical and Microstructural Characterization of Geopolymer
X-Ray diffractometer (XRD) analysis is used to analyze mineral phases present in
solid materials. XRD analysis of geopolymer made from fly ash shows the presence of
quartz (SiO2), mullite (Al6Si2O13) zeolites such as hydroxysodalite (Na4Al3Si3O12OH)
and herchelite (NaAlSi2O6•3H2O), and a diffuse halo peaks at 2θ angle of between 20o –
40o (Fernández-Jiménez and Palomo, 2005; Fernández-Jiménez et al., 2007; Zhang et al.,
2009; Guo et al., 2010). This suggests that geopolymer contains both crystalline and
amorphous (non crystalline) phases.
Microstructure of geopolymers have been observed by a lot of researchers using
the scanning electron microscope (SEM) which is an instrument used to produce high
resolution image of sample surfaces (Das, 2008). The structure of fly ash based
geopolymer reveals that the material consists of crust of shapeless reaction product and
presence of unreacted spherical fly ash particles depending on the degree of reaction

33
(Fernández-Jiménez and Palomo, 2009). Some of these unreacted fly ash particles are
sometimes covered with the reaction products.
2.9 Geochemical Modeling
Geochemical modeling tools have been increasingly used to assess environmental
impact and speciation of elements from materials (Halim et al., 2005) in order to answer
environmental questions such as: (1) How fast contaminants move and when it will reach
a certain point? (2) Whether the concentration of the contaminant exceeds regulatory
limits? (3) What processes will hinder or immobilize the contaminants? (4) What is the
state of the particular site under investigation? Geochemical modeling have been used in
the assessment of high level nuclear waste repositories, exploratory and feasibility studies
of mining sites, and speciation of elements from the interaction between landfill leachates
and liners (Zhu and Anderson, 2002).
According to Zhu and Anderson (2002), geochemical models are divided into
speciation-solubility model, reaction-path model and reactive transport model based on
their level of complexity. Speciation-solubility models perform batch calculations and
provide no spatial or temporal information about the contaminant, reaction path models
on the other hand are used to simulate successive reaction steps in response to mass or
energy flux thereby providing some temporal information about the progress of the
reaction. Reactive transport models are very complex models that provide both temporal
and spatial information of the chemical reactions. The most basic and least expensive
models belong to the speciation-solubility model group, they are suitable for answering
questions about concentration of constituents species present in an aqueous solution, and
their saturation states with respect to various minerals in the aqueous system. Common

34
speciation-solubility models are MINTEQA2, MINEQL+, geochemist‘s workbench,
EQ3/EQ6, SOLMINEQ.88,WATEQ4F and PHREEQC (Zhu and Anderson, 2002; Zhu,
2009). All these models involve batch calculations and serves as the basis for the reaction
path and reactive transport models (Zhu and Anderson, 2002).
PHREEQC (Parkhurst and Appelo, 1999) is the most widely used speciation-
solubility modeling tools with capability that includes performing speciation and
saturation index calculations, batch and one dimensional (1D) reaction transport
calculation, and inverse mass balance modeling (Parkhurst and Appelo, 1999; Zhu and
Anderson, 2002; Bone et al., 2004). According to Parkhurst and Appelo (1999), the
acronym PHREEQC stands for pH values (PH), redox (RE), equilibrium (EQ), and C
programming language (C) which are the most important parameters in the model. The
model utilizes solubility products (Ksp) of aqueous solution, minerals and solid solutions
to calculate the equilibrium state of the system under specific conditions using databases
included in the program which contains information on equilibrium constants and
properties of the different species of minerals, elements and solid solution.
Equilibrium state between the aqueous solution and mineral phases present is
evaluated based on value of the calculated saturation indexes (SI) of the system which is
obtained by relating the ion activity product (IAP) observed in solution and the
theoretical solubility product (Ksp) using Equation 2.2 (Appelo and Postma, 2005;
Andrews, 2007).
SI= log (IAP/Ksp) (2.2)
Andrews (2007) defined SI as the concentration at which dissolved concentration
of mineral components is saturated with respect to the solution. A negative SI value (SI <
35
0) indicates that the solution is undersaturated with respect to the mineral thereby making
the mineral dissolve, positive SI value (SI > 0) means that the solution is supersaturated
with respect to the mineral and the mineral will precipitate, and when SI equals zero, the
solution is in equilibrium with respect to a mineral (Andrews, 2007; Zhu, 2009). For SI
close to zero, the phase is in near equilibrium state with the solution and can be
considered as the controlling phase (Schiopu et al., 2009).
2.10 Summary
Despite the growing interest in geopolymer technology, there have been few
studies on the environmental characterization of the material. These studies have revealed
that geopolymer could leach out elements that include As, Cr and Se which are
considered priority pollutants in drinking water by the USEPA.
According to Cornelis et al. (2008), mobility of oxyanion forming elements can
be reduced using calcium containing mineral phases and metalate precipitation. Ettringite
was found to favor ionic substitution in which the SO42-
present in its structure is replaced
by the oxyanions (Bone et al., 2004). It was also reported by Zhang and Reardon (2003)
that the net positive charge on hydrocalumite structure can enable incorporation of
oxyanions to balance the charge on the mineral. Monosulfoaluminate was also found to
exhibit similar ionic substitution as ettringite (Saikia et al., 2006). In this case, the SO42-
and OH- in the structure are replaced by the oxyanions. Formation of calcium metalate
can also reduce the mobility of the oxyanion forming elements (Bone et al., 2004; Moon
et al., 2004). CSH which coexists with geopolymer gel also have potential for absorbing
oxyanions thereby reducing the elements mobility. It is evident from the literature that
calcium containing mineral phases can successfully lead to a reduction in mobility of

36
oxyanion forming elements which exist in different oxidation states, and whose mobility
and toxicity depends on the specie of the element present in any solution. Geochemical
modeling has been identified as a tool that can be used to assess the speciation of these
elements. PHREEQC, a widely used speciation-solubility modeling tool was considered
an ideal tool for determining the speciation of elements such as As, Cr and Se.
This dissertation would in addition to investigating the mobility leaching
mechanisms of oxyanions (As, Cr, Se) focus on using calcium containing mineral phases
in reducing the mobility of the elements from fly ash based geopolymer concrete, and the
use of PHREEQC/PHREEPLOT to predict the species of each element that would be
released from the material.

CHAPTER 3: EXPERIMENTAL PROTOCOL
3.1 Research Approach
The research approach employed is a quantitative approach which entails the use
of experimental methods to test the stated hypotheses. This approach involves making
geopolymer concretes with varying amount of hydrated lime added during synthesis,
subjecting the material to established experimental techniques at the service life and end
of life of the material life cycle. Cementitious materials like geopolymer concrete exist in
monolith form during its service life and in granular / crushed form at end of life.
Appropriate test methods are chosen for the different stage of the material life cycle.
3.2 Materials
3.2.1 Coal Fly Ash (CFA)
The CFA used in this study was obtained from a coal fired power plant in
Southeastern United States and classified as a Class F ash (as per TABLES 2-1 and 2-2)
based on its chemical composition. The material consists of high amount of oxides of
silicon and aluminum and a low amount of calcium oxide making it a suitable source
material for geopolymer synthesis.
3.2.2 Silica Fume (SF)
The SF used in this study was purchased from Ohio valley alloy services and
contains 98% amorphous silica and meets standard specification for silica fume used in
cement (ASTM, 2010b). Since higher amount of silica (SiO2) is required for geopolymer

38
synthesis, silica fume (SF) was added to increase the silica to alumina ratio (Si/Al) in
order to aid the formation of higher order poly(sialate-siloxo) and poly(sialate-disiloxo)
geopolymer structure.
3.2.3 Sodium Hydroxide (NaOH)
Sodium hydroxide (NaOH) is one of the components in the activating solution
responsible for dissolution of the starting fly ash during geopolymer synthesis. The
NaOH used is a commercial grade NaOH pearls with 98% purity.
3.2.4 Hydrated Lime (Ca(OH)2)
High calcium hydrated lime (Ca(OH)2) supplied by UNIVAR was used in the
study. The hydrated lime has about 95% Ca(OH)2 content with no Mg(OH)2 which
conforms to the specification of type N hydrated lime used in mortar and Portland cement
concrete (ASTM, 2006b).
3.2.5 Aggregates
The coarse (CA) and fine (FA) aggregates used in the study are the same type
used in making Portland cement concrete. The CA and FA are respectively a ⅜ inches
granite stone and silica sand. The aggregates were used in the saturated surface dry (SSD)
condition.
3.3 Experimental Method
The experimental method is divided into five different phases that are
summarized in TABLE 3-1. It consists of the various tasks that are completed to achieve
the research objectives and test the stated hypotheses. Detailed information of the
different experimental phases is presented in subsequent chapters of this dissertation.
Since the material exist in the monolith form during its service life and in crushed or

39
granular form at end of life, some of the geopolymer concretes were tested in the
monolith form and others in the granular/powder form.
TABLE 3-1: Experimental phases for the dissertation
TABLE 3-1 (continued)
Phase Task description
I Characterization of the materials / geopolymer products
a. XRF analysis
b. ANC/BNC test
a. Stabilized pH and moisture content
b. Bulk density and PSD
II Synthesis of fly ash geopolymer concretes and sample preparation
a. Geopolymer concrete without lime
b. Geopolymer concrete with lime
c. Crushing and sub sampling
d. Grinding and sieving
III Laboratory leaching test methods
a. Availability test
b. Tank leaching test
c. pH stat test
d. Water leach test
IV Mineralogical and microstructural characterization
a. XRD analysis
b. SEM/EDX analysis

40
TABLE 3-1 (continued)
Phase Task description
V Geochemical modeling using PHREEQC/PHREEPLOT
a. Speciation modeling
b. Model simulation results and interpretation
3.4 Quality Assurance and Quality Control
Proper sampling technique is used to obtain representative samples of the
geopolymer concrete. Dry granular samples were placed in ziplock bags and stored in a
dry storage container. All samples were immediately labeled to avoid confusion with
other samples. To ensure accuracy and precision in all measurements, all the analysis
except the XRD and SEM are performed in duplicate or triplicate. Blank analyses are
also included in some analytical methods using the same reagents and equipments but
without the samples, this will confirm the presence of any contamination during the
analytical methods.
All glasswares and labwares were acid washed and rinsed three times with
deionized water (DI) before each use. Only recently calibrated scales are utilized in all
weight measurements. All equipments are properly cleaned before testing another sample
to avoid cross contamination of samples. All samples are stored according to standard
storage requirements for each type of sample; liquid for cation analysis are acidified to
pH < 2 to minimize metal cations from precipitating and adsorption onto the storage
container wall (USGS, 1998) while liquid samples for anion analysis are not acidified.
All the liquid samples are then stored in a refrigerator maintained at 4oC or less.

41
3.5 Statistical Analysis of Data
All raw data obtained from the analysis are transformed into easily
understandable data form. The mean and standard deviation of all duplicate and triplicate
measurements are determined. Non parametric statistical analysis such as Kruskal-Wallis
test was used to statistically compare the results obtained from the four geopolymer
concrete samples. Tukey‘s HSD pairwise comparison was used to determine which
geopolymer concrete sample is significantly different from the other. JMP statistical
software version 9.0 by SAS was utilized in all statistical analysis at a 95% confidence
interval.
3.6 Pilot study
This section describes preliminary research studies that was completed on fly ash
based geopolymer concrete and paste in order to become familiarize with the synthesis of
the geopolymer and conducting the experimental methods. Majority of the work have
been on geopolymer paste. Geopolymer concrete samples were later produced with
recycled concrete aggregate (RCA) replacing some of the coarse aggregate. RCA was
incorporated into geopolymer concrete to create an outlet for using demolished concrete
waste and study how excess calcium in the RCA affect mobility of elements from the
produced geopolymer. Most of the results from the preliminary investigation have been
presented in conferences (Sanusi and Ogunro, 2009; Ogunro and Sanusi, 2010; Sanusi et
al., 2011).
3.6.1 Element Mobility from Fly Ash Based Geopolymer Paste
Mobility of 29 elements from geopolymer paste was studied using short term (6
hours) pH leaching test (Ogunro and Sanusi, 2010). In this investigation, geopolymer

42
paste whose components by weight include 67% Class F coal fly ash, 10% NaOH and 8%
SF was produced by mixing activating solution (dissolving SF in hot concentrated
NaOH) with CFA. The mixture was cast in cylindrical mold and cured in the oven at
75oC for 24 hours. Compressive strength of the cylinders was determined at 28 days, the
mortar crushed and pulverized to fine particles required for the pH leaching test. The pH
dependence leaching test used was performed at a liquid to solid (L/S) ratio of 10 with
continuous pH control based on a slight modification of the European standard pH test
CEN/TS 14997 (CEN, 2006). In the test method, the leaching solution pH was
continuously controlled to pH 3, 5, 7, 9, 11 and 13 using HNO3 or NaOH for 6 hours, and
the leachates filtered using 0.45µm membrane filter.
The results obtained reveals that mobility of elements varies across the pH range.
Elements such as barium (Ba), beryllium (Be), cobalt (Co), copper (Cu), manganese
(Mn), zinc (Zn), iron (Fe), magnesium (Mg), boron (B), strontium (Sr), lithium (Li) and
nickel (Ni) display high mobility at low pH which decreases as the pH increases from
acidic to the alkaline pH (FIGURE 3-1 and 3-2). Elements with very high mobility from
the geopolymer paste include aluminum (Al), sodium (Na), silicon (Si), calcium (Ca) and
potassium (K) (FIGURE 3-3) due to their high solubility during the geopolymerization
process. The mobility of these elements is almost constant at the acidic pH range and
increases gradually in the alkaline pH. Mobility of silver (Ag), cadmium (Cd), lead (Pb),
antimony (Sb), tin (Sn) and thallium (Tl) is very low across the pH range. The oxyanion
forming elements such as arsenic (As), selenium (Se), vanadium (V), molybdenum (Mo)
and chromium (Cr) on the other hand display lower mobility in the acidic pH, their
highest mobility occurs at pH between 9 and 11(FIGURE 3-4).

43
FIGURE 3-1: Mobility of elements from the geopolymer paste (category 1)
FIGURE 3-2: Mobility of elements from the geopolymer paste (category 2)
0
5
10
15
20
25
0 2 4 6 8 10 12 14
Con
centr
atio
n (
mg/k
g)
pH
Ba Be Co Cu Mn Zn
0
50
100
150
200
250
300
0 2 4 6 8 10 12 14
Conce
ntr
atio
n (
mg/k
g)
pH
Fe Mg B Sr Li Ni

44
FIGURE 3-3: Mobility of elements from the geopolymer paste (category 3)
FIGURE 3-4: Mobility of elements from the geopolymer paste (category 4)
The preliminary study reveals that depending on the pH of the environment where
geopolymer is been utilized, different elements can potentially leach out. In an acidic
environment, Ba, Be, Co, Cu, Mn, Fe, Mg, B, Sr, Li and Ni are elements that would leach
0
5000
10000
15000
20000
25000
0 2 4 6 8 10 12 14
Conce
ntr
atio
n (
mg/k
g)
pH
Al Na Si Ca K
0
5
10
15
20
25
30
35
40
0 2 4 6 8 10 12 14
Conce
ntr
atio
n (
mg/k
g)
pH
As V Se Ti Mo CR

45
out more while As, V, Se, Tl, Mo and Cr would leach out more in an alkaline
environment similar to the pH of the pore solution within the geopolymer (pH > 9).
Consequently, the focus of this research is to investigate the leachability of some target
oxyanions (As, Se and Cr).
3.6.2 Leaching of Oxyanion Forming Elements from Fly Ash Based Geopolymer Paste
Based on the results obtained from the pH leaching test (Section 3.6.1) which
showed that oxyanion forming elements leach more at the alkaline pH, there is thus a
need to find the most appropriate leaching test that can effectively predict the maximum
leaching of these elements. The Dutch availability test happens to be the most widely
used test for this type of environmental assessment. The test is a two step extraction
procedure conducted at pH 7 and pH 4, with the extraction step conducted at pH 7
designed to determine the leaching of oxyanion forming elements. But with the higher
mobility of the oxyanion forming elements at alkaline pH, the conventional availability
test conducted at pH 7 would underestimate their leaching, thereby creating an
opportunity for modification of the test to reflect the alkaline pH of the geopolymer
(Sanusi and Ogunro, 2009).
The aim of the study is to determine which availability test method is better for
oxyanion element leaching. Geopolymer paste was produced from CFA, NaOH and SF
using the mix design presented in section 3.6.1, and oven cured for 24 hours before
curing at ambient temperature until the 28 days test date. The geopolymer specimens
were crushed, pulverized and size reduced to particles <150µm required for the
availability test. The availability test (NEN 7341) and a modification of the test (MNEN)
was used to determine the leaching of As, Se and Cr from the geopolymer paste. TABLE

46
3-2 shows the experimental conditions for the two tests. In situations where pH needs to
be controlled, HNO3 was used to control the pH for the duration of the extraction step or
procedure.
TABLE 3-2: Experimental conditions for the availability tests
Test pH conditions Test duration
MNEN
1st step No pH control 18 hours
2nd
step 4 ± 0.5 3 hours
NEN
1st step 7 ± 0.5 3 hours
2nd
step 4 ± 0.5 3 hours
Results obtained from the investigation were statistically compared using the
Wilcoxon signed rank test at 95% confidence interval (α=0.05). The hypotheses tested in
this preliminary study is that standard leaching test method conducted at neutral pH is
adequate for predicting the leaching of oxyanion forming elements (As, Cr, Se). The null
(Ho) and alternative (Ha) hypothesis utilized in the statistical comparison are listed
below:
Ho: The concentrations of As, Cr and Se measured in the NEN 7341 and MNEN are
not different (NEN 7341 = MNEN). The test methods are the same.
Ha: The concentrations of As, Cr and Se measured in the NEN 7341 are generally less
than the concentration measured in MNEN (NEN 7341 < MNEN). The MNEN
test method gave results with higher measured concentrations.
The statistical comparison showed that there is no significant difference between
the results from the two test methods for As (p-value=0.6250), Se (p-value=0.6250), and
Cr (p-value=0.1250). In conclusion, it was observed that although the NEN 7341 was
47
conducted at pH 7, it is still effective at predicting the leaching of the oxyanion elements
such as As, Cr and Se and there is no need to consider a modification of the test to reflect
the alkaline nature of the geopolymer (Sanusi and Ogunro, 2011b).
3.6.3 Mitigating Leachability from Geopolymer Concrete using RCA
Based on extensive literature on the immobilizing oxyanions (presented in Section
2.7), this study focused on the use of additional calcium in geopolymer which would lead
to the formation of calcium containing mineral phases needed for the reduction in
mobility of oxyanion forming elements (Sanusi et al., 2011). Three mix of geopolymer
concretes were made using CFA, SF, natural coarse and fine aggregate, with recycled
concrete aggregate (RCA) used as partial replacement for the coarse aggregate. The
mixes made are: GC - geopolymer concrete with 0% RCA, RC10 – geopolymer concrete
with 10% RCA, and RC50- geopolymer concrete with 50% RCA. The RCA was used to
respectively replace 10% and 50% of the coarse aggregate content in the RC10 and RC50
concrete samples.
The CA, FA, CFA and RCA were mixed in a rotary mixer for 3 minutes before
adding the activating solution and the mixture was further mixed for an additional 3
minutes. The concrete was cast in cylindrical mold, aged for 24 hours before oven curing
at 75oC for another 24 hours. Compressive strength of the concretes were determined at
28 days, and the concretes crushed and size reduced to particle < 150µm. Dutch
availability test was used to assess the mobility of As, Cr and Se from the different
geopolymer concrete mix.
The compressive strength result (FIGURE 3-5) showed that replacing coarse
aggregate with RCA lead to increase in strength of the geopolymer concrete. The
48
leaching result presented in FIGURE 3-6 reveals that there is a reduction in mobility of
As and Se as the replacement of coarse aggregate with RCA increases. The study showed
that the use of RCA which contains soluble calcium would lead to an increase in strength
of geopolymer concrete and a reduction in mobility of the oxyanion elements analyzed.
FIGURE 3-5: Compressive strength of the fly ash based geopolymer concretes
FIGURE 3-6: Concentration of the leached oxyanion forming elements
0
10
20
30
40
50
60
GC RC10 RC50
Com
pre
ssiv
e st
rength
(M
Pa)
Geopolymer sample
0
2
4
6
8
10
12
14
16
GC RC10 RC50
Conce
ntr
atio
n (
mg/k
g)
Geopolymer sample
As Cr Se

49
3.6.4 Influence of Lime on Strength and Mobility of Elements from Geopolymer Paste
Motivation for studying the influence of lime on strength and mobility of
elements from geopolymer paste came from findings in the literature that Calcium
containing mineral phases can be used to reduce mobility of oxyanion elements and from
the result obtained from using RCA as partial replacement in geopolymer concrete
presented in section 3.6.3. In this particular study, two geopolymer mix (GPC and GP3)
were made using CFA, SF, NaOH and Ca(OH)2, with the GP3 mix having 3% additional
calcium in the form of Ca(OH)2 (Sanusi and Ogunro, 2011a). The CFA was mixed with
the activating solution which contains SF dissolved in hot concentrated NaOH. The
resulting geopolymer paste was cast in cylindrical mold and cured in the oven for 24
hours at 75oC.
Compressive strength of the geopolymers were determined after 28 days of
curing, and the tank leaching test based on the USEPA draft method 1315 (USEPA,
2009c) was used to investigate the mobility of elements from the monolithic geopolymer
samples. In this leaching test, the monolithic samples were submerged in deionized water
for 64 days in a tightly sealed container. The water was removed and replenished at nine
successive leaching intervals as specified by the leaching standard.
The result showed that there is an observed reduction in compressive strength of
the geopolymer mix made with extra Ca(OH)2 (FIGURE 3-7). The compressive strength
of the geopolymer paste dropped from 52 MPa in the GPC to 45 MPa for GP3, a 13%
reduction in the strength. It is suspected that the extra calcium result in formation of
calcium silicate hydrate (CSH) that hindered the geopolymerization process. Inductively
coupled plasma mass spectrometer (ICP-MS) was used to determine the concentration of

50
16 elements in the leachates collected from the leaching test. It was observed that there
was a slight reduction in the mobility of As, B, Ba, Cr, Fe, Mg, Mo, Se, S, and Zn from
GP3 mix when compared with GPC (FIGURE 3-8) suggesting that the added calcium
resulted in slight leachability reduction. On the basis of these preliminary findings, a
more rigorous and targeted study was developed to test all the hypotheses stipulated in
chapter one.
FIGURE 3-7: Compressive strength comparison for two geopolymer paste mixes
0
10
20
30
40
50
60
GPC mix GP3 mix
Aver
age
28 d
ay c
om
pre
ssiv
e st
rength
(M
Pa)
Geopolymer paste
n= 3

51
0.1
1
10
100
1000
10000
100000
Al As B Ba Ca Cr Cu Fe Mg Mn Mo Na Se Si V Zn
Cu
mu
lati
ve a
mo
un
t le
ach
ed
(m
g/m
2)
Elements
GPC GP3
FIGURE 3-8: Cumulative amount of elements leached from the two geopolymer paste

CHAPTER 4: SYNTHESIS OF GEOPOLYMER CONCRETE AND SAMPLE
PREPARATION
4.1 Synthesis and Preparation of the Geopolymer Concretes
Geopolymer concrete samples were made using the same mix design developed
by Tempest (2010). The mix design used in this study is presented in TABLE 4-1. This
mix was modified by incorporating varying amount of hydrated lime (0%, 0.5%, 1.0%,
and 2.0%) which slightly increased the mass of the total components without changing
the proportion of NaOH (10% NaOH/CFA) and SF (7.5% SF/CFA) in the mix. Due to
the added lime, the water to cementitious material (w/c) ratio varies from 0.364 to 0.358.
According to the mix design, the aggregates (CA and FA) make up 68% of the total
geopolymer concrete mix, while the SF content is 1.6%, NaOH is 2.1%, water and CFA
content are respectively 8.9% and 21%.
The activating solution required for the geopolymer synthesis was prepared the
previous day by dissolving SF in hot concentrated NaOH solution and allowing the
mixture to equilibrate in the oven for 24 hours. The geopolymer concretes were made in a
conventional concrete batch mixer, the FA, CA, Ca(OH)2 and CFA was thoroughly
mixed in a rotary mixer for 3 minutes, and the liquid component (activating solution)
later added and mixed together for additional 2 minutes. The resulting geopolymer
concrete was cast into 76.2mm (3 inches) by 152.4mm (6 inches) plastic cylindrical
molds in three layers, and consolidated by rodding each layer 25 times. Eighteen (18)

53
cylinders were made for each geopolymer concrete mix. After aging for 24 hours at
ambient temperature, nine cylinders were cured in the oven at 75oC for 24 hours while
the remaining nine samples cured without heat at room temperature. The concrete
samples were removed from the molds after 48 hours of casting and allowed to aged for 7
and 28 days at room temperature (25oC).
TABLE 4-1: Mix design for the geopolymer concrete (kg/m3)
Mix Ca(OH)2 (%) CFA FA CA SF NaOH H2O w/c
GPC 0 (0) 483 773 774 36 48 207 0.364
GP1 3 (0.5) 483 773 774 36 48 207 0.363
GP2 5(1.0) 483 773 774 36 48 207 0.361
GP3 10(2.0) 483 773 774 36 48 207 0.358
FIGURE 4-1 shows the schematic for the synthesis of geopolymer concrete cured
in the oven at 75oC. Compressive strength of three specimen from each batch were
determined at 7 and 28 days using the Universal Testing Machine (UTM) in accordance
to the standard method for determining compressive strength of cylindrical samples
(ASTM, 2010a).
4.2 Sampling and Sample Preparation
Sample preparation is considered one important part of the analytical process for
which the samples are prepared to simulate and meet the requirements of specific test
scenario. Material in the monolith form would be used for service life analysis while
materials in crushed or granular form would be used for end of life analysis. Samples for
end of life investigation are crushed into smaller fragments in a steel mortar shown in

54
FIGURE 4-2. The fragments are then combined and thoroughly homogenized to form a
composite sample.
FIGURE 4-1: Schematics of the geopolymer concrete production
FIGURE 4-2: Steel pestle and mortar used in crushing the geopolymer concrete

55
Representative samples of each geopolymer concrete are obtained using cone and
quartering method (FIGURE 4-3) in accordance with the procedures outlined in ASTM
C702 (ASTM, 2003). In the cone and quartering process, the sample is poured into a heap
to form a radial symmetry which is flattened and divided into four quadrants, opposite
quadrants are combined to form reduced sample and the other quadrant discarded. This
sub sampling process is continued as needed to obtain the needed amount of
representative sample.
FIGURE 4-3: Cone and quartering process (After (Allen, 2003))
FIGURE 4-4: Crushed and size reduced geopolymer concrete sample

56
The representative sample (right image in FIGURE 4-4) is ground into fine
powder using the ring grinder shown in FIGURE 4-5. Test samples required for the
analytical tests are obtained by sieving the representative samples to particle size less
than 150 µm (sieve #100).
FIGURE 4-5: Rocklab ring grinder used in grinding the geopolymer concrete samples
4.3 Summary
This chapter presents the synthesis of different geopolymer concrete mixes and
the preparation of the concrete samples for analysis. The geopolymer concrete created
has consistent workability and w/c ratio of about 0.36. The w/c is the ratio of the water
used in the synthesis to the cementitious solids which include the amount of CFA, SF,
NaOH and Ca(OH)2 in the mix design. As the amount of Ca(OH)2 increases, the
workability of the geopolymer concrete reduces because the material harden faster. At
above 2% Ca(OH)2, the geopolymer concrete harden before placement in the mold which
makes the addition of 2% Ca(OH)2 the optimum amount that can be used in the
geopolymer concrete synthesis in accordance with the procedure used for this study.

57
The use of two curing regime (heat curing at 75oC and curing without heat) aims
to identify the effect heat curing has on the leachability and strength of geopolymer
concrete. The main observation from the synthesis of geopolymer concrete using the two
curing regime is the presence of excessive efflorescence on the surface of the geopolymer
concrete cured without heat (FIGURE 4-6). The heat cured geopolymer concrete samples
does not exhibit any efflorescence. Efflorescence is a white powdery deposit of soluble
salts such as sodium carbonate hydrate, sodium carbonate or sodium phosphate hydrate
on the surface of concrete when the soluble salt migrate to the surface of the concrete and
moisture evaporates leaving behind the salt deposit on the surface which then crystallize
(PCA, 2012). Temuujin et al. (2009) reported that efflorescence is an indication of
insufficient geopolymerization which implies that the heat cured geopolymer concrete
forms greater level of geopolymerization.
FIGURE 4-6: Cured geopolymer concrete a) cured without heat, b) heat cured
a b

CHAPTER 5: CHARACTERIZATION OF THE MATERIALS
Characterization of the starting materials and the produced geopolymer concretes
are discussed in this chapter. All the characterization is completed according to standard
protocols. The properties covered are chemical composition and particle size distribution
of the starting materials, compressive strength of the geopolymer concretes, acid/base
neutralization capacity, moisture content and bulk density of all the materials.
5.1 Chemical Composition by X-Ray Fluorescence (XRF) Analysis
The chemical composition of the CFA and SF presented in TABLE 5-1 was
determined using XRF analysis. The analysis was completed by sending the samples to
the geological sciences department at the Michigan State University, East Lansing,
Michigan.
TABLE 5-1: Chemical composition of the CFA and SF (mass %)
SiO2 Al2O3 CaO Fe2O3 MgO Na2O K2O MnO P2O5 TiO2 LOI*
CFA 54.83 28.24 2.45 4.99 0.90 0.22 2.42 0.90 0.23 1.59 3.81
SF 98.48 0.18 0.17 0.18 0.08 0.00 0.12 0.08 0.01 0.00 0.74
*LOI = Loss on ignition
The CFA contains 88% SiO2+Al2O3+Fe2O3 and 2.5% CaO (low calcium) making
the material to be classified as a class F ash according to the ASTM C618 standard. This
type of ash is widely used in the synthesis of geopolymer although Class C (high
calcium) ash can also be used. The only problem with the use of Class C ash is that it
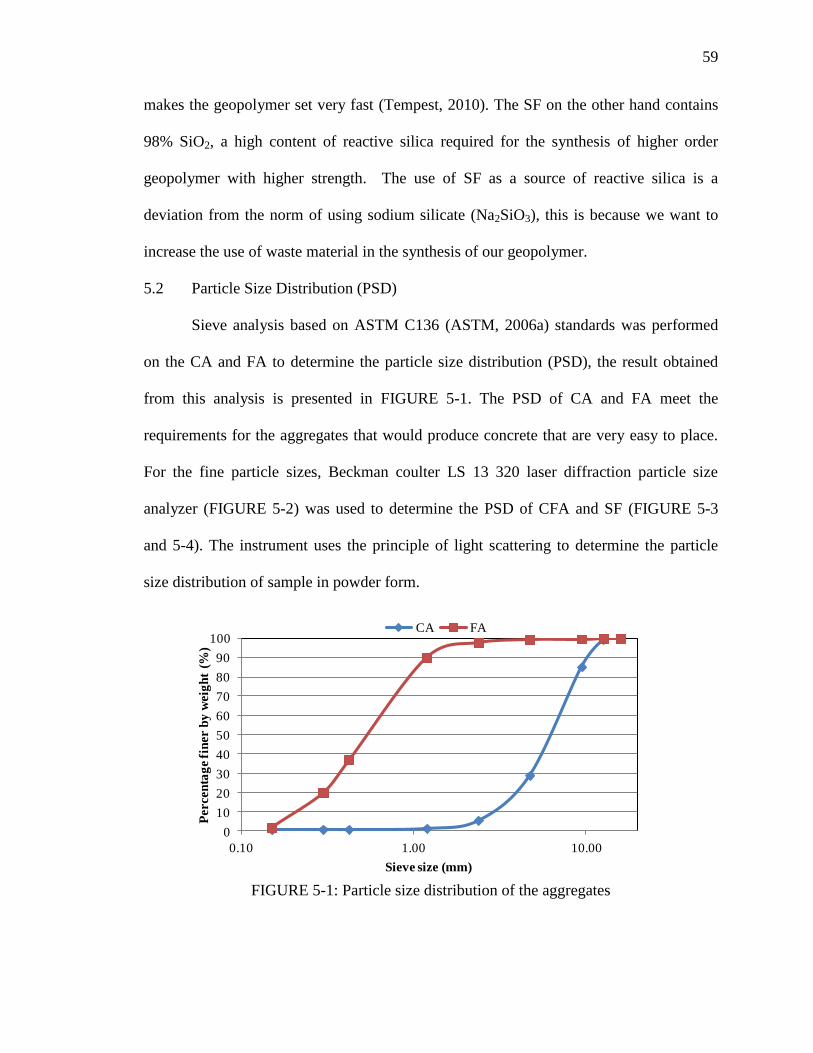
59
makes the geopolymer set very fast (Tempest, 2010). The SF on the other hand contains
98% SiO2, a high content of reactive silica required for the synthesis of higher order
geopolymer with higher strength. The use of SF as a source of reactive silica is a
deviation from the norm of using sodium silicate (Na2SiO3), this is because we want to
increase the use of waste material in the synthesis of our geopolymer.
5.2 Particle Size Distribution (PSD)
Sieve analysis based on ASTM C136 (ASTM, 2006a) standards was performed
on the CA and FA to determine the particle size distribution (PSD), the result obtained
from this analysis is presented in FIGURE 5-1. The PSD of CA and FA meet the
requirements for the aggregates that would produce concrete that are very easy to place.
For the fine particle sizes, Beckman coulter LS 13 320 laser diffraction particle size
analyzer (FIGURE 5-2) was used to determine the PSD of CFA and SF (FIGURE 5-3
and 5-4). The instrument uses the principle of light scattering to determine the particle
size distribution of sample in powder form.
0
10
20
30
40
50
60
70
80
90
100
0.10 1.00 10.00
Percen
tag
e f
iner b
y w
eig
ht
(%)
Sieve size (mm)
CA FA
FIGURE 5-1: Particle size distribution of the aggregates

60
The principle of light scattering involves analyzing light scattering pattern
(diffraction) produced when particles of different sizes are exposed to a beam of light
(Beckman Coulter, 2011). In the laser instrument, particles of the sample are suspended
in water, diluted to decrease interference, and pass through a cell where laser beam is
directed towards the particles (OEWRI, 2008). The PSD of the CFA and SF was
determined by measuring the pattern of light scattered by the particles in the sample since
each particle has different scattering pattern which is correlated to the particle size
distribution of the sample.
As shown in FIGURES 5-3 and 5-4, the CFA has particle that range in size from
0.04 µm to 309 µm while the SF has particle size in the range of 0.04 µm to 1800 µm.
The two materials have relatively well graded particle size distribution and mean particle
size of 47 µm and 277 µm respectively.
FIGURE 5-2: Laser diffraction particle size analyzer

61
FIGURE 5-3: Particle size distribution of CFA and SF (volume % )
FIGURE 5-4: Particle size distribution of CFA and SF (cumulative volume %)
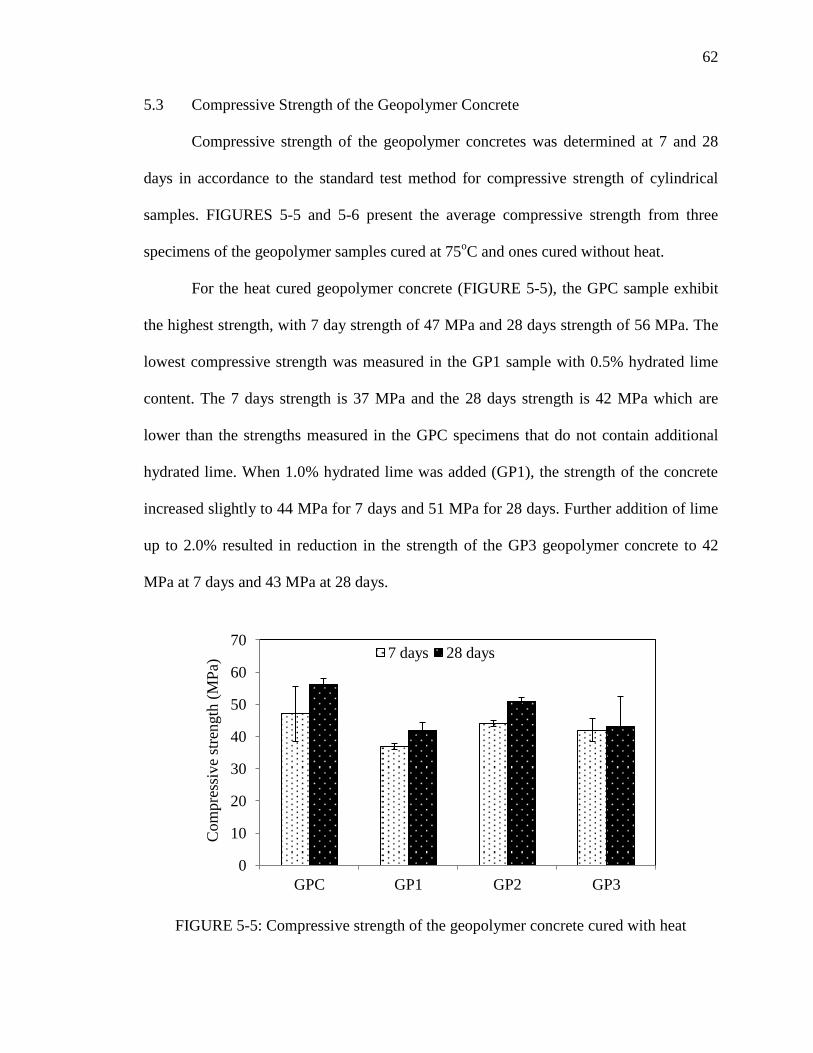
62
5.3 Compressive Strength of the Geopolymer Concrete
Compressive strength of the geopolymer concretes was determined at 7 and 28
days in accordance to the standard test method for compressive strength of cylindrical
samples. FIGURES 5-5 and 5-6 present the average compressive strength from three
specimens of the geopolymer samples cured at 75oC and ones cured without heat.
For the heat cured geopolymer concrete (FIGURE 5-5), the GPC sample exhibit
the highest strength, with 7 day strength of 47 MPa and 28 days strength of 56 MPa. The
lowest compressive strength was measured in the GP1 sample with 0.5% hydrated lime
content. The 7 days strength is 37 MPa and the 28 days strength is 42 MPa which are
lower than the strengths measured in the GPC specimens that do not contain additional
hydrated lime. When 1.0% hydrated lime was added (GP1), the strength of the concrete
increased slightly to 44 MPa for 7 days and 51 MPa for 28 days. Further addition of lime
up to 2.0% resulted in reduction in the strength of the GP3 geopolymer concrete to 42
MPa at 7 days and 43 MPa at 28 days.
FIGURE 5-5: Compressive strength of the geopolymer concrete cured with heat
0
10
20
30
40
50
60
70
GPC GP1 GP2 GP3
Com
pre
ssiv
e st
rength
(M
Pa)
7 days 28 days

63
The highest compressive strength of the geopolymer concrete cured without heat
(FIGURE 5-6) is less than 20 MPa for all the geopolymer concrete samples. The 7 days
compressive strength of the GPC and GP1 sample are the lowest strength (7 MPa) which
increase gradually by 1 MPa as the hydrated lime content increases from 1.0% and 2.0%
in the GP2 and GP3 samples respectively. At 28 days on the other hand, the GPC
produces the highest compressive strength of 18 MPa which reduces as the amount of
hydrated lime in the geopolymer concrete increases from 0.5% to 1.0% and finally 2.0%
in the GP1, GP2 and GP3 samples. According to Yip et al. (2005), previous studies found
that the addition of calcium should positively impart the compressive strength of
geopolymers, but that same conclusion cannot be made for the geopolymer concretes
produced in this study.
All the geopolymer concretes produced except the 7 days sample cured without
heat shows reduction in the overall compressive strength as the content of hydrated lime
increases from 0% to 2%. In all these samples, there was an observed increased in
compressive strength at 1.0% hydrated lime content when compared with the previous
sample with 0.5% hydrated lime. The most important observation from the result is that
the heat cured geopolymer concrete produced the highest compressive strength and the
average 28 days compressive strength of samples exceeds the design strength of 41 MPa
(6,000 psi).
Kruskal-Wallis test and Tukey-Kramer HSD pairwise comparison test conducted
at 95% confidence level (α = 0.05) are the statistical analysis tools used in this section.
The results from the statistical analysis are presented in appendix C. According to the
Kruskal-Wallis test result shown in appendix C1, the 7 days compressive strength of the

64
geopolymer concrete cured without heat are not significantly different (p-value =
0.0216). The Tukey-Kramer pairwise comparison of the compressive strength showed
that the following pairs have significantly different compressive strength: GP3vs GPC (p-
value = 0.0009), GP3 vs GP1 (p-value = 0.0042) and GP2 vs GPC (p-value = 0.0158). On
the other hand, the 28 day compressive strength of the geopolymer concrete cured
without heat (appendix C2) is not significantly different (p-value = 0.4415), so there is
no need for pairwise comparison.
As shown in appendix C3 and C4, the 7 day compressive strength of the
geopolymer cured with heat did not show any significant difference (p-value = 0.2479)
but the statistical analysis of 28 days strength reveals that there is significant difference
(p-value = 0.0237) between the compressive strength of the geopolymer concrete
samples. The pairwise comparison showed the some pair of the geopolymer concrete
samples: GP2 vs GP1 (p-value = 0.0312) and GPC vs GP3 (p-value= 0.0488) have
compressive strength that are significantly different.
FIGURE 5-6: Compressive strength of geopolymer concrete cured without heat
0
5
10
15
20
25
30
GPC GP1 GP2 GP3
Com
pre
ssiv
e st
rength
(M
Pa)
7 days 28 days
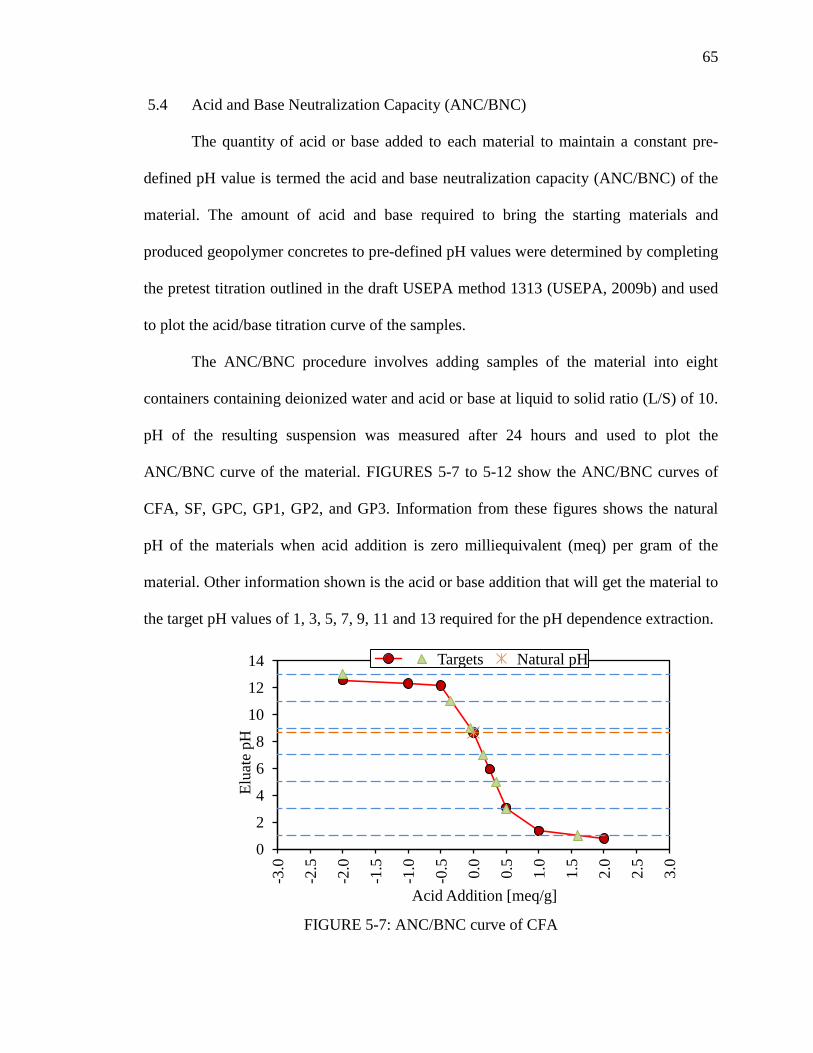
65
5.4 Acid and Base Neutralization Capacity (ANC/BNC)
The quantity of acid or base added to each material to maintain a constant pre-
defined pH value is termed the acid and base neutralization capacity (ANC/BNC) of the
material. The amount of acid and base required to bring the starting materials and
produced geopolymer concretes to pre-defined pH values were determined by completing
the pretest titration outlined in the draft USEPA method 1313 (USEPA, 2009b) and used
to plot the acid/base titration curve of the samples.
The ANC/BNC procedure involves adding samples of the material into eight
containers containing deionized water and acid or base at liquid to solid ratio (L/S) of 10.
pH of the resulting suspension was measured after 24 hours and used to plot the
ANC/BNC curve of the material. FIGURES 5-7 to 5-12 show the ANC/BNC curves of
CFA, SF, GPC, GP1, GP2, and GP3. Information from these figures shows the natural
pH of the materials when acid addition is zero milliequivalent (meq) per gram of the
material. Other information shown is the acid or base addition that will get the material to
the target pH values of 1, 3, 5, 7, 9, 11 and 13 required for the pH dependence extraction.
FIGURE 5-7: ANC/BNC curve of CFA
0
2
4
6
8
10
12
14
-3.0
-2.5
-2.0
-1.5
-1.0
-0.5
0.0
0.5
1.0
1.5
2.0
2.5
3.0
Elu
ate
pH
Acid Addition [meq/g]
Targets Natural pH

66
FIGURE 5-8: ANC/BNC curve of SF
FIGURE 5-9: ANC/BNC curve of GPC
0
2
4
6
8
10
12
14
-3.0
-2.5
-2.0
-1.5
-1.0
-0.5
0.0
0.5
1.0
1.5
2.0
2.5
3.0
Elu
ate
pH
Acid Addition [meq/g]
A Targets Natural pH
0
2
4
6
8
10
12
14
-6.0
-5
.5
-5.0
-4
.5
-4.0
-3
.5
-3.0
-2
.5
-2.0
-1
.5
-1.0
-0
.5
0.0
0.5
1.0
1.5
2.0
2.5
3.0
3.5
4.0
4.5
5.0
5.5
6.0
Elu
ate
pH
Acid Addition [meq/g]
28 d heat Targets Natural pH

67
FIGURE 5-10: ANC/BNC curve of GP1
FIGURE 5-11: ANC/BNC curve of GP2
0
2
4
6
8
10
12
14
-6.0
-5.5
-5.0
-4.5
-4.0
-3.5
-3.0
-2.5
-2.0
-1.5
-1.0
-0.5
0.0
0.5
1.0
1.5
2.0
2.5
3.0
3.5
4.0
4.5
5.0
5.5
6.0
Elu
ate
pH
Acid Addition [meq/g]
28 d heat Targets Natural pH
0
2
4
6
8
10
12
14
-6.0
-5.5
-5.0
-4.5
-4.0
-3.5
-3.0
-2.5
-2.0
-1.5
-1.0
-0.5
0.0
0.5
1.0
1.5
2.0
2.5
3.0
3.5
4.0
4.5
5.0
5.5
6.0
Elu
ate
pH
Acid Addition [meq/g]
28 d heat Targets Natural pH

68
FIGURE 5-12: ANC/BNC curve of GP3
5.5 Material Natural pH
Natural pH of the materials was determined from the pre titration test conducted
to determine the ANC/BNC as shown in FIGURES 5-7 to 5-12. TABLE 5-2 summarizes
the natural pH of all the materials. According to TABLE 5-2, the CFA and the
geopolymer concrete samples (GPC, GP1, GP2, and GP3) are all alkaline materials while
the SF has a pH that makes it a material with neutral pH.
TABLE 5-2: Natural pH of the materials
Material Natural pH
CFA 8.67
SF 7.62
GPC 11.60
GP1 11.00
GP2 11.10
GP3 11.20
0
2
4
6
8
10
12
14
-6.0
-5.5
-5.0
-4.5
-4.0
-3.5
-3.0
-2.5
-2.0
-1.5
-1.0
-0.5
0.0
0.5
1.0
1.5
2.0
2.5
3.0
3.5
4.0
4.5
5.0
5.5
6.0
Elu
ate
pH
Acid Addition [meq/g]
28 d heat Targets Natural pH

69
5.6 Moisture Content and Bulk Density
As-received moisture content of the materials was determined by drying the
samples at 105oC for 24 hours. As shown in TABLE 5-3, most of the materials have
moisture content greater than 1%, only the SF has moisture content of less than 1%. Bulk
density of loose dry fly ash is reported to be about 1,000 kg/m3(Sear, 2001) but the CFA
has a bulk density of about 900 kg/m3. The bulk density of the monolithic geopolymer
concretes were determined to be 2300 kg/m3.
TABLE 5-3: Moisture content and bulk density of the materials
Material Moisture content (%) Bulk density (kg/m3)
CFA 1.8 897.8
SF 0.5 378.4
GPC 1.4 2300.0
GP1 1.7 2300.0
GP2 1.9 2300.0
GP3 1.9 2300.0
5.7 Summary
The geopolymer concretes are alkaline material with pH > 11 and bulk density of
2300 kg/m3. This bulk density is equivalent to the density of normal weight concrete. The
average 28 days compressive strength of the heat cured geopolymer range from 42 MPa
(6013 psi) to 56 MPa (8117 psi) while the average 7 days compressive strength is 37 MPa
(5367 psi) to 47 MPa (6817 psi). In terms of 28 days compressive strength, the heat cured
geopolymer concrete is similar in strength to high strength concrete with compressive
strength of about 40 MPa (6,000psi) (Mehta and Monteiro, 2006). On the other hand,

70
geopolymer concretes cured without heat have average 28 days compressive strength that
ranges from 13 MPa (1937 psi) to 18 MPa (2647 psi) and an average 7 days compressive
strength that ranges from 7 MPa (1015 psi) to 9 MPa (1305 psi). It is obvious from the
results that heat curing is a requirement for the production of geopolymer concrete with
acceptable compressive strength for structural uses. Hydrated lime did not positively
impact the compressive strength of the geopolymer concretes, it result in the reduction in
strength of geopolymer concrete as the lime content increases but exhibit high strength at
the optimal lime addition of 1%.
Due to the presence of efflorescence on the surface of the geopolymer concretes
cured without heat and their low compressive strength, the material was not considered
for further investigation since it would only be suitable for low strength structural
applications like walkway, curbs and road divider. The heat cured geopolymer concretes
on the other hand are considered for further investigation because they meet the basic
strength requirement (40 MPa or 6000 psi) for concrete used in high strength structural
applications.

CHAPTER 6: LABORATORY LEACHING TEST METHODS
6.1 Introduction
The leaching test methods designed to evaluate leaching of elements from
cementitious material such as geopolymer concrete samples during their service life (in
monolith form) and at the end of service life (in granular form) are presented in TABLE
6-1. Batch leaching test such as the pH dependence test, water leach test and Dutch
availability test are considered for granular state of the samples while the tank test is used
for monolithic state of the samples. After completion of the leaching test, the samples
were filtered and the filtrate (leachate) for cation analysis was acidified to pH < 2 using
50% HNO3 in order to minimize metal precipitation and adsorption onto the sample
containers prior to using the inductively coupled plasma atomic emission spectroscopy
(ICP-AES). Ion chromatography (IC) was used for anion analysis of water leached
samples and the leachates were not acidified.
According to the preliminary investigation presented in Section 3.6.1, elements
such as As, Cr, Se, V and Mo that form oxyanion leach out more in the high pH condition
similar to the alkaline state that would exist in the pore solution of geopolymer concretes.
Although the concentration of other elements in the leachates is measured, this chapter
would focus mainly on the leaching of As, Cr and Se since they are considered elements
with more environmental concerns due to their mobility and toxicity at the different
oxidation states.

72
TABLE 6-1: Relevant leaching test during life cycle of cementitious materials
Material Life cycle period condition Area of use Relevant leaching
test
Cementitious
materials
Service life Monolith Foundation,
Façade,
containers,
sewer pipes
Tank test
End of service
life
(after demolition)
Granular
and reduced
fragments
Disposal,
aggregates in
concrete and
road
construction
pH dependence
test
Availability test &
Column test
Source: Van der Sloot and Kosson (2003)
6.2 pH Dependence Leaching Test
The pH dependence test is conducted to determine mobility of elements from the
geopolymer concrete samples when they are exposed to different pH condition. The test
was based on the USEPA draft method 1313 (USEPA, 2009b). In this test, deionized
water was added to granular/powdered geopolymer concrete samples in nine plastic
bottles at L/S ratio of 10. HNO3 or NaOH was used to maintain the pH to pre-selected pH
values of 3, 5, 7, 9, 11 and 13. The amount of HNO3 or NaOH required to make the
material reach the selected pH values was obtained from the pre titration curve presented
in FIGURES 5-7 to 5-12. FIGURE 6-1 shows the experimental setup for the pH
dependence test. Three method blanks without the samples are added to the pH extraction
in order to identify any contaminations that might be introduced by the deionized water,
HNO3 or NaOH. The analyses were carried out in duplicates, stopped after 24 hours and
the leachates filtered, then acidified before storing at 4oC.

73
FIGURE 6-1: pH dependence test experimental setup
The concentrations (mg/l) of elements measured in the leachates using the ICP-
AES were used to calculate the amount of the element leached (mg/kg) from each
material. In cases where the measured concentration is less than the detection limit (DL)
of the instrument, the concentration value DL/2 was used in the calculation of the amount
leached. The average (n=2) result of the pH dependence mobility of As, Cr and Se from
the CFA, SF, GPC, GP1, GP2 and GP3 expressed in mg/kg are presented in FIGURES 6-
2 to 6-7 while FIGURES D-1 to D-6 in appendix D show the pH dependence mobility of
the other elements. As shown in FIGURES 6-2 to 6-4, the mobility of the three elements
(As, Cr and Se) is highest at pH 1 but reduces as the pH increases. As mobility from CFA
reached 32 mg/kg at pH 1 and reduces to 1 mg/kg at pH 4 and pH 11. The amount
leached increases slightly at pH 7 to 4 mg/kg. The highest mobility in the alkaline pH is 7
mg/kg while 32 mg/kg is the highest at the acidic pH range. Mobility of As from the SF

74
is constant at 8 mg/kg irrespective of the pH although it was difficult filtering the
leachates obtained from the extractions between pH 4 and 11.
FIGURE 6-2: pH dependence mobility of As from the CFA and SF
The amount of Cr leached from both the CFA and SF is lower than the amount of
As leached (FIGURE 6-3). The highest amount of Cr released (18 mg/kg) from CFA
occurs at pH 1 while the highest amount released (4 mg/kg) in the alkaline pH occurs at
pH 13. On the other hand, the amount of Cr released from the SF is less than 1 mg/kg as
shown in FIGURE 6-3.
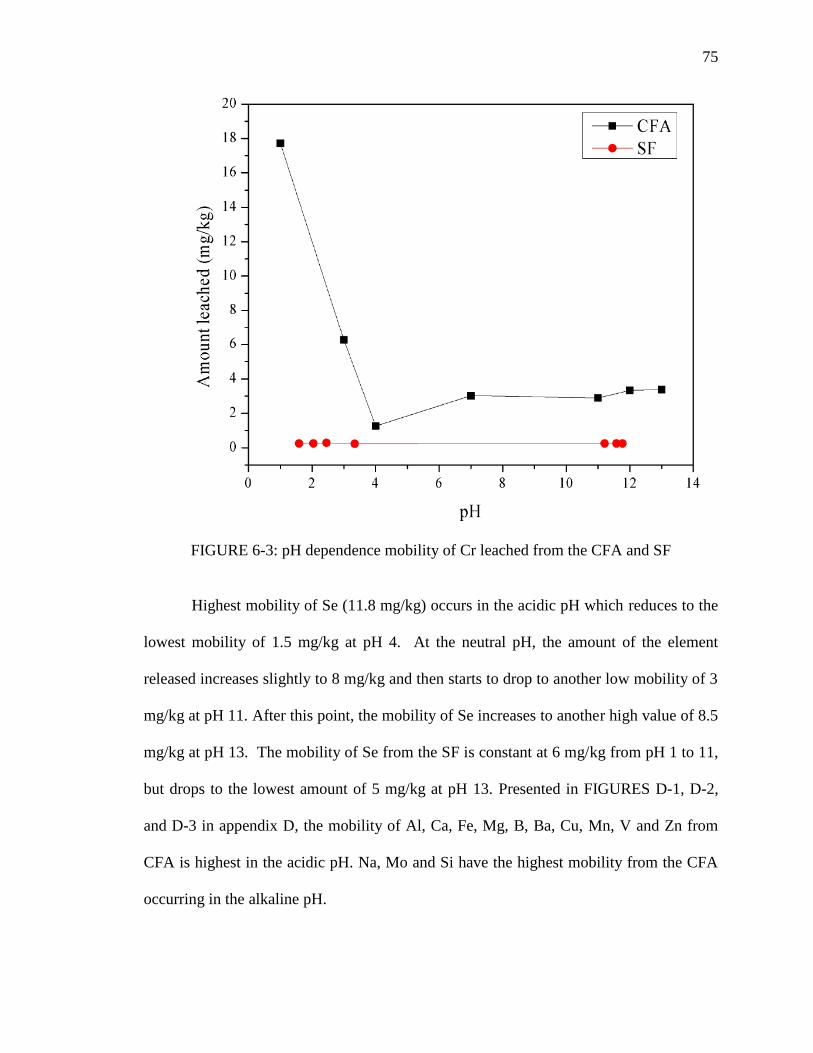
75
FIGURE 6-3: pH dependence mobility of Cr leached from the CFA and SF
Highest mobility of Se (11.8 mg/kg) occurs in the acidic pH which reduces to the
lowest mobility of 1.5 mg/kg at pH 4. At the neutral pH, the amount of the element
released increases slightly to 8 mg/kg and then starts to drop to another low mobility of 3
mg/kg at pH 11. After this point, the mobility of Se increases to another high value of 8.5
mg/kg at pH 13. The mobility of Se from the SF is constant at 6 mg/kg from pH 1 to 11,
but drops to the lowest amount of 5 mg/kg at pH 13. Presented in FIGURES D-1, D-2,
and D-3 in appendix D, the mobility of Al, Ca, Fe, Mg, B, Ba, Cu, Mn, V and Zn from
CFA is highest in the acidic pH. Na, Mo and Si have the highest mobility from the CFA
occurring in the alkaline pH.

76
FIGURE 6-4: pH dependence mobility of Se from the CFA and SF
Elements that include Al, Si, Ca, V, Mo and Fe have constant mobility across the
pH range (FIGURES D-1, D-2, and D-3 in appendix D). Others like Na and B exhibit
higher mobility in the alkaline pH while the remaining elements (Mg, Ba, Cu, Mn, and
Zn) displays higher mobility in the acidic pH.
Different pattern of element release were observed from the geopolymer concrete
samples as shown in FIGURES 6-5 to 6-7 and FIGURES D-4 to D-6 (in appendix D). In
all the geopolymer concrete samples, the leaching of As starting with high value at low
pH reduces with increasing pH and reached the lowest value in the pH range of 3 - 7
(FIGURE 6-5). The highest amount leached occurs in the alkaline pH of 13. In the
alkaline pH, among all the geopolymer samples, GP2 exhibits the lowest mobility of As
while GP3 displays the lowest at pH 1.

77
FIGURE 6-5: pH dependence mobility of As from the geopolymer concretes
The mobility of Cr from the geopolymer concrete samples shown in FIGURE 6-6
reveals that the element leach out more at pH 1 but drops rapidly at pH between 3 and 4
depending on the geopolymer concrete sample. The lowest mobility of this element
occurs in the alkaline pH range. GP2 samples has the minimum amount of the Cr leached
in the acidic pH but the mobility from the other materials becomes the same from pH 5
(FIGURE 6-6). The concentration of the Cr measured in the leachates from the
geopolymer concretes at pH 5 to pH 13 is less than the detection limit (DL) of the
instrument.

78
FIGURE 6-6: pH dependence mobility of Cr from the geopolymer concretes
Mobility of Se from the geopolymer concretes presented in FIGURE 6-7 reveals
that in most of the samples, the element leach out more in the alkaline pH. The lowest
amount of Se was leached at pH between 3 and 6 with an amount 1.5 mg/kg after that its
starts to increase as the pH increases until it reached the highest mobility at pH 13. GP2
samples display constant mobility throughout the pH range mainly because the
concentration measured in the leachates is less than the DL and the value DL/2 was used
to calculate the amount leached from the material. It can be seen from the results
presented in FIGURES 6-5 to 6-7 that the mobility of the elements is reduced in the GP2
geopolymer concretes which has 1.0% hydrated lime added during the synthesis.
Mobility of two other oxyanion forming elements (Mo and V) presented in FIGURE D-4
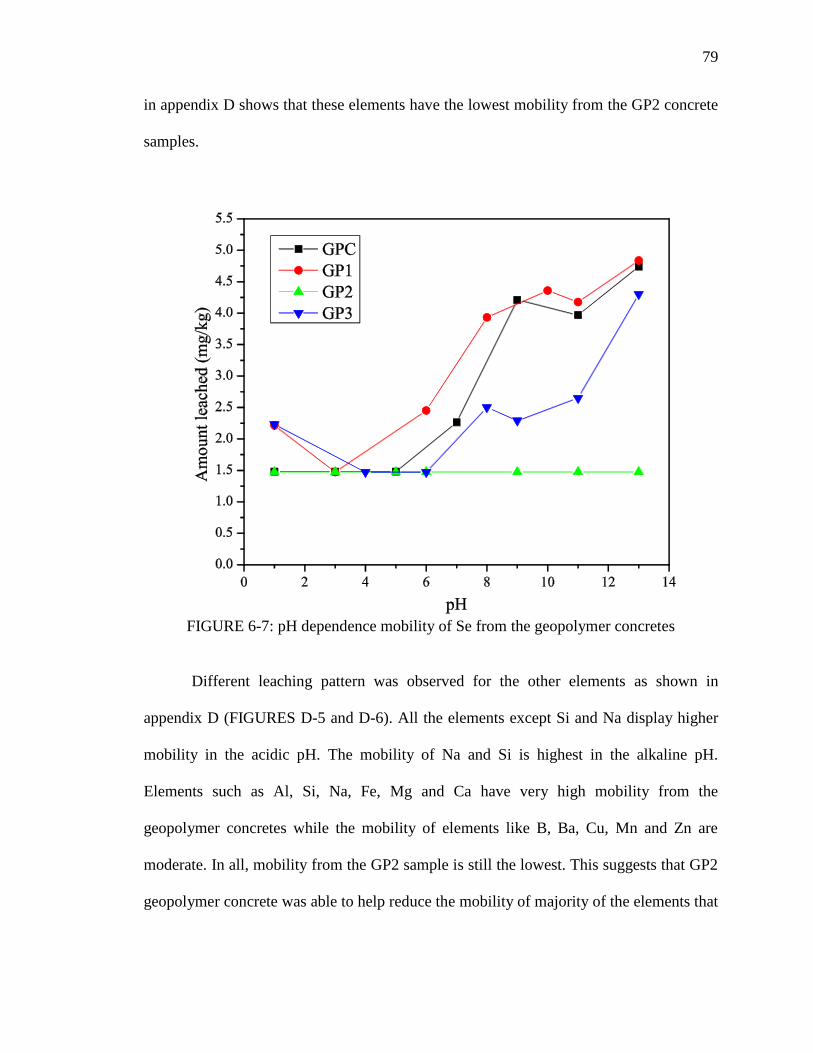
79
in appendix D shows that these elements have the lowest mobility from the GP2 concrete
samples.
FIGURE 6-7: pH dependence mobility of Se from the geopolymer concretes
Different leaching pattern was observed for the other elements as shown in
appendix D (FIGURES D-5 and D-6). All the elements except Si and Na display higher
mobility in the acidic pH. The mobility of Na and Si is highest in the alkaline pH.
Elements such as Al, Si, Na, Fe, Mg and Ca have very high mobility from the
geopolymer concretes while the mobility of elements like B, Ba, Cu, Mn and Zn are
moderate. In all, mobility from the GP2 sample is still the lowest. This suggests that GP2
geopolymer concrete was able to help reduce the mobility of majority of the elements that

80
are released from the geopolymer concrete, and may provide an indication of the range of
the optimum Ca content required to immobilize majority of the element.
6.3 Dutch Availability Test
The samples was subjected to the Dutch availability test to determine the
maximum amount of each element leachable from the starting material and geopolymer
samples under the worst-case environmental condition (EA, 2005a). The test is
performed at room temperature on size reduced sample (<150 µm) in order to ensure
complete dissolution of the constituents (Cappuyns and Swennen, 2008). The test method
consists of two extraction steps in which the pH was maintained at 7 and 4 using HNO3.
The extraction at pH 7 is conducted to simulate the leaching of oxyanion forming
elements and at pH 4 as the most extreme natural pH condition for cationic elements‘
mobility (Fällman, 1997).
This test method for which schematic is presented in FIGURE 6-8, 8 g of dry
sample was weighed into an acid washed beaker, and deionized water added at a liquid to
solid (L/S) ratio of 50. The suspension was agitated using magnetic stirrer while the pH
continuously controlled to pH 7 ± 0.5 using 2M HNO3 for 3 hours after which the
mixture was filtered through a 0.45µm membrane filter. The residue from the filtration
process was used for the second extraction step and the pH controlled to pH 4 ± 0.5 for
additional 3 hours. The liquid obtained after the filtration was combined with the liquid
from the first extraction step and acidified to pH < 2 using 50% V/V HNO3.
Concentrations of As, Cr and Se in the leachates are measured using the ICP-AES and
were used to calculate the average (n=3) availability of each element from the materials
expressed in mg/kg of the tested material.

81
FIGURE 6-8: Schematics of the Dutch availability test
FIGURE 6-9 shows the amount of the elements leached from the CFA and SF
while FIGURE 6-10 contains result for the geopolymer concrete samples. It can be seen
from these results that As and Se are the two elements that leach considerably from all
the materials. The amount of Cr leached is however very small in all the materials tested.
FIGURE 6-9: Availability of As, Se and Cr from the starting materials
0
2
4
6
8
10
12
14
16
CFA SF
Am
ou
nt
leach
ed (
mg/k
g)
Starting materials
Arsenic (As) Selenium (Se) Chromium (Cr)
Residue Dry material
1st step
L/S: 50
pH: 7
Time: 3 hrs
2nd
step
L/S: 50
pH: 4
Time: 3 hrs
Filtration Filtration
Combined
leachates

82
According to the availability test result presented in FIGURE 6-9, the mobility of
As from CFA reached 13 mg/kg whereas the mobility of Se is about 12.9 mg/kg and Cr is
around 4 mg/kg. The SF on the hand indicates more leaching of Se than As and Cr. The
amount of Se leached in the SF is 8 mg/kg while the amount of As and Cr released from
the material are respectively 7 mg/kg and 0.5 mg/kg. It can be seen from the result that
As and Se are readily available for leaching in the starting materials.
FIGURE 6-10: Availability of As, Cr and Se from geopolymer concrete samples
Mobility of As is highest in all the geopolymer concrete samples (see FIGURE 6-
10) with the maximum amount leached close to 10 mg/kg. In the case of Cr, its mobility
from the geopolymer concrete is very small which signifies that the material is not readily
leachable. One very important observation from the results shown in FIGURE 6-10 is
that the GP2 geopolymer concrete have lower amount of leached elements. There was a
10.5% reduction in the amount of As leached from the GP1 to GP2 sample and from GP2
0
2
4
6
8
10
12
GPC GP1 GP2 GP3
Am
ou
nt
lea
ched
(m
g/k
g)
Geopolymer concrete
Arsenic (As) Selenium (Se) Chromium (Cr)

83
to GP3 sample the mobility of As later increased by 11.7%. The reduction of Se from the
GP1 to GP2 sample was 25% and from GP2 to GP3, there was a 10% increase in the
mobility. Cr on the other hand, shows almost constant mobility from the geopolymer
concrete samples. The result suggests that the GP2 geopolymer concrete with 1.0%
additional hydrated lime lead to considerable reduction in the amount of As and Se
released from the geopolymer concrete.
6.4 Tank Test
Tank test based on the USEPA draft method 1315 (USEPA, 2009c) was used to
determine element mobility from the monolithic fly ash based geopolymer concrete. The
test is designed to provide the release rates of the constituent elements in the monolithic
geopolymer concrete. In this test, monolithic cylinder sample of the geopolymer
concretes was completely submerged or immersed in a given volume of deionized water
(FIGURE 6-11 and 6-12) and kept in static condition at ambient temperature. Amount of
deionized water added during the test was based on a liquid to solid exposed surface area
(L/Sa) ratio of 7±1. The deionized water was replenished with fresh deionized water at
nine intervals: 0.08 day, 1 day, 2 days, 7 days, 14 days, 28 days, 42 days, 49 days and 64
days and the weight of the monolith geopolymer determined after each leaching interval
in order to measure the amount of water absorbed into the solid matrix at the end of each
interval (USEPA, 2009c). The collected leachates were filtered through a 0.45µm
membrane filter and later acidified to pH < 2 using HNO3. Concentration of As, Cr and
Se measured in the leachates were used to determined the average (n=2) amount of the
elements released from the monolithic geopolymer concrete samples.
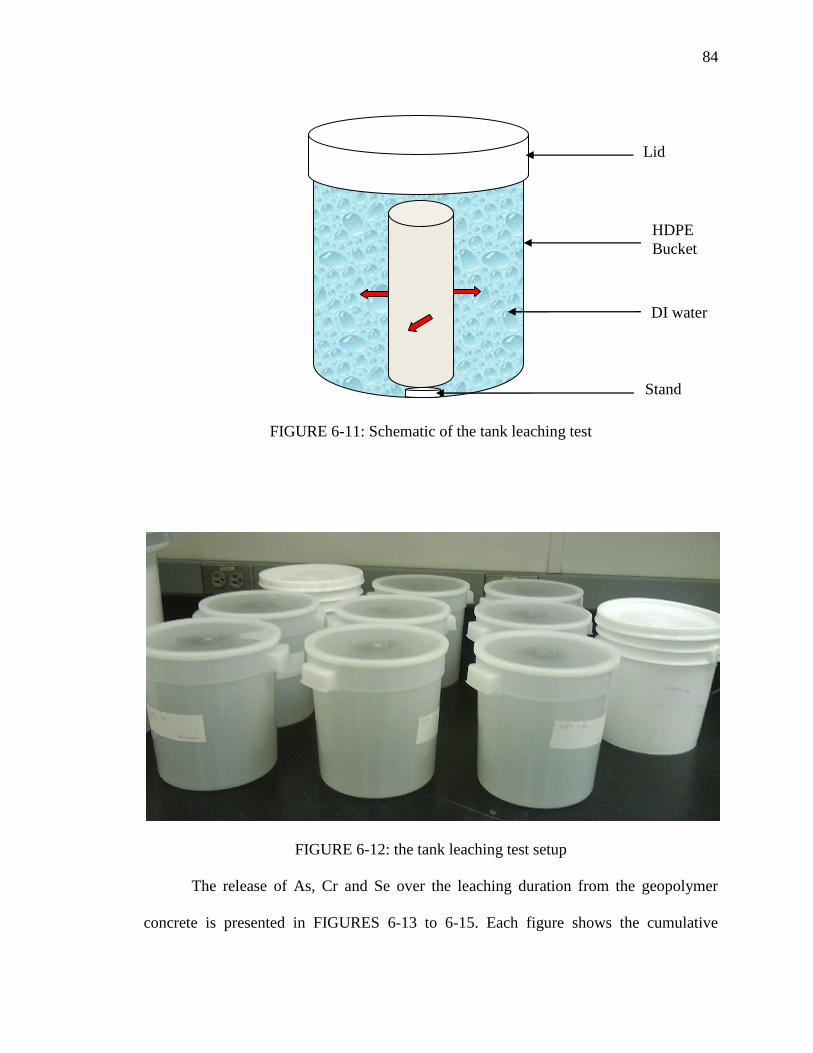
84
FIGURE 6-11: Schematic of the tank leaching test
FIGURE 6-12: the tank leaching test setup
The release of As, Cr and Se over the leaching duration from the geopolymer
concrete is presented in FIGURES 6-13 to 6-15. Each figure shows the cumulative
Lid
HDPE
Bucket
DI water
Stand

85
amount of each element released (mg/m2) and the release flux (mg/m
2.s) across the
exposed surface of the geopolymer concrete. The cumulative release plot and flux plot
were used to determine the mechanism responsible for the leaching.
FIGURE 6-13: Release of As from the geopolymer concrete samples
As shown in FIGURE 6-13, the cumulative amount of As released from the
geopolymer concretes reached 300 mg/m2
and the plot can be divided into three regions
86
which depict the leaching mechanism of the element. From the beginning of the test to 1
day, surface wash-off is the controlling mechanism. This mechanism is due to initial
wash-off of soluble material on the outside of the monolith concrete. EA (2005b)
reported that the slope of the region is less than or equal to 0.35. Between 1 day and 9
days of leaching, diffusion controlled mobility is the dominant leaching mechanism. This
is the normal mechanism responsible for leaching from monolithic materials and the
slope of the cumulative release plot is 0.5 ± 0.15 (EA, 2005b). After 9 days of leaching,
the dominant mechanism changes to depletion which is associated with reduction in
amount of the element released. In the surface wash-off region of the plot, As mobility
from the GPC sample is the highest while the lowest mobility occurs in the GP3 sample
(FIGURE 6-13) but at the region where depletion dominates, the GP2 sample has the
lowest mobility of As (FIGURE E-1 in appendix E).
The cumulative release plot of Se shown in FIGURE 6-14 reveals that the element
exhibits the same leaching behavior as As. The leaching mechanism is also divided into
surface wash-off, diffusion and depletion. The maximum amount of Se leached in this
case reaches 130 mg/m2. During the initial stage of the leaching, the GP1 and GP3
samples exhibits the lowest release of Se but in the depletion region of the plot, mobility
of Se from the GP2 sample is the lowest (FIGURE E-2 in appendix E).

87
FIGURE 6-14: Release of Se from the geopolymer concrete samples
From FIGURES 6-13 and 6-14, it is obvious that the cumulative release of As and
Se tend to a flat plateau towards the end of the leaching duration and the flux tend to zero
with the value dropping rapidly towards the end of the leaching. This leads to depletion
of the element as the leaching progresses. Cr on the other hand, exhibits an ever
increasing cumulative release as shown in FIGURE 6-15. The element does not display
similar leaching behavior to the previous two elements; there is still more of the element

88
available for leaching at the end of the leaching duration. The entire geopolymer concrete
sample display the same pattern of Cr release that reached a maximum value of 3 mg/m2.
The release mechanism in this case is a combination of surface wash-off, diffusion and
dissolution.
FIGURE 6-15: Release of Cr from the geopolymer concrete samples

89
The cumulative release plots showed that As has the highest mobility from the
geopolymer concretes and that the mobility of As and Se attains a plateau which indicates
reduction in elements availability (depletion of the elements). Cr mobility on the other
hand continues to increase over the leaching duration.
6.4.1 Leachability Index (LX) of the Elements
To further understand the mobility of these elements from the geopolymer
concretes, the fickian diffusion model based on fick‘s second law of diffusion was
employed to determine the leachability index (LX) of the elements (Kosson et al., 2002;
Dermatas et al., 2004), which would give the relative mobility of the elements. An
analytical solution (Equation 6.1) of the fickian diffusion model which assume zero
concentration at the solid-liquid interface (Kosson et al., 2002) was used to calculate the
effective diffusion coefficient (De) for each leaching interval using the relationship in
Equation 6.2.
(6.1)
(6.2)
Where is the effective diffusion coefficient for each element (m2/s), M is the
cumulative amount of element leached (mg/m2), ρ is the bulk density of the monolithic
geopolymer concrete (kg/m3), is the maximum leachable amount of each element
determined from the availability test (mg/kg), is the cumulative time at the end of the
current leaching interval i (s) and is the cumulative time at the end of the previous
leaching interval i-1 (s).

90
The LX defined mathematically using Equation 6.3 (Pariatamby et al., 2006) was
determined from the negative logarithms of the mean effective diffusion coefficient
calculated from Equation 6.2. The LX values are presented in TABLE 6-2.
(6.3)
Where n is the number of particular leaching period, m is the total number of individual
leaching periods, β is a constant (1.0 m2/s) and Di is the effective diffusion coefficient of
constituent i (m2/s).
TABLE 6-2: Leachability index (LX) of As, Se and Cr from geopolymer concrete
LX value
As Se Cr
GPC 10.6 10.7 11.4
GP1 10.5 10.5 11.4
GP2 10.4 10.3 11.4
GP3 10.5 10.5 11.5
According to Dermatas et al. (2004) and EA (2005b), the relative mobility of the
elements or any other contaminants is evaluated using the LX value which varies from 5
(very mobile) to 15 (immobile). TABLE 6-3 contains information used to interpret the
LX value. The lower the LX value the higher mobility of the element. The LX value
shown in TABLE 6-2 reveals that As and Se have high mobility from the geopolymer
concrete samples while Cr has average mobility from the same geopolymer concrete
91
samples. The LX value can therefore be used in making decision on utilization of the
geopolymer concrete. Dermatas et al. (2004) reported that any material that has elements
or contaminant LX value less than 8 is not suitable for disposal or utilization in
applications such walkways.
TABLE 6-3 :The LX range for different rate of mobility
Low mobility LX >12.5
Average mobility 11.0 < LX < 12.5
High mobility LX < 11.0
Source: EA (2005b)
6.4.2 Depletion of the Elements in Relation to Availability
The amount of each element leached per unit mass in the tank test over the 64
days leaching duration was estimated in order to determine the depletion of the element
in relation to the availability as obtained from the Dutch availability test. The amount
leached per unit mass in the tank test (U tank) is calculated using equation 6.4.
(6.4)
Where U tank is the amount of each component leached in the tank test (mg/kg), C64 is
the cumulative amount of the element leached after 64 days (mg/m2), A is the surface
area of the sample (m2), and m is the mass of the sample (kg).
FIGURES 6-16 to 6-18 shows the comparison of the amount of As, Se and Cr
leached from the monolith geopolymer concrete in relation to the amount leached using
the availability test. As shown in FIGURE 6-16, for the GP1 and GP2 samples, the
estimated amount of As leached in the tank test exceeds the amount leached in the
availability test.

92
FIGURE 6-16: As availability in tank test in relation to total availability
FIGURE 6-17: Se availability in tank test in relation to total availability
7.5
8.0
8.5
9.0
9.5
10.0
GPC GP1 GP2 GP3
Am
ou
nt
leach
ed (
mg/k
g)
Geopolymer concrete
U avail U tank
0.0
0.5
1.0
1.5
2.0
2.5
3.0
3.5
4.0
4.5
5.0
GPC GP1 GP2 GP3
Am
ou
nt
leach
ed (
mg/k
g)
Geopolymer concrete
U avail U tank
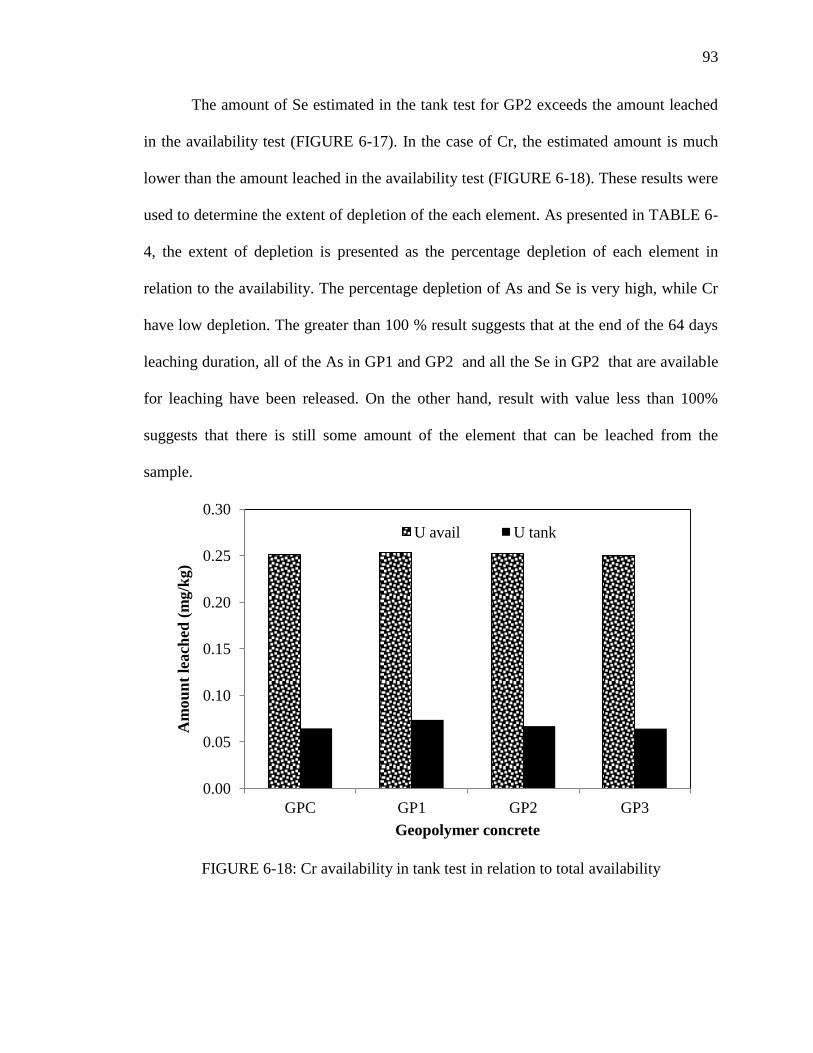
93
The amount of Se estimated in the tank test for GP2 exceeds the amount leached
in the availability test (FIGURE 6-17). In the case of Cr, the estimated amount is much
lower than the amount leached in the availability test (FIGURE 6-18). These results were
used to determine the extent of depletion of the each element. As presented in TABLE 6-
4, the extent of depletion is presented as the percentage depletion of each element in
relation to the availability. The percentage depletion of As and Se is very high, while Cr
have low depletion. The greater than 100 % result suggests that at the end of the 64 days
leaching duration, all of the As in GP1 and GP2 and all the Se in GP2 that are available
for leaching have been released. On the other hand, result with value less than 100%
suggests that there is still some amount of the element that can be leached from the
sample.
FIGURE 6-18: Cr availability in tank test in relation to total availability
0.00
0.05
0.10
0.15
0.20
0.25
0.30
GPC GP1 GP2 GP3
Am
ou
nt
leach
ed (
mg/k
g)
Geopolymer concrete
U avail U tank

94
TABLE 6-4: Percentage depletion in relation to total available fraction
Percentage after 64 days (%)
As Se Cr
GPC 92 82 26
GP1 102 92 29
GP2 107 121 27
GP3 99 94 26
6.5 Water Leach Test
The water leach test (WLT) was used to obtain aqueous solution of the
concentration of dissolved elements used for the geochemical speciation modeling.
Standard procedure described in ASTM D3987(ASTM, 2006c) was used. In this test
method, 200 ml of deionized water was added to 10 g of the granular geopolymer
concrete sample at L/S ratio of 20. The mixture was agitated for 18 hours and allowed to
settle for 15 minutes before filtering through a 0.45µm membrane filter. The ICP-AES
and IC were used to respectively measure the concentration of cations and anions in the
leachates. TABLE 6-5 shows the measured average (n=2) pH and temperature of the
leachates, while TABLES 6-6 and 6-7 contains average (n=2) concentration of cations
and anions measured in the leachates. This information is used as inputs into the
geochemical modeling program.
TABLE 6-5: Temp and pH of the water leach test leachates
GPC GP1 GP2 GP3
pH 11.23 11.26 11.51 11.14
Temperature [C] 25 25 25 25

95
TABLE 6-6: concentration of cations in the water leach test leachates
Elements
Concentration (mg/l)
GPC GP1 GP2 GP3
Al 0.45 1.26 0.75 0.69
As 1.02 1.02 1.02 0.93
Ba 0.03 0.03 0.03 0.03
B 1.78 1.79 1.78 1.65
Ca 0.64 1.05 0.78 1.13
Cr 0.03 0.03 0.03 0.03
Cu 0.03 0.03 0.03 0.03
Fe 0.33 0.63 0.47 0.42
Mg 0.16 0.26 0.22 0.19
Mn 0.03 0.03 0.03 0.03
Mo 0.27 0.26 0.26 0.24
Se 0.41 0.42 0.42 0.37
Si 160.00 169.50 183.00 153.00
Na 564.50 556.00 550.00 555.00
V 1.69 1.93 2.11 2.08
Zn 0.03 0.03 0.03 0.03

96
TABLE 6-7: Concentration of anions in the water leach test leachate
Elements
Concentration (mg/l)
GPC GP1 GP2 GP3
Br- 0.05 0.05 0.05 0.05
Cl- 1.20 1.30 1.95 9.70
F- 0.40 0.40 0.37 0.35
NO3- 0.20 0.11 0.11 0.20
PO43-
31.50 32.50 33.00 16.00
SO42-
155.00 150.00 150.00 145.00
As shown in TABLE 6-5, the pH of the material is greater than 11 which is a
confirmation of the material pH result presented in section 5.5. As shown in FIGURE 6-
5, concentrations of As, Se, B and Mo are lowest in the GP3 concrete. Higher
concentration of Al, Ca, V and Mg were measured in the leachates as the amount of
hydrated lime in the geopolymer concretes increases. The high amount of NaOH added
during the geopolymer synthesis results in the very high concentration of Na and Si
measured in the leachates. Elements such as Ba, Cr, Mn, Zn and Cu have constant
concentration in all the geopolymer concrete samples mainly because their measured
concentrations in less than the DL of the ICP-AES.
The anion concentrations measured in the leachates (TABLE 6-7) reveal that the
concentrations of SO42-
and PO43-
are high in all geopolymer concrete products with GP3
exhibiting slightly lower values. Concentration of F- measured in the leachates are
equivalent in all geopolymer with GP2 and GP3 samples containing slightly lower values
while Cl-
exhibits an increasing concentration as the amount of added hydrated lime
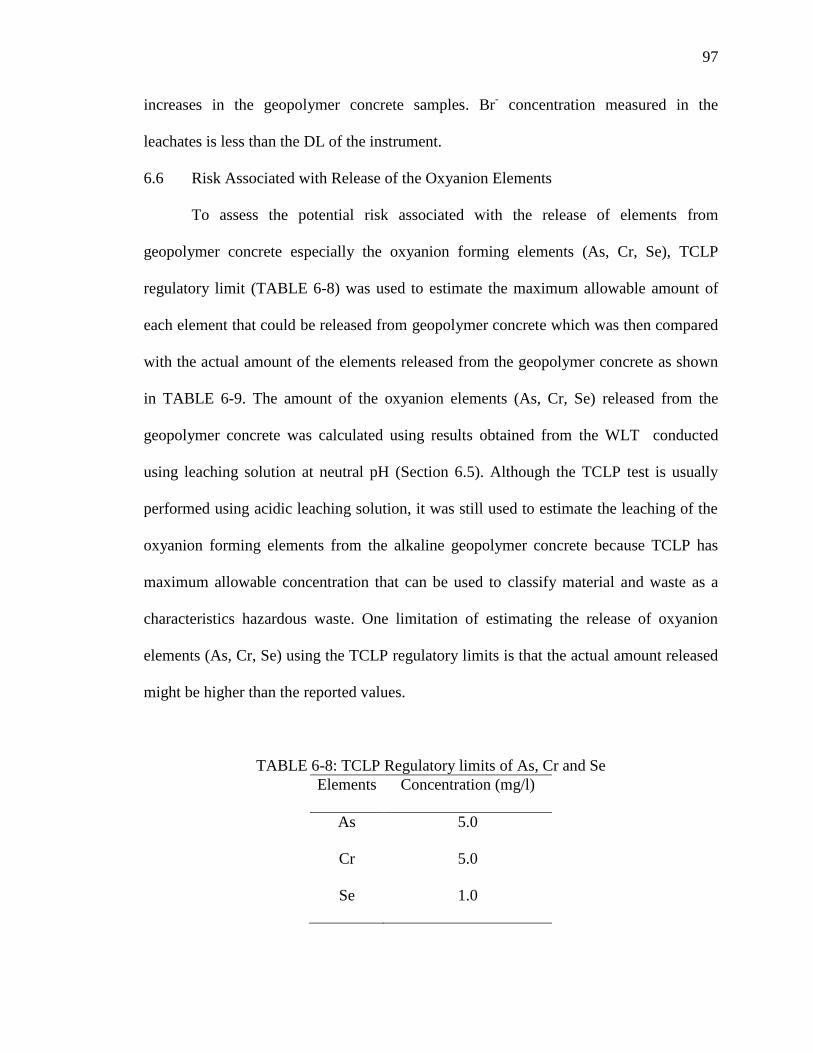
97
increases in the geopolymer concrete samples. Br- concentration measured in the
leachates is less than the DL of the instrument.
6.6 Risk Associated with Release of the Oxyanion Elements
To assess the potential risk associated with the release of elements from
geopolymer concrete especially the oxyanion forming elements (As, Cr, Se), TCLP
regulatory limit (TABLE 6-8) was used to estimate the maximum allowable amount of
each element that could be released from geopolymer concrete which was then compared
with the actual amount of the elements released from the geopolymer concrete as shown
in TABLE 6-9. The amount of the oxyanion elements (As, Cr, Se) released from the
geopolymer concrete was calculated using results obtained from the WLT conducted
using leaching solution at neutral pH (Section 6.5). Although the TCLP test is usually
performed using acidic leaching solution, it was still used to estimate the leaching of the
oxyanion forming elements from the alkaline geopolymer concrete because TCLP has
maximum allowable concentration that can be used to classify material and waste as a
characteristics hazardous waste. One limitation of estimating the release of oxyanion
elements (As, Cr, Se) using the TCLP regulatory limits is that the actual amount released
might be higher than the reported values.
TABLE 6-8: TCLP Regulatory limits of As, Cr and Se
Elements Concentration (mg/l)
As 5.0
Cr 5.0
Se 1.0

98
TABLE 6-9: Comparison of amount leached from geopolymer (mg/kg)
TCLP
Geopolymer
As Cr Se
As Cr Se
GPC 50.68 50.68 10.14
10.37 0.25 4.11
GP1 50.68 50.68 10.14
10.33 0.25 4.24
GP2 50.68 50.68 10.14
10.29 0.25 4.28
GP3 50.68 50.68 10.14
9.37 0.25 3.79
From the result, the amount of As released from the geopolymer concretes is
about 20% of the released amount based on the maximum allowable concentration for the
TCLP. The amount of Cr and Se released from the geopolymer concrete is also less than
the regulatory amount based on the TCLP test.
The risk associated with the oxyanion forming elements (As, Cr, Se) was assessed
using the USEPA risk based screening levels which considered only human health risks
(USEPA, 2012). Health risks considered are inhalation of particles, incidental ingestion
and dermal contact. The assessment was based on residential risk screening level and
performed using the risk-based screening level calculator which utilized the combination
of exposure assumptions with chemical toxicity values to determine the risk associated
levels. TABLE 6-10 shows the calculated residential risk based screening levels for the
human health risk considered.

99
TABLE 6-10: Residential risk based screening levels
Elements Concentration (mg/kg)
Ingestion Dermal Inhalation
As 2.35E+01 2.79E+02 2.13E+04
Cr NA NA NA
Se 3.91E+02 NA 2.84E+07
NA – None available
Based on the information in TABLE 6-10, all the amount of oxyanion elements
released from the geopolymer concretes are lower than the human risk based screening
levels. This suggests that the human health risk associated with the use of geopolymer
concrete is minimal.
6.7 Summary
The pH dependence test is a powerful laboratory tool for the environmental
assessment of any material. The test on geopolymer concrete reveals that the oxyanion
forming elements As and Se are released more in the alkaline pH. In general, the leaching
trend for the elements is similar in all the geopolymer concrete samples. Most of the
geopolymer concrete displays similar leaching pattern for As and Se and the GP2 sample
exhibit the lowest mobility of As and Se in the alkaline pH. Mobility of Cr from the
geopolymer concretes is however different, with highest mobility at pH 1 that reduces to
negligible amount after pH 4 or 5.
As and Se are elements that are available for leaching from the materials
according to the Dutch availability test. The mobility of these two elements from the GP2
sample is the lowest. The tank test showed that As and Se have high mobility from the

100
geopolymer concretes and that the amount of these element leached from the material
approaches a constant value as the leaching duration increases which means that the
element are being depleted from the geopolymer concretes. Cr on the other hand has
moderate mobility from the geopolymer concretes. The total amount of Cr released from
the geopolymer is relatively small but the cumulative amount released from the
geopolymer concretes is increasing as the leaching process progresses. After 64 days of
leaching As and Se depletion from GP2 exceeds 100% which means that all the element
have leached out. Cr on the other hand has low depletion suggesting that there is still
some amount of the element available for leaching.
The release of the oxyanion forming elements (As, Cr, Se) from the geopolymer
concrete is lower than the estimated release of the elements based on maximum allowable
values from the TCLP regulatory limits. Limited risk based assessment performed on the
geopolymer concretes indicate that the human health risk (incidental ingestion, dermal
contact and inhalation of particles) associated with the material is minimal.

CHAPTER 7: MINERALOGICAL AND MICROSTRUCTURAL
CHARACTERIZATION
7.1 Mineralogical and Microstructural Analysis
The mineralogy and microstructure of the crushed, pulverized geopolymer
samples and the starting materials was determined using X-ray diffraction (XRD) and
scanning electron microscope (SEM).
7.2 X-Ray Diffraction (XRD) Analysis
XRD analysis on the samples aims to confirm the formation of mineral phases
that might be responsible for adsorbing the oxyanion forming trace elements.
PANalytical X‘pert PRO model PW 3040 equipped with θ-θ goniometer and Cu X-ray
tube operated at 45 KV and 40 mA that generates Kα radiation with a wavelength of
1.54Å was used. In this analysis, the sample is front loaded into a zero background
sample holder and mounted on the instrument‘s stage. X-rays beams from the x-ray
source were irradiated on the sample and the interaction of the x-ray with the sample
creates diffracted x-ray beams whose intensity is recorded by the detector (FIGURE 7-1).
Diffractogram are produced by collecting data in the 2θ angle range of 4o to 80
o with a
step size of 0.05o. The measured peak positions and relative intensity of the diffraction
beams are used to determine the crystalline mineral phases present in the samples by
comparing the peak positions (2θ) and intensities from the diffractogram to reference data

102
found in the American Mineralogist Crystal Structure Database (AMSCD). XPowder1, a
free phase identification software was used for the phase identification.
FIGURE 7-1: Schematic of the XRD setup
FIGURES 7-2 to 7-6 show the XRD diffractogram of the starting materials (CFA
and SF) and the geopolymer concretes (GPC, GP1, GP2, and GP3). The diffractogram of
CFA shown in FIGURE 7-2 did not indicate the presence of many crystalline phases,
most likely because there are no sufficient peaks to identify the presence of the phases.
There is a diffuse halo peak at 2θ from 15o to about 35
o which suggest the presence of
amorphous content. The two crystalline phases identified in the fly ash sample are quartz
(SiO2) and mullite (2Al2O3 SiO2). These two mineral phases are among the principal
minerals found in coal fly ash (Rattanasak and Chindaprasirt, 2009). Mineral phases such
as hematite (Fe2O3), and magnetite (Fe3O4) are other mineral phases present in coal fly
ash. There was no observed crystalline phases in the silica fume (FIGURE 7-2), there
was however a halo peak located between 2θ angle of between 15o and 30
o which
indicate the presence of glassy or amorphous content.
1 XPowder is a software for powder X-ray diffraction analysis

103
FIGURE 7-2: XRD diffractogram for the CFA and SF used
FIGURE 7-3 shows the diffractogram of the geopolymer concrete with 0%
hydrated lime (GPC), some of the crystalline phases present in the material cannot be
fully characterized due to peaks with unmatched mineral phases. Minerals that were
successfully identified are quartz, riebeckite, and gypsum as shown in the figure. The
sample also exhibits a not too noticeable hump at 2θ angle of between 25o-30
o that is
associated with the amorphous content of geopolymer. Quartz (SiO2) is the major
crystalline phase in the GPC sample which is attributed to the fact that the material
contains silica sand used in the production of the geopolymer concrete. The other
minerals found in the geopolymer concrete sample are riebeckite
(Na2(Fe,Mg)3Fe2Si8O22(OH)2 - Sodium Iron Magnesium Silicate) and gypsum (CaSO4).
Riebeckite is a sodium rich silicate mineral formed in a highly alkali environment, whose

104
presence in geopolymer mineralogy has not been reported in any literature on the
mineralogy of geopolymer. According to Miyano and Klein (1983), riebeckite is formed
by reaction of iron oxides and quartz in the presence of water. The presence of a lot of
sodium ion, quartz and iron oxides might have actually resulted in the production of
riebeckite instead of calcium containing mineral phases. Occurrence of gypsum in the
sample might be as a result of the absence of ettringite since gypsum is required for the
formation of ettringite or monosulfoaluminate hydrate (Zheng et al., 2011).
FIGURE 7-4 shows the diffractogram of the GP1 sample which contains 0.5%
hydrated lime. According to the information in the figure, the addition of 0.5% hydrated
lime to the geopolymer system led to the formation of new mineral phases. In addition to
quartz, minerals identified in GP1 include bearsite (Be2(AsO4)(OH).4H2O), beraunite
(Fe2+
Fe3+
5(OH)5(PO4)4·4H2O) and lime (CaO).
FIGURE 7-3: XRD diffractogram for the GPC geopolymer concrete

105
FIGURE 7-4: XRD diffractogram for the GP1 geopolymer concrete
The riebeckite that was found in the GPC has disappeared or is converted to
another mineral, most likely beraunite which is a hydrated iron phosphate hydroxide.
Other obvious difference between the GPC and GP1 is the presence of lime and bearsite,
an arsenic containing mineral phase. The XRD pattern in FIGURE 7-5 shows the mineral
phases present in the GP2 sample that contains 1.0% hydrated lime. These diffractogram
reveals the presence of quartz (SiO2), heinrichite (Ba(UO2)2(AsO4)2•11H2O), magnetite
(Fe3O4), downeyite (SeO2), guyanaite (CrO(OH) and cadmoselite (CdSe). There seems to
be stronger quartz peak and some unmatch peaks. In GP2, there is disappearance of the
riebeckite formed in GPC and formation of the bearsite that occurs in GP1. Heinrichite,
an asernic containing mineral phase was also found in this sample.

106
FIGURE 7-5: XRD diffractogram for the GP2 geopolymer concrete
Although the mineral downeyite was identified in this geopolymer sample, the
presence of the mineral is doubted because this mineral is reported to be hygroscopic and
unstable under normal atmospheric conditions (Finkelman and Mrose, 1977). Only two
mineral phases can be successfully identified in GP3 as shown in FIGURE 7-6. These
two minerals are quartz and beraunite which are the minerals that can be found in the
other geopolymer concrete samples. TABLE 7-1 summarizes the mineral phases
identified in all the geopolymer concretes. Only quartz is common to all the geopolymer
concrete and beraunite was identified in only the GP1 and GP3 samples. The other
mineral phases were only identified once.
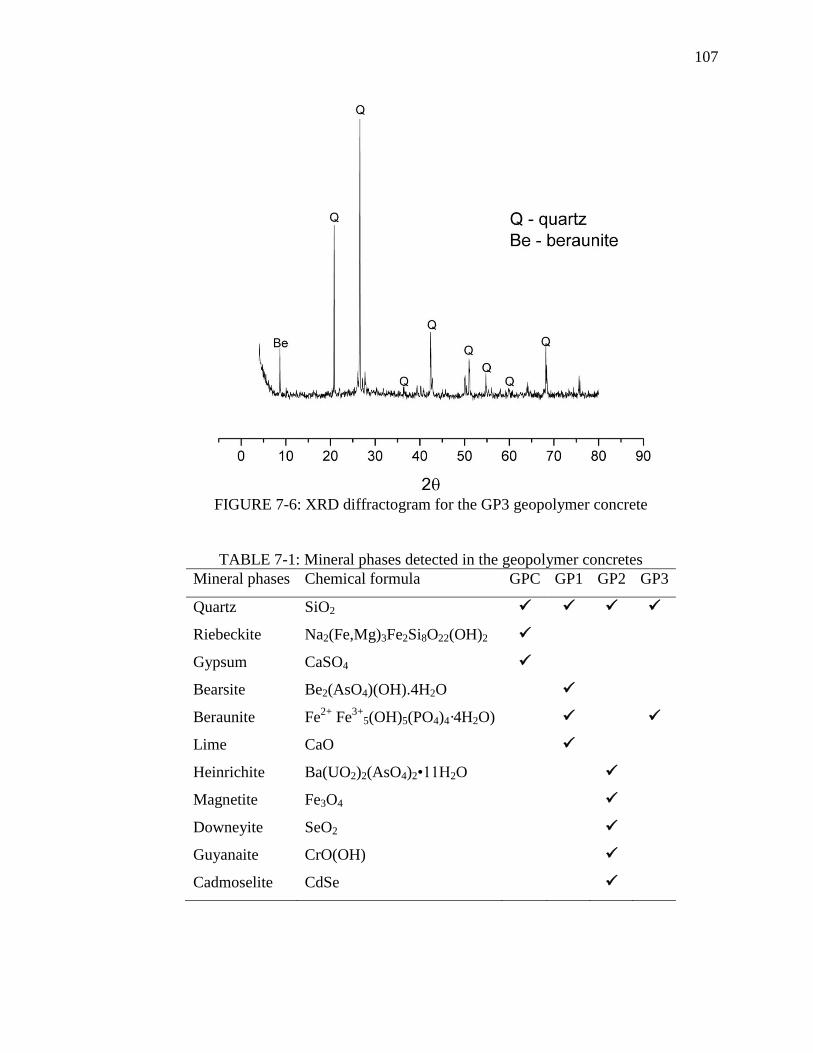
107
FIGURE 7-6: XRD diffractogram for the GP3 geopolymer concrete
TABLE 7-1: Mineral phases detected in the geopolymer concretes
Mineral phases Chemical formula GPC GP1 GP2 GP3
Quartz SiO2
Riebeckite Na2(Fe,Mg)3Fe2Si8O22(OH)2
Gypsum CaSO4
Bearsite Be2(AsO4)(OH).4H2O
Beraunite Fe2+
Fe3+
5(OH)5(PO4)4·4H2O)
Lime CaO
Heinrichite Ba(UO2)2(AsO4)2•11H2O
Magnetite Fe3O4
Downeyite SeO2
Guyanaite CrO(OH)
Cadmoselite CdSe

108
7.3 Scanning Electron Microscope (SEM) Analysis
JOEL scanning electron microscope (SEM) model JSM-6480 (FIGURE 7-7)
equipped with energy dispersive x-ray spectroscopy (EDX) was used to characterize the
samples. Imaging of the sample to determine the microstructure was achieved by
irradiating it with focused electron beams from a cathode, detector in the SEM converts
signal emitted by the sample to intensity that produces images of the sample surface
(Chancey, 2008). To avoid distorted images, the sample was coated with Gold (Au), a
conductive material using a sputtering device. Coating is necessary to allow the discharge
of electron build up thereby eliminating charging effect that occurs when the sample is
irradiated with electron beams with high accelerating voltage.
After coating, the sample is placed in the sample chamber which is evacuated to
create a vacuum inside. The sample is then irradiated with electron beam at 7 KV
accelerating voltage and the interaction of sample surface with the electron beams
produces images on the display which was adjusted to X 1,300 magnification to acquire
the SEM images of the sample.
FIGURE 7-7: JOEL SEM equipped with energy dispersive spectrometry (EDX)

109
FIGURES 7-8 to 7-12 show the SEM micrographs of the starting materials and
the produced geopolymer concretes. As shown in FIGURE 7-8, the CFA comprises of
spherical particles with smooth surfaces while the SF is made up of smaller particles that
clump together easily. The CFA has a mean particle size of 47 µm while the SF has mean
particle size of 277 µm.
CFA SF
FIGURE 7-8: SEM micrograph of CFA and SF
Micrograph of the geopolymer concretes (FIGURES 7-9 to 7-12) showed that the
material is very similar in microstructure. It shows a homogenous featureless hydration
product that result from the dissolution of the CFA and SF by the strong alkaline liquid.

110
FIGURE 7-9: SEM micrograph of the GPC geopolymer concrete
FIGURE 7-10: SEM micrograph of the GP1 geopolymer concrete

111
FIGURE 7-11: SEM micrograph of the GP2 geopolymer concrete
FIGURE 7-12: SEM micrograph of the GP3 geopolymer concrete

112
From these micrographs, the addition of hydrated lime during the geopolymer
synthesis did not significantly alter the surface morphology of the geopolymer. In all the
geopolymer concrete samples, the dense featureless product is the aluminosilicate matrix
of geopolymer. Unfortunately, there was no observed presence of unreacted or partially
reacted CFA particles which is normally seen in the microstructure of geopolymer.
7.4 Energy Dispersive X-Ray Spectroscopy (EDX) Analysis
Elemental composition of the geopolymer concrete was determined through the
use of the EDX attached to the SEM. According to Chancey (2008), electron beams at
accelerating voltage between 15 KV to 25 KV are normally used to irradiate the sample.
Interaction of these electron beams with the sample generates characteristics X-ray
photons with energies specific to the elements contained in the sample. Detectors in the
EDX detect photons and correlate their respective energies with the elements that emit
them. The EDX spectrums obtained from the EDX analysis are presented in FIGURES 7-
13 to 7-18. As expected, majority of elements identified in all the materials (CFA, SF
and geopolymer samples) are Si, Al, C and O which is due to the aluminosilicate nature
of both the starting materials and produced geopolymer concretes. Unfortunately, the
EDX analysis did not identify the presence of minor elements such as As, Cr and Se
(TABLE 7-2).

113
FIGURE 7-13: EDX spectrum of CFA
FIGURE 7-14: EDX spectrum of SF
FIGURE 7-15: EDX spectrum of GPC

114
FIGURE 7-16: EDX spectrum of GP1
FIGURE 7-17: EDX spectrum of GP2
FIGURE 7-18: EDX spectrum of GP3
FIGURE 7-18 does not show the presence of Si peak in the EDX spectrum for the
GP3 geopolymer concrete. Tantalum (Ta) peak occurs instead in the spectrum which is

115
due to the overlap between Si-K and Ta-M peaks (Suzuki and Rohde, 2008). Si is the
most probable element that belongs to the peak at 1.7 keV. After quantification of the
element, the normalized bulk composition of the geopolymer concrete is presented in
TABLE 7-2.
TABLE 7-2: Elemental composition of the geopolymer concretes
Elements CFA SF GPC GP1 GP2 GP3
Al 13.25 2.08 5.64 5.53 9.35 3.27
Si 18.60 28.81 29.57 33.76 19.92
O 40.59 34.64 43.92 42.71 25.11 25.68
C 15.74 28.28 11.90 7.69 10.02 38.22
Fe 3.08 2.07 1.97 8.83 1.46
Cu 2.52 2.97 1.86 1.89 9.37 1.57
Ca 1.69 1.15 0.89 4.70 0.51
K 1.66 0.83 0.68 2.16 0.33
Ti 1.15 0.34 1.73 0.19
Mo 1.38
Mg 0.33 0.45 0.51 0.81
Au 3.21 0.31 1.35 3.51
Na 2.41 3.08 3.05 1.46
V 0.53
Ta* 20.22
S 0.19
*Ta presence is the result of overlap between Ta and Si peak at 1.7 KeV

116
7.5 Summary
The result of the XRD investigation is less satisfactory because mineral phases
such as ettringite, monosulfoaluminate, CSH and calcium metalates that are considered
suitable candidate for immobilizing oxyanion elements were not identified in the
geopolymer concretes. This does not mean that these phases are not formed or present in
the samples, the peaks of the mineral phases are most likely not successfully identified
because of low peak intensity and limitation of the AMSCD database used for phase
identification. On the other hand, Van Jaarsveld and Van Deventer (1999) noted that
large part of geopolymer structure is amorphous to X-ray hence the absence of many
crystalline phases. Therefore, the inability to identity mineral such as CSH might be due
to the fact that the mineral is essentially amorphous (Gougar et al., 1996).
From the SEM analysis of the geopolymer concretes, the addition of calcium did
not significantly affect the microstructure of the geopolymer. Although it is believed that
the presence of extra calcium in the form of calcium hydroxide would lead to the
precipitation of poorly crystalline CSH or calcium mineral phases (Temuujin et al.,
2009), these minerals were not seen in the micrographs acquired from the SEM analysis.

CHAPTER 8: SPECIATION MODELING USING PHREEQC/PHREEPLOT
8.1 Background on PHREEQC/PHREEPLOT
PHREEQC is one of the most widely used speciation modeling program, which is
based on the equilibrium of aqueous solutions with mineral phases, solid solutions,
sorbing surfaces and gases (Parkhurst and Appelo, 1999; Halim et al., 2005). The
program uses ion-association aqueous model to calculate the distribution of aqueous
species in any aqueous solution and can allow the concentration of elements to be
adjusted to equilibrium or a specified saturation index (SI). The ion-association model
requires that before chemical equilibrium can be achieved all mass-action equations for
the aqueous species must be satisfied (Parkhurst and Appelo, 1999). PHREEQC program
uses information contained in the associated database and input file to calculate the
distribution of species and saturation indices of mineral phases. The input file contains set
of keywords that define the pH, temperature, density, chemical composition of the
solution (total concentration of cations and anions) while the database file contains
thermodynamic parameters such as dissociation equations and constants, mineral
formation reactions, and temperature functions (Zhu and Anderson, 2002).
PHREEPLOT is a program that has the capability of using output from
PHREEQC to produce high quality geochemical plots. It contains an embedded version
of the PHREEQC program and has the ability to do simple looping which makes it easier
to do repetitive PHREEQC calculations needed to generate a wide range of graphical

118
plots (Kinniburgh and Cooper, 2011). PHREEPLOT also consists of set of keywords in
the input file and associated database which defines the thermodynamic data needed for
the modeling. Information contained in the input file is read and processed simulation by
simulation to calculate the distribution of species and saturation indices of phases. This
chapter focuses on using PHREEPLOT to model the distribution of aqueous species of
As, Cr and Se based on the aqueous solution input data and mineral phases identified as
the solubility controlling phases.
8.1.1 The PHREEPLOT Database
Databases contain definition of chemical species, complexes and dissociation
constants under specified conditions such as temperature (Charlton et al., 1997; Dhir et
al., 2008). Most geochemical modeling programs come with several databases;
PHREEPLOT contains more database than other geochemical modeling programs used in
geochemical modeling. TABLE 8-1 present the databases associated with the
PHREEPLOT program.
TABLE 8-1: Databases associated with PHREEPLOT
TABLE 8-1(continued)
Database Size Description and key features
amm.dat 21 KB Small entries
iso.dat 255 KB Contains common mineral phases
minteq.dat 156 KB Developed for the minteq program and contains
organic compound, uranium minerals, arsenic
minerals, metalates of Ca and other elements
minteqv4.dat 390 KB Updated version with more entries than minteq.dat
NAPSI_290502 117 KB

119
TABLE 8-1(continued)
Database Size Description and key features
phreeqc.dat 34 KB Contains limited but consistent entries
phreeqd.dat 29 KB
pitzer.dat 20 KB
sit.dat 506 KB Contains phases such as ettringite,
monosulfoaluminate, gismondine, hydrogarnet,
downeyite and CSH
wateq4f.dat 99 KB Phreeqc.dat extended with many heavy metals
included
llnl.dat 756 KB A huge database that contains phases such as
gismondine, cadmoselite, downeyite and ettringite
Most of the databases do not contain dissociation constant and dissolution
equation for all the aqueous species or mineral phases needed for the simulation. Some
mineral phase of interest is missing in the database, their information was manually
adding into the chosen database via the input file data. These supplementary data for
mineral phases were obtained from literature search and other database.
8.1.2 Description of the PHREEPLOT Input File
As discussed in section 8.1, data needed for the modeling are supplied via the
input file. This input file contains set of keywords that is followed by data blocks which
define the parameters needed in the modeling separated into simulations by the END
keyword (Kinniburgh and Cooper, 2011). END keyword literally instructs the program to
calculate. Each keyword signifies the beginning of data block and the program knows

120
what to do with the data that follows the keyword provided the keyword is written
correctly (Zhu and Anderson, 2002). The input file is separated by the CHEMISTRY
keyword. The top of the input file contains PHREEPLOT settings while the bottom
contains the PHREEQC code (Kinniburgh and Cooper, 2011). The CHEMISTRY
keyword is used to separate the two section of the input file i.e. it signifies the beginning
of the PHREEQC input. According to Kinniburgh and Cooper (2011), PHREEPLOT
input file should be kept as simple as possible and preliminary calculations should be
placed at the beginning of the file.
Some of the keywords relevant for this modeling are discussed further in this
section. INCLUDE is a keyword that is placed in the CHEMISTRY section which is used
to call other files that contain codes needed for several calculations. Two INCLUDE files
relevant for this modeling are ―speciesvsph.inc‖ and ―speciesvspht.inc‖. These two files
are used in making the species vs pH plots; the former plots the relative concentration (in
%) of all species while the later plots the overall percentage of the elements species that
is in dissolved form (Kinniburgh and Cooper, 2011). The SOLUTION keyword defines
the composition of the aqueous solution which includes temperature, pH and density.
PHASES defines name, dissociation reactions and thermodynamic data for minerals and
gases that are used in the speciation and batch-reaction calculations (Parkhurst and
Appelo, 1999). EQUILIBRIUM_PHASES is used to define the combination of minerals
and /or gases that react reversibly with the aqueous solution to equilibrium, prescribed
saturation index (SI) or gas partial pressure (Parkhurst and Appelo, 1999; Appelo and
Postma, 2005).

121
8.2 Procedure for the PHREEPLOT Speciation Modeling
Four different sets of simulations with PHREEPLOT are performed in this study.
The pH temperature and chemical composition of the aqueous solutions from the WLT
performed on the geopolymer concretes (section 6.5) were used in each simulation.
Before the preparation of the input file, a suitable database was chosen that contains (1)
aqueous species of the elements of interest (2) dissolution equations of mineral phases
that are considered solubility controlling mineral phases (3) most accurate solubility
constant (k) for the mineral phases and aqueous species. The ‗llnl.dat‘ thermodynamic
database was employed because it is the largest and contains huge amount of mineral
phases that can potentially be solubility controlling phases.
The input file was then prepared by using keywords and associated data blocks.
The PHREEPLOT section of the input file begins with the keyword SPECIATION and
contains data blocks that define the database used, calculation type ‗species‘, the
calculation method, elements of interest, behavior of the program when an error is
encountered, looping function and number of times to loop. This section also contains
information on how the program handles and plots the generated data. The CHEMISTRY
keyword signifies the beginning of the PHREEQC section. In this section, the solubility
controlling minerals phases that are not present in the ‗llnl.dat‘ database were manually
added. TABLE 8-2 shows the manually added mineral phases, their dissolution equations
and solubility constant. Compositions of the aqueous solution (TABLE 6-5 to 6-7) used
in the speciation calculation are also entered in this section and the input file saved with a
―.ppi‖ extension in a designated folder. Appendix F contains the input file for one of the
simulations while the corresponding output file is in appendix G.

122
TABLE 8-2: Mineral phases manually added to the simulation
TABLE 8-2 (continued)
Phase name Dissolution equation and log_k at 25oC references
2
Cr-ettringite Ca6(Al(OH)6)2(CrO4)3:26H2O
= 6Ca2+
+2Al3+
-12H++3CrO4
2-+38H2O
log_k 60.28
sit.dat
Se-ettringite Ca6(Al(OH)6)2(SeO4)3:31.5H2O =
6Ca2+
+2Al3+
+3SeO42-
-12H+ +43.5H2O
log_k 61.29
(Chrysochoou
and Dermatas,
2006)
Se-monosulfoaluminate Ca4(Al(OH)6)2SeO4:9H2O = 4Ca2+
+2Al3+
-12H+ +SeO4
2- +21H2O
log_k 73.40
(Cornelis et al.,
2008)
Monosulfoaluminate Ca4Al2(SO4)(OH)12:6H2O = 4Ca2+
+2Al3+
-12H+ +SO4
2- +18H2O
log_k 72.73
sit.dat
Cr-monosulfoaluminate Ca4Al2O6(CrO4):15H2O=4Ca2+
+2Al3+
-12H+ +CrO4
2- +21H2O
log_k 71.36
sit.dat
CaSeO4:2H2O CaSeO4:2H2O = Ca2+
+SeO42-
+2H2O
log_k -2.68
sit.dat
CaSeO3:2H2O CaSeO3:2H2O = Ca2+
+SeO32-
+ 2H2O
log_k -4.6213
(Cornelis et al.,
2008)
CaSeO4 CaSeO4 = Ca2+
+SeO42-
2 sit.dat is a thermodynamic database in PHREEPLOT

123
TABLE 8-2 (continued)
Phase name Dissolution equation and log_k at 25oC references
2
log_k -3.0900
Ca3(AsO4)2:3H2O Ca3(AsO4)2:3H2O = 3Ca2+
+ 2AsO43-
+3H2O log_k -21.14
(Cornelis et al.,
2008)
CaHAsO3 CaHAsO3 = Ca2+
+HAsO32-
log_k -6.52
(Cornelis et al.,
2008)
CaCrO4 CaCrO4 = Ca2+
+CrO42-
log_k -3.15
sit.dat
CaHAsO4 CaHAsO4 = Ca2+
+ HAsO42-
Log_k -2.66
(Alexandratos
et al., 2007)
8.3 Model Simulation Results and Interpretation
Plots that show the distribution of species of the three elements are discussed in
this section. FIGURES 8-1 to 8-3 showed the percentage distribution of species of each
element as a function of pH. It is evident from the plots that the predominant species
varies across the pH range.
The simulation results of As shown in FIGURE 8-1 reveal that HAsO3F- and
AsO3F2-
are the As species present in the aqueous solution from all the geopolymer
concretes. HAsO3F- is the dominant specie in the acidic pH range while AsO3F
2- is more
dominant in the alkaline pH. These species of As are As (5) which is less soluble and less
toxic than As (3) (Moon et al., 2004). At about pH 6, the proportion of the two species in
the solution is the same.

124
FIGURE 8-1: Typical distribution of As species from the PHREEPLOT simulation
As shown in FIGURE 8-2, SeO42-
and HSeO4- are two species of Se (6) that are
present in the aqueous solution in considerable amount. From pH 1 to pH 2, HSeO4- is the
dominant specie present in the solution and as pH increases from 2, the dominant specie
changes to SeO42-
. At around pH 2, the two species have equal amount in the solution. Se
(4) species such as SeO32-
, HSeO3- and H2SeO3 are also present in the solution but the
amount present is so small that it does not significantly contribute to the species
distribution. The type of Se present in the solution in considerable amount is less toxic
since Se(4) is considered to be more toxic than Se (6) (Goldberg et al., 2006).

125
FIGURE 8-2: Typical distribution of Se species from the PHREEPLOT simulation
Both Cr (3) species: Cr3+
, CrOH2+
, CrCl2+ and Cr (6) species: HCrO4
-, CrO4
2- are
responsible for the distribution of Cr in the aqueous solution. Some of these species have
very low amount and therefore have insignificant contribution to the Cr distribution. The
obviously dominant species are Cr3+
, HCrO4- and CrO4
2-. Between pH 1 and pH 1.5, Cr
3+
is the main specie while HCrO4- is the other specie present. Equal amount of these two
species exist at pH 1.5, afterwards HCrO4- becomes the dominant specie and Cr
3+ reduces
to zero. The amount of the HCrO4- specie starts to diminish at around pH 5 while CrO4
2-
starts to increase. At around pH 7, there was equal distribution of the HCrO4- and CrO4
2-
specie. In the alkaline pH range, the dominant specie is the CrO42-
. Among all the species
present in the solution, the Cr(6) species are considered to be more toxic than Cr(3)
species (Shtiza et al., 2009).

126
FIGURE 8-3: Typical distribution of Cr species from the PHREEPLOT simulation
8.4 Validation of the Model Output
The purpose of model validation is to check the ability of the model to correctly
and realistically predict the results. Due to lack of experimental data from literature
search to use for validation of the model, the validation was instead conducted by
comparing the calculated molal concentration of each element (appendix G for molal
concentration at pH 11.23) obtained from the simulations with the measured
concentration in the aqueous solution used as input data. TABLE 8-3 contains the
comparison between the measured concentration and molal concentration obtained from
the modeling. Overall, the calculated concentration of As, Cr and Se from the model is
relatively very close to the measured concentration from the WLT that was used as input
data.

127
TABLE 8-3: Comparison of input and PHREEPLOT model output concentration Concentration (mg/l)
GPC GP1 GP2 GP3
PHREEPLOT WLT PHREEPLOT WLT PHREEPLOT WLT PHREEPLOT WLT
As 1.027 1.023 1.023 1.019 1.019 1.015 0.928 0.955
Cr 0.011 0.025 0.011 0.025 0.011 0.025 0.011 0.025
Se 0.407 0.405 0.420 0.418 0.424 0.422 0.375 0.374
8.5 Summary
The PHREEPLOT simulations showed the oxyanion elements (As, Cr, Se) are
present in the leachates in As(5), Se(6), Cr(3) and Cr(6) oxidation states. The results
indicated that in the alkaline pH range, As (5) exist mainly as AsO3F2-
, Se(6) as SeO42-
and Cr(6) as CrO42-
. These As and Se species present in this aqueous solution are in the
higher oxidation states and are less toxic than the reduced form. Cr on the other hand,
exists in an oxidation state that is found in the alkaline pH range is considered to be the
most toxic form. However the distribution of this higher oxidation states chromium
(Cr(6)) is negligible in the alkaline pH range.

CHAPTER 9: CONCLUSIONS AND RECOMMENDATIONS
9.1 Conclusions
As stated in chapter one, the suitability of geopolymer as a safe alternative to
cement in construction and waste stabilization depends on the material potential
environmental impacts. There is thus a need to properly understand geopolymer leaching
behavior during its service life and end of life conditions. The leaching of oxyanion
forming elements such as As, Cr and Se was particularly important because these
elements can exist in oxidation states that are more mobile in the alkaline pH
environment that would exist in geopolymer pore solution. This dissertation was set up
with the aim of understating the leaching mechanism oxyanion forming elements (As, Cr,
Se) from fly ash based geopolymer concrete and investigates the effect of hydrated lime
on mobility of these elements from the material and strength of the concrete. To achieve
the research goals, specific objectives (Section 1.4) were set and hypothesis (Section 1.5)
formulated. Several experimental tasks were designed in the course of this dissertation.
The following conclusions have been made based on the results from the tasks presented
in preceding chapters of this dissertation.
9.1.1 Synthesis of Geopolymer Concrete
Geopolymer concretes were synthesized using CFA, SF, CA, FA, NaOH with
varying amount of hydrated lime, cured without heat at room temperature and in an oven

129
maintained at 75oC. Major findings from the geopolymer concrete synthesis are
summarized as follows:
Geopolymer concretes are alkaline material with pH greater than 11 and the same
bulk density as normal weight concrete (2300 kg/m3) which is expected since
aggregates determine the weight of concrete.
The 28 days compressive strength of geopolymer concretes cured without heat is
relatively lower than the strength of the concrete cured at 75oC. The average
strength of the concretes cured without heat varies from 13 MPa (1937 psi) to 18
MPa (2647 psi) while the heat cured geopolymer concretes have average strength
that varies from 42 MPa (6013 psi) to 56 MPa (8117psi).
There is presence of efflorescence on the surface of the geopolymer concretes
cured without heat which might indicate insufficient geopolymerization hence the
lower strength of the concrete when compared with the heat cured geopolymer.
Hydrated lime addition leads to reduction in strength of the geopolymer concretes.
Geopolymer concretes made with additional hydrated lime exhibit lower
compressive strength than the control geopolymer concrete that has zero hydrated
lime added (GPC).
Among the geopolymer concrete with hydrated lime, the GP2 with 1% hydrated
lime have the highest strength in both the concrete cured with heat and without
heat.
The lower compressive strength of the geopolymer concrete cured without heat
makes it suitable for use only in low strength structural applications such as walkway,
road divider and solidification of waste. The heat cured geopolymer concrete on the hand
130
can be used for higher strength structural applications similar to OPC concrete since it
has compressive strength that exceed 41 MPa (6000 psi). It is evident from this
investigation that heat curing is required in order to produce geopolymer concrete of
considerable compressive strength. There is also an optimal amount of additive such as
hydrated lime that can added to geopolymer concrete that would not affect the strength of
the material. Part of hypothesis 5 which states that ―leaching of these oxyanion forming
elements can be mitigated by the addition of extra calcium in the form of lime during
geopolymer synthesis, which would lead to the formation of oxyanion substituted
calcium mineral phases in addition to the geopolymer phase without affecting the
durability of the geopolymer‖ was tested in Section 5.3. The results show that even
though the addition of lime lead to reduction in compressive strength of the geopolymers,
the overall the minimum compressive strength of the geopolymers that contain additional
lime still meets the strength requirement for concrete used in high strength structural
applications.
9.1.2 Leaching of Elements from Geopolymer Concrete
The leaching tests performed on the geopolymer concretes are: pH dependence
test, Dutch availability test, water leach test (WLT) on the granular form of the concretes
and the tank test on the monolith form of the concretes. Hypothesis 2 which states that
―oxyanion forming elements exhibit different leaching behavior than other elements that
are leached from the alkaline fly ash based geopolymer‖ was addressed using the pH
dependence test presented in Section 6.2. Results obtained from the pH dependence test
indicate that all oxyanion forming elements (As, Se, Mo and V) except Cr displays higher
mobility in the alkaline pH. Cr and other elements such as Al, Ca, Fe, Mg, B, Ba, Cu,
131
Mn, and Zn exhibit different leaching behavior with their highest mobility occurring in
the acidic pH range. Elements that include Al, Si, Ca and Na have extremely high
mobility from all the geopolymer concretes. The test also supported hypothesis 1 which
states that ―oxyanion elements (As, Cr, Se) are present in leachates from fly ash based
geopolymer concrete‖. In both the acidic and alkaline pH range, mobility of most of the
elements (As, Se, Mo, V, Si, Al, Fe, Mg, Cu, Mn and Zn) is lowest in the GP2 concrete
that has 1% hydrated lime. This implies that the addition of 1% hydrated lime was able to
reduce the mobility of most of the elements from the geopolymer concrete.
Hypothesis 3 which states that ―standard leaching test methods conducted at a
neutral pH are adequate for predicted the leaching of oxyanion forming elements‖ was
tested in Section 3.6.2 by statistically comparing the result of the Dutch availability test
conducted at neutral pH and acidic pH with result obtained from a modification of the
availability test conducted at the material pH and acidic pH. No statistical difference was
observed between the results from the two test methods, which signifies that the Dutch
test conducted at neutral pH is adequate to predict leaching of the oxyanion forming
elements (As, Cr, Se) from the alkaline fly ash based geopolymer.
The Dutch availability test used to investigate the leaching from the fly ash based
geopolymer concrete under the worst case scenario showed that As and Se exhibit
considerable leachability from the geopolymer concretes. As mobility varies from 8.3
mg/kg to 9.7 mg/kg while the mobility of Se range between 2.9 mg/kg to 4.5 mg/kg. The
lowest amount of each element leached (As – 8.3 mg/kg, Se – 2.9 mg/kg) occurs in the
GP2 sample. The amount of Cr released from all the geopolymer concrete is constant.

132
This results suggest that 1% hydrated lime in the geopolymer concrete may lead to
reduction in mobility of As and Se.
Tank test conducted on the monolithic geopolymer concrete better represent the
leaching behavior of the material during its service life. The test results showed that the
release mechanisms associated with the leaching of the three elements are surface wash-
off, diffusion, depletion and dissolution. Surface wash-off, diffusion and depletion are the
main leaching mechanism responsible for the leaching of As and Se which have high or
moderate mobility that tends to a flat plateau as the leaching duration increases. This
signifies that the element is depleting in the matrix. Cumulative amount of As released
from the geopolymer concretes reached a maximum of 300 mg/m2 while that of Se
reached a maximum of 130 mg/m2. The leaching mechanisms associated with the release
of Cr are surface wash-off, diffusion and dissolution with a cumulative amount of Cr
released at the end of the leaching duration that reached 3 mg/m2. It is obvious from the
result that the cumulative mobility of Cr has not reached the depletion stage because the
element have lower mobility rate than the other elements. Overall, the mobility of As and
Se from the GP2 concrete with 1% hydrated lime is the lowest.
Hypothesis 5 which states that ―leaching of these oxyanion elements can be
mitigated by the addition of extra calcium in the form of lime during geopolymer
synthesis‖ was tested using the pH dependence test (Section 6.2), Dutch availability test
(Section 6.3) and the tank test (Section 6.4). The results reveal that at 1.0% lime addition
there was reduction in the mobility of most of the elements including the oxyanion
forming elements (As, Cr, Se).

133
9.1.3 XRD and SEM/EDX Analysis of the Geopolymer Concretes
Hypothesis 4 which states that ―calcium containing mineral phases such as
ettringite, hydrocalumite, monosulfoaluminate, calcium metalates and calcium silicate
hydrates (CSH) are effective for immobilizing oxyanion forming elements via ion
substitution‖ was tested in Section 7.2 and 7.4. Although literature search suggested that
mineral phases such as ettringite, monosulfoaluminate, CSH and precipitates of calcium
are solubility controlling phases that can help reduce the mobility of the oxyanion
forming elements like As, Se and Cr. Unfortunately, this hypothesis cannot be supported
due to lack of identification of the mineral phases in the geopolymer concrete samples
analyzed. Mineralogical analysis of the geopolymer concrete using the XRD did not
reveal the presence of these solubility controlling mineral phases, but however reveals the
presence of other minerals phases such as quartz, riebeckite, gypsum, bearsite, bearunite,
lime, downeyite, cadmoselite, heinrichite, guyannaite and magnetite. Quartz is the only
mineral that is common to all the geopolymer concretes. The mineral beraunite was found
in the GP1 and GP3 concrete while the remaining minerals are found only in one
geopolymer concrete sample. The inability of the mineralogical analysis to identify the
solubility controlling mineral phases is most likely due to the fact that geopolymer
concrete are essentially amorphous to x-ray detection or due to low peak intensity which
makes their identification impossible.
Microstructural analysis of the geopolymer concrete using SEM showed that the
materials have similar surface morphology. All the geopolymer concretes have
homogenous featureless hydration product. It is obvious that the additional hydrated lime
did not significantly affect the microstructure of the concretes.

134
9.1.4 Distribution of Species of As, Cr and Se
PHREEQC/PHREEPLOT simulation identified HAsO3F- and AsO3F
2- are the As
species present in the aqueous solution while SeO42-
and HSeO4- are two species of Se
present in the aqueous solution in considerable amount. This species of As and Se are
respectively in the As (5) and Se(6) oxidation states which are considered to be less toxic
than the reduced oxidation state of the elements (As(3) and Se(4)). Dominant Cr species
present in the aqueous solution include Cr3+
, HCrO4- and CrO4
2-. Cr
3+ is in the Cr(3)
oxidation state while HCrO4- and CrO4
2- are in Cr(6) oxidation state. Cr(6) is considered
to be more toxic than Cr(3). In the alkaline pH, AsO3F2-
, SeO42-
, and CrO42-
are the main
species present in the aqueous solution. The closeness of the concentration of elements
used in input data and the calculated concentration from PHREEQC/PHREEPLOT
simulation was assessed. This comparison showed that the concentrations were very close
which means that the model was able to predict the concentration of As, Cr and Se in the
aqueous solution.
9.1.5 Overall Conclusions
The objectives of the research are listed below and the conclusions derived from
results of various experiment conducted to meet these objectives are stated.
To determine the release of oxyanion elements (As, Cr, Se) from fly ash based
geopolymer concrete under service life (monolithic) and end of life (granular)
conditions using appropriate tests.
To determine the maximum amount of oxyanion forming elements that would be
released under the worst case scenario when the material is pulverized.

135
The pH dependence, Dutch availability (worst case scenario) and tank (service
life) test were used to determine the mobility of the elements from the fly ash
based geopolymer concretes. The leaching tests reveal that As and Se leach out
from the geopolymer concrete samples in the high alkaline range (pH >11) in
greater amount during the service life and end of life conditions.
To assess the potential to decrease mobility, or even total immobilization of
oxyanion element (As, Cr, Se) in geopolymer concrete by means of using
hydrated lime as an admixture.
The addition of about 1% hydrated lime to geopolymer concrete led to reduction
in the mobility of As and Se. The added hydrated lime also led to overall
reduction in compressive strength of the geopolymer concretes but when
concretes with hydrated lime additive were compared, the concrete with 1%
hydrated lime result in slight increase in the compressive strength of the
geopolymer concrete.
To determine if there is formation of calcium containing mineral phases, calcium
precipitates or calcium metalates in the produced geopolymer concrete.
XRD analysis of the geopolymer concrete did not reveal the presence of these
mineral phases, but minerals phases such as quartz, riebeckite, gypsum, bearsite,
bearunite, lime, downeyite, cadmoselite, heinrichite, guyannaite and magnetite
were identified in the geopolymer concretes.
To identify the probable mechanisms responsible for immobilization of the
oxyanion forming elements (if there is any immobilization).

136
Although there was observed reduction in the mobility of the oxyanion forming
elements (As, Cr, Se) when 1% hydrated lime was added to the geopolymer
concrete. The mechanisms responsible for the immobilization were not known
due to the absence of the solubility controlling mineral phases that should
immobilize the elements via ion substitution and precipitation.
To determine the species of the oxyanion elements (As, Cr, Se) released from fly
ash based geopolymer concrete and their potential environmental impacts.
Even though there is high mobility of As and Se from the geopolymer, the species
of the elements identified by geochemical modeling indicated that their mobility
would not cause adverse environmental issue since these species belong to
oxidation states that are less toxic, while in the case of Cr mobility results in
release of low concentration of elements below the MCL.
Based on the results from this dissertation, more extensive investigation is needed
on mobility of oxyanion forming elements from geopolymer concrete before deciding
whether the material can be safely used in place of Portland cement concrete. However,
the results suggest that the material can be used in solidification/ stabilization of waste
before landfilling since the amount of oxyanion elements (As, Cr, Se) released is less
than the amount specified in the TCLP test as regulatory limits.
9.2 Limitations of the Study
Although most of the research objectives and hypotheses were reached, there are
some limitations and number of issues that are not properly addressed due to equipment
and time constraints. First, some of the tests were performed in only duplicates. It would
be advantageous to increase the number of replicates to five in order to be able to perform

137
proper statistical analysis of the results. Second, the free mineral phase identification
software and the AMSCD mineral database is not very reliable due to the limited number
of entries in the database and reduced functionality of the free software. Finally,
speciation modeling is not enough in the determination of the species of oxyanion
forming elements (As, Cr, Se) released from the geopolymer concretes.
9.3 Recommendations for Future Work
The following recommendations are suggested for future work:
Leaching behavior, mineralogical and microstructural analysis of the geopolymer
concrete cured without heat should be studied.
An optimized mix design with enough additives that would ensure the formation
and presence of the solubility containing mineral phases.
More extensive XRD mineral database should be used for identification of the
mineral phases present in the geopolymer concrete.
Platinum coating can be used instead of gold before the SEM/EDX analysis in
order to reduce the occurrence of charging and the ability to detect elements that
are identified at high accelerating voltage.
Speciation analysis using a combination of IC and ICP-MS should be conducted
to confirm the presence of the less toxic oxidation state of As, Cr and Se.
Accuracy of the result obtained from the PHREEPLOT modeling should be
verified using the result from speciation analysis using experimental method.
Future research should be done to establish the relationship between the strength
of the geopolymer concretes and the leachability of the oxyanion forming trace
elements (As, Cr, Se).

138
REFERENCES
ACAA. 2003. Fly ash facts for highway engineers Report No: FHWA-IF-03-019
American Coal Ash Association, Aurora, Colorado.
ACAA. 2008. Sustainable construction with coal combustion products:A primer for
architects, American Coal Ash Association Educational Foundation American
Coal Ash Association, Aurora, Colorado.
Alexandratos, V.G., E.J. Elzinga, and R.J. Reeder. 2007. Arsenate uptake by calcite:
Macroscopic and spectroscopic characterization of adsorption and incorporation
mechanisms. Geochimica et Cosmochimica Acta, 71 (17):4172-4187.
Allen, T. 2003. Powder sampling and particle size determination. Amsterdam; Boston:
Elsevier.
Andrews, L.C. 2007. A geochemical analysis of aluminum hydroxides and iron oxides in
little backbone creek, Shasta county, California. Bachelor of Arts, Carleton
College, Northfield, Minnesota.
Appelo, C.A.J., and D. Postma. 2005. Geochemistry, groundwater and pollution. 2nd ed.
Leiden, The Netherlands: A.A. Balkema publishers.
ASTM. 2003. ASTM C702 - Standard practice for reducing samples of aggregate to
testing size, ASTM International, West Conshohocken, PA.
ASTM. 2006a. ASTM C136 - Standard test method for sieve analysis of fine and coarse
aggregates, ASTM International, West Conshohocken, PA.
ASTM. 2006b. ASTM C207 - Standard specification for hydrated lime for masonary
purposes, ASTM International, West Conshohocken, PA.
ASTM. 2006c. ASTM D3987 - Standard test method for shake extraction of solid waste
with water, ASTM International, West Conshohocken, PA.
ASTM. 2008. ASTM C618 - Standard specification for coal fly ash and raw or calcined
natural pozzolan for use in concrete, ASTM International, West Conshohocken,
PA.
ASTM. 2010a. ASTM C39 - Standard test method for compressive strength of cylindrical
concrete specimens, ASTM International, West Conshohocken, PA.
ASTM. 2010b. ASTM C1240 - Standard specification for silica fume used in
cementitious mixtures, ASTM International, West Conshohocken, PA.
B'Hymer, C., and J.A. Caruso. 2006. Selenium speciation analysis using inductively
coupled plasma-mass spectrometry. Journal of Chromatography A, 1114 (1):1-20.

139
Badur, S., and R. Chaudhary. 2008. Utilization of hazardous wastes and by-products as a
green concrete material through S/S process: A review. Reviews on Advanced
Materials Science, 17 (1-2):42-61.
Bankowski, P., L. Zou, and R. Hodges. 2004. Reduction of metal leaching in brown coal
fly ash using geopolymers. Journal of Hazardous materials, 114 (1-3):59-67.
Barnhart, J. 1997. Occurrences, uses, and properties of chromium. Regulatory
Toxicology and Pharmacology, 26 (1):S3-S7.
Baur, I., P. Keller, D. Mavrocordatos, B. Wehrli, and C.A. Johnson. 2004. Dissolution-
precipitation behaviour of ettringite, monosulfate, and calcium silicate hydrate.
Cement and Concrete Research, 34 (2):341-348.
Beckman Coulter. 2011. LS 13 320 Laser diffraction particle size analyzer instructions
for use, Beckman Coulter, Inc, Brea, CA.
Bin-Shafique, M.S. 2002. Leaching of heavy metals from fly ash stabilized soils. PhD
Dissertation, University of Wisconsin-Madison, Madison, Wisconsin.
Bond, M.M. 2000. Characterization and control of selenium releases from mining in the
Idaho phosphate region. M.S Thesis, Environmental Science, Moscow, Idaho.
Bone, B.D., L.H. Barnard, D.I. Boardman, P.J. Carey, C.D. Hills, H.M. Jones, C.L.
Macleod, and M. Tyrer. 2004. Review of scientific literature on the use of
stabilisation/solidification for the treatment of contaminated soil, solid waste and
sludges, Environment Agency, Bristol, United Kingdom.
Bremner, T. 2001. Environmental aspects of concrete: problems and solutions. 1st All-
Russian Conference on Concrete and Reinforced Concrete, Moscow, Russia, 232-
246
Cappuyns, V., and R. Swennen. 2008. The application of pHstat leaching tests to assess
the pH-dependent release of trace metals from soils, sediments and waste
materials. Journal of Hazardous materials, 158 (1):185-195.
CEN. 2006. TS 14997 - Characterization of waste. Leaching behaviour tests. Influence of
pH on leaching with continuous pH-control European committee for
standardization (CEN), Brussels, Belgium.
Chancey, R.T. 2008. Characterization of crystalline and amorphous phases and respective
reactivities in a class F fly ash. PhD dissertation, University of Texas at Austin,
Austin, Texas.
Charlton, S.R., C.L. Macklin, and D.L. Parkhurst. 1997. PHREEQCI—a graphical user
interface for the geochemical computer program PHREEQC. Water Resources
Investigation Report: 97-4222.

140
Chrysochoou, M., and D. Dermatas. 2006. Evaluation of ettringite and hydrocalumite
formation for heavy metal immobilization: Literature review and experimental
study. Journal of Hazardous materials, 136 (1):20-33.
Cioffi, R., L. Maffucci, and L. Santoro. 2003. Optimization of geopolymer synthesis by
calcination and polycondensation of a kaolinitic residue. Resources, conservation
and recycling, 40 (1):27-38.
Cornelis, G., C.A. Johnson, T.V. Gerven, and C. Vandecasteele. 2008. Leaching
mechanisms of oxyanionic metalloid and metal species in alkaline solid wastes: A
review. Applied Geochemistry, 23 (5):955-976.
Damtoft, J.S., J. Lukasik, D. Herfort, D. Sorrentino, and E.M. Gartner. 2008. Sustainable
development and climate change initiatives. Cement and Concrete Research, 38
(2):115-127.
Das, G.P. 2008. Ash weathering controls on contaminant leachability. PhD dissertation,
Infrastructure and Environmental Systems, The University of North Carolina at
Charlotte, Charlotte, North Carolina.
Davidovits, J. 1991. Geopolymers : Inorganic polymeric new materials. Journal of
thermal analysis, 37:1633-1656.
Dermatas, D., D.H. Moon, N. Menounou, X. Meng, and R. Hires. 2004. An evaluation of
arsenic release from monolithic solids using a modified semi-dynamic leaching
test. Journal of Hazardous materials, 116 (1):25-38.
Dhir, R.K., T.D. Dyer, and L.J. Csetenyi. 2008. NORA: Non-radioactive waste
solidification methods and stability assessment, Concrete Technology Unit,
Department of Civil Engineering, University of Dundee, Dundee, Scotland.
Diaz, E., E. Allouche, and S. Eklund. 2010. Factors affecting the suitability of fly ash as
source material for geopolymers. Fuel, 89 (5):992-996.
Dogan, O., and M. Kobya. 2006. Elemental analysis of trace elements in fly ash sample
of Yatağan thermal power plants using EDXRF. Journal of Quantitative
Spectroscopy and Radiative Transfer, 101 (1):146-150.
Duxson, P., A. Fernâandez-Jimâenez, J. Provis, G. Lukey, A. Palomo, and J. Deventer.
2007. Geopolymer technology: the current state of the art. Journal of Materials
Science, 42 (9):2917-2933.
EA. 2005a. EA NEN 7371 - The determination of the availability of inorganic
components for leaching - "the maximum availability leaching test",
Environment Agency, United Kingdom.
EA. 2005b. EA NEN 7375 - Determination of leaching of inorganic components with the
diffusion test -The tank test, Environment Agency, United Kingdom.

141
Fällman, A.-M. 1997. Performance and design of the availability test for measurement of
potentially leachable amounts from waste materials. Environmental Science and
Technology, 31 (3):735-744.
Fernández-Jiménez, A., I. García-Lodeiro, and A. Palomo. 2007. Durability of alkali-
activated fly ash cementitious materials. Journal of Materials Science, 42
(9):3055-3065.
Fernández-Jiménez, A., and A. Palomo. 2005. Composition and microstructure of alkali
activated fly ash binder: Effect of the activator. Cement and Concrete Research,
35 (10):1984-1992.
Fernández-Jiménez, A., and A. Palomo. 2009. Nanostructure/microstructure of fly ash
geopolymers. In Geopolymers: structure, processing, properties and industrial
applications, edited by J. L. Provis and J. S. J. van Deventer. Cambridge, United
Kingdom: Woodhead Publishing limited.
Finkelman, R.B., and M.E. Mrose. 1977. Downeyite, the first verified natural occurrence
of SeO. American Mineralogist, 62:316-320.
Gartner, E. 2004. Industrially interesting approaches to "low-CO2" cements. Cement and
Concrete Research, 34 (9):1489-1498.
Giannopoulou, I.P., and D. Panias. 2007. Structure, design and applications of
geopolymeric materials. 3rd International Conference on Deformation Processing
and Structure of Materials, Belgrade, Serbia,
Goldberg, S., D.A. Martens, H.S. Forster, and M. Herbel. 2006. Speciation of selenium
(IV) and selenium (VI) using coupled ion chromatography—hydride generation
atomic absorption spectrometry. Soil Science Society of America Journal, 70
(1):41-47.
Gougar, M., B. Scheetz, and D. Roy. 1996. Ettringite and C---S---H Portland cement
phases for waste ion immobilization: A review. Waste Management, 16 (4):295-
303.
Guo, X., H. Shi, L. Chen, and W.A. Dick. 2010. Alkali-activated complex binders from
class C fly ash and Ca-containing admixtures. Journal of Hazardous materials,
173 (1-3):480-486.
Halim, C.E., S.A. Short, J.A. Scott, R. Amal, and G. Low. 2005. Modelling the leaching
of Pb, Cd, As, and Cr from cementitious waste using PHREEQC. Journal of
Hazardous materials, 125 (1-3):45-61.
Hardjito, D., and V. Rangan. 2005. Development and properties of low-calcium fly ash-
based geopolymer concrete, Research Report GC 1, Curtin University of
Technology, Perth, Australia.

142
Hardjito, D., and M. Tsen. 2008. Strength and thermal stability of fly ash based
geopolymer mortar. The 3rd Asian Concrete Federation international conference
ACF/VCA 2008, 11-13 November, 2008, Ho Chi Minh City, Vietnam,
Iwashita, A., T. Nakajima, H. Takanashi, A. Ohki, Y. Fujita, and T. Yamashita. 2007.
Determination of trace elements in coal and coal fly ash by joint-use of ICP-AES
and atomic absorption spectrometry. Talanta, 71 (1):251-257.
Izquierdo, M., and X. Querol. 2011. Leaching behaviour of elements from coal
combustion fly ash: An overview. International Journal of Coal Geology.
Izquierdo, M., X. Querol, J. Davidovits, D. Antenucci, H. Nugteren, and C. Fernández-
Pereira. 2009. Coal fly ash-slag-based geopolymers: Microstructure and metal
leaching. Journal of Hazardous materials, 166 (1):561-566.
Izquierdo, M., X. Querol, C. Phillipart, D. Antenucci, and M. Towler. 2010. The role of
open and closed curing conditions on the leaching properties of fly ash-slag-based
geopolymers. Journal of Hazardous materials, 176 (1-3):623-628.
Jackson, B.P. 1998. Trace element solubility from land application of fly ash/organic
waste mixtures with emphasis on arsenic and selenium speciation. PhD
dissertation, University of Georgia, Athens, Georgia.
Jankowski, J., C.R. Ward, D. French, and S. Groves. 2006. Mobility of trace elements
from selected Australian fly ashes and its potential impact on aquatic ecosystems.
Fuel, 85 (2):243-256.
Jegadeesan, G., S.R. Al-Abed, and P. Pinto. 2008. Influence of trace metal distribution on
its leachability from coal fly ash. Fuel, 87 (10):1887-1893.
Juenger, M.C.G., F. Winnefeld, J.L. Provis, and J.H. Ideker. 2010. Advances in
alternative cementitious binders. Cement and Concrete Research, - Article in
press.
Khale, D., and R. Chaudhary. 2007. Mechanism of geopolymerization and factors
influencing its development: a review. Journal of Materials Science, 42 (3):729-
746.
Kinniburgh, D., and D. Cooper. 2011. PhreePlot Guide : creating graphical output with
PHREEQC. http://www.phreeplot.org/ (accessed 4th November 2011).
Klemm, W.A. 1998. Ettringite and oxyanion-substituted ettringites-- their
characterization and applications in the fixation of heavy metals: A synthesis of
the literature, Portland Cement Association (PCA), Stokie, Illinois.
Komnitsas, K., and D. Zaharaki. 2007. Geopolymerisation: A review and prospects for
the minerals industry. Minerals Engineering, 20 (14):1261-1277.

143
Kong, D.L.Y., and J.G. Sanjayan. 2010. Effect of elevated temperatures on geopolymer
paste, mortar and concrete. Cement and Concrete Research, 40 (2):334-339.
Kosson, D.S., H.A. van der Sloot, F. Sanchez, and A.C. Garrabrants. 2002. An integrated
framework for evaluating leaching in waste management and utilization of
secondary materials. Environmental Engineering Science, 19 (3):159-204.
Lloyd, N.A., and B.V. Rangan. 2010. Geopolymer concrete with fly ash. 2nd
International Conference on Sustainable Construction Materials and
Technologies, Ancona, Italy,
Magalhães, M.C.F. 2002. Arsenic. An environmental problem limited by solubility. Pure
and Applied Chemistry, 74 (10):1843-1850.
Mehta, P.K., and P.J.M. Monteiro. 2006. Concrete : microstructure, properties, and
materials. New York: McGraw-Hill.
Min, J.H. 1997. Removal of arsenic, selenium and chromium from wastewater using
Fe(III) doped alginate gel sorbent. PhD dissertation, Civil Engineering, University
of California, Los Angeles, California.
Miyano, T., and C. Klein. 1983. Conditions of riebeckite formation in the iron-formation
of the Dales Gorge Member, Hamersley Group, Western Australia. American
Mineralogist, 68 (5-6):517.
Moon, D.H., D. Dermatas, and N. Menounou. 2004. Arsenic immobilization by calcium-
arsenic precipitates in lime treated soils. Science of the Total Environment, 330
(1-3):171-185.
NAS. 1977. Arsenic - medical and biological effects of environmental pollutants.
Washington, DC: The National Research Council, National Academy of Sciences.
Nazari, A., A. Bagheri, and S. Riahi. 2011. Properties of geopolmer with seeded fly ash
and rice husk bark ash. Materials Science and Engineering A, - Article In press.
Nordtest. 1995. NT ENVIR 003 - Solid waste, granular inorganic material : Availability
test, Nordtest, Espoo, Finland.
OEWRI. 2008. Standard operating procedure for: LS 13 320 laser diffraction particle size
analyzer operation, Missouri State University and Ozarks Environmental and
Water Resources Institute (OEWRI), Springfield, MO.
Ogunro, V., and O. Sanusi. 2010. Short-term mobility of elements from fly ash based
geopolymer paste. 11th International symposium on environmental geotechnology
and sustainable development (ISEG 2010), Beijing, China,
144
Pacheco-Torgal, F., J. Castro-Gomes, and S. Jalali. 2008a. Alkali-activated binders: A
review. Part 2. About materials and binders manufacture. Construction & building
materials., 22 (7):1315-1322.
Pacheco-Torgal, F., J. Castro-Gomes, and S. Jalali. 2008b. Alkali-activated binders: A
review:Part 1. Historical background, terminology, reaction mechanisms and
hydration products. Construction and Building Materials, 22 (7):1305-1314.
Panagiotopoulou, C., E. Kontori, T. Perraki, and G. Kakali. 2007. Dissolution of
aluminosilicate minerals and by-products in alkaline media. Journal of Materials
Science, 42 (9):2967-2973.
Paoletti, F. 2002. Behavior of oxyanions forming heavy metals in municipal solid waste
incineration. PhD dissertation, Institute for Technical Chemistry (Institut für
Technische Chemie), Karlsruhe Institute of Technology (KIT) formerly
Forschungszentrum Karlsruhe, Karlsruhe, Germany.
Pariatamby, A., C. Subramaniam, S. Mizutani, and H. Takatsuki. 2006. Solidification and
stabilization of fly ash from mixed hazardous waste incinerator using ordinary
Portland cement. Environmental Sciences, 13:8-13.
Parkhurst, D.L., and C.A.J. Appelo. 1999. User's guide to PHREEQC (Version 2): A
computer program for speciation, batch-reaction, one-dimensional transport, and
inverse geochemical calculations. Denver, Colorado: United States Geological
Survey.
PCA. Concrete technology - what causes efflorescence and how can it be avoided?
Portland Cement Asssociation (PCA) 2012. Available from
http://www.cement.org/tech/faq_efflorescence.asp.
Perera, D.S., O. Uchida, E.R. Vance, and K.S. Finnie. 2007. Influence of curing schedule
on the integrity of geopolymers. Journal of Materials Science, 42 (9):3099-3106.
Provis, J.L., P. Duxson, R.M. Harrex, C.-Z. Yong, and J.S.J. van Deventer. 2009.
Valorisation of fly ashes by geopolymerisation. Global NEST Journal, 11 (2):147-
154.
Provis, J.L., and J. van Deventer. 2009. Introduction to geopolymers. In Geopolymers:
Structure, Processing, Properties and Industrial Applications, edited by J. L.
Provis and J. S. J. van Deventer. Cambridge, United Kingdom: Woodhead Publ.
Limited.
Quiroga, P.N., and D.W. Fowler. 2004. The effects of aggregates characteristics on the
performance of Portland cement concrete. Austin, TX: International Center for
Aggregates Research, University of Texas at Austin.

145
Rangan, B.V. 2008. Low calcium fly ash based geopolymer concrete. In Concrete
Construction Engineering Handbook, edited by E. G. Nawy. Boca Raton, Florida:
Taylor & Francis Ltd.
Rangan, B.V. 2009. Engineering properties of geopolymer concrete. In Geopolymers:
structure, processing , properties and industrial applications, edited by J. L. Provis
and J. S. J. Van Deventer. Cambridge, United Kingdom.
Rattanasak, U., and P. Chindaprasirt. 2009. Influence of NaOH solution on the synthesis
of fly ash geopolymer. Minerals Engineering, 22 (12):1073-1078.
Roy, D.M. 1999. Alkali-activated cements opportunities and challenges. Cement and
Concrete Research, 29 (2):249-254.
Saikia, N., S. Kato, and T. Kojima. 2006. Behavior of B, Cr, Se, As, Pb, Cd, and Mo
present in waste leachates generated from combustion residues during the
formation of ettringite. Environmental Toxicology and Chemistry, 25 (7):1710-
1719.
Sakulich, A.R. 2009. Characterization of environmentally-friendly alkali activated slag
cements and ancient building materials. PhD dissertation, Drexel University,
Philadelphia, PA.
Sanusi, O., and V. Ogunro. 2009. Assessment of oxyanions trace elements leaching from
fly ash-based geopolymer. 10th International Symposium on Environmental
Geotechnology and Sustainable Development, Bochum, Germany,
Sanusi, O., and V. Ogunro. 2011a. Influence of calcium on strength and mobility of
elements from monolithic fly ash based geopolymer paste - submitted manuscript,
University of North Carolina at Charlotte.
Sanusi, O., and V. Ogunro. 2011b. Predicting the leaching of oxyanion forming trace
elements from fly ash based geopolymer paste using the availability test -
unpublished manuscript, University of North Carolina at Charlotte.
Sanusi, O., B. Tempest, and V.O. Ogunro. 2011. Mitigating leachability from fly ash
based geopolymer concrete using recycled concrete aggregate (RCA).
Geotechnical special publication of American Society of Civil Engineers, 2
(211):1315-1324.
Schiopu, N., L. Tiruta-Barna, E. Jayr, J. Méhu, and P. Moszkowicz. 2009. Modelling and
simulation of concrete leaching under outdoor exposure conditions. Science of the
Total Environment, 407 (5):1613-1630.
Schuwirth, N., and T. Hofmann. 2006. Comparability of and alternatives to leaching tests
for the assessment of the emission of inorganic soil contamination Journal of Soils
and Sediments, 6 (2):102-112.

146
Schwantes, J.M., and B. Batchelor. 2006. Simulated infinite-dilution leach test.
Environmental Engineering Science, 23 (1):4-13.
Sear, L.K.A. 2001. Properties and use of coal fly ash : a valuable industrial by-product.
London: Thomas Telford.
Shtiza, A., R. Swennen, V. Cappuyns, and A. Tashko. 2009. ANC, BNC and
mobilization of Cr from polluted sediments in function of pH changes.
Environmental Geology, 56 (8):1663-1678.
Škvára, F. 2007. Alkali activated materials or geopolymers? Ceramics- Silikáty, 51
(3):173-177.
Soco, E., and J. Kalembkiewicz. 2009. Investigations on Cr mobility from coal fly ash.
Fuel, 88 (8):1513-1519.
Somna, K., C. Jaturapitakkul, P. Kajitvichyanukul, and P. Chindaprasirt. 2011. NaOH-
activated ground fly ash geopolymer cured at ambient temperature. Fuel, 90
(6):2118-2124.
Struble, L., and J. Godfrey. 2004. How sustainable is concrete? Proceedings of the
International Workshop on Sustainable Development and Concrete Technology
Beijing, China,
Subaer. 2004. Influence of aggregate on the microstructure of geopolymer. PhD
Dissertation, Deparment of Applied Physics, Curtin University of Technology,
Perth, Western Australia.
Sun, P. 2005. Fly ash based inorganic polymeric building material. PhD Dissertation,
Civil Engineering, Wayne State University, Detroit, Michigan.
Suzuki, M., and D. Rohde. 2008. Resolving overlapping peak problems with NORAN
system 7 spectral imaging software, Thermo Fisher scientific, Madison, WI.
Tempest, B. 2010. Engineering characterization of waste derived geopolymer cement
concrete for structural applications. Ph.D Dissertation, Infrastructure and
Environmental Systems, The University of North Carolina at Charlotte, Charlotte,
North Carolina.
Temuujin, J., A. van Riessen, and R. Williams. 2009. Influence of calcium compounds on
the mechanical properties of fly ash geopolymer pastes. Journal of Hazardous
materials, 167 (1-3):82-88.
USEPA. 1986. Method 1320 - Multiple extraction procedure (MEP), United States
Environmental Protection Agency.
USEPA. 1994. Method 1312 - Synthetic precipitation leaching procedure (SPLP), United
States Environmental Protection Agency.
147
USEPA. 2009a. National primary drinking water regulations, United States
Environmental Protection Agency.
USEPA. 2009b. Preliminary method 1313 - Liquid - solid partitioning as a function of
extract pH for constituents in solid materials using a parallel batch extraction,
United States Environmental Protection Agency.
USEPA. 2009c. Preliminary method 1315 - Mass transfer in monolithic or compacted
granular materials using a semi-dynamic leaching procedure, United States
Environmental Protection Agency.
USEPA. 2012. Regional screening table -user's guide 2012 [cited 30th October 2012].
Available from http://www.epa.gov/reg3hwmd/risk/human/rb-
concentration_table/usersguide.htm.
USGS. 2012. Change in nitric acid preservative for trace element samples. United States
Geological Survey (USGS) 1998 [cited 19th July 2012]. Available from
http://water.usgs.gov/admin/memo/QW/qw98.06.html.
Van der Sloot, H., and D. Kosson. 2003. A unified approach for the judgement of
environmental properties of construction materials (cement-based, asphaltic,
unbound aggregates, soil) in different stages of their life cycle. WASCON 2003
conference, San Sebastian, Spain,
Van Jaarsveld, J., and J. Van Deventer. 1999. The effect of metal contaminants on the
formation and properties of waste-based geopolymers. Cement and Concrete
Research, 29 (8):1189-1200.
van Oss, H., and A.C. Padovani. 2002. Cement manufacture and the environment, part I:
chemistry and technology. Journal of Industrial Ecology, 6 (1):89-105.
van Oss, H.G., and A.C. Padovani. 2003. Cement manufacture and the environment, part
II: environmental challenges and opportunities. Journal of Industrial Ecology, 7
(1):93-126.
Wang, T. 2007. The leaching behavior of arsenic, selenium and other trace elements in
coal fly ash. PhD dissertation, Civil Engineering, University of Missouri-Rolla,
Rolla, Missouri.
Wang, T., T. Su, J. Wang, and K. Ladwig. 2007. Calcium effect on asernic (v) adsorption
onto coal fly ash. World of Coal Ash conference (WOCA 2007), Lexington,
Kentucky,
Xu, H., and J.S.J. Van Deventer. 2000. The geopolymerisation of alumino-silicate
minerals. International Journal of Mineral Processing, 59 (3):247-266.

148
Xu, J., Y. Zhou, Q. Chang, and H. Qu. 2006. Study on the factors of affecting the
immobilization of heavy metals in fly ash-based geopolymers. Materials Letters,
60 (6):820-822.
Yao, X., Z. Zhang, H. Zhu, and Y. Chen. 2009. Geopolymerization process of alkali-
metakaolinite characterized by isothermal calorimetry. Thermochimica Acta, 493
(1-2):49-54.
Yip, C., G. Lukey, and J. Van Deventer. 2005. The coexistence of geopolymeric gel and
calcium silicate hydrate at the early stage of alkaline activation. Cement and
Concrete Research, 35 (9):1688-1697.
Yip, C., and J. van Deventer. 2003. Microanalysis of calcium silicate hydrate gel formed
within a geopolymeric binder. Journal of Materials Science, 38 (18):3851-3860.
Zhang, J., J.L. Provis, D. Feng, and J.S. van Deventer. 2008. Geopolymers for
immobilization of Cr(6+), Cd(2+), and Pb(2+). Journal of Hazardous materials,
157 (2-3):2-3.
Zhang, M. 2000. Incorporation of oxyanionic boron, chromium, molybdenum, and
selenium into hydrocalumite and ettringite: Application to cementitious systems.
PhD dissertation, Earth Science, Waterloo, Ontario, CanadaUniversity of
Waterloo.
Zhang, M., and E.J. Reardon. 2003. Removal of B, Cr, Mo, and Se from wastewater by
incorporation into hydrocalumite and ettringite. Environmental science &
technology, 37 (13):2947-2952.
Zhang, M., and E.J. Reardon. 2005. Chromate and selenate hydrocalumite solid solutions
and their applications in waste treatment. Science in China Series C: Life
Sciences, 48:165-173.
Zhang, Y., W. Sun, and Z. Li. 2009. Preparation and microstructure characterization of
poly-sialate-disiloxo type of geopolymeric cement. Journal of Central South
University of Technology, 16 (6):906-913.
Zheng, L., C. Wang, W. Wang, Y. Shi, and X. Gao. 2011. Immobilization of MSWI fly
ash through geopolymerization: Effects of water-wash. Waste Management, 31
(2):311-317.
Zhu, C. 2009. Geochemical modeling of reaction paths and geochemical reaction
networks. Reviews in Mineralogy and Geochemistry, 70 (1):533.
Zhu, C., and G.M. Anderson. 2002. Environmental applications of geochemical
modeling. Cambridge, United Kingdom: Cambridge University Press.

149
Zhu, Y.N., X.H. Zhang, Q.L. Xie, D.Q. Wang, and G.W. Cheng. 2006. Solubility and
stability of calcium arsenates at 25 C. Water, Air, & Soil Pollution, 169 (1):221-
238.

150
APPENDIX A: MIX DESIGN FOR THE GEOPOLYMER CONCRETE
TABLE A-1: Mix design for the geopolymer concrete (kg/m3)
Mix HL( %) HL (kg) CFA(kg) FA (kg) CA (kg) SF (kg) NaOH (kg) H2O (kg) w/c
GPC 0.000 0.000 483.437 773.371 774.012 36.202 48.376 206.959 0.364
GP1 0.530 2.563 483.437 773.371 774.012 36.202 48.376 206.959 0.363
GP2 0.994 4.806 483.437 773.371 774.012 36.202 48.376 206.959 0.361
GP3 1.988 9.611 483.437 773.371 774.012 36.202 48.376 206.959 0.358
TABLE A-2: Percentage of each component in the geopolymer concrete (%)
Aggregates* CFA SF HL NaOH H2O Total
67 20.8 1.6 0.0 2.1 8.9 100.0
67 20.8 1.6 0.1 2.1 8.9 100.0
66 20.8 1.6 0.2 2.1 8.9 100.0
66 20.7 1.6 0.4 2.1 8.9 100.0
*Aggregates = FA + CA
TABLE A-3: Explanation of notations used in mix design
HL Hydrated lime
CFA Coal fly ash
FA Fine agregate
CA Coarse aggregate
SF Silica fume
NaOH Sodium hydroxide
H2O water

151
APPENDIX B: COMPRESSIVE STRENGTH MEASUREMENTS FOR THE
GEOPOLYMER CONCRETE MIXES
TABLE B-1: Compressive strength of the geopolymer concrete (psi)
7d_wo* 28d_wo 7d_w** 28d_w
GPC 951.9 3155.772 7542.79 7811.404
GPC 974.11 3121.392 7472.34 8330.362
GPC 973.26 1664.686 5344.46 8209.819
GP1 1008.065 1898.557 5286.786 5894.171
GP1 1050.792 2065.507 5563.667 5768.251
GP1 1075.41 1950.764 5440.719 6377.9
GP2 1194.963 1968.874 6530.702 7520.939
GP2 1177.985 2246.604 6264.431 7231.749
GP2 1211.658 2146.576 6363.894 7209.536
GP3 1378.183 1867.148 6579.938 7066.638
GP3 1437.323 1942.841 5539.191 6934.776
GP3 1182.654 2000.849 6218.308 4607.668
TABLE B-2: Compressive strength of geopolymer
concrete (MPa)
7d_wo* 28d_wo 7d_w** 28d_w
GPC 6.56 21.76 52.01 53.86
GPC 6.72 21.52 51.51 57.43
GPC 6.71 11.48 36.85 56.61
GP1 6.95 13.09 36.45 40.64
GP1 7.25 14.25 38.36 39.77
GP1 7.41 13.45 37.51 43.97
GP2 8.24 13.58 45.03 51.86
GP2 8.12 15.49 43.19 49.86
GP2 8.36 14.8 43.88 49.7
GP3 9.5 12.87 45.37 48.72
GP3 9.91 13.4 38.19 47.82
GP3 8.16 13.8 42.87 31.77
*Geopolymer concrete cured without heat
**Geopolymer concrete cured at 75oC

152
APPENDIX C: STATISTICAL ANALYSIS OF THE GEOPOLYMER CONCRETE
COMPRESSIVE STRENGTH
APPENDIX C1: 7 DAYS COMPRRESIVE STRENGTH FOR GEOPOLYMER
CONCRETE CURED WITHOUT HEAT
Strength_7d_wo

153

154
APPENDIX C2: 28 DAYS COMPRRESIVE STRENGTH FOR GEOPOLYMER
CONCRETE CURED WITHOUT HEAT
Strength_28d_wo

155

156
APPENDIX C3: 7 DAYS COMPRRESIVE STRENGTH FOR GEOPOLYMER
CONCRETE CURED WITH HEAT
Strength_7d_w

157

158
APPENDIX C4: 28 DAYS COMPRRESIVE STRENGTH FOR GEOPOLYMER
CONCRETE CURED WITH HEAT
Strength_28d_w
.

159

160
APPENDIX D: PH DEPENDENCE LEACHING TEST RESULTS FOR OTHER
ELEMENTS
FIGURE D-1: pH dependence mobility of elements from CFA and SF

161
FIGURE D-2: pH dependence mobility of elements from CFA and SF

162
FIGURE D-3: pH dependence mobility of Mo and V from the CFA and SF
FIGURE D-4: pH dependence mobility of Mo and V from the geopolymer concretes

163
FIGURE D-5: pH dependence mobility of elements from the geopolymer concretes

164
FIGURE D-6: pH dependence mobility of elements from the geopolymer concretes

165
APPENDIX E: ENLARGED CUMULATIVE PLOT OF THE ELEMENTS
FIGURE E-1: Plot showing enlarged cumulative release of As
FIGURE E-2: Plot showing enlarged cumulative release of Se

166
FIGURE E-3: Plot showing enlarged cumulative release of Cr

167
APPENDIX F: INPUT FILE FOR PHREEQC/PHREEPLOT
Input file – GPC composition used in this file
SPECIATION
jobTitle "Speciation of oxyanion forming elements (As, Cr, amd Se) vs pH"
database llnl.dat # this is a larger database (750kB) contains over 1155 minerals
calculationType species # plot %C species vs pH
calculationMethod 1 # Full set of speciation calculation done
mainSpecies As Cr Se # produce species plot for these elements
xmin 1 # controls the range of pH plotted - min pH
xmax 13 # max pH
resolution 120 # (13-1)/120 = 0.1 pH division
debug 2 #create the phreeqcall.out that conatisn the accumulated phreeqc.out
PLOT
plotTitle "Speciation of oxyanion forming elements"
xtitle pH
ytitle " % species"
multipageFile True # put all the plots into a single file
CHEMISTRY
# first simulation - initial solution calculation only calculated once
# speciation modeling section -osanusi
include 'speciesvspht.inc' # calculates % species and plot it against the pH
-reset true # Output initial solution calculation
-equilibrium_phases true # output the equilibrium phases
-species TRUE #output the species
SELECTED_OUTPUT
reset false
high_precision true
PHASES # temporarily add this to the database
Fix_H+
H+ = H+
log_K 0.0
CaSeO3:2H2O
CaSeO3:2H2O = + 1.0000 Ca++ + 1.0000 SeO3-- + 2.0000 H2O
log_k -4.6213
-delta_H -14.1963 kJ/mol # Calculated enthalpy of reaction
CaSeO3:2H2O # Enthalpy of formation: -384.741 kcal/mol
-analytic -4.1771e+001 -2.0735e-002 9.7870e+002 1.6180e+001 1.6634e+00
# -Range: 0-200
CaSeO3:H2O # Cornelis et al. 2008
CaSeO3:H2O = + 1.0000 Ca++ + 1.0000 SeO3-- + 1.0000 H2O
log_k -6.84
CaSeO4
CaSeO4 = + 1.0000 Ca++ + 1.0000 SeO4--
log_k -3.0900
-delta_H 0 # Not possible to calculate enthalpy of reaction
CaSeO4 # Enthalpy of formation: 0 kcal/mol
Ca3(AsO4)2:3H2O #Cornelis et al 2008
Ca3(AsO4)2:3H2O = + 3.0000 Ca+2 + 2.000 AsO4-3 + 3.0000 H2O
log_k -21.14
CaHAsO4 #Weilite source: Alexandratos et al. 2007
CaHAsO4 = +1.0000Ca++ +1.0000HAsO4--
log_k -2.66
CaHAsO4:H2O #Haidingerite source: Alexandratos et al. 2007
CaHAsO4:H2O = +1.0000Ca++ +1.0000HAsO4-- +1.0000H2O
168
log_k -4.79
CaCrO4 # from sit.dat
CaCrO4 = +1.000Ca+2 +1.000CrO4-2
log_k -3.15 #03DEA
delta_h -22.814 kJ/mol #
# Enthalpy of formation: -1399.186 kJ/mol
Ca3(AsO4)2:10H2O #Phaunouvite source:Cornelis etal. 2008
Ca3(AsO4)2:10H2O = +3.0000Ca++ +2.0000AsO4--- +10.0000H2O
log_k -21.21
Ca5(AsO4)3(OH)
Ca5(AsO4)3(OH) = +5.0000Ca++ +3.0000AsO4--- +1.0000OH-
log_k -40.12
Cr-ettringite # from sit.dat
Ca6(Al(OH)6)2(CrO4)3:26H2O = +6.000Ca+2 +2.000Al+3 -12.000H+ +3.000CrO4-2
+38.000H2O
log_k 60.28 #00PER/PAL
delta_h -509.59 kJ/mol #00PER/PAL
# Enthalpy of formation: -17323.75 kJ/mol
Se-ettringite # Chrysochoou and Dermatas 2006
Ca6(Al(OH)6)2(SeO4)3:31.5H2O = +6.000Ca+2 +2.000Al+3 +3.000SeO4-2 -12.000H+ +43.500H2O
log_k 61.29
Se-monosulfoaluminate # Cornelis et al 2008
Ca4(Al(OH)6)2SeO4:9H2O = +4.000Ca+2 +2.000Al+3 -12.000H+ +1.000SeO4-2 +21.000H2O
log_k 73.40
Monosulfoaluminate # Cornelis et al. 2008
Ca4Al2(SO4)(OH)12:13H2O = +4.000Ca+2 +2.000Al+3 -12.000H+ +1.000SO4-2
+25.000H2O
log_k 72.57 #07BLA/BOU
delta_h -522.63 kJ/mol #
# Enthalpy of formation: -8780.45 kJ/mol 82WAG/EVA
Cr-monosulfoaluminate #Cornelis et al. 2008
Ca4Al2(OH)12(CrO4):9H2O = +4.000Ca+2 +2.000Al+3 -12.000H+ +1.000CrO4-2
+21.000H2O
log_k 71.36 #01PER/PAL
delta_h -545.98 kJ/mol #01PER/PAL
# Enthalpy of formation: -9584.25 kJ/mol
#CSH1.6 # from sit.dat
#Ca1.6SiO3.6:2.58H2O = +1.600Ca+2 -3.200H+ +1.000H4(SiO4) +2.180H2O
# log_k -28 #07BLA/BOU
# delta_h -133.314 kJ/mol #
# Enthalpy of formation: -2819.79 kJ/mol 07BLA/BOU
#CSH1.2 # sit.dat
#Ca1.2SiO3.2:2.06H2O = +1.200Ca+2 -2.400H+ +1.000H4(SiO4) +1.260H2O
# log_k -19.3 #07BLA/BOU
# delta_h -88.6 kJ/mol #
# Enthalpy of formation: -2384.34 kJ/mol 07BLA/BOU
#CSH0.8 #sit.dat
#Ca0.8SiO2.8:1.54H2O = +0.800Ca+2 -1.600H+ +1.000H4(SiO4) +0.340H2O
# log_k -11.05 #07BLA/BOU
# delta_h -47.646 kJ/mol #
# Enthalpy of formation: -1945.13 kJ/mol 07BLA/BOU
CaSeO4:2H2O # from sit.dat
CaSeO4:2H2O = +1.000Ca+2 +1.000SeO4-2 +2.000H2O
log_k -2.68 #05OLI/NOL
delta_h -9.16 kJ/mol #
# Enthalpy of formation: -1709 kJ/mol 05OLI/NOL

169
# The concentration measured from the WLT was used as solution composition
SOLUTION 1 # Composition of the aqueous solution obtained from the tests
temp 25 # Temperature in C
pH 11.23 # Material ph or pH at zero acid and base addition
units mg/L
density 0.997 #kg/l
Na 564.50
Si 160.00
V 1.685
Al 0.4485
As 1.0231
B 1.78
Ca 0.644
Fe 0.329 # total Fe
Mg 0.164
Mo 0.265
Se 0.405
Cr 0.025
Cl 1.20 Charge
F 0.395
N(5) 0.195
P 31.50
S(6) 155.00
# no reaction so no need to SAVE solution 1
END
# second (final) simulation - the final simulation is iterated many times as required by
the speciation procedure
# batch reaction modeling - osanusi
USE solution 1
EQUILIBRIUM_PHASES 1
Fix_H+ -<x_axis> NaOH
-force_equality true
Halite -12 10 # maintains Na in the system for functioning of fix_H+ when
it goes -ve
# Include possible As, Cr and Se solubility controlling minerals
Cr-ettringite 0.5 0
Se-ettringite 0.5 0
Cr-monosulfoaluminate 0.5 0
Se-monosulfoaluminate 0.5 0
CaHAsO4 0.5 0
Ettringite 0.0 0
Monosulfoaluminate 0.0 0
CaHAsO4:H2O 0.5 0
Ca3(AsO4)2:10H2O 0.5 0
Ca5(AsO4)3(OH) 0.5 0
CaSeO4 0.5 0
CaSeO4:2H2O 0.5 0
Ca3(AsO4)2:10H2O 0.5 0
CaSeO3:2H2O 0.5 0
CaCrO4 0.5 0
END

170
APPENDIX G: OUTPUT FILE FOR PHREEQC/PHREEPLOT
Output file – obtained from simulation performed using GPC composition
------------------------------------
Reading input data for simulation 1.
------------------------------------
reset false
equilibrium_phases true
species TRUE
SELECTED_OUTPUT
reset false
high_precision true
PHASES
Fix_H+
H+ = H+
log_K 0.0
CaSeO3:2H2O
CaSeO3:2H2O = + 1.0000 Ca++ + 1.0000 SeO3-- + 2.0000 H2O
log_k -4.6213
delta_h -14.1963 kJ/mol
analytical_expression -4.1771e+001 -2.0735e-002 9.7870e+002 1.6180e+001
1.6634e+001
CaSeO3:H2O
CaSeO3:H2O = + 1.0000 Ca++ + 1.0000 SeO3-- + 1.0000 H2O
log_k -6.84
CaSeO4
CaSeO4 = + 1.0000 Ca++ + 1.0000 SeO4--
log_k -3.0900
delta_h 0
Ca3(AsO4)2:3H2O
Ca3(AsO4)2:3H2O = + 3.0000 Ca+2 + 2.000 AsO4-3 + 3.0000 H2O
log_k -21.14
CaHAsO4
CaHAsO4 = +1.0000Ca++ +1.0000HAsO4--
log_k -2.66
CaHAsO4:H2O
CaHAsO4:H2O = +1.0000Ca++ +1.0000HAsO4-- +1.0000H2O
log_k -4.79
CaCrO4
CaCrO4 = +1.000Ca+2 +1.000CrO4-2
log_k -3.15
delta_h -22.814 kJ/mol
Ca3(AsO4)2:10H2O
Ca3(AsO4)2:10H2O = +3.0000Ca++ +2.0000AsO4--- +10.0000H2O
log_k -21.21
Ca5(AsO4)3(OH)
Ca5(AsO4)3(OH) = +5.0000Ca++ +3.0000AsO4--- +1.0000OH-
log_k -40.12
Cr-ettringite
Ca6(Al(OH)6)2(CrO4)3:26H2O = +6.000Ca+2 +2.000Al+3 -12.000H+
+3.000CrO4-2 +38.000H2O
log_k 60.28
delta_h -509.59 kJ/mol
Se-ettringite
Ca6(Al(OH)6)2(SeO4)3:31.5H2O = +6.000Ca+2 +2.000Al+3 +3.000SeO4-2 -12.000H+
+43.500H2O
log_k 61.29
Se-monosulfoaluminate
Ca4(Al(OH)6)2SeO4:9H2O = +4.000Ca+2 +2.000Al+3 -12.000H+ +1.000SeO4-2 +21.000H2O
log_k 73.40
Monosulfoaluminate

171
Ca4Al2(SO4)(OH)12:13H2O = +4.000Ca+2 +2.000Al+3 -12.000H+ +1.000SO4-2
+25.000H2O
log_k 72.57
delta_h -522.63 kJ/mol
Cr-monosulfoaluminate
Ca4Al2(OH)12(CrO4):9H2O = +4.000Ca+2 +2.000Al+3 -12.000H+ +1.000CrO4-2
+21.000H2O
log_k 71.36
delta_h -545.98 kJ/mol
CaSeO4:2H2O
CaSeO4:2H2O = +1.000Ca+2 +1.000SeO4-2 +2.000H2O
log_k -2.68
delta_h -9.16 kJ/mol
SOLUTION 1
temp 25
pH 11.23
units mg/L
density 0.997
Na 564.50
Si 160.00
V 1.685
Al 0.4485
As 1.0231
B 1.78
Ca 0.644
Fe 0.329
Mg 0.164
Mo 0.265
Se 0.405
Cr 0.025
Cl 1.20 Charge
F 0.395
N(5) 0.195
P 31.50
S(6) 155.00
END
-------------------------------------------
Beginning of initial solution calculations.
-------------------------------------------
Initial solution 1.
WARNING: USER_PUNCH: Headings count doesn't match number of calls to PUNCH.
-----------------------------Solution composition------------------------------
Elements Molality Moles
Al 1.669e-005 1.669e-005
As 1.371e-005 1.371e-005
B 1.653e-004 1.653e-004
Ca 1.613e-005 1.613e-005
Cl 1.437e-002 1.437e-002 Charge balance
Cr 2.164e-007 2.164e-007
F 2.087e-005 2.087e-005
Fe 5.914e-006 5.914e-006
Mg 6.774e-006 6.774e-006
Mo 2.773e-006 2.773e-006
N(5) 1.398e-005 1.398e-005
Na 2.465e-002 2.465e-002
P 1.021e-003 1.021e-003
S(6) 1.620e-003 1.620e-003
Se 5.149e-006 5.149e-006
Si 2.674e-003 2.674e-003
V 3.321e-005 3.321e-005
----------------------------Description of solution----------------------------
pH = 11.230
pe = 4.000

172
Activity of water = 0.999
Ionic strength = 2.602e-002
Mass of water (kg) = 1.000e+000
Total alkalinity (eq/kg) = 7.107e-003
Total carbon (mol/kg) = 0.000e+000
Total CO2 (mol/kg) = 0.000e+000
Temperature (deg C) = 25.000
Electrical balance (eq) = 1.261e-018
Percent error, 100*(Cat-|An|)/(Cat+|An|) = 0.00
Iterations = 50
Total H = 1.110562e+002
Total O = 5.554645e+001
----------------------------Distribution of species----------------------------
Log Log Log
Species Molality Activity Molality Activity Gamma
OH- 1.914e-003 1.635e-003 -2.718 -2.786 -0.069
H+ 6.680e-012 5.888e-012 -11.175 -11.230 -0.055
H2O 5.553e+001 9.992e-001 1.744 -0.000 0.000
Al 1.669e-005
AlO2- 1.663e-005 1.426e-005 -4.779 -4.846 -0.067
NaAlO2 5.418e-008 5.418e-008 -7.266 -7.266 0.000
HAlO2 2.451e-010 2.451e-010 -9.611 -9.611 0.000
Al(OH)2+ 1.157e-015 9.915e-016 -14.937 -15.004 -0.067
AlOH+2 4.635e-021 2.516e-021 -20.334 -20.599 -0.265
AlHPO4+ 1.631e-023 1.398e-023 -22.788 -22.855 -0.067
AlF2+ 2.293e-025 1.965e-025 -24.640 -24.707 -0.067
AlF+2 1.489e-025 8.084e-026 -24.827 -25.092 -0.265
AlF3 1.511e-026 1.511e-026 -25.821 -25.821 0.000
Al+3 4.200e-027 1.324e-027 -26.377 -26.878 -0.501
AlSO4+ 1.267e-027 1.086e-027 -26.897 -26.964 -0.067
Al(SO4)2- 7.888e-029 6.760e-029 -28.103 -28.170 -0.067
AlF4- 2.705e-029 2.318e-029 -28.568 -28.635 -0.067
Al2(OH)2+4 1.080e-038 1.030e-039 -37.967 -38.987 -1.021
AlH2PO4+2 7.599e-039 4.125e-039 -38.119 -38.385 -0.265
Al3(OH)4+5 0.000e+000 0.000e+000 -48.033 -49.596 -1.563
Al13O4(OH)24+7 0.000e+000 0.000e+000 -85.731 -88.796 -3.065
As(-3) 0.000e+000
AsH3 0.000e+000 0.000e+000 -156.444 -156.444 0.000
As(3) 0.000e+000
AsO2OH-2 0.000e+000 0.000e+000 -57.669 -57.940 -0.271
H2AsO3- 0.000e+000 0.000e+000 -58.093 -58.160 -0.067
AsO2- 0.000e+000 0.000e+000 -58.112 -58.179 -0.067
HAsO2 0.000e+000 0.000e+000 -60.117 -60.117 0.000
As(OH)3 0.000e+000 0.000e+000 -60.176 -60.176 0.000
As(5) 1.371e-005
AsO3F-2 1.371e-005 7.343e-006 -4.863 -5.134 -0.271
HAsO3F- 3.746e-011 3.210e-011 -10.426 -10.493 -0.067
HAsO4-2 3.596e-036 1.926e-036 -35.444 -35.715 -0.271
AsO4-3 3.430e-036 8.392e-037 -35.465 -36.076 -0.611
H2AsO4- 0.000e+000 0.000e+000 -40.098 -40.165 -0.067
H3AsO4 0.000e+000 0.000e+000 -49.150 -49.150 0.000
B(-5) 0.000e+000
BH4- 0.000e+000 0.000e+000 -181.463 -181.530 -0.067
B(3) 1.653e-004
BO2- 1.585e-004 1.358e-004 -3.800 -3.867 -0.067
NaB(OH)4 5.349e-006 5.349e-006 -5.272 -5.272 0.000
B(OH)3 1.490e-006 1.490e-006 -5.827 -5.827 0.000
CaB(OH)4+ 1.543e-009 1.323e-009 -8.812 -8.879 -0.067
MgB(OH)4+ 5.752e-010 4.930e-010 -9.240 -9.307 -0.067
B2O(OH)5- 9.086e-020 7.787e-020 -19.042 -19.109 -0.067
BF2(OH)2- 1.584e-021 1.357e-021 -20.800 -20.867 -0.067
BF3OH- 2.431e-031 2.084e-031 -30.614 -30.681 -0.067
BF4- 0.000e+000 0.000e+000 -42.237 -42.304 -0.067
Ca 1.613e-005
CaPO4- 1.583e-005 1.357e-005 -4.800 -4.867 -0.067
Ca+2 2.454e-007 1.383e-007 -6.610 -6.859 -0.249
CaHPO4 3.194e-008 3.194e-008 -7.496 -7.496 0.000
CaSO4 1.620e-008 1.620e-008 -7.791 -7.791 0.000

173
CaOH+ 3.867e-009 3.314e-009 -8.413 -8.480 -0.067
CaB(OH)4+ 1.543e-009 1.323e-009 -8.812 -8.879 -0.067
CaCl+ 4.170e-010 3.574e-010 -9.380 -9.447 -0.067
CaP2O7-2 5.166e-011 2.767e-011 -10.287 -10.558 -0.271
CaNO3+ 9.616e-012 8.242e-012 -11.017 -11.084 -0.067
CaCl2 5.126e-012 5.126e-012 -11.290 -11.290 0.000
CaF+ 5.008e-012 4.292e-012 -11.300 -11.367 -0.067
CaH2PO4+ 1.003e-020 8.597e-021 -19.999 -20.066 -0.067
Cl(-1) 1.437e-002
Cl- 1.433e-002 1.220e-002 -1.844 -1.914 -0.070
NaCl 4.270e-005 4.270e-005 -4.370 -4.370 0.000
MgCl+ 4.812e-010 4.124e-010 -9.318 -9.385 -0.067
CaCl+ 4.170e-010 3.574e-010 -9.380 -9.447 -0.067
CaCl2 5.126e-012 5.126e-012 -11.290 -11.290 0.000
HCl 1.613e-014 1.613e-014 -13.792 -13.792 0.000
FeCl+ 2.579e-022 2.211e-022 -21.589 -21.655 -0.067
CrO3Cl- 2.199e-024 1.884e-024 -23.658 -23.725 -0.067
FeCl2 1.447e-026 1.447e-026 -25.840 -25.840 0.000
FeCl4-2 1.161e-029 6.217e-030 -28.935 -29.206 -0.271
FeCl2+ 5.584e-031 4.786e-031 -30.253 -30.320 -0.067
FeCl+2 8.930e-032 4.848e-032 -31.049 -31.314 -0.265
FeCl4- 9.985e-038 8.558e-038 -37.001 -37.068 -0.067
CrCl+2 2.229e-038 1.210e-038 -37.652 -37.917 -0.265
CrCl2+ 3.786e-040 3.245e-040 -39.422 -39.489 -0.067
Cl(1) 3.195e-030
ClO- 3.194e-030 2.738e-030 -29.496 -29.563 -0.067
HClO 5.978e-034 5.978e-034 -33.223 -33.223 0.000
Cl(3) 0.000e+000
ClO2- 0.000e+000 0.000e+000 -50.039 -50.106 -0.067
HClO2 0.000e+000 0.000e+000 -58.166 -58.166 0.000
Cl(5) 0.000e+000
ClO3- 0.000e+000 0.000e+000 -56.729 -56.797 -0.069
Cl(7) 0.000e+000
ClO4- 0.000e+000 0.000e+000 -67.722 -67.790 -0.069
Cr(2) 0.000e+000
Cr+2 0.000e+000 0.000e+000 -48.108 -48.373 -0.265
Cr(3) 5.454e-019
Cr(OH)4- 5.386e-019 4.616e-019 -18.269 -18.336 -0.067
Cr(OH)3 6.833e-021 6.833e-021 -20.165 -20.165 0.000
Cr(OH)2+ 9.374e-024 8.034e-024 -23.028 -23.095 -0.067
CrOH+2 4.371e-029 2.373e-029 -28.359 -28.625 -0.265
Cr+3 4.437e-036 1.398e-036 -35.353 -35.854 -0.501
CrCl+2 2.229e-038 1.210e-038 -37.652 -37.917 -0.265
CrCl2+ 3.786e-040 3.245e-040 -39.422 -39.489 -0.067
Cr2(OH)2+4 0.000e+000 0.000e+000 -53.289 -54.309 -1.021
Cr3(OH)4+5 0.000e+000 0.000e+000 -69.231 -70.795 -1.563
Cr(5) 2.502e-009
CrO4-3 2.502e-009 6.123e-010 -8.602 -9.213 -0.611
Cr(6) 2.139e-007
CrO4-2 2.139e-007 1.146e-007 -6.670 -6.941 -0.271
HCrO4- 2.617e-012 2.243e-012 -11.582 -11.649 -0.067
Cr2O7-2 3.139e-022 1.681e-022 -21.503 -21.774 -0.271
CrO3Cl- 2.199e-024 1.884e-024 -23.658 -23.725 -0.067
H2CrO4 6.038e-025 6.038e-025 -24.219 -24.219 0.000
F 2.087e-005
AsO3F-2 1.371e-005 7.343e-006 -4.863 -5.134 -0.271
F- 7.151e-006 6.107e-006 -5.146 -5.214 -0.069
NaF 1.301e-008 1.301e-008 -7.886 -7.886 0.000
HAsO3F- 3.746e-011 3.210e-011 -10.426 -10.493 -0.067
MgF+ 7.449e-012 6.384e-012 -11.128 -11.195 -0.067
CaF+ 5.008e-012 4.292e-012 -11.300 -11.367 -0.067
PO3F-2 4.470e-013 2.394e-013 -12.350 -12.621 -0.271
HF 5.521e-014 5.521e-014 -13.258 -13.258 0.000
HF2- 9.529e-020 8.167e-020 -19.021 -19.088 -0.067
HPO3F- 2.068e-020 1.773e-020 -19.684 -19.751 -0.067
BF2(OH)2- 1.584e-021 1.357e-021 -20.800 -20.867 -0.067
FeF+ 4.062e-024 3.481e-024 -23.391 -23.458 -0.067
AlF2+ 2.293e-025 1.965e-025 -24.640 -24.707 -0.067
AlF+2 1.489e-025 8.084e-026 -24.827 -25.092 -0.265
AlF3 1.511e-026 1.511e-026 -25.821 -25.821 0.000
H2F2 7.580e-027 7.580e-027 -26.120 -26.120 0.000

174
VO2F 6.951e-027 6.951e-027 -26.158 -26.158 0.000
AlF4- 2.705e-029 2.318e-029 -28.568 -28.635 -0.067
VO2F2- 1.428e-029 1.224e-029 -28.845 -28.912 -0.067
FeF+2 4.025e-030 2.185e-030 -29.395 -29.661 -0.265
H2PO3F 6.676e-031 6.676e-031 -30.175 -30.175 0.000
FeF2+ 2.519e-031 2.159e-031 -30.599 -30.666 -0.067
BF3OH- 2.431e-031 2.084e-031 -30.614 -30.681 -0.067
VOF+ 1.033e-035 8.851e-036 -34.986 -35.053 -0.067
VOF2 3.257e-038 3.257e-038 -37.487 -37.487 0.000
BF4- 0.000e+000 0.000e+000 -42.237 -42.304 -0.067
SiF6-2 0.000e+000 0.000e+000 -53.747 -54.018 -0.271
Fe(2) 1.017e-016
FePO4- 8.408e-017 7.206e-017 -16.075 -16.142 -0.067
Fe(OH)3- 1.419e-017 1.216e-017 -16.848 -16.915 -0.067
Fe(OH)2 1.800e-018 1.800e-018 -17.745 -17.745 0.000
FeOH+ 1.558e-018 1.335e-018 -17.807 -17.874 -0.067
Fe+2 4.417e-020 2.488e-020 -19.355 -19.604 -0.249
FeHPO4 4.164e-020 4.164e-020 -19.380 -19.380 0.000
Fe(OH)4-2 3.852e-021 2.063e-021 -20.414 -20.685 -0.271
FeSO4 3.162e-021 3.162e-021 -20.500 -20.500 0.000
FeCl+ 2.579e-022 2.211e-022 -21.589 -21.655 -0.067
FeF+ 4.062e-024 3.481e-024 -23.391 -23.458 -0.067
FeCl2 1.447e-026 1.447e-026 -25.840 -25.840 0.000
FeCl4-2 1.161e-029 6.217e-030 -28.935 -29.206 -0.271
FeH2PO4+ 3.602e-032 3.087e-032 -31.443 -31.510 -0.067
Fe(3) 5.914e-006
Fe(OH)4- 5.798e-006 4.969e-006 -5.237 -5.304 -0.067
Fe(OH)3 1.166e-007 1.166e-007 -6.933 -6.933 0.000
Fe(OH)2+ 1.714e-012 1.469e-012 -11.766 -11.833 -0.067
FeOH+2 4.815e-020 2.614e-020 -19.317 -19.583 -0.265
FeHPO4+ 1.771e-022 1.518e-022 -21.752 -21.819 -0.067
Fe+3 7.570e-029 2.386e-029 -28.121 -28.622 -0.501
FeF+2 4.025e-030 2.185e-030 -29.395 -29.661 -0.265
FeSO4+ 2.159e-030 1.851e-030 -29.666 -29.733 -0.067
FeCl2+ 5.584e-031 4.786e-031 -30.253 -30.320 -0.067
FeF2+ 2.519e-031 2.159e-031 -30.599 -30.666 -0.067
FeCl+2 8.930e-032 4.848e-032 -31.049 -31.314 -0.265
Fe(SO4)2- 2.927e-032 2.509e-032 -31.534 -31.601 -0.067
FeNO3+2 5.227e-033 2.837e-033 -32.282 -32.547 -0.265
Fe2(OH)2+4 1.929e-037 1.839e-038 -36.715 -37.735 -1.021
FeCl4- 9.985e-038 8.558e-038 -37.001 -37.068 -0.067
FeH2PO4+2 1.609e-039 8.735e-040 -38.793 -39.059 -0.265
Fe3(OH)4+5 0.000e+000 0.000e+000 -45.685 -47.249 -1.563
H(0) 5.468e-034
H2 2.734e-034 2.751e-034 -33.563 -33.560 0.003
Mg 6.774e-006
MgPO4- 6.675e-006 5.721e-006 -5.176 -5.243 -0.067
Mg+2 7.366e-008 4.332e-008 -7.133 -7.363 -0.231
MgHPO4 1.480e-008 1.480e-008 -7.830 -7.830 0.000
MgSO4 9.275e-009 9.275e-009 -8.033 -8.033 0.000
MgB(OH)4+ 5.752e-010 4.930e-010 -9.240 -9.307 -0.067
MgCl+ 4.812e-010 4.124e-010 -9.318 -9.385 -0.067
MgP2O7-2 4.793e-011 2.567e-011 -10.319 -10.591 -0.271
MgF+ 7.449e-012 6.384e-012 -11.128 -11.195 -0.067
MgH2PO4+ 5.718e-021 4.901e-021 -20.243 -20.310 -0.067
Mg4(OH)4+4 5.444e-024 5.191e-025 -23.264 -24.285 -1.021
Mo 2.773e-006
MoO4-2 2.773e-006 1.505e-006 -5.557 -5.822 -0.265
N(5) 1.398e-005
NO3- 1.398e-005 1.189e-005 -4.855 -4.925 -0.070
CaNO3+ 9.616e-012 8.242e-012 -11.017 -11.084 -0.067
HNO3 3.663e-018 3.663e-018 -17.436 -17.436 0.000
FeNO3+2 5.227e-033 2.837e-033 -32.282 -32.547 -0.265
Na 2.465e-002
Na+ 2.325e-002 1.992e-002 -1.634 -1.701 -0.067
NaHSiO3 1.147e-003 1.147e-003 -2.940 -2.940 0.000
NaSO4- 1.231e-004 1.055e-004 -3.910 -3.977 -0.067
NaHPO4- 8.128e-005 6.966e-005 -4.090 -4.157 -0.067
NaCl 4.270e-005 4.270e-005 -4.370 -4.370 0.000
NaOH 5.620e-006 5.620e-006 -5.250 -5.250 0.000
NaB(OH)4 5.349e-006 5.349e-006 -5.272 -5.272 0.000

175
NaAlO2 5.418e-008 5.418e-008 -7.266 -7.266 0.000
NaF 1.301e-008 1.301e-008 -7.886 -7.886 0.000
NaP2O7-3 5.036e-010 1.232e-010 -9.298 -9.909 -0.611
Na2P2O7-2 3.641e-010 1.950e-010 -9.439 -9.710 -0.271
NaHP2O7-2 2.741e-013 1.468e-013 -12.562 -12.833 -0.271
O(0) 1.669e-025
O2 8.347e-026 8.400e-026 -25.078 -25.076 0.003
P(-3) 0.000e+000
PH4+ 0.000e+000 0.000e+000 -199.589 -199.656 -0.067
P(5) 1.021e-003
HPO4-2 7.849e-004 4.204e-004 -3.105 -3.376 -0.271
PO4-3 1.322e-004 3.236e-005 -3.879 -4.490 -0.611
NaHPO4- 8.128e-005 6.966e-005 -4.090 -4.157 -0.067
CaPO4- 1.583e-005 1.357e-005 -4.800 -4.867 -0.067
MgPO4- 6.675e-006 5.721e-006 -5.176 -5.243 -0.067
H2PO4- 4.884e-008 4.186e-008 -7.311 -7.378 -0.067
CaHPO4 3.194e-008 3.194e-008 -7.496 -7.496 0.000
MgHPO4 1.480e-008 1.480e-008 -7.830 -7.830 0.000
NaP2O7-3 5.036e-010 1.232e-010 -9.298 -9.909 -0.611
P2O7-4 4.202e-010 3.433e-011 -9.377 -10.464 -1.088
Na2P2O7-2 3.641e-010 1.950e-010 -9.439 -9.710 -0.271
CaP2O7-2 5.166e-011 2.767e-011 -10.287 -10.558 -0.271
MgP2O7-2 4.793e-011 2.567e-011 -10.319 -10.591 -0.271
HP2O7-3 1.349e-012 3.300e-013 -11.870 -12.481 -0.611
PO3F-2 4.470e-013 2.394e-013 -12.350 -12.621 -0.271
NaHP2O7-2 2.741e-013 1.468e-013 -12.562 -12.833 -0.271
FePO4- 8.408e-017 7.206e-017 -16.075 -16.142 -0.067
H3PO4 3.798e-017 3.798e-017 -16.420 -16.420 0.000
H2P2O7-2 1.501e-017 8.037e-018 -16.824 -17.095 -0.271
FeHPO4 4.164e-020 4.164e-020 -19.380 -19.380 0.000
HPO3F- 2.068e-020 1.773e-020 -19.684 -19.751 -0.067
CaH2PO4+ 1.003e-020 8.597e-021 -19.999 -20.066 -0.067
MgH2PO4+ 5.718e-021 4.901e-021 -20.243 -20.310 -0.067
FeHPO4+ 1.771e-022 1.518e-022 -21.752 -21.819 -0.067
VO2HPO4- 1.686e-022 1.445e-022 -21.773 -21.840 -0.067
VO2(HPO4)2-3 1.462e-022 3.577e-023 -21.835 -22.447 -0.611
AlHPO4+ 1.631e-023 1.398e-023 -22.788 -22.855 -0.067
H3P2O7- 1.269e-026 1.088e-026 -25.897 -25.963 -0.067
H2PO3F 6.676e-031 6.676e-031 -30.175 -30.175 0.000
FeH2PO4+ 3.602e-032 3.087e-032 -31.443 -31.510 -0.067
H4P2O7 1.882e-036 1.882e-036 -35.725 -35.725 0.000
VO2H2PO4 6.024e-038 6.024e-038 -37.220 -37.220 0.000
AlH2PO4+2 7.599e-039 4.125e-039 -38.119 -38.385 -0.265
FeH2PO4+2 1.609e-039 8.735e-040 -38.793 -39.059 -0.265
S(6) 1.620e-003
SO4-2 1.497e-003 8.018e-004 -2.825 -3.096 -0.271
NaSO4- 1.231e-004 1.055e-004 -3.910 -3.977 -0.067
CaSO4 1.620e-008 1.620e-008 -7.791 -7.791 0.000
MgSO4 9.275e-009 9.275e-009 -8.033 -8.033 0.000
HSO4- 5.565e-013 4.769e-013 -12.255 -12.322 -0.067
FeSO4 3.162e-021 3.162e-021 -20.500 -20.500 0.000
VO2SO4- 1.808e-026 1.550e-026 -25.743 -25.810 -0.067
H2SO4 2.650e-027 2.650e-027 -26.577 -26.577 0.000
AlSO4+ 1.267e-027 1.086e-027 -26.897 -26.964 -0.067
Al(SO4)2- 7.888e-029 6.760e-029 -28.103 -28.170 -0.067
FeSO4+ 2.159e-030 1.851e-030 -29.666 -29.733 -0.067
Fe(SO4)2- 2.927e-032 2.509e-032 -31.534 -31.601 -0.067
VOSO4 3.510e-035 3.510e-035 -34.455 -34.455 0.000
VSO4+ 0.000e+000 0.000e+000 -54.201 -54.268 -0.067
Se(-2) 0.000e+000
HSe- 0.000e+000 0.000e+000 -57.377 -57.444 -0.067
Se-2 0.000e+000 0.000e+000 -60.889 -61.160 -0.271
H2Se 0.000e+000 0.000e+000 -64.852 -64.852 0.000
Se(4) 1.791e-007
SeO3-2 1.791e-007 9.593e-008 -6.747 -7.018 -0.271
HSeO3- 1.355e-011 1.161e-011 -10.868 -10.935 -0.067
H2SeO3 2.597e-020 2.597e-020 -19.586 -19.586 0.000
Se(6) 4.970e-006
SeO4-2 4.970e-006 2.662e-006 -5.304 -5.575 -0.271
HSeO4- 1.556e-015 1.333e-015 -14.808 -14.875 -0.067
Si 2.674e-003
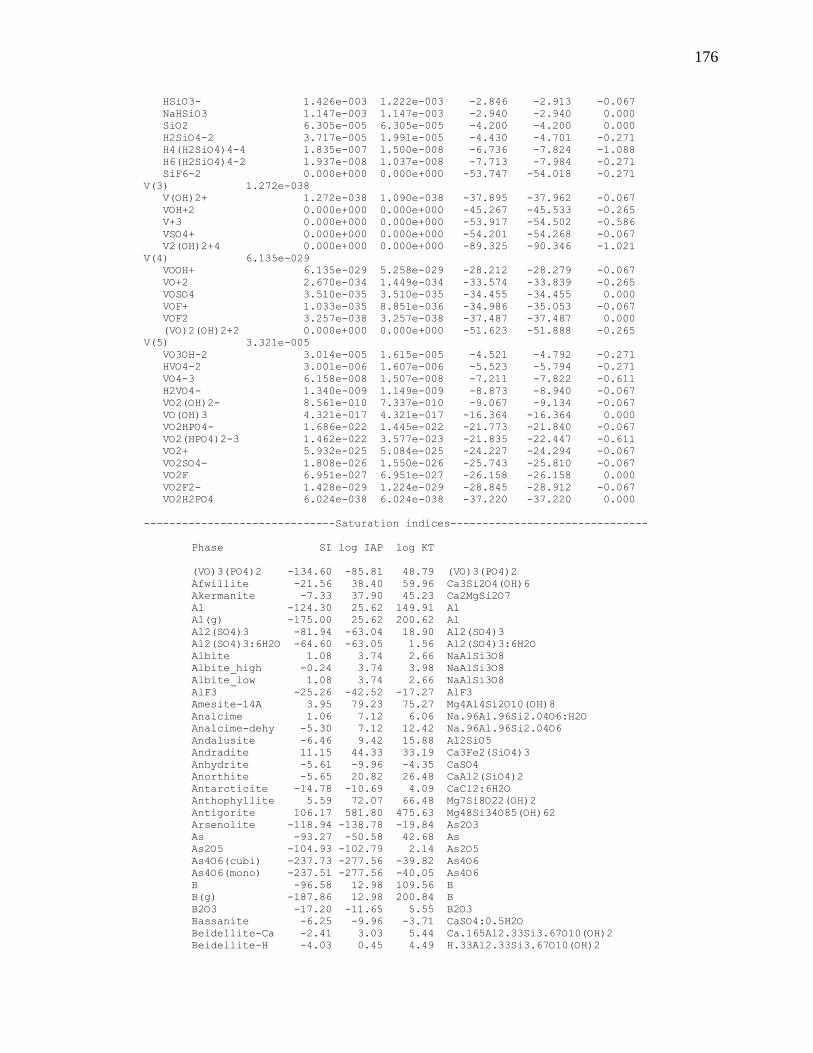
176
HSiO3- 1.426e-003 1.222e-003 -2.846 -2.913 -0.067
NaHSiO3 1.147e-003 1.147e-003 -2.940 -2.940 0.000
SiO2 6.305e-005 6.305e-005 -4.200 -4.200 0.000
H2SiO4-2 3.717e-005 1.991e-005 -4.430 -4.701 -0.271
H4(H2SiO4)4-4 1.835e-007 1.500e-008 -6.736 -7.824 -1.088
H6(H2SiO4)4-2 1.937e-008 1.037e-008 -7.713 -7.984 -0.271
SiF6-2 0.000e+000 0.000e+000 -53.747 -54.018 -0.271
V(3) 1.272e-038
V(OH)2+ 1.272e-038 1.090e-038 -37.895 -37.962 -0.067
VOH+2 0.000e+000 0.000e+000 -45.267 -45.533 -0.265
V+3 0.000e+000 0.000e+000 -53.917 -54.502 -0.586
VSO4+ 0.000e+000 0.000e+000 -54.201 -54.268 -0.067
V2(OH)2+4 0.000e+000 0.000e+000 -89.325 -90.346 -1.021
V(4) 6.135e-029
VOOH+ 6.135e-029 5.258e-029 -28.212 -28.279 -0.067
VO+2 2.670e-034 1.449e-034 -33.574 -33.839 -0.265
VOSO4 3.510e-035 3.510e-035 -34.455 -34.455 0.000
VOF+ 1.033e-035 8.851e-036 -34.986 -35.053 -0.067
VOF2 3.257e-038 3.257e-038 -37.487 -37.487 0.000
(VO)2(OH)2+2 0.000e+000 0.000e+000 -51.623 -51.888 -0.265
V(5) 3.321e-005
VO3OH-2 3.014e-005 1.615e-005 -4.521 -4.792 -0.271
HVO4-2 3.001e-006 1.607e-006 -5.523 -5.794 -0.271
VO4-3 6.158e-008 1.507e-008 -7.211 -7.822 -0.611
H2VO4- 1.340e-009 1.149e-009 -8.873 -8.940 -0.067
VO2(OH)2- 8.561e-010 7.337e-010 -9.067 -9.134 -0.067
VO(OH)3 4.321e-017 4.321e-017 -16.364 -16.364 0.000
VO2HPO4- 1.686e-022 1.445e-022 -21.773 -21.840 -0.067
VO2(HPO4)2-3 1.462e-022 3.577e-023 -21.835 -22.447 -0.611
VO2+ 5.932e-025 5.084e-025 -24.227 -24.294 -0.067
VO2SO4- 1.808e-026 1.550e-026 -25.743 -25.810 -0.067
VO2F 6.951e-027 6.951e-027 -26.158 -26.158 0.000
VO2F2- 1.428e-029 1.224e-029 -28.845 -28.912 -0.067
VO2H2PO4 6.024e-038 6.024e-038 -37.220 -37.220 0.000
------------------------------Saturation indices-------------------------------
Phase SI log IAP log KT
(VO)3(PO4)2 -134.60 -85.81 48.79 (VO)3(PO4)2
Afwillite -21.56 38.40 59.96 Ca3Si2O4(OH)6
Akermanite -7.33 37.90 45.23 Ca2MgSi2O7
Al -124.30 25.62 149.91 Al
Al(g) -175.00 25.62 200.62 Al
Al2(SO4)3 -81.94 -63.04 18.90 Al2(SO4)3
Al2(SO4)3:6H2O -64.60 -63.05 1.56 Al2(SO4)3:6H2O
Albite 1.08 3.74 2.66 NaAlSi3O8
Albite_high -0.24 3.74 3.98 NaAlSi3O8
Albite_low 1.08 3.74 2.66 NaAlSi3O8
AlF3 -25.26 -42.52 -17.27 AlF3
Amesite-14A 3.95 79.23 75.27 Mg4Al4Si2O10(OH)8
Analcime 1.06 7.12 6.06 Na.96Al.96Si2.04O6:H2O
Analcime-dehy -5.30 7.12 12.42 Na.96Al.96Si2.04O6
Andalusite -6.46 9.42 15.88 Al2SiO5
Andradite 11.15 44.33 33.19 Ca3Fe2(SiO4)3
Anhydrite -5.61 -9.96 -4.35 CaSO4
Anorthite -5.65 20.82 26.48 CaAl2(SiO4)2
Antarcticite -14.78 -10.69 4.09 CaCl2:6H2O
Anthophyllite 5.59 72.07 66.48 Mg7Si8O22(OH)2
Antigorite 106.17 581.80 475.63 Mg48Si34O85(OH)62
Arsenolite -118.94 -138.78 -19.84 As2O3
As -93.27 -50.58 42.68 As
As2O5 -104.93 -102.79 2.14 As2O5
As4O6(cubi) -237.73 -277.56 -39.82 As4O6
As4O6(mono) -237.51 -277.56 -40.05 As4O6
B -96.58 12.98 109.56 B
B(g) -187.86 12.98 200.84 B
B2O3 -17.20 -11.65 5.55 B2O3
Bassanite -6.25 -9.96 -3.71 CaSO4:0.5H2O
Beidellite-Ca -2.41 3.03 5.44 Ca.165Al2.33Si3.67O10(OH)2
Beidellite-H -4.03 0.45 4.49 H.33Al2.33Si3.67O10(OH)2

177
Beidellite-Mg -2.46 2.95 5.41 Mg.165Al2.33Si3.67O10(OH)2
Beidellite-Na -1.90 3.60 5.50 Na.33Al2.33Si3.67O10(OH)2
Berlinite -11.76 -19.02 -7.27 AlPO4
BF3(g) -52.18 -55.16 -2.98 BF3
Bischofite -15.59 -11.19 4.39 MgCl2:6H2O
Bloedite -14.48 -16.96 -2.48 Na2Mg(SO4)2:4H2O
Boehmite -0.74 6.81 7.55 AlO2H
Borax -16.29 -4.25 12.04 Na2(B4O5(OH)4):8H2O
Boric_acid -5.67 -5.83 -0.16 B(OH)3
Brucite -1.19 15.10 16.28 Mg(OH)2
Brushite -16.79 -10.24 6.55 CaHPO4:2H2O
Ca -111.69 28.14 139.83 Ca
Ca(g) -136.93 28.14 165.07 Ca
Ca-Al_Pyroxene -10.88 25.02 35.90 CaAl2SiO6
Ca2Al2O5:8H2O -14.75 44.82 59.57 Ca2Al2O5:8H2O
Ca2Cl2(OH)2:H2O -21.38 4.91 26.29 Ca2Cl2(OH)2:H2O
Ca2V2O7 -12.11 -51.82 -39.71 Ca2V2O7
Ca3(AsO4)2 -73.79 -55.99 17.80 Ca3(AsO4)2
Ca3(AsO4)2:10H2O -71.52 -92.73 -21.21 Ca3(AsO4)2:10H2O
Ca3(AsO4)2:3H2O -71.59 -92.73 -21.14 Ca3(AsO4)2:3H2O
Ca3Al2O6 -52.61 60.42 113.03 Ca3Al2O6
Ca3V2O8 -17.90 -36.22 -18.32 Ca3V2O8
Ca4Al2Fe2O10 -54.32 86.16 140.48 Ca4Al2Fe2O10
Ca4Al2O7:13H2O -31.23 76.02 107.25 Ca4Al2O7:13H2O
Ca4Al2O7:19H2O -27.66 76.02 103.68 Ca4Al2O7:19H2O
Ca4Cl2(OH)6:13H2O -32.22 36.11 68.33 Ca4Cl2(OH)6:13H2O
Ca5(AsO4)3(OH) -105.19 -145.31 -40.12 Ca5(AsO4)3(OH)
CaAl2O4 -17.69 29.22 46.91 CaAl2O4
CaAl2O4:10H2O -8.77 29.22 37.99 CaAl2O4:10H2O
CaAl4O7 -25.75 42.85 68.59 CaAl4O7
CaCrO4 -10.65 -13.80 -3.15 CaCrO4
CaHAsO4 -39.91 -42.57 -2.66 CaHAsO4
CaHAsO4:H2O -37.78 -42.57 -4.79 CaHAsO4:H2O
CaSeO3:2H2O -9.24 -13.88 -4.63 CaSeO3:2H2O
CaSeO3:H2O -7.04 -13.88 -6.84 CaSeO3:H2O
CaSeO4 -9.34 -12.43 -3.09 CaSeO4
CaSeO4:2H2O -9.75 -12.43 -2.68 CaSeO4:2H2O
CaSO4:0.5H2O(beta) -6.42 -9.96 -3.54 CaSO4:0.5H2O
CaV2O6 -16.06 -67.42 -51.36 CaV2O6
Chalcedony -0.44 -4.20 -3.76 SiO2
Chamosite-7A -17.62 15.13 32.76 Fe2Al2SiO5(OH)4
Chloromagnesite -33.01 -11.19 21.82 MgCl2
Chromite -16.63 -1.47 15.16 FeCr2O4
Chrysotile 5.86 36.89 31.03 Mg3Si2O5(OH)4
Cl2(g) -41.82 -38.83 2.99 Cl2
Claudetite -118.98 -138.78 -19.80 As2O3
Clinochlore-14A 9.45 76.50 67.05 Mg5Al2Si3O10(OH)8
Clinochlore-7A 6.08 76.50 70.42 Mg5Al2Si3O10(OH)8
Clinoptilolite-Ca -2.90 -10.42 -7.52
Ca1.7335Al3.45Fe.017Si14.533O36:10.922H2O
Clinoptilolite-dehy-Ca -38.56 -10.42 28.14 Ca1.7335Al3.45Fe.017Si14.533O36
Clinoptilolite-dehy-Na -32.43 -4.42 28.01 Na3.467Al3.45Fe.017Si14.533O36
Clinoptilolite-hy-Ca -2.90 -10.42 -7.52
Ca1.7335Al3.45Fe.017Si14.533O36:11.645H2O
Clinoptilolite-hy-Na 3.22 -4.42 -7.65
Na3.467Al3.45Fe.017Si14.533O36:10.877H2O
Clinoptilolite-Na 3.22 -4.42 -7.64 Na3.467Al3.45Fe.017Si14.533O36:10.922H2O
Clinozoisite -4.07 39.03 43.10 Ca2Al3Si3O12(OH)
Coesite -0.98 -4.20 -3.22 SiO2
Colemanite -25.27 -3.76 21.51 Ca2B6O11:5H2O
Cordierite_anhyd -15.63 36.44 52.07 Mg2Al4Si5O18
Cordierite_hydr -13.15 36.44 49.59 Mg2Al4Si5O18:H2O
Corundum -4.67 13.62 18.29 Al2O3
Cr -82.03 16.64 98.67 Cr
Cr-ettringite -41.27 19.01 60.28 Ca6(Al(OH)6)2(CrO4)3:26H2O
Cr-monosulfoaluminate -24.74 46.62 71.36 Ca4Al2(OH)12(CrO4):9H2O
CrCl3 -59.52 -41.60 17.92 CrCl3
CrF3 -42.86 -51.50 -8.64 CrF3
CrF4 -81.10 -93.43 -12.34 CrF4
Cristobalite(alpha) -0.72 -4.20 -3.48 SiO2
Cristobalite(beta) -1.17 -4.20 -3.03 SiO2

178
CrO2 -8.52 -27.66 -19.14 CrO2
CrO3 -25.84 -29.40 -3.56 CrO3
Cronstedtite-7A -4.53 11.64 16.18 Fe2Fe2SiO5(OH)4
Daphnite-14A -36.80 15.30 52.10 Fe5AlAlSi3O10(OH)8
Daphnite-7A -40.18 15.30 55.48 Fe5AlAlSi3O10(OH)8
Diaspore -0.34 6.81 7.15 AlHO2
Dicalcium_silicate -10.13 27.00 37.13 Ca2SiO4
Diopside 1.41 22.30 20.89 CaMgSi2O6
Downeyite -22.69 -29.48 -6.79 SeO2
Enstatite -0.39 10.90 11.29 MgSiO3
Epidote 4.52 37.29 32.77 Ca2FeAl2Si3O12OH
Epidote-ord 4.52 37.29 32.76 FeCa2Al2(OH)(SiO4)3
Epsomite -8.50 -10.46 -1.96 MgSO4:7H2O
Eskolaite -11.97 -21.19 -9.22 Cr2O3
Ettringite -31.92 30.55 62.46 Ca6Al2(SO4)3(OH)12:26H2O
F2(g) -101.14 -45.43 55.71 F2
Fayalite -17.55 1.51 19.06 Fe2SiO4
Fe -43.62 15.39 59.02 Fe
Fe(OH)2 -11.04 2.86 13.89 Fe(OH)2
Fe(OH)3 -0.57 5.07 5.64 Fe(OH)3
Fe2(SO4)3 -69.58 -66.53 3.05 Fe2(SO4)3
FeF2 -27.61 -30.03 -2.42 FeF2
FeF3 -25.01 -44.26 -19.26 FeF3
FeO -10.67 2.86 13.52 FeO
Ferrite-Ca 4.24 25.73 21.50 CaFe2O4
Ferrite-Dicalcium -15.46 41.33 56.80 Ca2Fe2O5
Ferrite-Mg 4.21 25.23 21.02 MgFe2O4
Ferroselite -87.62 -168.44 -80.82 FeSe2
Ferrosilite -8.75 -1.34 7.41 FeSiO3
FeSO4 -25.31 -22.70 2.61 FeSO4
FeV2O4 -319.33 -38.77 280.56 FeV2O4
Fix_H+ -11.23 -11.23 0.00 H+
Fluorapatite 9.21 -15.95 -25.16 Ca5(PO4)3F
Fluorite -7.22 -17.29 -10.07 CaF2
Forsterite -1.82 25.99 27.81 Mg2SiO4
Foshagite -16.00 49.80 65.80 Ca4Si3O9(OH)2:0.5H2O
Gehlenite -15.60 40.62 56.22 Ca2Al2SiO7
Gibbsite -0.93 6.81 7.74 Al(OH)3
Gismondine -0.08 41.64 41.72 Ca2Al4Si4O16:9H2O
Glauberite -10.98 -16.45 -5.47 Na2Ca(SO4)2
Goethite 4.54 5.07 0.53 FeOOH
Greenalite -22.42 0.17 22.58 Fe3Si2O5(OH)4
Grossular -3.95 47.82 51.78 Ca3Al2(SiO4)3
Gypsum -5.42 -9.96 -4.53 CaSO4:2H2O
Gyrolite -4.20 18.60 22.80 Ca2Si3O7(OH)2:1.5H2O
H2(g) -30.46 -33.56 -3.10 H2
H2O(g) -1.59 -0.00 1.59 H2O
Halite -5.18 -3.61 1.56 NaCl
Hatrurite -30.75 42.60 73.35 Ca3SiO5
HCl(g) -19.45 -13.14 6.30 HCl
Hedenbergite -9.47 10.06 19.53 CaFe(SiO3)2
Hematite 10.06 10.13 0.08 Fe2O3
Hercynite -12.32 16.48 28.80 FeAl2O4
Hexahydrite -8.73 -10.46 -1.73 MgSO4:6H2O
Hillebrandite -9.77 27.00 36.77 Ca2SiO3(OH)2:0.17H2O
Hydroboracite -24.63 -4.26 20.36 MgCaB6O11:6H2O
Hydrophilite -22.43 -10.69 11.75 CaCl2
Hydroxylapatite 3.72 0.49 -3.22 Ca5(OH)(PO4)3
Ice -0.14 -0.00 0.14 H2O
Jadeite -0.37 7.94 8.31 NaAl(SiO3)2
Jarosite-Na -20.93 -26.38 -5.45 NaFe3(SO4)2(OH)6
Kaolinite -1.50 5.22 6.72 Al2Si2O5(OH)4
Karelianite -51.57 -41.63 9.95 V2O3
Katoite -18.52 60.42 78.94 Ca3Al2H12O12
Kieserite -10.19 -10.46 -0.27 MgSO4:H2O
Kyanite -6.19 9.42 15.61 Al2SiO5
Larnite -11.42 27.00 38.42 Ca2SiO4
Laumontite -1.09 12.42 13.51 CaAl2Si4O12:4H2O
Lawrencite -32.49 -23.43 9.05 FeCl2
Lawsonite -1.28 20.82 22.11 CaAl2Si2O7(OH)2:H2O
Lime -16.97 15.60 32.57 CaO

179
Magnesiochromite -10.92 10.77 21.69 MgCr2O4
Magnetite 2.57 12.99 10.42 Fe3O4
Margarite -6.48 34.44 40.93 CaAl4Si2O10(OH)2
Mayenite -211.59 282.56 494.15 Ca12Al14O33
Melanterite -20.30 -22.70 -2.40 FeSO4:7H2O
Merwinite -14.91 53.50 68.41 MgCa3(SiO4)2
Mesolite 4.11 17.60 13.49 Na.676Ca.657Al1.99Si3.01O10:2.647H2O
Mg -94.89 27.63 122.52 Mg
Mg(g) -114.61 27.63 142.25 Mg
Mg1.25SO4(OH)0.5:0.5H2O -11.88 -6.69 5.20 Mg1.25SO4(OH)0.5:0.5H2O
Mg1.5SO4(OH) -12.12 -2.91 9.21 Mg1.5SO4(OH)
Mg2V2O7 -21.93 -52.83 -30.90 Mg2V2O7
MgCl2:2H2O -23.92 -11.19 12.73 MgCl2:2H2O
MgCl2:4H2O -18.49 -11.19 7.30 MgCl2:4H2O
MgCl2:H2O -27.26 -11.19 16.07 MgCl2:H2O
MgOHCl -13.94 1.95 15.89 MgOHCl
MgSeO3 -16.05 -14.38 1.67 MgSeO3
MgSeO3:6H2O -10.95 -14.38 -3.44 MgSeO3:6H2O
MgSO4 -15.29 -10.46 4.83 MgSO4
MgV2O6 -22.08 -67.93 -45.85 MgV2O6
Minnesotaite -22.07 -8.24 13.83 Fe3Si4O10(OH)2
Mirabilite -5.35 -6.50 -1.15 Na2SO4:10H2O
Mo -99.94 9.33 109.27 Mo
Molysite -47.83 -34.36 13.47 FeCl3
Monosulfoaluminate -22.11 50.46 72.57 Ca4Al2(SO4)(OH)12:13H2O
Monticellite -3.03 26.50 29.53 CaMgSiO4
Montmor-Ca -0.22 2.13 2.34 Ca.165Mg.33Al1.67Si4O10(OH)2
Montmor-Mg -0.19 2.05 2.23 Mg.495Al1.67Si4O10(OH)2
Montmor-Na 0.37 2.70 2.33 Na.33Mg.33Al1.67Si4O10(OH)2
Mordenite -1.53 -6.90 -5.36 Ca.2895Na.361Al.94Si5.06O12:3.468H2O
Mordenite-dehy -16.66 -6.89 9.77 Ca.2895Na.361Al.94Si5.06O12
MoSe2 -127.86 -182.98 -55.12 MoSe2
Na -51.57 15.80 67.37 Na
Na(g) -65.06 15.80 80.86 Na
Na2Cr2O7 -29.56 -39.74 -10.18 Na2Cr2O7
Na2CrO4 -13.24 -10.34 2.90 Na2CrO4
Na2O -48.36 19.06 67.42 Na2O
Na2Se -76.39 -64.56 11.83 Na2Se
Na2Se2 -99.36 -160.72 -61.35 Na2Se2
Na2SiO3 -7.34 14.86 22.20 Na2SiO3
Na3H(SO4)2 -21.63 -22.52 -0.89 Na3H(SO4)2
Na4Ca(SO4)3:2H2O -17.06 -22.95 -5.89 Na4Ca(SO4)3:2H2O
Na4SiO4 -36.68 33.92 70.60 Na4SiO4
Na6Si2O7 -52.76 48.77 101.53 Na6Si2O7
NaFeO2 -5.29 14.60 19.88 NaFeO2
Natrolite 1.69 20.08 18.39 Na2Al2Si3O10:2H2O
Natrosilite -7.41 10.66 18.07 Na2Si2O5
Nepheline -1.61 12.14 13.75 NaAlSiO4
NO2(g) -18.23 -9.89 8.35 NO2
Nontronite-Ca 11.27 -0.46 -11.73 Ca.165Fe2Al.33Si3.67H2O12
Nontronite-H 9.66 -3.03 -12.69 H.33Fe2Al.33Si3.67H2O12
Nontronite-Mg 11.23 -0.54 -11.77 Mg.165Fe2Al.33Si3.67H2O12
Nontronite-Na 11.79 0.11 -11.68 Na.33Fe2Al.33Si3.67H2O12
O2(g) -22.18 -25.08 -2.89 O2
Okenite -3.11 7.20 10.31 CaSi2O4(OH)2:H2O
Oxychloride-Mg -8.78 17.05 25.83 Mg2Cl(OH)3:4H2O
P -126.54 5.51 132.05 P
Paragonite -0.02 17.36 17.38 NaAl3Si3O10(OH)2
Pargasite -5.35 96.35 101.70 NaCa2Al3Mg4Si6O22(OH)2
Pentahydrite -9.07 -10.46 -1.39 MgSO4:5H2O
Periclase -6.23 15.10 21.33 MgO
Portlandite -6.95 15.60 22.55 Ca(OH)2
Prehnite -0.57 32.22 32.79 Ca2Al2Si3O10(OH)2
Pseudowollastonite -2.56 11.40 13.96 CaSiO3
Pyrophyllite -3.47 -3.18 0.29 Al2Si4O10(OH)2
Quartz -0.17 -4.20 -4.03 SiO2
Rankinite -13.42 38.40 51.82 Ca3Si2O7
Ripidolite-14A -8.76 52.02 60.78 Mg3Fe2Al2Si3O10(OH)8
Ripidolite-7A -12.14 52.02 64.16 Mg3Fe2Al2Si3O10(OH)8
Saponite-Ca 8.55 34.70 26.14 Ca.165Mg3Al.33Si3.67O10(OH)2
Saponite-H 6.94 32.12 25.18 H.33Mg3Al.33Si3.67O10(OH)2

180
Saponite-Mg 8.51 34.61 26.10 Mg3.165Al.33Si3.67O10(OH)2
Saponite-Na 9.07 35.27 26.20 Na.33Mg3Al.33Si3.67O10(OH)2
Scolecite 0.88 16.62 15.75 CaAl2Si3O10:3H2O
Se -30.50 -4.40 26.10 Se
Se-ettringite -38.18 23.11 61.29 Ca6(Al(OH)6)2(SeO4)3:31.5H2O
Se-monosulfoaluminate -25.42 47.98 73.40 Ca4(Al(OH)6)2SeO4:9H2O
Se2O5 -67.00 -57.51 9.49 Se2O5
SeCl4 -96.39 -82.05 14.33 SeCl4
Sellaite -8.35 -17.79 -9.44 MgF2
SeO3 -47.20 -28.03 19.16 SeO3
Sepiolite 4.96 35.18 30.22 Mg4Si6O15(OH)2:6H2O
Shcherbinaite -24.68 -26.13 -1.45 V2O5
Si -127.99 20.88 148.86 Si
Si(g) -199.06 20.88 219.94 Si
SiF4(g) -54.74 -69.98 -15.24 SiF4
Sillimanite -6.82 9.42 16.24 Al2SiO5
SiO2(am) -1.46 -4.20 -2.74 SiO2
Spinel -8.89 28.72 37.61 Al2MgO4
Starkeyite -9.46 -10.46 -1.00 MgSO4:4H2O
Strengite -9.38 -20.77 -11.39 FePO4:2H2O
Tachyhydrite -50.22 -33.07 17.14 Mg2CaCl6:12H2O
Talc 7.50 28.49 20.99 Mg3Si4O10(OH)2
Thenardite -6.14 -6.50 -0.36 Na2SO4
Tobermorite-11A -12.59 52.80 65.39 Ca5Si6H11O22.5
Tobermorite-14A -10.81 52.80 63.61 Ca5Si6H21O27.5
Tobermorite-9A -16.06 52.80 68.86 Ca5Si6H6O20
Tremolite 12.15 73.08 60.93 Ca2Mg5Si8O22(OH)2
Tridymite -0.36 -4.20 -3.84 SiO2
V -108.95 -2.01 106.94 V
V2O4 -31.32 -22.76 8.56 V2O4
V3O5 -66.43 -53.01 13.43 V3O5
V4O7 -83.18 -64.38 18.80 V4O7
Vivianite -38.38 -43.11 -4.72 Fe3(PO4)2:8H2O
Wairakite -5.50 12.42 17.92 CaAl2Si4O10(OH)4
Whitlockite -0.55 -4.87 -4.32 Ca3(PO4)2
Wollastonite -2.32 11.40 13.72 CaSiO3
Wustite -9.46 2.94 12.40 Fe.947O
Xonotlite -23.34 68.40 91.74 Ca6Si6O17(OH)2
Zoisite -4.10 39.03 43.14 Ca2Al3(SiO4)3OH
------------------
End of simulation.
------------------

181
APPENDIX H: MOLAL CONCENTRATION OF ELEMENTS OBTAINED FROM
THE MODEL
TABLE H-1: Molal concentration from simulation at pH 11.588
GPC GP1 GP2 GP3
As(5)
mol/l 1.371E-05 1.365E-05 1.360E-05 1.239E-05
mg/l 1.027 1.023 1.019 0.928
Cr(3)
mol/l 3.863E-28 5.440E-28 3.776E-28 4.268E-28
mg/l 2.008E-23 2.828E-23 1.963E-23 2.219E-23
Cr(5)
mol/l 5.570E-12 6.254E-12 5.566E-12 5.479E-12
mg/l 2.896E-07 3.251E-07 2.894E-07 2.849E-07
Cr(6)
mol/l 2.164E-07 2.164E-07 2.164E-07 2.164E-07
mg/l 0.011 0.011 0.011 0.011
Se(4)
mol/l 2.386E-13 3.096E-13 2.455E-13 2.313E-13
mg/l 1.884E-08 2.445E-08 1.938E-08 1.826E-08
Se(6)
mol/l 5.149E-06 5.315E-06 5.366E-06 4.749E-06
mg/l 0.407 0.420 0.424 0.375


![HempCreate: the art of hemp based Geopolymer extrusion. · The material aspect Extrude [print] buildings Necessary to; understand Geopolymer chemistry discover a suitable Geopolymer](https://img.pdfslide.us/doc/110x75/5f6499b949fcf85d37753e59/hempcreate-the-art-of-hemp-based-geopolymer-the-material-aspect-extrude-print.jpg)