Embed Size (px)
Citation preview

THE UNIVERSITY of LIVERPOOL1Huang -
Base Station Diversity Investigation of Mobile Radio at 450 MHz
Yi HUANG, S. C. Su+ and J. Hodgskiss*Department of Electrical Engineering & Electronics
The University of Liverpool
THE UNIVERSITY of LIVERPOOL2Huang -
Contents
• Background of the project• The investigation• Measurement results• Discussion and conclusions

THE UNIVERSITY of LIVERPOOL3Huang -
1. Background
• Mobile radio channel: – Signals are combined constructively/destructively
which results in the multipath fading problem. • Solutions: diversity systems
– The main idea is that copies of the signal/data with independent statistics should be received.
– It could be in the frequency domain, time domain or the space domain.
– Antenna diversity: space, polarisation, and pattern.

THE UNIVERSITY of LIVERPOOL4Huang -
Antenna diversity
• Theory– Well developed, but new diversity schemes and
applications are still being proposed and implemented.– Combining methods:
• Selection diversity: choosing the signal with the highest signal to noise ratio (SNR) from one of the branches at every instant.
• Maximal ratio combining: signals weighted proportionately to their SNR and then summed.
• Equal gain combining: signals are weighted by a constant before summing.

THE UNIVERSITY of LIVERPOOL5Huang -
Antenna diversity
– The most important parameters• Mean power at each branch• Correlation coefficient• Diversity gain
• Experiments/measurements– To validate and test diversity systems developed– Most investigations were conducted above 800 MHz– 450 MHz: private/special services, very little work – Scaling? X
( ) ( )ρ12
1 1 2 2
1 12
2 22
=− −
− −
z z z z
z z z z
*
THE UNIVERSITY of LIVERPOOL6Huang -
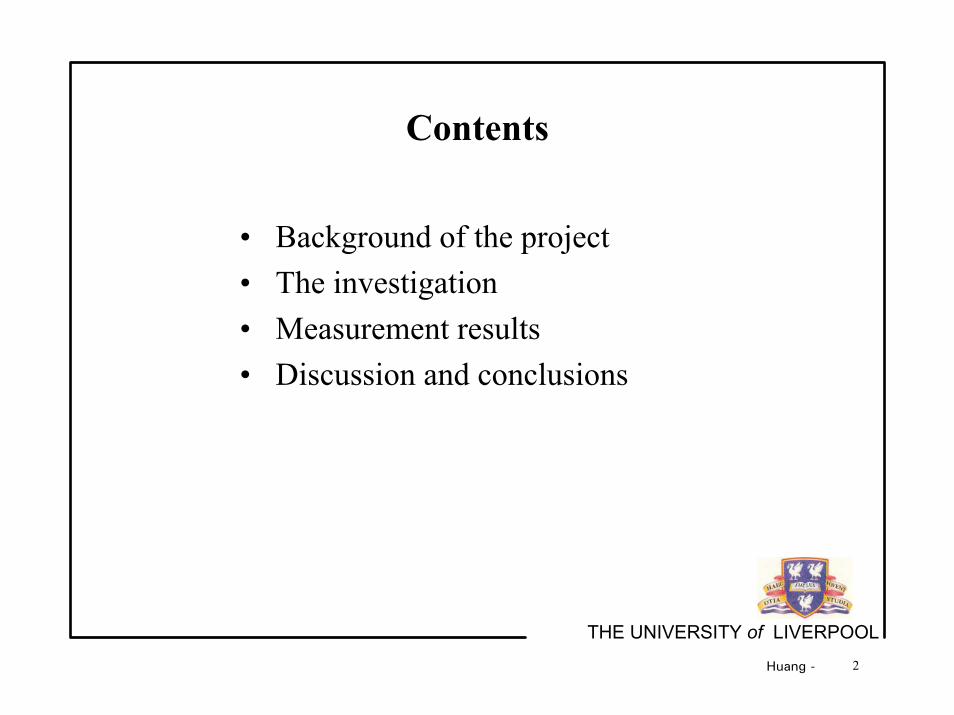
2. The investigation
• Base-station antenna configurations
• For both space and polarisation• Objective: to identify the best configuration for
uplink, if the space is limited
Config. A
Config. C
Config. B
Config. D

THE UNIVERSITY of LIVERPOOL7Huang -
Measurement system set-up: base station
• Half-wavelength dipole antennas with VSWR < 2• Receiving I(t) and Q(t) at each branch• Sampling frequency > 600 Hz (over 100 sample/λ)• Dynamic range > 50 dB• 30 m above the ground

THE UNIVERSITY of LIVERPOOL8Huang -
Measurement system set-up: mobile station
• Transmitter power 10W CW at 456 MHz• Monopole antenna, 1.5 m above the ground• Speed: 4m/s or 15 Km/h• Three routes: LOS, partial LOS, and NLOS

THE UNIVERSITY of LIVERPOOL9Huang -
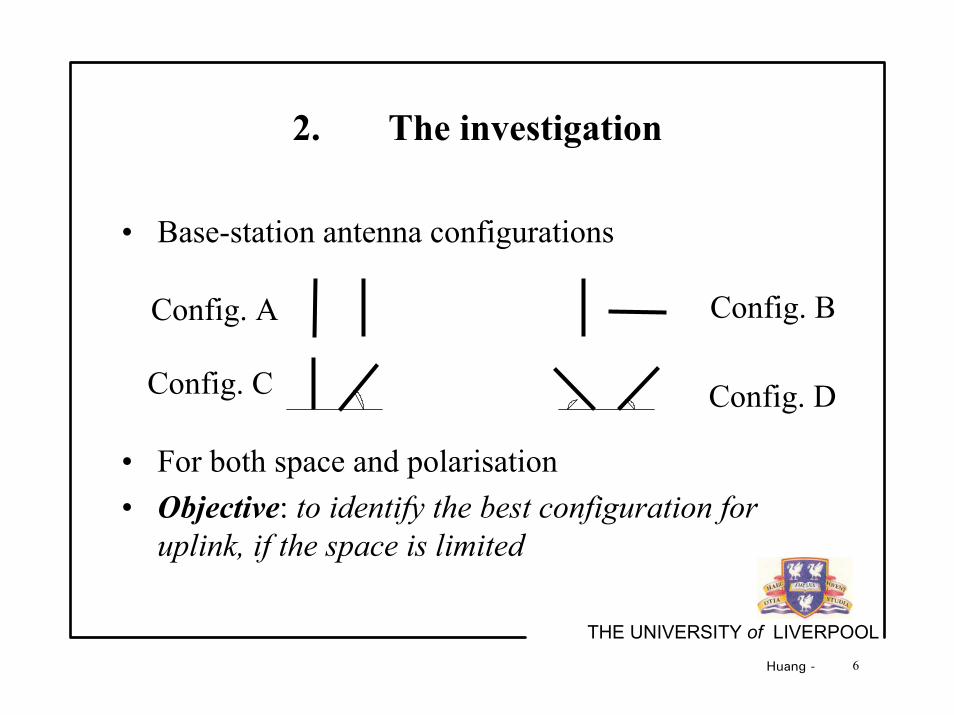
3. Measurement Results
• Significant difference (13 dB) for B• 2-4 dB difference for other configurations

THE UNIVERSITY of LIVERPOOL10Huang -
3. Measurement Results
• Significant difference (13 dB) for B• About 2 dB difference for other configurations
THE UNIVERSITY of LIVERPOOL11Huang -
3. Measurement Results
• About 9 dB for B• About 1 dB difference for other configurations

THE UNIVERSITY of LIVERPOOL12Huang -
Complex correlation: LOS
• B has the smallest correlation coefficient

THE UNIVERSITY of LIVERPOOL13Huang -
Complex correlation: partial LOS
• Again, B has the smallest correlation coefficient

THE UNIVERSITY of LIVERPOOL14Huang -
Complex correlation: NLOS
• And again, B has the smallest correlation coefficient• A seems to have the largest correlation coefficient

THE UNIVERSITY of LIVERPOOL15Huang -
Diversity GainG = [signal level of CPD at 10% of the combiner output in dB
- signal level of CPD at 10% of the reference signal in dB]

THE UNIVERSITY of LIVERPOOL16Huang -
Diversity Gain: LOS
• B: smallest• C: largest

THE UNIVERSITY of LIVERPOOL17Huang -
Diversity Gain: partial LOS
• B: smallest ?• C and D largest
THE UNIVERSITY of LIVERPOOL18Huang -
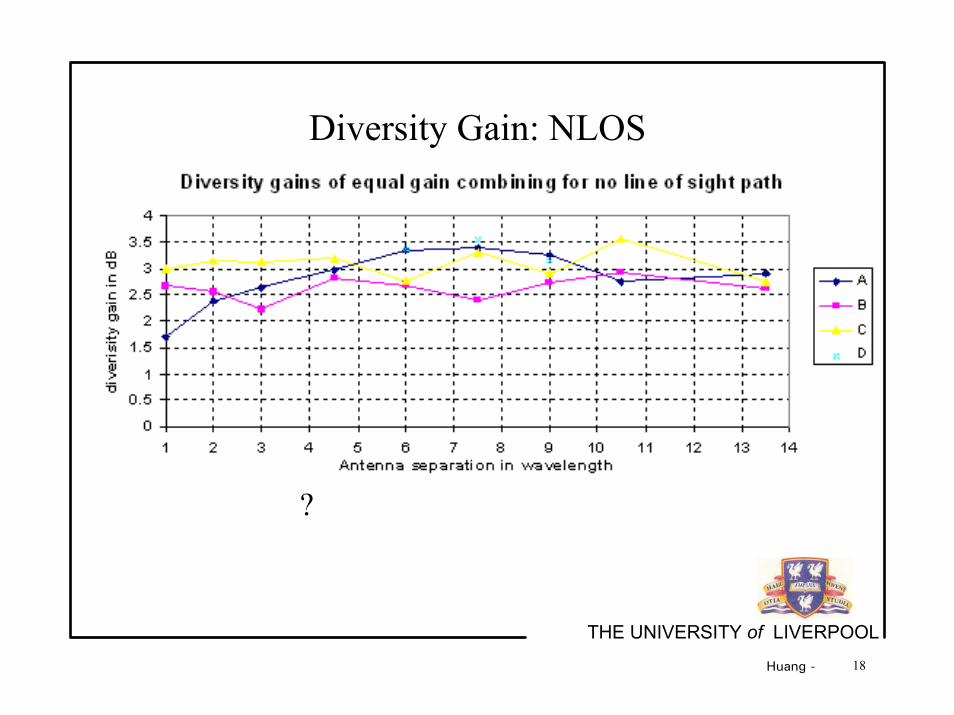
Diversity Gain: NLOS
?

THE UNIVERSITY of LIVERPOOL19Huang -
Diversity gain: LOS
• MRC C

THE UNIVERSITY of LIVERPOOL20Huang -
Diversity gain: partial LOS
• MRC C and SEL C

THE UNIVERSITY of LIVERPOOL21Huang -
Diversity gain: NLOS
• MRC C and EGC C

THE UNIVERSITY of LIVERPOOL22Huang -
4. Discussion and Conclusions
• The overall winner is C with a separation of 3λ (2m)– about 3.5 dB diversity gain at 10% level– about 7.9 dB diversity gain at 1% level– Smaller than that at higher frequencies
• Configuration A with a separation of 3λ (2m)– about 2.6 dB diversity gain at 10% level– about 6.0 dB diversity gain at 1% level
• Additional gains can be obtained by using both the spatial and polarisation arrangement for the same separation.

THE UNIVERSITY of LIVERPOOL23Huang -
Discussion and Conclusions
• Accuracy and Repeatability for diversity gain (10%)– The same route: difference < 0.3 dB– Different route: up to 1 dB– Different positions: up to 0.7 dB– Different mobile antenna orientation: up to 0.7 dB
• Time-consuming• Better characterisation approach is required
– In door facilities, such as reverberation chamber?