Embed Size (px)
Citation preview

BASE LINE SURVEY IN THE MINORITY CONCENTRATED DISTRICTS OF UTTAR PRADESH
(District: Badaun)
Sponsored by:
Ministry of Minority Affairs
Government of India New Delhi
Study conducted by:
Dr. Fahimuddin
Senior Fellow
GIRI INSTITUTE OF DEVELOPMENT STUDIES SECTOR-O, ALIGANJ HOUSING SCHEME
LUCKNOW-226 024

CONTENT
Executive Summary iv-vii CHAPTER I OUTLINE OF THE STUDY 1-3 CHAPTER II DEVELOPMENT STATUS IN 4-13 BADAUN DISTRICT CHAPTER III DEVELOPMENT STATUS AT 14-24 THE VILLAGE LEVEL CHAPTER IV DEVELOPMENT STATUS AT 25-49 THE HOUSEHOLD LEVEL CHAPTER V CRITICAL DEVELOPMENT GAPS 50-55 IN THE DISTRICT ANNEXURES 56-57 ABBREVIATIONS 58

ii
List of Tables Table Number
Title Page Number
1 Development Deficit in key Socio-economic, Basic amenities and Health indicators: Badaun District v
1.1 Sample Villages of Badaun District 3 2.1 Characteristics of Population in Badaun District and Uttar Pradesh, 2001 4 2.2 Demographic Status by Religion in Badaun District and Uttar Pradesh, 2001 5 2.3 Main Workers in Badaun District and Uttar Pradesh-2001 Census 5 2.4 Growth in Main Workers in Badaun District and Uttar Pradesh (1991-2001) 6 2.5 Employment through Employment Exchange in Badaun district 6 2.6 Land Use Pattern in Badaun District and Uttar Pradesh-2004-05 (Hectare) 7 2.7 Sources of Irrigation in Badaun District-2004-05 7 2.8 Area under Principal Crops in Badaun District and Uttar Pradesh-2004-05 8 2.9 Productivity of Major Crops in Badaun District and Uttar Pradesh-2004-05 8
2.10 Livestock in Badaun District-2004-05 9 2.11 Industrial Development in Badaun District (2006-07) 9 2.12 Economic Infrastructure Indicators in Badaun District and Uttar Pradesh 10 2.13 Rural Infrastructure in Badaun District and Uttar Pradesh (2005-06) 10 2.14 Educational Infrastructure in Badaun District and Uttar Pradesh, 2004-05 11 2.15 Health Infrastructure in Badaun District and Uttar Pradesh, 2005-06 11 2.16 Housing Conditions in Badaun District and Uttar Pradesh 12 2.17 Sources of Drinking Water in Badaun District and Uttar Pradesh 12 2.18 Sources of Cooking in Badaun District and Uttar Pradesh 12 2.19 Income and Poverty in Badaun District and Uttar Pradesh 13 3.1 Religion-wise population 14 3.2 Occupational Pattern 14 3.3 Land Use Pattern 15 3.4 Sources of Irrigation 15 3.5 Road and Electricity in Sample Villages 16 3.6 Per Household Availability of Sources of Drinking Water and their Status 16 3.7 Toilet Facility 17 3.8 Educational Facility 17 3.9 School Enrollment 18
3.10 Physical Structure of Schools 18 3.11 Private schools and Preferences of the People for Schools 19 3.12 Health Facilities 19 3.13 Facilities at the Sub-centre or PHC 20 3.14 Frequency of Visit of Health Staff in Villages 20 3.15 Conditions of PHC/sub-center in the village (put number of villages) 21 3.16 Details of Aanganwadi/ICDS Centers in Sample Villages 21 3.17 Private Medical Facilities (put number of villages) 22 3.18 Public Distribution System in the Villages 22 3.19 Other Facilities 23 3.20 Total Beneficiaries in the Government Programmes 23 3.21 Village Organization 24

iii 4.1 Composition of Different Religious Groups in the Sample 25 4.2 Family Size in Different Religious Groups 25 4.3 Population and Sex Ratio among Different Religious Groups 26 4.4 Classification of Population by Age among Different Religious Groups 26 4.5 Classification of Population by Level of Education among Different Religious Groups 27 4.6 Work Status of Hindu and Muslim Population 27 4.7 Main Activities of Population 28 4.8 Religion-wise Households Seeking Additional Employment and their most Preferred Activities 28 4.9 Distribution of Households of Different Religious Groups according to Land Size 29
4.10 Classification of Households according to the Value of their Land 30 4.11 Per Household Ownership of Livestock by Different Religious Groups 30 4.12 Distribution of Households by the Value of Livestock (Rs.) 31 4.13 Distribution of household by Value of Productive and other Assets 31 4.14 Per Household Value of Productive and Other Assets 32 4.15 Distribution of Households by the Type of Ownership of Houses 32 4.16 Distribution of Households by the Type of Houses 32 4.17 Distribution of Households by the Number of Rooms 33 4.18 Distribution of Households according to Sources of Homestead 33 4.19 Distribution of Households by the Electrification and Sources of Lighting 34 4.20 Classification of Households According to Sources of Drinking Water 34 4.21 Classification of Households According to Distance from Sources of Drinking Water 35 4.22 Classification of Households According to Toilet Facility and its type 35 4.23 Classification of Households According to Type of Cooking Fuel Used 35 4.24 Drainage Facility 36 4.25 Average Annual Income per Household by Sources of Income 36 4.26 Distribution of Households by the Size of Family Income (yearly) 37 4.27 Distribution of Households by the Size of Expenditure 37 4.28 Average Expenditure per Households on Different Items 38 4.29 Migration Characteristics of Working Family Members 38 4.30 Distribution of Households by Outstanding Amount of loan 39 4.31 Distribution of Households by Indebtedness Characteristics 40 4.32 Educational Status of Children in the Age of 5 to 15 years 41 4.33 Aspirations of parents regarding their Children’s Education 42 4.34 Interest in Training of Working Family Members 43 4.35 Type of Diseases 43 4.36 Place of Treatment of Diseases 44 4.37 Immunization of Children 44 4.38 Details of Public Distribution System 45 4.39 Access to Media and Communication 46 4.40 Awareness about Government Programmes 46 4.41 Views of Respondents regarding Facilities which need Special Attention 48 4.42 Views of the respondents regarding the Important Aspects lagging in their lives 49 Annexure-I: Value of Productive and Other Assets per Household. 56 Annexure II: Sample Villages of Badaun District 57
iv
Baseline Survey of Minority Concentrated Districts
Executive Summary: Badaun District
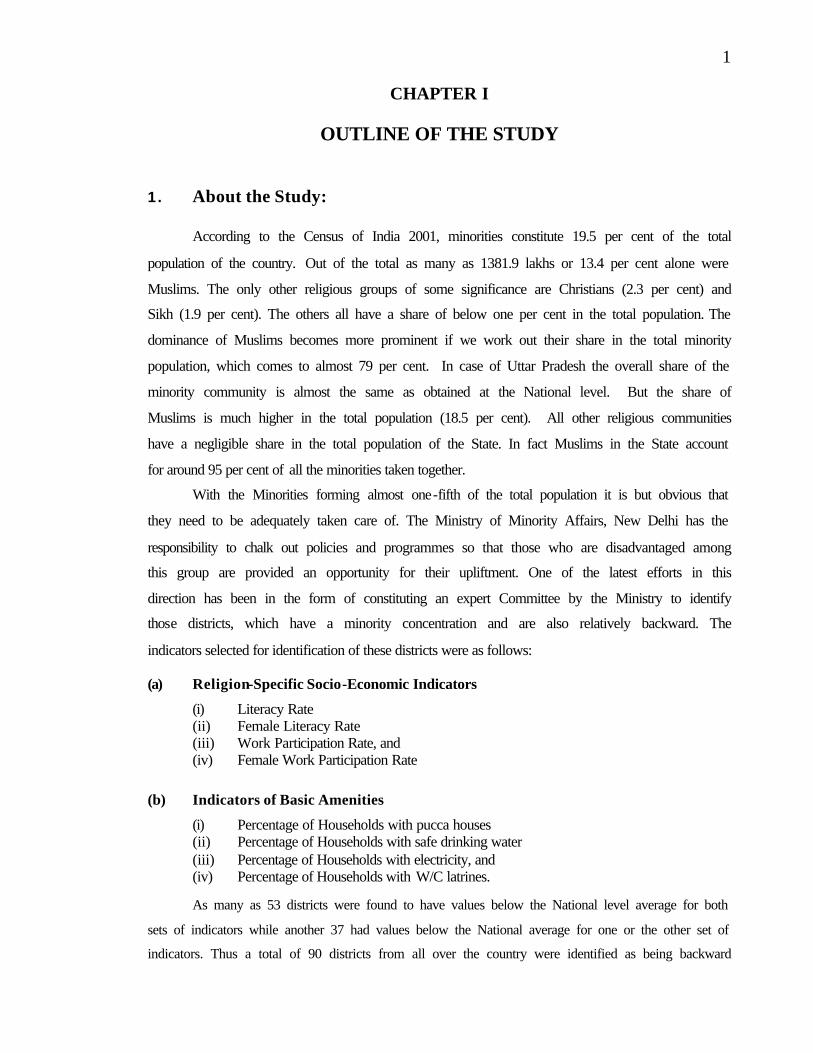
The purpose of the Base-line Survey was to
identify the development deficit in Badaun district and
identification of priority areas for the preparation of
Multi-sectoral Development Plan of the district. For
this purpose, basically 8 indicators were identified by
the expert committee constituted by the Ministry of
Minority Affairs, New Delhi. The idea was to identify
those districts which have a minority concentration and
are also relatively backward. The indicators selected for
identification of these districts were as follows:
(a) Religion-Specific Socio -Economic Indicators
i. Literacy Rate ii. Female Literacy Rate iii. Work Participation Rate iv. Female Work Participation Rate
(b) Indicators of Basic Amenities
i. Percentage of Households with pucca houses ii. Percentage of Households with safe drinking water iii. Percentage of Households with electricity iv. Percentage of Households with W/C latrines.
Besides the above, 2 additional indicators for assessing health status have been used.
These are:
i. Percentage of fully-vaccinated children ii. Percentage of institutional deliveries
The purpose of the Baseline Survey is to identify the infrastructural gaps which could be
filled up through the Multi-Sector District Development Plan (MsDP) for the Minority
Concentrated Districts (MCDs) which are also characterized by relative backwardness. By the
Multi-Sectoral District Development Plan, the relative backwardness of such districts could be
reduced at least to the National level. For this purpose, we have taken most recent National level
official estimates for finding the development deficits in terms of 10 selected indicators. Taking
Five Top Development Prioritie s of Badaun District
• Electrification • Housing • Female Literacy • General Literacy • Female Employment
Generation

v deficit as weight, the indicators representing specific sectors are ranked on a 10 point score scale
in which rank 1 indicates highest deficit. Thus, an indicator is given highest rank if the value of
deficit between the survey result and the estimate for the India is highest. The other indicators
are ranked in descending order according to their value of deficit. In case, the deficit comes
positive (survey result higher than the estimate of the India), the lower rank is assigned to that
indicator which has lower positive value and higher rank is given if the positive value is higher.
Accordingly, the main eight indicators have been ranked to find out that how the priority should
be accorded to different eight indicators in planning the Multi-Sector District Development Plan
of Badaun district. The deficits on eight indicators as identified by the Ministry of Minority
Affairs (MMA) have been calculated by using the latest All India data from the NSSO-2005.
Health related data are from the latest NHFC-3 Survey. The development deficit, thus, worked in
case of Badaun district has been presented in the following table:
Table 1: Development Deficit in key Socio-economic, Basic amenities and Health indicators: Badaun District
S.N
Indicators Survey Results 2008
All India (2005)
Gap between Survey result of the district
and all India
Rank
1. Rate of literacy 40.06 67.30 -27.24 4 2. Rate of female literacy 29 57.10 -28.1 3 3. Work participation rate 26.53 38.00 -11.47 6 4. Female work participation rate 3.71 21.50 -17.79 5 5. Percentage of households with pucca walls 25.67 59.40 -33.73 2 6. Percentage of households with safe drinking water 100.00 87.90 +12.1 8 7. Percentage of households with electricity 12.22 67.90 -55.68 1 8. Percentage of households with water close set latrines 69.00 39.20 +29.8 7 9. Percentage of fully vaccinated children 4.15 43.50 10 Percentage of institutional delivery 3.22 38.70
Though, Badaun district is part of the Western region of Uttar Pradesh, which is
considered to be the most developed part of the Uttar Pradesh, yet striking development gaps
have emerged in the district when compared with National. The followings are gaps which
require proper planning in the Multi-sector Development Plan of the district in order to alleviate
the district at the national and state level:
Electricity: v The present status of electrification in the households of Badaun district is miserably
poor. The baseline survey has shown that only 12 per cent of total rural households are electrified which is quite low in comparison with the National average of 68 per cent. Thus, 56 per cent of total rural households are less electrified in Badaun district as compared with the nation level. On the basis, electrification of rural houses may be accorded highest priority in the Multi-Sectoral Development Plan of the district.

vi
Housing:
v Improvement of housing is the next priority area, which requires intervention in Badaun District. The percentage of households with Pucca walls in total households was 26 percent, which emerged from our household survey in comparison with 59 percent at the all India level, showing a gap of 33 percentage points in the district. Hence, the provision of additional houses on the lines of Indira Awas Yojana (IAY) may be planned in the district as a next priority in the Multi-Sectoral development plan of the district.
Female Literacy:
v The rate of literacy among the females of the district has been found to be 29 per cent thorough the baseline survey while the same was 57 per cent at the all India Level. Thus, 28 per cent females of rural part of the Badaun district were more illiterate as compared with the national average. Therefore, in the Multi-sectoral Development Plan of the district, efforts to increase the female literacy should be given fourth priority.
General Literacy:
v The fact has emerged from the Base-line survey in Badaun district that general literacy rate is lower in the district as compared with the national level literacy rate. It is only 40 per cent in the district as against 67.30 at the national level. Hence, Badaun district is backward in literacy by 27 percentage points than the all India level. Therefore, proper planning is to be made in the Multi-sectoral development Plan of the District to increase the literacy level among the population in general of the Muslims in particular in Badaun district.
Female Work Participation Rate:
v The Base-line data has revealed that the female work participation rate is only 4.06 per cent in district versus 21.50 per cent at the all India level. Thus, it is 17.44 per cent lower in the district as compared with the national average. In our rank analysis, this indicator has got the fifth rank, as far the deficit is concerned. Therefore, availability of job opportunities for the females are to be increased in the district and such programmes which employ largely the women may be accorded due priority in the Multi-Sectoral Development Plan of the district.
Work Participation Rate:
v The people in the district has serious problem of employment. The baseline survey has shown that the work participation rate in the district is 26.53 per cent in comparison with 38 per cent at the national level. Therefore, multi-sectoral development plan of the district must lay greater emphasis on the promotion of employment generating activities in the district.

vii
Suggested Components of Multi-Sector District Development Plan: Badaun District
On the basis of above identified development deficits in Badaun district, it is suggested that the Multi-sector District Development Plan of the district should have the following major components: Ø The extension of electrification at the household level in rural areas of the district should
be given the top most priority. In this context, alternative sources of energy may also be considered.
Ø The condition of housing is generally poor in rural areas of Badaun district. The baseline survey has revealed that Muslims in Badaun district have not been adequately benefited under the Indira Awas Yojana (IAY). In the Multi-sectoral Development Plan, some Muslim families who are below the poverty line may be identified across different tehsils of the district and may be provided housing units on the lines of Indira Awas Yojana.
Ø The enhancement of literacy level among the rural population in general and among minorities in particular needs to be accorded due priority in the Multi-sector Development Plan of the district. It has been found through the baseline survey that a very high proportion of Muslims is still in the district. The literacy among the females is very low. It is also evident that large number of Muslim children falling in the age group of 5-15 years were never enrolled in schools. The aspiration of Muslim parents for the education of their children is also relatively lower. To mitigate this problem, due convergence with the Sarva Shiksha Abhiyan needs to be established in the district. There is also need to carry out a campaign to arouse the feelings of importance of education among the rural masses of the district. The NGOs may also be involved to launch an awareness campaign for this purpose.
Ø It has been found that employment generation is the critical problem in the district. In regard to this, ongoing programme to improve the productivity and diversification in agriculture need to be revitalized. Various non-farm activities are also being carried out in the rural areas of the district. There is a need to identify such activities and plan for their development in the Multi-sectoral Plan of the district. The employment of women should also be given due consideration.
Ø Provision of health care facilities is also the important priority identified through the baseline survey in the district. It has been found that the health care infrastructure in poor in the district. At the Tehsil level accessibility of these health care facilities should be reassessed and planning for the addition of such facilities may be made in the Multi-sectoral Plan of the district. Besides, immunization of children in general and of Minorities in particular, may be planned as a campaign. The involvement of NGOs may also be thought of. The training should also be given to untrained dias in rural areas of the district in order to ensure greater number of safe deliveries.
1
CHAPTER I
OUTLINE OF THE STUDY
1. About the Study: According to the Census of India 2001, minorities constitute 19.5 per cent of the total
population of the country. Out of the total as many as 1381.9 lakhs or 13.4 per cent alone were
Muslims. The only other religious groups of some significance are Christians (2.3 per cent) and
Sikh (1.9 per cent). The others all have a share of below one per cent in the total population. The
dominance of Muslims becomes more prominent if we work out their share in the total minority
population, which comes to almost 79 per cent. In case of Uttar Pradesh the overall share of the
minority community is almost the same as obtained at the National level. But the share of
Muslims is much higher in the total population (18.5 per cent). All other religious communities
have a negligible share in the total population of the State. In fact Muslims in the State account
for around 95 per cent of all the minorities taken together.
With the Minorities forming almost one-fifth of the total population it is but obvious that
they need to be adequately taken care of. The Ministry of Minority Affairs, New Delhi has the
responsibility to chalk out policies and programmes so that those who are disadvantaged among
this group are provided an opportunity for their upliftment. One of the latest efforts in this
direction has been in the form of constituting an expert Committee by the Ministry to identify
those districts, which have a minority concentration and are also relatively backward. The
indicators selected for identification of these districts were as follows:
(a) Religion-Specific Socio-Economic Indicators
(i) Literacy Rate (ii) Female Literacy Rate (iii) Work Participation Rate, and (iv) Female Work Participation Rate
(b) Indicators of Basic Amenities
(i) Percentage of Households with pucca houses (ii) Percentage of Households with safe drinking water (iii) Percentage of Households with electricity, and (iv) Percentage of Households with W/C latrines.
As many as 53 districts were found to have values below the National level average for both
sets of indicators while another 37 had values below the National average for one or the other set of
indicators. Thus a total of 90 districts from all over the country were identified as being backward

2 and having minority concentration. Of these as many as 21 (almost one-fourth) are in U.P. The
Ministry aims at devising suitable policy measures during the Eleventh Plan in order to develop these
districts. The Ministry then identified several institutions in different parts of the country to carry out
a baseline survey of these districts. The task of undertaking this study in the 21 districts of Uttar
Pradesh was entrusted to the Giri Institute of Development Studies, Lucknow.
2. Objectives of the Study:
The main objectives of the study are as follows:
(i) To conduct a gap analysis of availability of infrastructure such as schools, health, ICDS
centers and drinking water supply;
(ii) To find out the gaps in housing and sanitary facilities;
(iii) To identify the income generating activities such as artisan/handicrafts in which villagers
have a comparative advantage;
(iv) To identify the existing gaps in other infrastructural facilities such as roads, ITIs, banking
and marketing facilities which will provide the missing links and act as a catalyst in the
process of development of the district.
3. Methodology and Sample Design:
It was decided that 30 villages would be selected from each district. For village selection the
Tehsils of the district were first grouped into three strata in terms of minority population after
arranging them in descending order of minority population. The first stratum consisted of 20 per cent
of the Tehsils and the second and third stratum constituted 50 and 30 per cent Tehsils respectively.
Tehsil was used for stratification because religion-wise data is available in the 2001 census only upto
the Tehsil level. The number of villages selected from each stratum was directly proportional to the
share of each stratum and were selected as per the probability proportion to size with replacement
method.
Once the villages were identified, house listing was conducted by door-to-door visit in
villages where total population was upto 1200. But in case of villages with higher population the
different hamlets were considered and two hamlets were selected. The first hamlet was the one
where concentration of minority population was highest and the other hamlet was selected randomly.
From each village 30 households were selected by listing the households according to
their religion. Sample selected were in proportion to the population in each religious category
according to the systematic random sampling without replacement method.
In this way our total sample worked out to be as follows: Total number of villages 30 Total number of households 900
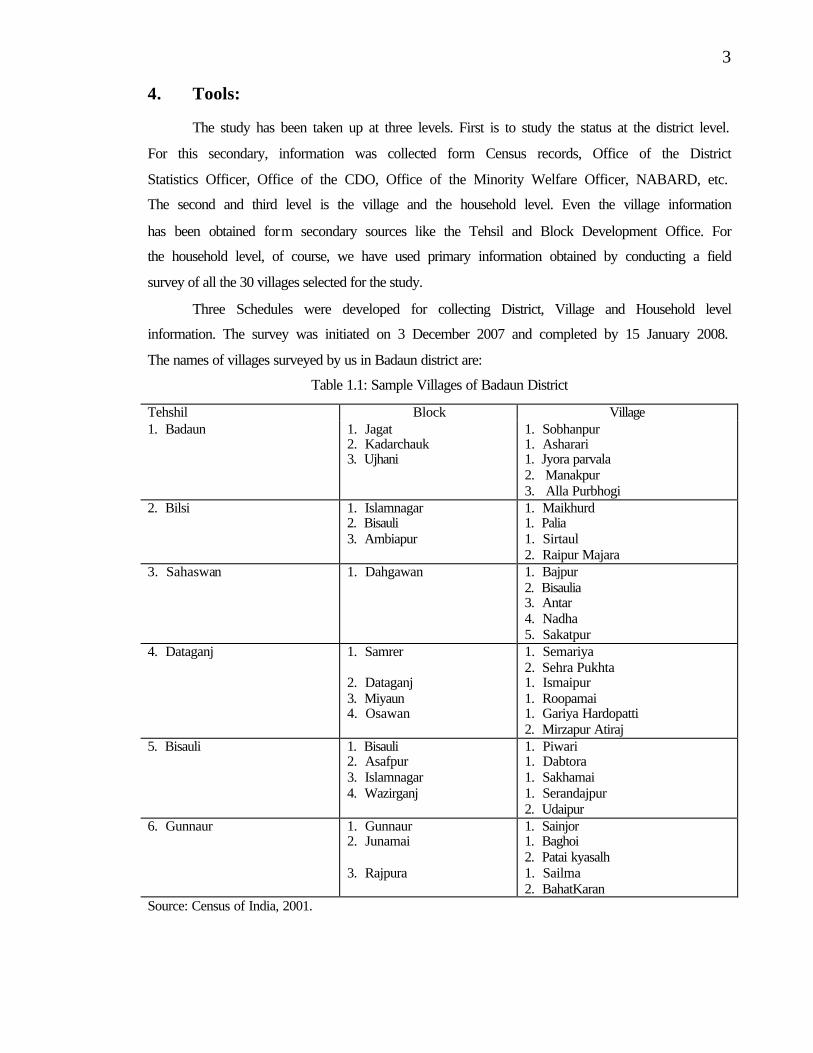
3 4. Tools:
The study has been taken up at three levels. First is to study the status at the district level.
For this secondary, information was collected form Census records, Office of the District
Statistics Officer, Office of the CDO, Office of the Minority Welfare Officer, NABARD, etc.
The second and third level is the village and the household level. Even the village information
has been obtained form secondary sources like the Tehsil and Block Development Office. For
the household level, of course, we have used primary information obtained by conducting a field
survey of all the 30 villages selected for the study.
Three Schedules were developed for collecting District, Village and Household level
information. The survey was initiated on 3 December 2007 and completed by 15 January 2008.
The names of villages surveyed by us in Badaun district are:
Table 1.1: Sample Villages of Badaun District
Tehshil Block Village 1. Badaun 1. Jagat
2. Kadarchauk 3. Ujhani
1. Sobhanpur 1. Asharari 1. Jyora parvala 2. Manakpur 3. Alla Purbhogi
2. Bilsi 1. Islamnagar 2. Bisauli 3. Ambiapur
1. Maikhurd 1. Palia 1. Sirtaul 2. Raipur Majara
3. Sahaswan 1. Dahgawan 1. Bajpur 2. Bisaulia 3. Antar 4. Nadha 5. Sakatpur
4. Dataganj 1. Samrer 2. Dataganj 3. Miyaun 4. Osawan
1. Semariya 2. Sehra Pukhta 1. Ismaipur 1. Roopamai 1. Gariya Hardopatti 2. Mirzapur Atiraj
5. Bisauli 1. Bisauli 2. Asafpur 3. Islamnagar 4. Wazirganj
1. Piwari 1. Dabtora 1. Sakhamai 1. Serandajpur 2. Udaipur
6. Gunnaur 1. Gunnaur 2. Junamai 3. Rajpura
1. Sainjor 1. Baghoi 2. Patai kyasalh 1. Sailma 2. BahatKaran
Source: Census of India, 2001.

4
CHAPTER II
DEVELOPMENT STATUS IN BADAUN DISTRICT 1. Introduction:
Badaun district, with an area of 5168 Sq. Kms., forms part of the Western Region of Uttar
Pradesh, which is the most, developed part of the state. The district is divided into 6 tehsils, 18
blocks and 1782 inhabited villages. The district accounted for 1.85 per cent of the state’s population
during 2001 census. The share of monitories population in total population of the district was higher
(21.9per cent) as compared to the percentage of minority population in the state (19.40 per cent).
Though the district is a part of the developed region of Uttar Pradesh, yet, there may be certain gaps
in the development of different sectors of the district, which may require plans of development in
order to improve the socio-economic conditions of the people in the district. In this chapter, existing
status of socio-economic development of Badaun district has been compared with the state scenario
in order to find the gaps, if any, in the development of the district.
1. Demographic Status:
Badaun district is facing high and increasing population pressure. The population in Badaun
district increased from 24.48 lakh in 1991 to 30.69 lakh in 2001. The decadal growth in population
during 1991-2001 was 25.4 per cent in the district as against 25.88 per cent at the state level during
the same period. The relative population pressure is higher in the district as compared to the state as
evident form population density. Though level of urbanization is quite high in the district but level of
literacy and work participation rate have been lower in the district as compared to the state (Table
2.1). Thus, the population explosion with high density and lower literacy coupled with lower work
participation rate may plunge the Badaun district deeper into poverty and unemployment, if not
checked through comprehensive planning.
Table 2.1: Characteristics of Population in Badaun District and Uttar Pradesh, 2001
Items Badaun District Uttar Pradesh Size of Households 6.51 6.50 Population Growth (1991-2001) in % 25.4 25.88 Density of Population (per Km.) 594 690 Sex Ratio 842 898 Percentage of SC/ST population 1.4 21.15 Percentage of Urban Population 18.16 20.78 Literacy Rate: Male Female Total
38.2 49.0 25.1
68.80 42.20 56.20
Worker Population Ratio (%) 30.00 32.51 Source: Census of India, 2001.

5 2. Demographic Status by Religion:
The classification of population comprising of followers of different religions in Badaun
district shows that the population of Hindus is highest (78.26 Per cent) followed by that of
Muslims (21.33 Per cent) as per 2001 Census. Though, on the parameters of literacy and work
participation rate, Muslims are most backward among all the religious groups in the district. The
position of Hindus is worse off as compared to Jains in literacy achievement and Buddhist and
Christians in work participation. Thus, on two important development parameters of literacy
and work participation, Muslims are at the bottom in Badaun district (Table 2.2).
Table 2.2: Demographic Status by Religion in Badaun District and Uttar Pradesh, 2001
Percentage in total Population Literacy Rate Work Participation Rate Religion Badaun Uttar Pradesh Badaun District Badaun District
Hindu 78.26 80.61 38.9 30.9 Muslim 21.33 18.49 35.3 27.0 Christian 0.11 0.13 72.9 32.0 Sikh 0.09 0.41 72.9 30.9 Buddhist 0.16 0.18 57.1 41.3 Jain 0.02 0.13 94.2 30.6 Others 0.03 0.05 76.4 51.0 Source: Census of India, 2001.
3. Structure and Growth in Employment: Agriculture is the main source of employment in Uttar Pradesh as a whole and in its
constituent districts as well. The data of 2001 Census as placed in table-2.3 showed that the
proportion of main workers employed in agricultural sector have been comparatively higher in
Badaun district than in the state as a whole. The proportion of main workers engaged in
household industries and other activities in the district is lower in state’s comparison. This
situation points to the fact that there has been lesser diversification of workers from agriculture
to other sectors in Badaun district because full time employment could not be created for the
growing workforce in the district.
Table 2. 3: Main Workers in Badaun District and Uttar Pradesh-2001 Census
Category Badaun Uttar Pradesh Cultivators 500921 (65.14) 18479865 (47.03) Agricultural Labour 105449 (13.71) 5956547 (15.16) Total Agricultural Workers 606370 (78.85) 24436412 (62.18) Household Industry 16635 (2.17) 2056944 (5.23) Others 145940 (18.98) 12803228 (32.58) Total 768945 (100.00) 39296584 (100.00) Source: Census of India, 2001.

6 The above observation gets further support from the data presented in table-2.4, which
shows that the growth of main workers as cultivators and agricultural labour in Badaun district
during 1991-2001 has been lowers as compared to the state which indicated that the
marginalization process of workers has been swiftly working in Badaun district. Therefore,
special attention needs to be given to generate full time employment on large scale in Badaun
district.
Table 2.4: Growth in Main Workers in Badaun District and Uttar Pradesh (1991-2001)
Category Badaun Uttar Pradesh Cultivators -8.87 -16.12 Agricultural Labour 22.85 -23.96 Total Agricultural Workers -4.59 -18.17 Household Industry 221.88 106.28 Others 35.72 21.95 Total 2.77 -4.99 Source: Census of India, 2001.
4. Unemployment:
Though the data on the unemployment situation in Badaun district is not available,
however, we have tried to gauge the problem on the basis of data of employment exchange in the
district. The provision of employment through employment exchange has been very dismal in
Badaun district. It is evident from table 2.5 that there has been continuous increase in the
registration of unemployed persons with the employment exchange during 2003-4 to 2004-05.
On an average, 20 thousand persons per year got them registered with the employment exchange
but negligible number of persons got the job. The number of vacancies notified during the
period also showed a declining trend, indicating thereby that the white-collar jobs, which were
already very few, are fast diminishing in Badaun district.
Table 2. 5: Employment through Employment Exchange in Badaun district
Items 2003-04 2004-05 2005-06 Total Number of registration 18903 19125 23334 Registration during the year 6903 4718 8220 Number of Vacancies notified 41 69 34 Number of Persons got employment 1 6 31 Source: Statistical Bulletin, 2006, District Badaun. 5. Land Use Pattern:
On account of high population pressure in Badaun district, around 80 per cent of the
reporting area has been brought under cultivation in the district, which is higher as compared to
the proportion of net cultivated area at the state level (69 per cent). The percentage of area under
forest in the district is quite low (1.33 per cent) in comparison with the forest area at the state

7 level (6.97 per cent). Despite higher proportion of net area sown in the district, cropping
intensity has remained quite low (141 per cent in Badaun district versus 193 per cent in the state)
which indicates that traditional structure of agriculture has not changed much in the district
despite the fact that level of irrigation in the district has been far better than what could be in the
state as a whole (Table 2. 6).
Table 2.6: Land Use Pattern in Badaun District and Uttar Pradesh-2004-05 (Hectare)
Items Badaun Uttar Pradesh Reporting Area 519948
(100.00) 24201292 (100.00)
Forest 6903 (1.33)
1685936 (6.97)
Barren and uncultivable Land 10447 (2.01)
548213 (2.27)
Land put to non-agricultural uses 46441 (8.93)
2594289 (10.71)
Cultural waste land 5612 (1.07)
467557 (1.93)
Pasture and other land under trees, plants etc. 6503 (1.25)
424728 (1.75)
Current and other fallow 29047 (5.58)
1731035 (7.15)
Net Area Sown 414995 (79.81)
16749534 (69.21)
Source: Statistical Bulletin, 2006, District Badaun 6. Irrigation Coverage and Sources: As observed above that the irrigation coverage has been much higher in Badaun district to
the extent that more than 92 per cent of the net area sown in the district has been brought under
irrigation. In this way most of the cultivated land is irrigated in the district. Most important
source of irrigation is tube wells, mostly y the private, through 71.97 per cent of the net areas
sown is irrigated in the district (Table 2.7).
Table 2.7: Sources of Irrigation in Badaun District-2004-05
Source Area Percentage Canal 19 0.005 Tube well 271731 71.97 Well 43356 11.48 Others 62472 16.55 Total 377578 100.00 Source: Statistical Bulletin, 2006, District Badaun 7. Cropping Pattern:
The agriculture in Badaun district is less diversified as compared to the level of
agricultural diversification at the state level. The percentage of area put to the cultivation of food

8 crops is higher in the district than the state. The opposite is the case of cultivation of oilseeds and
other commercial crops. Surprisingly, percentage of total area put for sugarcane cultivation is
less than what is at the state level (Table 2.8). Table 2.8: Area under Principal Crops in Badaun District and Uttar Pradesh-2004-05
Crop Badaun District Uttar Pradesh Cereals (81.21) 73.92 Pulses (5.99) 11.87 Total Food grains (87.20) 85.79 Oilseeds (3.19) 3.80 Sugarcane (2.78) 8.44 Potato (2.81) 1.83 Others (4.01) 0.14 Source: Statistical Bulletin, 2006, District Badaun 8. Productivity of Major Crops: The productivity of two major crops viz. rice and wheat is lower in the district than what
is at the state level. However, in case of pulses, oilseeds and other main cash crops like
sugarcane, yield levels are higher in the district in comparison with the state. Therefore,
concerted efforts are required to increase the productivity of food crops in the district, which will
provide increased income to the farmers (Table 2.9).
Table 2.9: Productivity of Major Crops in Badaun District and Uttar Pradesh-2004-05
(quintal/hectare) Crop Badaun District Uttar Pradesh Rice 15.73 18.13 Wheat 24.97 25.00 Barley 21.14 19.75 Maize 15.22 15.53 Urd 6.04 3.88 Moong 3.01 4.56 Arhar 9.74 9.62 Mustard 10.77 9.92 Groundnut 8.23 8.23 Sugarcane 632.48 608.07 Potato 224.85 223.83 Source: Statistical Bulletin, 2006, District Badaun
9. Livestock:
It is evident from the table 2.10 that the district has sizeable number of livestock specially
the milch animals, which offers great potential to develop dairy and its related activities in the
district.

9
Table 2.10: Livestock in Badaun District-2004-05
Type of animal Number Per 100 hectare of net area sown Drought Animals : Bullock Buffaloes
65554 68555
20 21
Milch Animals: Cows Buffaloes
78705 222160
24 68
Young Stock: Cattle Buffaloes
94815 194769
29 59
Others: Sheep Goats Horse Pigs Other animal
11141 231831 8871
29544 3528
1 51 4 7 0
Total Livestock 933112 284 Poultry 183300 56 Source: Statistical Bulletin, 2006, District Badaun. 10. Industrial Development:
The industrial development in Badaun district has been lackluster as yet. It is evident
from table 2.11 that number of registered factories per lakh of population by 2005-06 were
around 1.11 only and out of these only 13 factories were in operation and remaining were closed.
The working factories provided employment to 21 persons and produced out put to the tune of
rupees 4 lakh on per lakh of population. The development of Khadi and village industries was
also very much tardy in the district. There were just 3905 small scale, 652 Khadi and village
industries per lakh of population in 2005-06. The employment in each of these units was only 15
persons per lakh of population. The number of industrial estates was reported to be 10 in the
district but their existing status in terms of number of different working units could not be
available.
Table 2.11: Industria l Development in Badaun District (2006-07)
Registered Factories: Total Units Number of units working Average daily workers/employed Value of Production
34 21
2608 8126715
Per lakh of population
1.11 0.68 85
264763
Khadi and Small scale units: Small scale units Employment in small scale units Khadi and Village Industries Employment in Khadi and Village Industries
3905 28483 652 ---
127.22 927.95 21.24
Number of industrial estates 5 0.16 Source: Statistical Bulletin, 2006, District Badaun

10 11. Economic Infrastructure Development: Gaps in the development of important infrastructure in Badaun district are evident when
compared with the state level situation (Table 2.12). For example, average length of national
highways was zero and the length of other district roads per lakh of population was lesser in the
district as compared to the state as a whole. Per capita consumption of electricity was lower (120
kW) in Badaun district versus state as whole (168 kW). However, Badaun district is better placed in
terms of having larger number of post offices and telephone connections and higher credit-deposit
ratio as compared to the state as whole despite the fact that number of nationalized bank offices per
lakh of population was lower in the district than the state average.
Table 2.12: Economic Infrastructure Indicators in Badaun District and Uttar Pradesh
Sl. No. Items Badaun Uttar Pradesh 1. Length of National highways per lakh of population (2004-05) 0 2.43 2. Length of state level per lakh of population (2004-5) 9.74 5.34 3. Length of other district road per lakes of population (2004-05) 3.20 65.34 4. Per capita consumption of electricity (2004-5) 86 168.11 5. Number of post offices per lakh of population (2004-5) 323 10.62 7. Number of telephone connections per lakh of population (2004-05) 736 1679 9. Bank offices per lakh of population (2004-05) 2.19 5.00 Credit Deposit ratio (2004-05) 66 42.03
Source: 1. Statistical Diary, Uttar Pradesh, 2006. 2. Statistical Bulletin, 2006, District Badaun.
12. Rural Infrastructure:
In case of vital rural infrastructure, Badaun district is also not better placed when
compared with the U.P. State as a whole (Table 2.13). Only the number of rural go-downs,
fertilizer stores, cold storages, agro service centres agro service regulated markets and rural
banks are relatively higher in the district.
Table 2.13: Rural Infrastructure in Badaun District and Uttar Pradesh (2005-06) Items Badaun Uttar Pradesh
Percentage of villages connected with all weather roads 47 71 Percentage of villages electrified in total villages 58 71 Number of Rural Go downs per lakh of net area sown 241 91 Number of Seed Stores per lakh of net area sown 87 91 Number of Fertilizer Stores per lakh of net area sown 249 172 Number of Pesticides Stores per lakh of net area sown 77 66 Number of Tractors per lakh of net area sown 3582 4346 Number of Cold Storage per lakh of net area sown 15 7 Number of Agro Service Centres per lakh of net area sown 157 48 Number of Regulated Markets per lakh of net area sown 3 2 Number of Rural Banks per lakh of population 13 3 Number of Veterinary Centres per lakh of livestock 3 4 Number of Animal Service Centres per lakh of livestock 3 4 Source: 1. Statistical Diary, Uttar Pradesh, 2006. 2. Statistical Bulletin, 2006, District Badaun.

11 13. Educational Infrastructure:
Educational infrastructure particularly of basic education is getting spread across all the
districts of Uttar Pradesh under the Sarva Shiksha Abhiyan. But it is still lower to that of state
level (Table 2.14). Some serious pitfalls like higher teacher-students ratio in primary and senior
basic schools during 2004-05 were evident in the district, when compared with the state level
situation. However, such gaps will be minimized as the process of recruitment of additional
teachers is being done in every district of the state
Table 2.14: Educational Infrastructure in Badaun District and Uttar Pradesh, 2004-05
Items Badaun Uttar Pradesh Number of primary schools per lakh of population 73 78 Number of secondary schools per lakh of population 21 22 Number of higher secondary schools per lakh of population 5 8 Number of degree colleges per lakh of population .33 .86 Number of primary schools per 100 sq. km. 43 54 Number of secondary schools per 100 sq. km. 12 15 Teacher Student ratio in primary schools 110 57 Teacher Student ratio in senior basic schools 77 37 Source: 1. Statistical Diary, Uttar Pradesh, 2006. 2. Statistical Bulletin, 2006, District Badaun. 14. Health Infrastructure: The status of health infrastructure in Badaun district is not as developed as it is at the state
level (Table2.15). Thus, all the major health infrastructure is to be increased in the rural areas of
the district.
Table 2.15: Health Infrastructure in Badaun District and Uttar Pradesh, 2005-06
Items Badaun Uttar Pradesh Number of allopathic hospitals per lakh of population 0.75 3.50 Number of beds in allopathic hospitals per lakh of population 29 35.0 Number of Ayurvedic/Unani hospitals per lakh of population 1.11 1.42 Number of beds in Unani/Unani hospitals per lakh of population 1.14 6.55 Number of primary health centers per lakh of population 0.59 2.44 Number of child/women welfare centers per lakh of population 10.46 12.72 Source: 1. Statistical Diary, Uttar Pradesh, 2006. 2. Statistical Bulletin, 2006, District Badaun. 15. Housing in Badaun District:
The Census 2001 data has revealed that the proportion of permanent houses in total houses in
Badaun district was 64.40 per cent while the same was 53.40 per cent in the state as a whole.
However, in case of other type of houses, situation in Badaun district was opposite to that of state’s
situation (Table 2.16).

12 It is also evident that majority of houses are of smaller size in the district; having one or
two rooms. The proportion of houses with three or more rooms is relatively higher in the district
as compared to the state.
Table 2.16: Housing Conditions in Badaun District and Uttar Pradesh
Item Badaun District Uttar Pradesh Type of Houses Permanent 64.40 53.40 Semi-Permanent 21.90 25.60 Serviceable 11.40 16.90 Non- Serviceable 2.30 4.10 Number of Dwelling Rooms One Room 40.30 29.60 Two Rooms 34.20 31.20 Three Rooms 12.50 16.8 Four Rooms 6.80 9.6 Five Rooms & Above 4.80 10.5 No Exclusive Room 1.40 2.3 Source: Census 2001.
16. Sources of Drinking Water:
As evident from 2001 Census, Badaun district was better placed in terms of availability
of safe drinking water as taps and hand pumps/tube wells, which are considered as safe sources
of drinking water; were the main sources of drinking water in the district (Table 2.17).
Table 2.17: Sources of Drinking Water in Badaun District and Uttar Pradesh
Source Badaun District Uttar Pradesh Tap 27.72 23.60 Hand pump/Tube well 70.59 64.1 Well 1.02 11.6 River/ Canal 0.01 0.10 Any other 0.66 0.60 Source: Census 2001. 17. Sources of Cooking Fuel: Fire wood, Cow dung cake, and crop residue were reported to be the major sources of
cooking fuel in Badaun district. The use of modern means of cooking (LPG) was much lower in
Badaun district as compared to the state as a whole (Table 2.18).
Table 2.18: Sources of Cooking in Badaun District and Uttar Pradesh
Source Badaun District Uttar Pradesh Firewood 35.60 44.3 Crop residue 22.26 13.7 Cow- dung cake 35.52 27.3 Kerosene 1.12 2.30 LPG 5.21 11.3 Any other 0.29 1.10 Source: Census 2001.

13 18. Income and Poverty Level:
The per capita income and poverty level are the indicators of overall development. The
per capita income at 1993-94 and current prices during the year 2003-04 was found to be lower
in Badaun district than the state level per capita income. The percentage of rural BPL households
was slightly higher in the district as compared to the state. It implies that the economic condition
of people living in rural areas of the district is certainly poor in comparison with the people of
rural areas in Uttar Pradesh as a whole (Table 2.19).
Table 2.19: Income and Poverty in Badaun District and Uttar Pradesh
Details Badaun District Uttar Pradesh Per capita income at 1993-94 prices (2003-04) 5224 5975 Per capita income at current prices (2003-04) 9766 10637 Total number of rural households (BPL census 2002) 5577734 24026176 Total Rural Population (BPL census 2002) 2250390 127191122 Total number of BPL households (BPL census 2002) 163932 9956384 Total number of BPL population (BPL census 2002) 275409 49606616 Percentage of BPL households 28.37 27.50 Source: 1. Statistical Diary, Uttar Pradesh, 2006. 2. Statistical Bulletin, 2006, District Badaun.
14
CHAPTER III
DEVELOPMENT STATUS AT THE VILLAGE LEVEL
1. Introduction:
As mentioned earlier that a survey was conducted in 30 selected villages of Barielly district.
The detailed information regarding the status of development including various facilities and
amenities was obtained from various sources regarding the sample villages. In this chapter, analysis
of village level information has been made as under:
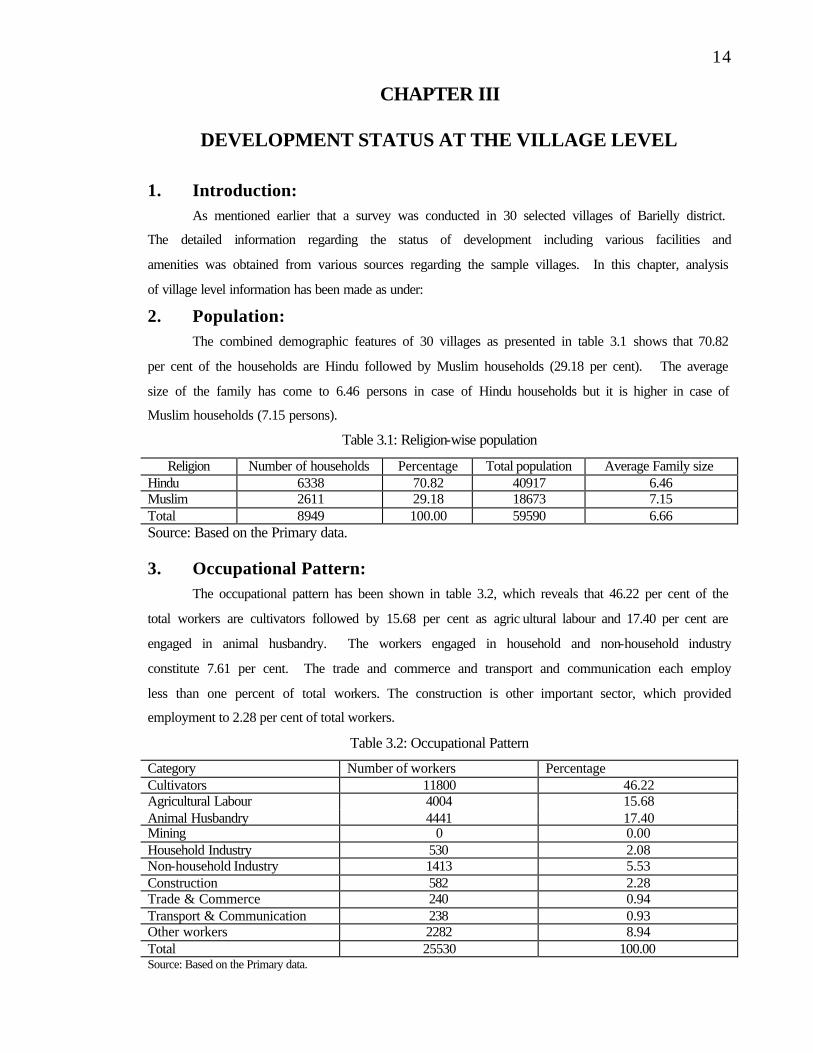
2. Population:
The combined demographic features of 30 villages as presented in table 3.1 shows that 70.82
per cent of the households are Hindu followed by Muslim households (29.18 per cent). The average
size of the family has come to 6.46 persons in case of Hindu households but it is higher in case of
Muslim households (7.15 persons).
Table 3.1: Religion-wise population
Religion Number of households Percentage Total population Average Family size Hindu 6338 70.82 40917 6.46 Muslim 2611 29.18 18673 7.15 Total 8949 100.00 59590 6.66 Source: Based on the Primary data. 3. Occupational Pattern:
The occupational pattern has been shown in table 3.2, which reveals that 46.22 per cent of the
total workers are cultivators followed by 15.68 per cent as agric ultural labour and 17.40 per cent are
engaged in animal husbandry. The workers engaged in household and non-household industry
constitute 7.61 per cent. The trade and commerce and transport and communication each employ
less than one percent of total workers. The construction is other important sector, which provided
employment to 2.28 per cent of total workers.
Table 3.2: Occupational Pattern
Category Number of workers Percentage Cultivators 11800 46.22 Agricultural Labour 4004 15.68 Animal Husbandry 4441 17.40 Mining 0 0.00 Household Industry 530 2.08 Non-household Industry 1413 5.53 Construction 582 2.28 Trade & Commerce 240 0.94 Transport & Communication 238 0.93 Other workers 2282 8.94 Total 25530 100.00 Source: Based on the Primary data.

15 4. Land use Pattern: The land use pattern shows that more than 89.72 per cent of the reported area has been brought
under cultivation. Forest area is absent. . The area under pasture/grazing, orchards and fallows is
around two per cent. The details of land use pattern have been shown in table 3.3.
Table 3.3: Land Use Pattern
Item Area Percentage 1. Total reporting area (Acres) 18174 100.00 2. Forest 0 0.00 3. Uncultivable land 873 4.80 4. Non-agricultural uses 997 5.49 5. Cultivable Waste 198 1.09 6. Pasture/Grazing 11 0.06 7. Orchards 359 1.98 8. Other Fallow 167 0.92 9. Current Fallow 216 1.19 10. Net Area Sown 16305 89.72 11. Area Sown More Than once 17611 Source: Based on the Primary data. 5. Sources of Irrigation:
The sources of irrigation has been shown in table 3.4 which indicates that maximum
53.41 per cent of total irrigated area is being irrigated through other sources which included
canal, wells etc. Followed by the private tube wells, which irrigated 42.62 per cent of total
irrigated areas in Badaun district. The contribution of government tube wells is 3.97 per cent.
Table 3.4: Sources of Irrigation
Source Percentage of Irrigated Area Canal 0.00 Tube well (Govt.) 3.97 Tube well (private) 42.62 Hand pump 0.00 Wells 0.00 Ponds, etc. 0.00 Other 53.41 Source: Based on the Primary data. 6. Roads and Electricity: Out of total 30 villages surveyed by us, 60 per cent has connectivity with all weather
roads. 53.33 of the total villages have Kharanja roads and kutcha-pucca roads are only in 3.33
per cent of total villages. The average distance of all the sample villages from the main road
comes to 3.13 kms.
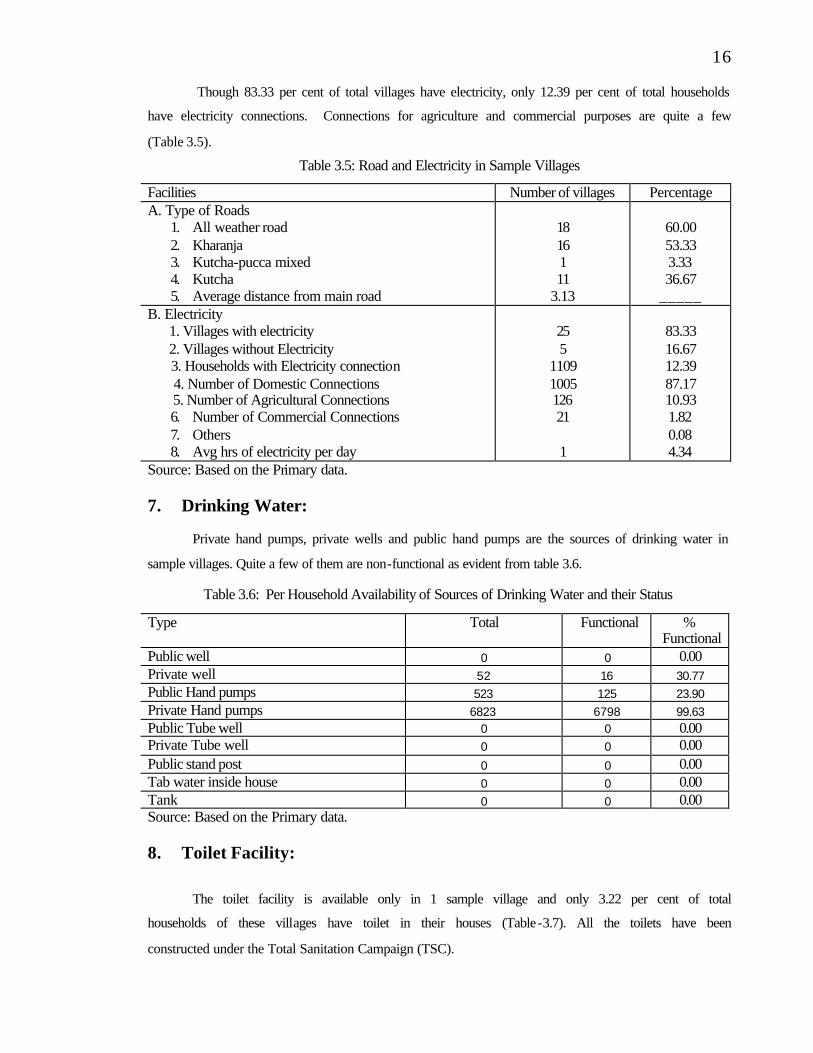
16 Though 83.33 per cent of total villages have electricity, only 12.39 per cent of total households
have electricity connections. Connections for agriculture and commercial purposes are quite a few
(Table 3.5).
Table 3.5: Road and Electricity in Sample Villages
Facilities Number of villages Percentage A. Type of Roads
1. All weather road 2. Kharanja 3. Kutcha-pucca mixed 4. Kutcha 5. Average distance from main road
18 16 1 11
3.13
60.00 53.33 3.33 36.67
_____ B. Electricity 1. Villages with electricity 2. Villages without Electricity 3. Households with Electricity connection 4. Number of Domestic Connections 5. Number of Agricultural Connections
6. Number of Commercial Connections 7. Others 8. Avg hrs of electricity per day
25 5
1109 1005 126 21 1
83.33 16.67 12.39 87.17 10.93 1.82 0.08 4.34
Source: Based on the Primary data. 7. Drinking Water:
Private hand pumps, private wells and public hand pumps are the sources of drinking water in
sample villages. Quite a few of them are non-functional as evident from table 3.6.
Table 3.6: Per Household Availability of Sources of Drinking Water and their Status
Type Total Functional % Functional
Public well 0 0 0.00 Private well 52 16 30.77 Public Hand pumps 523 125 23.90 Private Hand pumps 6823 6798 99.63 Public Tube well 0 0 0.00 Private Tube well 0 0 0.00 Public stand post 0 0 0.00 Tab water inside house 0 0 0.00 Tank 0 0 0.00 Source: Based on the Primary data. 8. Toilet Facility:
The toilet facility is available only in 1 sample village and only 3.22 per cent of total
households of these villages have toilet in their houses (Table-3.7). All the toilets have been
constructed under the Total Sanitation Campaign (TSC).

17
Table 3.7: Toilet Facility
Number of Villages 1
Toilet Facility Yes No 29
If, yes, then type Private Toilet Facility (Households) Total Sanitation Campaign
288 288
Source: Based on the Primary data. 9. Educational Facility: 29 out of 30 sample villages have primary schools within the village. The average
distance of primary schools from village is less than 1 Km. and students generally use pucca
road to reach primary schools. 15 out of 30 villages have middle schools with in their villages
and in case of 6 villages’ schools are located within their panchayats. The location of most of the
higher secondary schools both for the boys and girls is with in the respective blocks and students
cover on an average 4.9 Kms to reach their schools from their villages (Table 3.8). The status of
educational facilities has been presented in the following table 8.
Table 3.8: Educational Facility
Place Type of road Type Within
Village Within Block
Within Panchayat
Within District
Distance (average)
(kms) Pucca Semi
Pucca Kutcha Kutcha
Pucca Mix Primary School 29 0 1 0 0.1 18 1 1 1 Middle School 15 8 6 1 1.3 17 1 1 5 High/Higher Secondary (Boys) 2 21 2 5 4.9 17 3 0 10 High/Higher Secondary (Girls) 3 15 1 11 7.4 17 3 0 10 Religious School 1 2 0 27 15.4 18 3 0 9 Non Formal Education Centre 1 0 0 29 16.6 18 2 0 9 Others 2 0 0 28 27.3 18 3 0 8 Place code: 1. Within village, 2. within block, 3. within panchayat, 4. within district. Road code: 1. Pucca, 2. Semi-pucca, 3. Kutcha, 4. Kutcha-pucca mix Source: Based on the Primary data. 10. Students Enrollments: The average enrollment of boys and girls in class-I to class-V in the entire sample schools
considered to gather has been shown in table 3.9. The enrollment seems to be lower in all the
classes in view of the fact that each primary school average number of teachers should be 5 and
the teacher-student’s ratio should be 40.

18
Table 3. 9: School Enrollment Class Boys Girls Class I 27 25 Class II 29 24 Class III 29 24 Class IV 25 20 Class V 18 17 Source: Based on the Primary data. 11. Physical Structure of Schools:
All schools in the sample villages have own buildings except one school. The structure is mostly
pucca and made of cement, stone and tiles. The condition of school buildings has been reported to be
good and satisfactory in most cases. The classes are held in the classrooms in 23 sample schools. While
rest use verandah and open space for the classes. Most of the schools have useable blackboard and play
ground. Tat-Patti is provided for seating in majority of schools. The average number of teachers in each
primary school is 3 (Table 3.10).
Table 3.10: Physical Structure of Schools Details Number Schools with buildings Yes No Total
29 1 30
Type of Structure 1. Katcha/thatch 2. Katcha/tile 3. Semi pucca 4. Pucca
1 0 2 26
Main Flooring Materials 1. Mud 2. Brick 3. Cement, stone, tile 4. others
2 3 24 0
Condition of Building 1. Good 2. Satisfactory 3. Poor 4. Very bad
11 15 3 0
Where classes normally held 1. in the class room 2. In the Verandah 3. Open space
23 5 1
Does the school have useable blackboard Yes No
29 0
Does the school have playground Yes No
19 12
Seating facility provided to students 1. Tat-patti 2. Desk
29 0
How may teachers are currently teaching classes (1-5) 3 Source: Based on the Primary data.

19 12. Private Schools and Preferences of the People for Schools:
There are 11 private schools in 30 sample villages. The group discussion with the people
in sample villages has revealed that in 6 villages’ people prefer government schools over private
and other type of schools for the education of their children (Table 3.11).
Table 3.11: Private schools and Preferences of the People for Schools
Number of schools within the village 11 Up to the class level 12 No. of students enrolled 1335 Preference of the schools
1. Government 2. Private 3. Both
6 5 8
Source: Based on the Primary data. 13. Health Facility: It has been reported that the facility of medical sub center is available only in 5 villages
out of 30 sample villages. This facility is available to 11 villages in their respective blocks. None
of the sample village has the Primary Health Center (PHC). The people of 27 and 3 villages have
to travel within their blocks and district respectively to get the facility of Primary Health Center.
On the whole, health facilities are generally available at block or district level to the rural people
of the district. The rural people have to travel more around 10 kilometers from their villages to
get the major health facilities. The structure of approach roads on which the rural people
generally travel to get the medical facilities is good (Table 3.12).
Table 3.12: Health Facilities
Type of health Facility
With
in
Vill
age
With
in
Blo
ck
With
in
Pan
chay
at
With
in
Dis
tric
t A
vera
ge
Dis
tanc
e (K
ms)
Puc
ca
Sem
i P
ucca
Kut
cha
Kut
cha
Puc
ca M
ix
Sub-center 5 11 7 7 3.33 18 1 1 9 PHC 0 27 0 3 9.03 17 2 0 11 CHC 0 15 0 15 13.67 17 2 0 11 Hospital/Dispensary 0 20 0 10 11.37 17 2 0 11 Private Qualified Allopathic Doctors 2 21 2 5 7.70 17 2 0 10 Child Care Center 1 21 3 5 9.33 17 2 0 11 Family Planning Clinic 1 21 3 5 9.03 17 2 0 11 Chemist/Medicine Shop 3 19 5 3 4.97 17 2 0 9 Code: 1-Within village, 2-Within block, 3-within panchayat, 4-within district. Source: Based on the Primary data.

20 14. Facilities at PHC/Sub centre: Most of the medical facilities are available at the Primary Health Centres. However, at
majority of sub-centers important medical facilities are lacking (Table 3.13).
Table 3.13: Facilities at the Sub-centre or PHC
Facilities Sub-Centers PHC ANM 20 30 Medicines 15 30 Doctor 9 30 Regular Checkup 3 30 Pathological Tests 1 29 X-Ray 1 21 Beds 2 15 Any Other 2 10 Source: Based on the Primary data. 15. Frequency of Visit of Health Staff in Villages:
The frequency of visits of health staff in the villages has been shown in table 3.14. It has
become evident that the frequencies of visit of important medical staff like medical officer, ANM etc.
are not weekly in most of the villages.
Table 3.14: Frequency of Visit of Health Staff in Villages
Type of staff Frequency Weekly monthly Quarterly Hal0f Yearly Rarely
Medical Officer 1 11 5 0 13 Lady Health Visitor 3 5 1 0 21 ANM 11 17 2 0 Malaria Inspector 3 1 1 0 25 Health Educator 3 3 2 0 22 Vaccinator 7 14 1 0 8 ASHA 24 2 4 0 0 Others 1 9 0 0 20 Source: Based on the Primary data. 16. The Condition of PHCs: The buildings of the PHCs have been reported to satisfactory in case of 3 PHCs out of 5
PHCs and poor in 2PHCs. The availability of doctors and medicines is inadequate (Table 3.15).

21
Table 3.15: Conditions of PHC/sub-center in the village (put number of villages)
Buildings 1. Good 2. Satisfactory 3. Poor 4. Very bad
0 3 2 0
Doctor 1. Available daily 2. Available sometimes 3. Available rarely
0 2 3
Medicines 1. Available regularly 2. Occasional problems 3. Constant problems
2 0 3
17. Aanganwadi/ICDS Centres: Out of 28 ICDS centres, 26 are located in government buildings and 3 are located in
private buildings owned by the Aanganwadi workers. The condition of most of the buildings has
been reported to be good and satisfactory. It was found from the record of the/ICDS centres that
on average 923 mothers and 2360 children visited these centers during the last month. Visit of
the ICDS supervisor is reported to be irregular in majority of cases (Table 3.16).
Table 3.16: Details of Aanganwadi/ICDS Centers in Sample Villages
Details Number Place of House where located
1. Govt. Building 2. Private Building
26 2
If Pvt. Building then whose house located 1. Mukhiya House 2. Sarpanch 3. Other PRI representative 4. Aanganwadi workers 5. Others
0 0 0 2 0
Condition of Buildings 1. Good 2. Satisfactory 3. Poor 4. Bad
11 14 3
Number of Mothers and Children visited/benefited during the last one month 1. Mother 2. Children
923
2360 Does the ICDS supervisor visit the center
1. Yes 2. No
If yes the: 1. Weekly 2. Monthly 3. Quarterly
21 7 1
14 6
Source: Based on the Primary data.

22 18. Private Medical Facilities:
The private doctors are available in 21 villages out of 30 villages. However, only in 2
villages and 1 village, Allopathic and Ayurvedic doctors are available. In rest the villages, Jhola
type doctors are there. In this way, condition of medical services is very poor in the villages of
Badaun district and people are main depending on Jhola type doctors for their medical needs
(Table 3.17).
Table 3.17: Private Medical Facilities (put number of villages)
Items Number of villages Availability of doctor Yes No
21 9
Type of doctor Allopathic Homeopathic Unani Ayurvedic Jhola type
2 0 0 1
19 Source: Based on the Primary data 19. Public Distribution System It has been reported that PDS shops are located in 24 villages. The BPL cardholders are
around 50 percent in all the cardholders. The supply has been reported to be irregular in majority
of villages (Table 3.18).
Table 3.18: Public Distribution System in the Villages
PDS in the Village 1. Yes 2. No
If yes, the how many shops in the village If no, then distance
24 6
26 0.6 kms
Number of ration card 9820 Type of card
1. Annapurna 2. Antodya 3. BPL 4. APL
0
849 1487 7484
Is supply regular Foodgrain
1. yes 2. No.
Sugar 1. Yes 2. No
Kerosene oil 1. Yes 2. No
26 4
27 3
27 3
Source: Based on the Primary data.
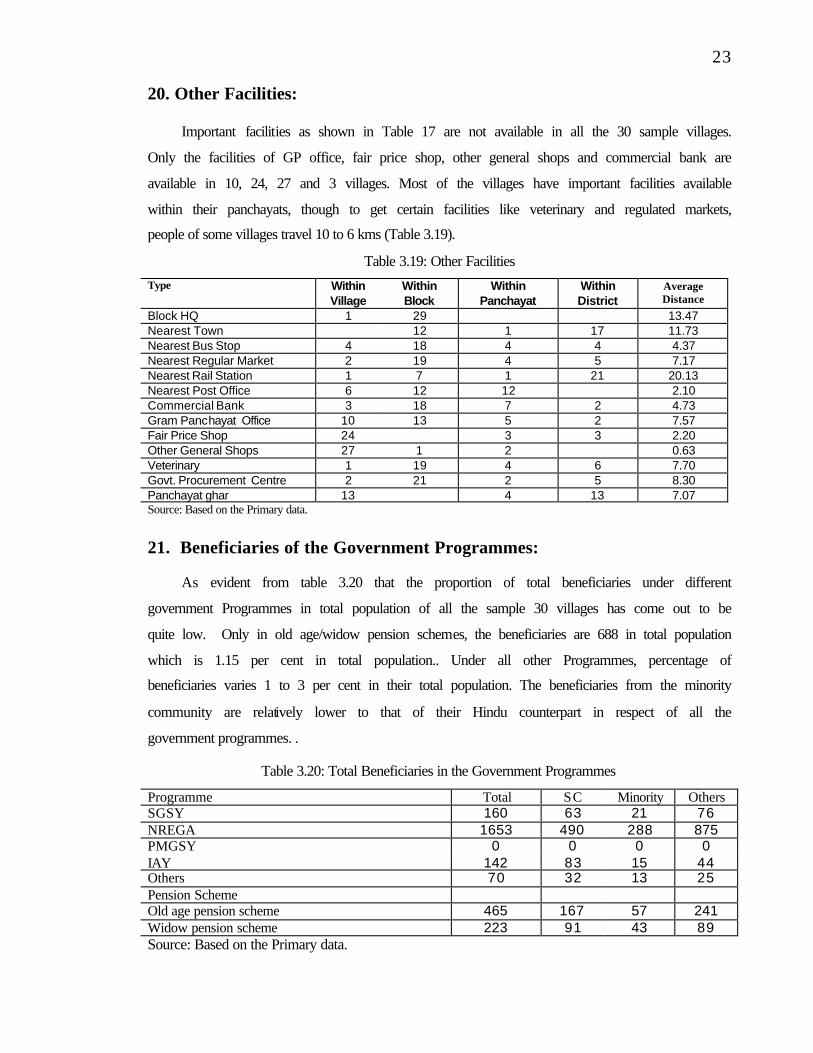
23 20. Other Facilities:
Important facilities as shown in Table 17 are not available in all the 30 sample villages.
Only the facilities of GP office, fair price shop, other general shops and commercial bank are
available in 10, 24, 27 and 3 villages. Most of the villages have important facilities available
within their panchayats, though to get certain facilities like veterinary and regulated markets,
people of some villages travel 10 to 6 kms (Table 3.19).
Table 3.19: Other Facilities
Type Within Village
Within Block
Within Panchayat
Within District
Average Distance
Block HQ 1 29 13.47 Nearest Town 12 1 17 11.73 Nearest Bus Stop 4 18 4 4 4.37 Nearest Regular Market 2 19 4 5 7.17 Nearest Rail Station 1 7 1 21 20.13 Nearest Post Office 6 12 12 2.10 Commercial Bank 3 18 7 2 4.73 Gram Panchayat Office 10 13 5 2 7.57 Fair Price Shop 24 3 3 2.20 Other General Shops 27 1 2 0.63 Veterinary 1 19 4 6 7.70 Govt. Procurement Centre 2 21 2 5 8.30 Panchayat ghar 13 4 13 7.07 Source: Based on the Primary data.
21. Beneficiaries of the Government Programmes: As evident from table 3.20 that the proportion of total beneficiaries under different
government Programmes in total population of all the sample 30 villages has come out to be
quite low. Only in old age/widow pension schemes, the beneficiaries are 688 in total population
which is 1.15 per cent in total population.. Under all other Programmes, percentage of
beneficiaries varies 1 to 3 per cent in their total population. The beneficiaries from the minority
community are relatively lower to that of their Hindu counterpart in respect of all the
government programmes. .
Table 3.20: Total Beneficiaries in the Government Programmes
Programme Total SC Minority Others SGSY 160 63 21 76 NREGA 1653 490 288 875 PMGSY 0 0 0 0 IAY 142 83 15 44 Others 70 32 13 25 Pension Scheme Old age pension scheme 465 167 57 241 Widow pension scheme 223 91 43 89 Source: Based on the Primary data.

24 22. Village Organizations: The type of village organizations reported to be in the sample villages have been shown in
table 3.21. Most of such organizations are related with agricultural activities. Large number of
them has non-functional too.
Table 3.21: Village Organization Organization Functional Non-
Functional Average number of
members 1. Cooperatives i. Credit 17 13 58 ii. Agricultural Inputs 25 5 84 iii. Production of Khadi 14 16 0 iv. Marketing 14 16 2 v. Dairy Coop 16 14 1 vi. Others 5 25 0 2. Workers organizations/unions 14 16 2 3. Farmers organization 15 15 4 4. Voluntary Organizations 13 17 0 5. Religious/Caste organizations 20 10 8 6. Political Organizations 15 15 2 7. Cultural Organizations 14 16 1 8. Youth Mandal 15 15 1 9. Women Mundal 18 12 3 10. Flood Relief Village Security Force 14 16 0 11. Others 4 26 1

25
CHAPTER IV
DEVELOPMENT STATUS AT THE HOUSEHOLD LEVEL
As mentioned earlier that a household survey was conducted in Badaun district, covering
nine hundred households. The objective was to find out the major socio-economic disparities
between minorities versus non-minorities and to identify the gaps in various infrastructural facilities
and amenities between the two groups at the household level. The exercise would be useful in
planning for bridging the gap that is perceived to be between the minorities and non-minorities in
Badaun district in particular and Uttar Pradesh in general. The following are the findings of analysis
based on the primary data.
1. Religion-wise Composition of Households:
In the nine hundred households surveyed in Badaun district, the representation of Hindu
households was 63.22 percent, followed by 36.78 percent of the Muslim households (Table 4.1).
In this way, the survey covered Hindu and Muslim households on the pattern of their
representation in the population of the district as evident from the Census of 2001.
Table 4.1: Composition of Different Religious Groups in the Sample
Religion Number of Households Percentages
Hindu 569 63.22 Muslim 331 36.78 All Religions 900 100.00 Source: Primary data based.
2. Family Size: It is evident from table 4.2 that average size of the family is highest among Muslims (6.31
persons) followed by Hindus (5.53 persons). It is also evident that 19 per cent of the Muslim
households have 7-9 persons as compared to 10 per cent of Hindu households. Thus, the analysis has
shown that the average size of the family is not only highest among the Muslim households but the
proportion of Muslim households with larger family size (7 persons and above) is relatively higher
also as compared to Hindu households in Badaun district.
Table 4.2: Family Size in Different Religious Groups
Religion Below 3 Persons
3 to 5 Persons
5 to 7 Persons
7 to 9 Persons
9 and above Persons
Total Persons
Average HH Size
Hindu 82 210 206 56 15 569 5.53 Muslim 40 72 129 64 26 331 6.31 Total 122 282 335 120 41 900 5.81 Note: Figures in brackets indicate percentages. Source: Primary data based.

26 3. Populations and Sex Ratio: The composition of male and female population in total population across different religious
groups (Table 4.3) indicates that the share of male population is higher in comparison with their
female population among Hindus as well as Muslims in the district. The impact of varying
proportion of males and females among different religious groups is evident in their sex ratios. The
table indicates shows that the Muslim has relatively lower number of females per thousand of males
in comparison with Hindus though situation remains generally otherwise. On the whole, it is
apparent that Badaun district has considerably lower sex ratio in its rural areas.
Table 4.3: Population and Sex Ratio among Different Religious Groups
Religion Male Percent Female Percent Total Percent Hindu 1760 55.96 1385 44.04 3145 100.00 Muslim 1182 56.64 905 43.36 2087 100.00 Total 2942 56.24 2290 43.73 5232 100.00 Note: Figures in brackets indicate percentages. Source: Primary data based.
3. Classification of Population by Age: The distribution of total population in different age groups as presented in table 4.4 shows
that 17 per cent of the total population of Hindus in rural areas of Badaun district is in the younger
age group of up to 45 years compared to 16 per cent in Muslims. The average age is 22 years in case
of Hindus as well as Muslims.
Table 4.4: Classification of Population by Age among Different Religious Groups
Religion Below 15 Years
15-30 Years
30-45 Years
45-60 Years
60 and above Years
Total Years
Average Age
Hindu 1492 775 526 268 84 3145 21.92 Muslim 997 546 303 186 55 2087 21.54 Total 2489 1321 829 454 139 5232 21.77 Note: Figures in brackets indicate percentages. Source: Primary data based.
5. Education: It reflects from the table 4.5 that more than half (59.94 per cent) of the rural population of
Badaun district is still illiterate. The illiteracy has been found to be the highest (63.30 per cent)
among the Muslims as against 57.65 per cent illiteracy among the Hindus. It is found that proportion
of population decreases as the level of education rises. In total, less than two per cent of the
population has higher education. However, the percentage of Muslims population with below
primary and upper primary education is also lower to that of Hindus indicating to a fact that the
Muslim in rural areas of Badaun district are not sending their children to primary schools to the
extent Hindus are doing and if the situation continues like this, Muslims would not be able to catch

27 up the Hindus in attainment of basic education in the district. Muslims are also lagging behind the
Hindus in terms of attainment of higher/technical education in the district. On the whole, Muslims
are educationally backward as compared to the Hindus of the district.
Table 4.5: Classification of Population by Level of Education among Different Religious Groups
Level of Education Hindu Percentage Muslim Percentage Total Percentage Illiterate 1813 57.65 1323 63.39 3136 59.94 Below Primary 72 2.29 65 3.11 137 2.62 Primary 755 24.01 436 20.89 1191 22.76 Upper Primary 304 9.67 149 7.14 453 8.66 High School 125 3.97 70 3.35 195 3.73 Intermediate 47 1.49 24 1.15 71 1.36 Technical Diploma 7 0.22 2 0.10 9 0.17 Technical professional degree 2 0.06 1 0.05 3 0.06 Graduate degree 13 0.41 13 0.62 26 0.50 Post graduate 3 0.10 2 0.10 5 0.10 Child 4 0.13 2 0.10 6 0.11 Total 3145 100.00 2087 100.00 5232 100.00 Source: Primary data based.
5. Work Status: The working status of Hindu and Muslim population has been presented in table 4.6. The
table shows that the unemployment among the Muslims is relatively higher as compared to
Hindus of the district. Employment status is also higher among the Muslims which indicates that
Muslim may be facing greater deprivation of employment as a result they are forced to work
more as compared to their Hindu counterparts of the district.
Table 4. 6: Work Status of Hindu and Muslim Population
Working Status Hindu Percentage Muslim Percentage Total Percentages Employed 860 27.34 594 28.46 1454 27.79 Unemployed 33 1.05 38 1.82 71 1.36 Domestic Work 722 22.96 496 23.77 1218 23.28 Students 847 26.93 408 19.55 1255 23.99 Retired/pensioners 0 0.00 1 0.05 1 0.02 Old/child 683 21.72 550 26.35 1233 23.57 Total 3145 100.00 2087 100.00 5232 100.00 Note: Figures in brackets indicate percentages. Source: Primary data based.
6. Main Activities of the Population: In table 4.7, main activities of the working population of different religious groups of
Badaun district have been shown. It reflects from the table that 37.21 per cent of the working
population of Hindus and 27.44 per cent working population of Muslims is engaged in
agriculture. Apart from agriculture, the Hindus as well as Muslims are found to be largely
engaged in manufacturing activities.

28
Table 4.7: Main Activities of Population
Category Hindu Percentage Muslim Percentage Total Percentage Agriculture 320 37.21 163 27.44 483 33.22 Livestock 59 6.86 26 4.38 85 5.85 Fisheries 1 0.12 2 0.34 3 0.21 Forestry 1 0.12 1 0.17 2 0.14 Manufacturing 453 52.67 374 62.96 827 56.88 Construction 0 0.00 0 0.00 0 0.00 Trade and Commerce 10 1.16 10 1.68 20 1.38 Transport 1 0.12 4 0.67 5 0.34 Fin & admin services 2 0.23 2 0.34 4 0.28 Education health services 13 1.51 12 2.02 25 1.72
Total 860 100.00 594 100.00 1454 100.00 Note: Figures in brackets indicate percentages. Source: Primary data based. 8. Search for Additional Employment and Preference for Different Activities
The respondents were asked whether they are in search of additional employment. The
majority of them reported that they were searching additional employment which is evident from
table 4.8. A higher percentage of Muslims reported that they are in search of additional employment
as compared to Hindus. The preferred activities are dairy, business, service and industry for Hindus
as well as for the Muslims.
Table 4.8: Religion-wise Households Seeking Additional Employment and their most Preferred Activities
Preferred Activities Hindu Percentage Muslim Percentage Total Percentage Searching employment 492 86.47 302 91.24 794 88.22 Not searching 77 13.53 29 8.76 106 11.78 Total 569 100.00 331 100.00 900 100.00 First Preferred Activity Dairy 224 45.53 165 54.64 389 48.99 Services 63 12.80 17 5.63 80 10.08 Poultry 29 5.89 30 9.93 59 7.43 Piggery 6 1.22 0 0.00 6 0.76 Sheep/Goat 5 1.02 23 7.62 28 3.53 Fishery 3 0.61 1 0.33 4 0.50 Ag. Labour 38 7.72 0 0.00 38 4.79 Non Ag Labour 3 0.61 2 0.66 5 0.63 Industry 55 11.18 32 10.60 87 10.96 Business 66 13.41 32 10.60 98 12.34 Total 492 100.00 302 100.00 794 100.00 Second Preferred Activity Dairy 108 21.95 42 13.91 150 18.89 Services 14 2.85 12 3.97 26 3.27 Poultry 74 15.04 71 23.51 145 18.26 Piggery 9 1.83 1 0.33 10 1.26 Sheep/Goat 66 13.41 52 17.22 118 14.86 Fishery 1 0.20 1 0.33 2 0.25 Ag. Labour 11 2.24 1 0.33 12 1.51 Non Ag Labour 4 0.81 5 1.66 9 1.13 Industry 98 19.92 61 20.20 159 20.03 Business 107 21.75 56 18.54 163 20.53 Total 492 100.00 302 100.00 794 100.00

29 Table 4.8 (contd…) Third Preferred Activity Dairy 73 14.84 31 10.26 104 13.10 Services 94 19.11 24 7.95 118 14.86 Poultry 20 4.07 16 5.30 36 4.53 Piggery 12 2.44 3 0.99 15 1.89 Sheep/Goat 72 14.63 53 17.55 125 15.74 Fishery 13 2.64 5 1.66 18 2.27 Ag. Labour 0 0.00 0 0.00 0 0.00 Non Ag Labour 3 0.61 2 0.66 5 0.63 Industry 115 23.37 89 29.47 204 25.69 Business 90 18.29 79 26.16 169 21.28 Total 492 100.00 302 100.00 794 100.00 Note: Figures in brackets indicate percentages. Source: Primary data based.
9. Households Owning Different Land Sizes:
All the sample households were classified according to their religion and land size. It
became evident that more than 45.62 per cent of the Muslim households are landless in
comparison with 36.03 per cent of Hindus households (Table 4.9). The pattern shows that the
number of Muslim households decreases as the size of land increases, revealing the fact that the
Muslims in Badaun district of Uttar Pradesh possess the smaller size of land in comparison with
their Hindu counterparts.
Table-4.9: Distribution of Households of Different Religious Groups according to Land Size
Size of Land Holding Hindu Muslim Total Landless 205 151 356 Below 1.0 178 116 294 1.00 to 2.50 120 44 164 2.50 to 5.00 61 19 80 5.00 to 7.50 5 1 6 7.50 to 10.00 0 0 0 10 and above 0 0 0 Total 569 331 900 Average land per household (Acres) 1.64 1.22 1.50 Note: Figures in brackets indicate percentages. Source: Primary data based.
10. Value of Land Owned: The value of la nd owned by different households has been assessed and shown in table
4.10. The Muslim households owning land with higher values are also lesser as compared to
Hindu households. It indicates that the quality of land owned by the Muslim households is
comparatively poor to that of Hindus. Hence the value of the land owned by the Muslims is also
relatively lower.
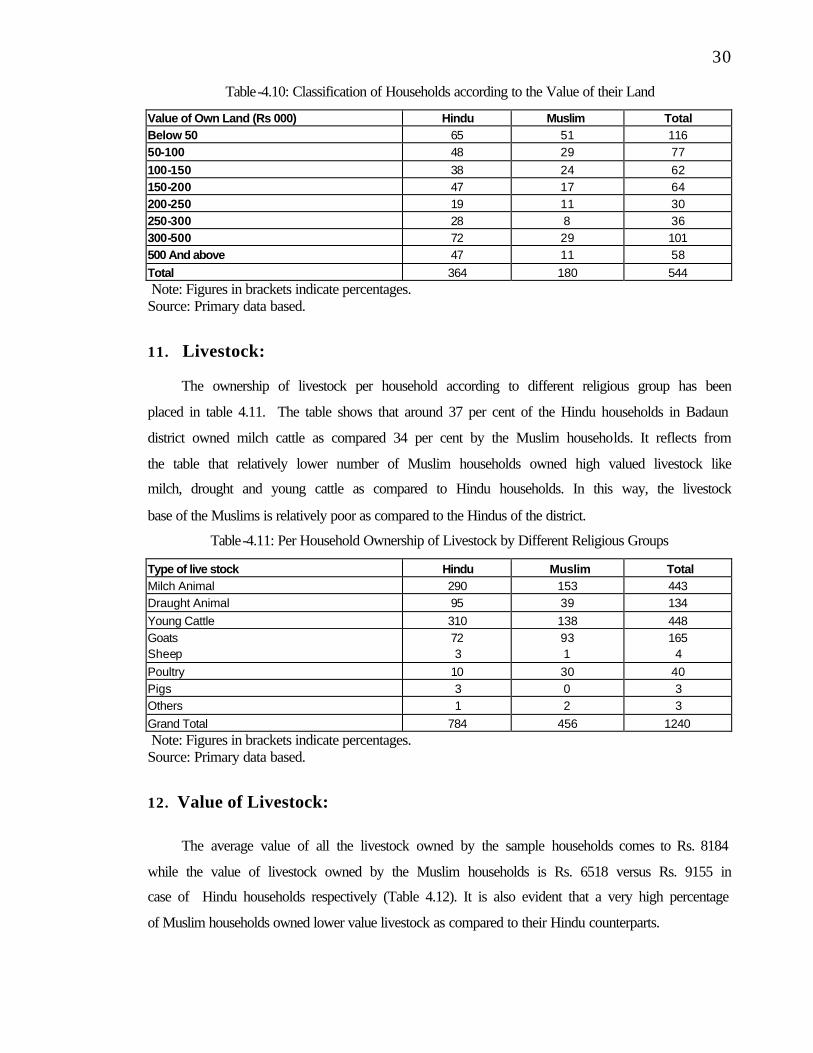
30
Table-4.10: Classification of Households according to the Value of their Land
Value of Own Land (Rs 000) Hindu Muslim Total Below 50 65 51 116 50-100 48 29 77 100-150 38 24 62 150-200 47 17 64 200-250 19 11 30 250-300 28 8 36 300-500 72 29 101 500 And above 47 11 58 Total 364 180 544 Note: Figures in brackets indicate percentages. Source: Primary data based.
11. Livestock: The ownership of livestock per household according to different religious group has been
placed in table 4.11. The table shows that around 37 per cent of the Hindu households in Badaun
district owned milch cattle as compared 34 per cent by the Muslim households. It reflects from
the table that relatively lower number of Muslim households owned high valued livestock like
milch, drought and young cattle as compared to Hindu households. In this way, the livestock
base of the Muslims is relatively poor as compared to the Hindus of the district.
Table-4.11: Per Household Ownership of Livestock by Different Religious Groups
Type of live stock Hindu Muslim Total Milch Animal 290 153 443 Draught Animal 95 39 134 Young Cattle 310 138 448 Goats 72 93 165 Sheep 3 1 4 Poultry 10 30 40 Pigs 3 0 3 Others 1 2 3 Grand Total 784 456 1240 Note: Figures in brackets indicate percentages. Source: Primary data based.
12. Value of Livestock:
The average value of all the livestock owned by the sample households comes to Rs. 8184
while the value of livestock owned by the Muslim households is Rs. 6518 versus Rs. 9155 in
case of Hindu households respectively (Table 4.12). It is also evident that a very high percentage
of Muslim households owned lower value livestock as compared to their Hindu counterparts.

31
Table 4.12: Distribution of Households by the Value of Livestock (Rs.)
Value of Livestock (Rs.) Hindu (HH) Percentage Muslim (HH) Percentage Total (HH) Percentage No Livestock 135 23.73 48 14.50 183 20.33 Below 1500 31 5.45 43 12.99 74 8.22 1500 - 30000 350 61.51 176 53.17 526 58.44 30000 - 45000 40 7.03 14 4.23 54 6.00 45000 - 60000 5 0.88 47 14.20 52 5.78 60000 - 75000 4 0.70 2 0.60 6 0.67 75000 and above 4 0.70 1 0.30 5 0.56 Total 569 100.00 331 100.00 900 100.00 Average per HH 9155 6518 8184 Note: Figures in brackets indicate percentages. Source: Primary data based.
13. Value of Productive and other Assets:
The average value of all the productive and other assets owned by the sample households
comes to Rs. 21547. The value of such assets owned by the Muslim households was found to be
marginally higher in comparison with Hindu households (Table 4.13). The table shows that a higher
proportion of Muslim households ow ned lower valued assets as compared to Hindu households.
Table 4.13: Distribution of household by Value of Productive and other Assets
Value (Rs 000) Hindu Percentage Muslim Percentage Total Percentage Below 25 432 75.92 249 75.23 681 75.67 25 - 50 80 14.06 47 14.20 127 14.11 50 - 75 33 5.80 10 3.02 43 4.78 75 - 100 12 2.11 10 3.02 22 2.44 100 and above 12 2.11 15 4.53 27 3.00 Total 569 100.00 331 100.00 900 100.00 Average per HH 21513 21607 21547 Note: Figures in brackets indicate percentages. Source: Primary data based.
14. Ownership of Productive and Other Assets: The value of productive and other assets has been calculated in table 4.14. The table shows that
each sample household of the district Badaun possesses productive and other assets to the tune of Rs.
21547. However, it is evident that the value of such assets owned by each Muslim household is
marginally higher as compared to Hindu households. The similar trend is observed when per
household value of different type of productive and other assets of Muslim households are compared
with the Hindu households. The average value of agricultural implements owned by the Muslim
households is substantially lower when compared with the value of agricultural implements owned
by the Hindu households.
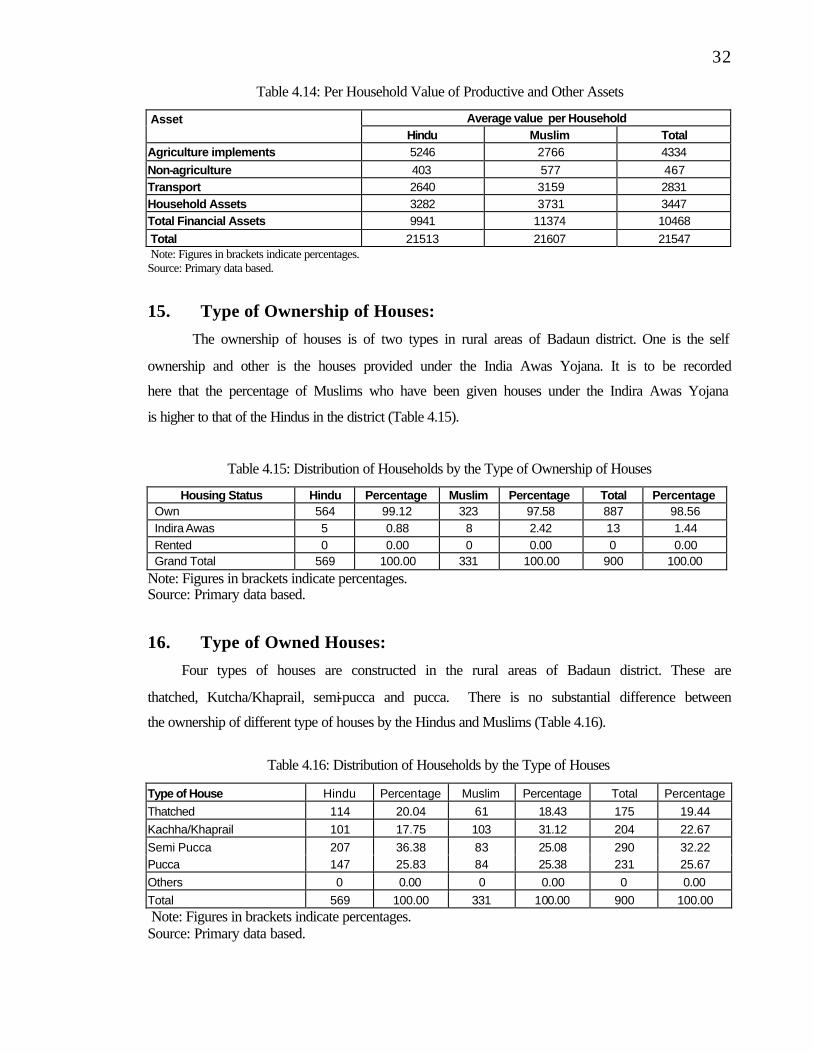
32
Table 4.14: Per Household Value of Productive and Other Assets
Average value per Household Asset Hindu Muslim Total Agriculture implements 5246 2766 4334 Non-agriculture 403 577 467 Transport 2640 3159 2831 Household Assets 3282 3731 3447 Total Financial Assets 9941 11374 10468 Total 21513 21607 21547 Note: Figures in brackets indicate percentages. Source: Primary data based.
15. Type of Ownership of Houses: The ownership of houses is of two types in rural areas of Badaun district. One is the self
ownership and other is the houses provided under the India Awas Yojana. It is to be recorded
here that the percentage of Muslims who have been given houses under the Indira Awas Yojana
is higher to that of the Hindus in the district (Table 4.15).
Table 4.15: Distribution of Households by the Type of Ownership of Houses
Housing Status Hindu Percentage Muslim Percentage Total Percentage Own 564 99.12 323 97.58 887 98.56 Indira Awas 5 0.88 8 2.42 13 1.44 Rented 0 0.00 0 0.00 0 0.00 Grand Total 569 100.00 331 100.00 900 100.00
Note: Figures in brackets indicate percentages. Source: Primary data based.
16. Type of Owned Houses: Four types of houses are constructed in the rural areas of Badaun district. These are
thatched, Kutcha/Khaprail, semi-pucca and pucca. There is no substantial difference between
the ownership of different type of houses by the Hindus and Muslims (Table 4.16).
Table 4.16: Distribution of Households by the Type of Houses
Type of House Hindu Percentage Muslim Percentage Total Percentage Thatched 114 20.04 61 18.43 175 19.44 Kachha/Khaprail 101 17.75 103 31.12 204 22.67 Semi Pucca 207 36.38 83 25.08 290 32.22 Pucca 147 25.83 84 25.38 231 25.67 Others 0 0.00 0 0.00 0 0.00 Total 569 100.00 331 100.00 900 100.00 Note: Figures in brackets indicate percentages. Source: Primary data based.

33 17. Number of Rooms in Houses: Mostly one and two rooms are there in majority of houses in Badaun District (Table 4.17).
As for the number of rooms in the houses of Hindus and Muslim is concerned, a higher
percentage of Hindu households owned larger number of rooms as compared to the Muslim
households.
Table 4.17: Distribution of Households by the Number of Rooms
Number of Rooms Hindu Percentage Muslim Percentage Total Percentage One 189 33.22 132 39.88 321 35.67 Two 253 44.46 122 36.86 375 41.67 Three 103 18.10 53 16.01 156 17.33 Four 12 2.11 22 6.65 34 3.78 Five 10 1.76 0 0.00 10 1.11 Six 1 0.18 2 0.60 3 0.33 Seven 0 0.00 0 0.00 0 0.00 Eight 1 0.18 0 0.00 1 0.11 Total 569 100.00 331 100.00 900 100.00 Note: Figures in brackets indicate percentages. Source: Primary data based.
18. Ownership of Homestead: The table 4.18 shows that around 98 per cent of total homestead are owned. Around 2 per
cent has been provided by government. There is no major difference across the religious group of
Hindus and Muslims as far the ownership of homestead is concerned.
Table 4.18: Distribution of Households according to Sources of Homestead
Homestead Hindu Percentage Muslim Percentage Total Percentage Own 560 98.42 323 97.58 883 98.11 Provided by Panchayat 8 1.41 7 2.11 15 1.67 Landlord's Land 1 0.18 1 0.30 2 0.22 Others 0.00 0.00 0.00 Total 569 100 331 100 900 100.00 Note: Figures in brackets indicate percentages. Source: Primary data based.
19. Electrification and Sources of Lighting: It is evident from table 27 that only 12 per cent of all rural houses have electricity so far
while 12 per cent of the Hindu houses have electricity as compared to 13 per cent of the Muslim
houses.
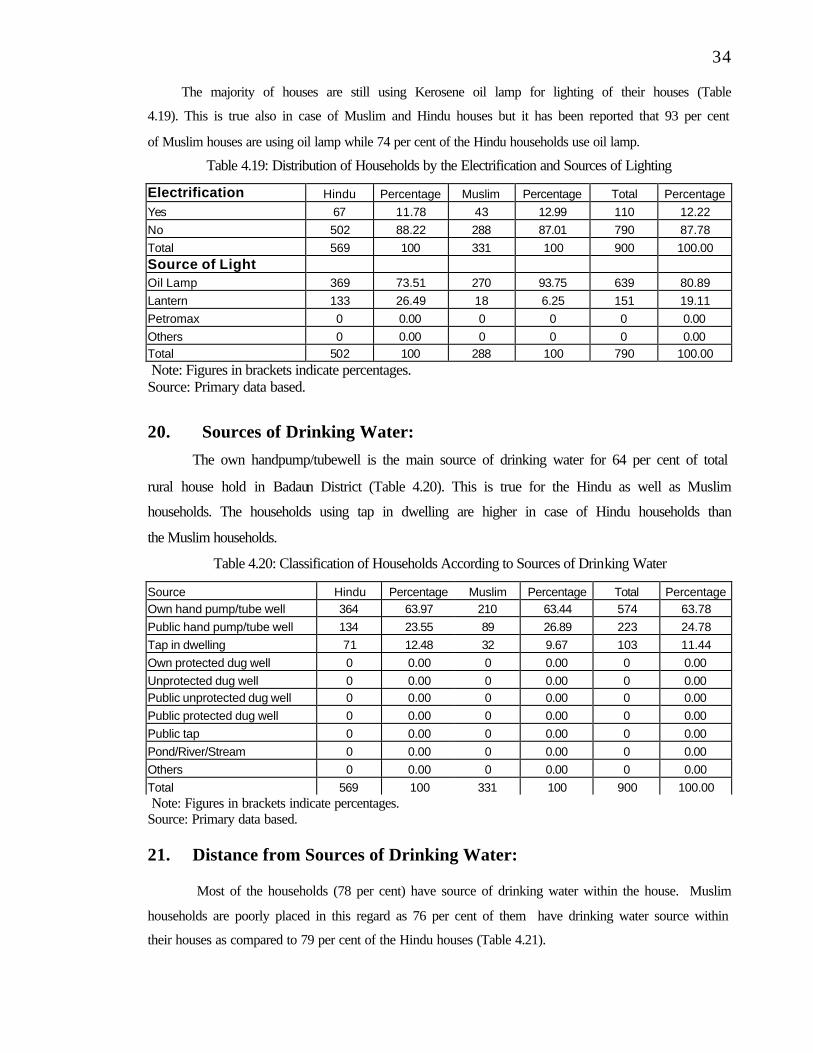
34 The majority of houses are still using Kerosene oil lamp for lighting of their houses (Table
4.19). This is true also in case of Muslim and Hindu houses but it has been reported that 93 per cent
of Muslim houses are using oil lamp while 74 per cent of the Hindu households use oil lamp.
Table 4.19: Distribution of Households by the Electrification and Sources of Lighting
Electrification Hindu Percentage Muslim Percentage Total Percentage Yes 67 11.78 43 12.99 110 12.22 No 502 88.22 288 87.01 790 87.78 Total 569 100 331 100 900 100.00 Source of Light Oil Lamp 369 73.51 270 93.75 639 80.89 Lantern 133 26.49 18 6.25 151 19.11 Petromax 0 0.00 0 0 0 0.00 Others 0 0.00 0 0 0 0.00 Total 502 100 288 100 790 100.00 Note: Figures in brackets indicate percentages. Source: Primary data based.
20. Sources of Drinking Water: The own handpump/tubewell is the main source of drinking water for 64 per cent of total
rural house hold in Badaun District (Table 4.20). This is true for the Hindu as well as Muslim
households. The households using tap in dwelling are higher in case of Hindu households than
the Muslim households.
Table 4.20: Classification of Households According to Sources of Drinking Water
Source Hindu Percentage Muslim Percentage Total Percentage Own hand pump/tube well 364 63.97 210 63.44 574 63.78 Public hand pump/tube well 134 23.55 89 26.89 223 24.78 Tap in dwelling 71 12.48 32 9.67 103 11.44 Own protected dug well 0 0.00 0 0.00 0 0.00 Unprotected dug well 0 0.00 0 0.00 0 0.00 Public unprotected dug well 0 0.00 0 0.00 0 0.00 Public protected dug well 0 0.00 0 0.00 0 0.00 Public tap 0 0.00 0 0.00 0 0.00 Pond/River/Stream 0 0.00 0 0.00 0 0.00 Others 0 0.00 0 0.00 0 0.00 Total 569 100 331 100 900 100.00 Note: Figures in brackets indicate percentages. Source: Primary data based.
21. Distance from Sources of Drinking Water:
Most of the households (78 per cent) have source of drinking water within the house. Muslim
households are poorly placed in this regard as 76 per cent of them have drinking water source within
their houses as compared to 79 per cent of the Hindu houses (Table 4.21).

35 Table 4.21: Classification of Households According to Distance from Sources of Drinking Water
Distance Hindu Percentage Muslim Percentage Total Percentage With in House 451 79.26 251 75.83 702 78.00 Upto 100 meters 106 18.63 67 20.24 173 19.22 100 - 250 meters 12 2.11 12 3.63 24 2.67 250 & above meters 0 0.00 1 0.30 1 0.11 Total 569 100 331 100 900 100.00 Note: Figures in brackets indicate percentages. Source: Primary data based.
22. Toilet Facility:
In house toilet facility is available to 21 per cent of the total households in rural areas of
Badaun district. Muslim households are better in this regards (Table 4.22). Pit latrine and watershed
or the two types of toilets, which are being used by majority of the houses across Hindu and Muslim
households.
Table 4.22: Classification of Households According to Toilet Facility and its type Hindu Percentage Muslim Percentage Total Percentage Toilet Facility 0.00 In House 103 18.10 89 26.89 192 21.33 Outside House 466 81.90 242 73.11 708 78.67 Total 569 100 331 100 900 100.00 Type of Toilet Facility Septic Tank Latrine 9 1.58 8 2.42 17 1.89 In the Dwelling water sealed 17 2.99 12 3.63 29 3.22 Pit Latrine 74 13.01 63 19.03 137 15.22 Covered Dry Latrine 3 0.53 8 2.42 11 1.22 n the community: water sealed 1 0.18 0 0.00 1 0.11 In the field 465 81.72 240 72.51 705 78.33 Total 569 100 331 100 900 100.00 Note: Figures in brackets indicate percentages. Source: Primary data based.
23. Types of Cooking Fuel Used: It has been reported by the sample household 61.22 per cent of them are using wood and 33
per cent using cow -dung cake as the two major sources of cooking fuel (Table 4.23). The similar
pattern is evident in Hindu as well as Muslim households.
Table 4.23: Classification of Households According to Type of Cooking Fuel Used Source of Fuel Hindu Percentage Muslim Percentage Total Percentage Wood 340 59.75 211 63.75 551 61.22 Coal 3 0.53 0 0.00 3 0.33 Kerosene Oil 0 0.00 1 0.30 1 0.11 Hay/Leaves 6 1.05 9 2.72 15 1.67 Cow Dung Cake 199 34.97 98 29.61 297 33.00 Agricultural Waste 16 2.81 7 2.11 23 2.56 Gobar Gas Plant 2 0.35 1 0.30 3 0.33 LPG 3 0.53 4 1.21 7 0.78 Total 569 100 331 100 900 100.00 Note: Figures in brackets indicate percentages. Source: Primary data based.

36 24. Drainage Facility: It has been reported by the sample respondents that 69 per cent of their total houses have
drainage facility. This facility is available to larger number of Muslim households as compared
with the Hindu households (Table 4.24)
Table 4.24: Drainage Facility
Facility of Drainage Hindu Percentage Muslim Percentage Total Percentage Yes 378 66.43 243 73.41 621 69.00 No 191 33.57 88 26.59 279 31.00 Total 569 100 331 100 900 100.00
25. Sources of Income: The average annual income has been calculated in case of sample households in table
4.25. It is evident from the table that around Rs. 25000 is the average income of all the rural
households considered together. It is also evident that the average annual income is higher in
case of Muslim households as compared with the Hindu households. Though the Muslim
households get lower income from agriculture when compared the income of Hindu households
from the agriculture but Muslim households draw higher income in manufacturing and other
non-farm activities than the Hindu households.
Table 4.25: Average Annual Income per Household by Sources of Income
Source of Income (Rs.) Hindu Muslim Total Agriculture 9775 7777 9041 Animal Husbandry 2475 2713 2562 Artisan Work 38 107 64 Trade 168 350 236 Manufacturing 25 254 109 Ag Wages 1413 1798 1555 Non Ag Wages 8492 10337 9170 Services 848 1291 1011 Interest 231 15 152 Remittances 104 1562 640 Pension 6 91 37 Others 162 45 119 Total 23737 26341 24695 Note: Figures in brackets indicate percentages. Source: Primary data based.
26. Family Income:
It has been found that 67.78 per cent of the total households have annual income of less
than Rs. 25,000 (Table 4.26). A higher percentage of Muslim households fall in this bracket of

37 income when compared with the Muslim households. Muslims households are also in greater
percentage of their total households in highest income group of Rs.1,50,000 to 2,50,000 (0.60 per
cent) versus Hindus (0.35 per cent).
Table 4.26: Distribution of Households by the Size of Family Income (yearly)
Size of Income (000 Rs) Hindu Percentage Muslim Percentage Total Percentage Below 25 401 70.47 209 63.14 610 67.78 25-50 155 27.24 103 31.12 258 28.67 50-100 8 1.41 16 4.83 24 2.67 100-150 3 0.53 1 0.30 4 0.44 150-250 2 0.35 2 0.60 4 0.44 Total 569 100.00 331 100.00 900 100.00 Note: Figures in brackets indicate percentages. Source: Primary data based.
27. Household by the Size of the Expenditure: The average annual expenditure of below Rs 25,000 is made by 76 per cent of sample
households (Table 4.27). Lower percentage of Muslim households falls in this category. Muslim
households are also in higher proportion in higher expenditure bracket as compared to the Hindu
households falling in higher income brackets.
Table 4.27: Distribution of Households by the Size of Expenditure
Size of Expenditure (000) Rs Hindu Percentage Muslim Percentage Total Percentage Below 25 455 79.96 227 68.58 682 75.78 25-50 107 18.80 90 27.19 197 21.89 50-100 7 1.23 14 4.23 21 2.33 Total 569 100.00 331 100.00 900 100.00 Per Household Exp. 20424 24030 21750 Note: Figures in brackets indicate percentages. Source: Primary data based.
28. Details of Expenditure: The Details of expenditure made by the sample households has been shown in table 4.28.
As usual major part of the expenditure is being made on food related items across all religious
groups. Average expenditure made by the Muslim households on food related items has been
found to be higher as against the Hindu households that too purchased from the market in greater
proportion.
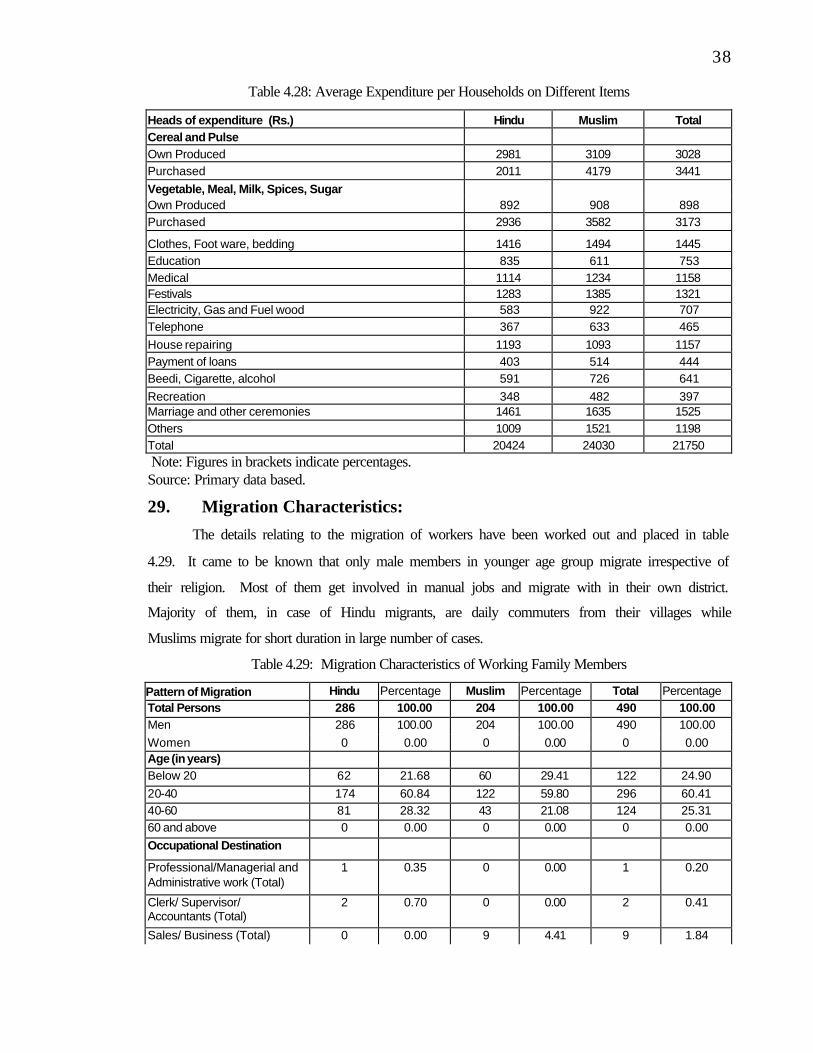
38
Table 4.28: Average Expenditure per Households on Different Items
Heads of expenditure (Rs.) Hindu Muslim Total Cereal and Pulse Own Produced 2981 3109 3028 Purchased 2011 4179 3441 Vegetable, Meal, Milk, Spices, Sugar Own Produced 892 908 898 Purchased 2936 3582 3173
Clothes, Foot ware, bedding 1416 1494 1445 Education 835 611 753 Medical 1114 1234 1158 Festivals 1283 1385 1321 Electricity, Gas and Fuel wood 583 922 707 Telephone 367 633 465 House repairing 1193 1093 1157 Payment of loans 403 514 444 Beedi, Cigarette, alcohol 591 726 641 Recreation 348 482 397 Marriage and other ceremonies 1461 1635 1525 Others 1009 1521 1198 Total 20424 24030 21750 Note: Figures in brackets indicate percentages. Source: Primary data based.
29. Migration Characteristics: The details relating to the migration of workers have been worked out and placed in table
4.29. It came to be known that only male members in younger age group migrate irrespective of
their religion. Most of them get involved in manual jobs and migrate with in their own district.
Majority of them, in case of Hindu migrants, are daily commuters from their villages while
Muslims migrate for short duration in large number of cases.
Table 4.29: Migration Characteristics of Working Family Members
Pattern of Migration Hindu Percentage Muslim Percentage Total Percentage Total Persons 286 100.00 204 100.00 490 100.00 Men 286 100.00 204 100.00 490 100.00 Women 0 0.00 0 0.00 0 0.00 Age (in years) Below 20 62 21.68 60 29.41 122 24.90 20-40 174 60.84 122 59.80 296 60.41 40-60 81 28.32 43 21.08 124 25.31 60 and above 0 0.00 0 0.00 0 0.00 Occupational Destination
Professional/Managerial and Administrative work (Total)
1 0.35 0 0.00 1 0.20
Clerk/ Supervisor/ Accountants (Total)
2 0.70 0 0.00 2 0.41
Sales/ Business (Total) 0 0.00 9 4.41 9 1.84

39 Table 4.29 (contd…) Manual Labour 267 93.36 175 85.78 442 90.20 Cast Occupation (Total) 15 5.24 20 9.80 35 7.14 Cultivate 1 0.35 0 0.00 1 0.20 Place of Migration Within District (Rural) 90 31.47 17 8.33 107 21.84 Within District (Urban) 100 34.97 82 40.20 182 37.14 Within State (Rural) 2 0.70 2 0.98 4 0.82 Within State (Urban) 18 6.29 9 4.41 27 5.51 Outside State (Rural) 0 0.00 6 2.94 6 1.22 Outside State (Urban) 76 26.57 88 43.14 164 33.47 Outside Country 0 0.00 0 0.00 0 0.00 Duration of Migration Short Term 77 26.92 93 45.59 170 34.69 Long Term 17 5.94 15 7.35 32 6.53 Daily Commuters 192 67.13 95 46.57 287 58.57 Total Note: Figures in brackets indicate percentages. Source: Primary data based.
30. Indebtedness: The indebted households have been classified in table 4.30 according to the amount of
loan outstanding. It has been found that around 77 per cent of the total households are under
debt of below Rs 15000/. The figure is higher in case of Muslim households (81.32 per cent)
versus Hindu households (72.73 per cent).
Table 4.30: Distribution of Households by Outstanding Amount of loan
Amount (Rs.000) Hindu Percentage Muslim Percentage Total Percentage Below 15 56 72.73 74 81.32 130 77.38 15-30 19 24.68 13 14.29 32 19.05 30-45 1 1.30 1 1.10 2 1.19 45-60 1 1.30 3 3.30 4 2.38 60-75 0 0.00 0 0.00 0 0.00 75-90 0 0.00 0 0.00 0 0.00 90 and above 0 0.00 0 0.00 0 0.00 Total H.H. 77 100.00 91 100.00 168 100.00 Per Household 1683 3002 2168
Note: Figures in brackets indicate percentages. Source: Primary data based.
31. Sources and Causes of Indebtedness: It is evident from the table 4.31 that around 19 per cent of total rural households are under
the debt. This proportion is higher in case of Muslim households (27.49 per cent) versus Hindu
households (13.53 per cent). The loan has been taken in majority of cases for agriculture,

40 consumption and health care. Among the institutional sources of credit, rural banks are the main
source while moneylenders are the major source among the non-institutional sources of loan
irrespective of Hindu and Muslim households. However, Muslim households have lesser
accessibility to institutional sources of credit when compared with the Hindu households.
Table 4.31: Distribution of Households by Indebtedness Characteristics
Pattern of Indebtedness Hindu Muslim Total Total sample households 569 331 900 Indebted Households 77
(13.53) 91
(27.49) 168
(18.67) Non-Indebted households 492
(86.47) 240
(72.51) 732
(81.33) Reason of Loan Agriculture 26 19 45 Trade and Commerce 3 6 9 Animal Purchase 13 9 22 House Construction 5 6 11 Consumption 2 22 24 Health 15 10 25 Festival/Functions 6 5 11 Others 7 14 21 Source of Loan Institutions Commercial Banks 8 8 16 Gramin Banks 21 12 33 Cooperative Bank/ Society 7 3 10 SHG/ NGO 4 5 9 Source of Loan Non- Institutional Trader 1 5 6 Money Lender 7 5 12 Land-lord Employee 2 5 7 Friends/ Relatives 23 50 73 Others 0 0 0
31. Educational Status of Children (5 -15 Years):
The educational status of children in the age group of 5-15 years has been examined in table
4.32. It is evident that two-third of total children are found to be going to schools. It is also revealed
that lower percentage of Muslim children is going to schools as compared with the Hindu children.
The children who are enrolled in the schools shows that their number declines as the standard
of class increases. However, the proportion of Muslim children studying in higher classes (class VI to
class X) is relatively lower to that of Hindu children in respective classes. It indicates that large
numbers of Muslim children leave the schools as the standard of education increases.
It has been reported that majority of the total children are studying in Government
schools. This is true in case of Hindu as well as Muslim children. The average distance of the
school is within 1 kilometer for majority of students. However, 90 per cent of total Muslim

41 children are studying in those schools, which are within the distance of less than 1 kilometer
while 89 per cent of Hindu children are going in such schools.
Medium of instruction is generally Hindi language but only 2 per cent of Hindu as well as
Muslim children are studying in English medium schools.
The non-affordability of fees and other educational expenses is the major reason for
dropout of the students. The work at home and need to earn are also the important reasons for the
dropout pf the Muslim children. The government assistance in the form of scholarship and others
is being availed by 74 per cent of the total Hindu children versus 67 per cent of Muslim children.
Table 4.32: Educational Status of Children in the Age of 5 to 15 years
Item Hindu Muslim Total Total Children 984 (100.00) 633 (100.00) 1617 (100.00) School going children 815 (82.82) 408 (64.45) 1223 (75.63) Characteristics of enrolled children Class I 131 61 192 Class II 113 86 199 Class III 126 69 195 Class IV 121 58 179 Class V 155 67 222 Class VI 46 20 66 Class VII 39 18 57 Class VIII 55 14 69 Class IX 14 6 20 Class X 15 9 24 Left/Dropout Left Dropout in Class I 78 117 195 Left Dropout in Class II 5 2 7 Left Dropout in Class III 1 0 1 Type of School Government 750 371 1121 Private 58 35 93 Madrasa 4 1 5 Missionary 0 0 0 Non formal 1 1 2 Total 2 0 2 Distance of School Within 1 Km 727 370 1097 1-2 Kms 28 11 39 2-4 kms 38 18 56 4 and above 22 9 31 Medium of Instruction Hindi 766 392 1158 English 19 8 27 Hindi English Both 23 8 31 Urdu 0 0 0 Learning Minority Language Yes 7 35 42 No 808 373 1181 Reason for Dropout Work at home 10 3 13

42 Table 4.32 (contd…) Need to earn 15 14 29 Far distance of School 2 3 5 Lack of facility in school 9 5 14 Teacher do not teach 0 2 2 Failed in exam 0 1 1 Fees/Expenditure not afford 70 35 105 Not interested in reading 13 21 34 Availing Govt Assistance Yes 603 273 876 No 212 135 347 Total Note: Figures in brackets indicate percentages. Source: Primary data based.
33. Aspiration of Parents for Education of their Children:
The respondents were asked to express their aspirations regarding the education of their
children. Around 27 per cent of the total respondents have not revealed any aspiration. The
percentage of no respondents is higher in Muslims as compared with Hindus (Table 4.33). Out of
those who expressed their aspiration, around 35 per cent of then want their boys to get education up
to the intermediate level. Aspiration for higher education of the boys is relatively lower among the
Muslim respondents.
The no response respondents are higher as far the educational aspiration of their girls is
concerned. Such respondents are higher among the Muslims as compared wit the Hindus. The
similar trend is evident as far the aspiration for higher education of girls is concerned in Hindus as
well as in Muslims.
Table 4.33: Aspirations of parents regarding their Children’s Education
Aspiration of Parents for education of their children
Hindu Percentage Muslim Percentage Total Percentage
BOYS No Response 129 22.67 115 34.74 244 27.11 High school 55 9.67 23 6.95 78 8.67 Intermediate 137 24.08 96 29.00 233 25.89 Pre Graduation/Diploma 48 8.44 12 3.63 60 6.67 Bachelor's Degree 83 14.59 46 13.90 129 14.33 Post Graduation 93 16.34 30 9.06 123 13.67 Technical Education 24 4.22 9 2.72 33 3.67 Total 569 100.00 331 100.00 900 100.00
GIRLS No Response 182 31.99 147 44.41 329 36.56 High school 67 11.78 40 12.08 107 11.89 Intermediate 138 24.25 89 26.89 227 25.22 Pre Graduation/Diploma 40 7.03 10 3.02 50 5.56 Bachelor's Degree 114 20.04 36 10.88 150 16.67 Post Graduation 21 3.69 7 2.11 28 3.11 Technical Education 7 1.23 2 0.60 9 1.00 Total 569 100.00 331 100.00 900 100.00 Note: Figures in brackets indicate percentages. Source: Primary data based.

43 34. Interest in Training: The sample respondents were asked to express their interest for different types of training to
improve their employment and income level. Around 42 per cent of the working members showed
their interest in training irrespective of Hindu and Muslim respondents (Table 4.34). B.Ed/BTC
training, training in animal husbandry and mechanical works was desired by the Hindu as well as
Muslim respondents. Quite a few of them were willing to bear the training expenses.
Table 4.34: Interest in Training of Working Family Members Type of Training Hindu Percentage Muslim Percentage Total Percentage Vocational Training 141 42.09 87 42.23 228 42.14 Driver 1 0.30 4 1.94 5 0.92 Mechanic 24 7.16 37 17.96 61 11.28 Computer 9 2.69 9 4.37 18 3.33 B.Ed/BTC 86 25.67 39 18.93 125 23.11 ITI/Polytechnics 2 0.60 0 0.00 2 0.37 Animal Husbandry 50 14.93 15 7.28 65 12.01 Small Enterprises 0 0.00 8 3.88 8 1.48 Others 22 6.57 7 3.40 29 5.36 Total 335 100.00 206 100.00 541 100.00 Place of Training Local 47 14.03 55 26.70 102 18.85 Nearby centre 216 64.48 131 63.59 347 64.14 District Headquarter 72 21.49 20 9.71 92 17.01 Total 335 100.00 206 100.00 541 100.00 Willingness to pay for training at least partly Yes 78 23.28 65 31.55 143 26.43 No 257 76.72 141 68.45 398 73.57 Total 335 100.00 206 100.00 541 100.00 Note: Figures in brackets indicate percentages. Source: Primary data based.
35. Types of Diseases It has come out from the survey that around 19 per cent of rural population has suffered
from various diseases during the last one year. While 20 per cent of the total Hindu population
fell ill, 17 per cent of the Muslim population fell ill. The seasonal and stomach related diseases
are the most prevalent (Table 4.35). Table 4.35: Type of Diseases
Type of disease Hindu Percentage Muslim Percentage Total Percentage Number of person falling ill 633 20.13 355 17.01 988 18.88 Seasonal Diseases 331 52.29 196 55.21 527 53.34 Prolong Fevers 97 15.32 29 8.17 126 12.75 ENT/Eyes 12 1.90 9 2.54 21 2.13 Accident 25 3.95 21 5.92 46 4.66 Stomach Related 105 16.59 54 15.21 159 16.09 Chronic diseases 41 6.48 32 9.01 73 7.39 Others 22 3.48 14 3.94 36 3.64 Total 633 100.00 355 100.00 988 100.00 Note: Figures in brackets indicate percentages. Source: Primary data based.

44 36.Place of Treatment: In private hospitals, 65.28 percent of the patients receive treatment followed by more than
13 percent by the Jhola Chap doctors (Table 4.36). It was also reported that only 5 percent of the
total patient were admitted in the hospital for treatment. The admission was taken by 6.48
percent of Muslim patients as compared to 3.95 percent by Hindu patients. The average annual
expenditure incurred by the Muslims on their treatment was Rs 1234 as compared to Rs. 1114
incurred by the Hindus and Rs. 1158 by the total population.
Table 4.36: Place of Treatment of Diseases Place of Treatment Hindu Percentage Muslim Percentage Total Percentage Govt. Hospital 25 3.95 23 6.48 48 4.86Private Hospital 446 70.46 199 56.06 645 65.28Both Government and Private 63 9.95 55 15.49 118 11.94Traditional 5 0.79 38 10.70 43 4.35Local Government health employee 1 0.16 0 0.00 1 0.10Home treatment 1 0.16 1 0.28 2 0.20Quacks 92 14.53 39 10.99 131 13.26Total 633 100.00 355 100.00 988 100.00Average Expenditure per household 1114 1234 1158 Note: Figures in brackets indicate percentages. Source: Primary data based.
37. Immunization of Children:
The respondents were enquired about the immunization of their children up to the age of 5
years. It was reported that more than 94 per cent of children were given polio drops. It was higher in
case of children of Hindus (95.30 per cent) as against the Children of Muslims (92.56 per cent). The
percentage of immunization of Muslim children was found to be lower to that of Hindu children in
case of entire four major diseases (Table 4.37).
Table 4.37: Immunization of Children
Details of Vaccination Hindu Muslim Total Polio 501 326 827 Diphtheria 449 221 670 BCG 466 260 726 Small Pox 377 174 551 Jaundice 7 5 12 Where Vaccination received Government Hospital 5 4 9 Private Hospital 14 11 25 Midwife/ASHA 480 306 786 Untrained Dai Others Total 499 321 820 Note: Figures in brackets indicate percentages. Source: Primary data based.

45 38. Public Distribution System: It is evident from the survey that 66 per cent of the total households are in BPL category in
rural areas of Badaun district. The proportion of Muslim households is higher (68 per cent) as
compared to Hindu households (64 per cent) as shown in Table 4.38.
The data shows that in general, 47 per cent of total households have BPL cards as against
43 per cent of Muslim households and 50 per cent of Hindu households. Majority of the
households (90 per cent) get the ration from PDS and the Muslim households who obtain ration
from PDS is 87 per cent versus 92 per cent of Hindu households.
The quantity of items (wheat, rice, sugar, kerosene etc.) obtained from the PDS by the
sample households is inadequate. The non-availability of PDS items in time is the main problem
faced by the PDS beneficiaries. Less weight and insufficient quantity are two other major
problems. Lack of timely supply in PDS is the most important reason for not getting the PDS
items for all the households. While the lack of money is the prime reason for the Muslims
households of not taking PDS items, lack of timely supply in PDS is the most important reason
for not getting PDS items for the Hindu households.
Table 4.38: Details of Public Distribution System
Are you in BPL Category Hindu Muslim Total Yes 366 226 592 No 203 105 308 Total 569 331 900 Do you have BPL Card Yes 185 98 283 No 181 128 309 Total 366 226 592 Do u get ration from PDS Yes 522 289 811 No 47 42 89 Total 569 331 900 Problems faced in PDS Insufficient Quantity 22 24 46 Bad Quality 2 2 4 Less Weight 41 22 63 Non-availability in time 295 110 405 Others 51 23 74 Are you capable of getting your share Yes 307 143 450 No 262 188 450 If No, than reasons Lack of Money 45 35 80 Lack of Supply in PDS 163 101 264 Discrimination by PDS Trader 23 29 52 Others 22 16 38 Note: Figures in brackets indicate percentages. Source: Primary data based.

46 39. Problems and losses during Communal Violence
None of the households among the 900 households has reported the problem of Communal
violence in the 30 villages surveyed by us. Therefore no loss of human life, property and feelings
of insecurity were reported.
40. Accessibility to Media and Communication The survey has revealed that rural households in Badaun District have limited access to
media and communication. Out of the total rural households surveyed, 4 percent read newspaper,
20 percent listen radio, 9 percent watch T.V. but 89 have mobiles. Within different religious
group, Muslims have relatively lower access to different means of media including the mobiles
(Table 4.39).
Table 4.39: Access to Media and Communication
Media Hindu Muslim Total Newspaper 18 16 34 Radio 110 73 183 Television 44 38 82 Telephone 1 0 1 Mobile 517 283 800 Note: Figures in brackets indicate percentages. Source: Primary data based.
41. Awareness and Benefited from Government Programmes: The levels of awareness of the surveyed households about the Government Programmes and
percentage of the households who have been benefited from these programmes in total households
have been worked out in Table 4.40.
It is apparent that around 47 per cent and 52 per cent of all households are aware about SGSY
and NREGS respectively. However, under both the Programmes, less than one per cent of all sample
households have been benefited. In case of IAY and Old age/Widow pension, a very high proportion
of all households have reported their awareness, yet benefits have remained confined to quite a few
of them. The awareness level among the Muslim households about the various programmes has been
found to be lower as compared with the Hindu households of the district.
Table 4.40: Awareness about Government Programmes
Awareness Hindu Muslim Total SGSY 291 131 422 NREGA 344 126 470 IAY 549 308 857 Widow Pension 546 313 859 TSC 440 249 689 ARWSP 92 12 104 SSA 530 294 824

47 Table 4.40 (contd…) Benefited SGSY 1 2 3 NREGA 1 3 4 IAY 10 2 12 Widow Pension 10 1 11 TSC 142 81 223 ARWSP 4 1 5 SSA 346 160 506 Who selected SGSY Pradhan 1 2 3 NREGA Pradhan 1 3 3 IAY Pradhan 9 2 11 Village Secretary 1 0 1 Widow Pension Pradhan 10 1 11 TSC Pradhan 139 78 217 Village Secretary 1 0 1 Self 2 3 5 ARWSP Pradhan 4 1 5 SSA Pradhan 256 117 373
Self 90 43 133 Beneficial for you and your family SGSY 26 12 38 NREGA 43 10 53 IAY 169 74 243 Widow Pension 65 43 108 TSC 82 67 149 ARWSP 8 2 10 SSA 177 128 305 Note: Figures in brackets indicate percentages. Source: Primary data based.
42. Facilities which Need Special Attention: Views of the Respondents:
The respondents were asked to tell about the various facilities in order of their preference
which need special attention. Health, road and education facilities were most desires by all the
respondents. The similar views were expressed by the Hindu as well Muslim respondents (Table
4.41).

48
Table 4.41: Views of Respondents regarding Facilities which need Special Attention
First Preference Hindu Percentage Muslim Percentage Total Percentage Road 76 13.36 66 19.94 142 15.78 Water 31 5.45 4 1.21 35 3.89 Health Facilities 202 35.50 90 27.19 292 32.44 Education 78 13.71 37 11.18 115 12.78 Transport 0 0.00 0 0.00 0 0.00 Electricity 29 5.10 34 10.27 63 7.00 House 10 1.76 4 1.21 14 1.56 Employment 16 2.81 17 5.14 33 3.67 Sanitation 5 0.88 10 3.02 15 1.67 Others 122 21.44 69 20.85 191 21.22 Total 569 100.00 331 100.00 900 100.00 Second Preference Road 65 11.42 33 9.97 98 10.89 Water 38 6.68 7 2.11 45 5.00 Health Facilities 152 26.71 106 32.02 258 28.67 Education 144 25.31 50 15.11 194 21.56 Transport 0 0.00 3 0.91 3 0.33 Electricity 26 4.57 27 8.16 53 5.89 House 14 2.46 14 4.23 28 3.11 Employment 8 1.41 26 7.85 34 3.78 Sanitation 10 1.76 9 2.72 19 2.11 Others 112 19.68 56 16.92 168 18.67 Total 569 100.00 331 100.00 900 100.00 Third Preference Road 54 9.49 40 12.08 94 10.44 Water 67 11.78 28 8.46 95 10.56 Health Facilities 98 17.22 55 16.62 153 17.00 Education 132 23.20 59 17.82 191 21.22 Transport 1 0.18 3 0.91 4 0.44 Electricity 19 3.34 25 7.55 44 4.89 House 28 4.92 12 3.63 40 4.44 Employment 17 2.99 35 10.57 52 5.78 Sanitation 14 2.46 5 1.51 19 2.11 Others 139 24.43 69 20.85 208 23.11 Total 569 100.00 331 100.00 900 100.00
43. Important Aspects Lagging in the Life of Respondents:
Employment, land, housing, health care facilities and skill are the most important aspects
which are lagging in the life of the respondents (Table 4.42). This is similar feeling in Hindus as
well in Muslims.

49
Table 4.42: Views of the respondents regarding the Important Aspects lagging in their lives' First Preference Hindu Percentage Muslim Percentage Total Percentage Land 143 25.13 107 32.33 250 27.78 House 81 14.24 50 15.11 131 14.56 health 64 11.25 38 11.48 102 11.33 Education 69 12.13 26 7.85 95 10.56 Employment 186 32.69 97 29.31 283 31.44 Skill 18 3.16 10 3.02 28 3.11 Electricity/Water 3 0.53 0 0.00 3 0.33 Others 5 0.88 3 0.91 8 0.89 Total 569 100.00 331 100.00 900 100.00 Second Preference Land 32 5.62 30 9.06 62 6.89 House 96 16.87 70 21.15 166 18.44 health 87 15.29 38 11.48 125 13.89 Education 110 19.33 67 20.24 177 19.67 Employment 164 28.82 71 21.45 235 26.11 Skill 69 12.13 51 15.41 120 13.33 Electricity/Water 4 0.70 2 0.60 6 0.67 Others 7 1.23 2 0.60 9 1.00 Total 569 100.00 331 100.00 900 100.00 Third Preference Land 33 5.80 20 6.04 53 5.89 House 50 8.79 31 9.37 81 9.00 health 136 23.90 78 23.56 214 23.78 Education 125 21.97 61 18.43 186 20.67 Employment 125 21.97 84 25.38 209 23.22 Skill 81 14.24 51 15.41 132 14.67 Electricity/Water 5 0.88 1 0.30 6 0.67 Others 14 2.46 5 1.51 19 2.11 Total 569 100.00 331 100.00 900 100.00

50
CHAPTER V
CRITICAL DEVELOPMENT GAPS IN THE DISTRICT
1. Introduction:
In the preceding chapters, socio-economic development status has been examined at the
three levels. First is the analysis of development status at the district level taking into account
Badaun District as a whole. Second is the analysis based on the development status of all the 30
sample villages considered together. The last is the analysis based on the development status
examined on the basis of primary data collected from 900-sample households. In this chapter,
critical development gaps have been identified in relation to three spatial levels, i.e. (I) Badaun
District as a whole; (II) Village level and (III) Household level.
2. Development Gaps at the District Level:
1. The growth of population and population density are very high in the district. Both these
factors are exerting an adverse impact on the employment and income prospects of the
people. Therefore the growth of population in the district is to be managed. The literacy
level has also found to be lower in the district. This gap is also to be taken care of on
priority basis.
2. The literacy level and work participation rate among Muslims of the district has been
found to be at bottom when compared with other minorities and Hindus of the district.
The gap between Muslims and other religious groups in terms of literacy and
employment is to be abridged if balanced social development is to be achieved in Badaun
District.
3. The full time employment opportunities are diminishing in the district and the number of
marginal workers are fast increasing; pointing to the situation of distress diversification.
Therefore special attention needs to be given to generate full time employment
opportunities in Badaun District. The white-collar job opportunities are also fast
diminishing in the district.
4. The agriculture is still at the subsistence level in the district. Crop intensity of the
diversification is still low despite larger area has been brought under cultivation and
irrigation. The productivity of major crops is still lower. So, the appropriate planning is
required to fill these gaps in the agricultural sector.

51 5. The district has sizeable livestock population but of non-descript type with relatively low
yield. The quality of livestock needs to be improved in the district.
6. Though industrial development in general has been lack luster in the district but
development in Khadi and Village industries, which have great potential of employment
generation, has not been reasonable enough in particular. Thus the activities of the Khadi
and the Village industry board need to be activated to bridge these gaps.
7. Three major infrastructures; namely the road network, electricity expansion and its
supplies, and the number of bank branches need to be increased at the district level.
8. There is a gap in rural infrastructure particularly in case of rural go-downs, agro service
centers and regulated markets. These gaps are to be abridged to match with the state
averages of these specialties.
9. Some gaps are visible in educational infrastructure of schools like bad condition of
school buildings, high teacher student ratio etc. We expect these gaps to be filled under
the SSA Programme.
10. There are also some gaps in the health infrastructure of Badaun district. So Primary
health centers, Allopathic hospitals and Child/Women welfare centers are to be increased
in the district
11. The analysis points to the fact that rural part of the district is comparatively backward to
its urban part. Low return from agriculture, inadequate employment opportunities and
critical gaps in key rural infrastructure has reduced the incomes of the rural people in the
district. As a result the percentage of BPL population in rural population of the district is
higher as compared to the State average. Therefore, proper planning for the composite
development of rural areas of Badaun District is required.
3. Development Gaps at the Village Level: 1. The combined population data of 30 sample villages has revealed that the size of households
in general and among the Muslims population in particular is high. This calls for the effective
implementation of family planning measures. The high proportion of total workers (43 per
cent) is engaged as cultivators followed by agricultural labours (14 per cent). Few of the
workers are found to be employed in non-farm activities, which has tremendous potential of
employment. This necessitates the planning for the development of non-farm activities in the
villages of Badaun District.
2. A high proportion of total cultivated area has been brought under cultivation, yet the
cropping intensity is still low which requires the intens ification of cropping as well as its
diversification.
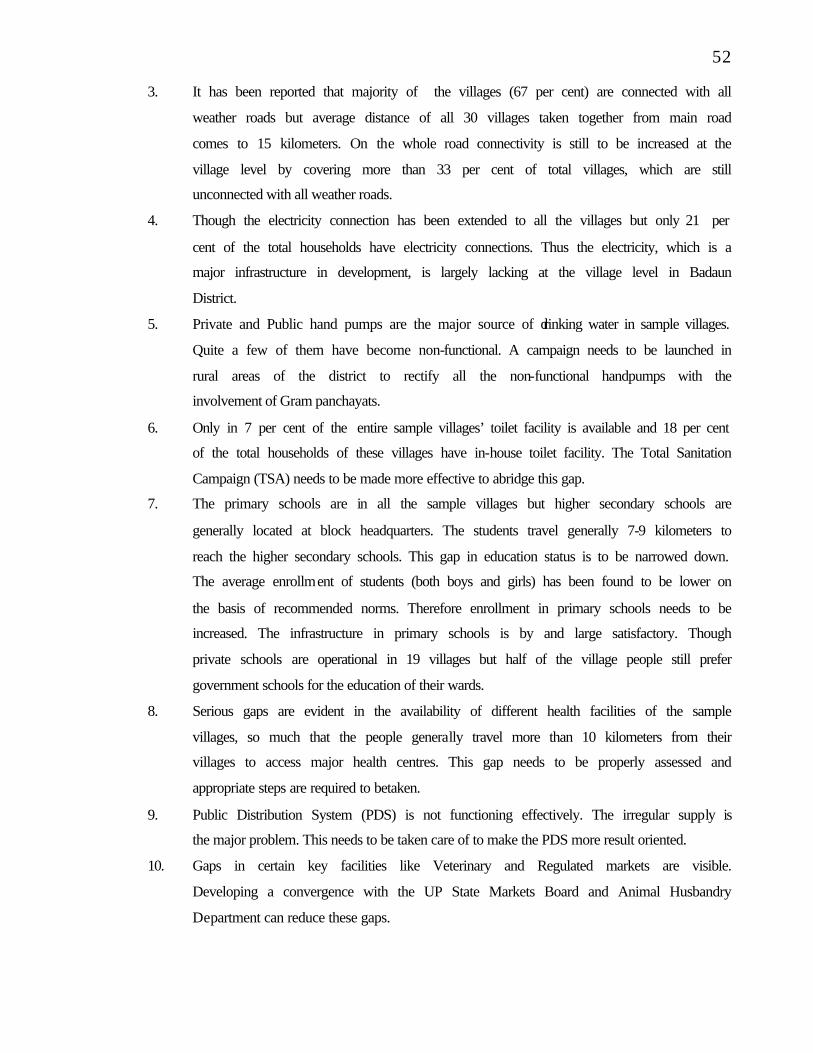
52 3. It has been reported that majority of the villages (67 per cent) are connected with all
weather roads but average distance of all 30 villages taken together from main road
comes to 15 kilometers. On the whole road connectivity is still to be increased at the
village level by covering more than 33 per cent of total villages, which are still
unconnected with all weather roads.
4. Though the electricity connection has been extended to all the villages but only 21 per
cent of the total households have electricity connections. Thus the electricity, which is a
major infrastructure in development, is largely lacking at the village level in Badaun
District.
5. Private and Public hand pumps are the major source of drinking water in sample villages.
Quite a few of them have become non-functional. A campaign needs to be launched in
rural areas of the district to rectify all the non-functional handpumps with the
involvement of Gram panchayats.
6. Only in 7 per cent of the entire sample villages’ toilet facility is available and 18 per cent
of the total households of these villages have in-house toilet facility. The Total Sanitation
Campaign (TSA) needs to be made more effective to abridge this gap.
7. The primary schools are in all the sample villages but higher secondary schools are
generally located at block headquarters. The students travel generally 7-9 kilometers to
reach the higher secondary schools. This gap in education status is to be narrowed down.
The average enrollment of students (both boys and girls) has been found to be lower on
the basis of recommended norms. Therefore enrollment in primary schools needs to be
increased. The infrastructure in primary schools is by and large satisfactory. Though
private schools are operational in 19 villages but half of the village people still prefer
government schools for the education of their wards.
8. Serious gaps are evident in the availability of different health facilities of the sample
villages, so much that the people generally travel more than 10 kilometers from their
villages to access major health centres. This gap needs to be properly assessed and
appropriate steps are required to betaken.
9. Public Distribution System (PDS) is not functioning effectively. The irregular supply is
the major problem. This needs to be taken care of to make the PDS more result oriented.
10. Gaps in certain key facilities like Veterinary and Regulated markets are visible.
Developing a convergence with the UP State Markets Board and Animal Husbandry
Department can reduce these gaps.

53 11. A number of non-agricultural activities are being undertaken in sample villages. The
problems in marketing and production are generally hampering the growth of these
activities. The Khadi and Village Industry Board should be activated to look in to these
problems. Lack of skill development is also one of the serious constraints in the
development of these industries.
12. The functioning of Self-help groups has been reported in 15 villages. Saving and credit is
their major activity. Now these groups are to be oriented to undertake some income
generating activities as well.
13. The number of beneficiaries under different Government programmes is quite a few
except Pension Scheme, benefits from other programmes accrued to only 3 per cent of
the total population.
4. Development Gaps at the Household Level:
1. Hindu population accounts for the majority of population in Badaun district followed by
the Muslims. Other minority groups like Christian, Sikh and Jain are in very negligible
number. Therefore, the development characteristics of Hindu and Muslim households
have been compared as far their development status is concerned.
2. The size of the family among Muslim households is relatively higher in rural areas of the
district, which needs to be managed. On the whole, sex ratio is quite low in the district
yet it is highest in case of Muslim households.
3. A high proportion of human resources have been found to be of younger age. This is true
across all the religious groups which are the strength of rural areas of the district.
4. The level of literacy has been found to be high at the household level. More than half of
the Muslim population is illiterate. This is one of the serious weaknesses of the
population in general as well as the Muslims in particular.
5. Most of the rural population and Hindu population are employed in agriculture while the
Muslims are largely employed in non-agricultural activities. Therefore for the
development of Muslims in the rural part of Badaun district, promotion of non-farm
activities is crucial.
6. It has come out that most of the households are in search of additional employment
opportunities and they have expressed their preference largely for agro-based activity like
dairy etc. It has already been pointed out that non-farm activities need to be promoted in
rural areas of district. This point gets further validation from the fact that 30 per cent of

54
the total households are landless in rural areas of the district and landless Muslim
households are more than 45 per cent among their total households.
7. Apart from lower land base of Muslim households, value of livestock and other
productive assets owned by them is also relatively lower than the Hindu households.
8. The Muslim household has been least benefited under the Indira Awas Yojana and
condition of their houses is also poor as compared to households of Hindus. Therefore
more beneficiaries under the Indira Awas Yojana should be drawn up from the Muslims.
9. In general a very low proportion of rural households have electricity. Muslim households
are marginally better as compared to their Hindu counterparts.
10. The facility of protected drinking water is available to most of the households across all
religious groups. However, In-house toilet facility is available to only 31 per cent
households. Muslim households are better in this regard as 50 per cent of their
households have in-house toilet facility in comparison with 21 per cent households of
Hindus. Thus, the coverage of Total Sanitation Campaign is to be speeded up in the
district.
11. Wood and Cow-dung cake are two major sources of cooking fuel in rural areas of the
district across different religious groups. In view of very low area under forest in the
district, alternative sources of cooking fuel are to be searched for.
12. Indebtedness is highest among the rural households. Around 85 per cent households are
reported to have average outstanding loan of Rs. 15000.
13. It has come out that 12 per cent of the total children in age group of 5-15 years were
never enrolled in the schools. The rate of dropout among the Muslim children goes on
increasing as their standard of class increases. This is a crucial issue which needs to be
looked into seriously.
14. A high proportion of Hindu parents aspire for higher education of their children, opposite
is the case with the Muslim parents. Therefore awareness about the value of education
needs to be spread among the rural Muslim masses of the district.
15. Hindu and Muslim households have largely expressed their interest in taking further
training in various local based non-farm activities. Most of them feel that the duration of
training should be 3 to 6 months and more than half of them are ready to bear 100 per
cent of theirs training expenses.
16. The ailment of the diseases is done at the private hospitals in majority of cases;
irrespective of religion. Jhola chhap doctors are also playing important role in medicare

55
of the people. Therefore, state sponsored health care services need to be strengthened in
rural areas of the district.
17. It has been found that a high proportion of total children are being immunized in the
district. However, there is gap in the immunization between Muslim and Hindu children.
This is needed to be taken care of. The maternity and child services are also poorly
availed to the rural population of the district in general and to Muslims in particular. This
necessitates the extension of women and child related medical services in rural part of the
district.
18. The Public Distribution System (PDS) of the district is in disarray. Non-availability of
PDS items in time and unavailability of sufficient quantity are the two major factors,
which are making the PDS system ineffective. Thus, the present model of the PDS needs
to be revamped completely.
19. The most important fact which is to be highlighted here is that the rural part of Badaun
District has been free from communal violence so far.
20. The media and communication accessibility has been found to be generally poor in the
rural areas of Badaun district. Its impact can be seen on the awareness level of people
about the various development Programmes of the government. The Indira Awas Yojana,
Old Age/Widow Pension Scheme and Total Sanitation Campaign are well known
Programmes to large number of rural people in the district. The rural people of the district
have little knowledge about other development Programmes. This is more in case of
Muslim population.
21. Most of the people in rural areas of the district has recognized the National Rural
Employment Guarantee Act, Indira Awas Yojana and Old Age/Widow Pension Scheme
as the three most useful government Programmes for the rural people of Badaun district..

56
Annexure-I: Value of Productive and Other Assets per Household
Asset Hindu Muslim Christian Sikh Others All Plough 290.68 330 0 0 300 297.1 Bullock cart 1221.68 420.75 0 0 0 962.78 Tractor 5744.34 7924.53 0 28333.33 0 6655.56 Power Tiller 161.81 0 0 750 0 121.11
Threshing Machine 381.55 169.81 0 3916.67 0 364.22 Pump Set 1401.62 938.49 0 10125 0 1373.78 Sprayer 108.74 122.64 0 0 0 110.78 Fodder Cutter 1313.43 780.75 0 1937.5 1000 1158.72 Others 1126.15 597.7 1050 250 0 957.28 Total Agricultural Implements 7261501 2990442 4203 543754 1306 10801190 Floor /Rice Mills 0 0 0 0 0 0 Oil Crusher 0 0 0 0 0 0 Sugarcane Crusher 0 0 0 0 0 0 Handloom 0 0 0 0 0 0 Power loom 27.51 0 0 0 0 18.89 Welding Machine 12.94 0 0 0 0 8.89 Electric and Electronic repair equipment 15.86 0 0 266.67 0 14.44 Motor repair 11.89 16.04 250 133.33 0 15.78 Sewing machine 275.08 335.85 300 1425 0 308.11 Others 261.28 101.28 0 0 0 209.23
Total Non-agricultural machinery & equipments 373620 120090 2200 21900 0 517810 Jeep 614.89 0 0 0 0 422.22 Truck 0 0 0 0 0 0 Bus 0 0 0 0 0 0 Car 364.08 452.83 0 0 0 383.33 Motor Cycle 3702.27 1758.49 16250 23583.33 0 3446.67 Scooter 169.26 66.42 0 1666.67 0 158 Cycle 1111.42 919.85 850 1295.83 0 1055.08 Other
Transport 3684460 847360 68400 318550 0 4918770 Electric Fan 106.15 107.36 2250 1620.83 0 136.11 Cooler 100.81 52.45 0 375 0 89.67 T.V. 586.73 446.98 1750 4112.5 0 597.11 Refrigerator 137.38 52.83 0 2733.33 0 146.33 CD Player 90.94 91.32 0 1583.33 0 110.44 Gas Stove (LPG) 135.92 77.36 1300 708.33 0 131.33 Phone 28.16 21.51 0 833.33 0 36.78 Mobile 525.57 410.75 2250 2616.67 1600 528.5 Furniture 1540.49 1250.91 550 4250 0 1485.23 Others 826.59 639.14 2650 3779.17 0 817.95
Total Modern household Assets 2520655 834913 43000 271350 1600 3671518 Savings in Bank/ Post Office/ Fixed Deposits 3900.92 2967.55 10000 13312.5 50000 3829.91 Gold Silver Ornaments 7860.61 4244.91 1750 16025 1000 6870.07 Others 1862.94 2443.03 8500 1025 0 2050 Total Financial Assets 8419928 2558702 81000 364350 51000 11474980 Gross Value of productive and other assets 22260164 7351507 198803 1519904 53906 31384268
Per household value of Productive and other assets 36019.68 27741.54 49700.75 126658.7 53906 34871.41
Note: Figures in brackets indicate percentages. Source: Primary data based.

57
Annexure II: Sample Villages of Badaun District
Tehshil Block Village 1. Badaun 1. Jagat
2. Kadarchauk 3. Ujhani
1. Sobhanpur 1. Asharari 1. Jyora parvala 2. Manakpur 3. Alla Purbhogi
2. Bilsi 1. Islamnagar 2. Bisauli 3. Ambiapur
1. Maikhurd 1. Palia 1. Sirtaul 2. Raipur Majara
3. Sahaswan 1. Dahgawan 1. Bajpur 2. Bisaulia 3. Antar 4. Nadha 5. Sakatpur
4. Dataganj 1. Samrer 2. Dataganj 3. Miyaun 4. Osawan
1. Semariya 2. Sehra Pukhta 1. Ismaipur 1. Roopamai 1. Gariya Hardopatti 2. Mirzapur Atiraj
5. Bisauli 1. Bisauli 2. Asafpur 3. Islamnagar 4. Wazirganj
1. Piwari 1. Dabtora 1. Sakhamai 1. Serandajpur 2. Udaipur
6. Gunnaur 1. Gunnaur 2. Junamai 3. Rajpura
1. Sainjor 1. Baghoi 2. Patai kyasalh 1. Sailma 2. BahatKaran
58 ABBREVIATIONS ANM Auxiliary Nurse Midwife
ARWSP Accelerated Rural Water Supply Programme
BHQ Block Head Quarter
BPL Below Poverty Line
CDO Chief Development Officer
CDR Credit Deposit Ratio
DRDA District Rural Development Authority
IAY Indira Awas Yojana
ITI Industrial Training Institute
MCDs Minority Concentrated Districts
MsDP Multi-sector District Development Plan
NABARD National Bank For Agriculture And Rural Development
NAREGA National Rural Employment Guaranty Act/Scheme
NFHS National Family And Health Survey
NSSO National Sample Survey Organization
PDS Public Distribution System
PHCs Primary Health Centers
PMGSY Pradhan Mantri Gramin Sadak Yojana
SGSY Swrnjayanti Gramin Swarojgar Yojana
SHGs Self-help Groups
SSA Sarva Shiksha Abhiyan
TLC Total Literacy Campaign