Embed Size (px)
Citation preview

Base-Flow Characteristics of Streams in the Valley and Ridge, the Blue Ridge, and the Piedmont Physiographic Provinces of Virginia
United States Geological Survey Water-Supply Paper 2457

�
with a high rank for potential surface-water yield are located in the Piedmont/Blue Ridge transition, the Valley and Ridge, and the Blue Ridge regions, and a majority of the basins that represent low-to-moderate ranks are located in the Piedmont regions (fig . 9) . The differences in water-yielding potential are only relative to the study area but should be considered in the process of managing surface-water resources .
Relation to Potential Ground-Water Yield
Potential ground-water yield is the capacity of the ground-water reservoir to store and transmit water. Knopman (1990) used specific capacity data as an indicator of potential ground-water yield . An alternative approach for areas that lack sufficient specific capacity or well-yield data is to use base-flow charac-teristics as indicators of potential ground-water yield . Trainer and Watkins (1975, p . 50) suggested that areas with favorable potential ground-water yield, where values for transmissivity and base flow are high, could be delineated by using base flow as an indicator. However, Olmsted and Hely (1962, p . A21) stated that the relation between base flow and the amount of ground water available for development is not simple . In order to indicate potential ground-water yield from base-flow characteristics, aquifer properties for selected basins with continuous streamflow data were determined by methods that use streamflow records and basin characteristics . The basin characteristics and aquifer properties are listed in appendix 3 .
Rorabaugh (1960, 1964) developed an equation that relates the slope of the master recession curve to the transmissivity and storage coefficient of the ground-water reservoir. An abbreviated form of the equation (Rorabaugh and Simons, 1966, p . 12) was used for 51 continuous-record streamflow-gaging stations to calculate areal diffusivity, which is the ratio oftransmissivity to storage coefficient :
_T __ 0 .933a2 S K '
where T is areal transmissivity (L2 /T), S is storage coefficient (dimensionless), a is aquifer half-width (L), and K is recession index (T) .
The recession index (K) values were determined by Rutledge and Mesko (1996) by using a computerized method that calculates a mathematical expression
20 Base-Flow Characteristics of Streams in Virginia
of the master recession curve of streamflow recession for each station . Aquifer half-width (a) is the average distance from the stream to the hydrologic divide . The distance a for each gaged station is equal to half the reciprocal of drainage density, which is the ratio ofthe total length of streams in a basin to the drainage area (Horton, 1945, p . 284 ; Olmsted and Hely, 1962, p . A19; Carlston, 1963, p . C5 ; Trainer, 1969, p . C179) . Summation ofall stream-segment lengths upstream of each streamflow-gaging station was accomplished by applying the ARC/INFO network analysis procedure to the U.S . Environmental Protection Agency Reach File, Version 3 (RF3) coverage . In some cases, the RF3 coverage does not contain all of the stream segments within the basin ; therefore, the distance a was estimated by using the mean drainage density from either the same hydrologic unit code or similar unit code .
Values of areal diffusivity range from 17,100 to 88,400 ft2/d, with a median value of 38,400 ft'/d (table 2), which are consistent with values reported in the literature (Olmsted and Hely, 1962 ; Hely and Olm-sted, 1963; Trainer and Watkins, 1974, 1975) . The Kruskal-Wallis test indicates that significant differ-ences exist (p=0 .037) in median values for areal diffusivity among the regions . The Tukey's MCT indicates that the Piedmont northern and southern, the Valley and Ridge, and the Blue Ridge regions do not differ significantly from each other and that the latter three regions are not significantly different from the Piedmont/Blue Ridge transition region but that the median value for areal diffusivity in the Piedmont northern region is significantly higher than in the Piedmont/Blue Ridge transition region (p=0.026) . In terms of the potential surface-water yield of the basins, the Tukey's MCT indicates that the median value for areal diffusivity decreases as the group rank-ing increases (p<0.001) . The group ranking of areal diffusivity does not correspond with the group ranking of potential surface-water yield for either the regions or the basins, which illustrates the difficulty of establishing the relation between base-flow characteristics and potential ground-water yield solely based on areal diffusivity. However, insight is provided by plotting areal diffusivity, which is grouped by potential sur-face-water yield, against the base-flow variability index (fig . 10) . A smooth line, determined by means ofa smoothing procedure (referred to as LOWESS) that uses robust least squares (Helsel and Hirsch, 1992, p . 46), suggests that areal diffusivity increases and potential surface-water yield decreases with

��
------------- - - - - - - -
----------------------
--------------------
--------------------
----------------------------
----------------------
-----------------
----------------------------
----------------------
--------------------
--------------------
Table 2. Summary statistics for aquifer properties by region and potential surface-water yield of basins [ft2 /d, feet squared per day]
Number Median 25th 75th Minimum Maximum
of sites percentile percentile
Areal Diffusivity (ft2/d)
Region: Valley and Ridge Blue Ridge - - - - - - - -Piedmont/Blue Ridge transition -Piedmont northern Piedmont southern
16 17 6 5 7
38,300 41,100 27,200 51,600 42,800
31,000 31,700 20,400 36,900 27,600
46,900 49,000 32,100 85,000 76,100
17,100 21,700 19,800 27,800 26,400
73,100 68,700 34,900 88,400 79,100
Potential surface-water yield : High Moderate ----------------Low
15 30 6
30,900 40,300 77,600
21,700 32,000 64,100
34,900 47,400 83,200
17,100 21,600 43,100
47,500 73,100 88,400
Study Area ----------------- 51 38,400 30,600 47,500 17,100 88,400
Areal Transmissivity (ft2 /d)
Region : Valley and Ridge Blue Ridge Piedmont/Blue Ridge transition - -Piedmont northern Piedmont southern
16 17 6 5 7
100 230 320 540 650
79 130 210 420 460
300 310 410 600 830
63 100 170 390 240
350 810 440 610 830
Potential surface-water yield : High -------------------Moderate Low -------------------
15 30 6
280 230 570
170 100 200
370 410 700
120 63 99
500 830 830
Study Area ----------------- 51 270 120 440 63 830
Storage Coefficient
Region : Valley and Ridge Blue Ridge Piedmont/Blue Ridge transition - -Piedmont northern Piedmont southern
16 17 6 5 7
.002 .006 .011 .008 .017
.002 .004 .008 .007 .008
.008
.008
.015
.014
.019
.001
.002
.008
.006 .006
.015
.018
.017
.016
.019
Potential surface-water yield : High Moderate ----------------Low
15 30 6
.008
.006
.007
.007
.002
.005
.012
.012 .009
.004
.001
.001
.019
.019 .011
Study Area ----------------- 51 .007 .004 .011 .001 .019
Relation to Potential Ground-Water Yield 21

���
a0 a0
v
W
BASE-FLOW VARIABILITY INDEX
EXPLANATION
POTENTIAL SURFACE-WATER YIELD OF BASIN
HIGH
o MODERATE
LOW
Figure 10 . Relation between areal diffusivity and base-flow variability index grouped by potential surface-water yield of basins .
increasing base-flow variability. Inasmuch as transmissivity and storage coefficient determine areal diffusivity, it would seem reasonable to assume that the negative relation between areal diffusivity and potential surface-water yield is in response to differences in ground-water storage .
Ideally, areas favorable for ground-water development would have high values for both areal transmissivity and storage coefficient . Rough estimates of areal transmissivity for the 51 continuous-record streamflow-gaging stations were calculated by using the following equation from Olmsted and Hely (1962, p . A18):
R + ET T I (2L) g ' (2)
where T is areal transmissivity (L2 /T), Rg is effective recharge (L3/T), ETg is riparian evapotranspiration (L3/T),
I is average ground-water gradient from divides to streams (L/L), and
L is length of discharge areas or total stream length (L) .
22 Base-Flow Characteristics of Streams in Virginia
The effective recharge rates (Rd determined in this investigation were nearly equal to rates calculated by Rutledge and Mesko (1996) ; therefore, values for riparian evapotranspiration (ETg) determined by Rutledge and Mesko (1996) were used in equation 2 . Average ground-water gradients from hydrologic divides to streams (I) were not readily available . Rough approximations for I, however, were determined using a procedure based on median basin relief and follows the assumption that the water-table profile mimics the topography of land surface . During the APRASA study, a Triangulated Irregular Network (TIN) (Environmental Systems Research Institute, 1992) was constructed to interpolate surface-elevation contours from the 30-second point-elevation data provided by the National Oceanic and Atmospheric Administration, National Geophysical Data Center. Median basin relief (in percent) is simply the median of all relief values calculated within a basin (T.O . Mesko, U.S . Geological Survey, written commun., 1994) . Median basin relief values were multiplied by the values for aquifer half-width to obtain estimates for the median elevation ofhydrologic divides above the streams within each basin . The median water-table elevation beneath the divides was assumed to be half the median elevation of the divides ; thus, the average ground-water gradient from divides to streams (I) is equal to the median water-table elevation divided by aquifer half-width . Values for total stream length (L) were determined by the previously mentioned ARC/ INFO procedure .
Values of areal transmissivity range from 63 to 830 ft2/d, with a median value of 270 ft'- /d (table 2) . Storage coefficients, which were estimated by dividing areal transmissivity by areal diffusivity, range from approximately 0.001 to 0.019 (dimensionless), with a median value of 0.007 (table 2) . These values for areal transmissivity and storage coefficient are consistent with values reported in the literature (Olmsted and Hely, 1962 ; Hely and Olmsted, 1963 ; Trainer and Wat-kins, 1974, 1975) . Median values for areal transmissivity and storage coefficient for the Piedmont and Piedmont/Blue Ridge transition regions generally are higher than those for the other regions as indicated by the Tukey's MCT; but the median value for storage coefficient for the Piedmont northern region is not significantly different from that of the other regions (p< 0.001) . Where grouped by potential surface-water yield of the basins, median values for these properties could not be statistically separated using Tukey's

�
MCT (p=0.073 and 0.294) . Areal transmissivity generally increases as storage coefficient increases ; however, basins with low potential surface-water yield generally have high values of areal transmissivity associated with low values of storage coefficient over a narrow range relative to those from basins designated as having moderate to high potential surface-water yield (fig . 11) . Similar to the earlier discussion concerning areal diffusivity and base-flow variability, values of storage coefficient can be different for the same value of areal transmissivity (fig . 11) . Although the basins with high potential surface-water yield tend to have comparatively low values for areal transmissivity, storage coefficients generally are large when compared to those from basins with similar values of areal transmissivity but different potential surfacewater yield . Giusti (1962, p . C129) concluded from an evaluation offloods and drought flows that differences in ground-water storage are related to variations in weathering rates and the degree of fracturing and
0 Q a0W
STORAGE COEFFICIENT
EXPLANATION
POTENTIALSURFACE-WATER YIELD OF BASIN
HIGH
MODERATE
LOW
LOWESS LINE
Figure 11 . Relation between areal transmissivity and storage coefficient grouped by potential surface-water yield of basins .
jointing . He also stated that similar rock types can have different capacities for ground-water storage .
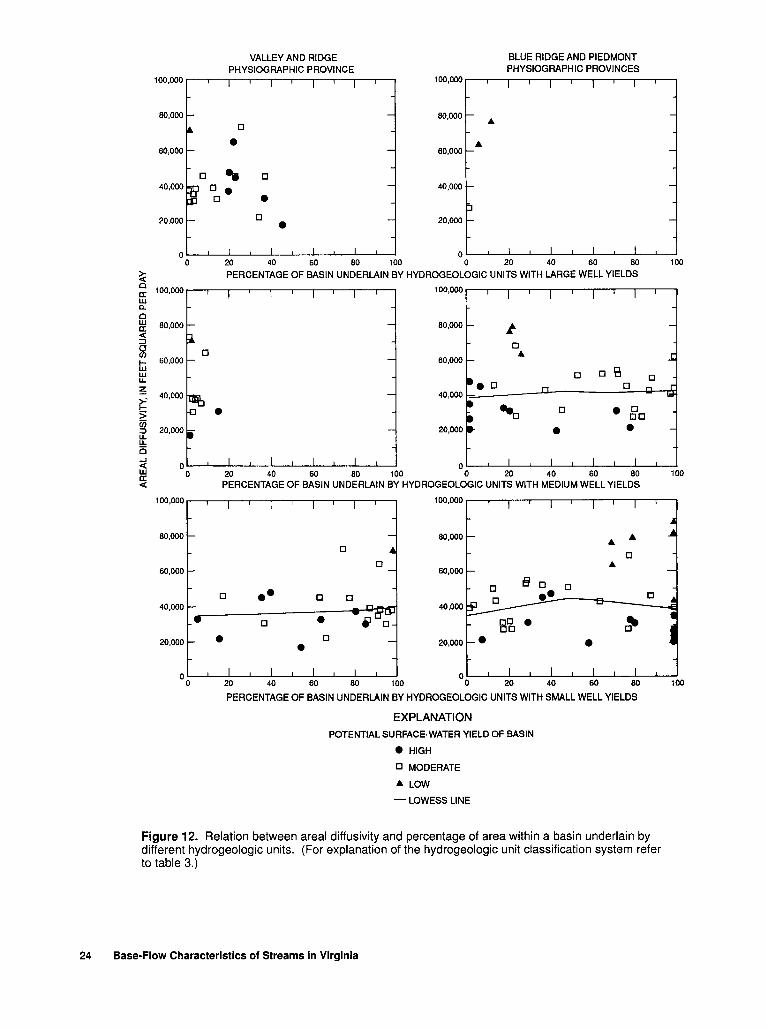
The above discussion suggests that potential ground-water yield is directly related to potential surface-water yield . Therefore, a relation between aquifer properties, grouped by potential surface-water yield, and well yields should exist . The APRASA study developed a hydrogeologic classification system, which separates the different rock types in the study area into 13 categories representing different ranges of specific capacity and well yield (Hollyday and others, 1992 ; Knopman and Hollyday, 1993; Mesko, 1993) . These rock categories were grouped into hydrogeologic units with large, medium, and small well yields for the Valley and Ridge Physiographic Province and for the Blue Ridge and the Piedmont Physiographic Provinces (table 3) . Areal diffusivity plotted against the percentage of the area within a basin underlain by the different hydrogeologic units where the individual data points are identified by their potential surface-water yield is shown in figure 12 . Generally, no trend is evident between areal diffusivity and the hydrogeologic units . Some of the high values of areal diffusivity are associated with basins predominantly underlain (greater than 50percent) by hydrogeologic units with small well yields, especially basins with a low potential surface-water yield. Areal transmissivity and storage coefficient plotted against the percentage of the area within a basin underlain by the different hydrogeologic units where the individual data points are identified by their potential surface-water yield are shown in figures 13 and 14 . Areal transmissivity and storage coefficient tend to decrease, which is the expected trend, as more ofthe basin is underlain by the hydrogeologic unit with small well yields in the Valley and Ridge Physio-graphic Province. A similar trend is indicated for the hydrogeologic unit with medium well yields in the Bkte Ridge and the Piedmont Physiographic Provinces . Areal transmissivity and storage coefficient tend to increase, which is not the expected trend, as more ofthe basin is underlain by the hydrogeologic unit with small well yields in the Blue Ridge and the Piedmont Physiographic Provinces .
Explanation of the different trends between aquifer properties, grouped by potential surface-water yield, and type of hydrogeologic unit may be related to the limited number of surface-water sites selected and approximations of variables used to estimate the aquifer properties . Although the estimated values for the
Relation to Potential Ground-Water Yield 23
������������������������
VALLEY AND RIDGE BLUE RIDGE AND PIEDMONT PHYSIOGRAPHIC PROVINCE PHYSIOGRAPHIC PROVINCES
100,000 100,000
80,000 80,000 p
60,000 60,000
p 40,000 40,000
20,000 20,000
0 0 0 20 40 60 80 100 0 20 40 60 80 100
PERCENTAGE OF BASIN UNDERLAIN BY HYDROGEOLOGIC UNITS WITH LARGE WELL YIELDS 0
100,000 100,000 w a 0 w 80,000 80,000
O p F- 60,000 60,000 w w
z 40,000 40,000
>_ t20,000 20,000
0 I
J0 0 1 I I I I I
w 0 20 40 60 80 100 0 20 40 60 80 100 PERCENTAGE OF BASIN UNDERLAIN BY HYDROGEOLOGIC UNITS WITH MEDIUM WELLYIELDS
100,000 100,000
80,000 80,000
60,000 60,000
- p 19 ° p p p p p ""
40,000 40,000 59
SO " O 20,000 p 20,000
I I I I I o f I I I I I 20 40 60 80 100 0 20 40 60 80 100
PERCENTAGE OF BASIN UNDERLAIN BY HYDROGEOLOGIC UNITS WITH SMALL WELL YIELDS
EXPLANATION POTENTIAL SURFACE-WATER YIELD OF BASIN
" HIGH
° MODERATE
LOW
-LOWESS LINE
Figure 12. Relation between areal diffusivity and percentage of area within a basin underlain by different hydrogeologic units . (For explanation of the hydrogeologic unit classification system refer to table 3 .)
24 Base-Flow Characteristics of Streams in Virginia

��������������������
VALLEY AND RIDGE BLUE RIDGE ANDPIEDMONT PHYSIOGRAPHIC PROVINCE PHYSIOGRAPHIC PROVINCES
1,000 1,000
800 800
600 600
3 400 400
69 Ep
200 F " 200
,7 p ~ M ~
0 1- I I I I 1 I I 1 I 0 0 20 40 60 80 100 0 20 40 60 80 100Q
PERCENTAGE OF BASIN UNDERLAIN BY HYDROGEOLOGIC UNITS WITH LARGE WELL YIELDS W 1000,, 1000a 0W
800 800 QV)FW W 600 600
z
400 400
200 200 z
0 I I I I I I IJ 0 ¢ 20 40 60 80 100 0 20 40 60 80 100W W PERCENTAGE OF BASIN UNDERLAIN BY HYDROGEOLOGIC UNITS WITH MEDIUM WELL YIELDS
1,000 1,000
O800
600 O
400
200
PERCENTAGE OF BASIN UNDERLAIN BY HYDROGEOLOGIC UNITS WITH SMALL WELL YIELDS
EXPLANATION POTENTIAL SURFACE-WATER YIELD OF BASIN
" HIGH
0 MODERATE
LOW
-LOWESS LINE
Figure 13 . Relation between areal transmissivity and percentage of area within a basin underlain by different hydrogeologic units . (For explanation of the hydrogeologic unit classification system refer to table 3 .)
Relation to Potential Ground-Water Yield 25

��������
VALLEY AND RIDGE BLUE RIDGE ANDPIEDMONT PHYSIOGRAPHIC PROVINCE PHYSIOGRAPHIC PROVINCES
0 .020 I I ' 0020 I. 1-'-I-~
3 0.015 0 0 .015
0 .010 0 .010
O
0 .005 0 .005
0 00 ~ I I I I 0 I ~ . I I I 0 20 40 60 80 100 0 20 40 60 80 100
PERCENTAGE OF BASIN UNDERLAIN BY HYDROGEOLOGIC UNITS WITH LARGEWELL YIELDS 0.020 0.020 I r--Q~-r
0
FZ 0.015 0.015wU
0 w O 0.010 0.010U w c0 a
0 0.005 0.005
N 0-
�oo'0 20 40 60 so 100 0 20 40 60 so 100
PERCENTAGE OF BASIN UNDERLAIN BY HYDROGEOLOGIC UNITS WITH MEDIUM WELL YIELDS 0 .020 0.020
0.015 0 0 .015
0 .010 0.010
0.005 0.005
O O
1 I I I 0 20 40 60 80 100 0 20 40 60 8o 100 PERCENTAGE OF BASIN UNDERLAIN BY HYDROGEOLOGIC UNITS WITH SMALLWELL YIELDS
EXPLANATION POTENTIAL SURFACE-WATER YIELD OF BASIN
" HIGH
0 MODERATE
LOW
-LOWESS LINE
Figure 14 . Relation between storage coefficient and percentage of area within a basin underlain bydifferent hydrogeologic units . (For explanation of the hydrogeologic unit classification system refer to table 3 .)
26 Base-Flow Characteristics of Streams in Virginia

�
---------- -
---------
-------- ---------- -
---------
Table 3. Description of the Appalachian Valley and Piedmont Regional Aquifer-System Analysis hydrogeologic unit classification system [gal /min, gallon per minute]
Physiographic province
Grouping variables Hydrogeologic unit Rock categories
Valley and Ridge -------- Lithology and Small well yields Siliciclastics, argillaceous carbonates specific capacity -- Medium well yields - - - - - Limestone
Large well yields Dolomite, mixtures of limestone and dolomite, alluvium
Blue Ridge and Piedmont - - - Well yield Small well yields Medium well yields - - - - -
Well yields range from 0 to 10 gal/min Well yields range from 10 to 20 gal/min
Large well yields Well yields greater than 20 gal/min
aquifer properties are considered to be reasonable, additional sites and ground-water data are needed to fully evaluate potential ground-water yield. Furthermore, the estimated aquifer properties may be representative of the unconsolidated regolith and not of the fractured bedrock, especially in the Piedmont regions . In addition, most of the wells in the study area are finished in the fractured bedrock with casing extending to or below the regolith-bedrock contact ; whereas the streams in the study area generally flow along or near the regolith-bedrock contact (Nutter and Otton, 1969, p. 15 ; Richardson, 1982, p. 6 ; Swain and others, 1991, p. 12) . Exceptions to these explanation are (1) areas in the Valley and Ridge region underlain by carbonate rocks and sandstone with thin regolith, (2) areas in the Blue Ridge and the Piedmont regions underlain by massive or foliated crystalline rocks with thin regolith, and (3) the Mesozoic sedimentary basins in the Piedmont regions (Swain and others, 1991) .
Another possible explanation is that the well-yield classification system may not account for differences on a Statewide scale, which is possible, because the classification system was developed for the entire APRASA study area. For example, a majority ofthe basins with high potential surface-water yield and predominantly underlain (greater than 50-percent) by the hydrogeologic unit with small well yields are in the Piedmont/Blue Ridge transition region. Well-yield data from Dawson and Davidson (1979) for high capacity wells within this region have a median value of 30 gal/min, which is characteristic of the hydrogeologic unit with large well yields in the Blue Ridge and the Piedmont Physiographic Provinces . The base-flow characteristics of a basin may provide a relative indication of the potential ground-water yield, but other factors need to be considered, such as geologic structure, lithology, precipitation, relief, and degree of
hydraulic interconnection between the regolith and bedrock .
SUMMARY AND CONCLUSIONS
Growth within the Valley and Ridge, the Blue Ridge, and the Piedmont Physiographic Provinces of Virginia has focussed concern about allocation of surface-water flow and increased demands on the ground-water resources . The purpose of this report is to (1) describe the base-flow characteristics of streams, (2) identify regional differences in these flow characteristics, and (3) describe, if possible, the poten-tial surface-water and ground-water yields of basins on the basis of the base-flow characteristics .
Base-flow characteristics are presented for streams in the Valley and Ridge, the Blue Ridge, and the Piedmont Physiographic Provinces of Virginia . The provinces are separated into five regions : (1) Valley and Ridge, (2) Blue Ridge, (3) Piedmont/Blue Ridge transition, (4) Piedmont northern, and (5) Pied-mont southern . Different flow statistics, which represent streamflows predominantly comprised of base flow, were determined for 217 continuous-record streamflow-gaging stations from historical mean daily discharge and for 192 partial-record streamflowgaging stations by means of correlation of discharge measurements . Variability of base flow is represented by the loglo of the ratio of Q50 to Q90. Effective recharge rates were also calculated.
Mean base flow ranges from 0.01 to 2.44 (ft3 /s)/ mi', with a median value of0.61 (ft 3 /s)/mil . The Q5o , which is a flow-duration statistic commonly used to estimate mean base flow, ranges from 0.00 to 2 .26 (ft 3/s)/mil , with a median value of 0 .55 (ft3 /s)/mil . The Q5o is an excellent estimator of mean base flow
Summary and Conclusions 27

�
for the Piedmont/Blue Ridge transition region and the Piedmont southern region, but tends to underestimate mean base flow for the remaining regions . Low-flow statistics (Q9o, Q95 , 7Q2, and 7QI0) represent base flow after periods of sparse recharge or drought and range from 0.00 to 0.76 (ft3/s)/mi', with median val-ues that range from 0.05 (ft3/s)/miz for 7Q10 to 0.15 (ft3 /s)/mil for Q9o . The base-flow variability index ranges from 0.07 to 2 .27, with a median value of 0.55 . Effective recharge rates range from 0.07 to 33.07 in/ yr, with a median value of 8 .32 in/yr.
Differences in the base-flow characteristics exist between regions . The median discharges for the Val-ley and Ridge, the Blue Ridge, and the Piedmont/Blue Ridge transition regions are higher than those for the Piedmont regions . Results from statistical analysis indicate that the regions can be ranked in terms of base-flow characteristics from highest to lowest as follows: (1) Piedmont/Blue Ridge transition, (2) Valley and Ridge and Blue Ridge, (3) Piedmont southern, and (4) Piedmont northern . The flow statistics are consistently higher and the values for base-flow variability are lower for basins within the Piedmont/Blue Ridge transition region relative to those from the other regions, whereas the basins within the Piedmont northern region show the opposite pattern .
Potential surface-water yield is a qualitative designation of the capacity of streams within a region or individual basin to sustain base flow and is based on the statistical analysis of base-flow characteristics of streams in the study area . In terms ofregions, the group rankings of the base-flow characteristics were used to designate the potential surface-water yield . In terms of individual basins, an approach developed for this investigation assigns a rank for potential surface-water yield to a basin according to the quartiles in which the values for the base-flow characteristics are located . Both procedures indicate that the Valley and Ridge, the Blue Ridge, and the Piedmont/Blue Ridge transition regions have moderate-to-high potential surface-water yield and the Piedmont regions have low-to-moderate potential surface-water yield.
Potential ground-water yield is the capacity of the ground-water reservoir to store and transmit water. Base-flow characteristics may provide a relative indication of the potential ground-water yield for areas that lack sufficient specific capacity or well-yield data. In order to indicate potential ground-water yield from base-flow characteristics, aquifer properties for 51 streamflow-gaging stations with continuous stream
28 Base-Flow Characteristics of Streams in Virginia
flow data were determined by methods that use streamflow records and basin characteristics . Areal diffusivity ranges from 17,100 to 88,400 ft2 /d, with a median value of 38,400 ft' /d . Areal transmissivity
'/d, with a median value ofranges from 63 to 830 ft -270 ft' /d . Storage coefficients, which were estimated by dividing areal transmissivity by areal diffusivity, range from approximately 0.001 to 0.019 (dimension-less), with a median value of 0.007 .
Statistical analysis ofmedian values of areal diffusivity indicate that the Piedmont northern and southern, the Valley and Ridge, and the Blue Ridge regions do not differ significantly from one another, and the latter three regions do not differ significantly from the Piedmont/Blue Ridge transition region ; but, the median value of areal diffusivity in the Piedmont northern region is significantly higher than it is in the Piedmont/Blue Ridge transition region . The median value for areal diffusivity decreases as potential surface-water yield of the basins increases . The ranking of areal diffusivity does not correspond with the ranking of potential surface-water yield for either the regions or the basins, which illustrates the difficulty of establishing the relation between base-flow character-istics and potential ground-water yield solely based on areal diffusivity. Statistical analysis indicates that the Piedmont and the Piedmont/Blue Ridge transition regions generally have median values of areal transmissivity and storage coefficient that are higher than those in the other regions ; but the median value of storage coefficient for the Piedmont northern region does not differ significantly from that in the other regions . Where grouped by potential surface-water yield of the basins, median values of areal transmissiv-ity and storage coefficient could not be statistically separated. Areal transmissivity generally increases as storage coefficient increases ; however, basins with low potential surface-water yield generally have high values of areal transmissivity associated with low values ofstorage coefficient over a narrow range relative to basins designated as having moderate-to-high poten-tial surface-water yield . Although the basins with high potential surface-water yield tend to have comparatively low values of areal transmissivity, storage coefficients generally are large when compared to those from basins with similar values oftransmissivity but different potential surface-water yield .
Aquifer properties were grouped by potential surface-water yield and were related to hydrogeologic units categorized by large, medium, and small well

�
yields for the Valley and Ridge Physiographic Province and for the Blue Ridge and the Piedmont Physiographic Provinces . Generally, no trend is evident between areal diffusivity and hydrogeologic units . Some of the high values of areal diffusivity are associated with basins predominantly underlain by hydrogeologic units with small well yields, especially basins with a low potential surface-water yield . Areal transmissivity and storage coefficient tend to decrease, which is the expected trend, as more ofthe basin is underlain by the hydrogeologic unit with small well yields in the Valley and Ridge Physiographic Province . A similar trend is indicated for the hydrogeologic unit with medium well yields in the Blue Ridge and the Piedmont Physiographic Provinces . Areal transmissivity and storage coefficient tend to increase, which is not the expected trend, as more ofthe basin is underlain by the hydrogeologic unit with small well yields in the Blue Ridge and the Piedmont Physiographic Provinces . Explanation of the different trends between aquifer properties and type of hydrogeologic unit may be related to the limited number of surfacewater sites selected and approximations of variables used to estimate the aquifer properties . The base-flow characteristics of a basin may provide a relative indication of the potential ground-water yield; but other factors need to be considered, such as geologic structure, lithology, precipitation, relief, and degree of hydraulic interconnection between the regolith and bedrock .
SELECTED REFERENCES
Arihood, L.D., and Glatfelter, D.R ., 1991, Method for esti-mating low-flow characteristics of ungaged streams in Indiana : U.S . Geological Survey Water-Supply Paper 2372, 18 p .
Butts, Charles, 1940, Geology of the Appalachian Valley in Virginia : Virginia Geological Survey Bulletin 52, 568 p-
Carlston, C .W., 1963, Drainage density and streamflow : U.S . Geological Survey Professional Paper 422--C, 8 p .
Cederstrom, D.J ., 1972, Evaluation of yields of wells in consolidated rocks, Virginia to Maine : U.S . Geologi-cal Survey Water-Supply Paper 2021, 38 p .
Conley, J.F., 1978, Geology of the Piedmont ofVirginia : Interpretation and problems, in Contributions to Virginia Geology-III : Virginia Division of Mineral Resources Publication 7, p . 115-149 .
1985, Geology ofthe southwestern Virginia Piedmont : Virginia Division of Mineral Resources Publication 59, 33 p .
1989, Geology of the Rocky Mount, Gladehill, Pen-hook, and Mountain Valley Quadrangles, Virginia : Virginia Division of Mineral Resources Publication 90, Part C, 15 p.
Conley, J.F., and Henika, W.S ., 1973, Geology of the Snow Creek, Martinsville East, Price, and Spray Quadran-gles, Virginia: Virginia Division ofMineral Resources Report of Investigations 33, 71 p.
Cushing, E .M., Kantrowitz, I.H ., and Taylor, K.R ., 1973, Water resources ofthe Delmarva Peninsula : U.S . Geo-logical Survey Professional Paper 822, 58 p .
Dawson, J.W., and Davidson, C.B ., 1979, Groundwater resources of Henry County, Virginia : Virginia State Water Control Board Planning Bulletin 312, 69 p .
Dempster, G.R., comp., 1990, National Water Information System user's manual, Automated Data Processing System : U.S . Geological Survey Open-File Report 90-116, v. 2, chap . 3 [variously paged] .
Drake, A.A., Jr., Sinha, A.K., Land, Jo, and Guy, R.E ., 1989, The Taconic orogeny, in Hatcher, R.D ., Jr., Thomas, W.A., and Viele, G.W., eds ., The Appala chian-Ouachita orogen in the United States, v . F-2 ofThe geology ofNorth America: Boulder, Colo ., Geological Society of America, p . 101-177 .
Environmental Systems Research Institute, 1992, Surface modeling with TIN, ARC/INFO User's Guide : Redlands California [variously paged] .
Fenneman, N.M., 1938, Physiography of Eastern United States : New York, McGraw Hill, 534 p .
Fisher, G.W., 1970, The Piedmont : Introduction, in Fisher, G.W., Pettijohn, F.J ., Reed, J.C ., Jr., and Weaver, K.N., eds ., Studies of Appalachian geology : Central and southern : New York, Wiley-Interscience, p . 295-298 .
Froelich, A.J ., 1985, Map and geotechnical properties of surface materials of the Culpeper Basin and vicinity, Virginia and Maryland : U.S . Geological Survey Miscellaneous Investigations Series Map I-1313-E, scale 1 :125,000 .
Giese, G.L ., and Mason, R.R., Jr., 1993, Low-flow charac-teristics ofstreams in North Carolina : U .S . Geological Survey Water-Supply Paper 2403, p . 29 .
Giusti, E.V, 1962, A relation between floods and drought flows in the Piedmont Province in Virginia, in Short papers in geology and hydrology, Articles 60-119, Geological Survey Research 1969 : U.S . Geological Survey Professional Paper 450-C, p . C 128-C 129.
Hack, J.T ., 1965, Geomorphology of the Shenandoah Valley Virginia and West Virginia and origin of the residual ore deposits : U.S . Geological Survey Professional Paper 484, 84 p .
Selected References 29

�
1982, Physiographic divisions and differential uplift of the Piedmont and Blue Ridge: U.S . Geological Survey Professional Paper 1265, 49 p.
1989, Geomorphology ofthe Appalachian High-lands, in Hatcher, R.D., Jr., Thomas, W.A., and Viele, G.W., eds., The Appalachian-Ouachita orogen in the United States, v. F-2 of The geology of North America: Boulder, Colo ., Geological Society of America, p. 459-470.
Hamilton, P.A ., Shedlock, R.J ., and Phillips, P.J ., 1991, Water-quality assessment ofthe Delmarva Peninsula, Delaware, Maryland, and Virginia-Analysis of avail-able ground-water-quality data through 1987 : U.S . Geological Survey Water-Supply Paper 2355-B, 65 p.
Hayes, D.C ., 1991, Low-flow characteristics of streams in Virginia : U.S . Geological Survey Water-Supply Paper 2374, 69 p.
Helsel, DR., and Hirsch, R.M., 1992, Statistical methods in water resources, Studies in environmental science 49 : New York, Elsevier Science Publishers, 522 p.
Hely, A.G ., and Olmsted, F.H ., 1963, Some relations between streamflow characteristics and the environment in the Delaware River region : U.S. Geological Survey Professional Paper 417-B, 21 p.
Henika, W.S ., 1977, Geology of the Blairs, Mount Hermon, Danville, and Ringgold Quadrangles, Virginia : Virginia Division of Mineral Resources Publication 2, 45 p.
Hollyday, E.F., Knopman. D.S ., Smith,M.A ., and Hileman, G.E ., 1992, Statistical analysis ofwell records for use in classifying and mapping hydrogeologic terranes in the Valley and Ridge province, in Hotchkiss, W.R., and Johnson, A.I ., eds., Regional aquifer systems of the United States, aquifers of the southern and eastern states : 27th Annual Conference of American Water Resources Association, New Orleans, La., 1991 : American Water Resources Association Monograph Series, no . 17, p . 75-92.
Horton, R.E ., 1945, Erosional development of streams and their drainage basins ; hydrophysical approach to quantitative morphology : Geological Society of America Bulletin, v. 56, p. 275-370.
King, P.B ., 1950, Geology ofthe Elkton area, Virginia : U.S . Geological Survey Professional Paper 230, 82 p.
Knopman, D.S ., 1990, Factors related to the water-yielding potential of rocks in the Piedmont and Valley and Ridge Provinces of Pennsylvania: U.S . Geological Survey Water-Resources Investigations Report 90-4174, 52 p .
Knopman, D.S ., and Hollyday, E.F., 1993, Variation in specific capacity in fractured rocks, Pennsylvania: Ground Water, v. 31, no . 1, p. 135-145.
Laczniak, R.J ., and Zenone, Chester, 1985, Ground-water resources of the Culpeper Basin, Virginia and Mary
30 Base-Flow Characteristics of Streams in Virginia
land : U.S . Geological Survey Miscellaneous Investi-gations Map I-1313-H, 2 sheets, scale 1 :125,000 .
Leonard, R.B ., 1962, Ground-water geology along the northwest foot of the Blue Ridge between Arnold Valley and Elkton, Virginia : Blacksburg, Virginia Polytechnic Institute and State University, Ph.D . dissertation .
Lichtler, W.F., and Wait, R.L ., 1974, Summary of the ground-water resources of the James River Basin, Virginia : U.S . Geological Survey Open-File Report 74-139, 54 p.
Lynch, D.D., 1987, Hydrologic conditions and trends in Shenandoah National Park, Virginia : U.S . Geological Survey Water-Resources Investigations Report 874131, 115 p.
Lynch, D.D., Nuckels, E.H ., and Zenone, Chester, 1987, Low-flow characteristics and chemical quality of streams in the Culpeper geologic basin, Virginia and Maryland : U.S . Geological Survey Miscellaneous Investigations Map 1-1313-F, 2 sheets, scale 1 :125,000 .
Mesko, T.O ., 1993, Delineation of hydrogeologic terranes in the Piedmont and Blue Ridge Physiographic Provinces-Southeastern and Mid-Atlantic United States [abs .] : American Association of Petroleum Geologists Bulletin, v. 77/8, p. 1471 .
Meyer, Gerald, Wilmoth, B.M., and LeGrand, H.E ., 1965, Availability of ground water in the Appalachian region, in Schneider, W.J ., and others, Water resources of the Appalachian region, Pennsylvania to Alabama: U.S . Geological Survey Hydrologic Investigations Atlas HA-198, 11 sheets, scale 1 :2,500,000 .
Milici, R.C ., Spiker, C.T., Jr., and Wilson, J.M ., comps., 1963, Geologic map ofVirginia : Charlottesville, Virginia Division of Mineral Resources, scale 1 :500,000 .
Mohler, E.H ., Jr., and Hagan, G.F., 1981, Low flow of streams in Fairfax County, Virginia : U.S . Geological Survey Open-File Report 81-63, 30 p.
Nuckels, E.H ., 1970, Virginia streamflow data program analysis : U.S . Geological Survey Open-File Report, 54 p.
Nuckels, E.H ., and Prugh, B .J ., Jr., 1991, National water summary 1988-89-Hydrologic events and floods and droughts, with a section on General climatology, by P.J . Michaels : U.S . Geological Survey Water-Supply Paper 2375,p. 543-550.
Nutter, L.J, and Otton, E.G., 1969, Ground-water occur-rence in the Maryland Piedmont : Maryland Geological Survey Report ofInvestigations No . 10, 56 p.
Olmsted, F.H ., and Hely, A.G ., 1962, Relation between ground water and surface water in Brandywine Creek basin, Pennsylvania : U.S . Geological Survey Profes-sional Paper 417-A, 21 p.
�
Pavich, M.J ., Leo, G.W., Obermeier, S.F., and Estabrook, J.R ., 1989, Investigations of the characteristics, origin, and residence time of the upland residual mantle of the Piedmont of Fairfax County, Virginia : U.S . Geological Survey Professional Paper 1352, 58 p.
Pavlides, Louis, 1981, The Central Virginia Volcanic-Plutonic Belt : An island arc of Cambrian(?) age: U.S . Geological Survey Professional Paper 1231-A, 34 p.
Pettijohn, F.J ., 1970, The Valley and Ridge-Stratigraphy and sedimentation, Introduction, in Fisher, G.W., Petti-john,F.J., Reed, J.C ., Jr., and Weaver, K.N., eds ., Stud-ies ofAppalachian geology: Central and southern : New York, Wiley-Interscience, p. 1-3 .
Prugh, B.J., Jr., and Scott, W.B ., 1986, National water sum-mary 1985-Hydrologic events and surface-water resources : U.S . Geological Survey Water-Supply Paper 2300, p. 467-472.
Rast, Nicholas, 1989, The evolution of the Appalachian chain, in Bally, A.W., and Palmer,A.R ., eds., The geol-ogy ofNorth America-An overview, v. A of The geology ofNorth America: Boulder, Colo ., Geological Society of America, p. 323-348.
Reed, J.C ., Jr., 1970, The Blue Ridge and the Reading Prong: Introduction, in Fisher, G.W., Pettijohn, F.J ., Reed, J.C ., Jr., and Weaver, K.N., eds., Studies of Appalachian geology: Central and southern : New York, Wiley-Interscience, p. 195-197.
Richardson, C.A., 1982, Ground water in the Piedmont Upland of Central Maryland : U.S . Geological Survey Water-Supply Paper 2077, 42 p.
Riggs, H.C ., 1964, The relation of discharge to drainage area in the Rappahannock River Basin, Virginia, in Geological Survey Research 1964: U.S . Geological Survey Professional Paper 501-B, p . B165-B168.
1965, Effect of land use on the low flows of streams in Rappahannock, Virginia, in Geological Survey Research 1965 : U.S . Geological Survey Professional Paper 525-C, p. C196-C198 .
Rorabaugh, M.I . 1960, Use of water-levels in estimating aquifer constants in a finite aquifer: International Association of Scientific Hydrology Publication No. 52, p. 314-323.
1964, Estimating changes in bank storage as groundwater contribution to streamflow : International Asso-ciation of Scientific Hydrology Publication No. 63, p. 432-441 .
Rorabaugh, M.I ., and Simons, W.D., 1966, Exploration of methods ofrelating ground water and surface water, Columbia River Basin-Second phase: U.S . Geologi cal Survey Open-File Report, 62 p.
Rutledge, A.T., 1992, Methods of using streamflow records for estimating total and effective recharge in the Appa-lachian Valley and Ridge, Piedmont, and Blue Ridge Physiographic Provinces, in Hotchkiss, W.R ., and Johnson, A.I ., eds., Regional aquifer systems of the
United States, aquifers of the southern and eastern states : 27th Annual Conference of American Water Resources Association, New Orleans, La ., 1991 : American Water Resources Association Monograph Series, no . 17, p. 59-73.
1993, Computer programs for describing the reces-sion of ground-water discharge and for estimating mean ground-water recharge and discharge from streamflow records: U.S . Geological Survey Water-Resources Investigations Report 93-4121, 45 p.
Rutledge, A.T., and Mesko, T.O ., 1996, Estimated hydro-logic characteristics of shallow aquifer systems in the Valley and Ridge, the Blue Ridge, and the Piedmont Physiographic Provinces based on analysis of streamflow recession and base flow : U.S . Geological Survey Professional Paper 1422-B, 58 p.
Searcy, J.K ., 1959, Flow-duration curves, Manual ofhydrology: Part 2. Low-flow techniques : U.S . Geological Survey Water-Supply Paper 1542-A, 33 p.
Schneider, W.J ., and Friel, E.A ., 1965, Low flows in the region, in Schneider, W.J ., and others, Water resources ofthe Appalachian region, Pennsylvania to Alabama: U.S . Geological Survey Hydrologic Investigations Atlas HA-198, 11 sheets, scale 1 :2,500,000 .
Smith R.W, 1981, Rock type andminimum 7-day/10-year flow in Virginia streams : Virginia Water Resources Research Center Bulletin 116, 43 p .
Sun, R.J ., 1986, Regional Aquifer-System Analysis program ofthe U.S . Geological Survey-Summary ofprojects, 1978-84: U.S . Geological Survey Circular 1002, 264p.
Swain, L.A ., Hollyday, E.F ., Daniel, C.C .,111, and Zapecza, O.S., 1991, Plan of study for the Regional Aquifer-Sys-tem Analysis of the Appalachian Valley and Ridge, Piedmont, and Blue Ridge Physiographic Provinces of the Eastern and Southeastern United States, with a description of study-area geology and geohydrology : U.S . Geological Survey Water-Resources Investiga-tions Report 91-4066, 44 p.
Trainer, F.W., 1969, Drainage density as an indicator ofbase flow in part ofthe Potomac River Basin, in Geological Survey Research 1969 : U.S . Geological Survey Pro fessional Paper 650-C, p . C177-C183 .
Trainer, F.W., and Watkins, F.A ., Jr., 1974, Use of base-runoffrecession curves to determine areal transmissivities in the upper Potomac River Basin, in U.S . Geolog ical Journal of Research, v. 2, no . 1, p. 125-131 .
1975, Geohydrologic reconnaissance of the upper Potomac River Basin: U.S . Geological Survey WaterSupply Paper 2035, 68 p.
U.S . Environmental Protection Agency, 1987, Handbook groundwater: U.S . Environmental Protection Agency EPA/625/6-87/016, 212 p.
U.S . Geological Survey, 1974, Hydrologic unit map-1974, State of Virginia, scale 1 :500,000 .
Selected References 31
��
Weaver, K.N., 1970, The Valley and Ridge and Appalachian Plateau Structure and tectonics, Introduction, in Fisher, G.W., Pettijohn, F.J ., Reed, J.C ., Jr., and Weaver, K.N ., eds., Studies of Appalachian geology: Central and southern : New York, Wiley-Interscience, p. 125-126.
Wehr, Frederick, and Glover, Lynn, III, 1985, Stratigraphy and tectonics of the Virginia-North Carolina Blue Ridge: Evolution of a late Proterozoic-early Paleozoic hinge zone : Geological Society of America Bulletin, v. 96, no . 3, p. 285-295.
Wyrick, G.G ., 1968, Ground-water resources of the Appala-chian region : U.S . Geological Survey Hydrologic Investigations Atlas HA-295, 4 sheets, scale 1 :3,168,000 .
32 Base-Flow Characteristics of Streams in Virginia

APPENDIXES

-------------------------------- - - ---------------- - - -
- - - - - - - - - - -
- - - - - - - - - - -
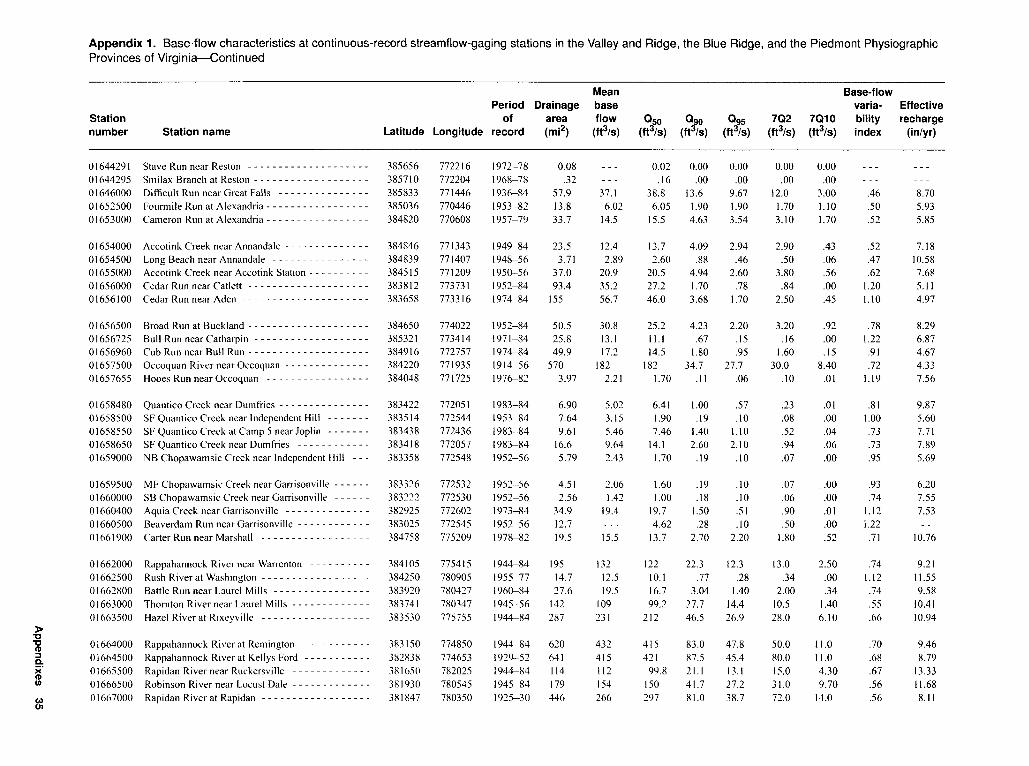
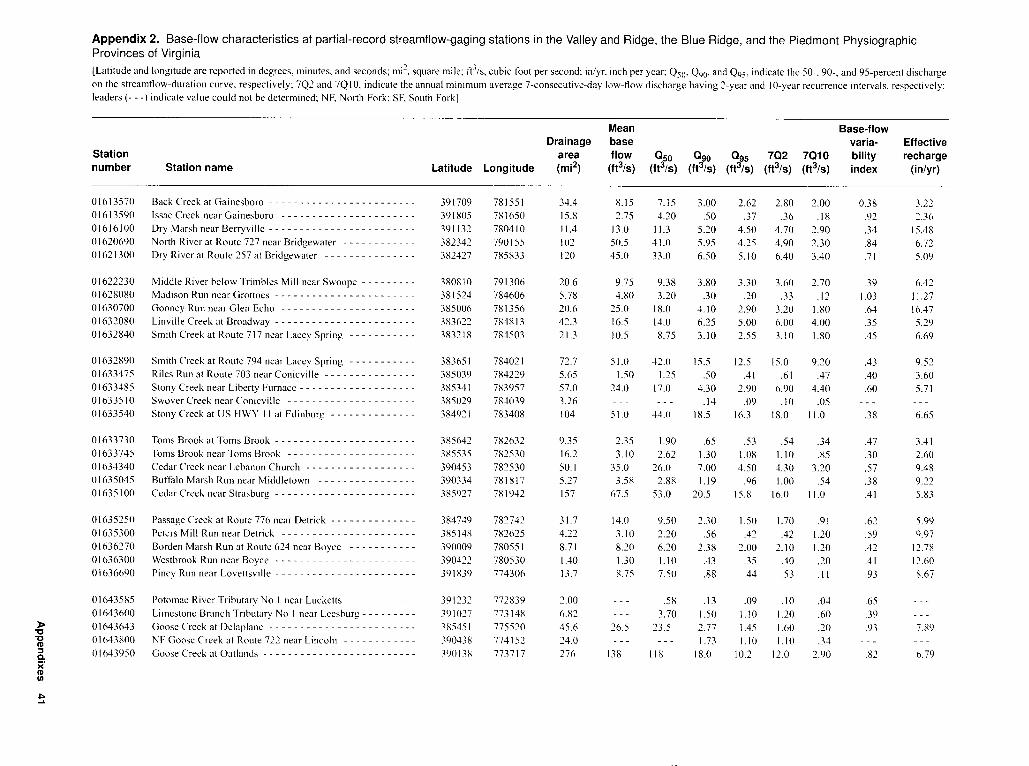
Appendix 1 . Base-flow characteristics at continuous-record streamflow-gaging stations in the Valley and Ridge, the Blue Ridge, and the Piedmont PhysiographicProvinces of Virginia [Latitude and longitude are reported in degrees, minutes, and seconds; mi'`, square mile ; ft 3 /s, cubic foot per second ; in/yr, inch per year; Q50, Q90, and Q95 , indicate the 50-, 90-, and 95-percent discharge on the streamflow-duration curve, respectively; 7Q2 and 7Q10, indicate the annual minimum average 7-consecutive-day low-flow discharge having 2-year and 10-year recurrence intervals, respectively ; leaders( ---) indicate value could not be determined; NB, North Branch ; SB, South Branch ; MF, Middle Fork ; NF, North Fork ; SF, South Fork ; Cr., Creek; nr, near]
Mean Base-flow Period Drainage base varia- Effective
Station of area flow 050 090 Q95 702 7010 bility rechargenumber Station name Latitude Longitude record (mil) (ft3/S) (ft3/S) (ft3/S) (ft3/S) (ft3/S) (ft3/S) index (in/yr)
01613900 HogueCreek near Hayfield 391252 781718 1962-84 15 .0 8.46 5.05 1 .00 0.77 0.75 0.37 0.70 7.66 01615000 Opequon Creek near Berryville 391040 780420 1945-84 57 .4 20 .6 17 .4 4.66 3.41 4.50 1 .40 .57 4.86 01615500 Abrams Creek at Winchester - 390950 781015 1946-49 5.60 4.42 3.50 2.30 2.10 1.20 .85 .18 10.71 01616000 Abrams Creek near Winchester 391040 780510 1951-84 16 .5 17 .8 17 .1 9.02 8.25 9.60 6.50 .28 14.66 01620500 North River near Stokesville - 382015 791425 1948-84 17 .2 16 .3 12 .2 .95 .54 .68 .21 1 .11 12 .89
01621000 Dry River at Rawley Springs - - - - - - - - - - - - - - - - 383010 790314 1946-47 72 .6 30 .4 25 .2 2.60 .72 .83 .12 .99 5 .69 01622000 North River near Burketown - - - - - - - - - - - - - - - - 382025 785450 1928-84 379 246 201 62 .9 52 .6 58 .0 39 .0 .50 8.83 01623000 Bell Creek at St Pauls Chapel near Staunton ------ 381000 790735 1949-55 .61 --- .00 .00 .00 .00 .00 --- --01623500 Bell Creek near Staunton------------------- 381100 790705 1949-55 3.80 --- .00 .00 .00 .00 .00 --- --01624000 Bell Creek at Franks Mill near Staunton -------- 381310 790635 1949-56 9.60 - - - .72 .10 .10 .00 .00 .86 --
01624300 Middle River near Verona ------------------ 381436 790208 1969-84 178 134 109 43 .4 36 .3 39 .0 28 .0 .40 10 .24 01624800 Christians Creek near Fishersville - - - - - - - - - - - - - 380742 785941 1969-84 70.1 52 .8 44 .4 17 .6 14 .8 17 .0 11 .0 .40 10 .23 01625000 Middle River near Grottoes ----------------- 381542 785144 1929-84 375 216 185 79 .5 66 .9 77 .0 52 .0 .37 7.83 01626000 South River near Waynesboro --------------- 380327 785430 1954-84 127 105 78 .5 32 .0 28 .5 30 .0 24 .0 .39 11 .21 01626500 South River at Waynesboro ----------------- 380340 785350 1930-52 144 109 92 .0 36 .4 32 .1 37 .0 26 .0 .40 10 .29
01626850 South River near Dooms - - - - - - - - - - - - - - - - - - - 380519 785238 1976-84 149 150 122 57 .0 52 .7 55 .0 45 .0 .33 13 .68 01627500 South River at Harriston ------------------- 381307 785013 1926-84 212 186 156.6 68 .1 58 .8 66 .0 48 .0 .36 11 .93 01628060 White Oak Run near Grottoes --------------- 381501 784457 1981-84 1.94 --- .43 .00 .00 .00 .00 --- --01628150 Deep Run near Grottoes ------------------- 381623 784536 1981-82 1.17 .58 .21 .03 .03 .09 .05 85 6.75 01628500 SF Shenandoah River near Lynnwood - - - - - - - - - - 381921 784518 1962-84 1,084 710 595 221 188 227 147 .43 8.90
01631000 SF Shenandoah River at Front Royal ----------- 385450 781240 1956-84 1,642 1,064 898 370 318 344 235 .39 8.80 01632000 NF Shenandoah River at Cootes Store - - - - - - - - - - 383813 785111 1926-84 210 89 .0 61 .8 4.71 2.20 3.20 .77 1 .12 5.75 01632900 Smith Creek near New Market --------------- 384136 783835 1962-84 93 .2 55 .2 45 .0 14.8 11 .4 14 .0 8.00 .48 8.04 01633000 NF Shenandoah River at Mount Jackson -------- 384444 783821 1945-84 506 237 187 45 .4 32 .1 37 .0 18 .0 .61 6.35 01633500 Stony Creek at Columbia Furnace - - - - - - - - - - - - - 385155 783745 1947-56 79 .4 42 .0 32 .6 8.00 6.84 5.80 3.30 .61 7.17
01634500 Cedar Creek near Winchester - - - - - - - - - - - - - - - - 390452 781947 1939-84 103 56.6 40.4 10.0 7.77 7.70 4.30 .61 7.46 01635500 Passage Creek near Buckton - - - - - - - - - - - - - - - - 385729 781601 1933-84 87 .8 40.2 25 .3 4.16 2.40 2.80 1 .30 .78 6.22 01638480 Catoctin Creek at Taylorstown --------------- 391516 773436 1973-84 89 .6 60.6 52 .6 9.30 6.81 6.80 2.90 .75 9.18 01643700 Goose Creek near Middleburg --------------- 385911 774749 1967-84 123 97 .1 86.0 10.6 5.96 6.00 .71 .91 10.72 01644000 Goose Creek near Leesburg ----------------- 390110 773440 1931-84 332 191 160 19.5 10.2 12 .0 2.50 .91 7.79
�
-------------------- --- --- ------ --- ---
-------------------------------------------------
Appendix 1 . Base-flow characteristics at continuous-record streamflow-gaging stations in the Valley and Ridge, the Blue Ridge, and the Piedmont Physiographic Provinces of Virginia-Continued
Mean Base-flow Period Drainage base varia- Effective
Station of area flow 050 090 095 702 7Q10 bility recharge number Station name Latitude Longitude record (mi l ) (ft3/S) (ft3 /S) (ft3 /S) (ft3 /S) (ft 3/S) (ft 3/S) index (in/yr)
01644291 Stave Run near Reston 385656 772216 1972-78 0.08 0 .02 0.00 0.00 0 .00 0.00 01644295 Smilax Branch at Reston ------------------ 385710 772204 1968-78 .32 .16 .00 .00 .00 .00 01646000 Difficult Run near Great Falls 385833 771446 1936r-84 57 .9 37 .1 38 .8 13 .6 9.67 12 .0 3.00 .46 8 .70 01652500 Fourmile Run at Alexandria 385036 770446 1953-82 13 .8 6 .02 6.05 1 .90 1 .90 1 .70 1 .10 .50 5 .93 01653000 Cameron Run at Alexandria 384820 770608 1957-79 33 .7 14 .5 15 .5 4.63 3.54 3 .10 1 .70 .52 5 .85
01654000 Accotink Creek near Annandale -------------- 384846 771343 1949-84 23 .5 12 .4 13 .7 4 .09 2.94 2 .90 .43 .52 7 .18 01654500 Long Beach near Annandale - - - - - - - - - - - - - - - - 384839 771407 1948-56 3 .71 2 .89 2 .60 .88 .46 .50 .06 .47 10 .58 01655000 Accotink Creek near Accotink Station - - - - - - - - - - 384515 771209 1950-56 37 .0 20 .9 20.5 4 .94 2 .60 3 .80 .56 .62 7 .68 01656000 Cedar Run near Catlett -------------------- 383812 773731 1952-84 93 .4 35 .2 27 .2 1 .70 .78 .84 .00 1 .20 5 .11 01656100 Cedar Run near Aden --------------------- 383658 773316 1974-84 155 56 .7 46.0 3 .68 1 .70 2 .50 .45 1 .10 4 .97
01656500 Broad Run at Buckland -------------------- 384650 774022 1952-84 50 .5 30 .8 25 .2 4 .23 2 .20 3 .20 .92 .78 8 .29 01656725 Bull Run near Catharpin ------------------- 385321 773414 1971-84 25 .8 13 .1 11 .1 .67 .15 .16 .00 1 .22 6 .87 01656960 Cub Run near Bull Run -------------------- 384916 772757 1974-84 49 .9 17 .2 14 .5 1 .80 .95 1 .60 .15 .91 4 .67 01657500 Occoquan River near Occoquan -------------- 384220 771935 1914-56 570 182 182 34 .7 27 .7 30.0 8 .40 .72 4 .33 01657655 Hooes Run near Occoquan ----------------- 384048 771725 1976-82 3 .97 2 .21 1 .70 . I l .06 .10 .01 1 .19 7 .56
01658480 Quantico Creek near Dumfries --------------- 383422 772051 1983-84 6 .90 5 .02 6 .41 1 .00 .57 .23 .01 .81 9 .87 01658500 SF Quantico Creek near Independent Hill ------- 383514 772544 1953-84 7 .64 3 .15 1 .90 .19 .10 .08 .00 1 .00 5 .60 01658550 SF Quantico Creek at Camp 5 near Joplin ------- 383438 772436 1983-84 9 .61 5 .46 7 .46 1 .40 1 .10 .52 .04 .73 7.71 01658650 SF Quantico Creek near Dumfries ------------ 383418 772057 1983-84 16 .6 9 .64 14 .1 2 .60 2 .10 .94 .06 .73 7.89 01659000 NB Chopawamsic Creek near Independent Hill --- 383358 772548 1952-56 5 .79 2 .43 1 .70 .19 .10 .07 .00 .95 5 .69
01659500 MF Chopawamsic Creek near Garrisonville ------ 383326 772532 1952-56 4 .51 2 .06 1 .60 .19 .10 .07 .00 .93 6 .20 01660000 SBChopawamsicCreek near Garrisonville ------ 383222 772530 1952-56 2 .56 1 .42 1 .00 .18 .10 .06 .00 .74 7 .55 01660400 Aquia Creek near Garrisonville -------------- 382925 772602 1973-84 34 .9 19 .4 19 .7 1 .50 .51 .90 .01 1 .12 7 .53 01660500 Beaverdam Run near Garrisonvi I le ------------ 383025 772545 1952-56 12 .7 --- 4 .62 .28 .10 .50 .00 1 .22 --01661900 Carter Run near Marshall ------------------ 384758 775209 1978-82 19 .5 15 .5 13 .7 2 .70 2 .20 1 .80 .52 .71 10 .76
01662000 Rappahannock River near Warrenton - - - - - - - - - - 384105 775415 1944-84 195 132 122 22 .3 12 .3 13 .0 2 .50 .74 9 .21 01662500 Rush River at Washington ------------------ 384250 780905 1955-77 14.7 12 .5 10.1 .77 .28 .34 .00 1 .12 11 .55 01662800 Battle Run near Laurel Mills ---------------- 383920 780427 1960-84 27 .6 19 .5 16.7 3 .04 1 .40 2 .00 .34 .74 9 .58 01663000 Thornton River near Laurel Mills - - - - - - - - - - - - - 383741 780347 1945-56 142 109 99.2 27 .7 14.4 10 .5 1 .40 .55 10 .41 01663500 Hazel River at Rixeyville ------------------ 383530 775755 1944-84 287 231 212 46 .5 26.9 28 .0 6 .10 .66 10 .94
01664000 Rappahannock River at Remington ------------ 383150 774850 1944-84 620 432 415 83 .0 47 .8 50.0 11 .0 .70 9 .46 01664500 Rappahannock River at Kel lys Ford ----------- 382838 774653 1929-52 641 415 421 87 .5 45 .4 80.0 11 .0 .68 8 .79 01665500 Rapidan River near Ruckersville - - -- - -- - -- - - - 381650 782025 1944-84 114 112 99 .8 21 .1 13 .1 15 .0 4 .30 .67 13 .33 01666500 Robinson River near Locust Dale - - -- - - - - - - - - - 381930 780545 1945-84 179 154 150 41 .7 27 .2 31 .0 9 .70 .56 11 .68 01667000 Rapidan River at Rapidan ------------------ 381847 780350 1925-30 446 266 297 81 .0 38 .7 72 .0 14 .0 .56 8 .11
�
--------
------------------
--------------
----------------------------------
----------------------
-
--------------------
---------------
--------------------------
- -
---------------
-----------------
- ----------------
------------------
-----------------
-- -
-----------------------------
------------------
- - - - - - - - - - - - - - -
- - - - - - - - - - -
- - - - - -
- - - - - - - - - - - - - -
- - - -
- - - - - - - - - - - -
- - - - - - - - - - - -
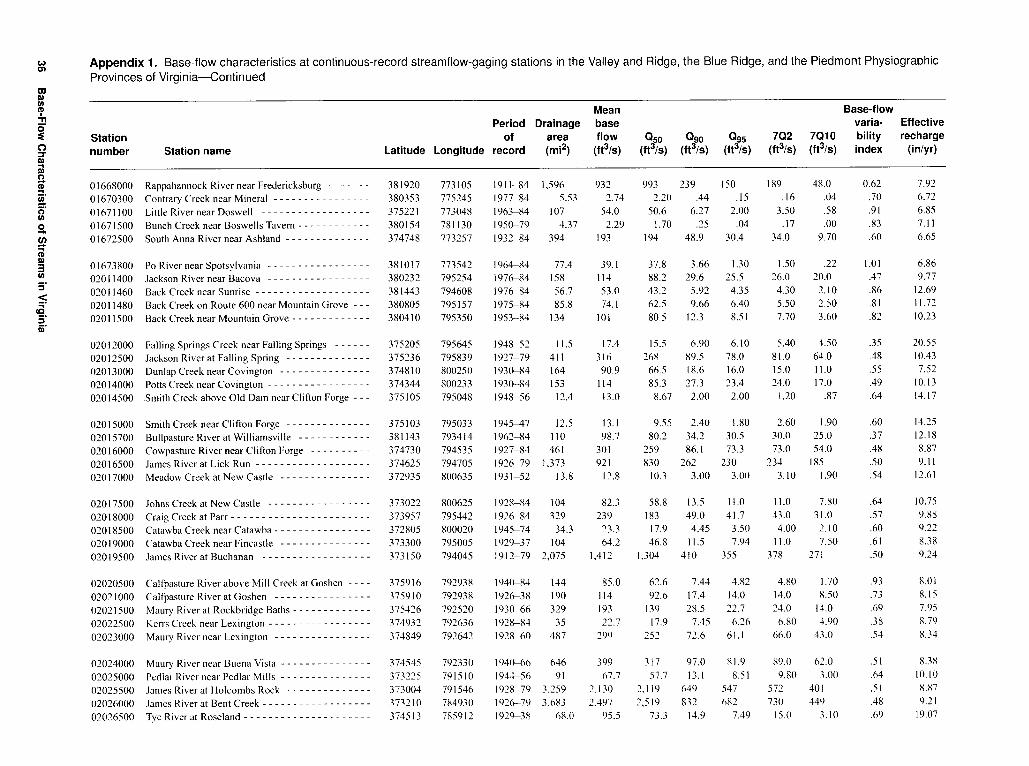
Appendix 1 . Base-flow characteristics at continuous-record streamflow-gaging stations in the Valley and Ridge, the Blue Ridge, and the Piedmont Physiographic Provinces of Virginia-Continued
Mean Base-flow Period Drainage base varia- Effective
Station of area flow Q50 090 Q95 702 7010 bility recharge number Station name Latitude Longitude record (mi l ) (ft 3/s) (ft 3/s) (ft 3/s) (ft 3/s) (ft 3/s) (ft3/s) index (in/yr)
01668000 RappahannockRiver near Fredericksburg 381920 773105 1911-84 1,596 932 993 239 150 189 48 .0 0 .62 7 .92 01670300 Contrary Creek near Mineral 380353 775245 1977-84 5 .53 2 .74 2 .20 .44 .15 .16 .04 .70 6 .72 01671100 Little River near Doswell 375221 773048 1963-84 107 54 .0 50 .6 6 .27 2 .00 3 .50 .58 .91 6 .85 01671500 Bunch Creek near Boswells Tavern ----------- 380154 781130 1950-79 4.37 2 .29 1 .70 .25 .04 .17 .00 .83 7 .11 01672500 South Anna River near Ashland 374748 773257 1932-84 394 193 194 48 .9 30 .4 34 .0 9 .70 .60 6 .65
01673800 Po River near Spotsylvania 381017 773542 1964-84 77 .4 39 .1 37 .8 3 .66 1 .30 1 .50 .22 1 .01 6 .86 02011400 Jackson River near Bacova 380232 795254 1976-84 158 114 88 .2 29 .6 25 .5 26 .0 20 .0 .47 9 .77 02011460 Back Creek near Sunrise 381443 794608 1976-84 56 .7 53 .0 43 .2 5 .92 4 .35 4 .30 2 .10 .86 12 .69 02011480 Back Creek on Route 600 near Mountain Grove 380805 795157 1975-84 85 .8 74 .1 62 .5 9 .66 6.40 5 .50 2 .50 .81 11 .72 02011500 Back Creek near Mountain Grove - 380410 795350 1953-84 134 101 80.5 12 .3 8 .51 7 .70 3 .60 .82 10 .23
02012000 02012500 02013000 02014000 02014500
Falling Springs Creek near Falling Springs Jackson River at Falling Spring Dunlap Creek near Covington Potts Creek near Covington ------------------Smith Creek above Old Dam near Clifton Forge --
375205 375236 374810 374344 375105
795645 795839 800250 800233 795048
1948-52 1927-79 193084 1930-84 1948-56
11 .5 411 164 153 12 .4
17 .4 316 90 .9 114 13 .0
15 .5 268 66.5 85 .3
8 .67
6 .90 89 .5 18 .6 27 .3 2 .00
6.10 78 .0 16 .0 23 .4 2 .00
5 .40 81 .0 15 .0 24.0
1 .20
4 .50 64 .0 11 .0 17 .0
.87
.35
.48
.55 .49 .64
20 .55 10.43 7 .52 10.13 14.17
02015000 02015700 02016000 02016500
Smith Creek near Clifton Forge Bullpasture River at Williamsville Cawpasture River near Clifton Forge - -James River at Lick Run ------------------
375103 381143 374730 374625
795033 793414 794535 794705
1945-47 1962-84 1927-84 1926-79
12 .5 110 461
1,373
13 .1 98 .7
301 921
9 .55 80 .2
259 830
2 .40 34 .2 86 .1
262
1 .80 30 .5 73 .3
230
2 .60 30.0 73 .0
234
1 .90 25 .0 54 .0 185
.60
.37
.48
.50
14 .25 12 .18 8 .87 9 .11
02017000 Meadow Creek at New Castle 372935 800635 1931-52 13 .8 12 .8 10 .3 3 .00 3 .00 3 .10 1 .90 .54 12 .61
02017500 Johns Creek at New Castle 373022 800625 1928-84 104 82 .3 58 .8 13 .5 11 .0 11 .0 7 .80 .64 10 .75 02018000 02018500
Craig Creek atParr-----------------------Catawba Creek near Catawba
373957 372805
795442 800020
192E-84 1945-74
329 34.3
239 23 .3
183 17 .9
49 .0 4 .45
41 .7 3 .50
43 .0 4 .00
31 .0 2 .10
.57
.60 9 .88 9 .22
02019000 Catawba Creek near Fincastle 373300 795005 1929-37 104 64 .2 46 .8 11 .5 7 .94 11 .0 7 .50 .61 8 .38 02019500 James River at Buchanan 373150 794045 1912-79 2,075 1,412 1,304 410 355 378 271 .50 9 .24
02020500 02021000 02021500 02022500 02023000
Calfpasture River above Mill Creek at Goshen Calfpasture River at Goshen Maury River at Roekbridge Baths herrs Creek near Lexington ----------------Maury River near Lexington -
375916 375910 375426 374932 374849
792938 792938 792520 792636 792642
1944-84 192E-38 193"6 1928-84 1928-60
144 190 329 35 487
85 .0 114 193 22 .7 299
62 .6 92 .6 139 17 .9
252
7 .44 17 .4 28 .5 7 .45
72 .6
4 .82 14 .0 22 .7 6 .26
61 .1
4 .80 14 .0 24 .0 6 .80
66 .0
1 .70 8 .50 14 .0 4 .90
43 .0
.93
.73
.69
.38
.54
8 .01 8 .15 7 .95 8 .79 8 .34
02024000 02025000
Maury River near Buena Vista --------------Pedlar River near Pedlar Mills
374545 373225
792330 791510
1940-66 1944-56
646 91
399 67 .7
317 57 .7
97 .0 13 .1
81 .9 8 .51
89 .0 9 .80
62 .0 3 .00
.51
.64 8 .38 10 .10
02025500 James River at Holcombs Rock 373004 791546 1928-79 3,259 2,130 2,119 649 547 572 401 .51 8 .87 02026000 James River at Bent Creek 373210 784930 1926-79 3,683 2,497 2,519 832 682 730 449 .48 9 .21 02026500 Tye River at Roseland -------------------- 374513 785912 1929-38 68 .0 95 .5 73 .3 14 .9 7 .49 15 .0 3 .10 .69 19 .07

�
----------------------------------
--------------
- - - - - - - - - - -
Appendix 1 . Base-flow characteristics at continuous-record streamflow-gaging stations in the Valley and Ridge, the Blue Ridge, and the Piedmont PhysiographicProvinces of Virginia-Continued
Mean Base-flow Period Drainage base varia- Effective
Station of area flow Qso Qso Q95 702 7010 bility recharge number Station name Latitude Longitude record (mil) (ft 3/s) (ft 3/s) (ft3 /s) (ft 3/s) (ft 3/s) (ft3/s) index (in/yr)
02027000 Tye River near Lovingston 374255 785855 1940-84 92 .8 116 102 23 .0 14 .8 19 .0 5 .00 0 .65 16 .99 02027500 Piney River at Piney River 374208 790140 1951-84 47 .6 73 .3 60 .2 11 .0 6 .60 7 .90 3 .20 .74 20 .92 02027800 Buffalo River near Tye River - - - - 373620 785525 1962-84 147 124 113 32 .7 22 .3 28 .0 7 .90 .54 11 .48 02028000 Tye (Buffalo) River near Norwood ----------- 373740 785250 1941-60 360 349 319 102 75 .7 81 .0 37 .0 .49 13 .17 02028500 Rockfish River near Greenfield 375210 784925 1944-84 94 .6 104 88 .1 19 .9 12 .4 15 .0 4 .10 .65 14 .90
02029000 James River at Scottsville ------------------ 374750 782930 192079 4,584 3,122 3,221 1,001 782 871 508 .51 9 .25 02029500 Hardware River near Scottsville -------------- 375024 782828 1927-38 104 80 .8 75 .0 24 .9 20 .2 20 .0 4 .20 .48 10 .54 02030000 Hardware River below Briery River nr Scottsville - - 374845 782720 1940--84 116 86 .3 82 .2 25 .2 17 .7 24 .0 7 .50 .51 10 .09 02030500 Slate River near Arvonia - - - - - - - - - - - - - - - - - - - 374210 782240 1927-84 226 123 128 42 .2 28 .6 34 .0 9 .50 .48 7 .41 02031000 Mechums River near White Hall - - - - - - - - - - - - - 380609 783535 1944-84 95 .4 75 .8 70 .8 22 .6 15 .9 16 .0 1 .60 .50 10 .78
02031500 NF Moormans River near White Hall - - - - - - - - - - 380825 784505 1953-84 11 .4 9 .72 5 .89 .38 .12 .33 .00 1 .19 11 .58 02032000 Moormans River near White Hall - - - - - - - - - - - - - 380805 784410 1945-46 18 .0 11 .8 10 .3 .00 .00 .00 .00 --- 8 .88 02032400 Buck Mountain Creek near Free Union --------- 380916 783222 1981-84 37 .0 26 .8 20 .9 5 .48 2 .80 3 .90 .88 .58 9 .85 02032680 NF Rivanna River near Proffit --------------- 380516 782444 1971-84 176 152 150 34 .6 22 .0 29 .4 8 .17 .64 11 .71 02033500 Rivanna River below Moores Cr. nr Charlottesville - 380109 782713 1927-34 507 268 260 45 .7 28 .0 48 .0 4 .80 .75 7 .18
02034500 Willis River at Lakeside Village -------------- 374000 781000 1927-84 262 136 130 33 .4 22 .6 26 .8 7 .19 .59 7 .06 02035000 James River at Cartersville ----------------- 374015 780510 1926-79 6,257 4,028 4,320 1,342 991 1,120 584 .51 8 .74 02035500 Lickinghole Creek near Goochland ------------ 374131 775722 1945-46 70 .0 36.8 41 .6 15 .5 13 .1 7 .40 4 .70 .43 7 .13 02036500 Fine Creek at Fine Creek Mills--------------- 373552 774912 1946-84 22 .1 12 .3 11 .9 2 .30 1 .20 2 .00 .47 .71 7 .54 02038000 Falling Creek near Chesterfield -------------- 372637 773121 1957-84 32 .8 20.5 18 .1 2 .49 1 .10 1 .80 .64 .86 8 .46
02038850 Holiday Creek near Andersonville ------------ 372455 783810 1967-84 8 .53 5 .69 5 .43 1 .80 1 .40 1 .60 .52 .48 9 .06 02039000 Buffalo Creek near Hampden Sydney - - - - - - - - - - 371525 782912 1948-84 69 .7 44.9 43 .4 17 .6 13 .2 15 .0 6 .00 .39 8 .75 02039500 Appomattox River at Farmville -------------- 371825 782320 1927-84 303 163 168 60 .9 45 .4 52 .0 21 .0 .44 7 .29 02040000 Appomattox River at Mattoax --------------- 372517 775133 1927-84 726 367 390 116 83 .0 86 .0 30 .0 .53 6.87 02041000 Deep Creek near Mannboro ----------------- 371659 775212 1948-84 158 79.8 78 .5 20 .0 11 .3 12 .0 1 .40 .59 6.85
02041500 Appomattox River near Petersburg ------------ 371333 773220 1928-66 1,334 614 680 197 133 .5 154 58 .0 .54 6.25 02042000 Swift Creek near Chester - - - - - - - - - - - - - - - - - - - 371855 772940 1944-49 143 85 .1 82 .4 13 .4 8 .44 4 .20 .75 .79 8 .08 02044000 Nottoway River near Burkeville -------------- 370440 781150 1948-84 38 .7 16 .6 15 .4 2 .20 1 .10 .92 .11 .85 5 .81 02044500 Nottoway River near Rawlings --------------- 365900 774800 1952-84 309 177 176 47 .7 28 .2 26 .0 4.00 .57 7 .76 02045000 Nottoway River near McKenney - - - - - - - - - - - - - 365645 774355 1947-50 362 221 238 92 .2 75 .0 33 .0 4.00 .41 8 .28
021146000 Stony Creek near Dinwiddie - - - - - - - - - - - - - - - - 370401 773610 1948-84 112 58 .9 52 .4 6 .52 2 .73 4 .30 .25 .91 7 .14 02050500 North Meherrin River near Keysville - - - - - - - - - - 370305 782520 1950-61 9 .211 4 .81 3 .30 1 .10 .59 .54 .21 .48 7 .10 02051000 North Meherrin River near Lunenburg - - - - - - - - - - 365950 782100 1948-84 55 .6 22 .4 21 .4 4 .02 2 .59 2 .60 .49 .73 5 .46 02051500 Meherrin River near Lawrenceville ------------ 364300 774955 193(1`84 552 242 256 68 .0 44.8 52 .0 16.0 .58 5 .94 02051600 Great Creek near Cochran ------------------ 364846 775519 1960-84 30 .7 18 .2 17 .0 3 .74 2 .00 3 .10 .35 .66 8 .05

�
-----------------
----------------------------------------------
Appendix 1 . Base-flow characteristics at continuous-record streamflow-gaging stations in the Valley and Ridge, the Blue Ridge, and the Piedmont Physiographic Provinces of Virginia-Continued
Mean Base-flow Period Drainage base varia- Effective
Station of area flow 050 090 095 702 7010 bility recharge number Station name Latitude Longitude record (mi l ) (ft 3/S) (ft3 /S) (ft 3/S) (ft 3/s) (ft3 /S) (ft 3/S) index (in/yr)
02052000 Meherrin River at Emporia 364124 773227 1967-84 747 372 392 101 62 .8 60 .0 23 .0 0 .59 6 .76 02052500 Fountains Creek near Brink ---------------- 363655 774200 1955-84 65 .2 32 .4 27 .2 1 .30 .26 .76 .00 1 .32 6 .75 02053800 SF Roanoke River near Shawsvil le 370824 801600 1962-84 110 77 .4 70 .2 27 .2 22 .4 21 .0 11 .0 .41 9 .55 02054500 Roanoke River at Lafayette 371411 801234 1945-84 257 160 135 51 .1 42 .6 42 .0 24 .0 .42 8 .43 02055000 Roanoke River at Roanoke 371530 795620 1951-84 395 229 191 68 .8 56 .9 58 .0 35 .0 A4 7 .88
02055100 Tinker Creek near Daleville ----------------- 372503 795608 1958-84 11 .0 8 .83 6 .77 2 .30 1 .90 2 .20 1 .40 .47 10 .89 02056650 Back Creek near Dundee - - - - - - - - - - - - - - - - - - - 371340 795206 1976-84 56 .8 39 .4 32 .5 8 .71 6 .20 5 .50 2 .50 .57 9 .42 02056900 Blackwater River near Rocky Mount ----------- 370242 794540 1978-84 115 96 .6 89 .9 32 .9 24 .3 22 .0 12 .0 .44 11 .40 02057000 Blackwater River near Union Hall ------------ 370235 794107 1927-63 208 160 165 71 .2 55 .4 66.0 26 .0 .36 10 .42 02057500 Roanoke (Staunton) River near Toshes --------- 370203 793118 1927--62 1,020 668 667 273 223 246 142 .39 8 .89
02058000 Snow Creek at Sago ---------------------- 365350 793905 1935-43 60 .0 45 .8 46.8 25 .4 22 .2 20.0 10 .0 .27 10 .37 02058400 Pigg River near Sandy Level - - - - - - - - - - - - - - - - 365645 793130 1965-84 350 241 254 112 86 .7 96 .0 47 .0 .36 9 .37 02058500 PiggRiver near Toshes -------------------- 365901 793052 1932-63 394 270 286 147 116 131 66 .0 .29 9 .30 02059500 Goose Creek near Huddleston --------------- 371023 793114 1956-84 188 116 109 45 .0 36.9 40 .0 23 .0 .38 8 .40 02060500 Roanoke River at Altavista ----------------- 370616 791744 1932-62 1,789 1,267 1,350 552 440 492 266 .39 9 .61
02061000 Big Otter River near Bedford ----------------- 372150 792510 1945-60 116 98 .1 91 .1 27.2 19.3 17 .0 7 .30 .52 11 .48 02061500 Big Otter River near Evington --------------- 371230 791814 1938-84 320 219 215 80.0 58 .3 69 .0 28 .0 .43 9 .28 02062000 Big Otter River near Altavista --------------- 371105 791645 193036 372 193 181 57 .9 45 .2 51 .0 21 .0 .50 7 .04 02062500 Roanoke(Staunton)River atBrookneal--------- 370228 785702 1925-62 2,415 1,574 1,715 734 568 648 344 .37 8 .85 02063000 Caldwells Creek near Appomattox ------------ 371940 785120 1954-60 5.10 2 .54 2.30 1 .30 .86 .84 .40 .25 6.77
02063500 Falling River at Spring Mills ---------------- 371440 785500 1955-60 52 .2 27 .7 26 .4 13 .1 9 .66 9 .50 3 .70 .30 7 .21 02064000 Falling River near Naruna ------------------ 370736 785736 1931-84 173 93 .1 92 .9 36 .2 27 .5 32 .0 15 .0 .41 7 .30 02064500 Little Falling River at Hat Creek-------------- 370750 785450 1930-34 43 .0 16 .0 18 .6 4 .97 1 .80 4 .60 1 .50 .57 5 .06 02065000 Falling River near Brookneal - - - - - - - - - - - - - - - - 370454 785607 1935-11 228 154 153 82 .8 71 .2 63 .0 33 .0 .27 9.15 02065500 Cub Creek at Phenix - - - - - - - - - - - - - - - - - - - - - - 370445 784550 1948-84 98 .0 63 .3 63 .7 24 .9 18 .3 22 .0 8 .20 .41 8 .77
02066000 Roanoke (Staunton) River at Randolph --------- 365454 784428 1902-62 2,977 1,950 2,209 1,018 773 847 426 .34 8 .89 02066500 Roanoke Creek at Saxe -------------------- 365549 783956 1948-72 135 56 .0 55 .5 15 .5 8 .18 8 .70 .80 .55 5 .63 02067000 Roanoke (Staunton) River near Clover --------- 365017 784002 1931-52 3,230 2,038 2,279 1,011 799 914 433 .35 8 .56 02069700 South Mayo River near Nettleridge ------------ 363415 800747 1964--84 84 .6 99 .2 96 .9 50 .7 41 .6 44 .0 27 .0 .28 15 .92 02070000 North Mayo River near Spencer -------------- 363405 795915 1930-84 108 93 .7 95 .4 49 .1 40 .2 44 .0 25 .0 .29 11 .78
02072500 Smith River at Bassett -------------------- 364612 800004 1940-50 259 268 271 149 128 125 95 .0 .26 14 .04 02073500 Leatherwood Creek near Old Liberty - - - - - - - - - - 363810 794730 1925-34 68 .0 28 .1 32.3 11 .1 6 .96 15 .0 7 .50 .46 5 .61 02074500 Sandy River near Danville ------------------ 363710 793016 1930-84 112 70 .0 72 .6 34 .0 27 .4 29 .0 15 .0 .33 8 .48 02075000 Dan River at Danville --------------------- 363515 792255 193(-50 2,050 1,400 1,709 866 748 739 515 .29 9 .27 02076500 Georges Creek near Gretna ----------------- 365611 791842 1950-84 9 .24 7 .44 7 .10 3 .70 2 .60 3 .20 1 .60 .28 10 .93
�
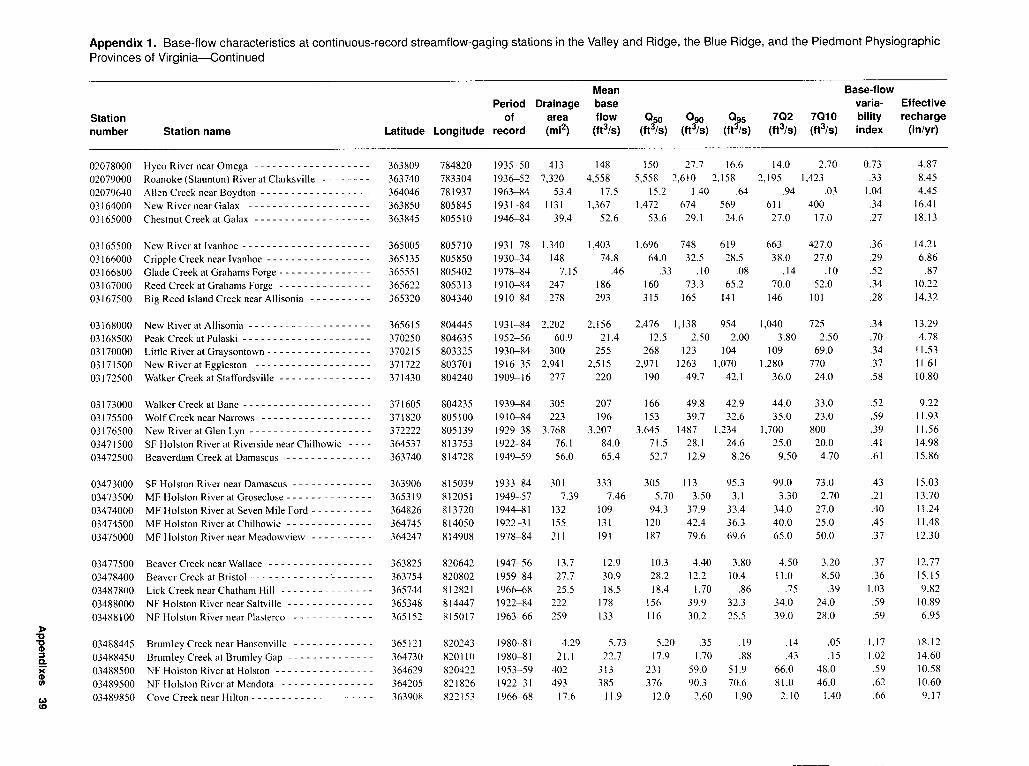
Appendix 1 . Base-flow characteristics at continuous-record streamflow-gaging stations in the Valley and Ridge, the Blue Ridge, and the Piedmont Physiographic Provinces of Virginia-Continued
Mean Base-flow Period Drainage base varia- Effective
Station of area flow Qso 090 095 7Q2 7Q10 bility recharge number Station name Latitude Longitude record (mil) (ft3 /S) (ft 3/S) (ft 3/S) (ft 3/S) (ft 3/s) (ft 3/s) index (in/yr)
02078000 HycoRiver near Omega ------------------- 363809 784820 1935-50 413 148 150 27 .7 16 .6 14 .0 2 .70 0.73 4 .8702079000 Roanoke(Staunton)River atClarksville -------- 363740 783304 1936-52 7,320 4,558 5,558 2,610 2,158 2,195 1,423 .33 8 .4502079640 Allen Creek near Boydton ------------------ 364046 781937 1963-84 53 .4 17 .5 15 .2 1 .40 64 .94 .03 1 .04 4 .45
611 400 .34 16 .4103164000 New River near Galax -------------------- 363850 805845 1931-84 1131 1,367 1,472 674 56903165000 Chestnut Creek at Galax - - - - - - - - - - - - - - - - - - - 363845 805510 1946-84 39.4 52 .6 53 .6 29 .1 24 .6 27 .0 17 .0 .27 18 .13
03165500 New River at Ivanhoe --------------------- 365005 805710 1931-78 1,340 1,403 1,696 748 619 663 427 .0 .36 14 .2103166000 Cripple Creek near Ivanhoe ----------------- 365135 805850 1930-34 148 74 .8 64 .0 32 .5 28 .5 38 .0 27 .0 .29 6 .8603166800 Glade Creek at Grahams Forge --------------- 365551 805402 1978-84 7 .15 .46 .33 .10 .08 .14 .10 .52 .8703167000 Reed Creek at Grahams Forge --------------- 365622 805313 1910-84 247 186 160 73 .3 65 .2 70.0 52 .0 .34 10 .2203 167500 Big Reed Island Creek near Allisonia - - - - - - - - - - 365320 804340 1910-84 278 293 315 165 141 146 101 .28 14 .32
03168000 NewRiver at Allisonia -------------------- 365615 804445 1931-84 2,202 2,156 2,476 1,138 954 1,040 725 .34 13 .2903168500 Peak Creek at Pulaski --------------------- 370250 804635 1952-56 60 .9 21 .4 12 .5 2 .50 2 .00 3.80 2 .50 .70 4 .7803170000 Little River atGraysontown----------------- 370215 803325 1930-84 300 255 268 123 104 109 69 .0 .34 11 .5303171500 New River at Eggleston ------------------- 371722 803701 1916-35 2,941 2,515 2,971 1263 1,070 1,280 770 .37 11 .6103172500 Walker Creek at Staffordsville --------------- 371430 804240 1909-16 277 220 190 49 .7 42 .1 36 .0 24.0 .58 10 .80
03173000 Walker Creek at Bane --------------------- 371605 804235 1939-84 305 207 166 49 .8 42 .9 44 .0 33 .0 .52 9 .2203175500 WolfCreek near Narrows ------------------ 371820 805100 1910-84 223 196 153 39 .7 32 .6 35 .0 23 .0 .59 11 .9303176500 New River at Glen Lyn-------------------- 372222 805139 1929-38 3,768 3,207 3,645 1487 1,234 1,700 800 .39 11 .5603471500 SF Holston River at Riverside near Chilhowie - - - - 364537 813753 1922-84 76.1 84 .0 71 .5 28 .1 24 .6 25 .0 20 .0 .41 14 .9803472500 Beaverdam Creek at Damascus -------------- 363740 814728 1949-59 56.0 65 .4 52 .7 12 .9 8 .26 9 .50 4 .70 .61 15 .86
03473000 SF Holston River near Damascus - - - - - - - - - - - - - 363906 815039 1933-84 301 333 305 113 95 .3 99 .0 73 .0 43 15 .0303473500 MF Holston River at Groseclose -------------- 365319 812051 1949-57 7 .39 7 .46 5 .70 3 .50 3 .1 3 .30 2 .70 .21 13 .7003474000 MF Holston River at Seven Mile Ford ---------- 364826 813720 1944-81 132 109 94 .3 37 .9 33 .4 34.0 27 .0 .40 11 .2403474500 MF Holston River at Chilhowie -------------- 364745 814050 1922-31 155 131 120 42 .4 36 .3 40 .0 25 .0 .45 11 .4803475000 MF Holston River near Meadowview - - - - - - - - - - 364247 814908 1978-84 211 191 187 79 .6 69 .6 65 .0 50.0 .37 12 .30
03477500 Beaver Creek near Wallace ----------------- 363825 820642 1947-56 13 .7 12 .9 10 .3 4 .40 3 .80 4 .50 3 .20 .37 12.7715 .1503478400 Beaver Creek at Bristol-------------------- 363754 820802 1959-84 27 .7 30 .9 28 .2 12 .2 10 .4 11 .0 8 .50 .36
03487800 Lick Creek near Chatham Hill --------------- 365744 812821 1966-68 25 .5 18 .5 18 .4 1 .70 .86 .75 .39 1 .03 9 .8203488000 NF Holston River near Saltville -------------- 365348 814447 1922-84 222 178 156 39 .9 32 .3 34 .0 24 .0 .59 10 .8903488100 NF Holston River near Plasterco - - - - - - - - - - - - - 3651-52 815017 1963-66 259 133 116 30.2 25 .5 39 .0 28 .0 .59 6 .95
D ' a 03488445 Brumley Creek near Hansonville - - - - - - - - - - - - - 365121 820243 1980-81 4.29 5 .73 5 .20 .35 .19 .14 .05 1 .17 18 .12
a 03488450 Brumley Creek at Brumley Gap -------------- 364730 820110 198(1_81 21 .1 22 .7 17 .9 1 .70 .88 .43 .15 1 .02 14 .60iK 03488500 NF Holston River at Holston ---------------- 364629 820422 1953-59 402 313 231 59 .0 51 .9 66 .0 48 .0 .59 10 .58(o
03489500 NF Holston River at Mendota --------------- 364205 821826 1922-31 493 385 376 90 .3 70 .6 81 .0 46.0 .62 10 .60t,,r 03489850 Cove Creek near Hilton -------------------- 363908 822153 1966-68 17 .6 11 .9 12 .0 2 .60 1 .90 2 .10 1 .40 .66 9 .17

�
------------
---------------------------------------
---------------------------------
--------------- -
- -
- - -
- -
- - - - - - - - - - - -
- - - - - - - - - - - - -- - - - - - - - - - - - - -
- - - - - - - - - - - -
Appendix 1 . Base-flow characteristics at continuous-record streamflow-gaging stations in the Valley and Ridge, the Blue Ridge, and the Piedmont Physiographic Provinces of Virginia-Continued
Mean Base-flow Period Drainage base varia- Effective
Station of area flow Q50 Q90 095 702 7010 bility recharge number Station name Latitude Longitude record (mil) (ft3/s) (ft3/s) (ft3/s) (ft3/s) (ft3/s) (ft3/s) index (in/yr)
03489870 Big Moccasin Cr. at Collinwood near Hansonville 364416 821925 1966-68 41 .9 36.0 38.2 9.54 8.27 5.30 3.50 0.60 11 .66 03489900 Big Moccasin Creek near Gate City 363847 823312 1966-68 79 .6 66.8 68 .8 19 .9 17 .0 10 .0 6.70 .54 11 .40 03490000 NF Holston River near Gate City 363631 823405 1958-81 672 553 532 127 102 97 .0 56 .0 .62 11 .16 03521500 Clinch River at Richlands 370-510 814652 1972-84 137 131 124 34 .1 27 .2 29 .0 19 .0 .56 12 .99 03522000 Little River at Wardell 370216 814752 1950-52 103 118 98 .5 35 .2 30 .0 25 .0 18 .0 .45 15 .-52
03523000 Big Cedar Creek near Lebanon 365429 820220 1953-59 51 .5 42 .9 28 .6 7.52 6.67 5.10 3.20 .58 11 .32 03524000 Clinch River at Cleveland 365641 820918 1922-84 528 415 378 98 .0 78 .4 81 .0 54 .0 .59 10 .68 03525000 Stony Creek at Fort Blackinore 364630 823450 1950-52 41 .4 49 .1 41 .8 3.10 2.00 1 .80 .52 1 .13 16 .10 03526000 Copper Creek near Gate City - 364026 823357 1949-72 106 93 .1 74 .4 27 .5 24 .1 24 .0 18 .0 .43 11 .93 03527000 Clinch River at Speers Ferry 363855 824502 1951-81 1,126 911 864 190 151 148 100 .66 10 .98
03527500 NF Clinch River at Duffield ---------------- 364240 824745 1953-59 23 .1 22 .6 9.78 1 .60 1 .30 1 .90 .95 79 13 .26 03531500 Powell River near Jonesville - 363943 830542 1933-84 319 288 248 52 .1 38 .1 42 .0 24 .0 .68 12 .26
----------------------------------------------
---------------------------
--------------------------------------------------------------------
-----------
--------------------------
---------------------------------------- --- --- --- ---
--------------
---------------------------------------
---------------------------------------
------------------------------------
---------------------------------------------------------
----------- --- ------------ --- ---
------------------------------------ --- --- --- ---
-------------------------
Appendix 2. Base-flow characteristics at partial-record streamflow-gaging stations in the Valley and Ridge, the Blue Ridge, and the Piedmont PhysiographicProvinces of Virginia [Latitude and longitude are reported in degrees, minutes, and seconds; mi`, square mile ; ft ; /s, cubic foot per second ; in/yr, inch per year; Q5n, Q9p, and Q9s, indicate the 50-, 90-, and 95-percent discharge on the streamflow-duration curve, respectively; 7Q2 and 7Q10, indicate the annual minimum average 7-consecutive-day low-flow discharge having 2-year and 10-year recurrence intervals, respectively ; leaders (---) indicate value could not be determined; NF, North Fork ; SF, South Fork]
Mean Base-flow Drainage base varia- Effective
Station area flow 050 Q90 095 7Q2 7010 bility rechargenumber Station name Latitude Longitude (mil) (ft3/s) (ft3/s) (ft3/s) (ft3/s) (ft3/s) (ft3/s) index (in/yr)
01613570 Back Creek at Gainesboro ----------------------- 391709 781551 34 .4 8.15 7.15 3.00 2.62 2.80 2.00 0.38 3.22 01613590 IssacCreek near Gainesboro 391805 781650 15 .8 2.75 4.20 .50 .37 .36 .18 .92 2.36 01616100 Dry Marsh near Berryville 391132 780410 11 .4 13 .0 11 .3 5.20 4.50 4.70 2.90 .34 15 .48 01620690 North River at Route 727 near Bridgewater 382342 790155 102 50 .5 41 .0 5.95 4.25 4.90 2.30 .84 6.72 01621300 Dry River at Route 257 at Bridgewater 382427 785833 120 45 .0 33 .0 6.50 5.10 6.40 3.40 .71 5.09
01622230 Middle River below Trimbles Mill near Swoope -------- 380810 791306 20.6 9.75 9.38 3.80 3.30 3.60 2.70 39 6.42 01628080 Madison Run near Grottoes 381524 784606 5.78 4.80 3.20 .30 .20 .33 .12 1 .03 11 .27 01630700 Gooney Run near Glen Echo 385006 781356 20 .6 25 .0 18 .0 4.10 2.90 3.20 1 .80 .64 16 .47 01632080 Linville Creek at Broadway 383622 784813 42 .3 16 .5 14.0 6.25 5.00 6.00 4.00 .35 5.29 01632840 Smith Creek at Route 717 near Lacey Spring 383218 784503 21 .3 10 .5 8.75 3.10 2.55 3.10 1 .80 45 6.69
01632890 Smith Creek at Route 794 near Lacey Spring 383651 784021 72 .7 51 .0 42 .0 15 .5 12 .5 15 .0 9.20 43 9.52 01633475 Riles Run at Route 703 near Conicville 385039 784229 5.6-5 1 .50 1.25 .50 .41 .61 .47 .40 3.60 01633485 Stony Creek near Liberty Furnace 385341 783957 57 .0 24 .11 17.0 4.30 2.90 6.90 4.40 .60 5.71 01633510 SwoverCreek near Conicville 385029 784039 3.26 .14 .09 .10 .05 01633540 Stony Creek at US FIWYIIatEdinburg 384921 783408 104 51 .0 44.0 18 .5 16 .3 18 .0 11 .0 .38 6.65
01633730 Toms Brook at Toms Brook ---------------------- 385642 782632 9.35 2.35 1.90 .65 .53 .54 .34 .47 3.41 01633745 Toms Brook near Toms Brook 385535 782530 16.2 3.10 2.62 1 .30 1 .08 1 .10 .85 .30 2.60 01634340 Cedar Creek near Lebanon Church 390453 782530 50.1 35 .0 26.0 7.00 4.50 4.30 3.20 .57 9.48 01635045 Buffalo Marsh Run near Middletown 390334 781817 5 .27 3.58 2.88 1 .19 .96 1 .00 .54 .38 9.22 01635100 Cedar Creek near Strasburg 385927 781942 157 67 .5 53 .0 20 .5 15 .8 16 .0 11 .0 .41 5.83
01635250 Passage Creek at Route 776 near Detrick 384749 782742 31 .7 14 .0 9.50 2.30 1 .50 1 .70 .91 .62 5.99 01635300 Peters Mill Run near Detrick 385148 782625 4.22 3.10 2.20 .56 .42 .42 1.20 .59 4.97 01636270 Borden Marsh Run at Route 624 near Boyce 390009 780551 8.71 8.20 6.20 2.38 2.00 2.10 1 .20 .42 12 .78 01636300 Westbrook Run near Boyce 390422 780530 1 .40 1 .30 1 .10 .43 .35 .40 .20 .41 12 .60 01636690 Piney Run near Lovettsville 391839 774306 13 .7 8.75 7.50 .88 44 53 .11 93 8.67
01643585 Potomac River Tributary No I near Lucketts 391232 772839 2.00 58 .13 .09 .10 .04 65 0 1643600 Limestone Branch Tributary No 1 near Leesburg 3911127 773148 6.82 3.70 1 .50 1 .10 1 .20 .60 39 01643643 Goose CreekkatDelaplane 385451 775520 45 .6 26.5 23 .5 2.77 1.45 1 .60 .20 93 7.89 01643800 NF Goose Creek at Route 722 near Lincoln 390438 774152 24 .0 1 .73 1 .10 1 .10 .34 01643950 Goose Creek at Oatlands 390138 773717 276 138 118 18 .0 10 .2 12 .0 2.90 82 6.79

�
---
Appendix 2. Base-flow characteristics at partial-record streamflow-gaging stations in the Valley and Ridge, the Blue Ridge, and the Piedmont Physiographic Provinces of Virginia-Continued
Mean Base-flow Drainage base varia- Effective
Station number Station name Latitude Longitude
area (mil)
flow (ft3/s)
Q50 (ft3/s)
Q90 (ft3/s)
095 (ft3/s)
702 (ft3/s)
7010 (ft3/s)
bility index
recharge (in/yr)
01643988 Little River near Oatlands ------------------------ 390025 773653 47 .7 26 .0 22 .0 3.40 1 .80 2.10 0.50 0.81 7.40 01644255 SF Broad Run at Arcola ------------------------- 385710 773209 5.31 .80 .58 .01 .00 .01 .00 1.76 2.04 01644280 Broad Run near Leesburg ------------------------ 390335 772622 76 .1 --- --- .60 .22 .28 .02 --- --01644300 Sugarland Run at Hendon ------------------------ 385800 772217 3.36 .44 .48 .08 .05 .00 .00 .78 1 .78 01646200 Scott Run near Mclean -------------------------- 385732 771221 4.69 2.90 2.70 .82 .54 .73 .12 .52 8.39
01656200 Broad Run near Warrenton ----------------------- 384825 774847 2.94 1 .57 1 .32 .18 .09 .11 .03 .87 7.25 01656655 Kettle Run near Nokesville ----------------------- 384328 773632 11 .9 --- --- .00 00 .00 .00 --- --01656659 Kettle Run at Brentsville ------------------------- 384158 773042 25 .0 --- --- .00 .00 .00 .00 --- --01656670 Broad Run at Brentsville ------------------------- 384132 772942 137 --- --- 4.20 2.40 3.30 1 .20 --- --01656705 Black Branch near Haymarket --------------------- 385446 773743 3.05 --- 2.50 .02 .01 .02 .00 2.10 --
01656715 Chestnut Lick near Catharpin---------------------- 385317 773537 11 .1 --- --- .01 .00 .01 .00 --- --01656743 Lick Branch atCatharpin------------------------- 385058 773424 3.06 --- .90 .00 .00 .00 .00 --- --01656750 Little Bull Run near Bull Run ---------------------- 385032 773222 27 .2 --- --- .42 .17 .20 .00 --- --01656768 Flat Branch near Manassas ----------------------- 384622 772957 1 .10 .08 .07 .00 .00 .00 .00 --- .99 01657245 Russia Branch at Manassas ----------------------- 384542 772637 1 .47 .26 .21 .03 .01 .02 .00 .85 2.40
01661840 Rappahannock River near Flint Hill ----------------- 384532 780142 65 .9 34 .0 30.1 5.52 2.82 3.00 .46 .74 7.00 01662110 Hazel River at Route 631 near Woodville -------------- 383627 781415 5.54 13 .5 12.5 2.80 1 .60 1 .70 .36 .65 33 .07 01662150 Hughes River near Nethers ----------------------- 383427 781749 9.92 16 .3 16.0 2.70 1 .50 1 .80 .30 .77 22 .30 01665100 JonasRunnear Brandy Station --------------------- 382920 775408 11 .4 --- 4.60 .00 .00 .00 .00 --- --01665150 Mountain Run near KellysFord -------------------- 382737 774850 118 --- 23 .0 4.40 2.60 4.10 .80 .72 --
01665220 Deep Run at Route 615 near Goldvein - - - - - - - - - - - - - - - - 382707 773746 15 .4 6.30 5.65 .50 .21 .53 .10 1 .05 5.55 01665400 Conway River near Stanardsville - - - - - - - - - - - - - - - - - - - 381958 782353 25 .8 26 .0 24.0 2.70 1 .40 1 .70 .30 .95 13 .68 01665850 Robinson River at Route 231 near Criglersville - - - - - - - - - - 382654 781644 47 .8 85 .0 75.0 6.10 2.65 3.00 .45 1 .09 24 .13 01667600 Cedar Run Tributary near Culpeper ------------------ 382350 780025 .58 .23 .20 .03 .02 .01 .00 .82 5.38 01667650 Cedar Run near Culpeper------------------------- 382148 775832 33 .2 --- 2.50 .05 .00 .03 .00 1 .70 --
01667700 SumerduckRunnear Culpeper--------------------- 382219 775627 11 .0 --- 1 .00 .00 .00 .00 .00 --- --01667848 Black Walnut Run at Burr Hill --------------------- 382036 775134 12 .1 6.55 5.41 .83 .30 .35 .05 .81 7.35 01667850 Mine Run at Burr Hill--------------------------- 382036 775133 31 .8 --- --- 1 .84 .70 .78 .10 01670120 Mountain Run at Route 643 near Gordonsville - - - - - - - - - - 380939 780606 14 .1 4.80 4.80 1 .60 .95 .95 .20 .48 4.62 01670200 Pamunkey Creek at Route 651 near Lahore ------------ 380916 775702 51 .7 30.3 29.8 5.58 3.29 4.00 1 .00 .73 7.94
01671040 Long Creek at Route 655 near Buckner --------------- 375538 774744 8.01 2.29 2.24 .54 .30 .35 .10 .62 3.88 01671680 South Anna River at Route 208 near Louisa ------------ 375850 780254 113 34 .4 31 .8 9.45 5.20 6.00 2.00 .53 4.13 01671950 Deep Creek at Route 640 near Apple Grove ------------ 375157 775453 10.1 3.43 3.34 .62 .31 .42 .10 .73 4.61 01672200 Taylors Creek at Route 715 near Montpelier ------------ 374749 774327 22 .0 9.02 8.95 2.08 1 .10 1 .50 .50 .63 5.56 01672400 South Anna River Tributary No 6 near Ashland --------- 374840 773420 .33 .17 .17 .04 .02 .02 .00 .63 6.99

�
---
---
Appendix 2 . Base-flow characteristics at partial-record streamflow-gaging stations in the Valley and Ridge, the Blue Ridge, and the Piedmont Physiographic Provinces of Virginia-continued
Mean Base-flow Drainage base varia- Effective
Station area flow Qeo Q90 095 7Q2 7Q1p bility recharge number Station name Latitude Longitude (mil) (ft 3/S) (ft3/S) (ft 3/S) (ft3/S) (ft3 /S) (ft 3/S) index (in/yr)
01672800 Newfound River at Route 685 near Ashland ------------ 375035 773230 36.3 9 .18 8 .58 2 .17 1 .09 1 .40 .40 0.60 3 .43 01673960 Mat River near Marye--------------------------- 380623 773607 14.5 3 .60 3 .40 .16 .04 .05 .00 1 .33 3 .37 01674172 Polecat Creek near Ladysmith --------------------- 375813 772913 10.8 4 .35 4.20 .38 .14 .17 .00 1 .04 5 .47 02002000 Jackson River at US HWY 220 at Vanderpool - - - - - - - - - - 382205 793735 13 .0 7 .50 6.50 1 .80 1 .40 1 .40 .90 .56 7 .83 02015600 Cowpasture River near Head Waters ----------------- 381930 792614 11 .3 8 .10 6.90 2 .00 1 .60 1 .60 1 .00 .54 9.73
02015800 Thompson Creek at Route 39 near Bath Alum - - - - - - - - - - 380238 794105 15 .7 8 .10 6.40 1 .90 1 .60 2 .20 1 .80 .53 7 .00 02016600 Craig Creek above Muddy Branch near McDonalds Mill --- 372116 801723 23 .0 10 .0 5 .60 .42 .31 .31 .17 1 .12 5 .90 02017300 Craig Creek at New Castle------------------------ 373006 800618 112 .58 .48 a2 .18 20 .15 .34 .07 02017400 Johns Creek Tributary near New Castle --------------- 373030 801 130 1 .57 .70 .50 .11 .08 .09 .06 .66 6 .05 02019100 Spreading Spring Branch at Springwood -------------- 373257 794442 6 .76 3 .20 2 .80 1 .10 .88 1 .00 .55 .41 6 .42
02020170 East Fork Elk Creek at Belfast Trail near Natural Bridge --- 373417 792931 4.15 1 .93 1 .50 .39 .31 .32 .22 .59 6 .31 02020200 Calfpasture River near West Augusta - - - - - - - - - - - - - - - - 381624 791802 12 .8 --- 5 .60 .03 .01 .01 .00 2 .27 02021700 Cedar Grove Branch near Rockbridge Baths ------------ 375300 792308 12 .3 4 .60 3 .90 1 .85 1 .65 1 .80 1 .40 .32 5 .07 02024240 South Buffalo Creek at Route 611 near Lexington -------- 374414 793418 21 .1 9 .95 8 .95 4 .55 4.10 4 .20 3 .40 .29 6 .40 02024760 Reed Creek at Route 637 near Big Island -------------- 373010 792407 7 .46 10 .8 9 .44 3 .45 2.74 3 .00 1 .80 .44 19 .66
02024900 Pedlar River below Davis Mill Creek near Buena Vista ---- 374448 791609 18 .2 13 .5 11 .5 4 .50 3.90 4 .20 3 .00 .41 10 .07 02025650 Harris Creek at Route 675 near Monroe --------------- 372935 790910 34 .5 28 .0 27 .0 7 .20 4 .90 4 .20 1 .10 .57 11 .01 02025800 Burton Creek Tributary at Lynchburg - - - - - - - - - - - - - - - - 372110 791105 2 .36 1 .19 1 .11 .33 .23 .30 .10 .53 6.84 02025900 Beaver Creek at Route 660 near Bocock -------------- 372116 790427 24 .0 13 .6 13 .1 5 .20 3 .90 4 .60 2 .10 .40 7 .69 02026400 SF Tye River at Nash --------------------------- 375124 790247 14 .2 15 .5 13 .0 5 .30 4 .00 4 .40 2 .10 .39 14.81
02027600 Buffalo River below Forks of Buffalo - - - - - - - - - - - - - - - - 374047 791320 15 .9 16 .0 12 .3 2 .40 1 .50 2 .00 .69 .71 13 .66 02027670 Buffalo River near Amherst----------------------- 373618 790135 93 .1 58 .8 52 .2 17 .2 12 .4 14.0 6.60 .48 8 .57 02027700 Buffalo River Tributary near Amherst - - - - - - - - - - - - - - - - 373345 785735 .46 .40 .33 .04 .02 .03 .00 .92 11 .80 02028450 Sycamore Creek at Route 601 near Howardsville -------- 374043 783955 9.94 5 .40 5 .20 1 .80 1 .40 1 .60 .55 .46 7 .37 02028700 Cove Creek near Covesville----------------------- 375206 784332 4.00 3 .70 3 .30 1 .03 .73 .90 .30 .51 12 .55
02029200 NF Hardware River at Red Hill -------------------- 375803 783704 11 .0 11 .8 11 .0 3 .10 2 .15 3 .00 .85 .55 14 .56 02029400 South Branch NF Hardware River near North Garden ----- 375721 783935 6 .59 5 .40 5 .20 1 .70 1 .20 1 .60 .50 .49 11 .12 02030150 Slate River at Buckingham ----------------------- 373308 783353 63 .0 39 .8 38 .3 12 .8 9.50 11 .0 3 .50 .48 8 .57 02030300 Slate River near Dillwyn ------------------------- 373708 782910 154 80 .0 85 .0 27 .0 18 .2 22 .0 5 .80 .50 7 .05 02030850 StocktonCreek near Crozet ----------------------- 380237 784154 20 .4 11 .5 10 .5 3 .20 2 .20 2 .00 .22 .52 7 .65
D 02033750 Buck Island Creek below Houchins Creek near Simeon - - - - 375713 782415 31 .0 11 .0 10 .0 1 .40 .75 1 .30 .18 .85 4 .82 02034150 Little Byrd Creek at Route 667 uear Fife--------------- 374550 780524 29.9 --- 6 .60 .78 .42 .66 .10 .93o. x 02034300 Little Willis River atCurdsville -------------------- 372438 782735 7.07 2 .80 2 .70 1 .10 .83 .95 .40 .39 5 .37
H 02035075 Maxey Mill Creek at Ballsville --------------------- 373107 780731 12 .0 4 .75 4 .95 1 .40 .92 1 .10 .34 .55 5 .37 02035460 Big Lickinghole Creek at Route 613 near Goland -------- 374352 775721 28 .7 8 .20 8 .20 3 .00 2 .00 2.30 .96 .44 3 .88ato

�
---------------------------------------------
----------
------------------
------
------------------
----------------------- --- --- ---
- - -- -
---
- - - - - - -
- - - - - - -
- - - - - - - - - - -
Appendix 2. Base-flow characteristics at partial-record streamflow-gaging stations in the Valley and Ridge, the Blue Ridge, and the Piedmont Physiographic Provinces of Virginia-Continued
Mean Base-flow Drainage base varia- Effective
Station area flow Q5o Q90 Q95 702 7010 bility recharge number Station name Latitude Longitude (mil) (ft3/s) (ft3/s) (ft3/s) (ft3/s) (ft3/s) (ft3/s) index (in/yr)
02036700 BemardsCreek near Manakin 373325 774033 15 .4 6.20 5.90 1 .00 00 .00 0.011 0.77 5.46 02038900 Dry Creek near Farnrville 372045 782445 3.64 .41 .38 .06 .04 .05 .00 .80 1 .53 02039600 Briery Creek at US HWY460 (Bus) near Rice 371649 782148 41 .5 12 .0 11 .9 4.40 3.25 3.70 1 .40 .43 3 .92 02039700 Sandy River at USHWY460near Rice -------------- 371631 781917 39 .7 13 .8 13 .5 4.50 3.20 3.60 1 .30 .48 4.72 02039800 Angola Creek near Angola------------------------ 372216 781744 6.74 1 .95 1 .90 1 .00 .80 .86 .46 .28 3 .93
02040500 Flat Creek near Amelia ------------------------- 372327 780345 73 .0 38 .3 36 .0 5.45 2.80 2.60 .30 .82 7.11 02040600 Nibbs Creek Tributary near Amelia 372345 775820 .35 .15 .15 .02 .01 .01 .00 .88 5 .82 02040900 Little Creek near Denaro ------------------------ 371332 780110 3.93 1 .85 1 .80 66 .46 .46 .14 .44 6.39 02041400 Whipponock Creek at Route 627 near Church Road 371145 773923 3.27 1 .03 .98 .18 .09 .12 .01 .74 4.27 02042050 Franks Branch at Route 626 near Colonial Heights 371642 772835 16 .8 8.50 7.70 58 .20 .25 .01 1 .12 6.87
02044200 Falls Creek Tributary near Victoria 370204 781026 .34 .12 .11 .02 .01 .01 .00 74 4.79 02044300 Little Nottoway River at Route 40 near Blackstone 370225 780207 72 .6 44 .5 42 .0 7.80 3.90 3.40 .48 .73 8.32 02044400 Hurricane Branch at Blackstone 370447 775855 1 .61 .17 .17 .04 .02 .02 .00 .63 1 .43 02045800 White Oak Creek at Route 620 near Hebron ----------- 370740 774854 5.94 .46 .16 .12 .01 02046300 Hatcher Run at Route 613 near Reems 370723 772845 35 .7 8.00 7.00 1.20 .60 .86 .08 .77 3 .04
02046750 Three Creek at Route 616 near Emporia --------------- 364325 773113 67 .2 10 .7 10 .3 1 .80 .96 1 .20 .29 .76 2.16 02050400 North Meherrin River near Briery - - - - - - - - - - - - - - - - - - - 370420 782745 1 .19 .58 .56 .18 .14 .14 .05 .49 6.61 02051100 South Meherrin River near Chase City - - -- - - - - -- - - -- - - 365134 782522 27 .6 6.51 6.00 1.02 .61 .70 .16 .77 3 .20 02051175 Meherrin River at Route 636 near North View - - - - - - - - - - 364803 781004 305 85 .0 80 .0 21 .0 14 .0 13 .0 8.70 .58 3 .78 02051200 Flat Rock Creek near Kenbridge -------------------- 365358 780722 21 .5 14 .0 13 .1 2.70 1 .80 1 .80 .36 .69 8.84
02051300 Evans Creek near Brodnax ------------------------ 364407 775734 14 .6 5.60 5.60 2.30 1 .60 1 .80 .65 39 5.20 02051650 Rocky Run near Dolphin - - - - - - - - - - - - - - - - - - - - - - - - - 364735 774935 1 .41 49 .42 .03 .01 .01 .00 1 .15 4.72 02052100 Rattlesnake Creek near Ankum--------------------- 363648 775225 6.55 1 .40 1 .40 .10 .03 .04 .00 1 .15 2.90 02054120 NFRoanokeRiver near LustersGate ---------------- 371318 802156 44 .6 19 .5 17 .0 6.10 5.00 4.80 2.60 .45 5.93 02056700 Beaverdam Creek at Route 757 near Hardy ------------ 371328 794523 24 .8 --- --- 4.00 2.80 3 .20 .88 --
02056950 Maggodee Creek near Boones Mill ------------------ 370757 795820 11 .0 8.75 8.25 2.15 1 .30 1 .20 .34 .58 10 .79 02057050 Gills Creek at Route 122 near Burnt Chimney - - - - - - - - - - 370731 794658 21 .8 13 .0 14 .0 5.00 3.60 6.00 24 45 8.09 02057600 PiggRiver atRoute 40near Rocky Mount ------------- 365834 795532 40 .5 40 .5 40 .0 18.0 13 .5 17 .0 8.50 .35 13 .57 02057700 Powder Mill Creek at Rocky Mount ----------------- 370026 795225 64 .36 36 .12 .09 .11 .05 .48 7.63 02057750 Little Chestnut Creek near Syndorsville --------------- 365407 795055 15 .5 9.50 10 .0 3 .40 2.50 2.90 1 .10 47 8.32
02058100 Turkeycock Creek at Route 969 at Sago --------------- 365253 793752 29 .5 12 .2 12 .4 10.0 8.00 8.90 4.20 .09 5.61 02059420 NF Goose Creek near Montvale -------------------- 372214 794155 31 .5 10 .4 10 .3 8.80 7.90 8.40 6.-50 .07 4.48 02059460 Shockoe Creek at Route 755 near Irving -------------- 371846 794034 4.02 2.25 2.05 37 .26 .30 .10 .74 7.60 02060400 Sycamore Creek at Sycamore---------------------- 370125 792124 5.30 1 .60 1 .60 1.05 .09 1 .00 .70 .18 4.10 02061200 Little Otter River at Route 122 near Bedford ----------- 372141 793003 18 .3 12 .0 11 .0 4.20 3.10 3 .60 1 .50 42 8.90

�
--------------------
------------
-
---------------- --- --- ------------------
----------------------
- - - - - - -
- - - - - - - - - - - -
Appendix 2. Base-flow characteristics at partial-record streamflow-gaging stations in the Valley and Ridge, the Blue Ridge, and the Piedmont Physiographic Provinces of Virginia-Continued
Mean Base-flow Drainage base varia- Effective
Station area flow Q5a Q90 Q95 702 7Q1Q bility recharge number Station name Latitude Longitude (mil ) (ft 3/s) (ft 3/s) (ft3/s) (ft 3/s) (ft 3/s) (ft3/s) index (in/yr)
02062300 Seneca Creek at Route 633 near Long Island ----------- 370623 790722 52 .0 26 .5 26 .5 9 .00 7 .00 8 .00 3 .30 0 .47 6 .92 02063400 Reedy Creek near Spring Mills --------------------- 371654 785414 12 .6 7 .83 7 .67 2 .70 2 .03 2 .40 .90 .45 8 .43 02063600 Button Creek near Rustburg ----------------------- 371525 790410 .59 .39 .39 10 .06 .08 .03 .59 8 .97 02065100 Snake Creek near Brookneal - - - - - - - - - - - - - - - - - - - - - - 370042 785752 1 .68 .78 .77 45 .36 .40 .25 .23 6 .30 02065220 Catawba Creek at Route 626 at Clarkton -------------- 365830 785345 40 .3 11 .3 11 .2 8 .75 6 .75 8 .00 4 .40 .11 3 .80
02065300 Right Hand Fork near Appomattox ------------------ 371612 784914 2 .08 1 .27 1 .27 .62 .48 .57 .30 31 8 .29 020654110 Big Cub Creek at Route 701 near Madisonville - - - - - - - - - - 371213 784405 37 .2 12 .5 12 .5 10 .2 7 .50 9 .00 4 .00 .09 4 .54 02066450 Roanoke Creek near Charlotte Court House ------------ 370327 783503 42 .7 11 .3 11 .2 5 .65 4.00 4 .80 1 .60 30 3.58 02067100 Difficult Creek at US HWY360 near Scottsburg --------- 364746 784710 40 .3 15 .7 15 .0 6 .12 5 .05 6 .20 2 .40 .39 5 .29 02067810 Maple Swamp Branch near Meadows of Dan ----------- 364410 802628 .49 .57 .64 .35 .36 .30 .21 .26 15 .79
02069600 Anglin Branch near Stuart ------------------------ 363815 801255 3 .10 3 .50 3 .50 1 .45 1 .10 1 .20 .58 .38 15 .32 02069800 Grassy Branch at Route 721 near Sanvil le - - - - - - - - - - - - - 364203 800548 3 .29 3 .20 3 .20 1 .60 1 .25 1 .40 .82 .30 13 .20 02071600 Smith River near Charity------------------------- 364818 801204 79 .7 80 .0 80 .0 4.10 3 .45 38 .0 22 .0 1 .29 13 .62 02071800 Nicholas Creek near Ferrum----------------------- 365211 800310 12 .2 11 .1 11 .1 4.65 3 .20 3 .60 1 .30 .38 12 .35 02072600 Reed Creek near Collinsville ---------------------- 364517 795448 12 .4 7 .25 7 .25 3 .30 2 .60 2 .80 1 .40 .34 7 .93
02074450 Sandy River near Swansonville -------------------- 364423 793654 24 .1 11 .2 11 .3 7.38 6 .00 6 .00 3 .20 .18 6 .28 02075020 Fall Creek at Route 719 near Danville - - - - - - - - - - - - - - - - 364042 792413 5 .39 2 .10 2 .15 59 .39 .44 .15 56 5 .29 02075275 Sandy Creek (River) at US HWY 58 near Ringgold ------- 363450 791331 18 .2 7 .63 7 .75 4 .03 3 .50 3 .50 1 .90 28 5 .69 02075600 Birch Creek near Birch -------------------------- 364212 791303 19 .8 10 .5 10 .5 3 .70 1 .90 3 .20 1 .30 .45 7 .21 02075900 Lawsons Creek at Turbeville - - - - - - - - - - - - - - - - - - - - - - 363639 790128 8 .70 2 .70 2 .70 1 .10 .75 .98 .42 .39 4 .21
02076300 Banister River at US HWY29 near Chatham ----------- 364641 792333 84.8 46.0 48 .0 19 .0 13 .5 16 .0 6 .70 .40 7 .36 02076650 Banister River at Route 640 near Mount Airy ----------- 365439 791100 269 160 162 79 .8 34 .8 63 .0 31 .0 31 8 .07 02076700 Blacks Creek near Mount Airy --------------------- 365640 790956 3.44 1 .35 1 .35 .18 .06 .12 .02 .88 5 .33 02076770 Sandy Creek at Route 832 at Meadville --------------- 364932 790139 99 .0 43 .4 42 .1 21 .5 16 .4 19 .0 9 .10 .29 5 .95 02078400 Bluestone Creek at Route 699 near Laconi - - - - - - - - - - - - - 364348 783658 47 .8 18 .0 16.5 1 .20 .62 .60 .05 1 .14 5 .11
02079660 Jolly Hollow Branch at Boydton 364038 782313 3 .60 1 .10 1 .05 37 .28 .32 .18 45 4.15 02079665 CoxCreek atBaskerville------------------------- 364058 781615 11 .5 5 .10 5 .00 1 .67 1 .15 1 .311 .40 48 6 .02 03162415 Helton Creek at US HWY 58 near Whitetop 363633 813352 5 .28 7 .75 5 .50 .85 .65 2 .60 1 .60 .81 19 .92 03162650 Wilson Creek atVolney-------------------------- 363720 812336 17 .7 8 .25 5 .50 .70 .53 2 .20 1 .30 90 6 .33 03163500 Elk Creek at Mount Carmel Church near Galax - - 364153 810326 63 .5 50 .0 52 .5 14 .5 10 .3 12 .0 5 .10 56 10 .69
D 03165350 Brush Creek at Route 94 near Ivanhoe 364559 805905 15 .1 .32 .12 1 .00 .25 .29 03165750 Blue Springs Creek near Cedar Springs 364814 811822 12 .9 6.80 5 .80 2 .50 2 .20 2 .40 1 .70 37 7 .15
x 03166400 Stony Fork near Favonia ------------------------ 370030 811127 7 .77 4.40 3 .40 63 50 .52 .34 73 7 .68 rn 03167200 Laurel Fork at Route 638 near Laurel Fork 364434 803149 28 .3 33 .0 34 .5 21 .5 19 .3 20 .11 14.0 21 15 .82 ,pcn
03167695 BeavcrdarnCreek atHillsville 365545 804342 4.19 4.15 4 .20 2 .73 2 .38 2 .30 1 .60 19 13 .44

�
Appendix 2. Base-flow characteristics at partial-record streamflow-gaging stations in the Valley and Ridge, the Blue Ridge, and the Piedmont PhysiographicProvinces of Virginia-Continued
Mean Base-flow Drainage base varia- Effective
Station number Station name Latitude Longitude
area (mil)
flow (ft3/s)
Q50 (ft3/s)
Q90 (ft3/s)
Q95 (ft3/s)
7Q2 (ft3/s)
7Q10 (ft3/s)
bility index
recharge (in/yr)
03168750 Thorne Springs Branch near Dublin ----------------- 370530 804434 4.77 0.93 0.62 0.14 0.10 0.10 0.04 0.65 2.65 03169150 Pine Creek at Route 682 near Floyd ----------------- 365703 801703 10 .7 9.00 8.75 6.00 5.10 5.60 4.40 .16 11 .41 03169370 Brush Creek at Route 616 near Riner ----------------- 370157 802349 19 .1 6.60 5.80 2.30 1.85 1 .90 1 .10 .40 4.69 03171400 Neck Creek at Route 617 near Belspring -------------- 371103 803724 7.92 6.30 5.30 2.15 1.90 2.00 1 .60 .39 10.79 03171550 Sinking Creek at Route 700 near Newport - - - - - - - - - - - - - 371840 803055 65 .4 63 .2 51 .5 12 .8 9.90 10.00 6.00 .60 13 .11
03171900 Kimberling Creek near Holly Brook ----------------- 371038 805854 27 .3 5.60 3.50 .24 .17 .18 .08 1 .16 2.78 03177600 BluestoneRiver above Bluefield-------------------- 371357 811800 16.7 16 .2 15 .1 8.20 7.40 7.10 6.00 .27 13 .16 03475700 Spring Creek near Abingdon - - - - - - - - - - - - - - - - - - - - - - 364403 820229 2.99 3.60 3.40 1.20 1 .00 1 .00 .70 .45 16 .34 03489800 Cove Creek near Shelleys ------------------------ 363913 822116 17 .3 23 .0 14 .0 1.60 1 .20 1 .20 .65 .94 18 .04 03521950 Maiden Spring Creek near Thompson Valley ----------- 370328 813126 17 .8 11 .0 10 .5 7.00 6.50 7.00 6.00 .18 8.39
03523650 ThompsonCreek atArtrip------------------------ 365801 820642 19 .5 8.50 7.60 1.30 .98 1 .00 .55 .77 5.92 03523700 Weaver Creek at Artrip -------------------------- 365733 820748 18 .1 5.50 4.80 .50 .34 .37 .18 .98 4.12 03525100 Cove Creek near Stanleytown --------------------- 364500 823725 23 .5 15 .2 14 .5 3 .50 2.80 2.80 1.90 .62 8.78 03525490 Stock Creek at Clinchport ------------------------ 364032 824444 31 .2 24 .0 22 .0 4.30 3.40 3.20 2.10 .71 10 .44 03527480 NF Clinch River near Duffield --------------------- 364402 824751 16 .1 13 .0 12 .0 2.10 1 .60 1 .60 1.00 .76 10 .96
03527490 Dry Branch near Duffield ------------------------ 364354 824749 4.24 .20 .14 --- --- .00 .00 --- .64 03529800 SF Powell River at East Stone Gap ------------------ 365205 824448 27 .2 20.0 17 .0 3.80 2.60 3.00 1 .60 .65 9.98 03529900 Butcher Fork at East Stone Gap -------------------- 365224 824414 8.15 6.60 5.60 1 .45 1 .08 1 .20 .69 .59 10 .99 03531505 BatieCreek near Jonesville ----------------------- 363934 830908 17 .4 10.0 9_50 3.30 2.60 2.80 1 .90 .46 7.80 03531520 WallenCreek near Jonesville ---------------------- 363758 831019 47 .4 40.0 36.0 12 .4 10 .0 11 .0 7.30 .46 11 .45
03531530 Hardy Creek near Smiley------------------------- 363901 831450 17 .3 16.0 14.0 4.00 3.10 3.40 2.10 .54 12 .55 03531535 Dry Creek near Smiley -------------------------- 363908 831448 23 .6 10.5 9.00 1 .90 1 .40 1 .50 .88 .68 6.04

����
Appendix 3. Basin characteristics and aquifer properties for selected continuous-record streamflow-gaging stations in the Valley and Ridge, the Blue Ridge, and the Piedmont Physiographic Provinces of Virginia [mi/mi`, mile per square mile; in/yr, inch per year; ft`/d, feet squared per day; BR, Blue Ridge region ; PN, Piedmont northern region ; PS, Piedmont southern region ; VR, Valley and Ridge region .
Effective recharge rates are presented in appendix 1]
Percentage of basin underlain Recession Riparian Average Areal
Potential by hydrogeologic unit Aquifer index evapo- ground- Total Areal trans- Stor-
surface- Blue Ridge and Drainage half- (days/ trans- water stream diffu- missiv- age
Station water Valley and Ridge Piedmont density width log piration gradient length sivity ity coeffi
number yield Region Small Medium Large Small Medium Large (mi/mi) (ft) cycle) (in/yr) (ft/mi) (mi) (ft2/d) (ft2/d) cient
01626850 High BR 35 .3 0.0 22 .8 35 .9 6.1 0.0 1 .34 1,977 81 .0 1 .59 110 199 45,000 330 0.007
01627500 High VR 39 .5 .0 20 .0 39 .7 .8 .0 1 .27 2,077 84 .7 1 .53 104 270 47,500 320 .007 1 .57 301 165 71,200 99 .00101632000 Low VR 97.8 2.1 .1 .0 .0 .0 1 .32 2,001 52 .5
01632900 Moderate VR 63 .0 .0 37 .0 .0 .0 1.33 1,987 81 .6 .82 110 68 .8 45,200 350 .008 1 .28 200 143 64,300 100 .00201634500 Moderate VR 91 .3 8.7 .0 .0 .0 .0 1 .39 1,901 52 .4
.99 57 .0 127 52,100 400 .00801638480 Moderate BR .0 .0 .0 27 .9 72 .1 .0 1 .42 1,859 61 .9
01643700 Moderate BR .0 .0 .0 76 .9 23 .1 .0 1 .48 1,783 43 .2 1 .87 96 .0 182 68,700 280 .004 .60 45 .0 86 .0 27,800 450 .01601646000 Moderate PN .0 0 .0 98 .3 1 .3 .4 1 .49 1,777 106 .82 45 .0 34 .5 46,000 390 .00801654000 Moderate PN .0 .0 .0 87 .3 12 .7 .0 1 .47 1,801 65 .7
.0 .0 .0 100 .0 .0 1 .41 1,872 37 .0 1 .20 34.0 8.9 88,400 540 .00601658500 Low PN
01660400 Low PN .0 .0 .0 100 .0 .0 1 .29 2,039 47 .6 .90 34.0 45 .1 81,500 600 007
01662800 Moderate BR .0 .0 .0 .0 100 .0 1 .57 1,682 59 .6 1 .20 74 .0 15 .9 44,300 810 018
01663500 Moderate BR .0 .0 .0 13 .5 86.5 .0 1 .59 1,662 59 .5 1 .36 115 188 43,300 520 012
01666500 Moderate PN .0 .0 .0 47 .6 52 .4 .0 1 .41 1,872 63 .3 1 .67 74 .0 177 51,600 590 .011
01673800 Low PS .0 .0 .0 78 .6 21 .4 0 1 .34 1,963 45 .5 .96 28 .0 104 79,100 650 .008
02011400 Moderate VR 90 .8 6.7 2.5 .0 .0 .0 1 .76 1,499 59 .1 1 .74 337 77 .1 35,500 220 .006
02011460 Moderate VR 94 .5 2.9 2.6 .0 .0 .0 1 .76 1,501 68 .7 1 .70 431 35 .0 30,600 170 .006
02014000 Moderate VR 95 .8 4.0 .2 .0 .0 .0 1 .73 1,530 58 .5 1 .88 354 264 37,300 63 .002
02015700 High VR 85.0 15 .0 .0 .0 .0 .0 1 .78 1,486 67 .9 1 .57 253 54 .1 30,400 350 .012
02017500 Moderate VR 97.5 2.5 .0 .0 .0 .0 1 .83 1,440 50 .5 2.08 303 191 38,300 74 .002
02018000 Moderate VR 91 .8 4.5 3.7 .0 .0 .0 1 .72 1,531 57 .0 1 .33 297 567 38,400 70 .002
02022500 Moderate VR 85 .9 .0 14 .1 .0 .0 .0 1 .80 1,467 62 .0 1 .12 258 63 .0 32,400 68 .002
02027000 Moderate BR .0 .0 .0 3.2 96 .8 .0 1 .62 1,634 60 .6 2.33 340 150 41,100 110 .0113 1.50 110 241 27,500 230 .00802027800 Moderate BR .0 .0 .0 21 .2 78 .8 .0 1 .64 1,608 87 .7
02028500 Moderate BR .0 .0 .0 20.4 79 .6 .0 1 .73 1,527 67 .4 2.03 240 164 32,300 130 .004
02031000 Moderate BR .0 .0 .0 28 .5 71 .5 .0 1 .32 2,004 68.3 1 .34 109 126 54,800 270 .005
02032400 Moderate BR .0 .0 .0 35 .8 64 .2 .0 1 .58 1,666 49.3 1 .49 137 33 .7 52,600 290 .006
02038850 Moderate PS .0 .0 0 98 .5 1 .5 .0 1 .44 1,830 79 .0 .67 31 .0 12 .3 39,500 690 .017
02039000 High PS .0 .0 .0 98 .8 1 .2 .0 1 .51 1,753 108.7 .98 41 .0 105 26,400 500 .019
a 02044500 Moderate PS .0 0 .0 62 .8 37 .2 .0 1 .48 1,782 69 .2 .64 22 .0 458 42,800 830 .019 XN y
AV
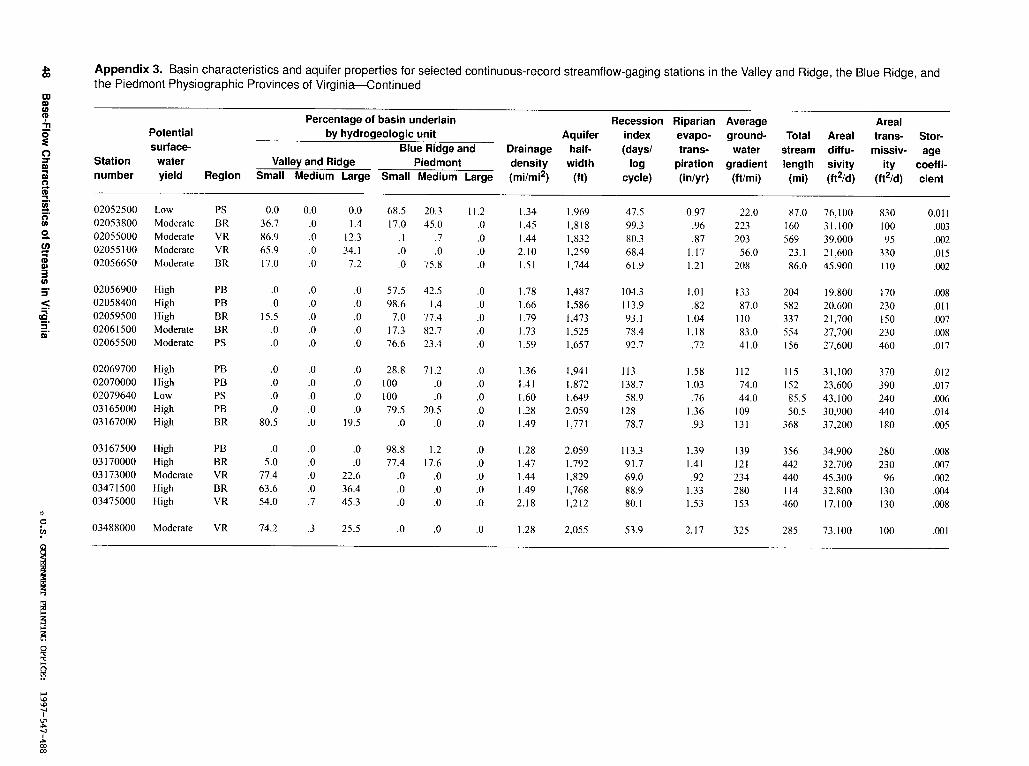
��������������
A Appendix 3 . Basin characteristics and aquifer properties for selected continuous-record streamflow-gaging stations in the Valley and Ridge, the Blue Ridge, and00 the Piedmont Physiographic Provinces of Virginia---Continued
WdNm Percentage of basin underlain Recession Riparian Average Arealm Potential by hydrogeologic unit Aquifer index evapo- ground- Total Areal trans- Stor-
n surface- Blue Ridge and Drainage half- (days/ trans- water stream diffu- missiv- age Station water Valley and Ridge Piedmont density width log piration gradient length sivity ity coeffinumber yield Region Small Medium Large Small Medium Large (mi/mi2 ) (ft) cycle) (in/yr) (ft/mi) (mi) (ft2 /d) (ft2/d) cient
m 02052500 Low PS 0.0 0.0 0.0 68 .5 20 .3 11 .2 1 .34 1,969 47 .5 0.97 22 .0 87 .0 76,100 830 0.011
°tn 02053800 Moderate BR 36 .7 .0 1 .4 17 .0 45 .0 .0 1 .45 1,818 99 .3 .96 223 160 31,100 100 .003 02055000 Moderate VR 86 .9 .0 12 .3 .1 .7 .0 1 .44 1,832 80 .3 .87 203 569 39,000 95 .002N 02055100 Moderate VR 65 .9 .0 34 .1 .0 .0 .0 2.10 1,259 68 .4 1 .17 56 .0 23 .1 21,600 330 .015
y 02056650 Moderate BR 17 .0 .0 7.2 .0 75 .8 .0 1 .51 1,744 61 .9 1 .21 208 86 .0 45,900 110 .002 Ul
02056900 High PB .0 .0 .0 57 .5 42 .5 .0 1 .78 1,487 104.3 1 .01 133 204 19,800 170 .008 02058400 High PB .0 .0 .0 98 .6 1 .4 .0 1 .66 1,586 113.9 .82 87 .0 582 20,600 230 .011 02059500 High BR 15 .5 .0 .0 7.0 77.4 .0 1 .79 1,473 93 .1 1 .04 110 337 21,700 150 .007 02061500 Moderate BR .0 .0 .0 17 .3 82 .7 .0 1 .73 1,525 78 .4 1 .18 83 .0 554 27,700 230 .008tv 02065500 Moderate PS .0 .0 .0 76 .6 23 .4 .0 1 .59 1,657 92 .7 .72 41 .0 156 27,600 460 .017
02069700 High PB .0 .0 .0 28 .8 71 .2 .0 1 .36 1,941 113 1 .58 112 115 31,100 370 .012 02070000 High PB .0 .0 .0 100 .0 .0 1 .41 1,872 138.7 1 .03 74 .0 152 23,600 390 .017 02079640 Low PS .0 .0 .0 100 .0 .0 1 .60 1,649 58 .9 .76 44 .0 85 .5 43,100 240 .006 03165000 High PB .0 .0 .0 79 .5 20 .5 .0 1 .28 2,059 128 1 .36 109 50.5 30,900 440 .014 03167000 High BR 80 .5 .0 19.5 .0 .0 .0 1 .49 1,771 78 .7 .93 131 368 37,200 180 .005
03167500 High PB .0 .0 .0 98.8 1 .2 .0 1 .28 2,059 113.3 1 .39 139 356 34,900 280 .008 03170000 High BR 5.0 .0 .0 77.4 17 .6 .0 1 .47 1,792 91 .7 1 .41 121 442 32,700 230 .007 03173000 Moderate VR 77 .4 .0 22 .6 .0 .0 .0 1 .44 1,829 69 .0 .92 234 440 45,300 96 .002 03471500 High BR 63 .6 .0 36 .4 .0 .0 .0 1 .49 1,768 88 .9 1 .33 280 114 32,800 130 .004 03475000 High VR 54 .0 .7 45 .3 .0 .0 .0 2.18 1,212 80 .1 1 .53 153 460 17,100 130 .008
u c y 03488000 Moderate VR 74 .2 .3 25 .5 .0 .0 .0 1 .28 2,055 53 .9 2.17 325 285 73,100 100 .001