Embed Size (px)
Citation preview

DISCLAIMER The author’s views expressed in this publication do not necessarily reflect the views of the United States Agency for International
Development or the United States Government.
BASA PILIPINAS IMPACT EVALUATION
FINAL REPORT
November 2017
USAID BASA PILIPINAS


BASA PILIPINAS IMPACT EVALUATION
FINAL REPORT
November 2017
USAID/Philippines
GS-10F-0294C / AID-492-M-15-00011
This publication was produced at the request of the United States Agency for International Development
(USAID). It was prepared independently by Jordan Robinson, Mike Duthie, and Andrea Hur on behalf
of Social Impact, Inc.
Contact:
Social Impact, Inc.
2300 Clarendon Blvd., Suite 1000
Arlington, VA 22201
Jordan Robinson, Project Manager
DISCLAIMER
The authors’ views expressed in this publication do not necessarily reflect the views of the United
States Agency for International Development or the United States Government.

ACKNOWLEDGEMENTS
The authors gratefully acknowledge numerous individuals and organizations that contributed to this
impact evaluation (IE).
We would first like to express our gratitude to the Philippine Department of Education (DepEd) for
ongoing support of this IE and extensive engagement in briefings and reviews of draft reports. DepEd
central and regional staff provided valuable input into the IE design, granted school access, participated
in dissemination, and provided the evaluators access to administrative data.
We would also like to express our gratitude to all the school directors and teachers for their
participation, including opening their doors to their classrooms to allow observation. We also thank the
students and their parents. The participants’ input provided us with valuable information for this IE, and
we are very grateful.
We are very grateful to Tylor Nelson Sofres - Philippines (TNS Philippines) for their hard work and
valuable data collection efforts over the course of this IE. In particular, we would like to recognize Yazmin
Tolentino for her excellent management of data collection activities. At Social Impact headquarters,
Miguel Albornoz and Andrea Hur provided critical support in data cleaning and data presentation. We
also thank our local education specialist in the Philippines, Dr. Jessie Barrot, who provided valuable sector
and contextual expertise over the course of the IE.
We thank the Basa Pilipinas implementing partner, particularly Marcial Salvatierra and Lisa Hartenberger,
for their ongoing collaboration. Finally, we highly appreciate the support and guidance extended by
USAID/Philippines. In particular, we thank Nancy Ebuenga for her cooperation and support throughout
the study.

TABLE OF CONTENTS
ACKNOWLEDGEMENTS .......................................................................................................................... II
EXECUTIVE SUMMARY ............................................................................................................................ 1
FINDINGS ........................................................................................................................................................................................... 2
CONCLUSIONS ................................................................................................................................................................................ 3
RECOMMENDATIONS ................................................................................................................................................................... 4
INTRODUCTION ....................................................................................................................................... 6
DEVELOPMENT INTERVENTION ............................................................................................................................................... 6
EXISTING EVIDENCE ...................................................................................................................................................................... 8
EVALUATION PURPOSE AND EVALUATION QUESTIONS ............................................................................................. 9
IMPACT EVALUATION METHODOLOGY .......................................................................................... 10
SCHOOL SAMPLING AND MATCHING ................................................................................................................................ 10
DEVELOPMENT OF AN EVALUATION SAMPLE FRAME .................................................................................................................... 10
SCHOOL MATCHING ...................................................................................................................................................................................... 10
STUDENT SAMPLING ................................................................................................................................................................... 11
SAMPLE SIZE CALCULATION AND POWER ANALYSIS .................................................................................................. 11
DATA COLLECTION .................................................................................................................................................................... 12
DATA COLLECTION TOOLS .......................................................................................................................................................................... 12
FIELDWORKER TRAINING ............................................................................................................................................................................ 13
DATA ANALYSIS ............................................................................................................................................................................ 14
LIMITATIONS .................................................................................................................................................................................. 15
STRENGTHS OF THE EVALUATION APPROACH .............................................................................................................. 15
FINDINGS: STUDENTS ........................................................................................................................... 17
OVERVIEW OF THE SAMPLE ...................................................................................................................................................... 17
SUMMARY OF EGRA FINDINGS ............................................................................................................................................... 17
MOTHER TONGUE ....................................................................................................................................................................... 19
FILIPINO ............................................................................................................................................................................................ 20
ENGLISH ............................................................................................................................................................................................ 22
PROGRESS TOWARD BENCHMARKS .................................................................................................................................... 24
PREDICTORS OF READING OUTCOMES ............................................................................................................................. 25
ZERO SCORES ................................................................................................................................................................................. 27
EGMA .................................................................................................................................................................................................. 28

FINDINGS: TEACHERS AND SCHOOLS .............................................................................................. 29
CONCLUSIONS ........................................................................................................................................ 32
STUDENTS ........................................................................................................................................................................................ 32
TEACHERS AND SCHOOLS ....................................................................................................................................................... 33
RECOMMENDATIONS ............................................................................................................................ 34
ANNEX I – EVALUATION STATEMENT OF WORK .......................................................................... 35
ANNEX 2 – SAMPLED SCHOOLS .......................................................................................................... 38
ANNEX 3 – POWER CALCULATIONS ................................................................................................. 45
ANNEX 4 – INSTRUMENTS .................................................................................................................... 46
ANNEX 5 – EGMA FINDINGS ................................................................................................................ 90
ANNEX 6 – COMPLETE REGRESSION TABLES ................................................................................. 92
ANNEX 7 – ALTERNATE REGRESSION MODELS ............................................................................ 119
ANNEX 8 – CORRELATIONS BETWEEN OBSERVED TEACHING PRACTICES AND ORF ...... 143
ANNEX 9 – EGRA ASSESSMENT EQUATING ................................................................................... 144
ANNEX 10 – REVIEW OF TEST ORDER EFFECTS ........................................................................... 147
ANNEX 11 – HISTOGRAMS OF ORF SCORES .................................................................................. 157
ANNEX 12 – DISCLOSURE OF CONFLICTS OF INTEREST ........................................................... 161

TABLE OF FIGURES
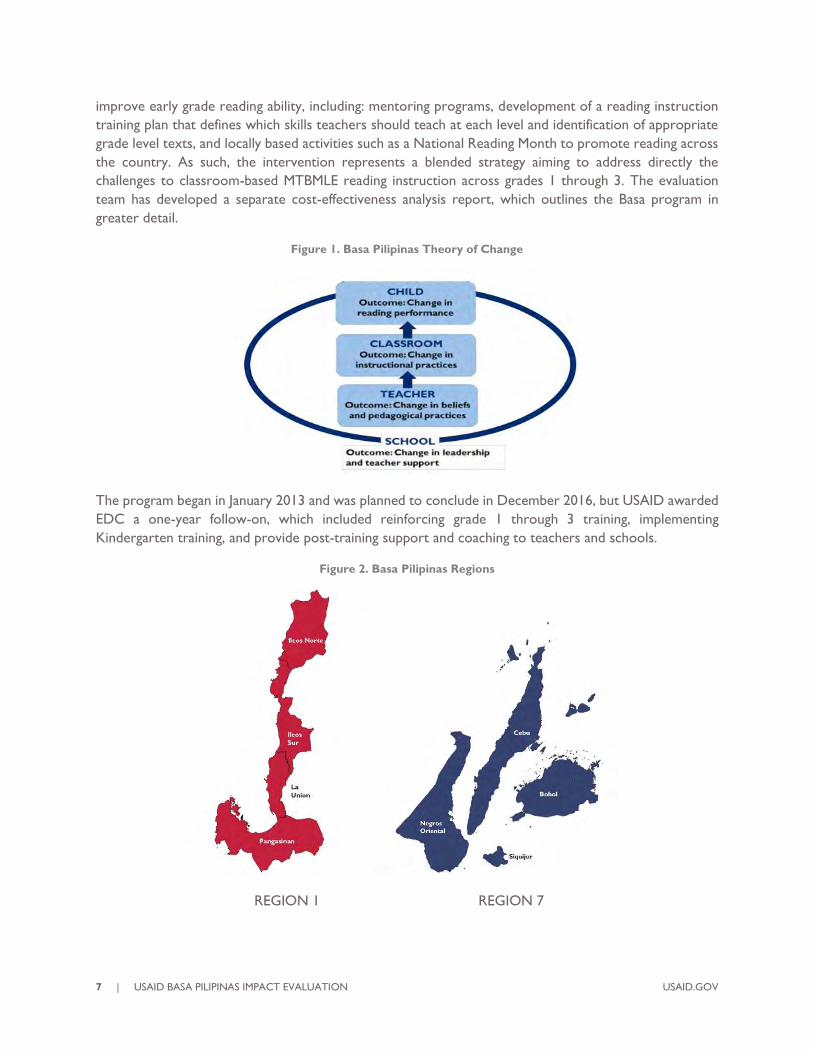
FIGURE 1. BASA PILIPINAS THEORY OF CHANGE .................................................................................................................. 7
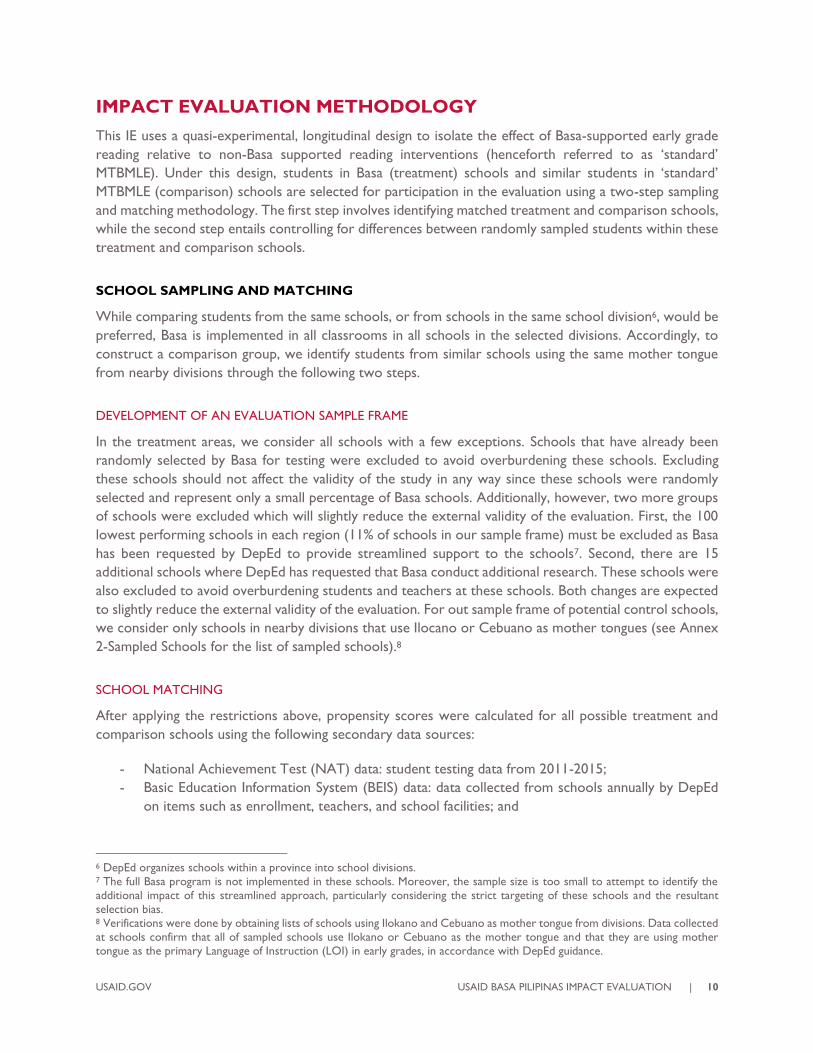
FIGURE 2. BASA PILIPINAS REGIONS ............................................................................................................................................ 7
FIGURE 3. IMPACTS OF BASA ON GRADE 1 STUDENTS .................................................................................................... 20
FIGURE 4. IMPACTS OF BASA ON GRADE 2 STUDENTS - FILIPINO .............................................................................. 21
FIGURE 5. IMPACTS OF BASA ON GRADE 3 STUDENTS - FILIPINO .............................................................................. 21
FIGURE 6. IMPACTS OF BASA ON GRADE 4 STUDENTS - FILIPINO .............................................................................. 22
FIGURE 7. IMPACTS OF BASA ON GRADE 2 STUDENTS - ENGLISH ............................................................................. 23
FIGURE 8. IMPACTS OF BASA ON GRADE 3 STUDENTS – ENGLISH ............................................................................. 23
FIGURE 9. IMPACTS OF BASA ON GRADE 4 STUDENTS - ENGLISH ............................................................................. 24
TABLE OF TABLES
TABLE 1: ONE-YEAR IMPACTS OF BASA.................................................................................................................................... 2
TABLE 2: NATIONAL CURRICULUM STANDARDS FOR READING ................................................................................. 6
TABLE 3: SAMPLED SCHOOLS ....................................................................................................................................................... 11
TABLE 4: EGRA TOOLS ADMINISTERED BY GRADE AND YEAR .................................................................................... 12
TABLE 5: FIELD IRR RESULTS .......................................................................................................................................................... 14
TABLE 6: EVALUATION SAMPLE ................................................................................................................................................... 17
TABLE 7: STUDENT CHARACTERISTICS ................................................................................................................................... 17
TABLE 8: ONE-YEAR IMPACTS OF BASA.................................................................................................................................. 18
TABLE 9: TWO-YEAR IMPACTS OF BASA ................................................................................................................................. 19
TABLE 10: PERCENT ATTAINING BENCHMARKS – FILIPINO ........................................................................................... 25
TABLE 11: PERCENT ATTAINING BENCHMARKS – ENGLISH .......................................................................................... 25
TABLE 12: PREDICTORS OF READING OUTCOMES ............................................................................................................ 26
TABLE 13: ZERO SCORES – FILIPINO .......................................................................................................................................... 27
TABLE 14: ZERO SCORES – ENGLISH ......................................................................................................................................... 28
TABLE 15: EGMA ................................................................................................................................................................................ 28
TABLE 16: SCHOOL-LEVEL OUTCOMES .................................................................................................................................. 29
TABLE 17: TEACHER-LEVEL OUTCOMES .................................................................................................................................. 30
TABLE 18: GENERAL BEST-PRACTICE TEACHING BEHAVIORS ....................................................................................... 30
TABLE 19: READING-SPECIFIC BEST-PRACTICE TEACHING BEHAVIORS ................................................................... 31

ACRONYMS
3ie International Initiative for Impact Evaluation
Basa Basa Pilipinas
BEIS Basic Education Information System
CPM Correct Per Minute
DepEd Department of Education
EDC Education Development Center
EGMA Early Grade Math Assessments
EGRA Early Grade Reading Assessments
ELLN Early Language Literacy and Numeracy
IE Impact Evaluation
IRR Inter-Rater Reliability
JPAL Abdul Latif Jameel Poverty Action Lab
LAC Learning Action Cells
MTBMLE Mother Tongue-Based Multilingual Education
NAT National Achievement Test
OLS Ordinary Least Squares
OR Odds Ratio
PAD Project Appraisal Document
PRIMR Kenya Primary Math and Reading
RCT Randomized Controlled Trial
RLL Read-Learn-Lead Program
TE Treatment Effect
TNS Taylor Nelson Sofres

1 | USAID BASA PILIPINAS IMPACT EVALUATION USAID.GOV
EXECUTIVE SUMMARY
Since 2009, the Philippine Department of Education (DepEd) began phasing in mother tongue-based
multilingual education (MTBMLE) across the Philippines. Starting in the 2014 - 2015 school year, all public
schools in the Philippines were implementing MTBMLE in grades K through 3. Per MTBMLE policy, mother
tongue is the main language of instruction from Kinder to Grade 3, and Filipino and English are gradually
introduced from Grade 2 onward. Building on its ongoing assistance to the education sector in the
Philippines, with a special focus on early grade reading, USAID collaborated with DepEd to implement the
Basa Pilipinas (Basa) program, a four-year early grade reading program implemented by Education
Development Center (EDC) in five provinces in the Philippines—Cebu, La Union, Ilocos Norte, Ilocos
Sur, and Bohol. Basa was designed to support DepEd’s MTBMLE initiative by providing teacher training,
improved instructional materials, and strengthened delivery systems. The intervention represents a
blended strategy aiming to directly address the challenges to classroom-based MTBMLE reading
instruction across grades 1 through 3.
Extensive literature supports the effectiveness of school-based interventions on improving student
outcomes, though there is lack of consensus on which approaches are most effective and on whether
effects persist over time. Basa’s approach to improving student literacy is broadly aligned with approaches
that have been effective in a variety of country contexts. Despite the wealth of literature on school-based
early literacy interventions, limited evidence exists for literacy interventions within the context of
multilingual education. This IE and two ongoing USAID mother tongue IEs in Guatemala and Peru will
contribute to this literature.
USAID/Philippines has commissioned an impact evaluation (IE) of the Basa program to measure its impact
and cost-effectiveness as an early grade reading intervention, in the context of MTBMLE. The IE (and cost
analysis) of Basa will be used by USAID, DepEd, and other key stakeholders in the Philippines as the basis
for policy and programming decisions about how reading interventions in support of MTBMLE can best
be structured and implemented to improve early grade learning outcomes.
USAID/Philippines commissioned this evaluation to answer the following two evaluation questions:
1. What is the impact on student reading proficiency and comprehension of the Basa-supported early
grade reading intervention relative to the standard approach?
2. Do any positive impacts of Basa justify additional funding?
This report examines Question 1, while a subsequent report focuses on the cost effectiveness analysis.
This IE uses a quasi-experimental design to isolate the effect of Basa-supported early grade reading relative
to non-Basa supported reading interventions (henceforth referred to as ‘standard’ MTBMLE). Under this
design, students in Basa (treatment) schools and similar students in ‘standard’ MTBMLE (comparison)
schools are selected for participation in the evaluation using a two-step sampling and matching
methodology. The first step involves identifying matched treatment and comparison schools, while the
second step entails controlling for differences between randomly sampled students within these treatment
and comparison schools.
Data were collected longitudinally at three points in time from a panel of Basa and non-Basa students,
teachers, and school principals. Additionally, data was collected from parents at baseline. Data include:
reading and math assessments, principal interviews, classroom observations, teacher interviews, and

USAID.GOV USAID BASA PILIPINAS IMPACT EVALUATION | 2
household surveys. Reading outcomes were measured in mother tongue in Grade 1 and Filipino and
English for subsequent grades, as reading performance in Filipino and English were the main outcome
indicators of interests to USAID. Baseline data were collected from September-October 2015; outcome
data were collected between February and March of 2016 and 2017.
FINDINGS
STUDENTS
When looking at changes over one year of participation in Basa, we observe small, statistically significant
effects of Basa in early grades, that reduce, and in some cases become negative, in later grades (Table 1).
Specifically, Basa generates a statistically significant increase in letters correct per minute (cpm) (TE1=2.15,
p=0.100) and familiar words cpm (TE=4.05, p=0.023) in Grade 1 mother tongue. In Grade 2, Basa increases
student scores by 1.5 words cpm in both familiar words (p=0.085) and unfamiliar words (p=0.031), and
4.2 words cpm in oral reading fluency in Filipino. In English, in Grade 2 Basa is associated with significant
increases in letters cpm (TE=2.17, p=0.006) and unfamiliar words cpm (TE=1.37, p=0.089). Grade 3 Basa
students perform similarly to comparison students in Filipino on all subtests, but in English, we find that
Basa generates a significant increase in letters cpm (TE=2.08, p=0.009), familiar words cpm (TE=1.89,
p=0.090), and unfamiliar words cpm (TE=1.37, p=0.051). Finally, we find no sustained impacts for students
in Grade 4, who had received Basa support in prior grades, in most subtests in both Filipino and English,
but statistically significant negative impacts in reading comprehension, with a 9.3 percentage points
decrease in Filipino comprehension (p=0.050) and 6.9 percentage points decrease in English reading
comprehension (p=0.001) relative to changes in the comparison group.
TABLE 1: ONE-YEAR IMPACTS OF BASA GRADE 1 GRADE 2 GRADE 3 GRADE 4
MT FILIPINO ENGLISH FILIPINO ENGLISH FILIPINO ENGLISH
Letters per minute 2.15* 1.06 2.17*** 0.88 2.08*** 0.30 1.09
Familiar words per minute 4.05** 1.52* 0.97 1.08 1.89* -1.19 0.12
Unfamiliar words per minute 2.00 1.47** 1.37* 0.71 1.37* -0.77 -0.40
ORF per minute 4.93 4.22** 2.50 -0.59 0.82 -1.44 0.99
Reading comprehension (% correct)
0.036 -0.001 0.034 -0.001 -0.061 -0.093*** -0.069*
Reading comprehension excl. non-readers (% correct)
-0.028 -0.023 0.017 0.003 -0.075* -0.099*** -0.078**
* significant at 90% ** significant at 95% ***significant at 99% + p <0.1 + 0.1< p <0.2 - p <0.1 - 0.1< p <0.2
The two-year impacts of Basa follow a similar trend, with positive results in initial grades that dissipate in
the later grades. Notably, we see greater indication of impact of Basa in Grade 2 over two years, with
generally larger and more consistently positive treatment effects, indicating a larger effect of Basa in both
Filipino and English combining gains from Grade 1 together with gains from Grade 2.
1 Treatment effect (TE) represents our estimate of the program impact in the units of the outcome. The p-value represents the
probability that result is due to chance or, in other words, the chance that the difference we measure does not reflect a true
difference between the population of Basa and non-Basa students. So, in this case we estimate a 2.15 increase in letters per
minute as a result of Basa, and we are 90% confident that this represents a true difference between Basa and non-Basa. Unless
explicitly stated otherwise, we report a result as statistically significant if the p-value is equal to or less than 0.1.

3 | USAID BASA PILIPINAS IMPACT EVALUATION USAID.GOV
The IE also measured the extent to which Basa and comparison students attained reading fluency and
comprehension benchmarks and targets. These benchmarks and targets were developed jointly by DepEd
and Basa to be used as a standard against which progress toward improving reading outcomes among
Filipino children would be measured. Generally speaking, both Basa and comparison students fell short of
these targets. In some cases, Basa students had greater odds of attaining benchmarks and in other cases,
Basa students had lower odds.
As a part of the analysis, the evaluation team explored the extent to which various demographic,
household, school, and teacher characteristics predict reading fluency and comprehension scores. The
largest and most significant factors explaining reading scores are sex and region, with girls consistently
outperforming boys, and students from Region 7 generally outperforming students in Region 1. Other
factors that positively predict reading scores include: student math scores, teachers exhibiting reading
best-practices, school and household assets, age at start of Kindergarten and at start of someone reading
to the child, having access to reading material at home, and larger school enrollment. School closure and
receiving help on homework were associated with lower reading scores.
Early Grade Math Assessments (EGMA) were administered to test for any effect of Basa on aptitude in
mathematics. Though the Basa program is a literacy program and is not expected to generate changes in
numeracy, it has been theorized that improved literacy outcomes may lead to improved numeracy
outcomes. We observe positive statistically significant effects of Basa on one to two subtests per grade
with null effects across the remaining subtests. We find positive treatment effects only for numbers
identified cpm, for which Basa had statistically significant positive effects across all grades except for Grade
3.
TEACHERS AND SCHOOLS
On most fronts, Basa and comparison schools, principals, and teachers are generally statistically similar at
follow-up, after controlling for relevant factors exogenous to the intervention.2 At the end of the 2017
school year, Basa principals were more likely to participate in Learning Action Cells (LAC) (OR=2.12,
p=0.078), but reported similar frequency convening LACs as standard schools. Many teacher-level
outcomes show no effect of Basa, with two exceptions. Holding all else constant, teachers at Basa schools
were more likely to have attended early grade reading training than equivalent peers at comparison
schools (OR=1.83, p=0.001). However, among those teachers who did receive training, Basa teachers
received one day less of training in both mother tongue (p=0.003) and training overall (p=0.015). Basa
teachers are more likely to encourage students to sound out unfamiliar words and to put students into
smaller groups several times per month, but otherwise exhibit statistically similar levels of general and
reading-specific best practices as comparison teachers.
CONCLUSIONS
STUDENTS
Basa had small but statistically significant impacts on Grade 1 and Grade 2 students in reading and math,
including reductions in English zero scores. Results are consistently more positive for the combined
measure of the effect of Grade 1 Basa plus Grade 2 Basa than looking at the effect of a single year of Basa.
2 Control variables for school analyses include: average school reading and math scores, enrollment, number of teachers, school
assets, and principal sex, age, and qualifications. Control variables for teacher analyses include these variables as well as: class
size and teacher sex, age, and qualifications.

USAID.GOV USAID BASA PILIPINAS IMPACT EVALUATION | 4
Among Grade 3 students, we find some significant impacts on English but no impacts on Filipino. We find
no significant impact of Basa among Grade 4 students in either language, apart from a significant negative
impact on reading comprehension for Grade 4 students both in Filipino and English. Based on the results
of this impact evaluation, we conclude that the Basa program resulted in some short-term gains in both
pre-reading3 and oral reading fluency for treatment students, but these effects become null over time,
with comparison students reaching parity with, and in some cases surpassing, Basa students by Grade 4.
These results are consistent with evidence from other early grade literacy evaluations, which seems to
indicate significant gaps in our knowledge of how to create sustainable improvements in reading outcomes.
Additionally, Basa did not generate a positive impact on reading comprehension in any grade, and we find
evidence of a negative effect on reading comprehension in G4. While we do not find a clear mechanism
for the observed negative effects on Grade 4 reading comprehension, it may relate to differences in Basa
versus non-Basa schools in the language used in class. Differences between Basa and non-Basa teachers in
class time spent using mother tongue, Filipino, and English are negligible until Grade 4, when we see that
Basa teachers spend significantly more time in mother tongue and almost significantly less time in English.
While we do find some evidence that class time in mother tongue in Grades 3 and 4 is associated with
decreased English and Filipino reading fluency and comprehension, the negative results for reading
comprehension are still observed when controlling for class time in mother tongue and English. As we did
not measure reading outcomes in mother tongue beyond Grade 1, we cannot say whether the program
had an impact on mother tongue reading outcomes in grades 2 through 4.
TEACHERS AND SCHOOLS
Basa and comparison schools, principals, and teachers are generally statistically similar at follow-up, after
controlling for relevant factors exogenous to the intervention. Considering the intervention’s theory of
change—impacting student scores through changing school leadership and teacher beliefs and practices—
the modest results of this IE may be a result of limited observed impacts of Basa on schools and teachers.
RECOMMENDATIONS
1- Explore mechanisms for sustainability in later grades. Given that the IE found short-term
but no lasting impact of Basa on student achievement in Filipino and English, the evaluation team
recommends that USAID explore interventions that have the potential to sustain student
achievement gains in future grades. This may include supporting teachers who instruct Grade 4
or higher as students in this stage may still be honing their reading skills and learning to
comprehend increasingly complex text. This may also include providing follow-up and coaching
support to teachers who received training to encourage continued use of the material.
2- Investigate what works well in standard DepEd training. We found that Grade 4 students
who attended non-Basa schools performed better on reading comprehension than students who
attended Basa schools, particularly among boys. This finding is statistically significant, controlling
for baseline score and other explanatory variables. As such, we recommend investigating what the
standard DepEd training is doing well that could be contributing to these higher gains relative to
Basa students. Moreover, we recommend that this investigation utilize a gender lens to further
investigate if there are certain methods or approaches that are working particularly well with
boys.
3 Letter identification, familiar word and unfamiliar word subtests can be considered pre-reading subtests.

5 | USAID BASA PILIPINAS IMPACT EVALUATION USAID.GOV
3- Integrate evaluative thinking and evaluation planning at an early stage. One limitation
of this IE is that the evaluator was contracted several years after the start of implementation. Early
planning allows better alignment between implementation and evaluation timelines, including
collection of baseline data, and improves the feasibility of a randomized control trial, or even
identification of a similar control group. Moreover, early planning helps to ensure evaluation
findings are available to USAID at times when major programmatic decisions are to be made.
Finally, by planning early, evaluators and implementers can work to ensure similarity in tools which
facilitates comparison and knowledge generation. To maximize the usefulness of future
evaluations, USAID should plan for evaluations as early as possible, ideally at the Project Appraisal
Document (PAD) stage.
4- Consider future research on the sustainability of effects of reading programs as well
as on the null results on reading comprehension. The Sa Aklat Sisikat Reading Program in
the Philippines, the Nali Kali program in India, the USAID/Mali Read-Learn-Lead program, and this
IE all found effects in early grades that did not hold in subsequent grades. The generally null and
negative findings in Grades 3 and 4 could potentially result from teachers having received a less
developed and refined version of the Basa training in the intervention startup years or some other
factor. Additional research with the current Grade 3 cohort, which was matched prior to the
start of Grade 1, or future cohorts would allow USAID to test whether results with this cohort
are sustained or similarly diminish over time. Further, more research should be conducted on
why the program generated impact on some measures of pre-reading and oral reading fluency but
not in comprehension.

USAID.GOV USAID BASA PILIPINAS IMPACT EVALUATION | 6
INTRODUCTION
Early grade literacy acquisition is critically important to both individual and national development. Not
only does learning to read facilitate educational development and broaden the range of economic and
other learning possibilities, it empowers the learner and leads to positive externalities in health and civic
participation. While 97% of Filipinos have basic literacy, only 86% are functionally literate. One challenge
to achieving higher levels of literacy has been that the primary education system in the Philippines
previously focused on reading in English and Filipino; however, teaching children to read in languages that
they do not speak at home can pose a substantial barrier for children who already struggle to learn to
read.
To address this, the Philippine Department of Education (DepEd) officially adopted the implementation of
mother tongue-based multi-lingual education (MTBMLE) across the Philippines at all levels of education,
through the 2009 DepEd order 74 and the 2010 Strategic Plan for implementation of MTBMLE. The
Enhanced Basic Education Act of 2013 lent further support to these policies by establishing mother tongue
as the language of literacy and primary language nationwide. All public schools in the Philippines began
implementing MTBMLE in grades K-3 in the 2014 - 2015 school year. Table 2 displays the national
curriculum standards alongside the established language of instruction for each grade. Per MTBMLE policy,
mother tongue is the main language of instruction from Kinder to Grade 3, and Filipino and English are
gradually introduced from Grade 2 onward.
DEVELOPMENT INTERVENTION
Building on its ongoing assistance to the education sector in the Philippines, with a special focus on early
grade reading, USAID collaborated with DepEd to implement the Basa Pilipinas (Basa) program, a four-
year early grade reading program implemented by Education Development Center (EDC) in five provinces
in the Philippines—Cebu, La Union, Ilocos Norte, Ilocos Sur, and Bohol. Basa was designed to support
DepEd’s MTBMLE initiative by providing teacher training, improved instructional materials, and
strengthened delivery systems. Within these components are various additional activities aimed to
TABLE 2: NATIONAL CURRICULUM STANDARDS FOR READING GRADE MOTHER TONGUE FILIPINO ENGLISH
Kindergarten
• Oral fluency
• Pre-reading activities
• Medium of instruction
Grade 1
• Oral fluency
• Academic vocabulary
• Reading and writing
• Medium of instruction
• Oral (listening and speaking) in
Q2
• Reading (Q4)
• Oral (listening and
speaking) in Q3
Grade 2
• Oral fluency
• Literacy development
• Medium of instruction
• Oral (communicative
competence)
• Literacy development
• Oral (communicative
competence)
• Reading (Q2)
Grade 3
• Oral fluency
• Literacy development
• Medium of instruction for
most subjects
• Oral (communicative
competence)
• Literacy development
• Medium of instruction for
Filipino subject only
• Oral (communicative
competence)
• Literacy development
• Medium of instruction for
English subject only
7 | USAID BASA PILIPINAS IMPACT EVALUATION USAID.GOV
improve early grade reading ability, including: mentoring programs, development of a reading instruction
training plan that defines which skills teachers should teach at each level and identification of appropriate
grade level texts, and locally based activities such as a National Reading Month to promote reading across
the country. As such, the intervention represents a blended strategy aiming to address directly the
challenges to classroom-based MTBMLE reading instruction across grades 1 through 3. The evaluation
team has developed a separate cost-effectiveness analysis report, which outlines the Basa program in
greater detail.
Figure 1. Basa Pilipinas Theory of Change
The program began in January 2013 and was planned to conclude in December 2016, but USAID awarded
EDC a one-year follow-on, which included reinforcing grade 1 through 3 training, implementing
Kindergarten training, and provide post-training support and coaching to teachers and schools.
Figure 2. Basa Pilipinas Regions
REGION 1 REGION 7

USAID.GOV USAID BASA PILIPINAS IMPACT EVALUATION | 8
EXISTING EVIDENCE
Extensive literature supports the effectiveness of school-based interventions on improving student
outcomes, though there is lack of consensus on which approaches are most effective and on whether
effects persist over time. A 2015 meta-analysis of 77 randomized experiments of school-based
interventions on learning in developing country primary schools identifies the following types of
interventions as having the largest mean effect sizes, among them both teacher training and instructional
materials, though none stand out as far and away the most effective4: treatments with computers or
instructional technology (0.15 standard deviations (SD)5); teacher training (0.12 SDs); smaller classes,
smaller learning groups within classes, or ability grouping (0.12 SDs); contract or volunteer teachers (0.10
SDs); student and teacher performance incentives (0.09 SDs); and instructional materials (0.08 SDs).i ii
Similarly, a 2016 systematic review of the impact of education programs conducted by the International
Initiative for Impact Evaluation (3ie) finds that programs designed to address constraints schools and
teachers face in improving reading proficiency (referred to as structured pedagogy programs) had an
average effect size of 0.23 SD units on literacy outcomes.iii
One such study is a RCT of the USAID/Kenya Primary Math and Reading (PRIMR) program, which (similar
to Basa) provided teachers training and practice implementing new instructional strategies, teacher
observation and coaching, and development and distribution of learner books and teacher guides. The
PRIMR IE found very large effects among Grade 1 and Grade 2 students in both English and Kiswahili.
Specifically, this RCT observed gains between treatment and control students of 21.4 letters per minute
(.73 SDs), 13.7 words per minute in reading fluency (.40 SDs), and 11.3% comprehension (.38 SDs).iv The
study did not test effects on Grade 3 students. The RCT of the USAID Mozambique Aprender a Ler
program, an intensive structured pedagogy program, examined outcomes for a cross-section of Grade 2
and Grade 3 students and found positive treatment effects across all EGRA subtests.v The IE included
testing another cohort of Grade 2 and 3 students in treatment and control schools one year post-
intervention, finding substantial drops in gains in that follow-up year, but still statistically significant effects
in treatment schools relative to control schools. Another similar study is the USAID/Rwanda Literacy
Boost RCT, which compared literacy outcomes between a control group and students who either
received 1) teacher training, or 2) teacher training plus community activities. This IE found no impact of
the program on meeting a basic literacy threshold in either treatment group, but positive impacts in both
reading fluency and comprehension on students who did meet the basic literacy threshold, indicating an
impact only on those students with basic proficiency.vi The IE found larger impacts for those students who
received the community activities in addition to the teacher training.
In the Philippines, the Abdul Latif Jameel Poverty Action Lab (JPAL) carried out a 2009 RCT of the Sa
Aklat Sisikat Reading Program, a 31-day reading program targeted at Grade 4 students that provided age-
appropriate reading material, trained teachers in their use, and supported teachers’ initial efforts to
encourage reading. This IE found modest reading performance gains of 0.13 SDs for treatment students
relative to control immediately after the intervention, though the effect diminished over time to 0.06 SDs
three months after conclusion of the intervention.vii Similarly, an IE of the Nali Kali program in India—an
Activity Based Learning pedagogical change program—found strong, significant effects on literacy scores
4 Indeed, the effect sizes reported are quite modest overall. 5 Standardized effect sizes are valuable in a meta-analysis as they allow comparison of interventions with varying outcomes.

9 | USAID BASA PILIPINAS IMPACT EVALUATION USAID.GOV
though these achievements in early grades do not persist in later grades. viii The study also found
insignificant effects in math.
Despite the wealth of literature on school-based early literacy interventions, limited evidence exists for
literacy interventions within the context of multilingual education. One exception is the USAID/Mali Read-
Learn-Lead program (RLL), which provided schools and teachers with structured pedagogy in support of
mother tongue instruction.ix The IE of the RLL program found positive impact of the intervention on
Grade 1 and Grade 2 students but no impacts on Grade 3 students, which the authors report as indicative
that RLL gains may not have led to lasting advantages for students in subsequent years.
Basa’s approach to improving student literacy is broadly aligned with approaches that have been effective
in a variety of country contexts. This IE contributes to this existing literature on the effectiveness of
school-based programs in improving student outcomes, particularly by tracking student outcomes over
two years, which allows us to test both one-year versus two-year effects, as well as the impact on students
one year post-intervention (see Grade 4 results). As several studies found that effects were not sustained
beyond the early grades, this is an area of particular interest. This IE also contributes to the literature on
the extent to which literacy interventions can lead to improved numeracy outcomes; evidence from
existing literature is mixed. This IE and two ongoing USAID mother tongue IEs in Guatemala and Peru will
contribute to this literature.
EVALUATION PURPOSE AND EVALUATION QUESTIONS
USAID/Philippines has commissioned an impact evaluation (IE) of the Basa program to measure its impact
and cost-effectiveness as an early grade reading intervention, in the context of MTBMLE. The IE (and cost
analysis) of Basa will be used by USAID, DepEd, and other key stakeholders in the Philippines as the basis
for policy and programming decisions about how reading interventions in support of MTBMLE can best
be structured and implemented to improve early grade learning outcomes.
USAID/Philippines commissioned this evaluation to answer the following two evaluation questions:
1. What is the impact on student reading proficiency and comprehension of the Basa-supported early
grade reading intervention relative to the standard approach?
2. Do any positive impacts of Basa justify additional funding?
This report examines Question 1. We have used the results of question one, combined with an analysis
of the program’s cost data, to develop a second report that focuses specifically on Question 2. This IE
serves as an accountability mechanism that measures the extent to which USAID investment has led to
literacy gains, contributes to the literature on effectiveness of early grade reading programs, particularly
those supporting MTBMLE, and, combined with results from ongoing USAID-funded IEs in Peru and
Guatemala, will provide evidence from various contexts. Ultimately, the IE yields important information
to inform how early grade reading programs can be best implemented, providing data for USAID and the
Philippines government to make evidence-based decisions about effective programming to improve
student reading achievement and access to education.
USAID.GOV USAID BASA PILIPINAS IMPACT EVALUATION | 10
IMPACT EVALUATION METHODOLOGY
This IE uses a quasi-experimental, longitudinal design to isolate the effect of Basa-supported early grade
reading relative to non-Basa supported reading interventions (henceforth referred to as ‘standard’
MTBMLE). Under this design, students in Basa (treatment) schools and similar students in ‘standard’
MTBMLE (comparison) schools are selected for participation in the evaluation using a two-step sampling
and matching methodology. The first step involves identifying matched treatment and comparison schools,
while the second step entails controlling for differences between randomly sampled students within these
treatment and comparison schools.
SCHOOL SAMPLING AND MATCHING
While comparing students from the same schools, or from schools in the same school division6, would be
preferred, Basa is implemented in all classrooms in all schools in the selected divisions. Accordingly, to
construct a comparison group, we identify students from similar schools using the same mother tongue
from nearby divisions through the following two steps.
DEVELOPMENT OF AN EVALUATION SAMPLE FRAME
In the treatment areas, we consider all schools with a few exceptions. Schools that have already been
randomly selected by Basa for testing were excluded to avoid overburdening these schools. Excluding
these schools should not affect the validity of the study in any way since these schools were randomly
selected and represent only a small percentage of Basa schools. Additionally, however, two more groups
of schools were excluded which will slightly reduce the external validity of the evaluation. First, the 100
lowest performing schools in each region (11% of schools in our sample frame) must be excluded as Basa
has been requested by DepEd to provide streamlined support to the schools7. Second, there are 15
additional schools where DepEd has requested that Basa conduct additional research. These schools were
also excluded to avoid overburdening students and teachers at these schools. Both changes are expected
to slightly reduce the external validity of the evaluation. For out sample frame of potential control schools,
we consider only schools in nearby divisions that use Ilocano or Cebuano as mother tongues (see Annex
2-Sampled Schools for the list of sampled schools).8
SCHOOL MATCHING
After applying the restrictions above, propensity scores were calculated for all possible treatment and
comparison schools using the following secondary data sources:
- National Achievement Test (NAT) data: student testing data from 2011-2015;
- Basic Education Information System (BEIS) data: data collected from schools annually by DepEd
on items such as enrollment, teachers, and school facilities; and
6 DepEd organizes schools within a province into school divisions. 7 The full Basa program is not implemented in these schools. Moreover, the sample size is too small to attempt to identify the
additional impact of this streamlined approach, particularly considering the strict targeting of these schools and the resultant
selection bias. 8 Verifications were done by obtaining lists of schools using Ilokano and Cebuano as mother tongue from divisions. Data collected
at schools confirm that all of sampled schools use Ilokano or Cebuano as the mother tongue and that they are using mother
tongue as the primary Language of Instruction (LOI) in early grades, in accordance with DepEd guidance.
11 | USAID BASA PILIPINAS IMPACT EVALUATION USAID.GOV
- Census data: obtained at the municipality-level from the 2010 census.
Generating propensity scores for all schools in the evaluation sample frame models the Basa selection
process, identifying which secondary data are associated with participation in the program. This process
allows for efficient matching of schools along a wide range of variables related to program participation.
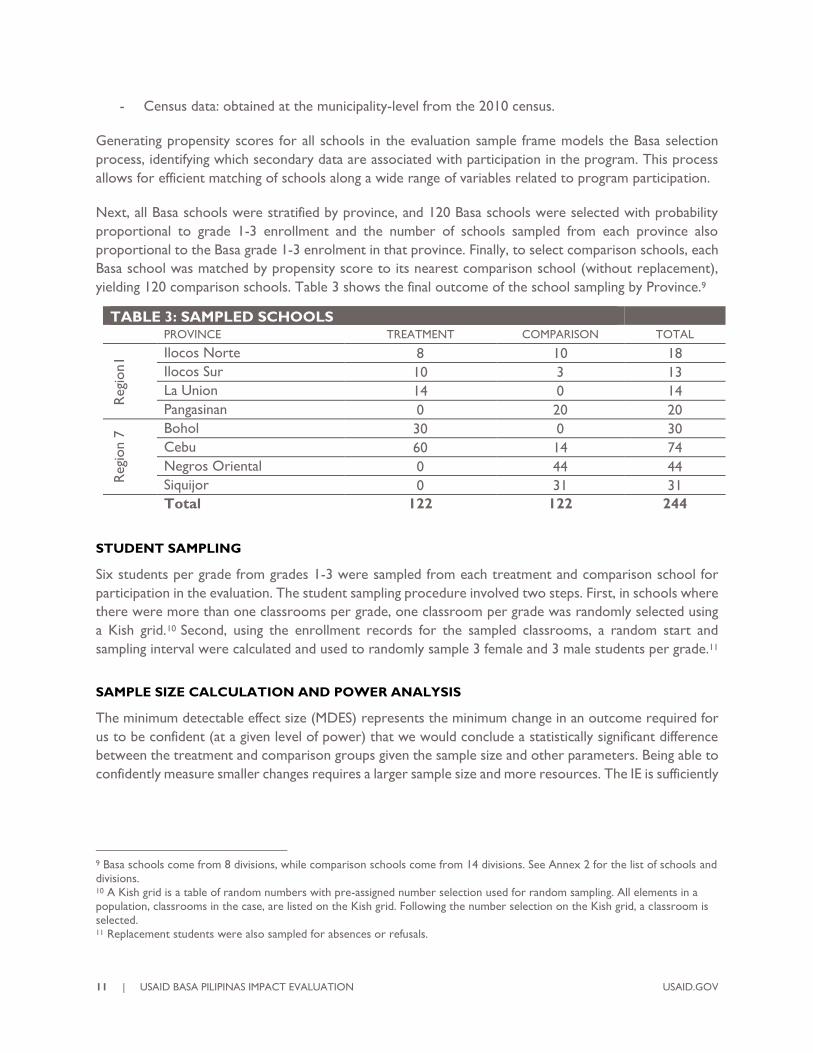
Next, all Basa schools were stratified by province, and 120 Basa schools were selected with probability
proportional to grade 1-3 enrollment and the number of schools sampled from each province also
proportional to the Basa grade 1-3 enrolment in that province. Finally, to select comparison schools, each
Basa school was matched by propensity score to its nearest comparison school (without replacement),
yielding 120 comparison schools. Table 3 shows the final outcome of the school sampling by Province.9
STUDENT SAMPLING
Six students per grade from grades 1-3 were sampled from each treatment and comparison school for
participation in the evaluation. The student sampling procedure involved two steps. First, in schools where
there were more than one classrooms per grade, one classroom per grade was randomly selected using
a Kish grid.10 Second, using the enrollment records for the sampled classrooms, a random start and
sampling interval were calculated and used to randomly sample 3 female and 3 male students per grade.11
SAMPLE SIZE CALCULATION AND POWER ANALYSIS
The minimum detectable effect size (MDES) represents the minimum change in an outcome required for
us to be confident (at a given level of power) that we would conclude a statistically significant difference
between the treatment and comparison groups given the sample size and other parameters. Being able to
confidently measure smaller changes requires a larger sample size and more resources. The IE is sufficiently
9 Basa schools come from 8 divisions, while comparison schools come from 14 divisions. See Annex 2 for the list of schools and
divisions. 10 A Kish grid is a table of random numbers with pre-assigned number selection used for random sampling. All elements in a
population, classrooms in the case, are listed on the Kish grid. Following the number selection on the Kish grid, a classroom is
selected. 11 Replacement students were also sampled for absences or refusals.
TABLE 3: SAMPLED SCHOOLS
PROVINCE TREATMENT COMPARISON TOTAL
Regi
on1 Ilocos Norte 8 10 18
Ilocos Sur 10 3 13
La Union 14 0 14
Pangasinan 0 20 20
Regi
on 7
Bohol 30 0 30
Cebu 60 14 74
Negros Oriental 0 44 44
Siquijor 0 31 31
Total 122 122 244

USAID.GOV USAID BASA PILIPINAS IMPACT EVALUATION | 12
powered to measure a 0.17 SD difference12 in reading fluency and comprehension scores between Basa
and non-Basa students across all grades combined, at the end of the 2015-2016 and 2016-2017 school
years. This MDES was benchmarked against the smallest effect size (0.17 SD) EDC measured in their 2015
evaluation report, indicating that the sample size would be sufficient to measure EDC’s anticipated changes
for the grades taken together, with a high degree of confidence.13 SI performed post-hoc power analysis
at endline and found all assumptions in the power analysis to be robust. Thus, the IE is sufficiently powered
to the expected level to confidently measure the changes anticipated by the Basa program. See Annex 3-
Power Calculations for details.
DATA COLLECTION
Data were collected longitudinally at three points in time from a panel of Basa and non-Basa students,
their teachers, parents, and school principals. Data include: reading assessments, principal interviews,
classroom observations, teacher interviews, and household surveys. Baseline data were collected from
September-October 2015; outcome data were collected between February and March 2016 and 2017.14
DATA COLLECTION TOOLS
STUDENT LEARNING ASSESSMENTS were used to measure changes in student learning outcomes.
SI used Early Grade Reading Assessments (EGRA) designed and tested by RTI in Cebuano, Ilokano, Filipino,
and English, and Early Grade Math Assessments (EGMA) in mother tongue designed and tested by DepEd.
Grade 1 students were tested in mother tongue, while grades 2 through 4 were tested in Filipino and
English.
Results revealed ceiling effects15 of the Filipino tool with Grade 3 and Grade 4 student, and in English for
Grade 4 students. To address the ceiling effects, the evaluation team developed more challenging Filipino
and English reading passages and associated comprehension questions. We pilot tested these tools with a
sample of 148 Grade 3 students in 2016 and a sample of 169 Grade 4 students in 2017 across regions 1
and 7 and found the revised tests to be more appropriately-leveled to our sample of students. Learning
12 A minimum detectable effect size (MDES) of 0.2 SD is generally considered small. Meaning that a study that can measure a 0.2
SD change is generally considered highly powered (as it can detect what is commonly considered to be relatively small changes
between a treatment and control group). 13 For each individual grade cohort, we expect to be able to measure a change of at least 0.21 SD. 14 Data are collected from schools in the same order for each round of data collection to ensure consistency. 15 Ceiling effects occur when there is an artificial upper limit on the possible values for a variable and participants score at or
near this limit, restricting the variation in scores. In the context of an impact evaluation, if a student scores very high at baseline,
it limits the ability to capture positive gains at follow-up.
TABLE 4: EGRA TOOLS ADMINISTERED BY GRADE AND YEAR
GRADE 1 GRADE 2 GRADE 3 GRADE 4
MOTHER TONGUE FILIPINO & ENGLISH FILIPINO & ENGLISH FILIPINO & ENGLISH
Cohort 1 T0: Sept. 2015
T1: Feb. 2016 T2: Feb. 2017
Cohort 2 T0: Sept. 2015
T1: Feb. 2016 T2: Feb. 2017
Cohort 3
T0: Sept. 2015
T1: Feb. 2016 T2: Feb. 2017

13 | USAID BASA PILIPINAS IMPACT EVALUATION USAID.GOV
assessments were administered electronically using tablets and the RTI-developed Tangerine software
platform, following the standard EGRA and EMGA protocols.
TEACHER SURVEYS AND TEACHER OBSERVATIONS were conducted during each of the three
data collection periods to gather information on teacher characteristics, experience, and exposure to
training and Basa materials. SI developed a teacher observation protocol based on tools used successfully
by SI in other early grade reading evaluations, to complement the teacher survey. The observation tool
includes generally recognized good teaching practices across all subjects as well as widely recognized
practices that are considered beneficial specifically for reading instruction. Besides teaching practices, the
observation tool also captures observations regarding equal treatment of learners, presence of classroom
resources, and student behavior.
Each surveyed teacher’s classroom was observed three times in the school day, with priority given to
language classes, in twenty-minute increments to capture teacher instructional practices and the literacy
environment. The classroom observations were conducted by enumerators who were thoroughly and
consistently trained on how to recognize each of the practices according to agreed-upon standards. See
Annex 4-Instruments for the teacher survey and teacher observation instrument.
ADMINISTRATOR SURVEYS were conducted in each of the sampled schools during each of the three
data collection periods to gather data on a variety of school characteristics, including student enrollment
and attendance and school facilities and resources. The administrator survey is included in Annex 4-
Instruments.
HOUSEHOLD SURVEYS captured socio-economic characteristics of student households at baseline
only. The household survey was administered to the primary caregiver of the students using contact
information obtained from schools. The data collection partner visited the households, obtained informed
consent, and then interviewed the primary caregiver of the child. See Annex 4-Instruments for the
household survey instrument.
FIELDWORKER TRAINING
SI contracted Taylor Nelson Sofres (TNS) Philippines to conduct data collection for the Basa Pilipinas IE
at baseline, midline, and endline. TNS Philippines has extensive experience in school-based data collection,
having carried out data collection for both the PhilEd and Basa projects. TNS and SI conducted two
regionally-based trainings and school practice tests in Region 1 and Region 7 prior to the launch of each
data collection period. Training for Region 1 and Region 7 consisted of a review of all instruments, mock
assessments and interviews, introduction of the study and obtaining informed consent, sampling, inter-
rater reliability (IRR) tests, and two days of field practice in practice schools. An SI team member
participated in both trainings to provide support and oversight.
IRR tests were conducted during each enumerator training. At midline and endline, in accordance with
the updated guidance in the USAID EGRA Toolkit 2.0, SI collected and analyzed IRR data over the course
of fieldwork. Field IRRs were implemented for the first set of students assessed each day of fieldwork for
the full data collection period, alternating between grades. During the first three weeks of fieldwork, SI
analyzed IRR results overnight and submitted results to the field teams for debriefing the next day.

USAID.GOV USAID BASA PILIPINAS IMPACT EVALUATION | 14
Table 5 presents the final IRR results for each region, with each entry representing the percent of
questions for which the observing and scoring enumerators scored identically. Each round consists of
several fieldwork days over which IRR results were analyzed. From the outset of fieldwork, IRR was
consistently high. Enumerators consistently scored assessments with over 90% agreement during the first
three weeks of fieldwork. Though IRR testing continued over the course of fieldwork for ongoing
reinforcement, the evaluation team did not aggregate and analyze the data beyond the first three weeks
of fieldwork, given the high levels of agreement.
TABLE 5: FIELD IRR RESULTS
REGION 1 REGION 7
G2 G3 G4 G2 G3 G4
Round 1 95% 93% 91% 99% 98% 98%
Round 2 94% 97% 96% 98% 99% 98%
Round 3 98% 94% 91% 98% 99% 99%
DATA ANALYSIS
EGRA and EGMA data have been analyzed using a multivariate Tobit regression model to measure: 1)
effects of the Basa program on student learning outcomes, and 2) student, household and school
predictors of reading outcomes. Tobit analysis was selected to account for flooring effects of reading
assessment results resulting from zero scores. Impact estimates were calculated using a lagged dependent
variable model, which controlled for student initial score in addition to other student, household, and
school-level variables, using each of the EGRA and EGMA subtests as dependent variables. To make the
treatment and comparison groups as similar as possible, we analytically control for differences in student
demographics, household characteristics, as well as teacher and school characteristics across multiple
regression models.
The evaluation team also implemented robustness checks using other model specifications, including
models that control for schools who had teachers participating in the DepEd Early Language Literacy and
Numeracy (ELLN) program (see Annex 7).16 Impact estimates obtained from these additional models are
consistent with estimates obtained from our primary model, with a few exceptions, and thus provide
additional support for the validity of the impact estimates. Student scores and regression results for each
group are presented using sample weights to more accurately represent the population of Basa schools.
School and teacher-level outcome variables were analyzed using multivariate ordinary least squares (OLS),
logistic, and ordered logistic regression models. These models were run on the outcome data alone as a
cross-section, as many potential control variables collected at baseline could have already been influenced
by the Basa program. Odds ratios are a way to interpret the coefficients of a logistic regression, which
generally refer to the likelihood of an outcome occurring, for example the likelihood of a treatment versus
comparison student scoring zero on a given assessment subtest. An odds ratio greater than one indicates
that the odds are more likely that the treatment group exhibited the outcome relative to the comparison
group, whereas an odds ratio less than one indicates that the comparison group was more likely to exhibit
the outcome. Odds ratios close to one indicate no treatment effect (positive or negative). In contrast, for
16 Other robustness checks include performing analyses on unweighted and un-equated data, and additional model specifications
such as: standard OLS, fixed-effects model, multi-level model, and coarsened exact matching.

15 | USAID BASA PILIPINAS IMPACT EVALUATION USAID.GOV
an OLS regression coefficient, a negative number denotes an inverse relationship between treatment
status and the outcome, while a positive number indicates a direct relationship.
LIMITATIONS
There are four main potential limitations to this IE. First, and related to external validity, given that some
treatment schools were excluded from the evaluation sample frame, the Basa evaluation sample may not
be fully representative of the Basa intervention schools. However, given that the non-randomly excluded
schools are a small percentage (11%) of Basa schools, we do not expect this to significantly affect
generalizability.
Second, given the timing of the start of the evaluation contract, baseline data were collected in September
and October, though the school year starts in mid-June. To the extent that Basa generates significant
reading improvements in the first few months of schools (relative to the gains generated under the
standard approach), the impacts presented here may be under-estimated. However, we do not expect
that program impacts would be solely or even predominantly generated in the first few months of school.
Moreover, we also look at effects from the end of one school year until the end of the next year, which
should fully capture all changes during the year.
Third, since the Basa program began implementation in target schools prior to the start of the evaluation,
including up to two years of implementation in some areas, the evaluation baseline data collection cannot
be considered a pre-intervention measurement at the school-level. However, at the student-level, the
design still allows for measurement of both the first and second year of participation in Basa. For Grade
1 students, this will serve as a baseline for the students at the start of their participation in the Basa
program, and the outcome measurement will estimate the effect of the first year of Basa participation for
Grade 1 students. Grade 2 and 3 students in treatment schools will already have participated in Basa for
one year or two years. Accordingly, outcome measurement for this group will measure the incremental
effect of the second (or third) year of participation in the program.
Fourth, the length of time between baseline and 2016 follow-up data collection was relatively short for
observing impacts, since baseline data collection took place in September and October, and follow-up in
February and March (5 months). The 2017 round of follow-up data collection provided additional time for
impacts to be observed.
STRENGTHS OF THE EVALUATION APPROACH
The evaluation design was developed in close consultation with USAID, DepEd, and Basa to measure the
impact of Basa using a rigorous counterfactual, or what would have occurred in treatment schools had
Basa not been implemented. While baseline data collection took place several years after the start of
implementation, this IE design captured a student-level baseline. This consisted of a measure of the effect
of the first year of Basa participation for Grade 1 students, and the incremental effect of a second or third
year of Basa for students in Grades 2 and 3.
We are confident in the validity of the findings of this IE for the following reasons. First, balance tests
performed after matching support that this quasi-experimental design succeeded in establishing a
reasonable counterfactual since there are minimal differences between the treatment and comparison
group at baseline, and we control for those differences in analysis. Thus, we can confidently attribute

USAID.GOV USAID BASA PILIPINAS IMPACT EVALUATION | 16
observed outcomes to the Basa intervention. Second, post-hoc power calculations confirm the IE was
sufficiently powered to the desired level. Third, the IE benefited from minimal attrition and no differential
attrition between the treatment and comparison group, indicating that the observed results are generally
devoid of selection bias. Finally, results are consistent across various model specifications (see Annex 7).

17 | USAID BASA PILIPINAS IMPACT EVALUATION USAID.GOV
FINDINGS: STUDENTS
OVERVIEW OF THE SAMPLE
Table 6 displays the intended sample of this impact evaluation by grade, along with the sample actually
achieved on a panel basis at the student-level at 2016 and 2017 follow-up. The overall attrition rate of
9.2% is well below the 16.67% attrition threshold needed to maintain the study’s intended power. Attrition
includes students who dropped out of school, transferred schools, refused participation, or were
otherwise unable to be located at follow-up.
TABLE 6: EVALUATION SAMPLE
BASELINE 2016 FOLLOW-UP 2017 FOLLOW-UP GRADE STUDENTS GRADE STUDENTS ATTRITION GRADE STUDENTS ATTRITION
Grade 1 1,440 Grade 1 1,377 4.4% Grade 2 1,300 9.7%
Grade 2 1,440 Grade 2 1,382 4.0% Grade 3 1,316 8.6%
Grade 3 1,440 Grade 3 1,372 4.7% Grade 4 1,307 9.2%
Total 4,320 Total 4,131 4.4% Total 3,923 9.2%
Table 7 displays basic characteristics of the treatment and comparison groups after sample weights are
applied. The groups are comparable across all of these characteristics with the exception of grade 1
through 3 enrollment; Basa schools are generally smaller than standard MTBMLE schools.
TABLE 7: STUDENT CHARACTERISTICS
STANDARD
MTBMLE BASA
Female 48% 47%
Attended kindergarten 95% 92%
Speaks MT at home 98% 98%
Read to at home 84% 84%
Students missing school in last 4 weeks 48% 45%
Student has books at home 80% 80%
Student has books at home in MT 70% 67%
Parents that desire university-level education for student 94% 96%
Parents who feel comfortable at student’s school 100% 100%
Parent involvement in student’s school 86% 81%
Average class size 35.6 34.19
Total enrollment in grade 1 - grade 3 425.65 294.77
SUMMARY OF EGRA FINDINGS
Tables 8 & 9 summarize EGRA findings across grades and languages. The one-year impacts represent two
distinct measurements of the effects of Basa over one school year: (1) from the baseline near the beginning
of the 2015-2016 school year to the end of the same school year, and (2) from the end of school year
2015-2016 to the end of school year 2016-2017. We combine estimates from these two measurements
to present our estimated impacts for each grade/language combination. The two-year impacts of Basa
represent the treatment effects measured by comparing outcomes from baseline (2015) to end of school
year 2016-2017. Regression coefficients were calculated using a multivariate Tobit regression model to

USAID.GOV USAID BASA PILIPINAS IMPACT EVALUATION | 18
test the impact of Basa on literacy outcomes, controlling for any prior observed differences in student
performance and various other factors associated with literacy outcomes. Results of this analysis estimate
the average treatment effect (TE), or impact, of the intervention, on letters and words read correctly per
minute (cpm) and reading comprehension.
Under the primary analytical approach measuring changes over one year, we observe small, statistically
significant effects of Basa in early grades, that reduce, and in some cases become negative, over time.
Specifically, Basa generates a statistically significant increase in letters cpm (TE17=2.15, p=0.100) and
familiar words cpm (TE=4.05, p=0.023) in Grade 1 mother tongue. In Grade 2, Basa increases student
scores by 1.5 words cpm in both familiar words (p=0.085) and unfamiliar words (p=0.031), and 4.2 words
cpm in oral reading fluency in Filipino. In English, Basa is associated with significant increases in Grade 2
letters cpm (TE=2.17, p=0.006) and unfamiliar words cpm (TE=1.37, p=0.089). Grade 3 Basa students
perform similarly to comparison students in Filipino on all subtests except for letters, but in English, we
find that Basa generates a significant increase in letters cpm (TE=2.08, p=0.009), familiar words cpm
(TE=1.89, p=0.090), and unfamiliar words cpm (TE=1.37, p=0.051). Finally, we find no sustained impacts
for Grade 4 students in most subtests in both Filipino and English, but statistically significant negative
impacts in reading comprehension, with a 9.3 percentage points decrease in Filipino comprehension
(p=0.050) and 6.9 percentage points decrease in English reading comprehension (p=0.001) relative to
changes in the comparison group.
TABLE 8: ONE-YEAR IMPACTS OF BASA
GRADE 1 GRADE 2 GRADE 3 GRADE 4 MT FILIPINO ENGLISH FILIPINO ENGLISH FILIPINO ENGLISH
Letters per minute 2.15* 1.06 2.17*** 0.88 2.08*** 0.30 1.09
Familiar words per minute 4.05** 1.52* 0.97 1.08 1.89* -1.19 0.12
Unfamiliar words per minute 2.00 1.47** 1.37* 0.71 1.37* -0.77 -0.40
ORF per minute 4.93 4.22** 2.50 -0.59 0.82 -1.44 0.99
Reading comprehension (% correct) 0.036 -0.001 0.034 -0.001 -0.061 -0.093*** -0.069*
Reading comprehension excl. non-
readers (% correct) -0.028 -0.023 0.017 0.003 -0.075* -0.099*** -0.078**
* significant at 90% ** significant at 95% ***significant at 99% + p <0.1 + 0.1< p <0.2 - p <0.1 - 0.1< p <0.2
The two-year impacts of Basa follow a similar trend, with positive results in initial grades that dissipate in
the later grades. Notably, we see greater indication of impact of Basa in Grade 2 under this approach,
with generally larger and more consistently positive treatment effects, indicating a larger effect of Basa in
both Filipino and English combining gains from Grade 1 together with gains from Grade 2.
17 Treatment effect (TE) represents our estimate of the program impact in the units of the outcome. The p-value represents
the probability that result is due to chance or, in other words, the chance that the difference we measure does not reflect a
true difference between the population of Basa and non-Basa students. So, in this case we estimate a 2.15 increase in letters per
minute as a result of Basa, and we are 90% confident that this represents a true difference between Basa and non-Basa. Unless
explicitly stated otherwise, we report a result as statistically significant if the p-value is equal to or less than 0.1.

19 | USAID BASA PILIPINAS IMPACT EVALUATION USAID.GOV
TABLE 9: TWO-YEAR IMPACTS OF BASA
GRADE 2 GRADE 3 GRADE 4
FILIPINO ENGLISH FILIPINO ENGLISH FILIPINO ENGLISH
Letters per minute 3.14* 4.56*** 2.64 5.06*** 1.94 1.47
Familiar words per minute 6.50*** 5.19* 1.06 2.07 0.74 -0.23
Unfamiliar words per minute 4.36*** 3.66** 3.33*** 0.89 -0.73 0.86
ORF per minute 7.24*** 6.81** -1.22 -0.45 -1.37 0.07
Reading comprehension (% correct) -0.03 -0.02 -0.04 -0.09 -0.08*** -0.06 * significant at 90% ** significant at 95% ***significant at 99% + p <0.1 + 0.1< p <0.2 - p <0.1 - 0.1< p <0.2
Below we present graphs of results of follow-up scores and impact estimates for each EGRA subtest from
the one-year estimates for each grade, organized by the language of testing. The y-axis for each subtest
shows the total number of items, which is roughly indicative of the total possible score on the subtest.18
We also display the regression treatment effect for each subtest, controlling for baseline scores and
demographic, household, and school-level variables.
MOTHER TONGUE
Grade 1 Basa students scored higher on the mother tongue EGRA across all subtests at follow-up, before
controlling for baseline scores and other control variables. After applying controls, these impacts are
generally small and statistically insignificant except for letters and familiar words cpm, where Basa
increased student scores by 2.15 letters cpm (p=0.010) and 4.05 more familiar words cpm (p=0.230).
Regression results disaggregated by sex reveal that Basa is differentially impacting boys and girls. While
program impact estimates are null for all subtests for boys, impact estimates are statistically significant at
the 90% confidence level for girls on both familiar words (p=0.035) and unfamiliar words (p=0.004). We
also observe differential treatment effects across language, with generally negative treatment effects in
Ilokano and positive treatment effects in Cebuano. It is important to note that results in Ilokano and
Cebuano are not comparable since the languages differ in complexity and structure. For instance, Ilokano
has lengthier words than Cebuano.
18 The total number of items is only roughly indicative of the total possible score because total scores are calculated
incorporating the time remaining after completing all items. Thus, if a student correctly reads all words or letters in a subtest
and still has time remaining, that student would score higher than the total number of items.

USAID.GOV USAID BASA PILIPINAS IMPACT EVALUATION | 20
Figure 3. Impacts of Basa on Grade 1 students
FILIPINO
Basa had a statistically significant impact on Grade 2 Filipino in three of the five subtests. Specifically, due
to Basa, Grade 2 students read 1.52 more familiar words cpm than comparison students (p=0.085), and
performed statistically better in unfamiliar words (TE=1.47, p=0.031), and oral reading fluency (TE=4.22,
p=0.026). However, Basa had no impact on letters cpm or reading comprehension. Boys in Grade 2
benefited more than girls in Filipino; results are generally null for girls and significant for Basa boys in
familiar words, unfamiliar words, and oral reading fluency, though negative and significant for reading
comprehension. Basa had no impact on Grade 3 students in Filipino; sex-disaggregated results show this
holds for both boys and girls. Grade 4 Filipino results show negative effects of Basa, though these are
insignificant for all subsets except for reading comprehension, where Basa had a negative impact on student
scores; Basa students scored 9.3 percentage points lower than comparison students, after controlling for
baseline scores and other control variables.19 These negative results in reading comprehension are driven
by Basa boys who are significantly negatively impacted by Basa, while Basa had no effect on Grade 4 girls.
19 This result is still negative and statistically significant controlling only for explanatory variables but not baseline scores, though
with a slightly smaller magnitude (TE=-0.081, p=0.003).

21 | USAID BASA PILIPINAS IMPACT EVALUATION USAID.GOV
Figure 4. Impacts of Basa on Grade 2 students - Filipino
Figure 5. Impacts of Basa on Grade 3 students - Filipino

USAID.GOV USAID BASA PILIPINAS IMPACT EVALUATION | 22
Figure 6. Impacts of Basa on Grade 4 students - Filipino
ENGLISH20
Basa had a statistically significant, positive impact on Grade 2 students in English letters cpm (TE=2.17,
p=0.006) and unfamiliar words cpm (TE=1.37, p=0.089), but no impact on Grade 2 students in familiar
words, oral reading fluency, or reading comprehension. Grade 3 Basa students experienced positive
results from Basa in letters cpm (TE=2.06, p=0.009), familiar words cpm (TE=1.89, p=0.090), and
unfamiliar words cpm (TE=1.37, p=0.051), but results are null for oral reading fluency and negative for
reading comprehension, with Basa students scoring 8 percentage points lower than comparison students
(p=0.087) after controlling for baseline scores and other variables. Basa had no impact on Grade 4
students, except for reading comprehension, for which we also observe a negative impact of Basa (TE=-
0.07, p=0.083).21
20 It should be noted that reading in English only begins in Grade 3, per MTBMLE policy. 21 This result is still negative but just short of statistical significance controlling only for explanatory variables but not baseline
scores (TE=-0.074, p=0.108).
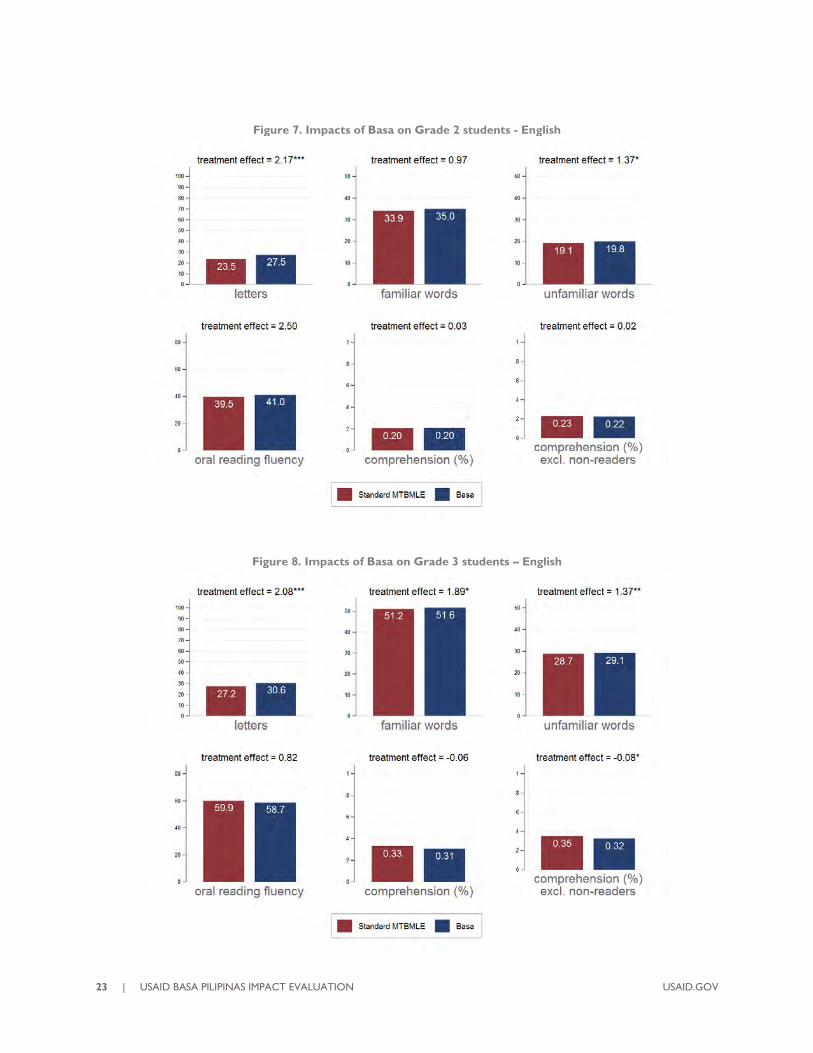
23 | USAID BASA PILIPINAS IMPACT EVALUATION USAID.GOV
Figure 7. Impacts of Basa on Grade 2 students - English
Figure 8. Impacts of Basa on Grade 3 students – English

USAID.GOV USAID BASA PILIPINAS IMPACT EVALUATION | 24
Figure 9. Impacts of Basa on Grade 4 students - English
PROGRESS TOWARD BENCHMARKS22
In May 2015, Basa convened a working group to establish reading fluency and comprehension benchmarks
and targets for each grade in Filipino and English. These benchmarks and targets were designed to be used
as a standard against which progress toward improving reading outcomes among Filipino children would
be measured. Table 10 & 11 show the percentage of Basa and comparison students meeting these targets
for the standard EGRA benchmarks of reading proficiency in oral reading fluency and reading
comprehension and impact estimates for the effect of Basa on attaining each target. Generally, both Basa
and comparison students fell short of these targets. In some cases, Basa students had greater odds of
attaining benchmarks and in other cases, Basa students had lower odds.
For Filipino, Grade 2 Basa students were significantly more likely to meet the reading fluency benchmarks
of 40 words cpm (OR=1.57, p=0.004) and 60 words cpm (OR=1.37, p=0.072) but similarly likely to achieve
reading comprehension benchmarks. Grade 3 Basa students were significantly less likely to meet the 60%
and 80% comprehension benchmarks, though very few students in either group attained these
benchmarks. Grade 4 Basa students were similarly likely to meet reading fluency and comprehension
benchmarks. In English, Basa and comparison students are equally likely to achieve benchmarks across all
grades, except Grade 4 Basa students have lower odds of attaining the 40% reading comprehension
benchmark (OR=0.56, p=0.041).
22 The Grade 3 and Grade 4 EGRA tools are more challenging tools developed by SI. Lower performance against benchmarks in
Grade 3 and Grade 4 therefore does not indicate lower reading proficiency among these students rather more modest
performance given the more challenging assessment. See the methodology section of this report for further explanation.

25 | USAID BASA PILIPINAS IMPACT EVALUATION USAID.GOV
TABLE 10: PERCENT ATTAINING BENCHMARKS – FILIPINO23
BENCHMARK GRADE TARGET STANDARD
MTBMLE BASA IMPACT
40 words cpm
2 62% 51% 55% 1.57***
3 75% 69% 69% 0.87
4 -- 82% 81% 0.76
60 words cpm
2 29% 27% 28% 1.37*
3 47% 40% 38% 0.83
4 -- 44% 43% 1.13
40% comprehension
2 66% 48% 47% 0.92
3 70% 12% 12% 0.80
4 -- 8% 5% 0.57
60% comprehension
2 36% 21% 22% 1.12
3 44% 4% 2% 0.55**
4 -- 1% 1% --
80% comprehension
2 16% 9% 9% 0.99
3 20% 2% 1% 0.33**
4 -- 1% 0% -- * significant at 90% ** significant at 95% ***significant at 99% + p <0.1 + 0.1< p <0.2 - p <0.1 - 0.1< p <0.2
TABLE 11: PERCENT ATTAINING BENCHMARKS – ENGLISH
BENCHMARK GRADE TARGET STANDARD
MTBMLE BASA IMPACT
40 wpm
2 61% 49% 50% 1.10
3 72% 70% 70% 1.18
4 -- 85% 81% 1.01
60 wpm
2 36% 26% 26% 1.24
3 54% 51% 48% 0.96
4 -- 68% 61% 0.76
40% comprehension
2 32% 18% 18% 1.20
3 41% 31% 29% 0.86
4 -- 21% 16% 0.56**
60% comprehension
2 23% 15% 15% 1.27
3 30% 28% 25% 0.83
4 -- 7% 8% 1.31
80% comprehension
2 13% 7% 7% 1.32
3 20% 16% 14% 0.87
4 -- 4% 3% -- * significant at 90% ** significant at 95% ***significant at 99%
+ p <0.1 + 0.1< p <0.2 - p <0.1 - 0.1< p <0.2
PREDICTORS OF READING OUTCOMES
As a part of the analysis, the evaluation team explored the extent to which various demographic,
household, school, and teacher characteristics predict reading fluency and comprehension scores.
Regressions were run using oral reading fluency and reading comprehension scores as dependent variables.
Table 12 summarizes those factors we found to be consistently predictive of reading scores. The full
results of these regressions can be found in Annex 6.
23 Too few G4 students met the 60% and 80% Filipino comp. and 80% English comp. benchmark to run the regression.

USAID.GOV USAID BASA PILIPINAS IMPACT EVALUATION | 26
TABLE 12: PREDICTORS OF READING OUTCOMES
Region 7 students performed substantially better than Region 1 students in Grade 2,
particularly in Filipino where students in Region 7 scored 29 words cpm higher than Grade
2 students in Region 1. The ORF disparity diminishes in grades 3 and 4, but remains for
comprehension.
Girls significantly outperformed boys in ORF by 11 to 14 words cpm, and score 5 to 15
percentage points higher in comprehension. This is roughly equivalent to the effect of one
additional year of schooling.
Household and school assets positively predict higher ORF and comprehension scores.
Students who started Kindergarten at a younger age score higher than those who started
at an older age. Notably, among Grade 2 students, each additional year in age at start of
Kindergarten is associated with a 4 word drop in reading fluency in Filipino.
Receiving homework help is inversely related to ORF and comprehension scores, though
only statistically significant for Grade 2 and Grade 4 English comprehension, which could
mean students with lower aptitude require more homework help or that students who
receive homework help actually learn less of the material.
Having reading material at home positively predicts ORF and comprehension scores for
some grades and languages, though not consistently so. Notably, Grade 3 students who
bring books home from school score 6 words cpm higher on Filipino ORF and 7 words
cpm higher on English ORF, though results are null for other grades and for reading
comprehension.
Having someone reading to the child at home starting at a younger age is positively related
to ORF scores and highly statistically significant across most languages and grades.
School closure negatively predicts ORF and comprehension scores. One additional day of
school closure is associated with a drop of 0.5 words cpm in Filipino and nearly 1 word
cpm in English reading fluency among Grade 3 students, and 1 percentage point drop in
reading comprehension among Grade 4 students. Results are null for other grades.
Controlling for a student’s class size, students in schools with higher enrollment have higher
test scores across most languages and grades.
Grade 2 students who have a teacher with a post-graduate degree score, on average, 15
words cpm higher in Filipino reading fluency. This variable does not explain reading scores
for other grades or languages, but months of teacher experience has a significant positive
effect on Grade 4 Filipino comprehension and a nearly significant effect on English
comprehension in both Grade 3 and Grade 4.
Grade 3 students whose teachers demonstrate reading-specific teaching best practices
correctly read, on average, 5.9 words cpm more in Filipino and 7.7 words cpm more in
English. This variable does not explain reading scores for other grades or languages.
Math score is a highly statistically significant predictor of reading score across all languages
and grades.

27 | USAID BASA PILIPINAS IMPACT EVALUATION USAID.GOV
ZERO SCORES
In addition to mean scores on each EGRA subtest, the evaluation team also analyzed the percentage of
Basa and comparison students scoring zero on a subtest, by language and grade at baseline and at 2016
and 2017 follow-up. Zero scores generally reduced from start of year to end of year for both Basa and
comparison students in Filipino and English, though zero scores among comparison students generally
reduced more than did zero scores for Basa students. It should be noted that more challenging Grade 3
and Grade 4 assessments were developed in order to capture gains attributable to the Basa intervention.
Thus, higher zero scores in these grades do not indicate losses in proficiency, rather lower performance,
across both groups, on a more challenging assessment.
Basa significantly reduced Grade 2 Filipino zero scores in unfamiliar words (OR=1.57, p=0.053) and reading
fluency (OR=1.47, p=0.060) relative to changes in the comparison group. For Grade 3 students, Basa
reduced zero scores in reading fluency only (OR=2.01, p=0.080). However, Basa increased zero scores
among Grade 4 students in reading comprehension (OR=0.48, p=0.004) relative to the comparison group.
TABLE 13: ZERO SCORES – FILIPINO
GRADE
STANDARD MTBMLE BASA IMPACT
ODDS
RATIO Start of
Year
End of
Year Change
Star of
Year
End of
Year Change
Letters
2 19% 10% 9% 19% 10% 9% 1.04
3 15% 8% 7% 11% 6% 5% 1.39
4 -- 4% -- -- 4% -- 1.16
Familiar words
2 17% 10% 7% 10% 7% 3% 1.32
3 8% 5% 3% 4% 4% 0% 0.94
4 -- 4% -- -- 3% -- 0.64
Unfamiliar words
2 23% 14% 9% 15% 10% 5% 1.57*
3 11% 8% 3% 6% 6% 0% 1.20
4 -- 7% -- -- 4% -- 4.33***
Reading fluency
2 27% 13% 14% 22% 12% 10% 1.47*
3 7% 5% 2% 4% 4% 0% 2.01*
4 -- 2% -- -- 2% -- 2.97
Comprehension
2 48% 32% 16% 43% 32% 11% 1.26
3 50% 39% 11% 39% 37% 2% 1.08
4 -- 56% -- -- 66% -- 0.48*** * significant at 90% ** significant at 95% ***significant at 99%
+ p <0.1 + 0.1< p <0.2 - p <0.1 - 0.1< p <0.2
For English, Basa reduced Grade 2 zero scores in letters (OR=1.75, p=0.024), unfamiliar words (OR=1.45,
p=0.090), and reading fluency (OR=1.53, p=0.036). Results for Grade 3 and Grade 4 students were again
more modest; Basa reduced Grade 3 zero scores in letters only (OR=1.87, p=0.027), and though not
meeting the threshold of statistically significance, increased zero scores in Grade 4 English reading
comprehension (OR=0.74, p=0.142).

USAID.GOV USAID BASA PILIPINAS IMPACT EVALUATION | 28
TABLE 14: ZERO SCORES – ENGLISH
GRADE
STANDARD MTBMLE BASA IMPACT
ODDS
RATIO Start of
Year
End of
Year Change
Star of
Year
End of
Year Change
Letters
2 13% 9% 4% 17% 6% 11% 1.75**
3 14% 6% 8% 12% 4% 8% 1.87**
4 -- 2% -- -- 2% -- 0.74
Familiar words
2 28% 19% 9% 20% 14% 6% 1.10
3 13% 9% 4% 8% 7% 1% 1.34
4 -- 8% -- -- 8% -- 0.67
Unfamiliar words
2 32% 21% 11% 25% 16% 9% 1.45*
3 18% 11% 7% 12% 10% 2% 0.95
4 -- 9% -- -- 9% -- 0.74
Reading fluency
2 20% 11% 9% 12% 8% 4% 1.53**
3 9% 5% 4% 5% 5% 0% 1.10
4 -- 3% -- -- 2% -- 1.39
Comprehension
2 70% 58% 12% 65% 57% 8% 1.31
3 57% 45% 12% 51% 46% 5% 0.87
4 -- 63% -- -- 69% -- 0.74 * significant at 90% ** significant at 95% ***significant at 99%
+ p <0.1 + 0.1< p <0.2 - p <0.1 - 0.1< p <0.2
EGMA
Early Grade Math Assessments (EGMA) were administered to test for any effect of Basa on learning in
Mathematics. Though the Basa program is a literacy program and is not expected to generate changes in
numeracy (and accordingly is not being evaluated according to numeracy outcomes), it has been theorized
that improved literacy outcomes may lead to improved numeracy outcomes. We observe positive
statistically significant effects of Basa on one to two subtests per grade with null effects across the
remaining subtests. Positive treatment effects were most consistent for numbers identified cpm, for which
Basa had statistically significant positive effects across all grades except for Grade 3.
TABLE 15: EGMA
GRADE 1 GRADE 2 GRADE 3 GRADE 4
Number identification cpm 1.45** 2.07*** 0.93 4.13***
Quantity comparison (% correct) -0.007 0.023* 0.010 0.007
Missing number (% correct) 0.003 0.016 -0.011 -0.023
Addition level 1 cpm 0.03 0.42 -0.10 -0.40
Subtraction level 1 cpm 0.32 0.25 0.22 -0.07
Word problem (% correct) 0.114*** 0.009 -0.004 -0.022
Addition level 2 (% correct) -- 0.034 0.044** -0.029
Subtraction level 2 (% correct) -- -0.014 0.001 0.006
* significant at 90% ** significant at 95% *** significant at 99% + p <0.1 + 0.1< p <0.2 - p <0.1 - 0.1< p <0.2
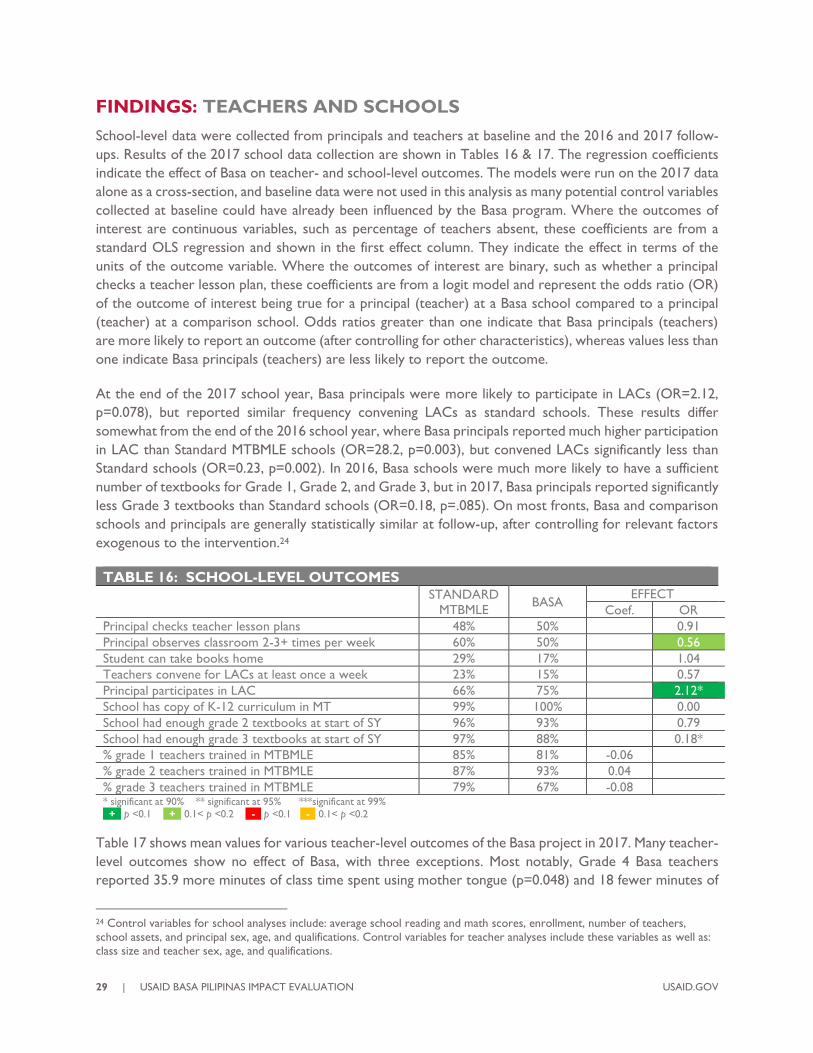
29 | USAID BASA PILIPINAS IMPACT EVALUATION USAID.GOV
FINDINGS: TEACHERS AND SCHOOLS
School-level data were collected from principals and teachers at baseline and the 2016 and 2017 follow-
ups. Results of the 2017 school data collection are shown in Tables 16 & 17. The regression coefficients
indicate the effect of Basa on teacher- and school-level outcomes. The models were run on the 2017 data
alone as a cross-section, and baseline data were not used in this analysis as many potential control variables
collected at baseline could have already been influenced by the Basa program. Where the outcomes of
interest are continuous variables, such as percentage of teachers absent, these coefficients are from a
standard OLS regression and shown in the first effect column. They indicate the effect in terms of the
units of the outcome variable. Where the outcomes of interest are binary, such as whether a principal
checks a teacher lesson plan, these coefficients are from a logit model and represent the odds ratio (OR)
of the outcome of interest being true for a principal (teacher) at a Basa school compared to a principal
(teacher) at a comparison school. Odds ratios greater than one indicate that Basa principals (teachers)
are more likely to report an outcome (after controlling for other characteristics), whereas values less than
one indicate Basa principals (teachers) are less likely to report the outcome.
At the end of the 2017 school year, Basa principals were more likely to participate in LACs (OR=2.12,
p=0.078), but reported similar frequency convening LACs as standard schools. These results differ
somewhat from the end of the 2016 school year, where Basa principals reported much higher participation
in LAC than Standard MTBMLE schools (OR=28.2, p=0.003), but convened LACs significantly less than
Standard schools (OR=0.23, p=0.002). In 2016, Basa schools were much more likely to have a sufficient
number of textbooks for Grade 1, Grade 2, and Grade 3, but in 2017, Basa principals reported significantly
less Grade 3 textbooks than Standard schools (OR=0.18, p=.085). On most fronts, Basa and comparison
schools and principals are generally statistically similar at follow-up, after controlling for relevant factors
exogenous to the intervention.24
TABLE 16: SCHOOL-LEVEL OUTCOMES STANDARD
MTBMLE BASA
EFFECT
Coef. OR
Principal checks teacher lesson plans 48% 50% 0.91
Principal observes classroom 2-3+ times per week 60% 50% 0.56
Student can take books home 29% 17% 1.04
Teachers convene for LACs at least once a week 23% 15% 0.57
Principal participates in LAC 66% 75% 2.12*
School has copy of K-12 curriculum in MT 99% 100% 0.00
School had enough grade 2 textbooks at start of SY 96% 93% 0.79
School had enough grade 3 textbooks at start of SY 97% 88% 0.18*
% grade 1 teachers trained in MTBMLE 85% 81% -0.06
% grade 2 teachers trained in MTBMLE 87% 93% 0.04
% grade 3 teachers trained in MTBMLE 79% 67% -0.08 * significant at 90% ** significant at 95% ***significant at 99%
+ p <0.1 + 0.1< p <0.2 - p <0.1 - 0.1< p <0.2
Table 17 shows mean values for various teacher-level outcomes of the Basa project in 2017. Many teacher-
level outcomes show no effect of Basa, with three exceptions. Most notably, Grade 4 Basa teachers
reported 35.9 more minutes of class time spent using mother tongue (p=0.048) and 18 fewer minutes of
24 Control variables for school analyses include: average school reading and math scores, enrollment, number of teachers,
school assets, and principal sex, age, and qualifications. Control variables for teacher analyses include these variables as well as:
class size and teacher sex, age, and qualifications.

USAID.GOV USAID BASA PILIPINAS IMPACT EVALUATION | 30
class time in English than comparison teachers (p=0.204). This finding may help explain the negative reading
comprehension findings in Grade 4, though results still indicate a negative effect on Grade 4 reading
comprehension even after controlling for this factor. Second, holding all else constant, teachers at Basa
schools were more likely to have attended early grade reading training than equivalent peers at
comparison schools (OR=1.83, p=0.001). However, among those teachers who did receive training, Basa
teachers received one day less of training in both mother tongue (p=0.003) and training overall (p=0.015).
Third, Basa teachers are statistically significantly more likely to put students into smaller groups several
times per month (OR=1.93, p=0.002).
TABLE 17: TEACHER-LEVEL OUTCOMES STANDARD
MTBMLE BASA
EFFECT
Coef. OR
Early grade reading training, % teachers attended 62% 75% 1.83***
Early grade reading training, days attended 8.86 8.05 -0.99**
Early grade MT reading training, days attended 3.18 2.34 -1.14***
Class time in MT, minutes 189.43 196.88 5.49
Class time in Filipino, minutes 74.55 74.98 -0.22
Class time in English, minutes 78.82 75.42 0.10
Puts students into smaller groups several times per
month
73% 83% 1.93***
Teachers displaying 75%+ of applicable reading behaviors 70% 62% 0.69
General teaching behavior index 91% 90% 0.01
Reading teaching behavior index 83% 79% -0.02
Teachers very familiar with MT grammar 54% 50% 0.87
Teachers not comfortable providing instruction in MT 56% 61% 1.15 * significant at 90% ** significant at 95% ***significant at 99% + p <0.1 + 0.1< p <0.2 - p <0.1 - 0.1< p <0.2
Table 18 & 19 display the percent of teachers in Basa and comparison schools that demonstrated general
and reading-specific “best-practice” behaviors, respectively, at follow-up. To be counted as demonstrating
each behavior, the teacher must have been scored by an enumerator as displaying the behavior at least
“sometimes” or “partially correct” in two or more out of the three times that they were observed. In
order to determine the effect of teaching at a Basa school on the demonstration of these behaviors, each
behavior was run as the dependent variable of a logistic regression. The coefficients in the table compare
the odds of the behavior being displayed by a teacher at a Basa school compared to a comparison school,
holding all else constant. Table 18 shows that Basa teachers demonstrated similar levels of general teaching
best-practices, expect that Basa teachers were significantly less likely to engage students in cooperative
learning strategies.
TABLE 18: GENERAL BEST-PRACTICE TEACHING BEHAVIORS
CATEGORY BEHAVIOR STANDARD
MTBMLE BASA OR
Classroom
materials
Uses different instructional resources 97% 98% 0.69
Uses materials besides textbooks 90% 88% 0.89
Opportunities for
Reflection and
Application
Connects to previous lessons 75% 77% 1.43
Asks probing questions 93% 95% 1.55
Provides opportunities to apply learning 83% 82% 1.09
Provides opportunities for critical thinking 90% 92% 1.25
Positive learning
environment
Effective classroom management 100% 99% --
Treats students fairly 99% 100% --

31 | USAID BASA PILIPINAS IMPACT EVALUATION USAID.GOV
Other Manages time effectively 100% 100% --
Assesses pupil learning 100% 100% --
Cooperative learning strategies 75% 59% 0.57**
General teacher behavior index 91% 90% -- * significant at 90% ** significant at 95% ***significant at 99% + p <0.1 + 0.1< p <0.2 - p <0.1 - 0.1< p <0.2
With respect to reading-specific teaching best-practices, Basa teachers were significantly more likely to
ask students to sound out new words, possibly indicating greater emphasis among Basa teachers on
phonetics. Though Basa and non-Basa teachers were equally likely to ask questions to assess student
reading comprehension, Basa teachers were observed to do so more consistently than comparison
teachers (OR=2.37, p=0.005). Similarly, while fewer Basa teachers provided varied methods for good
writing, Basa teachers were significantly more likely than comparison teachers to display these behaviors
consistently (OR=1.52, p=0.061).
TABLE 19: READING-SPECIFIC BEST-PRACTICE TEACHING BEHAVIORS
CATEGORY BEHAVIOR STANDARD
MTBMLE BASA OR
Classroom
materials
Asks pre-reading questions 79% 76% 0.98
Asks learners to act something out 77% 63% 0.69
Uses multiple methods for comp. 89% 84% 0.59
Asks questions to assess reading comp. 98% 97% 1.46
Asks questions to assess listening comp. 96% 93% 0.49
Allows learners to retell story 66% 55% 0.85
Opportunities for
learning to decode
and spell words
Encourages sounding it out 81% 86% 2.08**
Provides instructions to decode 76% 75% 1.24
Asks learners to recognize letters 87% 76% 0.44
Asks learners to recite alphabet 48% 50% 2.11
Positive learning
environment
Avoids criticizing learners 99% 99% --
Encourages learners to help each other 71% 66% 0.98
Other Reading-level appropriate activities 95% 92% 0.42
Asks readers to read aloud 87% 89% 1.37
Teaches learners new words 85% 87% 1.17
Assigns individual reading 64% 50% 0.68
Provides varied methods for good writing
skills 91% 82% 0.55
* significant at 90% ** significant at 95% ***significant at 99%
+ p <0.1 + 0.1< p <0.2 - p <0.1 - 0.1< p <0.2

USAID.GOV USAID BASA PILIPINAS IMPACT EVALUATION | 32
CONCLUSIONS
STUDENTS
Basa had small but statistically significant impacts on Grade 1 and Grade 2 students in reading and math,
including reductions in English zero scores. Results are consistently more positive for the combined
measure of the effect of Grade 1 Basa plus Grade 2 Basa than looking at the effect of a single year of Basa.
Among Grade 3 students, we find some significant impacts on English but no impacts on Filipino. We find
no significant impact of Basa among Grade 4 students in either language, apart from a significant negative
impact on reading comprehension for Grade 4 students both in Filipino and English. Basa reduced zero
scores for some Grade 3 and Grade 4 subtests, but increased zero scores for Grade 4 reading
comprehension. While around half of Grade 3 and Grade 4 students score zero in reading comprehension
due to the more challenging assessment, it is important to note that this does not bias our results for
several reasons. First, both Basa and comparison students received the same assessment. Second, results
are still null or negative among those who do not score zero. Third, we observe that zero scores reduced
more among comparison students, and that Basa increased zero scores among Grade 4 students. Finally,
results are consistent across a variety of model specifications (see Annex 7). Accordingly, we are confident
that the results stand.
Based on the results of this impact evaluation, we conclude that the Basa program resulted in some short-
term gains in both pre-reading25 and oral reading fluency for treatment students, but these effects become
null over time, with comparison students reaching parity with Basa students by Grade 4. These results are
consistent with evidence from other early grade literacy evaluations, which seems to indicate significant
gaps in our knowledge of how to create sustainable improvements in reading outcomes. Additionally, Basa
did not have an impact on reading comprehension in any grade, and had a negative impact on reading
comprehension in Grade 4. While we do not find a clear mechanism for the observed negative effects on
Grade 4 reading comprehension, it may relate to differences in Basa versus non-Basa schools in the
language used in class. Differences between Basa and non-Basa teachers in class time spent using mother
tongue, Filipino, and English are negligible until Grade 4, when we see that Basa teachers spend significantly
more time in mother tongue and almost significantly less time in English. While we do find some evidence
that class time in mother tongue in Grades 3 and 4 is associated with decreased English and Filipino reading
fluency and comprehension, the negative results for reading comprehension are still observed when
controlling for class time in mother tongue and English. As we did not measure reading outcomes in
mother tongue beyond Grade 1, we cannot say whether the program had an impact on mother tongue
reading outcomes in grades 2 through 4.
Results from this evaluation confirm that girls generally out-perform boys across grades and subtests. We
observe no consistent trend in Basa either reducing or exacerbating the gender gap; in some instances,
girls benefit from Basa more than boys and in others, boys benefit more than girls. Notably, Grade 1 girls
generally benefit more than boys from the intervention. Girls in Grade 4 generally experienced no benefit
from Basa, while Basa boys in Grade 4 generally experienced a negative effect (i.e. benefited more from
standard MTBMLE). Results from this IE also illuminate factors that explain reading achievement. Aside
from sex and region, other factors that positively predict reading scores include: student EGMA scores,
teachers exhibiting reading best-practices, school and household assets, age at start of Kindergarten and
25 Letter identification, familiar word and unfamiliar word subtests can be considered pre-reading subtests.

33 | USAID BASA PILIPINAS IMPACT EVALUATION USAID.GOV
at start of someone reading to the child, having access to reading material at home, and larger school
enrollment. School closure and receiving help on homework are associated with lower reading scores.
TEACHERS AND SCHOOLS
Basa and comparison schools, principals, and teachers are generally statistically similar at follow-up, after
controlling for relevant factors exogenous to the intervention. Considering the intervention’s theory of
change—impacting student scores through changing school leadership and teacher beliefs and practices—
the modest results of this IE may be a result of limited observed impacts of Basa on schools and teachers.
Basa principals were no more likely to check teacher lesson plans, observe classrooms, convene LACs,
have access to the mother tongue curriculum, or allow students to bring books home from school.
However, Basa principals were more likely to participate in LACs.
As we would expect, Basa teachers were significantly more likely to have attended early grade reading
training. Of those who reported attending early grade training, Basa teachers received significantly fewer
training days, which is consistent with our understanding of the Basa training, which is shorter in duration
than standard DepEd trainings. Basa teachers are more likely to encourage students to sound out
unfamiliar words and to put students into smaller groups several times per month, but otherwise exhibit
statistically similar levels of general and reading-specific best practices as comparison teachers.

USAID.GOV USAID BASA PILIPINAS IMPACT EVALUATION | 34
RECOMMENDATIONS
1- Explore mechanisms for sustainability in later grades. Given that the IE found short-term
but no lasting impact of Basa on student achievement in Filipino and English, the evaluation team
recommends that USAID explore interventions that have the potential to sustain student
achievement gains in future grades. This may include supporting teachers who instruct Grade 4
or higher as students in this stage may still be honing their reading skills and learning to
comprehend increasingly complex text. This may also include providing follow-up and coaching
support to teachers who received training to encourage continued use of the material.
2- Investigate what works well in standard DepEd training. We found that Grade 4 students
who attended non-Basa schools performed better on Filipino reading comprehension than
students who attended Basa schools, particularly among boys. This finding is statistically significant,
controlling for baseline score and other explanatory variables. As such, we recommend
investigating what the standard DepEd training is doing well that could be contributing to these
higher gains relative to Basa students. Moreover, we recommend that this investigation utilize a
gender lens to further investigate if there are certain methods or approaches that are working
particularly well with boys.
3- Integrate evaluative thinking and evaluation planning at an early stage. One limitation
of this IE is that the evaluator was contracted several years after the start of implementation.
Thus, the baseline is for the student-level rather than the school or project-level. Early planning
allows better alignment between implementation and evaluation timelines and improves the
feasibility of a randomized control trial, which is the gold standard of impact evaluation
methodologies. Moreover, early planning helps to ensure evaluation findings are available to
USAID at times when major programmatic decisions are to be made. Finally, by planning early,
evaluators and implementers can work to ensure similarity in tools which facilitates comparison
and knowledge generation. To maximize the usefulness of future evaluations, USAID should plan
for evaluations as early as possible, ideally at the Project Appraisal Document (PAD) stage.
4- Consider future research on the sustainability of effects of reading programs as well
as on the null results on reading comprehension. The Sa Aklat Sisikat Reading Program in
the Philippines, the Nali Kali program in India, the USAID/Mali Read-Learn-Lead program, and this
IE all found effects in early grades that did not hold in subsequent grades. The generally null and
negative findings in Grades 3 and 4 could potentially result from teachers having received a less
developed and refined version of the Basa training in the intervention startup years, differences in
language use during class time, or some other factor(s). Additional research with the current
Grade 3 cohort, which was matched prior to the start of Grade 1, or future cohorts would allow
USAID to test whether results with this cohort are sustained or similarly diminish over time.
Further, more research should be conducted on why the program generated impact on some
measures of pre-reading and oral reading fluency but not in comprehension.

35 | USAID BASA PILIPINAS IMPACT EVALUATION USAID.GOV
ANNEX I – EVALUATION STATEMENT OF WORK
A. IMPACT EVALUATION PARAMETERS
A rigorous evaluation design must be used to the greatest extent possible in assessing the impact of Basa
Pilipinas and of mother-tongue reading instruction and for related cost analyses.
1. Methodological Options
The methodological options for conducting a rigorous impact evaluation include:
a. Experimental designs in which the contractor establishes treatment and control groups for
comparison from the beginning of program implementation with random assignment of eligible
participants into treatment and control groups; and
b. Quasi-experimental designs in which the contractor constructs comparison groups that resemble treatment groups, at least in observed characteristics, through some kind of matching method,
such as propensity scoring or multivariate correlation. Difference-in-difference methodology can then be used to compare between treatment and comparison groups before and after
program implementation. Other analytical options, such as instrumental variable and regression discontinuity designs, may be considered if appropriate and in consultation with USAID.
2. Qualitative Data
Qualitative data analysis must also be used to compliment quantitative data and enhance the depth
of the evaluation study. This may include data from administrative records and secondary sources
on the implementation of MTBMLE and Basa Pilipinas, observation of MTBMLE and Basa Pilipinas
activities (teaching, training, etc.), as well as selected individual and/or group interviews (with
administrators, teachers, trainers, material developers, students, and other stakeholders.
3. Cost Analysis
Several different aspects of cost analysis must be included such as cost-effectiveness, cost-benefit,
cost utility and cost feasibility analyses. While it is expected that the bulk of the cost analysis under
this contract will look at cost-effectiveness, cost-benefit, cost utility and cost feasibility analysis are
also relevant. The overall goal of cost analysis in this evaluation is to provide timely data to USAID,
the GPH, and other relevant stakeholders to support decision-making about rollout and scaling up
of the reading interventions evaluated.
4. Measuring Outcomes
As noted previously, the Basa Pilipinas activity supports MTBMLE in six (6) provinces encompassing
instruction in three (3) mother tongues (Ilocano, Cebuano and Maguindanaoan). It is anticipated
that the Basa Pilipinas Impact Evaluation will collect data on reading performance from a statistically
significant sample (at least a 95% confidence level) or higher of students receiving USAID assistance
and those not receiving USAID assistance. Although the size of that sample will vary depending on
the number of causal variables being examined in the proposed evaluation design, this has been

USAID.GOV USAID BASA PILIPINAS IMPACT EVALUATION | 36
estimated as approximately 1,000 students receiving USAID assistance and 1,000 not receiving
USAID assistance each year.
Reading performance (in English and Filipino) must be used as the main outcome indicator in
assessing Basa Pilipinas. Many established reading achievement tests exist to measure this indicator
including the Early Grade Reading Assessment (EGRA) developed through funding support
from USAID and the World Bank, government-sponsored reading achievement tests such as the
Philippine Informal Reading Inventory (Phil-IRI), the National Achievement Test (NAT), and others.
The Contractor must be able to use or modify existing reading performance instruments and/or
existing reading performance data (from DepEd, administrative records, etc.). In all cases, the
Contractor must select or create the best tool to measure reading achievement in this context in
close consultation with USAID and DepEd. This may involve a combination of tools, such as EGRA
to measure performance for control and comparisons groups and GPH surveys to provide baseline
and national comparisons. The Contractor must also determine (in consultation with USAID and
DepEd) how data on reading achievement can best be disaggregated (e.g., with regard to gender,
location, indigenous affiliation, initial reading ability etc.). Gender disaggregation is of particular
priority to help USAID and DepEd better understand gender differences in reading achievement and
how performance gaps that exist between girls and boys in different sub-regions can best be
addressed.
5. Coordination
Significant coordination is required to carry out this evaluation. The Contractor will work closely
with the Basa Pilipinas implementer (Education Development Center), the implementer of USAID’s
PhilEd Data activity (RTI) that collects related educational statistics, USAID, and other important
education program partners. The Contractor will also work closely with DepEd officials who are
implementing the country-wide MTBMLE program and whose approval will be needed to collect
data in the field. In addition, the Contractor will work closely with relevant USAID technical staff
and technical staff of other bilateral and multilateral donors implementing related education
programs in the Philippines.
a. Coordination with USAID’s Basa Pilipinas Contractor
The Contractor is responsible for designing and implementing the Basa Pilipinas impact
evaluation -- providing oversight, maintaining quality, and assuring independence. Under the
Basa Pilipinas contract, the implementer (EDC) collected baseline data on outputs and
outcomes for program participants (those receiving USAID assistance) that can be aggregated
at the classroom, school and division levels. To the extent possible, the Contractor must
utilize this baseline and follow-up data collected by the Basa contractor, while also identifying
or constructing comparison or control groups and collecting outcome data from these groups
as necessary, appropriate and feasible to provide the basis for analyzing Basa Pilipinas’ impacts
and costs.
The Contractor will work closely with the Basa Pilipinas implementer (EDC) and USAID in
finalizing the evaluation design, coordinating program implementation, and articulating their joint

37 | USAID BASA PILIPINAS IMPACT EVALUATION USAID.GOV
and separate responsibilities for data collection, analysis and reporting. To the greatest extent
possible, the Contractor will utilize the same instruments and procedures for collecting output
and outcome data as the Basa contractor and/or work closely with the Basa contractor to
modify those instruments and data collection procedures as necessary and appropriate. The
evaluation contractor will also work closely with the Basa contractor and USAID to modify
program implementation (e.g., program roll out, phasing, site and participant selection, etc.) as
possible and appropriate to ensure the most credible and powerful evaluation design and
analysis.
b. Coordination with the USAID’s PhilEd Data Contractor
The evaluation Contractor will also work closely with the implementer (RTI) of USAID’s PhilEd
Data activity to make the best possible use of the country-wide reading performance data being
collected. To the greatest extent possible, the Contractor will use this data as a basis for
controlled comparisons or, where appropriate, collect similar data itself

USAID.GOV USAID BASA PILIPINAS IMPACT EVALUATION | 38
ANNEX 2 – SAMPLED SCHOOLS
Sampled Schools, Standard MTBMLE
School Division Municipality
1 anapao es pangasinan i lingayen burgos
2 aurelio ibero mes (jugno es) negros oriental amlan (ayuquitan)
3 ayusan-paoa elementary school vigan city city of vigan (capital)
4 b. durano es danao city danao city
5 b. enriquez es danao city danao city
6 baay es ilocos norte city of batac
7 badiang ps negros oriental valencia (luzurriaga)
8 bais city west es bais city bais city
9 balaas ps negros oriental jimalalud
10 baligat es ilocos norte city of batac
11 balili ps negros oriental valencia (luzurriaga)
12 bal-loy es pangasinan ii binalonan santa maria
13 balugo es negros oriental valencia (luzurriaga)
14 banawe e/s negros oriental pamplona
15 bangcal es negros oriental jimalalud
16 baoa east es ilocos norte city of batac
17 baoa es ilocos norte city of batac
18 basac elementary school siquijor larena
19 biningan es ilocos norte city of batac
20 bio-os es negros oriental amlan (ayuquitan)
21 bogo elementary school siquijor maria
22 bolos elementary school siquijor siquijor (capital)
23 bongalonan es negros oriental basay
24 buttong es laoag city laoag city (capital)
25 buyong es lapu-lapu city lapu-lapu city (opon)
26 caaoacan es laoag city laoag city (capital)
27 cabang es negros oriental jimalalud
28 calabnugan es negros oriental sibulan
29 calango es negros oriental zamboanguita
30 calapugan es pangasinan ii binalonan natividad
31 camangaan es vigan city city of vigan (capital)
32 cambajao es negros oriental sibulan
33 can-asagan es negros oriental san juan
34 candanay elementary school siquijor siquijor (capital)
35 candaping elementary school siquijor maria
36 candigum elementary school siquijor larena
37 cangabo es negros oriental la libertad

39 | USAID BASA PILIPINAS IMPACT EVALUATION USAID.GOV
School Division Municipality
38 cangclaran elementary school siquijor lazi
39 cangmunag elementary school siquijor san juan
40 canjulao es lapu-lapu city lapu-lapu city (opon)
41 cantaroc elementary school siquijor maria
42 cantugbas ps siquijor maria
43 capalasanan elementary school siquijor lazi
44 dapdap elementary school siquijor lazi
45 dariwdiw es ilocos norte city of batac
46 datagon es negros oriental pamplona
47 delfin dawe es danao city danao city
48 don pablo carmen blanco utzurrum mes negros oriental basay
49 fatima es negros oriental pamplona
50 felix m. tio memorial e/s (bangcolotan es) negros oriental zamboanguita
51 gregorio elmaga mes (nasig-id es) negros oriental zamboanguita
52 guadalupe es bogo city city of bogo
53 hawanay es talisay city city of talisay
54 inmalog es pangasinan ii binalonan sison
55 jilabangan es negros oriental tayasan
56 jose r. remollo es (cambaloctot es) negros oriental san jose
57 lacaon es negros oriental jimalalud
58 langtad es city of naga cebu city of naga
59 lebueg es pangasinan ii binalonan laoac
60 libo elementary school siquijor enrique villanueva
61 lico-an elementary school siquijor maria
62 logucan elementary school siquijor maria
63 lo-oc es negros oriental sibulan
64 maayong tubig es negros oriental dauin
65 mabini es pangasinan ii binalonan balungao
66 magallanes es pangasinan ii binalonan tayug
67 mag-aso es negros oriental dauin
68 maglinao es negros oriental basay
69 magnuang es ilocos norte city of batac
70 magsaysay mes negros oriental sibulan
71 malabo ps negros oriental valencia (luzurriaga)
72 malaunay es negros oriental valencia (luzurriaga)
73 malongcay es negros oriental zamboanguita
74 mapalasan es negros oriental la libertad
75 maria central elementary school siquijor maria
76 martin benjamin mes (tambojangin es) negros oriental amlan (ayuquitan)
77 minabuntod ps negros oriental canlaon city

USAID.GOV USAID BASA PILIPINAS IMPACT EVALUATION | 40
School Division Municipality
78 minalulan elementary school siquijor maria
79 nabago es negros oriental zamboanguita
80 naga central es city of naga cebu city of naga
81 naguirangan-capacuan es ilocos norte city of batac
82 napo elementary school carcar city city of carcar
83 nasuji ps negros oriental valencia (luzurriaga)
84 new bataan elementary school siquijor larena
85 new corregidor elementary school siquijor larena
86 palinpinon es negros oriental valencia (luzurriaga)
87 pangi elementary school siquijor siquijor (capital)
88 papallasen es pangasinan i lingayen burgos
89 pisong a elementary school siquijor maria
90 ponong elementary school siquijor larena
91 ponong elementary school siquijor siquijor (capital)
92 po-o elementary school siquijor lazi
93 portland es danao city danao city
94 puhagan es negros oriental valencia (luzurriaga)
95 pulangbato es negros oriental valencia (luzurriaga)
96 raois es vigan city city of vigan (capital)
97 roxas elementary school siquijor enrique villanueva
98 sa-ay elementary school carcar city city of carcar
99 sabang es danao city danao city
100 sacsac es negros oriental bacong
101 saleng es pangasinan ii binalonan tayug
102 salngan es negros oriental zamboanguita
103 salvacion es pangasinan ii binalonan santo tomas
104 san andres es pangasinan iibinalonan balungao
105 san antonio elementary school siquijor siquijor (capital)
106 san antonio west es pangasinan ii binalonan san nicolas
107 san isidro es pangasinan ii binalonan san nicolas
108 san joaquin es pangasinan ii binalonan balungao
109 san leon es pangasinan ii binalonan balungao
110 san miguel es pangasinan i lingayen burgos
111 san miguel es negros oriental bacong
112 san roque es pangasinan ii binalonan san manuel
113 sobol es pangasinan ii binalonan san nicolas
114 solangon es siquijor san juan
115 sra. ascion es negros oriental san jose
116 sta. cruz integrated school pangasinan ii binalonan santa maria
117 suba basbas es lapu-lapu city lapu-lapu city (opon)

41 | USAID BASA PILIPINAS IMPACT EVALUATION USAID.GOV
School Division Municipality
118 tag-ibo elementary school siquijor san juan
119 tagmanocan elementary school siquijor lazi
120 tambisan elementary school siquijor san juan
121 vicente i. villa ms negros oriental valencia (luzurriaga)
122 villa jose es pangasinan ii binalonan san nicolas
Sampled Schools, Basa Participants
School Division Municipality
1 ablayan es cebu dalaguete
2 abucay es bohol sikatuna
3 alburquerque central es bohol alburquerque
4 alcoy central es cebu alcoy
5 alicia ces annex bohol alicia
6 altavista es cebu poro
7 argao i central es cebu argao
8 arpili es cebu balamban
9 bacay es cebu minglanilla
10 bacong es bohol anda
11 bangar ces la union bangar
12 basdio es bohol guindulman
13 batuan central es - annex bohol batuan
14 bauang north cs la union bauang
15 bayog es bohol pres. carlos p. garcia (pitogo)
16 bongoyan es cebu borbon
17 borbon central es cebu borbon
18 botigues es cebu bantayan
19 buenasuerte es bohol pilar
20 bugtong kawayan es cebu barili
21 burgos central school ilocos sur burgos
22 butubut norte es la union balaoan
23 buyog es bohol jetafe
24 cabancalan ii es mandaue city mandaue city
25 cabawan elementary school tagbilaran city tagbilaran city (capital)
26 caleriohan es cebu dalaguete
27 calioet es ilocos norte bacarra
28 canhaway es bohol guindulman
29 canlambong es bohol dimiao
30 can-olin es bohol candijay
31 cansaga elementary cebu consolacion
32 capariaan es ilocos sur santa cruz
33 carmen central es cebu carmen

USAID.GOV USAID BASA PILIPINAS IMPACT EVALUATION | 42
School Division Municipality
34 catmon integrated school cebu catmon
35 city east elementary school tagbilaran city tagbilaran city (capital)
36 concepcion es bohol danao
37 cordova central es cebu cordoba
38 cubacub es mandaue city mandaue city
39 dait norte es bohol buenavista
40 dalid es mandaue city tabuelan
41 dalumpinas es san fernando city city of san fernando (capital)
42 day-as es cebu cordoba
43 don mariano marcos mem. sch. ilocos norte pinili
44 don tomas r. mendoza es la union naguilian
45 dumalan es cebu dalaguete
46 garcia park es bohol talibon
47 getafe central es bohol jetafe
48 gibitngil is cebu medellin
49 hanopol es bohol balilihan
50 ilocanos es san fernando city city of san fernando (capital)
51 jose chona jo es (cambuhawe) cebu balamban
52 kagsing es cebu ginatilan
53 kal-anan es cebu tabogon
54 kalangahan es cebu tuburan
55 kanlungcab ps cebu tabuelan
56 kinan-oan es bohol trinidad
57 labogon es mandaue city mandaue city
58 langtad es cebu argao
59 lantag es ilocos sur santa cruz
60 lila central es bohol lila
61 lipata central es cebu minglanilla
62 luna central school la union luna
63 madridejos central es cebu madridejos
64 magcalape es cebu asturias
65 maguikay es mandaue city mandaue city
66 malacorong ps cebu argao
67 mandaue city cs mandaue city mandaue city
68 mandaue city cs sped center mandaue city mandaue city
69 mandaug es bohol calape
70 mangga es cebu tuburan
71 maoasoas es la union pugo
72 mohon es cebu sogod
73 monta�a ps bohol baclayon
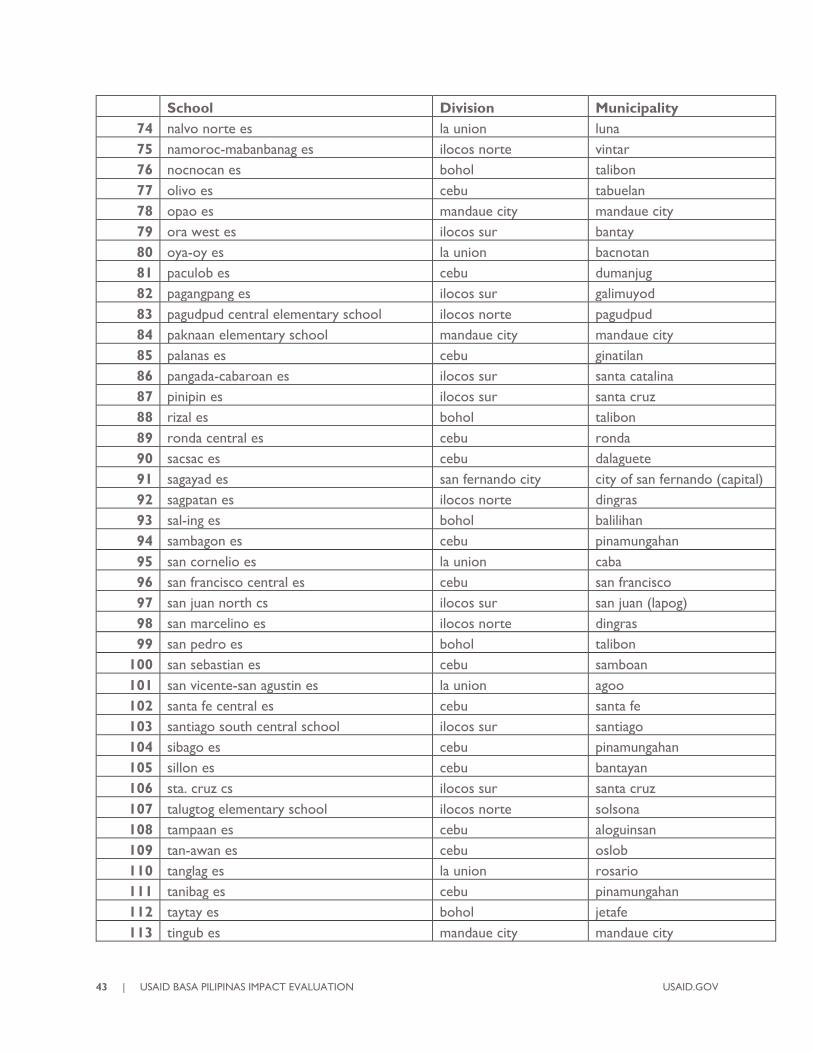
43 | USAID BASA PILIPINAS IMPACT EVALUATION USAID.GOV
School Division Municipality
74 nalvo norte es la union luna
75 namoroc-mabanbanag es ilocos norte vintar
76 nocnocan es bohol talibon
77 olivo es cebu tabuelan
78 opao es mandaue city mandaue city
79 ora west es ilocos sur bantay
80 oya-oy es la union bacnotan
81 paculob es cebu dumanjug
82 pagangpang es ilocos sur galimuyod
83 pagudpud central elementary school ilocos norte pagudpud
84 paknaan elementary school mandaue city mandaue city
85 palanas es cebu ginatilan
86 pangada-cabaroan es ilocos sur santa catalina
87 pinipin es ilocos sur santa cruz
88 rizal es bohol talibon
89 ronda central es cebu ronda
90 sacsac es cebu dalaguete
91 sagayad es san fernando city city of san fernando (capital)
92 sagpatan es ilocos norte dingras
93 sal-ing es bohol balilihan
94 sambagon es cebu pinamungahan
95 san cornelio es la union caba
96 san francisco central es cebu san francisco
97 san juan north cs ilocos sur san juan (lapog)
98 san marcelino es ilocos norte dingras
99 san pedro es bohol talibon
100 san sebastian es cebu samboan
101 san vicente-san agustin es la union agoo
102 santa fe central es cebu santa fe
103 santiago south central school ilocos sur santiago
104 sibago es cebu pinamungahan
105 sillon es cebu bantayan
106 sta. cruz cs ilocos sur santa cruz
107 talugtog elementary school ilocos norte solsona
108 tampaan es cebu aloguinsan
109 tan-awan es cebu oslob
110 tanglag es la union rosario
111 tanibag es cebu pinamungahan
112 taytay es bohol jetafe
113 tingub es mandaue city mandaue city

USAID.GOV USAID BASA PILIPINAS IMPACT EVALUATION | 44
School Division Municipality
114 tonoton es ilocos norte piddig
115 trinidad central es bohol trinidad
116 tubigagmanok es cebu asturias
117 tuble es cebu moalboal
118 union es bohol ubay
119 upper tunghaan es cebu minglanilla
120 vito es cebu minglanilla
121 yati es cebu liloan
122 zaragosa es cebu badian

45 | USAID BASA PILIPINAS IMPACT EVALUATION USAID.GOV
ANNEX 3 – POWER CALCULATIONS
The following assumptions were used to determine the number of schools and students in the sample:
• Clustering: intra-cluster correlation(ICC)=0.1762 (the highest ICC reported by EDC from their
most recent EGRA testing for the 2015 evaluation report)
• Power: 80%
• Significance Level: 95% (using a two-sided test)
• Correlation between baseline and outcome measures: 30% (a conservative estimate based on the
findings of several reading assessment studies across developing countries that have examined the
variables that impact student reading scores, including a recent EGRA study conducted by SI in
Malawi which identified access to books at home, socioeconomic status, and absenteeism as having
large impacts on student reading scores.26)
• Attrition: 16.67% (a very high estimate, which we expect to be much lower, likely less than 5% in
practice, though maintaining a high estimate initially ensures we do not underpower the study due
to larger than anticipated attrition). To keep attrition as low as possible, we are collecting
household data, including various points of contact for each student, so that if students drop out
or change schools, we should still be able to track them. For any students that migrate and are no
longer reachable, we can perform analysis using baseline data to determine if there are any
covariates that predict migration (including treatment), and control for these factors in future
analyses.
26 USAID Malawi. (2010). Early Grade Reading Assessment: National Baseline Report.
<www.eddataglobal.org/reading/index.cfm/Malawi%20National%20Baseline%20EGRA%202010.pdf?fuseaction=throwpub&ID=35
4>.

USAID.GOV USAID BASA PILIPINAS IMPACT EVALUATION | 46
ANNEX 4 – INSTRUMENTS
Student Items27
Student background
1. [Code student gender] O Male O Female
2. What is your age? _____
3. What language to you speak most at home? (Don’t read these options to the student. If the student
is slow to respond, wait up to 8 seconds before prompting “what language do you speak when you talk
to your mother, father, siblings, etc.?).
a. Ilokano
b. Cebuano
c. Filipino
d. English
e. Other, please specify____________________________________
f. Refuse to respond
4. What language do you usually speak with your friends?
a. Ilokano
b. Cebuano
c. Filipino
d. English
e. Other, please specify_______________________________
f. Refuse to respond
5. Did you attend Kindergarten?
a. No
b. Yes
c. Don’t know
d. Refused
Reading
6. Does anyone at home read to you?
a. No (Skip to QUESTION 8)
b. Yes
c. Don’t know (Skip to QUESTION 8)
d. Refuse to answer (Skip to QUESTION 8)
7. How often does someone at home read to you?
a. Hardly ever
b. Only sometimes
c. 2-3 times a week
d. Every day
e. Don’t know
f. Refuse to answer
8. Do you read on your own at home?
27 These items were requested of students alongside EGRA and EGMA instruments. The EGRA and EGMA tools are omitted,
since they are too long to practically include. These tools are available upon request.

47 | USAID BASA PILIPINAS IMPACT EVALUATION USAID.GOV
a. No
b. Yes
c. Don’t know
d. Refuse to answer
9. Do you do homework at home?
a. No (Skip to QUESTION 11)
b. Yes
c. Don’t know (Skip to QUESTION 11)
d. Refuse to answer (Skip to QUESTION 11)
10. Does anyone at home help you with your homework?
a. No
b. Yes
c. Don’t know
d. Refuse to answer
11. How do you feel about reading?
a. Happy
b. Neutral
c. Unhappy
d. Don’t know
e. Refuse to answer
Feelings about school
12. Do you feel happy or sad about coming to school?
a. Happy
b. Sad
c. Don’t know
d. Refuse to answer
13. How much do you think you learn at school?
a. Not anything
b. Not much
c. Some
d. A lot
e. Don’t know
f. Refuse to answer
14. Do you think school is boring?
a. No
b. Sometimes
c. Yes
d. Don’t know
e. Refuse to answer

USAID.GOV USAID BASA PILIPINAS IMPACT EVALUATION | 48
TEACHER SURVEY
Start Time/End Time: _______________________________
Region: O Region I O Region VII
Division: ___________________________________________
District: ____________________________________________
Barangay: __________________________________________
DepEd School ID: ___________________________________
Survey Date: _______________________________________
Enumerator ID: _____________________________________
Grade: O Grade 1 O Grade 2 O Grade 3
This classroom is: O Mixed Level O High Performing O Low Performing
Note to administrator: O =single choice allowed =Multiple choice allowed
Hi, my name is _____________, and I am from TNS, an independent data collection firm working with
USAID and the Department of Education (DepEd) in the Philippines. We are conducting a study to
assess the impact of a project that supports teachers and schools in their efforts to teach children using
the mother tongue. This school and your classroom has been selected through a process of statistical
sampling to take part in this study. Your participation would involve an interview lasting approximately
30 minutes, followed by observation of your classroom throughout the day. The results of our analysis
will be used by DepEd and USAID to help identify additional support that is needed to help ensure that
all children in the Philippines become good readers.
If you choose to participate, your responses will be strictly confidential. Your responses will be
combined with those from other schools in the study and presented in the form of summary tables.
Neither you nor your school will be individually identified or named in the report. There are no
anticipated risks or benefits to you personally for participating in this study, though information
collected in this study may benefit others in the future by helping to identify areas where additional
support is needed.
You do not have to participate if you do not wish to. Once we begin, if you don’t want to answer a
question, that’s ok.
STOP: ADMINISTER CONSENT DOCUMENT

49 | USAID BASA PILIPINAS IMPACT EVALUATION USAID.GOV
Do you have any questions? Do you agree to participate?
CONSENT STATEMENT: I understand and agree to participate in this reading research study.
SIGNATURE _________________________________________________________________
Please feel free to contact Yazmin Tolentino (63(2)5484577) or James Fremming from Social Impact
(001703-465-1884 ext.208) at should you have questions about the study.
Was consent obtained? O Yes O No
1. Teacher’s Sex: O Male O Female
2. Teacher Name: First ___________ Middle_______________ Last______________________
3. What is your age? _______ years
4. What is the highest academic degree you have received?
O Diploma O Bachelor’s Degree
O Higher Diploma (Post-graduate) O Master’s Degree
O Doctorate Degree O Other (specify) :_________________
O Don’t know O Refuse
5. What is your professional status?
O Holder of DepEd regular/plantilla post
O LGU-funded (MLGU, BLGU)
O Community-recruited and paid teacher (PTA, other stakeholders)
O Volunteer
O Don’t know
O Refuse
6. What is your native language? (Native language is the one that has been used most since birth).
O [Ilokano/Cebuano]
O Filipino/Tagalog
O English
O Other Please list: ___________________________
O Don’t know

USAID.GOV USAID BASA PILIPINAS IMPACT EVALUATION | 50
O Refuse
7. Are you familiar with grammar rules, alphabet sounds, spelling, and pronunciation in [Ilokano/Cebuano]?
O Very O Somewhat O Not at all O Don’t know O Refuse
8. How long have you been teaching? (includes all types of schools)
______ years ______ months
9. How many years have you been teaching using [Ilokano/Cebuano] as the main medium of instruction?
O This is the first year O 2 years (this year and last) O More than 2 years
O Don’t know O Refuse
10. a. Have you attended any in-service training or professional development sessions on early grade reading and
writing either this school year or last school year?
O Yes O No [ to 11] O Don’t know [ to 11] O Refuse
b. About how many training days did you receive in total over the past school year?
______ days
c. How many of these training days, if any, were for mother tongue reading instruction?
______ days
d. Who facilitated the training(s)? (Do not prompt, select all that respondent mentions).
USAID Basa Pilipinas/EDC
DepED
NGO or community organization
Private sector/company
Church or religious institution
Other: Please list: _____________________________
O Don’t know O Refuse
11. What is the main language of instruction (Medium of Instruction/MOI) used in your classroom?
O [Ilokano/Cebuano]
O Filipino/Tagalog
O English
O Other Please list: ______________________________
12. How much time each day is spent using the following languages?

51 | USAID BASA PILIPINAS IMPACT EVALUATION USAID.GOV
[Ilokano/Cebuano] hours _____ minutes_____
Filipino/Tagalog hours _____ minutes_____
English hours _____ minutes_____
Other Please list: __________________ hours _____ minutes_____
13. Do you have a copy of each of the K to 12 curricula in Mother Tongue, Filipino and English that you can
consult regularly?
For Mother Tongue O Yes O No
For Filipino O Yes O No
For English O Yes O No
14. Do you have a copy of the DepEd Teacher’s Manual for [grade]?
O Yes O No O Don’t know O Refused
15. How many reading learners’ manuals in [mother tongue] do you have for your students at present?
O None
O Enough so that each student has one
O Enough so that 2 students share one book
O Enough so that 3 students share one book
O 4 or more students have to share a book
16. How many reading learners’ manuals in Filipino do you have for your students at present?
O None
O Enough so that each student has one
O Enough so that 2 students share one book
O Enough so that 3 students share one book
O 4 or more students have to share a book

USAID.GOV USAID BASA PILIPINAS IMPACT EVALUATION | 52
17. How many other reading materials, apart from learners’ manuals (for instance, picture books, story cards,
and so on) do you have for your students in [mother tongue]?
O None
O Enough so that each student has one
O Enough so that 2 students share one book
O Enough so that 3 students share one book
O 4 or more students have to share a book
18. How many other reading materials, apart from learners’ manuals (for instance, picture books, story cards,
and so on) do you have for your students in Filipino?
O None
O Enough so that each student has one
O Enough so that 2 students share one book
O Enough so that 3 students share one book
O 4 or more students have to share a book
19. Do you ever use lesson plans? If so, how often?
O No, never
O Yes, sometimes
O Yes, most of the time
O Yes, always
20. Please rate your level of comfort providing instruction in [Ilokano/Cebuano]:
O Not at all comfortable
O Slightly comfortable
O Moderately comfortable
O Very comfortable
O Don’t know

53 | USAID BASA PILIPINAS IMPACT EVALUATION USAID.GOV
O Refused
21. Do you put students into smaller groups by their reading level?
O Yes O No
b. If YES, how often do put them in groups:
O Once a year O 1-3 times a year O Every month O Multiple times a month
c. If YES, how much of the literacy instruction time is conducted in smaller groups?
O All the time O Most of the time O Some of the time O Not very often
22. Do you maintain written attendance records?
O Yes O No O Refused
Observe student records and note whether they are:
O Fully complete O Mostly complete O Partially complete O Records not available
23. Do you read for pleasure outside the classroom?
O Yes, 1 or 2 times a week
O Yes, 3 times a week or more
O No
O Don’t know
O Refuse
24. Do you regularly read any of the following? (select all that apply)
Newspapers or magazines Websites
Bible, Koran, or other religious text Email or text messages
Novels Professional materials
Other (specify):______________
O Don’t know O Refuse

USAID.GOV USAID BASA PILIPINAS IMPACT EVALUATION | 54
25. Is there a place in your community where you can borrow books to read (a library or reading center)?
O Yes O No O Don’t know O Refuse
26. In the last six months, have you borrowed books from a library or reading center?
O Yes O No O Don’t know O Refuse
I. Classroom literacy environment
27. There are reading materials in the
classroom in these languages:
[Select all that apply]
[Ilokano/Cebuano] ........................................................................ 1
English .............................................................................................. 2
Filipino/Tagalog .............................................................................. 3
Other local .................................................................................... 4
28. If there are [Ilokano/Cebuano]
materials around the classroom,
how many are visible (displayed
on walls):
None ............................................................................................... 0
Few (1 -3) ...................................................................................... 1
Some (between 3 and 8) ............................................................ 2
Many (more than 8) ..................................................................... 3
29. Children have their own books
corresponding to the subject to
be observed
None ................................................................................................ 1
Some ................................................................................................ 2
All ...................................................................................................... 3
30. If some or all children have
subject-matter books, which
language are they in?
[Ilokano/Cebuano] ........................................................................ 1
English .............................................................................................. 2
Filipino/Tagalog .............................................................................. 3
Other local ..................................................................................... 4
31. If we would like to hear more from you or if a follow up is required, could we contact you again in
the near future?
Contact information: _________________________________
THANK YOU VERY MUCH FOR YOUR TIME!

55 | USAID BASA PILIPINAS IMPACT EVALUATION USAID.GOV
TEACHER OBSERVATION FORM
Region: O Region I O Region VII
DepEd School ID: ___________________________
Survey Date: _______________________________
Start Time/End Time: ________________________
Enumerator ID: _____________________________
Grade: O Grade 1 O Grade 2 O Grade 3
Teacher Name: First ___________ Middle_______________ Last_____________________
Teacher’s Sex: O Male O Female
II. Observation Protocol (To be completed for each of the 3 lessons observed)
Select the subject to be observed:
(Note: reading or language class preferred,
social studies is second best option)
[Ilokano/Cebuano] ....................................................................... 1
English ............................................................................................. 2
Filipino ............................................................................................ 3
Social studies (AP) ....................................................................... 4
Math ................................................................................................ 5
MAPEH ........................................................................................... 6
Other (Specify) ______________________________ -98
What is the main language of instruction
in this subject
[Ilokano/Cebuano] ....................................................................... 1
English ............................................................................................. 2
Filipino/Tagalog ............................................................................. 3
How many girls are present? ________________
How many boys are present? ________________

USAID.GOV USAID BASA PILIPINAS IMPACT EVALUATION | 56
TEACHER BEHAVIOR
OBSERVED
1
Do not see
the
behavior
described
2
See the
behavior
sometimes
or partially
correct
3
See the
behavior done
very well and
consistently
where
appropriate
4
Behavior is
not relevant
to the subject
being taught
1. Connects to what learners have
learned previously
2. Manages instructional time
effectively
3. Demonstrates effective
classroom management skills
4. Makes effective use of different
instructional resources and
strategies
5. Treats all students equally/fairly
6. Engages learners in carefully
planned cooperative learning
strategies
7. Asks probing, open-ended
questions
8. Provides learners with structured
opportunities to apply their
understanding and skills to
everyday life and problems
9. Provides opportunities for
learners to develop higher-
order and critical thinking
skills
10. Uses appropriate learning
materials besides textbooks
11. Assesses pupil learning
BIAS or MISTREATMENT

57 | USAID BASA PILIPINAS IMPACT EVALUATION USAID.GOV
TEACHER BEHAVIOR
OBSERVED
1
Do not see
the
behavior
described
2
See the
behavior
sometimes
or partially
correct
3
See the
behavior done
very well and
consistently
where
appropriate
4
Behavior is
not relevant
to the subject
being taught
12. Avoids using gender biased
language
13. Avoids using abusive language
14. Provides positive, encouraging
feedback
15. Does not allow learners to use
gender biased language
16. Does not allow learners to use
abusive language
17. Promotes equal access to
desks, learning materials, etc.
especially for girls
READING PRACTICE
(May need to mark Option 4 for many
of these, if not observing a reading
class)
18. Engages learners in reading
activities or games appropriate to
their reading level
19. Encourages learners to “sound
it out” when they don’t know a
word
20. Avoids criticizing learners who
don’t answer correctly or read
poorly
21. Asks learners pre-reading
questions such as “What do
you think the story will be about

USAID.GOV USAID BASA PILIPINAS IMPACT EVALUATION | 58
TEACHER BEHAVIOR
OBSERVED
1
Do not see
the
behavior
described
2
See the
behavior
sometimes
or partially
correct
3
See the
behavior done
very well and
consistently
where
appropriate
4
Behavior is
not relevant
to the subject
being taught
based on the pictures and/or title
of the book?” when learners
themselves or teacher reads a
story.
22. Asks learners to make appropriate
sounds or act something out,
such as the roar a lion makes or the
way a frog hops after learners
themselves or teacher read a story.
23. Applies multiple methods to
support comprehension,
including games, group work, etc.
24. Encourages learners to help
each other
25. Asks individual learners to read
aloud
26. Provides instructions on how to
decode syllables and words
27. Teaches learners meanings of
new words
28. Asks learners questions to assess
their understanding of something
the learner(s) or teacher
have/has read
29. Asks learners questions to assess
their understanding of stories
they hear
30. Asks learners to recognize
letters and say letter names
and/or sound

59 | USAID BASA PILIPINAS IMPACT EVALUATION USAID.GOV
TEACHER BEHAVIOR
OBSERVED
1
Do not see
the
behavior
described
2
See the
behavior
sometimes
or partially
correct
3
See the
behavior done
very well and
consistently
where
appropriate
4
Behavior is
not relevant
to the subject
being taught
31. Allows learners to retell the story
they have read or read by their
teacher.
32. Asks learners to recite the
alphabet
33. Assigns reading for learners to
do on their own during school
time
34. Provides a variety of methods for
learners to establish good
writing skills (includes both
composition skills such as dictating
stories, expressing stories through
pictures, and explaining how writing
helps us communicate, as well as
mechanical writing such as letter
and word scripting, tracing, etc.)
PUPIL BEHAVIOR
35. Most learners are actively
engaged in the lesson
36. Most learners are actively
engaged when working in small
groups or in pairs
37. Learners appear to understand
what the teacher is saying
III. Lesson Summary Questions
At the end of the observation, answer the following questions based on your impression of the overall
lesson content. Circle the number that corresponds to the answer in the column at left.

USAID.GOV USAID BASA PILIPINAS IMPACT EVALUATION | 60
How consistently did the teacher use
[language] during the lesson?
None .................................................................................................................. 0
Very little (1-25%)........................................................................................... 1
Some of the time (25-75%) .......................................................................... 2
Most of the time (75-95%) ........................................................................... 3
All or nearly all of the time (95-100%) ...................................................... 4
How consistently did the students use
[language] during the lesson?
None .................................................................................................................. 0
Very little (1-25%)........................................................................................... 1
Some of the time (25-75%) .......................................................................... 2
Most of the time (75-95%) ........................................................................... 3
All or nearly all of the time (95-100%) ...................................................... 4
How actively did students participate in the
lesson?
Pupils participated when called on but did not volunteer .................... 1
Pupils participated when called on and
some pupils volunteered ............................................................................... 2
Most pupils participated actively (including showing a willingness to
ask and answer questions, make guesses.) ............................................... 3
How did the teacher support the pupils’
understanding and use of [language]?
Multiple responses allowed
Did not use or support the use of [language].......................................... 0
By code-switching in a different language ................................................. 1
By modeling the proper language use for pupil to repeat or emulate.
............................................................................................................................. 2
By scolding or punishing pupils for lack of or incorrect use of the
language. ............................................................................................................ 3
By praising or rewarding pupils for using the language appropriately
............................................................................................................................. 4
By pointing out or correcting language errors and misunderstandings
............................................................................................................................. 5
By monitoring comprehension (e.g. ‘Do you understand?’ ‘Is that
helpful?’ Need more explanation?) ............................................................. 6
By using simpler language to explain more difficult language. .............. 7
Using visual aids like pictures and charts .................................................. 8
Other (specify below) .................................................................................... 9
If the teacher used a different language
during the class (code-switching), what
language was used?
Multiple responses allowed
[Ilokano/Cebuano] .......................................................................................... 1
English ................................................................................................................ 2
Filipino/Tagalog ................................................................................................ 3
Other local language ...................................................................................... 4
Not applicable .................................................................................................. 5
If the teacher used a different language
during the class (code-switching), why was
it used?
To clarify/emphasize a concept explained first in [language] ............... 1
To introduce a concept before introducing it in [language] ................ 2
To give procedural directions...................................................................... 3
To discipline ..................................................................................................... 4
Other (Specify below) ................................................................................... 5
Not applicable .................................................................................................. 6

61 | USAID BASA PILIPINAS IMPACT EVALUATION USAID.GOV
PRINCIPAL SURVEY
Symbols used in this booklet:
Silent reading: instructions for the assessor
(Move on)
Note to administrator: O =single choice allowed =Multiple choice allowed
Questions to fill out before beginning the survey
1. Province Name: O Bahol O Cebu O Ilocos Norte O Ilokos Sur
O La Union O Mandaue City
2. School Name: _________________________________________
3. DepED School ID _________________________________________
4. Municipality Name _________________________________________
5. Barangay Name _________________________________________
6. Type of school Elementary Central Integrated
7. Enumerator ID _________________________________________
8. School GPS Coordinates _________________________________________
9. Survey Date (mm/dd/yyyy): _________________________________________
10. Time survey started: _________________________________________
STOP: ADMINISTER CONSENT DOCUMENT
As previously mentioned, I am from [DATA COLLECTION FIRM], an independent data collection
firm working with USAID and the Department of Education (DepEd) in the Philippines. We are
conducting a study to assess the impact of a project that supports teachers and schools in their
efforts to teach children using the mother tongue. This school has been selected through a process
of statistical sampling to take part in this study, which will involve an interview with you. The results
of our analysis will be used by DepEd and USAID to help identify additional support that is needed
to help ensure that all children in the Philippines become good readers.
If you choose to participate, your responses will be strictly confidential. Your responses will be
combined with those from other schools in the study and presented in the form of summary tables.
Neither you nor your school will be individually identified or named in the report. There are no
anticipated risks or benefits to you personally for participating in this study, though information

USAID.GOV USAID BASA PILIPINAS IMPACT EVALUATION | 62
collected in this study may benefit others in the future by helping to identify areas where additional
support is needed. The interview will last approximately 45 minutes. We will return to this school
at the end of this school year and the end of next school year to repeat the same procedures.
You do not have to participate if you do not wish to. Once we begin, if you don't want to answer a
question, that's ok.
Do you have any questions? Do you agree to participate?
CONSENT STATEMENT: I understand and agree to participate in this reading research study.
SIGNATURE: _______________________________________________________
Please feel free to contact Yazmin Tolentino (63(2)5484577) or James Fremming from Social Impact
(001-703-465-1884 ext.208) at should you have questions about the study.
11. Check box if consent is obtained: O Yes O No
12. What is the gender of the respondent? O Male O Female
13. What is your name? "Please be advised that all your responses will be kept confidential and will not
be individually linked to your school, nor will it show up in our report. We will, however, request
for your full name for the purpose of re-visiting the school later this school year and next school
year."
First Name ___________________________
Middle Name ___________________________
Last Name ___________________________
14. What is your designation at this school?
O School Head/Principal

63 | USAID BASA PILIPINAS IMPACT EVALUATION USAID.GOV
O Teacher-in-Charge
O Assistant Principal
O Other (specify) __________________
15. How long have you been in your position as School Head/Principal/TIC or Assistant Principal (years
and months)?
Number of Years: Number of months:
16. May I know what is your highest level of qualification?
O Less than Bachelor’s O Bachelor’s Degree O Master’s Degree O Doctorate
17. Have you received special training or taken courses in school management?
O Yes O No [ to Q.19] O Don’t know [ to Q.19]
18. If yes, how many training days in school management did you receive in total over the past school
year?
Days: O Don’t know
19. In the last four weeks, how many days were you.... (answer each option, for 0 enter 0)
Physically present at school
Officially away
Sick/personal leave
Public/Non-working holiday
Other________________
20. What was the first day of school this school year? Month _____ Day _____ Year _2015_
21. Since the start of the current school year, was this school closed or were there days when classes
were not being taught, during the regular school calendar (other than holidays)?
O Yes O No [ to Q.24] O Don’t Know [ to Q.24]
22. If yes, how many days was school closed or were classes not being taught?

USAID.GOV USAID BASA PILIPINAS IMPACT EVALUATION | 64
Number of Days: O Don’t know
23. Why was the school closed?
Professional days Natural disaster
Other______________
24. A: At what time does the school day start?
Hours Minutes
24. B: At what time does the school day end?
Hours Minutes
25. How many minutes are allocated for assembly, break and lunch each day? (enter 0, for 0 minutes)
Assembly (Minutes)
Breaks (Minutes)
Lunch (Minutes)
26. What is the highest grade instructed at this school? Grade: ___________
27. What is the lowest grade instructed at this school? Grade: ___________
Teachers at the School
28. How many of the following teachers are currently employed at your school?
Grade 1 Grade 2 Grade 3 Grade 4 Grade 5 Grade 6
Plantilla (DepEd payroll)
Teachers
Volunteer Teachers
Local Government Paid
Teachers
Other
Total
65 | USAID BASA PILIPINAS IMPACT EVALUATION USAID.GOV
29. How many of the following teachers are female?
Grade 1 Grade 2 Grade 3 Grade 4 Grade 5 Grade 6
Plantilla (DepEd payroll)
Teachers
Volunteer Teachers
Local Government Paid
Teachers
Other
Total
30. How many plantilla teachers were absent today (or on the last day school was in session)?
[Enter 0, for 0]
Grade 1:
Grade 2:
Grade 3:
31. How many plantilla teachers arrived after the start of classes (late) today? [Enter 0, for 0]
Grade 1:
Grade 2:
Grade 3:
32. What do you do with a class whose teacher is absent? [DO NOT READ OPTIONS! JUST
MARK BASED ON ANSWER(S)]
Principal takes class
Let class proceed without the teachers
Join all the students in one class (under other teacher)
Assign a school volunteer
Other: _______________________________________

USAID.GOV USAID BASA PILIPINAS IMPACT EVALUATION | 66
33. Does your school take teacher attendance?
O Yes O No O Don’t know
34. Who records teacher attendance information?
Principal
Assistant Principal
Other (please specify):____________________
35. Could I please see your teacher attendance records for the previous month?
(How frequently was the attendance completed?)
Records not available O
Attendance completed DAILY O
Attendance completed WEEKLY O
Attendance completed BI-WEEKLY O
Attendance completed MONTHLY O
Other (please specify): ______________O
36. Do you have a copy of each of the K to 12 (or applicable grades) curricula in Mother Tongue,
Filipino and English that teachers can consult regularly?
For Mother Tongue O Yes O No
For Filipino O Yes O No
For English O Yes O No
37. How many Grade 1, Grade 2 and Grade 3 teachers have been trained in the current mother
tongue-based DepEd curriculum?
Grade 1:_______ Grade 2:_______ Grade 3:_______
38. Who provided this training?

67 | USAID BASA PILIPINAS IMPACT EVALUATION USAID.GOV
O DepEd
O USAID Basa Pilipinas/EDC
O Other, specify: _________________
39. Do you or one of your staff check teachers’ lesson/log plans? If so, how frequently?
No, never O
Yes, once a year O
Yes, 2-3 times a year O
Yes, 1-2 times every month O
Yes, once every week O
Yes, 2-3 times a week O
Yes, daily O
Other O
Don’t know O
40. How often do you visit / observe classrooms?
Never O
Once a year O
Yes, 2-3 times a year O
1-2 times every month O
Once every week O
2-3 times a week O
Daily O
Others:_________________O
Don’t know O
School Resources and Facilities

USAID.GOV USAID BASA PILIPINAS IMPACT EVALUATION | 68
41. At the beginning of this school year, did your school have textbooks or learners manuals for
Grade 1, Grade 2 and Grade 3 students in the appropriate language of instruction, according to
current DepEd MTB-MLE policy? [If yes to all to Q.43]
Grade 1: O Yes O No
Grade 2: O Yes O No
Grade 3: O Yes O No
42. If NO, how long after the beginning of the school year did you receive the appropriate
textbooks or learners manuals?
Grade 1: Months: __________ Weeks: _________
Grade 2: Months: __________ Weeks: _________
Grade 3: Months: __________ Weeks: _________
43. At the beginning of this school year, did your school have the appropriate number of
textbooks or learners manual for all your Grade 1, Grade 2, and Grade 3 students, according to
current Department of Education (DepEd) policy? [If yes to all, to Q.45]
Grade 1: O Yes O No
Grade 2: O Yes O No
Grade 3: O Yes O No
44. If NO, how long after the beginning of the school year did you receive the missing textbooks or
learners manuals?
Grade 1: Months: __________ Weeks: _________
Grade 2: Months: __________ Weeks: _________
Grade 3: Months: __________ Weeks: _________
45. Do you have a school library?
Yes O No O [ to Q.47] Don’t know O [ to Q.47]
46. How frequently does a class visit a library?
_____ times per _______

69 | USAID BASA PILIPINAS IMPACT EVALUATION USAID.GOV
47. Can the children read library books in the following locations? [READ OUT OPTIONS AND
CHECK ALL THAT APPLY]
Yes No
In the school library O O
In the classroom O O
At home O O
In other school locations O O
48. How many Grade 1 and Grade 2 classrooms does this school have? (Refers to physical
space, defining classroom as a space divided by walls on all sides and a door).
Grade 1: _________ Grade 2: __________ Grade 3: __________
49. Do any classes or grades share a classroom?
Yes O No O [ to Q.51]
50. If yes, please explain: _____________________________________________
51. Do you have communal or classroom toilets? [CHECK ALL THAT APPLY]
Communal toilets [If unchecked, to Q.53]
Classroom toilets
Other:_______________________
52. Are your communal toilets separate for boys and girls?
Yes O No O Other(s)__________________
53. Does this school have electricity?
Yes O No O [ to Q.55]
54. If yes, what type of electricity? [CHECK ALL THAT APPLY]
Grid supply Generator Solar power
55. How often does this school have electricity?
O Reliable O Usually O Rarely
56. Does this school have water supply?
Yes O No O [ to Q.58]
57. If yes, what type of water supply does this school have? [CHECK ALL THAT APPLY]

USAID.GOV USAID BASA PILIPINAS IMPACT EVALUATION | 70
Local Piped Water Well/Deep Well
Rainwater Catchment Natural Source
58. Is there a school feeding program?
Yes O No O [ to Q.61]
59. If yes, is the feeding program offered every day?
Yes O No O [ to Q.61]
60. What time of day does the feeding program occur?
Before school O Middle of the day O After school O
61. Does this school have one or more computers?
Yes O No O [ to Q.64]
62. If yes, how many computers? ___________
63. Who can use the computer(s)?
Principal Teachers Students
64. Does this school have internet?
Yes O No O [ to Q.66]
65. If yes, who can use the internet?
Principal Teachers Students
66. Building materials:
Steel Concrete Wood Nipa

71 | USAID BASA PILIPINAS IMPACT EVALUATION USAID.GOV
Flooring
Roofing
Walls
Building condition:
Excellent Good Fair Poor
Flooring
Roofing
Walls
Community Involvement in the School
67. Is there a Parent Teachers Association (PTA) at this school?
Yes O No O [ to Q.73] Don’t know O [ to Q.73]
68. If yes, how many times did the PTA meet in this past school year?
Number of Days
69. On average, what percent of the pupils’ parents and guardians did you meet with during the
school year?
About less than 25% of parents O
About 26% to 50% of parents O
About 51% to 75% O
About 76% to 100% O
Don’t know/remember O
70. What are the roles of the PTA at your school? [DO NOT READ OUT OPTIONS AND
CHECK ALL THAT APPLY]
Discuss school management problems
Discuss students’ problems and solutions
Manage partnerships with organizations
Review progress of school improvement efforts
Approve school policy
Manage school infrastructure and equipment
Discuss school curriculum
Raise funds (for materials, construction, etc.)

USAID.GOV USAID BASA PILIPINAS IMPACT EVALUATION | 72
Manage procurement or distribution of textbooks
Implement/build PTA infrastructure projects
Other (specify): __________________________
Don’t know
71. How satisfied are you with the level of support the PTA provides to the school?
Very Satisfied O
Satisfied O
Somewhat Satisfied O
Not satisfied O
Don’t know O
72. How satisfied are you with parents’ (PTA or non-PTA) involvement in their children’s school
work?
Very Satisfied O
Satisfied O
Somewhat Satisfied O
Not satisfied O
Don’t know O
73. What types of DepEd officials (roles) visited your school in the last school year (July 2013-March
2014)? [CHECK ALL THAT APPLY-CROSS CHECK WITH LOG BOOK]
District Supervisors
Other Supervisors
Medical staff
Engineers
Other_____________
74. What activities have DepEd officials undertaken during his or her visits? [DO NOT READ
RESPONSES – CHECK ALL THAT APPLY]
No visit
Check the school’s financial records and lesson plans
Check the infrastructure (water, toilets, etc.)
Sit in the class and observe a class in session
Check recent student assessment tests and evaluation processes
Provide information on curriculum innovations
Provide information on professional development opportunities

73 | USAID BASA PILIPINAS IMPACT EVALUATION USAID.GOV
Give advice on school health and sanitary practices
Give advice to principals
Other__________________________________________________
75. Do teachers in your school participate in LAC (Learning Action Cells)?
Yes O No O [ to Q.78] Don’t know O [ to Q.79]
76. If yes, what role do you play in convening the Learning Action Cell at your school?
Lead Instructor O
Overseer or Manager O
Observer O
Other(s):______________ O
77. If yes, how often do the teachers convene for the Learning Action Cell?
Never O
Once a year O
Yes, 2-3 times a year O
1-2 times every month O
Once every week O
2-3 times a week O
Daily O
Don’t know O
Others:________________ O
78. If no, why not? [DO NOT READ RESPONSES – CHECK ALL THAT APPLY]
School does not have one
Teachers do not have time
Teachers do not like the notion of a LAC
Not enough teachers in school to engage in a LAC
Other(s)________________________________________________
79. Has your school ever undergone an Early Grade Reading Assessment (EGRA) test in the past?
O Yes O No [ to Q.81] O Don’t know [ to Q.81]
80. If yes, when did your school undergo an Early Grade Reading Assessment (EGRA) in the past?
Year___________ Month_________________
81. Is this school receiving support from any organizations, programs, or businesses other than
DepEd or Local Government?
O Yes O No [ to Q.83] O Don’t know [ to Q.83]
82. If yes, who is providing support? __________________________________

USAID.GOV USAID BASA PILIPINAS IMPACT EVALUATION | 74
Now we would like to review your enrollment and attendance records.
Student Enrollment, Attendance and Dropout
83. Enrollment (observe in records):
Grade 1 Grade 2 Grade 3 Grade 4 Grade 5 Grade 6
M F M M M M M F M F M F
Section 1
Section 2
Section 3
Section 4
Section 5
84. How are Grade 1 students assigned to sections? (Applies only if the school has more than
one Grade 1 section)
O Randomly assigned to a section
O Assigned to section based on ability/level
O Assigned to section based on some other criteria.
Specify: __________________________________________
85. How are Grade 2 students assigned to sections? (Applies only if the school has more than
one Grade 1 section)
O Randomly assigned to a section
O Assigned to section based on ability/level
O Assigned to section based on some other criteria.
Specify: __________________________________________
86. How are Grade 3 students assigned to sections? (Applies only if the school has more than
one Grade 1 section)
O Randomly assigned to a section
O Assigned to section based on ability/level
O Assigned to section based on some other criteria.
Specify: __________________________________________
87. If we would like to hear more from you or if a follow up is required, could we contact
you again in the near future?
Yes O No O [ to Q.89]
88. If yes, contact number: _____________________________________
75 | USAID BASA PILIPINAS IMPACT EVALUATION USAID.GOV
89. Was there a class / section excluded in the sampling for Grade 1? [DO NOT ASK PRINCIPAL.
JUST ANSWER BASED ON HOW SAMPLING WAS DONE EARLIER IN THE DAY,
CONSULT TEAM LEADER IF DON'T KNOW ANSWER.]
Yes O No O [ to Q.92]
90. If yes, how many? ______________________
91. If yes, why? ___________________________
92. Was there a class / section excluded in the sampling for Grade 2? [DO NOT ASK PRINCIPAL.
JUST ANSWER BASED ON HOW SAMPLING WAS DONE EARLIER IN THE DAY,
CONSULT TEAM LEADER IF DON'T KNOW ANSWER.]
Yes O No O [ to Q.95]
93. If yes, how many? ______________________
94. If yes, why? ___________________________
95. Was there a class / section excluded in the sampling for Grade 3? [DO NOT ASK PRINCIPAL.
JUST ANSWER BASED ON HOW SAMPLING WAS DONE EARLIER IN THE DAY,
CONSULT TEAM LEADER IF DON'T KNOW ANSWER.]
Yes O No O [ to end]
96. If yes, how many? ______________________
97. If yes, why? ___________________________
Thank you very much!
Time Interview ended: _________________
Move on to student sampling.

USAID.GOV USAID BASA PILIPINAS IMPACT EVALUATION | 76
Basa Pilipinas Household Survey
The following information should be pre-coded into the survey, with as much information as possible auto-populating (only 1-6
must appear to the enumerator; 7-13 can be hidden, if preferred):
1. Division:____________________________
2. District:_____________________________
3. Barangay:___________________________
4. Name of Student:_____________________
5. Grade of Student:_____________________
6. Student ID number: ___________________
7. School ID Number:____________________
8. Enumerator ID:_______________________
9. Household ID: _______________________
10. Date:_______________________________
11. Time Start:__________________________
12. Time End: ___________________________
13. GPS Coordinates: _____________________

77 | USAID BASA PILIPINAS IMPACT EVALUATION USAID.GOV
Section A. Approaching the Household
Hi, <smile and greet the respondent>. My name is _____________, and I am from TNS, an independent data collection
firm working with USAID and the Department of Education (DepEd) in the Philippines. We are conducting a study to
assess the impact a project that supports teachers and schools in their efforts to teach children using the language
spoken at home. The first part of our study involved testing student reading abilities at randomly selected schools in or
near areas where the new education project is being implemented. [STUDENT’S NAME] was randomly selected to
take part in this study. We visited his/her school recently to assess his/her reading ability. But, now we want to
understand more about the various factors that may be affecting [STUDENT’S NAME]’s ability to read.
We would like to speak with the person who would be most knowledgeable about [STUDENT’S NAME]’s schooling.
14. Is the most knowledgeable person about [STUDENT’S NAME] schooling available?
a. No - (SCHEDULE A TIME TO RETURN TO THE HOUSEHOLD)
b. Yes - (SKIP TO SECTION B. CONSENT)
15. Visits:
Visit 1 Date:___________________ Time:_____________________ Result:_____________________
Visit 2 Date:___________________ Time:_____________________ Result:_____________________
Visit 3 Date:___________________ Time:_____________________ Result:_____________________
Final Visit Date:___________________ Time:_____________________
Result:_____________________
Total Number of Visits:________________________________________________________________
RESULT CODES
a. Primary Caregiver Available
b. Nobody at home or no one who is capable of responding.
c. Respondent asked to postpone the visit.
d. Respondent refused to participate.
e. Dwelling vacant or location not a dwelling.
f. Dwelling destroyed.
g. Dwelling not found.

USAID.GOV USAID BASA PILIPINAS IMPACT EVALUATION | 78
Section B. Consent of Respondent
Hi, <smile and greet the respondent>. My name is _____________, and I am from TNS, an independent data collection
firm working with USAID and the Department of Education (DepEd) in the Philippines. We are conducting a study to
assess the impact of a project that supports teachers and schools in their efforts to teach children using the language
spoken at home. The first part of our study involved testing student reading abilities at randomly selected schools in or
near areas where the new education project is being implemented. [STUDENT’S NAME] was randomly selected to
take part in this study as one of 4,320 students in the study. We visited his/her school recently to assess his/her reading
ability. But, now we want to understand more about the various factors that may be affecting [STUDENT’S NAME]’s
ability to read by visiting the households of each of these 4,320 students. We will ask you questions about the people
who live in your household, your student’s education, and your experiences with his/her school.
We would like your help in this. But you do not have to take part if you do not want to, and you are free to opt out of
any questions you do not feel comfortable answering. You may also end your participation in the study at any time
without consequence. If you decide to take part, your responses will be confidential. Your name will not be mentioned
anywhere in the survey data or report, and it will not be reported to DepEd or USAID. There are no anticipated risks
to you or your student for participating in this study. Although your participation will not benefit you personally, the
results of our analysis will be used by DepEd to help identify additional support that is needed to help ensure that all
children in the Philippines become good readers. However, your student’s name will not be included in this or any
report and will be kept confidential.
If you agree to help with this study, I will read you a consent statement and ask for your oral consent to participate in
the interview. This interview will take approximately 30 minutes to complete. Do you have any questions? Do you
provide your consent to begin?
CONSENT STATEMENT: I understand and agree to participate in this reading research study.
Please feel free to contact Yazmin Tolentino(63(2)5484577) or James Fremming from Social Impact (001-706-465-1884
ext. 208) should you have questions about the study.

79 | USAID BASA PILIPINAS IMPACT EVALUATION USAID.GOV
1. Household Roster: Please list each of the members who live in your household – including all the infants, children, adults, and
elderly. Please start with yourself.
1 2 3 4 5 6 7 8 9 10 11 12 If yes
to 11
13
Name (given
name and
surname)
What is
[NAME’s]
relationship
to the head of
household?
SEE
CODES
What is
[NAME’s]
relationship
to
[STUDENT’S
NAME]?
SEE
CODES
What is
[NAME’S]
sex? (Only
ask if not
obvious)
0: Male
1: Female
How old is
[NAME]?
GO TO
NEXT
PERSON
ON
ROSTER
if person is
under the
age of 2
Did [NAME]
attend school
this year?
(Only ask this
question is the
person is older
than 2)
0-No (SKIP
TO
COLUMN
9)
1-Yes
What level
of school did
he or she
attend this
year?
SEE
CODES
Did he or
she repeat
this year?
0 – No
1 - Yes
If column 6 is
coded with a
“0”, ask what is
the highest
level of
education
completed by
[NAME]?
SEE CODES
If the answer in
column 9 is coded
as less than 1 AND
column 6 is coded
as “0” ask “why
didn’t he/she
attend school this
year?”
If column 9 is coded
as 1-11 AND
column 6 is coded
as “0”, ask “why
did he or she drop
out of school?”
SEE CODES
Can [NAME]
read?
0 – No
1 – A little
(e.g. can
read signs
but not
books)
2 - Yes
If yes for
Col. 11,
then, ask:
Can
[NAME]
read a one
page letter
in any
language
0 – Not at
all
1 –Yes,
with
some
difficulty
2- Yes,
fluently
Is [NAME]
employed?
0-No, unemployed
1-No, retired
2-No, too young
to work
3-Yes, employed
4-Yes, self-
employed
A
B
C
D
E
F
G
H
I
J

USAID.GOV USAID BASA PILIPINAS IMPACT EVALUATION | 80
B. CODES FOR (Q1.3) RELATIONSHIP TO THE
STUDENT
1=FATHER OF STUDENT
2=MOTHER OF STUDENT
3=SIBLING OF STUDENT
4=GRANDFATHER OR GRANDMOTHER OF STUDENT
5=COUSIN OF STUDENT
6=UNCLE OF STUDENT
7=AUNT OF STUDENT
8=SISTER-IN-LAW OF STUDENT
9=BROTHER-IN-LAW OF STUDENT
10=GREAT GRANDFATHER OR GREAT GRANDMOTHER
11=STEPFATHER/STEPMOTHER OF STUDENT
12=NIECE/NEPHEW OF STUDENT
13=FAMILY FRIEND
14=STUDENT
97=OTHER
A. CODES FOR (Q1.2) RELATIONSHIP TO
HEAD
1=HEAD OF HOUSEHOLD
2=SPOUSE OF HEAD OF HOUSE
3=CHILD OF HEAD
4=GRANDCHILD OF HEAD OF HOUSE
5=NIECE/NEPHEW OF HEAD OF HOUSE
6=PARENT OF HEAD OF HOUSE
7=SIBLING OF HEAD OF HOUSE
8=UNCLE/AUNT-IN-LAW OF HEAD
9=SON/DAUGHTER-IN-LAW OF HEAD
10=BROTHER/SISTER-IN-LAW OF HEAD
11=GRANDFATHER/GRD.MOTHER OF HEAD
12=AUNT/UNCLE OF HEAD
13=STEPFATHER/STEPMOTHER OF HEAD
14=STEPBROTHER/STEPSISTER OF HEAD
15=OTHER RELATIVE
16=NON-RELATIVE
C. CODES FOR LEVEL OF SCHOOL
ATTENDED THIS YEAR and
HIGHEST LEVEL OF EDUCATION
COMPLETED (Questions 1.7 & 1.9)
0 = NONE
1 = KINDERGARTEN
2 = GRADE 1
3 = GRADE 2
4 = GRADE 3
5 = GRADE 4
6 = GRADE 5
7 = GRADE 6
8 = GRADE 7
9 = GRADE 8
10 = GRADE 9
11 = GRADE 10
12 =VOCATIONAL TRAINING
13 =UNIVERSITY OR HIGHER
-97 =OTHER
D. REASON PERSON DIDN’T ATTEND SCHOOL OR DROPPED OUT
(Q1.10)
1 = LIMITED AVAILABILITY OF TEACHERS
2 = EMPLOYMENT/HELPING FAMILY WITH WORK
3 = TAKING CARE OF SIBLINGS OR OTHER RELATIVES
4 = FEES/COST/COULDN’T AFFORD
5 = DISTANCE (THE CLOSEST SCHOOL WAS TOO FAR AWAY)
6 = MARRIAGE
7 = POOR SCHOOL FACILITIES
8 = PREGNANCY
9 = SICKNESS
10 = CONCERN OVER VIOLENCE/BULLYING/TEASING
11 = NOT MOTIVATED/DIDN’T VALUE EDUCATION
12 = CURRICULUM TOO DIFFICULT OR NOT PERFORMING WELL
97 = OTHER
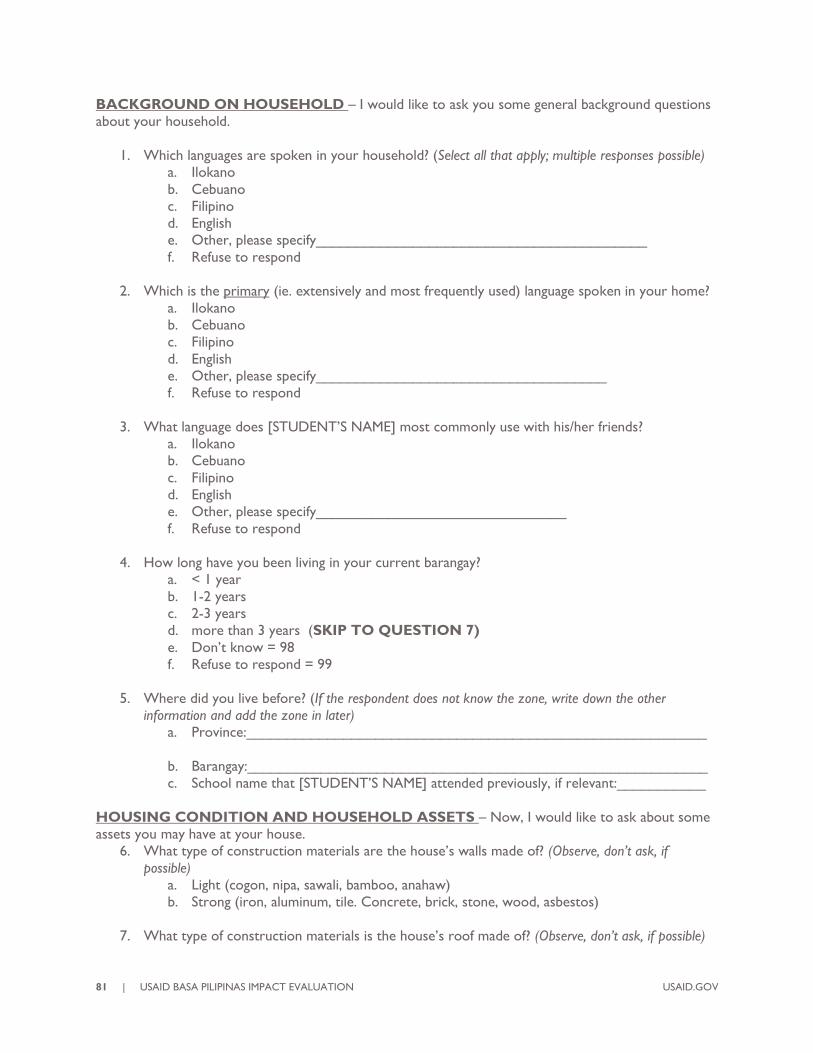
81 | USAID BASA PILIPINAS IMPACT EVALUATION USAID.GOV
BACKGROUND ON HOUSEHOLD – I would like to ask you some general background questions
about your household.
1. Which languages are spoken in your household? (Select all that apply; multiple responses possible)
a. Ilokano
b. Cebuano
c. Filipino
d. English
e. Other, please specify_________________________________________
f. Refuse to respond
2. Which is the primary (ie. extensively and most frequently used) language spoken in your home?
a. Ilokano
b. Cebuano
c. Filipino
d. English
e. Other, please specify____________________________________
f. Refuse to respond
3. What language does [STUDENT’S NAME] most commonly use with his/her friends?
a. Ilokano
b. Cebuano
c. Filipino
d. English
e. Other, please specify_______________________________
f. Refuse to respond
4. How long have you been living in your current barangay?
a. < 1 year
b. 1-2 years
c. 2-3 years
d. more than 3 years (SKIP TO QUESTION 7)
e. Don’t know = 98
f. Refuse to respond = 99
5. Where did you live before? (If the respondent does not know the zone, write down the other
information and add the zone in later)
a. Province:_________________________________________________________
b. Barangay:_________________________________________________________
c. School name that [STUDENT’S NAME] attended previously, if relevant:___________
HOUSING CONDITION AND HOUSEHOLD ASSETS – Now, I would like to ask about some
assets you may have at your house.
6. What type of construction materials are the house’s walls made of? (Observe, don’t ask, if
possible)
a. Light (cogon, nipa, sawali, bamboo, anahaw)
b. Strong (iron, aluminum, tile. Concrete, brick, stone, wood, asbestos)
7. What type of construction materials is the house’s roof made of? (Observe, don’t ask, if possible)

USAID.GOV USAID BASA PILIPINAS IMPACT EVALUATION | 82
a. Light (cogon, nipa, or anahaw), salvaged/makeshift materials, mixed but predominantly
light materials or salvaged materials
b. Strong (galvanized iron, aluminum, tile, concrete, brick, stone, asbestos, mixed but
predominantly strong materials
8. What kind of toilet facility does the family use?
a. None, open pit, closed pit or other
b. Flush toilet (water sealed)
9. How many radios does the family own?
a. Zero
b. One
c. Two or more
10. How many television sets does the family own?
a. Zero
b. One
c. Two or more
11. Does the family own a gas stove or a gas range?
a. No
b. Yes
12. Does the family own a sala set?
a. No
b. Yes
13. Does the family own a motorcycle or scooter?
a. No
b. Yes
14. Is this household (or any member) a beneficiary of Pantawid Pamilyan Pilipino Program (4Ps) or
a recipient of Conditional Cash Transfer?
a. No
b. Yes
15. Does this household have a refrigerator (note: must be functioning)?
a. No
b. Yes
STUDENT SCHOOLING – Now I would like to talk about [STUDENT’S NAME]’s schooling.
16. Did [STUDENT’S NAME] attend a kindergarten?
a. Yes
b. No
c. Don’t know
d. Refuse to respond
17. If yes, what type of kindergarten?
a. Play group

83 | USAID BASA PILIPINAS IMPACT EVALUATION USAID.GOV
b. Day Care
c. Nursery
d. Other, specify
18. If yes, How long did [STUDENT’S NAME] attend kindergarten?
a. 4 months or less
b. More than 4 months but less than a school year
c. One school year
d. Two school years
e. Three or more school years
f. Don’t know
g. Refuse to respond
19. What was the primary language spoken in [STUDENT’S NAME]’s kindergarten?
a. Ilokano
b. Cebuano
c. Filipino
d. English
e. Other, please specify_______________________________
f. Refuse to respond
20. A: Do you know [STUDENT NAME’S] age when he/she first attended Grade 1?
a. Yes
b. Don’t know
c. Refuse to respond
B: How old was [STUDENT’S NAME] (in years)? ______________________
21. Has [STUDENT’S NAME’S] repeated a grade?
a. No = 0 (SKIP TO QUESTION 24)
b. Yes = 1
c. Don’t know (SKIP TO QUESTION 2)
d. Refuse to respond
22. Which grade(s) was it/ were they and why?
Standard 1 -
Repeated
(No = 0,
Yes = 1)
2 – Number of years
repeated (including
current year, if applicable)
3 – Reason for
repeating (see codes
below; multiple
selections possible)
A –
Kindergarten
B - Grade 1
C - Grade 2
CODES
Too many absences = 1
Poor quality teaching = 2
Classroom was too crowded = 3
No/not enough textbooks = 4

USAID.GOV USAID BASA PILIPINAS IMPACT EVALUATION | 84
Child isn’t smart = 5
Child didn’t study/pay attention = 6
I didn’t know how to help him/her = 7
I didn’t have time to help him/her = 8
He/she was too hungry to learn = 9
Teacher didn’t like him/her = 10
Child didn’t sit for the exam = 11
Lack of money to send the child to school=12
Family crisis = 13
Natural disaster = 14
Family or child relocated or moved = 15
Student did not master the material = 16
Student did not learn to read = 17
Student did not want to go to school = 18
Don’t know = 98
Refuse to answer = 99
23. Did [STUDENT’S NAME] miss one or more days of school in the past four weeks?
a. No (SKIP TO QUESTION 26)
b. Yes
c. Don’t know (SKIP TO QUESTION 26)
d. Refuse to respond (SKIP TO QUESTION 26)
24. Why did [STUDENT’S NAME] miss some school in the past four weeks? (Select all that apply;
multiple responses possible)
a. He/she needed to stay home to complete domestic chores such as helping to care for
younger children or elderly or sick relatives, cooking, cleaning, fetching water or wood,
etc.
b. He/she needed to tend animals or work on the family farm or in the family business.
c. He/she did not want to go to school.
d. He/she was ill/sick.
e. He/she needed to attend a funeral.
f. He/she was too hungry to go to school.
g. He/she did not have any clothes to wear or his/her clothes were dirty.
h. He/she missed school for another reason, please specify:
i. ______________________________________________________________
j. Don’t know
k. Refuse to respond
25. What are the things you (or someone in your household) do or have done to help [STUDENT’S
NAME] learn? (Don’t read the options but check all options the respondent offers; multiple responses
possible)
a. Help with their homework
b. Buy or borrow books and other reading materials for them to read
c. Take them to the library
d. Take them to a reading event
e. Talk with their teacher or head teacher about the child’s learning progress
f. Participate in the PTA
g. Participate in the School Committee
h. Regularly read to the child (can be in the past when the child was younger)

85 | USAID BASA PILIPINAS IMPACT EVALUATION USAID.GOV
i. Encourage child to read
j. Communicate to your child that you have high expectations for him/her
k. Hire a private tutor
26. Does [STUDENT’S NAME] ever do homework outside of school?
a. No (SKIP TO QUESTION 30)
b. Yes
c. Don’t know (SKIP TO QUESTION 30)
d. Refuse to respond (SKIP TO QUESTION 30)
27. About how many hours per week does [STUDENT’S NAME] spend doing homework outside of
school? ______________________________________
28. Do you or anyone else in the ever help [STUDENT’S NAME] with his/her homework? If so,
how often?
a. No
b. Yes, rarely
c. Yes, sometimes
d. Yes, frequently
e. Don’t know
f. Refuse to respond
29. Are there any books or other reading materials that [STUDENT’S NAME] can read at home?
a. No (SKIP TO QUESTION 34)
b. Yes
c. Don’t know (SKIP TO QUESTION 34)
d. Refuse to respond (SKIP TO QUESTION 34)
30. If yes, how many books or other reading materials are available in your household?
a. Between 1 - 10
b. Between 11- 20
c. Between 21-50
d. Between 51 - 100
e. More than 100
31. If yes, how does your family obtain the following reading materials?
Buy
From
Library/
School/
Community
Center
Gift
From
family/
friends
From
Gov. /
NGO
Other
Newspaper Magazines Books
32. If yes, are any of these books in [MOTHER TONGUE]?
a. No
b. Yes
c. Don’t know
d. Refuse to respond

USAID.GOV USAID BASA PILIPINAS IMPACT EVALUATION | 86
33. Has anyone in your household ever read to [STUDENT’S NAME]? (Including family members
who no longer live in the household)
a. No (SKIP TO QUESTION 37)
b. Yes
c. Don’t know (SKIP TO QUESTION 37)
d. Refuse to respond (SKIP TO QUESTION 37)
34. How often does someone usually read to [STUDENT’S NAME]?
a. Nobody reads to him/her anymore
b. Once a month
c. A few times a week
d. Once a week
e. More than once a week
f. Don’t know
g. Refuse to respond
35. A: Do you know [STUDENT NAME’S] age when someone in this household began to read to
him/her?
a. ___________age
b. Don’t know
c. Refuse to respond
B: How old was [STUDENT’S NAME] (in years)? _________________
36. Does [STUDENT’S NAME] ever bring any books home from school?
a. No
b. Yes
c. Don’t know
d. Refuse to respond
37. A: What is the highest level of education you would like [STUDENT’S NAME] to achieve?
a. Grade School
b. Vocational [SKIP TO NUMBER 39]
c. University higher [SKIP TO NUMBER 39]
d. B: Please specify what Grade in Grade School: _____________
e. A: What is the highest level of education you expect [STUDENT’S NAME] to achieve?
f. Grade School
g. Vocational
h. University or higher
B: Please specify what Grade in Grade School: _____________
COMMUNITY-SCHOOL INVOLVEMENT IN EDUCATION
38. Does [STUDENT’S NAME’S] school have a PTA or School Committee?
a. No (SKIP TO QUESTION 43)
b. Yes, a PTA (PROCEED TO 41 BUT THEN SKIP TO QUESTION 43)
c. Yes, a School Committee (SKIP TO QUESTION 42)

87 | USAID BASA PILIPINAS IMPACT EVALUATION USAID.GOV
d. Yes, both
e. Don’t know (SKIP TO QUESTION 43)
f. Refuse to respond (SKIP TO QUESTION 43)
39. Please describe the types of things the PTA at [STUDENT’S NAME’s] school does? (Read the
response options to the respondent. Select all that apply; multiple responses possible)
a. Monitors teacher absences
b. Buys, or raises money to buy learning materials (other than books) for the school
c. Buys books for the classrooms or raises money to buy books
d. Reads to students
e. Provides tutoring for students who are having difficulty learning to read
f. Tries to motivate the community to get involved in supporting the school
g. Raises money and/or encourages parents and/or community members to repair/maintain
the school and/or build new classrooms or teacher housing
h. Helps organize book fairs
i. Hosts after-school book clubs
j. Works with the school staff to find ways to improve the school and the teaching-
learning process
k. Helps set policy
l. Other, please specify_________________________________________________
m. Don’t know
n. Refuse to respond
40. What types of things does the School Committee at (STUDENT’S NAME) do? (Let them
respond on their own for about 20-30 seconds and then ask about the items below for those they
haven’t already given. Report all that apply; multiple responses possible)
a. Monitors teacher absences
b. Buys, or raises money to buy learning materials (other than books) for the school
c. Buys books for the classrooms or raises money to buy books
d. Reads to students
e. Provides tutoring for students who are having difficulty learning to read
f. Tries to motivate the community to get involved in supporting the school
g. Raises money and/or encourages parents and/or community members to repair/maintain
the school and/or build new classrooms or teacher housing
h. Helps organize book fairs
i. Hosts after-school book clubs
j. Works with the school staff to find ways to improve the school and the teaching-
learning process
k. Helps set policy
l. Other, please specify_________________________________________________
m. Don’t know
n. Refuse to respond
41. Do you or others in the household feel welcome in (STUDENT’S NAME) school?
a. No
b. Yes (SKIP TO QUESTION 45)
c. I/We have never gone to his/her school (SKIP TO QUESTION 45)
d. Don’t know (SKIP TO QUESTION 45)
e. Refuse to answer (SKIP TO QUESTION 45)

USAID.GOV USAID BASA PILIPINAS IMPACT EVALUATION | 88
42. Why do you or they not feel welcome in (STUDENT’S NAME) school? (Don’t read options, but
record all options they give; multiple responses possible)
a. Because I/we can’t read
b. Because I/we don’t know anything about schools – or I never went to school
c. Because the teachers and head teachers at the school don’t want me/us there
d. Because education is best left to the educators
e. Because I don’t have time
f. I can’t think of any way I can be helpful or make a difference
g. I’d be involved if someone told me how I could be helpful
h. Other, please
list________________________________________________________
i. Don’t know
j. Refuse to respond
43. Have you and/or any member of your family ever been invited to or asked to be involved in
[STUDENT’S NAME’S] school in any way?
a. No (SKIP TO QUESTION 47)
b. Yes
c. Don’t know (SKIP TO QUESTION 47)
d. Refuse to respond (SKIP TO QUESTION 47)
44. Who invited you/them to be involved? (Multiple responses possible; select all that apply)
a. Headteacher
b. Teacher
c. PTA Member
d. School Committee Member
e. Letter from school
f. Neighbor
g. Friend
h. Relative
i. [STUDENT’s NAME]
j. The EGRA Project
k. The TIANA Project
l. The Literacy Boost Project
m. The ASPIRE Project
n. Other, please list____________________________________________________
o. Don’t know or don’t remember
p. Refuse to respond
45. Are you (and/or any member of the household) involved in the school in any way?
a. No (SKIP TO END)
b. Yes
c. Don’t know (SKIP TO END)
d. Refuse to respond (SKIP TO END)
46. How are you (and/or someone in your household) involved? (Multiple responses possible; select all
that apply)
a. Help in [STUDENT’S NAME’s] classroom
b. Participate in PTA
c. Participate on School Committee

89 | USAID BASA PILIPINAS IMPACT EVALUATION USAID.GOV
d. In a group helping to increase support for reading
e. Host after-school book club
f. Donate books, magazines, and other reading materials
g. Donate food for school meals
h. Encourage families to send their girls to school or to let them stay in school
i. Encourage families to send disabled child(ren) to school or to let them stay in school
j. Provide financial support to families who can’t afford to children to school
k. Provide (buy and/or make) learning materials for use in the classroom
l. Helped to construct, maintain and/or refurbish a building (e.g., classroom, teacher
housing, latrine)
m. Help in school garden
n. Other, please specify_________________________________________________
o. Don’t know = -98
p. Refuse to respond = -99
47. Approximately how much time do you spend on these activities?
a. Number of hours:______
b. Per:______
48. Language of Interview:
a. Ilokano
b. Cebuano
c. Filipino
d. English
e. Other, please specify____________________
49. In case we need to get in touch with you, would it be possible to call you?
a. Yes
b. No
c. Specify: __________________________
Thank you for your participation! You have been very helpful

USAID.GOV USAID BASA PILIPINAS IMPACT EVALUATION | 90
ANNEX 5 – EGMA FINDINGS
Grade I
CATEGORY IMPACT
Number identification cpm 1.448**
(0.0473)
Quantity comparison (% correct) -0.00671
(0.710)
Missing number (% correct) 0.00343
(0.774)
Addition level 1 cpm 0.0347
(0.914)
Subtraction level 1 cpm 0.318
(0.451)
Word problem (% correct) 0.114***
(7.46e-06)
Grade 2
CATEGORY IMPACT
Number identification cpm 4.133***
(0.00454)
Quantity comparison (% correct) 0.00693
(0.401)
Missing number (% correct) -0.0225
(0.152)
Addition level 1 cpm -0.401
(0.537)
Subtraction level 1 cpm -0.0722
(0.884)
Word problem (% correct) -0.0215
(0.380)
Addition level 2 (% correct) -0.0292
(0.238)
Subtraction level 2 (% correct) 0.00554
(0.836)
Grade 3
CATEGORY IMPACT
Number identification cpm 0.934
(0.213)
Quantity comparison (% correct) 0.0102
(0.108)
Missing number (% correct) -0.0113
(0.450)
Addition level 1 cpm -0.102

91 | USAID BASA PILIPINAS IMPACT EVALUATION USAID.GOV
(0.728)
Subtraction level 1 cpm 0.224
(0.482)
Word problem (% correct) -0.00409
(0.844)
Addition level 2 (% correct) 0.0441**
(0.0382)
Subtraction level 2 (% correct) 0.000857
(0.965)
Grade 4
CATEGORY IMPACT
Number identification cpm 4.133***
(0.00454)
Quantity comparison (% correct) 0.00693
(0.401)
Missing number (% correct) -0.0225
(0.152)
Addition level 1 cpm -0.401
(0.537)
Subtraction level 1 cpm -0.0722
(0.884)
Word problem (% correct) -0.0215
(0.380)
Addition level 2 (% correct) -0.0292
(0.238)
Subtraction level 2 (% correct) 0.00554
(0.836)

USAID.GOV USAID BASA PILIPINAS IMPACT EVALUATION | 92
ANNEX 6 – COMPLETE REGRESSION TABLES
Predictors of Reading Outcomes:
Oral Reading Fluency
Filipino ORF
Filipino ORF
Filipino ORF
English ORF
English ORF
English ORF
Filipino RC
Filipino RC Filipino RC English RC English RC English RC
VARIABLES Grade 2 Grade 3 Grade 4 Grade 2 Grade 3 Grade 4 Grade 2 Grade 3 Grade 4 Grade 2 Grade 3 Grade 4
G2 Filipino ORF - t1 0.180***
(0.00219)
G2 average class size -0.193** 0.00521
-0.00186* -0.00133
(0.0372) (0.944) (0.0667) (0.435)
2017 outcomes 2.720 1.153 6.069*** 4.759**
-0.0943**
*
-0.0974**
* -0.118** -0.0409
(0.265) (0.421) (0.00753) (0.0216)
(0.000523)
(4.28e-05) (0.0249) (0.397)
Age of student -0.448 0.0293 1.089 0.0110 -1.115* 0.453 -0.0118 -0.00429 0.0446*** 0.0287 -0.0114 0.0399
(0.667) (0.949) (0.417) (0.989) (0.0797) (0.777) (0.444) (0.630) (0.00812) (0.327) (0.599) (0.215)
Sex of student 10.49*** 5.837*** 3.787*** 8.603*** 4.738*** 3.286*
0.0701***
0.0547*** -0.00455 0.0783** 0.0978*** 0.0917
(1.44e-09)
(3.27e-08) (0.00666)
(8.29e-06)
(3.26e-05) (0.0976) (0.00272)
(2.78e-05) (0.871) (0.0329) (0.00467) (0.104)
Region 7 23.78*** -
6.074*** -1.021 3.598 -0.679 4.081 0.00923
-0.0736**
* -0.248*** 0.109* 0.126* -0.0207
(4.98e-09)
(0.000161) (0.693) (0.127) (0.667) (0.207) (0.766) (0.00165) (2.84e-05) (0.0908) (0.0543) (0.837)
Mother tongue -0.819 1.631 -1.355 -0.824 3.179 -4.140 -0.0494 0.0380 -0.0295 0.179* 0.139 0.148
(0.873) (0.279) (0.560) (0.794) (0.171) (0.508) (0.297) (0.169) (0.811) (0.0664) (0.156) (0.518)
Household assets index 0.705 -0.310 -0.619 1.473*** 0.0268 -0.0199 0.0105* 0.00235 -0.00951 0.0267** 0.0336*** 0.0184
(0.147) (0.322) (0.118) (0.00024
3) (0.935) (0.970) (0.0580) (0.592) (0.313) (0.0163) (0.00479) (0.309)
Student attended Kindergarten -8.114 0.595 3.954 6.665 1.127 2.309 0.0564 -0.0262 0.0821* 0.0989 0.0537 0.0370
(0.492) (0.742) (0.108) (0.211) (0.506) (0.474) (0.392) (0.312) (0.0890) (0.418) (0.442) (0.720)
Student's age when first attended Kindergarten -3.864 0.466 -0.999 -2.179** 0.240 -2.410 -0.0112 -0.0118 -0.0343 -0.0773* 0.0212 -0.0418
(0.112) (0.609) (0.442) (0.0318) (0.826) (0.181) (0.546) (0.414) (0.200) (0.0547) (0.468) (0.422)
Student does homework 0.230 -0.0143 -0.409 0.0430 0.274 1.072** -0.00417 0.00199 -0.0159 0.0198* 0.00966 0.0157
(0.713) (0.965) (0.258) (0.910) (0.394) (0.0256) (0.523) (0.623) (0.118) (0.0928) (0.483) (0.263)
Student receives homework help from a family member 0.661 -0.693 1.308 -0.0181 -0.417 -2.032 0.0134 -0.00163 0.0406 -0.0651* 0.0141 -0.125**
(0.724) (0.557) (0.314) (0.989) (0.678) (0.234) (0.504) (0.923) (0.173) (0.0664) (0.704) (0.0345)
Student has books at home -0.360 -0.883 1.179 3.755*** -1.992* -0.295
0.0750*** 0.00937 0.0319 0.0375 -0.00217 0.0492
(0.855) (0.470) (0.495) (0.00399) (0.0728) (0.908) (0.00583) (0.571) (0.257) (0.380) (0.959) (0.493)

93 | USAID BASA PILIPINAS IMPACT EVALUATION USAID.GOV
Student brings books home from school 1.287 4.867*** -0.0570 4.490* 4.378** -0.303 0.0551* 0.0308 0.0418 0.101 -0.0305 -0.0355
(0.671) (0.00352) (0.979) (0.0740) (0.0126) (0.953) (0.0903) (0.238) (0.389) (0.115) (0.608) (0.667)
Highest level of education in the household 1.081 0.0216 -0.242 0.614 0.799 -0.517 -0.00552 0.00183 0.0130* 0.0239 0.00603 0.0118
(0.390) (0.981) (0.620) (0.591) (0.432) (0.397) (0.524) (0.836) (0.0647) (0.260) (0.868) (0.703)
Student's age when someone began to read to him/her 0.0252 -0.696 -0.802 -0.657 -0.471 -0.905 -0.00468 -0.00624 0.00480 -0.0402* -0.0232 -0.0333
(0.982) (0.162) (0.317) (0.293) (0.421) (0.291) (0.681) (0.486) (0.735) (0.0571) (0.237) (0.321)
School assets index -1.059 0.395 -2.052* -0.358 -0.0654 -0.481 0.0141 0.00513 -0.0370** 0.0243 0.0272 -0.0102
(0.327) (0.431) (0.0551) (0.659) (0.912) (0.702) (0.190) (0.455) (0.0275) (0.244) (0.170) (0.780)
Highest grade instructed at this school 0.996 3.891 4.089 -0.231 3.757** 8.212**
-0.0324** -0.0131 -0.0574* -0.0317 0.0445 -0.0608
(0.389) (0.107) (0.142) (0.906) (0.0375) (0.0106) (0.0107) (0.718) (0.0876) (0.487) (0.459) (0.447)
Number of days school was closed this year -0.239 -0.404 0.253** 0.0421 -0.189 -0.162 0.00103 -0.00376 -0.000147 -0.00103 -0.000448
-0.0151***
(0.424) (0.108) (0.0447) (0.842) (0.301) (0.522) (0.701) (0.297) (0.957) (0.846) (0.944) (0.00423)
Total school enrollment at baseline
0.0122*** 0.000386 0.00578*
0.00624**
0.00438*** 0.00434
4.89e-05** 1.58e-06
0.000215***
0.000134*** 1.11e-06
0.000196***
(7.97e-05) (0.829) (0.0524) (0.0125) (0.00127) (0.146) (0.0131) (0.936) (2.16e-08) (0.00813) (0.984) (0.00144)
Months of teaching experience 0.00133 -0.00468 0.00487 0.000734 0.000887 0.00299 -7.49e-05 4.50e-05
0.000249** 6.59e-05 0.000345* 0.000328
(0.873) (0.382) (0.339) (0.920) (0.884) (0.734) (0.422) (0.507) (0.0416) (0.712) (0.0563) (0.165)
Students are put into small reading groups 0.770 0.377 -0.458 1.637 -1.852 3.756 0.0337 -0.0263 0.0448 0.00140 0.0545 0.110
(0.809) (0.816) (0.748) (0.513) (0.214) (0.249) (0.444) (0.301) (0.225) (0.983) (0.562) (0.211)
Teacher has post-graduate degree 13.37*** 3.679* 2.104 1.507 -0.985 1.746 0.0510 0.00682 -0.0867* -0.0200 -0.0338 -0.00957
(0.000419) (0.0520) (0.248) (0.389) (0.569) (0.495) (0.107) (0.764) (0.0660) (0.734) (0.519) (0.910)
General teacher behavior index 11.71 4.574 1.074 -0.972 0.186 -3.267 0.00426 0.0589 -0.254** -0.0579 0.0948 -0.0177
(0.289) (0.335) (0.856) (0.856) (0.964) (0.717) (0.958) (0.301) (0.0308) (0.754) (0.536) (0.949)
Reading-specific practices index -2.595 2.652 -3.638 -0.793 5.977** -4.163 -0.0312 0.0267 0.162* 0.0415 0.0164 0.202
(0.652) (0.272) (0.403) (0.798) (0.0323) (0.477) (0.533) (0.435) (0.0968) (0.650) (0.835) (0.368)
Minutes of class time using MT 0.00981
-0.000791
-0.000912 -0.00478
-0.00931* -0.00445 -2.42e-05
-0.000113
* 0.000195
-0.000386*
*
-0.000435*
** 0.000361

USAID.GOV USAID BASA PILIPINAS IMPACT EVALUATION | 94
(0.276) (0.877) (0.879) (0.394) (0.0935) (0.572) (0.786) (0.0640) (0.160) (0.0266) (0.00661) (0.133)
Minutes of class time using Filipino 0.0123
-0.000262
-0.0212**
* 0.0202 0.00802 -0.0159 0.000326 -
0.000268 -0.000138 -0.000495 -0.000623 -0.000425
(0.726) (0.992) (0.00260) (0.531) (0.544) (0.157) (0.435) (0.473) (0.422) (0.562) (0.302) (0.193)
Minutes of class time using English 0.000380 0.0159 -0.00715 -0.00398 0.00233 -0.00580
-0.000161 1.82e-05 0.000288 0.000111
0.00128*** 0.000471*
(0.980) (0.481) (0.335) (0.796) (0.803) (0.638) (0.173) (0.959) (0.138) (0.697) (0.00495) (0.0776)
Numbers - t2 1.011*** 0.557*** 0.333*** 0.887*** 0.555*** 0.476***
0.00762***
0.00531***
0.00277*** 0.0111***
0.00947*** 0.0110***
(0) (0) (1.54e-
09) (2.32e-
09) (0) (3.39e-
10) (0) (0) (0.000122) (0) (0) (1.39e-10)
Filipino ORF - t1 0.505*** 0.744***
(0) (0)
G3 average class size 0.0507 -0.0765
0.00182** -0.000925
(0.410) (0.167) (0.0111) (0.486) G4 average class size 0.0636 0.113* 0.000155 0.000130
(0.148) (0.0697) (0.885) (0.950)
G2 English ORF - t1 0.454***
(0.000723)
English ORF - t1 0.702*** 0.745***
(0) (0)
G2 Filipino reading comp - t1 0.450***
(0)
Filipino reading comp - t1 0.254*** 0.725***
(0) (0)
G2 English reading comp - t1 0.542***
(0)
English reading comp - t1 0.612*** 0.410***
(0) (4.00e-10)
Constant -4.456 -35.05* -28.69 -9.713 -26.20* -44.06 0.174 0.000339 -0.119 -0.225 -1.080* -0.974
(0.870) (0.0629) (0.245) (0.590) (0.0873) (0.132) (0.387) (0.999) (0.733) (0.636) (0.0621) (0.194)
Observ-ations 2,018 2,082 715 2,020 2,083 715 2,024 2,083 715 2,024 2,083 715
Predictors of Oral Reading Fluency by Treatment Status
Filipino Filipino
ORF Basa Filipino
ORF Basa Filipino
ORF Basa Filipino
ORF non-Basa
Filipino ORF non-
Basa
Filipino ORF non-
Basa LABELS Grade 2 Grade 3 Grade 4 Grade 2 Grade 3 Grade 4
2017 outcomes 0.286 -0.725
3.786 -1.689

95 | USAID BASA PILIPINAS IMPACT EVALUATION USAID.GOV
(0.912) (0.709)
(0.335) (0.456)
Age of student -0.503 -0.263 1.472 1.356 0.704 3.219 (0.656) (0.702) (0.401) (0.618) (0.467) (0.116)
Gender of student 11.87*** 11.41*** 10.75*** 11.26*** 14.25*** 18.61*** (0) (0) (1.53e-05) (1.59e-05) (0) (2.56e-07)
Region 7 29.38*** -0.711 -6.087 21.31*** 7.650*** -1.617 (0) (0.761) (0.288) (5.37e-06) (0.000175) (0.746)
Mother tongue -0.635 2.092 2.863 20.30** 0.181 -4.718 (0.905) (0.377) (0.665) (0.0114) (0.943) (0.411)
Household assets index 0.997* -0.443 0.556 0.957 1.391*** 0.651 (0.0523) (0.316) (0.435) (0.260) (0.00640) (0.314)
Student attended Kindergarten -7.907 1.500 6.659* 6.290 5.627** 8.920** (0.515) (0.533) (0.0726) (0.147) (0.0256) (0.0285)
Student's age when first attended Kindergarten
-4.083* 0.352 -1.766 0.530 1.445 4.625
(0.0998) (0.776) (0.343) (0.836) (0.366) (0.278)
Student does homework 0.329 0.138 -0.417 -0.376 -1.079 0.543 (0.617) (0.753) (0.525) (0.735) (0.215) (0.600)
Student receives homework help from a family member
0.427 -0.548 -0.308 4.509** -0.611 -0.892
(0.830) (0.700) (0.885) (0.0331) (0.744) (0.774)
Student has books at home -0.348 -1.375 -0.802 3.757* -1.528 1.304 (0.872) (0.373) (0.745) (0.0752) (0.374) (0.658)
Student brings books home from school 1.530 6.030** 3.663 2.865 -2.235 9.404* (0.634) (0.0126) (0.311) (0.423) (0.497) (0.0646)
Highest level of education in the household
1.283 -0.101 -0.0549 -4.519*** -1.233 -0.115
(0.320) (0.940) (0.954) (0.00891) (0.198) (0.910)
Student's age when someone began to read to him/her
-0.284 -1.441** -1.329 0.641 -3.682*** -3.246**
(0.796) (0.0391) (0.261) (0.659) (0.000608) (0.0282)
School assets index -1.157 1.670** -5.017*** 0.227 0.312 -5.023*** (0.342) (0.0376) (0.00770) (0.753) (0.563) (0.00699)
Highest grade instructed at this school 1.024 1.274 2.800 -0.325 0.816 -0.516 (0.401) (0.695) (0.549) (0.887) (0.744) (0.874)
Number of days school was closed this year
-0.267 -0.575* -0.100 0.350 0.509** 0.805*
(0.411) (0.0595) (0.645) (0.535) (0.0213) (0.0603)
Total school enrollment at baseline 0.0126*** 0.00121 6.20e-05 0.00220 -0.00117 0.0165*** (3.74e-07) (0.587) (0.986) (0.491) (0.471) (0.00596)
Months of teaching experience 0.00135 -0.0125 0.000892 0.0231** 0.00695 0.0198 (0.883) (0.114) (0.942) (0.0496) (0.319) (0.365)
Students are put into small reading groups
0.731 2.334 0.0212 2.773 -4.472** 0.498
(0.848) (0.296) (0.996) (0.396) (0.0341) (0.911)
Teacher has post-graduate degree 15.57*** -0.841 -5.718 6.430* 3.029** 6.408* (0.000218) (0.710) (0.185) (0.0952) (0.0317) (0.0749)
General teacher behavior index 11.26 -0.737 -2.453 41.87*** -1.012 1.005 (0.352) (0.906) (0.801) (5.35e-07) (0.878) (0.937)
Reading-specific practices index -2.890 5.734* -4.623 -18.03*** 1.898 11.70 (0.638) (0.0715) (0.478) (0.00177) (0.675) (0.226)
Minutes of class time using MT 0.00975 -0.00166 0.0129 -0.0210** -0.00930 -0.0240 (0.308) (0.787) (0.266) (0.0374) (0.282) (0.127)
Minutes of class time using Filipino 0.0240 0.00632 -0.0223** -0.00323 -0.00102 -0.0329

USAID.GOV USAID BASA PILIPINAS IMPACT EVALUATION | 96
(0.648) (0.855) (0.0462) (0.898) (0.967) (0.109)
Minutes of class time using English 0.00104 0.0129 0.0112 0.00980 0.0131 -0.0401 (0.946) (0.596) (0.439) (0.431) (0.652) (0.105)
Numbers correct per minute 1.172*** 1.030*** 0.960*** 1.224*** 0.980*** 0.704*** (0) (0) (0) (0) (0) (8.48e-09)
Average G2 class size (G2 enrollment/number of G2 sections)
-0.198** -0.234***
(0.0481) (0.00714)
Average G3 class size (G3 enrollment/number of G3 sections)
0.00598
-0.106
(0.945)
(0.168)
Average G4 class size (G4 enrollment/number of G4 sections)
-0.0200
-0.0837
(0.830)
(0.174)
Constant -5.959 -11.08 -9.744 -87.86*** 2.734 -39.96 (0.830) (0.661) (0.807) (0.00371) (0.912) (0.314)
978 1,011 332 1,044 1,071 378
English
English ORF Basa
English ORF Basa
English ORF Basa
English ORF non-Basa
English ORF non-Basa
English ORF non-
Basa
LABELS Grade 2 Grade 3 Grade 4 Grade 2 Grade 3 Grade 4
2017 outcomes -0.855 -4.752* -6.158* -5.577*
(0.737) (0.0609) (0.0700) (0.0529) Age of student 0.0242 -0.827 -0.0765 -0.423 -0.0942 0.674
(0.980) (0.407) (0.973) (0.851) (0.956) (0.698)
Gender of student 12.44*** 14.54*** 14.02*** 11.29*** 17.25*** 16.35***
(0) (0) (0.000186) (4.70e-05) (1.07e-08) (1.11e-07)
Region 7 8.290** 1.067 2.453 12.95*** 9.702** 3.316
(0.0136) (0.693) (0.751) (6.02e-05) (0.0143) (0.600)
Mother tongue 0.986 4.047 -6.282 -7.966* -2.227 -8.457
(0.808) (0.258) (0.547) (0.0544) (0.537) (0.238)
Household assets index 1.831*** 0.511 2.515** 2.931*** 1.466 1.973***
(0.000118) (0.412) (0.0133) (3.92e-05) (0.122) (0.00933)
Student attended Kindergarten 5.682 2.631 7.214 0.468 -0.942 2.197
(0.187) (0.371) (0.140) (0.926) (0.819) (0.608) Student's age when first attended
Kindergarten -2.495* -0.307 -4.344 1.016 2.120 3.901
(0.0671) (0.849) (0.113) (0.594) (0.266) (0.329)
Student does homework 0.282 0.277 0.221 -0.226 -0.655 -1.539
(0.597) (0.631) (0.795) (0.772) (0.384) (0.119) Student receives homework help
from a family member -1.155 -0.982 -3.135 1.685 2.050 -0.671
(0.480) (0.540) (0.288) (0.347) (0.351) (0.840)
Student has books at home 3.226* -2.006 -2.864 2.619 -1.798 -2.817
(0.0717) (0.270) (0.522) (0.220) (0.369) (0.386) Student brings books home from
school 1.579 7.427** 6.550 4.478 -5.930 14.94***
(0.557) (0.0148) (0.250) (0.125) (0.236) (7.78e-05) Highest level of education in the
household 1.368 0.864 -0.0514 -0.0164 0.210 -0.491
(0.437) (0.713) (0.972) (0.963) (0.874) (0.618)

97 | USAID BASA PILIPINAS IMPACT EVALUATION USAID.GOV
Student's age when someone began to read to him/her -1.964*** -1.879** -0.353 0.851 -5.103*** -4.396***
(0.00912) (0.0418) (0.797) (0.560) (0.000465) (0.00837)
School assets index 0.422 2.559*** -3.571 0.183 0.245 -7.170***
(0.717) (0.00213) (0.207) (0.783) (0.716) (0.000931) Highest grade instructed at this
school 0.00276 -2.662 11.33** -2.573 3.602 4.071
(0.999) (0.387) (0.0360) (0.274) (0.213) (0.513) Number of days school was closed
this year 0.162 -0.966*** -0.407 1.222** 0.142 0.236
(0.615) (0.00248) (0.239) (0.0276) (0.625) (0.614)
Total school enrollment at baseline 0.0121*** 0.00508*** 0.00156 -
0.01000*** 0.00784*** 0.0126***
(1.02e-06) (0.00117) (0.734) (0.00222) (8.75e-05) (0.00806)
Months of teaching experience 0.00335 -0.00762 0.00874 0.0249** 0.00670 0.0395*
(0.746) (0.469) (0.623) (0.0326) (0.509) (0.0994) Students are put into small reading
groups 5.120 2.582 2.275 0.0627 -5.059* 3.631
(0.139) (0.399) (0.726) (0.979) (0.0863) (0.475)
Teacher has post-graduate degree 1.339 -0.288 -6.444 5.970** 4.215 5.588
(0.577) (0.911) (0.278) (0.0296) (0.209) (0.234)
General teacher behavior index -4.176 1.971 -15.04 13.38* 3.615 7.184
(0.603) (0.780) (0.331) (0.0832) (0.686) (0.650)
Reading-specific practices index 3.422 7.546* -7.899 -4.525 0.833 10.95
(0.380) (0.0596) (0.444) (0.417) (0.842) (0.318)
Minutes of class time using MT 0.000604 -0.0140* 0.0110 -0.0404*** 0.00123 -0.0285
(0.940) (0.0861) (0.545) (0.000142) (0.886) (0.131)
Minutes of class time using Filipino 0.0612 -0.00802 -0.0297* 0.00627 0.0307 -0.0387*
(0.313) (0.718) (0.0895) (0.836) (0.197) (0.0895)
Minutes of class time using English 0.00544 0.0171 0.0157 -0.0214 0.00716 -0.0553*
(0.801) (0.262) (0.430) (0.363) (0.784) (0.0546)
num_ids_permin_t2 1.287*** 1.453*** 1.400*** 1.363*** 1.391*** 1.171***
(0) (0) (0) (0) (0) (0) Average G2 class size (G2
enrollment/number of G2 sections) -0.128 -0.0822
(0.246) (0.383) Average G3 class size (G3
enrollment/number of G3 sections) -0.108 -0.145
(0.175) (0.163) Average G4 class size (G4
enrollment/number of G4 sections) -0.00347 0.166*
(0.980) (0.0776)
Constant -8.031 12.39 -44.71 -8.322 -16.81 -54.05
(0.716) (0.632) (0.330) (0.760) (0.566) (0.295)
979 1,011 332 1,045 1,072 378

USAID.GOV USAID BASA PILIPINAS IMPACT EVALUATION | 98
Treatment Effects:
Regressions – Mother Tongue
Letter sounds correct per
minute
Familiar words correct
per minute
Unfamiliar words correct
per minute
Oral reading fluency, per
minute
Reading comp., % correct
Reading comp. (no zeros), % correct
Treatment = Basa 2.145* 4.051** 2.004 4.934 0.0360 -0.0288
(0.0996) (0.0231) (0.110) (0.256) (0.230) (0.237) Letters - Mother Tongue 0.604***
(0)
Class size in the beginning of the school year 0.0402 0.0557 0.00926 0.0121 -0.000710 -0.000860
(0.568) (0.536) (0.906) (0.903) (0.721) (0.540) Household assets index 0.455 0.334 0.632 0.215 0.00519 0.000812
(0.202) (0.389) (0.134) (0.664) (0.574) (0.906) Student attended kindergarten 2.647 1.332 2.919 6.713* 0.124 0.0550
(0.420) (0.581) (0.316) (0.0643) (0.139) (0.517) Student’s age when first attended kindergarten 0.0272 -0.951 0.126 -1.051 -0.00203 -0.0120
(0.978) (0.360) (0.902) (0.419) (0.950) (0.723) Student does homework -0.724* 0.0687 -0.267 -0.133 -0.00696 -0.00952
(0.0597) (0.835) (0.426) (0.736) (0.392) (0.306) Student receives homework help from a family member
1.713 2.261** 2.015* 2.089 0.0174 0.0122
(0.125) (0.0365) (0.0659) (0.179) (0.546) (0.668) Student has books at home -1.776 1.740 2.567 1.794 0.0773* 0.0580*
(0.268) (0.355) (0.223) (0.228) (0.0791) (0.0989) Student brings books home from school 0.108 0.277 0.114 0.668 -0.0324 -0.0801
(0.957) (0.857) (0.934) (0.689) (0.504) (0.103) Highest level of education in the household 0.384 0.382 0.658 0.323 0.0142 0.0155
(0.701) (0.724) (0.557) (0.741) (0.623) (0.569) Age when student was first read to -1.535* -0.615 -1.327* -0.921 -0.0169 0.0102
(0.0535) (0.310) (0.0673) (0.169) (0.346) (0.544) School assets index 0.619 0.169 -0.158 -0.148 0.0104 0.0163
(0.238) (0.819) (0.829) (0.835) (0.514) (0.133) Highest grade instructed -2.691*** -0.246 -0.313 0.223 -0.0275 -0.0373
(0.00281) (0.845) (0.756) (0.834) (0.308) (0.229) # of days school is closed -0.212 0.328 0.374 0.565* 0.0104 0.0100
(0.552) (0.322) (0.359) (0.0918) (0.333) (0.300) Total enrollment -0.00155 -0.000364 0.000938 0.00134 3.07e-05 -1.17e-05
(0.313) (0.794) (0.526) (0.402) (0.429) (0.734) Months of teaching experience 0.00243 0.00644 0.0107 0.00837 0.000408** 0.000143
(0.717) (0.321) (0.124) (0.223) (0.0412) (0.418) Students are put into small reading groups 1.175 1.525 1.260 0.623 0.0494 0.0605
(0.565) (0.473) (0.582) (0.810) (0.402) (0.227) Teacher has post-graduate degree -1.887 0.630 0.0655 0.489 -0.0364 -0.0463
(0.397) (0.760) (0.980) (0.796) (0.497) (0.374)
Age of student 0.318 -0.359 -0.176 -0.640 -0.0622** -0.0498*
(0.712) (0.657) (0.807) (0.456) (0.0236) (0.0564) Sex of student 2.109* 6.247*** 6.131*** 5.915*** 0.132*** 0.0738**
(0.0553) (2.93e-05) (0.000540) (8.89e-05) (8.38e-06) (0.0144) Region 7 at the end of school year 3.269* 1.830 0.198 3.316 0.0548 -0.0329
(0.0759) (0.367) (0.918) (0.146) (0.241) (0.413) Mother tongue at the end of school year -8.201 -1.428 -2.229 -1.803 0.00570 0.0411
(0.131) (0.396) (0.231) (0.349) (0.926) (0.513) Familiar words
0.990***
(0)
Unfamiliar words
0.826***
(0.000196)
ORF
0.914***
(0)
Reading comprehension
1.190***
(0)
Reading comprehension excl. non-readers
0.914***

99 | USAID BASA PILIPINAS IMPACT EVALUATION USAID.GOV
(0) Constant 34.40*** 6.403 4.442 2.887 0.311 0.688**
(0.00153) (0.600) (0.719) (0.833) (0.376) (0.0384) Observations 1,362 1,361 1,360 1,361 1,366 879
Regressions – Filipino G2
Letter sounds correct per
minute
Familiar words correct
per minute
Unfamiliar words correct
per minute
Oral reading fluency,
correct per minute
Reading comp., % correct
Reading comp. (no zeros), % correct
Treatment = Basa 1.059 1.521* 1.466** 4.222** -0.000892 -0.0225
(0.248) (0.0845) (0.0308) (0.0262) (0.964) (0.253)
Filipino letters per minute 0.641***
(0)
Grade 2 average class size -0.0633 -0.0751* -0.00726 -0.200** -0.00255*** -0.00221**
(0.343) (0.0820) (0.807) (0.0132) (0.00713) (0.0131)
Household assets index 0.528 0.0110 0.0242 0.565 0.00962 0.00195
(0.189) (0.968) (0.899) (0.266) (0.102) (0.767)
Student attended kindergarten 8.505*** 0.633 0.420 -2.565 0.0925 0.0346
(0.00192) (0.798) (0.803) (0.783) (0.181) (0.620)
Student’s age when first attended kindergarten
-0.291 0.359 0.0337 -1.860 0.00488 0.0378
(0.747) (0.696) (0.959) (0.402) (0.799) (0.113)
Student does homework 0.285 0.262 0.139 0.0391 -0.0122* -0.0151*
(0.463) (0.354) (0.478) (0.939) (0.0644) (0.0682)
Student receives homework help from a family member
0.478 -0.508 0.640 -0.0387 0.00271 -0.00644
(0.634) (0.543) (0.291) (0.983) (0.898) (0.779)
Student has books at home 0.939 -0.0709 -0.299 -0.557 0.0598** 0.0597**
(0.479) (0.939) (0.718) (0.759) (0.0181) (0.0377)
Student brings books home from school -0.605 1.405 1.495 3.131 0.0651* -0.0142
(0.658) (0.225) (0.158) (0.306) (0.0737) (0.735)
Highest level of education in the household 1.338*** -0.250 0.142 1.971* 0.00283 0.0655***
(0.00556) (0.610) (0.634) (0.0959) (0.794) (0.00875)
Age when student was first read to -0.414 -0.654 -0.355 -0.624 -0.0105 -0.00478
(0.488) (0.110) (0.286) (0.599) (0.341) (0.720)
School assets index 0.0571 0.699 0.428 0.217 0.0241** 0.0135
(0.939) (0.129) (0.193) (0.823) (0.0343) (0.226)
Highest grade instructed -1.534 -0.0367 -0.514 1.177 0.000466 0.00141
(0.149) (0.977) (0.544) (0.330) (0.972) (0.939)
# of days school is closed -0.0612 0.228 0.257** 0.275 0.00276 0.000372
Student does homework (0.783) (0.189) (0.0446) (0.296) (0.275) (0.869)
Total enrollment 0.00203 -0.000131 0.00168** 0.00746*** 8.71e-05*** 7.69e-05***
(0.338) (0.914) (0.0492) (0.00118) (5.58e-05) (0.000178)
Months of teaching experience -0.00295 0.00222 0.00117 0.00739 -5.76e-05 -5.57e-05
(0.652) (0.618) (0.679) (0.370) (0.555) (0.606)
Students are put into small reading groups 2.970 -0.0970 -0.529 -0.727 -0.00365 0.0179
(0.141) (0.941) (0.589) (0.778) (0.932) (0.668)
Teacher has post-graduate degree 0.509 1.584 0.0240 11.89*** 0.0473 -0.00616
(0.756) (0.175) (0.981) (0.00101) (0.139) (0.877)
2017 outcomes -4.369*** 5.531*** 0.453 7.740*** -0.0661** -0.0942***

USAID.GOV USAID BASA PILIPINAS IMPACT EVALUATION | 100
(0.00326) (1.49e-07) (0.548) (0.00110) (0.0135) (0.00291)
Age of student 0.384 -0.605 -0.534 -0.601 -0.00801 -0.0153
(0.591) (0.317) (0.240) (0.579) (0.597) (0.335)
Sex of student 2.925*** 2.837*** 2.030*** 9.098*** 0.0702*** 0.0584**
(0.000965) (0.00109) (0.000691) (5.46e-08) (0.000625) (0.0146)
Region 7 3.922* 6.013*** 4.066*** 16.35*** 0.00594 -0.138***
(0.0992) (1.29e-05) (2.25e-05) (1.75e-05) (0.860) (0.00523)
Mother tongue at the end of school year -2.999 -0.383 0.458 -1.061 -0.0672 -0.0644
(0.390) (0.828) (0.780) (0.810) (0.165) (0.249)
Familiar words – G2
0.994***
(0)
Unfamiliar words – G2
0.843***
(0)
ORF – G2
0.622***
(0)
Reading comp – G2
0.643***
(0)
Reading comp excl. non-readers – G2
0.492***
(0)
Constant 11.24 7.043 7.593 11.78 0.0822 0.247
(0.285) (0.549) (0.353) (0.658) (0.697) (0.316)
Observations 2,529 2,534 2,532 2,530 2,536 1,823
Regressions – Filipino G3
Letter sounds correct per
minute
Familiar words correct per
minute
Unfamiliar words correct
per minute
Oral reading fluency, correct
per minute
Reading comp., % correct
Reading comp. (no zeros), %
correct
Treatment = Basa 0.876 1.080 0.713 -0.593 -0.00142 0.00336
(0.309) (0.251) (0.154) (0.673) (0.914) (0.803)
Household assets index 0.538** 0.128 0.246 0.279 0.00759* 0.00638
(0.0428) (0.570) (0.136) (0.338) (0.0562) (0.109)
Student attended kindergarten -0.215 1.711 -1.407 0.849 -0.00955 -0.00276
(0.922) (0.271) (0.191) (0.681) (0.751) (0.926) Student’s age when first attended kindergarten 0.551 -0.200 0.116 0.290 -0.00895 -0.00801
(0.520) (0.777) (0.785) (0.765) (0.513) (0.582)
Student does homework 0.893** -0.346 0.134 0.280 0.00468 0.00347
(0.0113) (0.210) (0.456) (0.473) (0.317) (0.501) Student receives homework help from a family member 0.0409 0.495 -0.184 -1.630 -0.00433 0.00452
(0.965) (0.477) (0.738) (0.154) (0.796) (0.799)
Student has books at home -1.150 -1.670* -0.800 -0.545 0.00737 0.0141
(0.353) (0.0580) (0.175) (0.682) (0.623) (0.370)
Student brings books home from school -2.637** 1.896* 0.315 5.010*** 0.0128 0.00686
(0.0254) (0.0783) (0.740) (0.000958) (0.625) (0.804) Highest level of education in the household 1.040 1.148** 0.252 1.302 0.0208*** 0.0129**
(0.104) (0.0168) (0.445) (0.227) (0.00565) (0.0121)
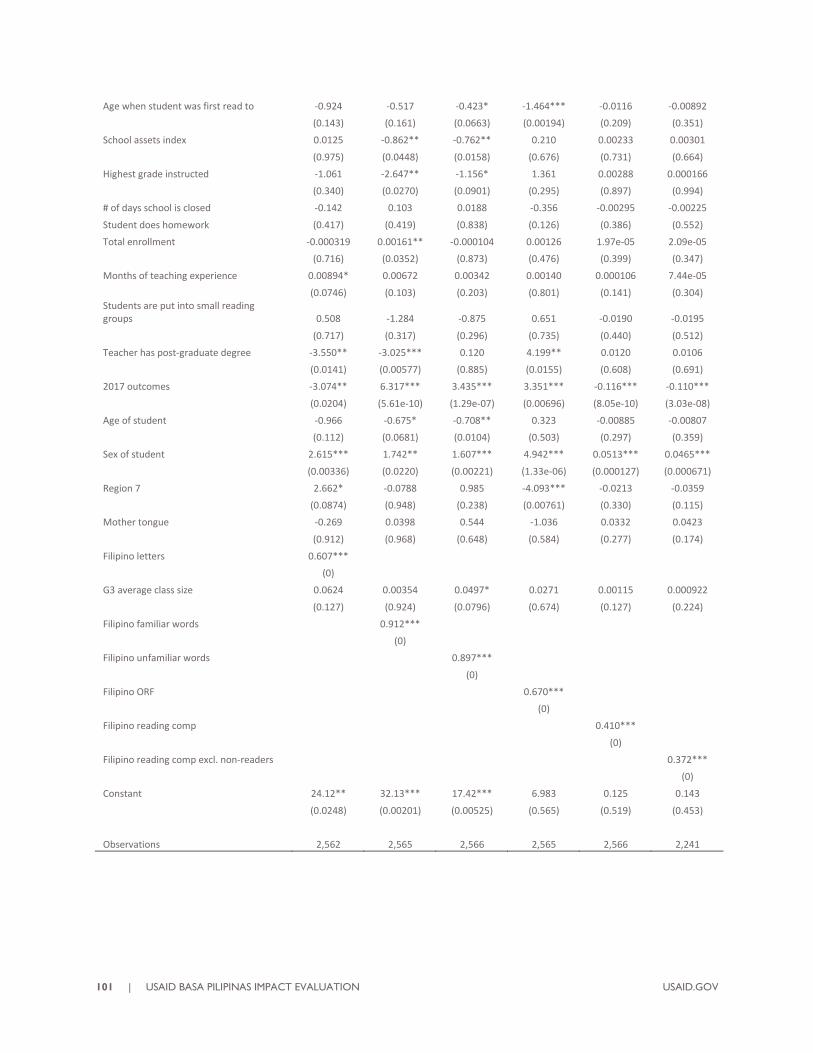
101 | USAID BASA PILIPINAS IMPACT EVALUATION USAID.GOV
Age when student was first read to -0.924 -0.517 -0.423* -1.464*** -0.0116 -0.00892
(0.143) (0.161) (0.0663) (0.00194) (0.209) (0.351)
School assets index 0.0125 -0.862** -0.762** 0.210 0.00233 0.00301
(0.975) (0.0448) (0.0158) (0.676) (0.731) (0.664)
Highest grade instructed -1.061 -2.647** -1.156* 1.361 0.00288 0.000166
(0.340) (0.0270) (0.0901) (0.295) (0.897) (0.994)
# of days school is closed -0.142 0.103 0.0188 -0.356 -0.00295 -0.00225
Student does homework (0.417) (0.419) (0.838) (0.126) (0.386) (0.552)
Total enrollment -0.000319 0.00161** -0.000104 0.00126 1.97e-05 2.09e-05
(0.716) (0.0352) (0.873) (0.476) (0.399) (0.347)
Months of teaching experience 0.00894* 0.00672 0.00342 0.00140 0.000106 7.44e-05
(0.0746) (0.103) (0.203) (0.801) (0.141) (0.304) Students are put into small reading groups 0.508 -1.284 -0.875 0.651 -0.0190 -0.0195
(0.717) (0.317) (0.296) (0.735) (0.440) (0.512)
Teacher has post-graduate degree -3.550** -3.025*** 0.120 4.199** 0.0120 0.0106
(0.0141) (0.00577) (0.885) (0.0155) (0.608) (0.691)
2017 outcomes -3.074** 6.317*** 3.435*** 3.351*** -0.116*** -0.110***
(0.0204) (5.61e-10) (1.29e-07) (0.00696) (8.05e-10) (3.03e-08)
Age of student -0.966 -0.675* -0.708** 0.323 -0.00885 -0.00807
(0.112) (0.0681) (0.0104) (0.503) (0.297) (0.359)
Sex of student 2.615*** 1.742** 1.607*** 4.942*** 0.0513*** 0.0465***
(0.00336) (0.0220) (0.00221) (1.33e-06) (0.000127) (0.000671)
Region 7 2.662* -0.0788 0.985 -4.093*** -0.0213 -0.0359
(0.0874) (0.948) (0.238) (0.00761) (0.330) (0.115)
Mother tongue -0.269 0.0398 0.544 -1.036 0.0332 0.0423
(0.912) (0.968) (0.648) (0.584) (0.277) (0.174)
Filipino letters 0.607***
(0)
G3 average class size 0.0624 0.00354 0.0497* 0.0271 0.00115 0.000922
(0.127) (0.924) (0.0796) (0.674) (0.127) (0.224)
Filipino familiar words 0.912***
(0)
Filipino unfamiliar words 0.897***
(0)
Filipino ORF 0.670***
(0)
Filipino reading comp 0.410***
(0)
Filipino reading comp excl. non-readers 0.372***
(0)
Constant 24.12** 32.13*** 17.42*** 6.983 0.125 0.143
(0.0248) (0.00201) (0.00525) (0.565) (0.519) (0.453)
Observations 2,562 2,565 2,566 2,565 2,566 2,241

USAID.GOV USAID BASA PILIPINAS IMPACT EVALUATION | 102
Regressions – Filipino G4
Letter sounds correct per
minute
Familiar words correct per
minute
Unfamiliar words correct
per minute
Oral reading fluency, correct
per minute
Reading comp., % correct
Reading comp. (no zeros), %
correct
Treatment = Basa 0.300 -1.185 -0.767 -1.442 -0.0931*** -0.0992***
(0.817) (0.180) (0.390) (0.204) (0.00149) (0.00104)
Household assets index 0.964** 0.186 -0.270 -0.348 -0.00554 -0.00453
(0.0120) (0.546) (0.213) (0.329) (0.546) (0.604)
Student attended kindergarten 2.217 0.931 -0.224 0.412 0.0261 0.0232
(0.408) (0.601) (0.882) (0.893) (0.588) (0.625) Student’s age when first attended kindergarten -1.055 -0.880 -0.400 -0.168 -0.0197 -0.0143
(0.443) (0.330) (0.558) (0.884) (0.408) (0.555)
Student does homework 0.180 0.0904 -0.0821 0.0534 -0.0118 -0.0129
(0.665) (0.734) (0.691) (0.860) (0.198) (0.164) Student receives homework help from a family member 0.959 -0.260 0.180 0.151 0.0137 0.00902
(0.474) (0.780) (0.790) (0.894) (0.618) (0.735)
Student has books at home 0.958 1.665* 0.825 1.770 0.0395 0.0369
(0.567) (0.0980) (0.231) (0.157) (0.212) (0.247)
Student brings books home from school 1.603 2.700 0.345 -1.767 0.00596 0.00510
(0.327) (0.137) (0.832) (0.371) (0.905) (0.921) Highest level of education in the household -0.600 0.367 0.261 0.696 0.0282** 0.0283**
(0.294) (0.671) (0.420) (0.338) (0.0117) (0.0126)
Age when student was first read to 0.0987 -0.156 -0.186 -0.817 -0.00447 0.000478
(0.900) (0.752) (0.629) (0.221) (0.736) (0.970)
School assets index -0.915 -0.942* 0.268 -0.332 -0.00710 -0.00462
(0.222) (0.0697) (0.520) (0.690) (0.741) (0.827)
Highest grade instructed -1.440 0.911 -0.385 2.246 -0.124*** -0.118***
(0.529) (0.709) (0.784) (0.391) (0.00240) (0.00329)
# of days school is closed -0.0779 -0.0589 -0.00835 0.162 -0.00220 -0.00121
Student does homework (0.661) (0.637) (0.914) (0.200) (0.439) (0.671)
Total enrollment 0.00676*** 0.00483*** 0.00546*** 0.00346 0.000143*** 0.000118***
(0.000136) (0.00240) (0.000636) (0.316) (0.000474) (0.000231)
Months of teaching experience 0.000329 0.00140 0.00100 0.00980** 0.000101 6.49e-05
(0.953) (0.769) (0.757) (0.0408) (0.451) (0.621) Students are put into small reading groups 2.213 1.074 -0.452 1.297 0.00843 0.00678
(0.169) (0.440) (0.718) (0.514) (0.850) (0.879)
Teacher has post-graduate degree -3.262** -0.584 -1.741* -0.0941 -0.0277 -0.0182
(0.0161) (0.699) (0.0952) (0.941) (0.582) (0.718)
Age of student 0.499 0.591 0.583 0.844 0.0221 0.0155
(0.593) (0.312) (0.251) (0.407) (0.174) (0.323)
Sex of student 5.413*** 3.999*** 2.307*** 3.364*** 0.0294 0.0302
(2.17e-05) (1.43e-05) (0.000159) (0.00198) (0.309) (0.293)
Region 7 1.410 -0.379 -1.920* 0.137 -0.136** -0.138**
(0.381) (0.815) (0.0573) (0.931) (0.0158) (0.0134)
Mother tongue 0.669 1.098 2.122 0.840 -0.0215 -0.0191
(0.868) (0.566) (0.224) (0.717) (0.816) (0.835)

103 | USAID BASA PILIPINAS IMPACT EVALUATION USAID.GOV
Filipino letters 0.647***
(0)
Filipino familiar words 0.533***
(0)
Filipino unfamiliar words 0.673***
(0)
Filipino ORF 0.813***
(0)
Filipino reading comp 0.623***
(0)
Filipino reading comp excl. non-readers 0.604***
(0)
G4 average class size -0.125** -0.0229 -0.0484 0.0591 0.000759 0.00106
(0.0126) (0.600) (0.162) (0.302) (0.558) (0.403)
Constant 14.60 -5.448 5.972 -9.608 0.673* 0.656*
(0.513) (0.780) (0.627) (0.659) (0.0745) (0.0848)
Observations 1,177 1,178 1,177 1,177 1,178 1,119
Regressions – English G2
Letter sounds correct per
minute
Familiar words correct per
minute
Unfamiliar words correct
per minute
Oral reading fluency, correct
per minute
Reading comp., % correct
Reading comp. (no zeros), %
correct
Treatment = Basa 2.169*** 0.970 1.374* 2.501 0.0343 0.0173
(0.00577) (0.398) (0.0891) (0.140) (0.408) (0.674)
English letters 0.552***
(0)
G2 average class size -0.142*** -0.00291 0.0915** -0.0312 -0.000578 -0.000693
(0.00319) (0.961) (0.0181) (0.710) (0.705) (0.662)
Household assets index 0.936*** 0.788 0.430* 1.485*** 0.0273** 0.0251**
(0.00118) (0.132) (0.0713) (0.00510) (0.0144) (0.0297)
Student attended kindergarten 6.790*** 4.676 3.897** 9.002 0.237** 0.212*
(0.00236) (0.177) (0.0356) (0.140) (0.0437) (0.0813) Student’s age when first attended kindergarten 0.0156 -0.245 -0.0225 -1.163 -0.0218 -0.0204
(0.986) (0.830) (0.979) (0.376) (0.565) (0.566)
Student does homework 0.176 0.101 0.317 0.158 0.0120 0.0165
(0.544) (0.814) (0.174) (0.719) (0.268) (0.163) Student receives homework help from a family member -1.095 0.610 -0.942 -0.918 -0.0537 -0.0766**
(0.248) (0.633) (0.219) (0.456) (0.137) (0.0304)
Student has books at home -0.0558 0.821 -0.642 2.636 0.00705 -0.00392
(0.965) (0.664) (0.437) (0.106) (0.861) (0.923)
Student brings books home from school 2.137 0.628 1.333 7.351** 0.0840 0.0527
(0.119) (0.741) (0.372) (0.0455) (0.175) (0.385)
Highest level of education in the household 0.462 0.306 0.438 1.046 0.0218 0.0211
(0.220) (0.662) (0.339) (0.293) (0.239) (0.287)
Age when student was first read to 0.128 -1.019 -0.232 -1.246 -0.0467** -0.0439**
(0.792) (0.114) (0.532) (0.181) (0.0235) (0.0293)
School assets index 1.014 0.468 0.116 0.572 0.0370** 0.0228
(0.126) (0.504) (0.816) (0.450) (0.0444) (0.232)
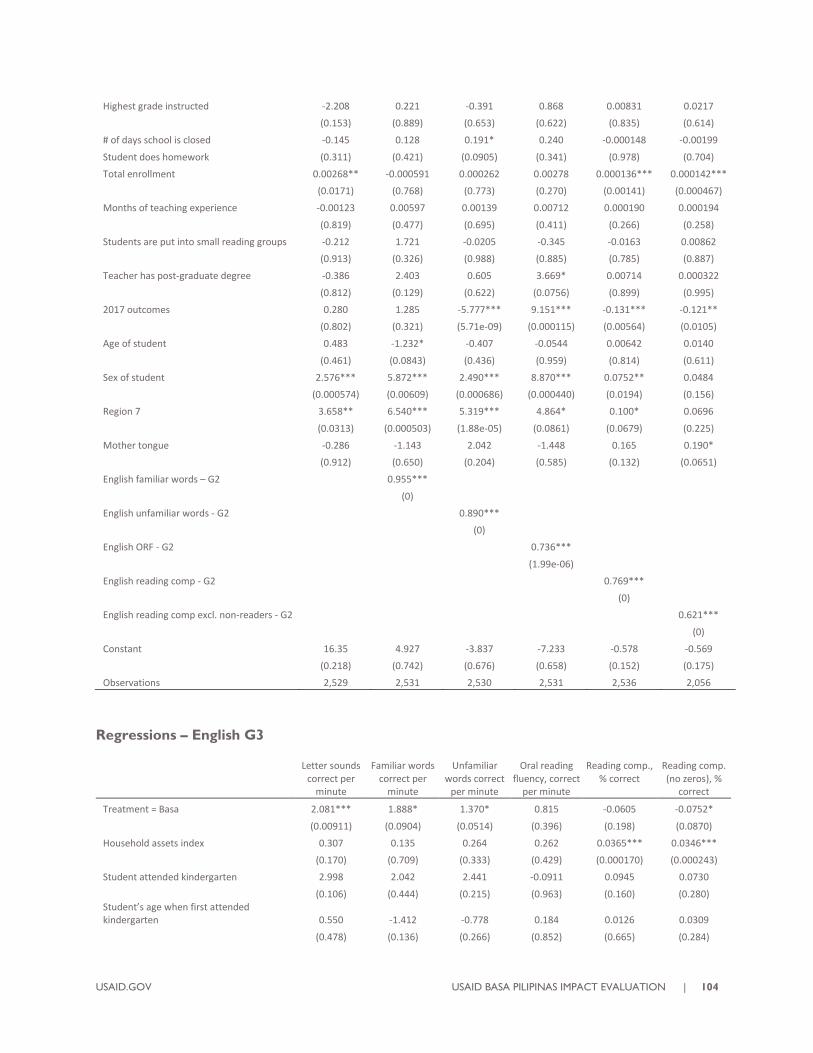
USAID.GOV USAID BASA PILIPINAS IMPACT EVALUATION | 104
Highest grade instructed -2.208 0.221 -0.391 0.868 0.00831 0.0217
(0.153) (0.889) (0.653) (0.622) (0.835) (0.614)
# of days school is closed -0.145 0.128 0.191* 0.240 -0.000148 -0.00199
Student does homework (0.311) (0.421) (0.0905) (0.341) (0.978) (0.704)
Total enrollment 0.00268** -0.000591 0.000262 0.00278 0.000136*** 0.000142***
(0.0171) (0.768) (0.773) (0.270) (0.00141) (0.000467)
Months of teaching experience -0.00123 0.00597 0.00139 0.00712 0.000190 0.000194
(0.819) (0.477) (0.695) (0.411) (0.266) (0.258)
Students are put into small reading groups -0.212 1.721 -0.0205 -0.345 -0.0163 0.00862
(0.913) (0.326) (0.988) (0.885) (0.785) (0.887)
Teacher has post-graduate degree -0.386 2.403 0.605 3.669* 0.00714 0.000322
(0.812) (0.129) (0.622) (0.0756) (0.899) (0.995)
2017 outcomes 0.280 1.285 -5.777*** 9.151*** -0.131*** -0.121**
(0.802) (0.321) (5.71e-09) (0.000115) (0.00564) (0.0105)
Age of student 0.483 -1.232* -0.407 -0.0544 0.00642 0.0140
(0.461) (0.0843) (0.436) (0.959) (0.814) (0.611)
Sex of student 2.576*** 5.872*** 2.490*** 8.870*** 0.0752** 0.0484
(0.000574) (0.00609) (0.000686) (0.000440) (0.0194) (0.156)
Region 7 3.658** 6.540*** 5.319*** 4.864* 0.100* 0.0696
(0.0313) (0.000503) (1.88e-05) (0.0861) (0.0679) (0.225)
Mother tongue -0.286 -1.143 2.042 -1.448 0.165 0.190*
(0.912) (0.650) (0.204) (0.585) (0.132) (0.0651)
English familiar words – G2 0.955***
(0)
English unfamiliar words - G2 0.890***
(0)
English ORF - G2 0.736***
(1.99e-06)
English reading comp - G2 0.769***
(0)
English reading comp excl. non-readers - G2 0.621***
(0)
Constant 16.35 4.927 -3.837 -7.233 -0.578 -0.569
(0.218) (0.742) (0.676) (0.658) (0.152) (0.175)
Observations 2,529 2,531 2,530 2,531 2,536 2,056
Regressions – English G3
Letter sounds correct per
minute
Familiar words correct per
minute
Unfamiliar words correct
per minute
Oral reading fluency, correct
per minute
Reading comp., % correct
Reading comp. (no zeros), %
correct
Treatment = Basa 2.081*** 1.888* 1.370* 0.815 -0.0605 -0.0752*
(0.00911) (0.0904) (0.0514) (0.396) (0.198) (0.0870)
Household assets index 0.307 0.135 0.264 0.262 0.0365*** 0.0346***
(0.170) (0.709) (0.333) (0.429) (0.000170) (0.000243)
Student attended kindergarten 2.998 2.042 2.441 -0.0911 0.0945 0.0730
(0.106) (0.444) (0.215) (0.963) (0.160) (0.280) Student’s age when first attended kindergarten 0.550 -1.412 -0.778 0.184 0.0126 0.0309
(0.478) (0.136) (0.266) (0.852) (0.665) (0.284)

105 | USAID BASA PILIPINAS IMPACT EVALUATION USAID.GOV
Student does homework 0.662** -0.190 0.0275 0.187 0.00755 0.00740
(0.0166) (0.618) (0.912) (0.580) (0.579) (0.596) Student receives homework help from a family member -0.650 -0.0653 -0.944 -0.849 0.00886 0.0224
(0.396) (0.947) (0.213) (0.412) (0.793) (0.504)
Student has books at home -0.971 1.651 -0.162 -1.697 -0.0310 -0.0179
(0.384) (0.197) (0.872) (0.140) (0.399) (0.645)
Student brings books home from school 0.444 4.282** 0.0955 3.361* -0.0358 -0.0702
(0.714) (0.0492) (0.937) (0.0923) (0.553) (0.224) Highest level of education in the household 1.127* 1.436** 0.719* 1.281** 0.0223 0.0166
(0.0883) (0.0219) (0.0581) (0.0265) (0.278) (0.401)
Age when student was first read to -1.488*** -0.615 -0.628 -0.801 -0.0403** -0.0342**
(0.000573) (0.208) (0.129) (0.104) (0.0228) (0.0466)
School assets index 0.184 -1.088* -0.244 -0.740 0.00300 0.00485
(0.667) (0.0666) (0.549) (0.216) (0.862) (0.791)
Highest grade instructed -1.262 -1.195 0.255 1.468 -0.0491 -0.0613
(0.329) (0.482) (0.842) (0.536) (0.369) (0.229)
# of days school is closed 0.0359 -0.361 -0.191 -0.306 -0.00977 -0.00779
Student does homework (0.769) (0.148) (0.295) (0.127) (0.106) (0.169)
Total enrollment 0.000497 0.00227* 0.00144 0.00616*** 4.37e-05 3.02e-05
(0.566) (0.0903) (0.321) (1.73e-06) (0.310) (0.494)
Months of teaching experience 0.00235 0.00261 0.00344 0.00330 0.000281 0.000297*
(0.577) (0.638) (0.344) (0.575) (0.118) (0.0735)
Students are put into small reading groups -0.639 -0.493 0.0246 -1.204 0.0637 0.0875
(0.697) (0.761) (0.986) (0.333) (0.455) (0.336)
Teacher has post-graduate degree -1.874 -3.101* -2.572** -3.021* -0.0647 -0.0500
(0.103) (0.0584) (0.0453) (0.0912) (0.202) (0.318)
2017 outcomes -4.746*** 6.194*** 0.401 10.85*** 0.0176 0.00587
(3.21e-06) (1.37e-05) (0.702) (0) (0.643) (0.880)
Age of student -0.529 -1.146 -1.118* -1.243* -0.0210 -0.0278
(0.406) (0.126) (0.0572) (0.0703) (0.338) (0.213)
Sex of student 1.997** 0.520 1.828*** 3.213*** 0.136*** 0.120***
(0.0116) (0.628) (0.00813) (0.00168) (2.23e-05) (0.000114)
Region 7 4.062*** 2.195 2.935** 0.815 0.153** 0.147**
(0.000743) (0.214) (0.0148) (0.634) (0.0181) (0.0161)
Mother tongue 1.409 -0.997 -0.320 0.450 0.0703 0.0939
(0.439) (0.686) (0.879) (0.824) (0.454) (0.302)
English letters 0.625***
(0) G3 average class size at the end of the school year 0.00772 -0.00127 -0.0128 -0.0490 -0.000812 -0.00123
(0.828) (0.979) (0.768) (0.374) (0.552) (0.402)
English familiar words 0.896***
(0)
English unfamiliar words 0.856***
(0)
English ORF 0.894***
(0)
English reading comp. 0.772***
(0)

USAID.GOV USAID BASA PILIPINAS IMPACT EVALUATION | 106
English reading comp. excl. non-readers 0.696***
(0)
Constant 22.24** 31.89** 17.94* 9.420 0.244 0.337
(0.0407) (0.0408) (0.0932) (0.637) (0.619) (0.464)
Observations 2,562 2,566 2,566 2,566 2,566 2,317
Regressions – English G4
Letter sounds correct per
minute
Familiar words correct per
minute
Unfamiliar words correct
per minute
Oral reading fluency, correct
per minute
Reading comp., % correct
Reading comp. (no zeros), %
correct
Treatment = Basa 1.090 0.124 -0.404 0.988 -0.0688* -0.0776**
(0.314) (0.919) (0.715) (0.603) (0.0829) (0.0489)
Household assets index 0.203 0.380 0.0297 -0.347 0.0192 0.0206
(0.608) (0.320) (0.925) (0.418) (0.147) (0.124)
Student attended kindergarten -1.627 -2.442 -3.343* 0.0634 0.0569 0.0524
(0.477) (0.274) (0.0764) (0.985) (0.554) (0.584) Student’s age when first attended kindergarten -2.733** -0.217 -0.182 -0.811 -0.0672 -0.0598
(0.0434) (0.827) (0.836) (0.591) (0.129) (0.181)
Student does homework 0.191 0.496 0.691** 0.528 0.000690 0.000595
(0.610) (0.171) (0.0150) (0.300) (0.955) (0.961) Student receives homework help from a family member 1.014 -1.604 -1.132 0.890 -0.0981** -0.105**
(0.428) (0.203) (0.281) (0.546) (0.0216) (0.0139)
Student has books at home 1.302 1.538 0.0627 1.514 0.0280 0.0272
(0.357) (0.244) (0.953) (0.339) (0.579) (0.600)
Student brings books home from school -3.250 -4.056* 0.439 -1.326 -0.0196 -0.0357
(0.342) (0.0994) (0.854) (0.732) (0.775) (0.600) Highest level of education in the household 0.102 0.749 0.632 0.648 0.0506 0.0524
(0.907) (0.469) (0.218) (0.427) (0.163) (0.162)
Age when student was first read to -0.508 -1.101 -1.670*** -1.338 -0.0178 -0.0114
(0.424) (0.115) (0.000758) (0.101) (0.512) (0.678)
School assets index -0.0878 -1.030 -1.000* 0.370 -0.0352 -0.0307
(0.935) (0.172) (0.0611) (0.711) (0.138) (0.196)
Highest grade instructed -2.705 0.142 2.430 6.303** -0.173* -0.177*
(0.364) (0.961) (0.407) (0.0249) (0.0808) (0.0760)
# of days school is closed -0.182 -0.143 -0.152 0.231 -0.0103** -0.0105**
Student does homework (0.433) (0.378) (0.201) (0.382) (0.0330) (0.0370)
Total enrollment 0.00428* 0.00632** 0.00507*** 0.00755*** 0.000235*** 0.000198***
(0.0667) (0.0125) (0.00847) (0.00827) (5.90e-08) (1.17e-05)
Months of teaching experience -0.000251 0.00311 -0.000699 -0.00132 0.000285 0.000273
(0.970) (0.581) (0.886) (0.844) (0.164) (0.185)
Students in small groups by reading level 2.264 3.025* 0.754 1.370 0.119** 0.128**
(0.376) (0.0911) (0.605) (0.557) (0.0306) (0.0211)
Teacher has a post-bachelor degree -1.999 -0.0912 0.470 -0.162 -0.0356 -0.0261
(0.431) (0.966) (0.756) (0.934) (0.523) (0.652)
2017 outcomes
Age of student
-0.323 0.454 0.185 1.172 0.0458 0.0383
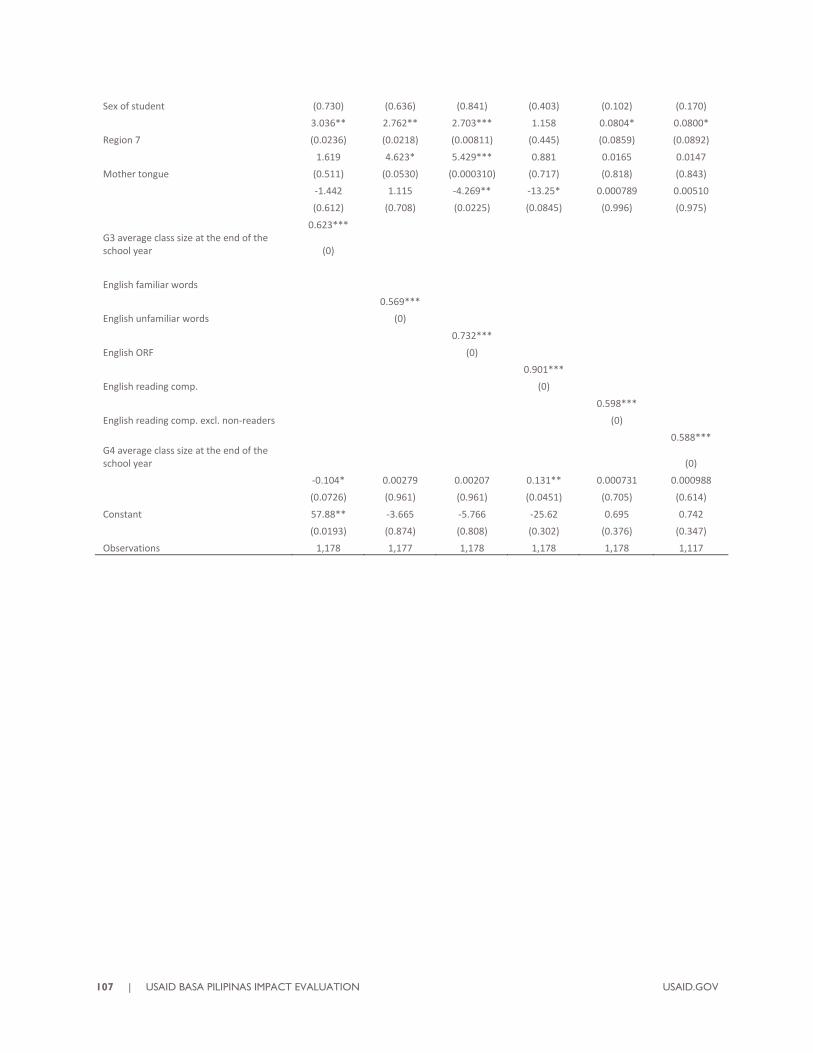
107 | USAID BASA PILIPINAS IMPACT EVALUATION USAID.GOV
Sex of student (0.730) (0.636) (0.841) (0.403) (0.102) (0.170)
3.036** 2.762** 2.703*** 1.158 0.0804* 0.0800*
Region 7 (0.0236) (0.0218) (0.00811) (0.445) (0.0859) (0.0892)
1.619 4.623* 5.429*** 0.881 0.0165 0.0147
Mother tongue (0.511) (0.0530) (0.000310) (0.717) (0.818) (0.843)
-1.442 1.115 -4.269** -13.25* 0.000789 0.00510
(0.612) (0.708) (0.0225) (0.0845) (0.996) (0.975)
0.623*** G3 average class size at the end of the school year (0)
English familiar words
0.569***
English unfamiliar words (0)
0.732***
English ORF (0)
0.901***
English reading comp. (0)
0.598***
English reading comp. excl. non-readers (0)
0.588*** G4 average class size at the end of the school year (0)
-0.104* 0.00279 0.00207 0.131** 0.000731 0.000988
(0.0726) (0.961) (0.961) (0.0451) (0.705) (0.614)
Constant 57.88** -3.665 -5.766 -25.62 0.695 0.742
(0.0193) (0.874) (0.808) (0.302) (0.376) (0.347)
Observations 1,178 1,177 1,178 1,178 1,178 1,117

USAID.GOV USAID BASA PILIPINAS IMPACT EVALUATION | 108
EGRA Zero Scores
English
Letter sounds
correct per minute
Familiar words
correct per minute
Unfamiliar words
correct per minute
Oral reading fluency,
correct per minute
Letter sounds
correct per minute
Familiar words
correct per minute
Unfamiliar words
correct per minute
Oral reading fluency,
correct per minute
Letter sounds
correct per minute
Familiar words
correct per minute
Unfamiliar words
correct per minute
Oral reading fluency,
correct per minute
Reading comp., % correct
Reading comp., % correct
Reading comp., % correct
VARIABLE Grade 2 Grade 2 Grade 2 Grade 2 Grade 3 Grade 3 Grade 3 Grade 3 Grade 4 Grade 4 Grade 4 Grade 4 Grade 2 Grade 3 Grade 4
Treatment = Basa 1.751** 1.103 1.448* 1.532** 1.874** 1.344 0.950 1.103 0.737 0.674 0.742 1.386 1.308 0.865 0.735
(0.0244) (0.602) (0.0899) (0.0357) (0.0273) (0.332) (0.820) (0.813) (0.617) (0.350) (0.444) (0.747) (0.201) (0.315) (0.142)
G2 English letters zero scores 3.650***
(1.82e-05) G2 average class size 0.982 0.999 1.012 1.010 0.984
(0.200) (0.882) (0.167) (0.363) (0.122) 2017 outcomes 1.046 1.275 1.720** 1.071 0.436** 1.711 1.059 1.947* 0.973
(0.901) (0.251) (0.0451) (0.818) (0.0231) (0.158) (0.845) (0.0876) (0.849) Age of student 0.992 1.144 1.085 0.946 1.023 0.760** 0.792** 0.714** 0.959 1.330 1.174 1.071 1.220 0.925 1.249*
(0.973) (0.237) (0.473) (0.658) (0.885) (0.0346) (0.0133) (0.0236) (0.886) (0.286) (0.458) (0.931) (0.131) (0.345) (0.0963)
Sex of student 2.435*** 2.016*** 1.494* 1.989** 1.418 1.351 1.830*** 1.883 0.898 1.933 2.091** 0.502 1.407* 1.525*** 1.512**
(0.000718) (0.00542) (0.0761) (0.0130) (0.233) (0.286) (0.00849) (0.111) (0.849) (0.106) (0.0233) (0.323) (0.0606) (0.00114) (0.0474)
Region 7 0.771 2.131** 1.868* 0.888 1.953* 2.268* 1.817* 1.861 11.03*** 7.457*** 2.353 5.150 1.743** 1.557* 1.755
(0.582) (0.0107) (0.0604) (0.801) (0.0919) (0.0716) (0.0952) (0.330) (0.00844) (0.000292) (0.239) (0.208) (0.0486) (0.0874) (0.170)
Mother tongue 0.558 0.627 0.669 0.447 0.638 0.348 0.625 0.0598*** 0.0226*** 0.124*** 2.335* 1.049 0.842
(0.537) (0.501) (0.591) (0.447) (0.663) (0.388) (0.629) (0.000709) (0.00185) (0.00957) (0.0723) (0.875) (0.822)
Households assets index 1.249** 1.103 1.151** 1.097 0.960 0.970 1.011 1.001 1.090 1.027 1.151 1.285 1.057 1.102** 1.131*
(0.0164) (0.154) (0.0357) (0.261) (0.646) (0.778) (0.889) (0.996) (0.629) (0.865) (0.287) (0.521) (0.336) (0.0174) (0.0515)
Student attended kindergarten 1.988 4.167*** 2.378** 1.153 3.327*** 0.523 0.784 0.115** 0.659 2.298 0.281 0.208 2.947* 1.266 1.237
(0.215) (0.001000) (0.0401) (0.811) (0.00995) (0.395) (0.579) (0.0341) (0.643) (0.260) (0.266) (0.425) (0.0541) (0.379) (0.624)
Student’s age when first 1.126 0.859 0.981 0.895 0.765 1.033 1.318 1.151 0.435 0.700 0.589 0.353 0.867 1.123 0.713*

109 | USAID BASA PILIPINAS IMPACT EVALUATION USAID.GOV
attended kindergarten
(0.690) (0.485) (0.936) (0.680) (0.406) (0.905) (0.246) (0.688) (0.240) (0.354) (0.117) (0.380) (0.476) (0.350) (0.0958)
Student does homework 0.923 0.909 1.029 0.919 1.029 1.203** 1.105 1.050 1.512* 1.046 1.185 0.789 1.114* 0.982 1.030
(0.291) (0.193) (0.629) (0.145) (0.756) (0.0490) (0.309) (0.686) (0.0772) (0.786) (0.200) (0.299) (0.0721) (0.723) (0.647)
Student receives homework help 0.821 1.388 1.517* 1.121 0.731 0.367*** 0.427*** 0.572 0.623 0.569 1.146 0.0905*** 0.911 0.991 0.595***
(0.530) (0.223) (0.0555) (0.666) (0.290) (0.00435) (0.00423) (0.141) (0.503) (0.212) (0.760) (0.00307) (0.614) (0.942) (0.00979)
Student has books at home 1.067 1.194 0.746 1.332 1.172 0.783 0.867 0.573 2.277 1.187 0.978 1.980 1.094 0.979 0.991
(0.842) (0.474) (0.184) (0.350) (0.683) (0.468) (0.602) (0.243) (0.254) (0.678) (0.952) (0.450) (0.673) (0.880) (0.971)
Student brings books home from school 0.944 1.470 1.983* 2.017** 0.180* 2.029** 1.367 1.350 0.0257*** 1.292 3.797** 1.189 1.081 0.977 0.863
(0.885) (0.291) (0.0683) (0.0326) (0.0850) (0.0285) (0.357) (0.641) (0.00244) (0.646) (0.0185) (0.879) (0.825) (0.921) (0.698)
Highest level of education in the household 1.221 0.963 0.999 1.080 1.211 1.063 1.517 1.944 1.401 1.497 0.994 0.710 1.045 1.111 1.237
(0.496) (0.683) (0.997) (0.369) (0.722) (0.667) (0.123) (0.131) (0.659) (0.463) (0.981) (0.107) (0.667) (0.242) (0.218)
Student’s age when first read to 1.191 0.885 0.843* 0.848 0.841 0.774* 0.771** 0.633** 0.909 0.691 0.517*** 3.069** 0.721*** 0.793*** 0.862
(0.153) (0.253) (0.0875) (0.189) (0.282) (0.0826) (0.0478) (0.0289) (0.819) (0.223) (0.000238) (0.0422) (0.00168) (0.00212) (0.242)
School assets index 1.041 1.151 0.958 1.231 0.949 0.628** 1.080 0.796 1.071 0.763 0.774 0.939 1.196* 0.950 0.886
(0.794) (0.215) (0.718) (0.302) (0.696) (0.0354) (0.554) (0.409) (0.893) (0.386) (0.338) (0.866) (0.0662) (0.428) (0.347)
Highest grade instructed 1.165 0.627 0.706 0.158*** 1.147 2.212** 1.505 0.264 0.00822** 0.553 1.009 20.27*** 0.398* 1.059 0.514
(0.602) (0.194) (0.328) (0.000737) (0.728) (0.0276) (0.234) (0.233) (0.0389) (0.657) (0.993) (0.00498) (0.0647) (0.748) (0.196)
# of days school is closed 1.007 1.038 1.045 1.117 1.073 1.014 1.023 0.949 0.819** 0.962 0.968 0.914 1.007 0.988 0.969
(0.885) (0.248) (0.296) (0.172) (0.342) (0.754) (0.460) (0.355) (0.0359) (0.532) (0.483) (0.425) (0.914) (0.590) (0.200)
Total enrollment 1.001 1.000 1.000 0.999 1.001 1.000 1.000 1.000 1.001 1.001 1.002* 1.010* 1.000 1.000 1.001***
(0.260) (0.587) (0.614) (0.124) (0.244) (0.758) (0.949) (0.442) (0.332) (0.303) (0.0578) (0.0535) (0.156) (0.147) (4.52e-05)

USAID.GOV USAID BASA PILIPINAS IMPACT EVALUATION | 110
Months of teaching experience 0.999 1.002* 1.001 0.999 0.998 1.001 0.999 0.998 1.006 1.001 0.999 0.996 1.001 1.001 1.001
(0.471) (0.0618) (0.494) (0.657) (0.356) (0.474) (0.360) (0.371) (0.125) (0.721) (0.486) (0.318) (0.183) (0.224) (0.203)
Students in small groups by reading level 0.653 0.909 0.947 1.512 0.151*** 0.114* 2.057* 0.732 1.425 0.690 0.918 37.16*** 0.856 1.480 1.435
(0.373) (0.838) (0.887) (0.370) (0.000994) (0.0566) (0.0660) (0.761) (0.728) (0.586) (0.914) (0.000130) (0.593) (0.212) (0.198)
Post-bachelor degree 0.704 1.325 1.523 0.634 1.062 0.800 1.499 0.712 0.665 2.139 0.768 0.521 0.698 0.695* 1.089
(0.468) (0.313) (0.120) (0.218) (0.877) (0.635) (0.265) (0.509) (0.480) (0.177) (0.710) (0.329) (0.315) (0.0837) (0.805)
English familiar words zero scores – G2 29.20***
(0) English unfamiliar words zero scores – G2 23.30***
(0)
English ORF zero scores 14.12***
(0) English letters zero scores 6.216*** 4.723**
(1.54e-05) (0.0255) G3 average class size 0.990 1.016 0.995 1.007 0.995
(0.454) (0.156) (0.640) (0.684) (0.273) English familiar words zero scores 109.8*** 62.44***
(0) (0) English unfamiliar words zero scores 33.00*** 37.15***
(0) (0) English ORF zero scores 43.68*** 29,901***

111 | USAID BASA PILIPINAS IMPACT EVALUATION USAID.GOV
(0) (6.97e-08) G4 average class size 0.969 0.996 0.983 0.981 1.002
(0.101) (0.858) (0.444) (0.501) (0.834)
English reading comp 4.408*** 4.110*** 4.866***
(0) (0) (1.11e-10)
Constant 0.802 1.493 0.683 1.683e+06*
** 225.6* 0.479 0.195 1.014e+08*
* 1.366e+19*
** 550.3 776.3 1.34e-10*** 55.10 0.525 15.38
(0.947) (0.895) (0.904) (0.00121) (0.0846) (0.845) (0.574) (0.0260) (0.00908) (0.553) (0.406) (0.00966) (0.292) (0.705) (0.490)
Observations 2,537 2,537 2,537 2,537 2,568 2,568 2,568 2,568 1,149 1,180 1,180 1,149 1,309 2,568 1,180

USAID.GOV USAID BASA PILIPINAS IMPACT EVALUATION | 112
Filipino
Letter sounds
correct per minute
Familiar words
correct per minute
Unfamiliar words
correct per minute
Oral reading fluency,
correct per minute
Letter sounds
correct per minute
Familiar words
correct per minute
Unfamiliar words
correct per minute
Oral reading fluency,
correct per minute
Letter sounds
correct per minute
Familiar words
correct per minute
Unfamiliar words
correct per minute
Oral reading fluency,
correct per minute
Reading comp., % correct
Reading comp., % correct
Reading comp., % correct
VARIABLE Grade 2 Grade 2 Grade 2 Grade 2 Grade 3 Grade 3 Grade 3 Grade 3 Grade 4 Grade 4 Grade 4 Grade 4 Grade 2 Grade 3 Grade 4
Treatment = Basa 1.038 1.316 1.574* 1.466* 1.394 0.942 1.204 2.012* 1.155 0.638 4.333*** 2.971 1.261 1.077 0.480***
(0.894) (0.302) (0.0528) (0.0600) (0.208) (0.886) (0.565) (0.0800) (0.746) (0.538) (0.00794) (0.334) (0.227) (0.572) (0.00432)
Filipino letters zero scores – G2 5.923***
(3.75e-08) G2 average class size 0.970** 0.991 0.999 0.981* 0.967***
(0.0104) (0.562) (0.953) (0.0715) (0.000833) 2017 outcomes 0.495** 3.332*** 2.811*** 2.988*** 0.751 0.955 1.132 2.736** 0.503***
(0.0133) (0.00743) (0.00271) (0.00276) (0.340) (0.910) (0.725) (0.0213) (2.87e-05) Age of student 0.904 1.060 0.987 1.034 1.123 1.057 0.809 0.989 0.871 5.537*** 1.236 0.562* 1.072 0.878 1.172
(0.403) (0.769) (0.927) (0.862) (0.484) (0.849) (0.183) (0.963) (0.661) (0.000228) (0.680) (0.0671) (0.633) (0.174) (0.221)
Sex of student 1.367* 1.475 2.003** 1.683** 1.291 2.664** 1.138 2.773** 1.716 1.022 0.580 3.069 1.720** 1.532*** 1.373
(0.0679) (0.246) (0.0192) (0.0134) (0.260) (0.0132) (0.705) (0.0371) (0.166) (0.977) (0.369) (0.176) (0.0137) (0.000889) (0.154)
Region 7 2.660** 2.945** 2.076 16.81*** 3.541*** 3.301** 0.953 0.964 2.146 10.90** 0.197* 38.57* 1.438 0.860 0.277***
(0.0265) (0.0315) (0.102) (7.53e-11) (0.000989) (0.0278) (0.926) (0.944) (0.351) (0.0306) (0.0793) (0.0614) (0.210) (0.482) (0.00680)
Mother tongue 0.0224*** 0.417 0.409 0.883 0.987 0.0580** 1.055 0.0362*** 2.910 0.0704 0.542 1.264 1.383
(3.06e-09) (0.319) (0.540) (0.788) (0.985) (0.0189) (0.966) (0.00384) (0.157) (0.103) (0.252) (0.504) (0.661)
Households assets index 1.078 1.102 1.065 1.121* 1.040 1.131 0.965 1.115 1.191 0.969 0.537** 0.899 1.004 1.046 0.951
(0.347) (0.360) (0.497) (0.0815) (0.700) (0.434) (0.735) (0.340) (0.237) (0.897) (0.0213) (0.574) (0.952) (0.285) (0.520)
Student attended kindergarten 1.883 1.975 0.720 1.241 1.790 0.462 0.894 1.527 1.574 1.059 0.745 0.0158* 1.964 0.754 1.274
(0.189) (0.466) (0.563) (0.753) (0.218) (0.519) (0.855) (0.604) (0.546) (0.974) (0.892) (0.0556) (0.210) (0.395) (0.512)
Student’s age when first attended kindergarten 0.796 1.162 0.745 0.943 1.044 0.634 0.878 0.868 0.388** 0.0396*** 0.222** 1.183 1.026 0.889 0.885

113 | USAID BASA PILIPINAS IMPACT EVALUATION USAID.GOV
(0.320) (0.616) (0.321) (0.740) (0.860) (0.194) (0.644) (0.678) (0.0290) (0.00123) (0.0222) (0.786) (0.883) (0.357) (0.486)
Student does homework 1.043 1.157 0.997 1.018 0.968 1.009 0.950 1.089 1.084 1.528* 0.817 2.484*** 0.917 1.069 0.885*
(0.638) (0.223) (0.972) (0.774) (0.662) (0.935) (0.635) (0.294) (0.642) (0.0597) (0.355) (5.69e-05) (0.143) (0.136) (0.0844)
Student receives homework help 1.388 0.893 2.159*** 1.105 1.209 0.523 0.645 0.580 1.213 1.121 0.858 0.341 0.816 0.858 1.110
(0.173) (0.744) (0.000473) (0.647) (0.472) (0.167) (0.191) (0.142) (0.688) (0.886) (0.830) (0.237) (0.325) (0.252) (0.607)
Student has books at home 1.044 1.100 0.871 1.086 0.741 0.616 1.155 1.275 1.995 0.470 0.517 1.417 1.556** 1.220 1.207
(0.882) (0.775) (0.614) (0.773) (0.343) (0.294) (0.719) (0.639) (0.159) (0.345) (0.333) (0.621) (0.0441) (0.142) (0.436)
Student brings books home from school 0.576 1.134 2.244* 1.616* 0.628 2.804 1.776 1.503 0.557 4.105*** 2.770* 1.042 1.711* 1.268 1.146
(0.126) (0.747) (0.0599) (0.0990) (0.462) (0.138) (0.160) (0.558) (0.443) (0.00208) (0.0624) (0.972) (0.0880) (0.300) (0.736)
Highest level of education in the household 1.607 1.009 1.081 1.131 1.250 1.186 0.961 1.565 1.027 1.944 0.802 2.993 1.043 1.497*** 1.630**
(0.125) (0.943) (0.649) (0.155) (0.618) (0.738) (0.862) (0.334) (0.924) (0.431) (0.145) (0.335) (0.752) (0.00215) (0.0258)
Student’s age when first read to 0.894 0.893 0.895 0.950 0.654*** 0.751 0.655*** 0.709 0.982 0.552* 1.937*** 0.331*** 0.868 0.924 0.902
(0.361) (0.483) (0.405) (0.680) (0.00297) (0.285) (0.00464) (0.122) (0.944) (0.0811) (0.000560) (0.00525) (0.231) (0.344) (0.342)
School assets index 0.687* 1.376* 1.042 1.050 0.748** 0.873 0.848 1.317 0.546* 0.366 0.253** 0.242** 1.025 1.009 0.910
(0.0696) (0.0660) (0.751) (0.661) (0.0381) (0.610) (0.444) (0.106) (0.0971) (0.120) (0.0185) (0.0114) (0.819) (0.905) (0.559)
Highest grade instructed 1.249 0.148*** 1.215 0.497 1.493 0.392 0.787 2.331 2.355 0.546 1.152 8.480 1.273 0.852 0.307***
(0.486) (0.00640) (0.505) (0.417) (0.243) (0.216) (0.733) (0.203) (0.129) (0.515) (0.902) (0.337) (0.547) (0.470) (0.000198)
# of days school is closed 0.995 0.951 1.089 0.984 0.976 1.007 1.015 1.003 1.004 1.093 1.003 0.874 1.082 0.975 0.987
(0.899) (0.408) (0.175) (0.714) (0.549) (0.883) (0.730) (0.969) (0.912) (0.155) (0.972) (0.140) (0.323) (0.386) (0.561)
Total enrollment 1.001** 1.000 0.999 1.001 1.000 1.000* 1.000* 0.999*** 1.003** 1.001 1.001* 0.999 1.000 1.000 1.001***
(0.0445) (0.717) (0.185) (0.273) (0.235) (0.0663) (0.0684) (0.000878) (0.0380) (0.172) (0.0684) (0.295) (0.162) (0.629) (0.00179)
Months of teaching experience 1.001 1.002 1.000 1.000 1.000 0.999 0.999 0.999 0.998 0.991* 1.000 1.007** 1.001 1.001* 1.000
(0.332) (0.194) (0.690) (0.759) (0.716) (0.474) (0.515) (0.575) (0.258) (0.0708) (0.986) (0.0492) (0.330) (0.0833) (0.855)

USAID.GOV USAID BASA PILIPINAS IMPACT EVALUATION | 114
Students in small groups by reading level 1.503 0.544 0.399* 0.518* 0.857 1.224 0.463 0.0627*** 0.332 0.915 0.463 0.123** 0.900 0.651** 1.088
(0.513) (0.408) (0.0954) (0.0972) (0.752) (0.805) (0.381) (0.000447) (0.242) (0.882) (0.236) (0.0452) (0.776) (0.0320) (0.810)
Post-bachelor degree 0.821 1.037 1.249 2.706** 0.972 6.588* 1.147 1.531 0.405 0.602 0.507 0.0893** 1.707 1.121 0.841
(0.586) (0.943) (0.612) (0.0171) (0.926) (0.0529) (0.791) (0.419) (0.217) (0.524) (0.284) (0.0141) (0.267) (0.564) (0.639)
Filipino familiar words zero scores – G2 91.49***
(0)
English unfamiliar words zero scores – G2 75.34***
(0)
Filipino ORF zero scores 1.099
(0.798) Filipino letters zero scores 6.803*** 2.672
(0) (0.166) G3 average class size 0.987 1.037** 1.023* 1.023 1.010*
(0.390) (0.0417) (0.0871) (0.268) (0.0966) Filipino familiar words zero scores 305.8*** 948.4***
(0) (7.37e-06) Filipino unfamiliar words zero scores 97.71*** 2,990***
(0) (0) Filipino ORF zero scores 123.1*** 599.1***
(8.32e-10) (9.36e-07)

115 | USAID BASA PILIPINAS IMPACT EVALUATION USAID.GOV
G4 average class size 0.979 0.965* 0.974 0.974 1.008
(0.296) (0.0980) (0.407) (0.399) (0.398)
Filipino reading comp 9.278*** 3.948*** 4.219***
(0) (0) (2.53e-09)
Constant 142.0* 83,900* 1.330 112.2 0.349 35,899* 348.5 1.439 17.59 70,390 966.7 0.156 0.0997 11.76 630.4**
(0.0805) (0.0567) (0.935) (0.482) (0.728) (0.0801) (0.306) (0.953) (0.637) (0.123) (0.493) (0.902) (0.455) (0.185) (0.0241)
Observations 2,537 2,537 2,537 2,537 2,568 2,568 2,568 2,568 1,180 1,149 1,180 1,149 1,309 2,568 1,180
Teacher Regression Results
VARIABLES
Attended session on early grade reading/wri
ting this/past
year
# of training days
received in tot last year
# of training days
received for mother tongue reading
Have a copy of DepEd Teacher’s manual
Puts students in
small groups several
times per month
Very familiar
with grammar rules and
alphabet in MT
1:1 ratio reading
learners' manuals in
MT
1:1 ratio of other
reading materials
inMT
very comfortable providing instruction
in MT
Minutes of class time using MT
Minutes of class time
using Filipino
Minutes of class time
using Fiipino
Teacher displayed 75%+ of relevant general teaching
behaviors
General teacher
behavior index
Reading-specific
practices index
Treatment = Basa 1.826*** 1.282 1.565** 0.426** 1.926*** 0.874 0.921 1.211 1.151 5.479 -0.234 0.104 -0.00980 0.00583 -0.0149
(0.00155) (0.214) (0.0449) (0.0361) (0.00241) (0.428) (0.670) (0.402) (0.407) (0.621) (0.961) (0.986) (0.796) (0.592) (0.290)
School reading average 1.288 1.245 1.878 1.100 1.656 0.972 1.051 0.997 0.983 12.69*** -1.854 -2.527* -0.00834 0.00235 -0.0144
(0.380) (0.476) (0.119) (0.692) (0.168) (0.761) (0.584) (0.972) (0.851) (0.00305) (0.279) (0.0845) (0.734) (0.764) (0.219)
School math average 1.166 1.267 0.865 0.837 1.082 1.066 1.120 1.269 1.192 -3.032 -0.0142 -3.123 -0.00612 0.00226 0.0124
(0.340) (0.169) (0.359) (0.458) (0.654) (0.608) (0.454) (0.167) (0.174) (0.682) (0.998) (0.424) (0.888) (0.846) (0.469)
Mother tongue is native language 0.643 0.457 1.065 0.962 0.334* 2.157* 2.294** 0.909 1.307 14.37 -27.54 -3.416 0.0448 -0.0260 0.0658
(0.421) (0.147) (0.894) (0.958) (0.0918) (0.0944) (0.0343) (0.827) (0.525) (0.559) (0.129) (0.785) (0.770) (0.404) (0.256)
1:1 ratio reading learners’ manuals in Filipino 1.547* 1.291 1.112 2.471** 2.189*** 0.796 11.12*** 1.638 0.996 3.181 -7.610 -2.586 -0.000272 0.00392 0.0121
(0.0747) (0.323) (0.701) (0.0369) (0.00511) (0.289) (0) (0.119) (0.986) (0.828) (0.385) (0.742) (0.996) (0.799) (0.530)
1:1 ratio of other 1.042 1.129 0.921 0.579 0.587* 1.785*** 1.983*** 19.51*** 1.197 15.91 -15.88** -15.08** -0.114** -0.0263* -0.0478**

USAID.GOV USAID BASA PILIPINAS IMPACT EVALUATION | 116
reading materials in Filipino
(0.871) (0.652) (0.755) (0.197) (0.0580) (0.00515) (0.00266) (0) (0.388) (0.230) (0.0343) (0.0384) (0.0456) (0.0849) (0.0174)
Sex of teacher 1.195 1.133 1.534 0.818 2.454** 1.421 3.042*** 1.233 0.863 0.127 -16.10 -7.499 -0.105 -0.0309 -0.0481
(0.654) (0.775) (0.311) (0.752) (0.0191) (0.316) (0.00657) (0.673) (0.680) (0.996) (0.269) (0.599) (0.122) (0.125) (0.120)
School assets index 0.679** 0.680** 0.779 1.294 1.031 1.011 0.870 0.924 1.010 -6.109 2.952 6.332* -0.0321 -0.0125* -0.0220**
(0.0312) (0.0213) (0.125) (0.226) (0.871) (0.933) (0.307) (0.618) (0.940) (0.432) (0.545) (0.0579) (0.221) (0.0701) (0.0155)
Low-level classroom 1.039 0.895 0.754 0.855 1.791 0.714 0.493* 0.314** 0.791 9.520 -2.772 -0.769 -0.0822 -0.0862*** -0.0495
(0.930) (0.805) (0.556) (0.831) (0.213) (0.346) (0.0632) (0.0173) (0.528) (0.667) (0.794) (0.934) (0.475) (0.00643) (0.200)
Age of teacher 1.016 1.014 1.022* 1.063** 0.988 1.016 0.991 1.016 0.998 0.496 0.326 -0.363 -0.00482* 0.000517 -0.00170*
(0.168) (0.237) (0.0883) (0.0135) (0.362) (0.107) (0.430) (0.231) (0.849) (0.437) (0.277) (0.347) (0.0659) (0.489) (0.0995)
Post-bachelor degree 0.767 0.999 0.841 0.825 0.856 0.986 0.627** 0.707 0.976 -35.61** 9.917 8.468 -0.0775 -0.0493*** -0.0561***
(0.270) (0.998) (0.522) (0.681) (0.596) (0.949) (0.0494) (0.231) (0.910) (0.0102) (0.187) (0.299) (0.173) (0.00182) (0.00403)
Reports reading for pleasure outside the classroom 1.149 1.036 1.407 1.497 1.522 0.745 0.859 1.338 0.977 -46.71*** 1.543 6.169 0.0677 -0.0109 0.00723
(0.631) (0.907) (0.300) (0.358) (0.167) (0.201) (0.545) (0.362) (0.919) (0.000506) (0.823) (0.295) (0.307) (0.554) (0.766)
Total enrollment 1.000 1.000 1.001 1.000 0.999*** 1.000 1.000 1.000 1.000 -0.0640*** -0.0214*** -0.0129 -1.95e-05 1.19e-05 2.83e-05
(0.416) (0.933) (0.126) (0.911) (0.000157) (0.218) (0.992) (0.551) (0.200) (0.00288) (0.00771) (0.131) (0.801) (0.617) (0.340)
G2 average class size 1.000 0.994 0.974* 1.001 1.011 1.025** 0.990 1.002 0.994 -1.008 0.109 0.554* 0.00564* 0.00182* 0.00275**
(0.986) (0.686) (0.0724) (0.969) (0.398) (0.0370) (0.432) (0.925) (0.587) (0.154) (0.759) (0.0541) (0.0611) (0.0659) (0.0207)
G3 average class size 1.021* 1.020 1.025** 1.016 0.997 0.994 0.994 1.014 1.008 0.312 0.319 -0.0404 0.00168 -8.43e-05 -0.000231
(0.0906) (0.132) (0.0238) (0.289) (0.801) (0.530) (0.645) (0.331) (0.428) (0.622) (0.212) (0.883) (0.444) (0.895) (0.792)
G4 average class size 1.007 1.007 1.003 0.978 0.996 0.996 1.025** 0.997 0.997 1.933** -0.713 -0.563* 0.00106 -0.000342 0.000658
(0.618) (0.657) (0.824) (0.168) (0.800) (0.712) (0.0437) (0.853) (0.802) (0.0224) (0.109) (0.0564) (0.697) (0.642) (0.496)
Constant 0.379 0.685 0.0715** 2.324 4.204 0.179** 0.0462*** 0.0150*** 1.477 169.9*** 126.4*** 108.0*** 0.793*** 0.924*** 0.836***
(0.302) (0.698) (0.0125) (0.620) (0.199) (0.0357) (0.000362) (5.96e-05) (0.629) (0.000549) (6.49e-06) (3.56e-07) (0.00108) (0) (0)
Observations 982 816 702 983 983 972 983 983 959 983 983 983 651 651 651
R-squared 0.086 0.058 0.039 0.114 0.144 0.186

117 | USAID BASA PILIPINAS IMPACT EVALUATION USAID.GOV
Grade-disaggregated Teacher Regression Results
Attended session on early grade reading and writing this/last yr
# of training days did you received in tot last yr # of training days for mother tongue reading instruction
Mean Total G2 G3 G4 Total G2 G3 G4 Total G2 G3 G4
Standard 0.62 0.65 0.66 0.53 8.85 8.86 8.7 9.03 3.18 4.54 3 1.49
Basa 0.75 0.86 0.87 0.47 8.04 8.72 7.86 7.14 2.34 3.01 2.5 1.07
Total 0.74 0.85 0.86 0.47 8.07 8.73 7.89 7.23 2.38 3.08 2.52 1.09
Trt effect 4.933*** 1.218 1.588 2.225 0.0146 0.013 1.682 -0.0181 -1.474
Minutes of class time using Filipino Minutes of class time using English Puts students in small groups several times per mo.
Mean Total G2 G3 G4 Total G2 G3 G4 Total G2 G3 G4
Standard 74.55 56.66 56.3 120.33 78.82 55.22 58.02 135.7 0.73 0.74 0.7 0.75
Basa 74.98 56.52 52.37 125.97 75.42 55.89 62.51 115.93 0.83 0.82 0.88 0.78
Total 74.96 56.52 52.5 125.75 75.55 55.86 62.35 116.69 0.82 0.82 0.87 0.78
Trt effect -0.462 -0.843 35.91**
-1.492* 9.702 0.39
1.729 0.572 0.549
Reading-specific practices index Very familiar with grammar rules and alphabet in mother
tongue 1:1 ratio reading learners' manuals in mother tongue
Mean Total G2 G3 G4 Total G2 G3 G4 Total G2 G3 G4
Standard 0.83 0.84 0.84 0.83 0.54 0.53 0.57 0.54 0.56 0.69 0.85 0.07
Basa 0.79 0.80 0.79 0.78 0.5 0.55 0.52 0.41 0.56 0.78 0.7 0.11
Total 0.79 0.80 0.79 0.78 0.5 0.54 0.52 0.42 0.56 0.78 0.7 0.1
Trt effect -0.010 0.008 -0.031 0.834 5.550*** 0.535 1.315 0.862 1.542
Have a copy of DepEd Teacher's manual Teacher displayed 75%+ of relevant reading-specific
teaching behaviors 1:1 ratio of other reading materials in Mother Tongue
Mean Total G2 G3 G4 Total G2 G3 G4 Total G2 G3 G4
Standard 0.97 0.99 0.96 0.95 0.7 0.71 0.73 0.65 0.21 0.25 0.29 0.06
Basa 0.92 0.91 0.94 0.91 0.62 0.67 0.61 0.57 0.3 0.46 0.34 0.07

USAID.GOV USAID BASA PILIPINAS IMPACT EVALUATION | 118
Total 0.92 0.91 0.94 0.91 0.62 0.67 0.61 0.57 0.3 0.45 0.34 0.07
Trt effect 0.0986** 4.147*** 1.197
0.845 0.646 0.680 0.829 0.853 0.737
Minutes of class time using MT General teacher behavior index Teacher very comfortable providing instruction in mother
tongue
Mean Total G2 G3 G4 Total G2 G3 G4 Total G2 G3 G4
Standard 189.43 242.56 226.7 71.79 0.91 0.91 0.91 0.91 0.56 0.55 0.52 0.62
Basa 196.88 235.51 229.61 107.97 0.9 0.91 0.9 0.89 0.61 0.65 0.58 0.61
Total 196.59 235.82 229.51 106.59 0.9 0.91 0.9 0.89 0.61 0.65 0.58 0.61
Trt effect 1.121 -0.883 -0.66
0.015 0.008 -0.001 1.658 0.413* 0.542

119 | USAID BASA PILIPINAS IMPACT EVALUATION USAID.GOV
ANNEX 7 – ALTERNATE REGRESSION MODELS
Regression Results
Letter
sounds
correct per
minute
Familiar
words
correct per
minute
Unfamiliar
words
correct per
minute
Oral
reading
fluency,
correct per
minute
Reading
comp., %
correct
Reading
comp. (no
zeros), %
correct
Letter
sounds
correct per
minute
Familiar
words
correct
per
minute
Unfamiliar
words
correct
per
minute
Oral
reading
fluency,
correct
per
minute
Reading
comp., %
correct
Reading
comp. (no
zeros), %
correct
Letter
sounds
correct
per
minute
Familiar
words
correct
per
minute
Unfamiliar
words
correct per
minute
Oral
reading
fluency,
correct
per
minute
Reading
comp., %
correct
Reading
comp. (no
zeros), %
correct
2 Year Results - English 4.564*** 5.191* 3.662** 6.810** -0.0233 5.056*** 2.073 0.890 -0.448 -0.0923 1.473 -0.232 0.861 0.0721 -0.0591
(0.00328) (0.0665) (0.0163) (0.0165) (0.653) (0.000480) (0.454) (0.606) (0.889) (0.166) (0.221) (0.867) (0.579) (0.977) (0.103)
2 Year Results - Filipino 3.142* 6.497*** 4.356*** 7.239*** -0.0327 2.637 1.058 3.330*** -1.219 -0.0367 1.936 0.738 -0.734 -1.369 -0.0778***
(0.0619) (0.000649) (0.000575) (0.00206) (0.255) (0.138) (0.566) (0.00825) (0.640) (0.150) (0.262) (0.708) (0.481) (0.279) (0.00489)
Nonequated 2 Year Results - English 4.856*** 5.917** 4.205*** 7.735** -0.0178 5.110*** 2.178 1.036 -1.044 -0.0643 1.018 -0.264 0.907 -0.577 -0.0485
(0.00244) (0.0428) (0.00796) (0.0130) (0.650) (0.000572) (0.454) (0.571) (0.757) (0.188) (0.401) (0.853) (0.566) (0.808) (0.215)
Nonequated 2 Year Results - Filipino 3.205* 6.927*** 4.474*** 7.513*** -0.0229 2.729 1.007 2.968** -1.991 -0.0361 1.624 0.622 -0.97 -1.72 -0.0761***
(0.0703) (0.000333) (0.000269) (0.00150) (0.394) (0.124) (0.587) (0.0202) (0.435) (0.167) (0.353) (0.755) (0.356) (0.172) (0.00520)
Unweighted - English 2.424*** 1.502* 0.793 1.170 0.0163 -0.0136 1.722*** 1.572* 1.628*** 0.177 0.0308 0.0158 1.617* -0.140 -0.719 -0.293 -0.0666* -0.0661*
(0.000113) (0.0755) (0.165) (0.196) (0.556) (0.633) (0.00386) (0.0543) (0.00528) (0.820) (0.242) (0.548) (0.0868) (0.876) (0.359) (0.794) (0.0606) (0.0649)
Unweighted - Filipino 1.327** 1.297** 1.040** 1.665 -0.00960 -0.0289* 0.763 1.155** 0.806** 0.692 0.00186 -0.00234 0.850 -0.922 -0.870* -1.432 -0.0769*** -0.0797***
(0.0372) (0.0318) (0.0180) (0.143) (0.518) (0.0736) (0.195) (0.0496) (0.0351) (0.352) (0.857) (0.826) (0.320) (0.147) (0.0751) (0.112) (0.000118) (6.43e-05)
Sex disaggregated - English 3.528*** 2.250 2.594** 2.411 0.0508 0.0241 2.678** 1.369 1.590* 1.196 -0.0587 -0.0765 -0.0951 1.050 -0.421 1.624 -0.0364 -0.0487
(0.00289) (0.135) (0.0326) (0.239) (0.369) (0.678) (0.0346) (0.363) (0.0613) (0.382) (0.294) (0.121) (0.955) (0.634) (0.790) (0.513) (0.624) (0.507)
Sex disaggregated - Filipino 1.521 1.344 1.905* 4.902** -0.0196 -0.0488* 1.272 0.304 0.708 -1.975 -0.00957 0.00255 -1.408 -0.410 -0.423 0.423 -0.0798** -0.0899**
(0.234) (0.188) (0.0570) (0.0455) (0.436) (0.0717) (0.257) (0.798) (0.309) (0.353) (0.677) (0.907) (0.408) (0.774) (0.735) (0.813) (0.0295) (0.0156)
Controlling for ELLN schools - English 2.067** 1.462 1.053 1.739 0.0169 -0.00377 1.717* 0.758 1.055 -0.0440 -0.00172 -0.0257 2.192* 0.152 0.0802 -0.471 -0.0746* -0.0820*
(0.0197) (0.232) (0.239) (0.217) (0.690) (0.930) (0.0522) (0.532) (0.152) (0.964) (0.964) (0.520) (0.0671) (0.900) (0.945) (0.696) (0.0916) (0.0680)
Controlling for ELLN schools - Filipino 1.104 1.249 1.287* 3.078* 0.00640 -0.0150 0.385 -0.108 0.418 -2.003 -0.00964 -0.00702 -0.167 -0.449 -0.207 -0.655 -0.0653** -0.0686**
(0.268) (0.159) (0.0542) (0.0748) (0.773) (0.518) (0.687) (0.915) (0.485) (0.193) (0.493) (0.612) (0.880) (0.533) (0.766) (0.556) (0.0210) (0.0177)
Excluding ELLN Schools - English 2.026** 1.334 1.017 1.508 0.0137 -0.00495 1.728* 0.783 1.038 -0.0864 -0.00510 -0.0292 1.953* -0.448 -0.225 0.230 -0.0833* -0.0891*
(0.0236) (0.279) (0.259) (0.283) (0.746) (0.909) (0.0540) (0.521) (0.163) (0.929) (0.897) (0.475) (0.0912) (0.687) (0.838) (0.851) (0.0652) (0.0553)
Excluding ELLN Schools - Filipino 1.104 1.133 1.208* 2.954* 0.00533 -0.0148 0.496 -0.0566 0.417 -1.992 -0.00963 -0.00714 -0.394 -0.585 -0.211 -0.758 -0.0519* -0.0546**
(0.272) (0.203) (0.0720) (0.0870) (0.811) (0.521) (0.605) (0.955) (0.488) (0.198) (0.492) (0.607) (0.725) (0.413) (0.767) (0.505) (0.0543) (0.0441)
Grade 2 Grade 3 Grade 4

USAID.GOV USAID BASA PILIPINAS IMPACT EVALUATION | 120
ELLN
The DepEd Early Language Literacy and Numeracy (ELLN) program is a DepEd program intended to
develop literacy and numeracy skills among Kinder to Grade 3 pupils. Of our sample of 122 comparison
schools, 20 are also ELLN schools, representing 16% of our comparison sample. To test the robustness
of our findings, we analyze the data 1) controlling for ELLN participation, and 2) excluding ELLN schools.
The results below show regression results controlling for participation in ELLN, followed by a table of
impact estimates excluding the 20 ELLN schools. The impact estimates resulting from both of these
alternate models are consistent with our primary model, lending further support for our findings and
conclusions.
Controlling for ELLN – Filipino:
Grade 2
VARIABLES
Letter sounds
correct per minute
Familiar words
correct per minute
Unfamiliar words
correct per minute
Oral reading fluency,
correct per minute
Reading comp., % correct
Reading Comp. (no zeros), % correct
Treatment = Basa 1.104 1.249 1.287* 3.078* 0.00640 -0.0150
(0.268) (0.159) (0.0542) (0.0748) (0.773) (0.518)
ELLN school 0.137 -1.174 -0.773 -4.157 0.0236 0.0228
(0.942) (0.545) (0.609) (0.311) (0.552) (0.556)
Filipino letters – G2 0.642***
(0)
G2 average class size -0.0605 -0.0750* -0.00660 -0.197** -0.00245** -0.00213**
(0.368) (0.0835) (0.823) (0.0135) (0.0104) (0.0178)
Households assets index 0.493 -0.0566 -0.0191 0.582 0.00931 0.00206
(0.215) (0.833) (0.920) (0.243) (0.115) (0.754)
Student attended Kindergarten 8.414*** 0.671 0.474 -2.504 0.0903 0.0360
(0.00198) (0.787) (0.780) (0.788) (0.192) (0.605)
Student's age when first attended Kindergarten -0.230 0.234 -0.0743 -2.114 0.00796 0.0395*
(0.797) (0.797) (0.910) (0.336) (0.674) (0.0963)
Student does homework 0.277 0.262 0.145 0.0492 -0.0120* -0.0145*
(0.475) (0.357) (0.455) (0.923) (0.0695) (0.0773)
Student receives homework help from a family member 0.564 -0.387 0.710 -0.00205 0.00554 -0.00468
(0.573) (0.635) (0.232) (0.999) (0.790) (0.837)
Student has books at home 1.245 -0.114 -0.332 -0.902 0.0641*** 0.0638**
(0.355) (0.901) (0.686) (0.612) (0.00849) (0.0203)
Student brings books home from school -0.711 1.443 1.519 3.209 0.0613* -0.0163
(0.602) (0.212) (0.149) (0.289) (0.0916) (0.694)
Highest level of education in the household 1.461*** -0.242 0.132 1.961* 0.00535 0.0645***
(0.00230) (0.615) (0.658) (0.0956) (0.617) (0.00987)

121 | USAID BASA PILIPINAS IMPACT EVALUATION USAID.GOV
Age when student was first read to -0.420 -0.626 -0.338 -0.572 -0.0104 -0.00453
(0.483) (0.126) (0.312) (0.628) (0.349) (0.733)
School assets index 0.0109 0.714 0.472 0.147 0.0230** 0.0120
(0.988) (0.116) (0.149) (0.877) (0.0434) (0.272)
Highest grade instructed at this school -1.544 0.00452 -0.502 1.177 0.000136 0.000978
(0.146) (0.997) (0.546) (0.325) (0.992) (0.957)
# of days school is closed -0.0642 0.226 0.254** 0.290 0.00277 0.000430
(0.773) (0.193) (0.0474) (0.268) (0.275) (0.849)
Total enrollment 0.00207 2.77e-05 0.00178** 0.00763*** 8.30e-05***
7.31e-05***
(0.346) (0.983) (0.0395) (0.000746) (6.60e-05) (0.000224)
Months of teaching experience -0.00333 0.00273 0.00143 0.00748 -5.67e-05 -4.63e-05
(0.609) (0.541) (0.610) (0.362) (0.559) (0.666)
Students are put into small reading groups 2.826 -0.100 -0.511 -0.717 -0.00963 0.0123
(0.160) (0.939) (0.606) (0.779) (0.823) (0.766)
Teacher has post-graduate degree 0.539 1.299 -0.165 11.71*** 0.0498 -0.00354
(0.739) (0.263) (0.868) (0.000984) (0.120) (0.928)
2017 outcomes -4.495*** 5.639*** 0.550 7.691*** -0.0702*** -0.0977***
(0.00233) (7.81e-08) (0.464) (0.000986) (0.00870) (0.00211)
Age of student 0.363 -0.649 -0.564 -0.519 -0.00817 -0.0142
(0.613) (0.281) (0.214) (0.631) (0.588) (0.369)
Sex of student 2.992*** 2.829*** 1.990*** 9.006*** 0.0700*** 0.0564**
(0.000675) (0.000942) (0.000814) (4.38e-08) (0.000643) (0.0176)
Region 7 3.897 5.874*** 3.974*** 16.00*** 0.00647 -0.134***
(0.100) (1.92e-05) (2.37e-05) (1.67e-05) (0.848) (0.00621)
Filipino familiar words – G2 0.994***
(0)
Filipino unfamiliar words – G2 0.840***
(0)
Filipino ORF – G2 0.622***
(0)
Filipino reading comp. – G2 0.649***
(0)
Filipino reading comp excl. non-readers –G2 0.500***
(0)

USAID.GOV USAID BASA PILIPINAS IMPACT EVALUATION | 122
Constant 8.105 7.480 8.849 12.90 -0.00519 0.153
(0.434) (0.515) (0.265) (0.627) (0.979) (0.512)
Observations 2,550 2,555 2,553 2,551 2,557 1,836
Grade 3
VARIABLES
Letter sounds
correct per minute
Familiar words
correct per minute
Unfamiliar words
correct per minute
Oral reading fluency,
correct per minute
Reading comp., % correct
Reading Comp. (no zeros), % correct
Treatment = Basa 0.385 -0.108 0.418 -2.003 -0.00964 -0.00702
(0.687) (0.915) (0.485) (0.193) (0.493) (0.612)
ELLN school -1.624 -4.261*** -1.081 -5.079** -0.0287 -0.0362
(0.347) (0.00309) (0.140) (0.0462) (0.275) (0.158)
Filipino letters – G2
G2 average class size
Households assets index 0.546** 0.146 0.260 0.286 0.00808** 0.00704*
(0.0364) (0.505) (0.113) (0.314) (0.0424) (0.0747)
Student attended Kindergarten -0.308 1.407 -1.456 -0.0437 -0.00539 0.00255
(0.886) (0.358) (0.159) (0.983) (0.854) (0.930)
Student's age when first attended Kindergarten 0.604 -0.186 0.153 0.262 -0.00935 -0.00761
(0.476) (0.790) (0.711) (0.788) (0.494) (0.599)
Student does homework 0.899** -0.326 0.148 0.334 0.00471 0.00325
(0.0105) (0.235) (0.413) (0.393) (0.312) (0.524)
Student receives homework help from a family member 0.0385 0.333 -0.183 -1.710 -0.00507 0.00444
(0.967) (0.630) (0.737) (0.133) (0.763) (0.804)
Student has books at home -1.265 -1.684* -0.895 -0.502 0.00586 0.0135
(0.301) (0.0532) (0.128) (0.704) (0.695) (0.396)
Student brings books home from school -2.541** 2.040* 0.346 5.214*** 0.0138 0.00544
(0.0300) (0.0581) (0.717) (0.000620) (0.597) (0.845)
Highest level of education in the household 1.077* 1.159** 0.262 1.380 0.0201*** 0.0118**
(0.0896) (0.0138) (0.424) (0.198) (0.00605) (0.0120)
Age when student was first read to -0.946 -0.585 -0.448* -1.568*** -0.0119 -0.00840
(0.131) (0.110) (0.0511) (0.000883) (0.193) (0.376)
School assets index -0.0439 -0.941** -0.771** 0.118 0.00116 0.00171
(0.911) (0.0283) (0.0155) (0.813) (0.864) (0.804)
Highest grade instructed at this school -0.958 -2.355* -1.029 1.696 0.00445 0.000844
(0.373) (0.0544) (0.155) (0.213) (0.840) (0.970)

123 | USAID BASA PILIPINAS IMPACT EVALUATION USAID.GOV
# of days school is closed -0.136 0.115 0.0222 -0.336 -0.00290 -0.00205
(0.439) (0.373) (0.810) (0.147) (0.397) (0.589)
Total enrollment -0.000267 0.00176** -8.72e-05 0.00141 2.06e-05 2.17e-05
(0.764) (0.0252) (0.896) (0.452) (0.390) (0.342)
Months of teaching experience 0.00856* 0.00660 0.00355 0.00106 0.000110 7.30e-05
(0.0890) (0.108) (0.187) (0.849) (0.129) (0.321)
Students are put into small reading groups 0.509 -1.242 -0.896 0.669 -0.0196 -0.0200
(0.716) (0.330) (0.281) (0.723) (0.433) (0.507)
Teacher has post-graduate degree -3.702*** -2.959*** 0.203 4.180** 0.0152 0.0129
(0.00997) (0.00705) (0.807) (0.0159) (0.513) (0.628)
2017 outcomes -3.071** 6.299*** 3.428*** 3.196*** -0.117*** -0.110***
(0.0187) (4.88e-10) (1.29e-07) (0.00826) (8.19e-10) (3.75e-08)
Age of student -1.019* -0.703* -0.741*** 0.201 -0.00831 -0.00712
(0.0914) (0.0557) (0.00712) (0.692) (0.317) (0.406)
Sex of student 2.746*** 1.844** 1.613*** 5.036*** 0.0523*** 0.0482***
(0.00188) (0.0144) (0.00182) (8.05e-07) (0.000118) (0.000519)
Region 7 2.595* 0.0212 1.170 -3.915*** -0.0162 -0.0322
(0.0890) (0.986) (0.163) (0.00911) (0.450) (0.157)
Filipino letters 0.609***
(0)
G3 average class size 0.0637 4.28e-05 0.0489* 0.0246 0.00114 0.000920
(0.118) (0.999) (0.0849) (0.702) (0.130) (0.228)
Filipino familiar words 0.913***
(0)
Filipino unfamiliar words 0.900***
(0)
Filipino ORF 0.672***
(0)
Filipino reading comp 0.411***
(0)
Filipino reading comp excl. non-readers 0.371***
(0)
Constant 23.83** 31.89*** 17.34*** 7.107 0.145 0.170

USAID.GOV USAID BASA PILIPINAS IMPACT EVALUATION | 124
(0.0235) (0.00224) (0.00547) (0.560) (0.446) (0.366)
Observations 2,575 2,578 2,579 2,578 2,579 2,250
Grade 4
VARIABLES
Letter sounds
correct per minute
Familiar words
correct per minute
Unfamiliar words
correct per minute
Oral reading fluency,
correct per minute
Reading comp., % correct
Reading Comp. (no zeros), % correct
Treatment = Basa -0.167 -0.449 -0.207 -0.655 -0.0653** -0.0686**
(0.880) (0.533) (0.766) (0.556) (0.0210) (0.0177)
ELLN school -2.333 2.584 1.863 2.783 0.0955* 0.102*
(0.425) (0.258) (0.403) (0.223) (0.0973) (0.0917)
Households assets index 0.972** 0.148 -0.316 -0.411 -0.00703 -0.00580
(0.0104) (0.631) (0.152) (0.239) (0.439) (0.503)
Student attended Kindergarten 2.220 0.968 -0.165 0.374 0.0250 0.0231
(0.412) (0.585) (0.914) (0.902) (0.602) (0.626)
Student's age when first attended Kindergarten -1.015 -1.073 -0.459 -0.222 -0.0215 -0.0147
(0.452) (0.235) (0.502) (0.844) (0.369) (0.545)
Student does homework 0.0753 0.103 -0.0867 0.0335 -0.0115 -0.0127
(0.857) (0.700) (0.672) (0.910) (0.212) (0.172)
Student receives homework help from a family member 1.141 -0.367 0.193 0.213 0.0162 0.0125
(0.411) (0.691) (0.772) (0.848) (0.551) (0.635)
Student has books at home 0.961 1.568 0.756 1.693 0.0386 0.0371
(0.563) (0.116) (0.275) (0.174) (0.224) (0.245)
Student brings books home from school 1.810 2.853 0.512 -1.557 0.00972 0.00567
(0.246) (0.109) (0.747) (0.420) (0.842) (0.911)
Highest level of education in the household -0.502 0.371 0.286 0.746 0.0285** 0.0282**
(0.395) (0.667) (0.387) (0.319) (0.0128) (0.0136)
Age when student was first read to 0.000825 -0.127 -0.264 -0.970 -0.00858 -0.00302
(0.999) (0.804) (0.483) (0.124) (0.495) (0.806)
School assets index -0.832 -0.967* 0.223 -0.383 -0.00932 -0.00672
(0.281) (0.0644) (0.588) (0.644) (0.659) (0.747)
Highest grade instructed at this school -1.506 1.024 -0.388 2.270 -0.122*** -0.117***
(0.503) (0.671) (0.776) (0.374) (0.00208) (0.00284)
# of days school is closed -0.0760 -0.0439 -0.00468 0.173 -0.00190 -0.00101
(0.666) (0.724) (0.949) (0.156) (0.499) (0.721)
Total enrollment 0.00678*** 0.00478*** 0.00539*** 0.00343 0.000141*** 0.000116***
(0.000154) (0.00323) (0.00100) (0.330) (0.000622) (0.000299)

125 | USAID BASA PILIPINAS IMPACT EVALUATION USAID.GOV
Months of teaching experience 5.33e-05 0.00142 0.000818 0.00967** 9.60e-05 6.05e-05
(0.992) (0.767) (0.800) (0.0437) (0.471) (0.643)
Students are put into small reading groups 1.576 1.077 -0.503 1.289 0.0144 0.0134
(0.360) (0.430) (0.683) (0.509) (0.742) (0.758)
Teacher has post-graduate degree -2.926** -0.535 -1.658 0.0942 -0.0263 -0.0187
(0.0306) (0.726) (0.105) (0.938) (0.597) (0.707)
2017 outcomes
Age of student 0.574 0.596 0.561 0.816 0.0205 0.0138
(0.536) (0.307) (0.266) (0.422) (0.211) (0.387)
Sex of student 5.718*** 3.945*** 2.306*** 3.373*** 0.0273 0.0273
(5.29e-06) (1.61e-05) (0.000133) (0.00199) (0.341) (0.335)
Region 7 1.332 -0.206 -1.709* 0.238 -0.135** -0.139**
(0.401) (0.902) (0.0759) (0.876) (0.0153) (0.0117)
Filipino letters 0.653***
(0)
Filipino familiar words 0.535***
(0)
Filipino unfamiliar words 0.674***
(0)
Filipino ORF 0.817***
(0)
Filipino reading comp 0.634***
(0)
Filipino reading comp excl. non-readers 0.615***
(0)
G4 average class size -0.123** -0.0199 -0.0464 0.0633 0.000821 0.00111
(0.0142) (0.652) (0.183) (0.267) (0.527) (0.381)
Constant 15.85 -5.398 8.082 -8.981 0.643* 0.622*
(0.457) (0.779) (0.489) (0.672) (0.0737) (0.0881)
Observations 1,186 1,187 1,186 1,186 1,187 1,125

USAID.GOV USAID BASA PILIPINAS IMPACT EVALUATION | 126
Controlling for ELLN – English:
Grade 2
VARIABLES
Letter sounds
correct per minute
Familiar words
correct per minute
Unfamiliar words
correct per minute
Oral reading fluency,
correct per minute
Reading comp., % correct
Reading Comp. (no zeros), % correct
Treatment = Basa 2.067** 1.462 1.053 1.739 0.0169 -0.00377
(0.0197) (0.232) (0.239) (0.217) (0.690) (0.930)
ELLN school -0.465 1.282 -1.089 -3.061 -0.0590 -0.0642
(0.713) (0.648) (0.497) (0.437) (0.489) (0.418)
English letters – G2 0.554***
(0)
G2 average class size -0.139*** -0.00490 0.0934** -0.0285 -0.000636 -0.000782
(0.00391) (0.935) (0.0158) (0.734) (0.685) (0.634)
Households assets index 0.925*** 0.725 0.404* 1.434*** 0.0278** 0.0257**
(0.00126) (0.166) (0.0925) (0.00664) (0.0112) (0.0235)
Student attended Kindergarten 6.803*** 4.675 3.990** 9.048 0.246** 0.223*
(0.00220) (0.178) (0.0321) (0.138) (0.0369) (0.0683)
Student's age when first attended Kindergarten -0.0778 -0.339 -0.0503 -1.243 -0.0170 -0.0140
(0.929) (0.767) (0.952) (0.339) (0.655) (0.695)
Student does homework 0.164 0.0874 0.316 0.161 0.0123 0.0169
(0.572) (0.839) (0.174) (0.715) (0.251) (0.150)
Student receives homework help from a family member -1.072 0.679 -0.964 -0.763 -0.0574 -0.0812**
(0.249) (0.594) (0.206) (0.532) (0.109) (0.0212)
Student has books at home -0.177 0.867 -0.599 2.472 -0.00174 -0.0130
(0.887) (0.638) (0.469) (0.126) (0.965) (0.747)
Student brings books home from school 2.138 0.759 1.314 7.314** 0.0791 0.0482
(0.120) (0.688) (0.377) (0.0462) (0.201) (0.428)
Highest level of education in the household 0.466 0.330 0.382 1.086 0.0171 0.0154
(0.197) (0.637) (0.427) (0.282) (0.319) (0.391)
Age when student was first read to 0.156 -1.015 -0.246 -1.186 -0.0440** -0.0413**
(0.748) (0.111) (0.507) (0.200) (0.0323) (0.0401)
School assets index 0.974 0.429 0.169 0.523 0.0380** 0.0251
(0.147) (0.536) (0.736) (0.483) (0.0356) (0.172)
Highest grade instructed at this school -2.212 0.279 -0.415 0.921 0.00920 0.0223
(0.151) (0.858) (0.633) (0.594) (0.816) (0.603)
# of days school is closed -0.140 0.122 0.188* 0.243 -0.000149 -0.00202
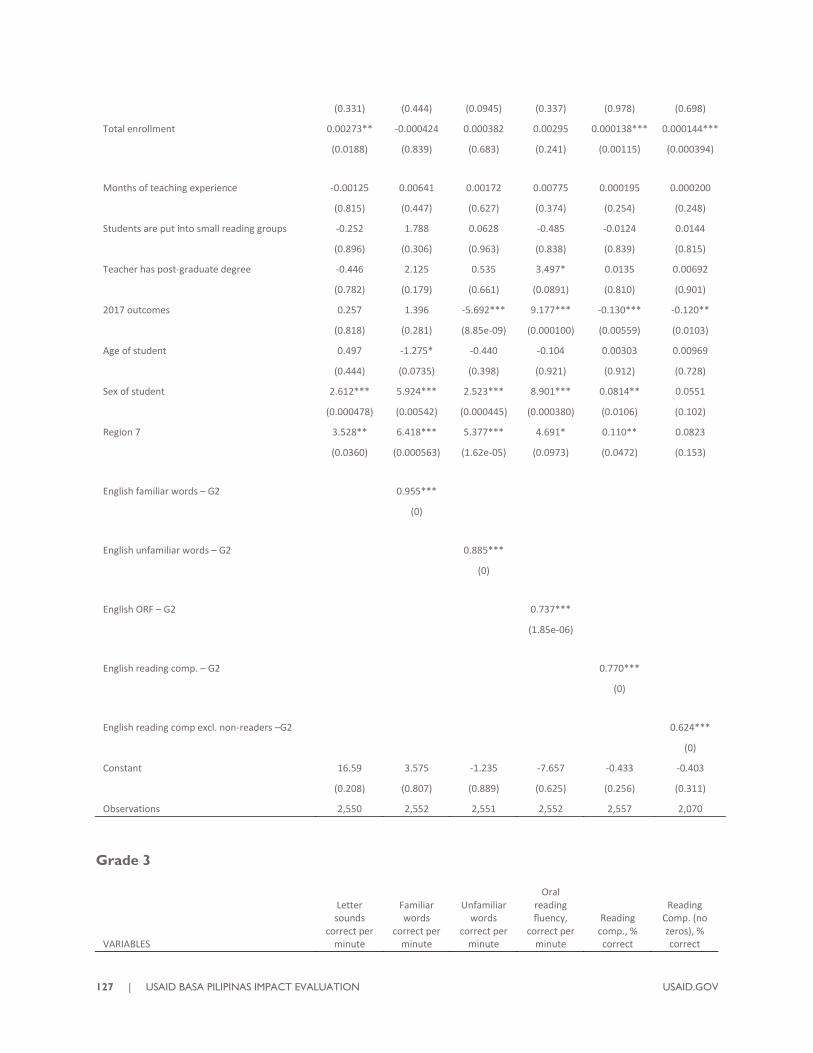
127 | USAID BASA PILIPINAS IMPACT EVALUATION USAID.GOV
(0.331) (0.444) (0.0945) (0.337) (0.978) (0.698)
Total enrollment 0.00273** -0.000424 0.000382 0.00295 0.000138*** 0.000144***
(0.0188) (0.839) (0.683) (0.241) (0.00115) (0.000394)
Months of teaching experience -0.00125 0.00641 0.00172 0.00775 0.000195 0.000200
(0.815) (0.447) (0.627) (0.374) (0.254) (0.248)
Students are put into small reading groups -0.252 1.788 0.0628 -0.485 -0.0124 0.0144
(0.896) (0.306) (0.963) (0.838) (0.839) (0.815)
Teacher has post-graduate degree -0.446 2.125 0.535 3.497* 0.0135 0.00692
(0.782) (0.179) (0.661) (0.0891) (0.810) (0.901)
2017 outcomes 0.257 1.396 -5.692*** 9.177*** -0.130*** -0.120**
(0.818) (0.281) (8.85e-09) (0.000100) (0.00559) (0.0103)
Age of student 0.497 -1.275* -0.440 -0.104 0.00303 0.00969
(0.444) (0.0735) (0.398) (0.921) (0.912) (0.728)
Sex of student 2.612*** 5.924*** 2.523*** 8.901*** 0.0814** 0.0551
(0.000478) (0.00542) (0.000445) (0.000380) (0.0106) (0.102)
Region 7 3.528** 6.418*** 5.377*** 4.691* 0.110** 0.0823
(0.0360) (0.000563) (1.62e-05) (0.0973) (0.0472) (0.153)
English familiar words – G2 0.955***
(0)
English unfamiliar words – G2 0.885***
(0)
English ORF – G2 0.737***
(1.85e-06)
English reading comp. – G2 0.770***
(0)
English reading comp excl. non-readers –G2 0.624***
(0)
Constant 16.59 3.575 -1.235 -7.657 -0.433 -0.403
(0.208) (0.807) (0.889) (0.625) (0.256) (0.311)
Observations 2,550 2,552 2,551 2,552 2,557 2,070
Grade 3
VARIABLES
Letter sounds
correct per minute
Familiar words
correct per minute
Unfamiliar words
correct per minute
Oral reading fluency,
correct per minute
Reading comp., % correct
Reading Comp. (no zeros), % correct

USAID.GOV USAID BASA PILIPINAS IMPACT EVALUATION | 128
Treatment = Basa 1.717* 0.758 1.055 -0.0440 -0.00172 -0.0257
(0.0522) (0.532) (0.152) (0.964) (0.964) (0.520)
ELLN school -1.381 -4.029** -1.109 -3.129* 0.202** 0.169**
(0.372) (0.0384) (0.415) (0.0579) (0.0305) (0.0439)
Households assets index 0.344 0.148 0.272 0.288 0.0355*** 0.0340***
(0.125) (0.680) (0.314) (0.377) (0.000229) (0.000284)
Student attended Kindergarten 2.300 1.523 2.080 -0.775 0.112* 0.0938
(0.225) (0.557) (0.279) (0.696) (0.0934) (0.159)
Student's age when first attended Kindergarten 0.517 -1.384 -0.759 0.294 0.0136 0.0333
(0.503) (0.133) (0.276) (0.765) (0.640) (0.254)
Student does homework 0.688** -0.152 0.0512 0.225 0.00728 0.00665
(0.0131) (0.692) (0.838) (0.509) (0.586) (0.627)
Student receives homework help from a family member -0.661 -0.156 -0.946 -0.910 0.0100 0.0253
(0.386) (0.873) (0.212) (0.375) (0.764) (0.446)
Student has books at home -0.915 1.647 -0.201 -1.648 -0.0324 -0.0183
(0.412) (0.194) (0.842) (0.153) (0.373) (0.637)
Student brings books home from school 0.535 4.374** 0.184 3.472* -0.0358 -0.0721
(0.660) (0.0441) (0.881) (0.0830) (0.550) (0.208)
Highest level of education in the household 1.119* 1.502** 0.764** 1.314** 0.0230 0.0166
(0.0790) (0.0178) (0.0470) (0.0219) (0.255) (0.390)
Age when student was first read to -1.534*** -0.676 -0.667 -0.888* -0.0399** -0.0322*
(0.000401) (0.168) (0.110) (0.0745) (0.0243) (0.0631)
School assets index 0.120 -1.187** -0.325 -0.872 0.00302 0.00547
(0.776) (0.0434) (0.420) (0.137) (0.860) (0.763)
Highest grade instructed at this school -1.063 -0.929 0.445 1.839 -0.0483 -0.0638
(0.405) (0.595) (0.739) (0.446) (0.392) (0.211)
# of days school is closed 0.0368 -0.332 -0.178 -0.288 -0.00996 -0.00808
(0.763) (0.185) (0.329) (0.153) (0.100) (0.152)
Total enrollment 0.000548 0.00234* 0.00147 0.00625*** 3.60e-05 2.16e-05
(0.526) (0.0979) (0.327) (4.99e-07) (0.364) (0.608)
Months of teaching experience 0.00219 0.00218 0.00317 0.00307 0.000275 0.000285*
(0.600) (0.692) (0.376) (0.599) (0.120) (0.0812)
Students are put into small reading groups -0.556 -0.547 0.0107 -1.201 0.0594 0.0815
(0.735) (0.737) (0.994) (0.340) (0.487) (0.372)
Teacher has post-graduate degree -1.841 -3.122* -2.660** -3.013* -0.0719 -0.0585
(0.106) (0.0591) (0.0388) (0.0896) (0.155) (0.239)
2017 outcomes -4.834*** 6.036*** 0.299 10.67*** 0.0193 0.00952
(2.25e-06) (1.66e-05) (0.770) (0) (0.610) (0.807)

129 | USAID BASA PILIPINAS IMPACT EVALUATION USAID.GOV
Age of student -0.584 -1.231* -1.192** -1.370** -0.0223 -0.0285
(0.358) (0.0992) (0.0411) (0.0461) (0.314) (0.204)
Sex of student 2.039*** 0.617 1.937*** 3.382*** 0.138*** 0.121***
(0.00950) (0.565) (0.00440) (0.000895) (1.32e-05) (7.45e-05)
Region 7 4.341*** 2.346 2.988** 1.085 0.158** 0.152**
(0.000269) (0.177) (0.0128) (0.521) (0.0132) (0.0122)
English letters 0.628***
(0)
G3 average class size 0.00381 -0.000885 -0.0119 -0.0520 -0.000707 -0.00113
(0.913) (0.985) (0.784) (0.342) (0.597) (0.436)
English familiar words 0.898***
(0)
English unfamiliar words 0.858***
(0)
English ORF 0.897***
(0)
English reading comp 0.777***
(0)
English reading comp excl. non-readers 0.702***
(0)
Constant 23.79** 31.21** 17.42 9.134 0.231 0.360
(0.0267) (0.0441) (0.112) (0.647) (0.636) (0.424)
Observations 2,575 2,579 2,579 2,579 2,579 2,327
Grade 4
VARIABLES
Letter sounds
correct per minute
Familiar words
correct per minute
Unfamiliar words
correct per minute
Oral reading fluency,
correct per minute
Reading comp., % correct
Reading Comp. (no zeros), % correct
Treatment = Basa 2.192* 0.152 0.0802 -0.471 -0.0746* -0.0820*
(0.0671) (0.900) (0.945) (0.696) (0.0916) (0.0680)
ELLN school 4.342* -0.0652 1.985 -4.840 -0.0153 -0.0118
(0.0585) (0.985) (0.520) (0.325) (0.820) (0.854)

USAID.GOV USAID BASA PILIPINAS IMPACT EVALUATION | 130
Households assets index 0.205 0.401 0.0417 -0.405 0.0155 0.0169
(0.600) (0.287) (0.894) (0.361) (0.237) (0.199)
Student attended Kindergarten -1.794 -2.396 -3.585* -0.648 0.0534 0.0498
(0.427) (0.281) (0.0607) (0.854) (0.575) (0.599)
Student's age when first attended Kindergarten -2.635** -0.211 -0.260 -1.142 -0.0656 -0.0575
(0.0473) (0.832) (0.764) (0.452) (0.137) (0.197)
Student does homework 0.188 0.508 0.739*** 0.619 -0.000984 -0.00114
(0.607) (0.155) (0.00747) (0.213) (0.934) (0.924)
Student receives homework help from a family member 0.883 -1.685 -1.304 0.958 -0.0887** -0.0941**
(0.483) (0.177) (0.213) (0.523) (0.0469) (0.0356)
Student has books at home 1.194 1.484 -0.00929 1.514 0.0265 0.0262
(0.398) (0.262) (0.993) (0.346) (0.601) (0.614)
Student brings books home from school -3.095 -3.862 0.616 -0.841 -0.0132 -0.0310
(0.355) (0.115) (0.791) (0.827) (0.845) (0.647)
Highest level of education in the household 0.168 0.778 0.648 0.677 0.0528 0.0542
(0.850) (0.454) (0.220) (0.447) (0.163) (0.164)
Age when student was first read to -0.564 -1.096 -1.666*** -1.663** -0.0328 -0.0264
(0.357) (0.107) (0.000453) (0.0355) (0.179) (0.292)
School assets index -0.231 -1.077 -1.065** 0.457 -0.0366 -0.0319
(0.831) (0.159) (0.0410) (0.636) (0.121) (0.179)
Highest grade instructed at this school -2.693 0.103 2.563 6.581** -0.175* -0.180*
(0.361) (0.971) (0.379) (0.0208) (0.0698) (0.0649)
# of days school is closed -0.159 -0.142 -0.129 0.256 -0.0105** -0.0109**
(0.488) (0.383) (0.275) (0.377) (0.0296) (0.0320)
Total enrollment 0.00430* 0.00626** 0.00516*** 0.00801*** 0.000240*** 0.000203***
(0.0698) (0.0142) (0.00797) (0.00544) (1.99e-08) (6.45e-06)
Months of teaching experience -0.000215 0.00285 -0.000584 -0.00103 0.000293 0.000280
(0.975) (0.615) (0.905) (0.877) (0.152) (0.173)
Students are put into small reading groups 2.431 2.864 1.003 1.881 0.126** 0.136**
(0.341) (0.108) (0.475) (0.405) (0.0179) (0.0116)
Teacher has post-graduate degree -1.917 -0.0344 0.546 0.334 -0.0297 -0.0213
(0.450) (0.987) (0.720) (0.869) (0.586) (0.708)
2017 outcomes
Age of student -0.318 0.460 0.197 1.147 0.0437 0.0360
(0.733) (0.633) (0.832) (0.418) (0.113) (0.191)
Sex of student 3.184** 2.861** 2.693*** 0.906 0.0811* 0.0797
(0.0173) (0.0163) (0.00774) (0.558) (0.0938) (0.102)
Region 7 1.437 4.852** 5.297*** 0.644 0.0180 0.0154

131 | USAID BASA PILIPINAS IMPACT EVALUATION USAID.GOV
(0.558) (0.0436) (0.000601) (0.802) (0.797) (0.834)
English letters 0.627***
(0)
English familiar words 0.566***
(0)
English unfamiliar words 0.735***
(0)
English ORF 0.907***
(0)
English reading comp 0.597***
(0)
English reading comp excl. non-readers 0.587***
(0)
G4 average class size -0.0991* 0.00131 0.00362 0.133** 0.000864 0.00110
(0.0866) (0.982) (0.932) (0.0411) (0.652) (0.573)
Constant 54.52** -2.461 -11.32 -36.09 0.786 0.837
(0.0261) (0.915) (0.628) (0.174) (0.291) (0.265)
Observations 1,187 1,186 1,187 1,187 1,187 1,123
Sex Disaggregated Results – Mother Tongue
VARIABLES
Letter sounds
correct per minute
Familiar words
correct per minute
Unfamiliar words
correct per minute
Oral reading fluency,
correct per minute
Reading comp., % correct
Reading Comp. (no zeros), % correct
Basa boys 0.172 0.906 -0.760 2.602 0.00252 -0.0509
(0.898) (0.546) (0.621) (0.215) (0.948) (0.115)
Letters 0.604***
(0)
Basa girls 4.111 6.367** 5.636*** 4.723 0.0654 0.0403
(0.114) (0.0351) (0.00414) (0.485) (0.204) (0.359)
Class size 0.0402 0.0558 0.00929 0.0122 -0.000705 -0.000859
(0.568) (0.535) (0.906) (0.902) (0.722) (0.541)
Households assets index 0.458 0.338 0.635 0.217 0.00523 0.000836
(0.200) (0.382) (0.132) (0.653) (0.571) (0.903)

USAID.GOV USAID BASA PILIPINAS IMPACT EVALUATION | 132
Student attended kindergarten 2.676 1.389 2.967 6.751* 0.125 0.0556
(0.414) (0.566) (0.308) (0.0623) (0.138) (0.513)
Student’s age when first attended kindergarten 0.0289 -0.948 0.129 -1.048 -0.00201 -0.0120
(0.977) (0.360) (0.899) (0.420) (0.950) (0.723)
Student does homework -0.720* 0.0756 -0.261 -0.129 -0.00688 -0.00946
(0.0612) (0.819) (0.436) (0.745) (0.398) (0.309)
Student receives homework help from a family member 1.707 2.257** 2.010* 2.086 0.0174 0.0122
(0.126) (0.0364) (0.0663) (0.172) (0.546) (0.670)
Student has books at home -1.762 1.753 2.586 1.806 0.0775* 0.0582*
(0.272) (0.352) (0.221) (0.228) (0.0788) (0.0983)
Student brings books home from school 0.109 0.271 0.116 0.665 -0.0324 -0.0799
(0.957) (0.860) (0.933) (0.683) (0.505) (0.104)
Highest level of education in the household 0.368 0.354 0.636 0.302 0.0139 0.0154
(0.712) (0.742) (0.569) (0.752) (0.631) (0.572)
Age when student was first read to -1.532* -0.610 -1.324* -0.918 -0.0169 0.0103
(0.0537) (0.313) (0.0675) (0.175) (0.347) (0.541)
School assets index 0.610 0.156 -0.170 -0.158 0.0103 0.0162
(0.244) (0.833) (0.817) (0.824) (0.519) (0.135)
Highest grade instructed at this school -2.682*** -0.232 -0.302 0.232 -0.0274 -0.0373
(0.00287) (0.854) (0.765) (0.827) (0.309) (0.230)
# of days school is closed -0.214 0.325 0.372 0.562* 0.0103 0.0101
(0.546) (0.324) (0.361) (0.0894) (0.334) (0.298)
Total enrollment -0.00152 -0.000321 0.000979 0.00137 3.11e-05 -1.15e-05
(0.320) (0.818) (0.510) (0.388) (0.422) (0.739)
Months of teaching experience 0.00251 0.00654 0.0109 0.00846 0.000409** 0.000143
(0.707) (0.313) (0.121) (0.212) (0.0405) (0.417)
Students are put into small reading groups 1.164 1.510 1.245 0.612 0.0493 0.0604
(0.569) (0.477) (0.586) (0.813) (0.403) (0.228)
Teacher has post-graduate degree -1.856 0.679 0.107 0.523 -0.0359 -0.0461
(0.404) (0.741) (0.967) (0.782) (0.502) (0.376)
Age of student 0.330 -0.340 -0.160 -0.628 -0.0621** -0.0497*
(0.702) (0.674) (0.825) (0.465) (0.0240) (0.0569)
Sex of student -1.832 0.139 0.723 1.386 0.0687 0.0351
(0.431) (0.961) (0.705) (0.854) (0.113) (0.287)
Region 7 3.259* 1.821 0.189 3.305 0.0547 -0.0328
(0.0765) (0.370) (0.922) (0.148) (0.242) (0.414)
Mother tongue -8.205 -1.430 -2.235 -1.808 0.00567 0.0411
(0.131) (0.393) (0.226) (0.347) (0.927) (0.512)
Familiar words 0.991***
(0)
Unfamiliar words 0.826***

133 | USAID BASA PILIPINAS IMPACT EVALUATION USAID.GOV
(0.000193)
ORF 0.915***
(0)
Reading comp 1.190***
(0)
Reading comp. excl. non-readers 0.914***
(0)
Constant 36.10*** 9.099 6.814 4.906 0.341 0.707**
(0.000891) (0.449) (0.579) (0.704) (0.331) (0.0322)
Observations 1,362 1,361 1,360 1,361 1,366 879

USAID.GOV USAID BASA PILIPINAS IMPACT EVALUATION | 134
Sex-Disaggregated Results – Filipino
Regression Results
Letter sounds correct
per minute
Familiar words correct
per minute
Unfamiliar words correct
per minute
Oral reading fluency, correct
per minute
Reading comp., % correct
Reading comp.
(no zeros), % correct
Letter sounds correct
per minute
Familiar words correct
per minute
Unfamiliar words correct
per minute
Oral reading fluency, correct
per minute
Reading comp., % correct
Reading comp.
(no zeros), % correct
Letter sounds correct
per minute
Familiar words correct
per minute
Unfamiliar words correct
per minute
Oral reading fluency, correct
per minute
Reading comp., % correct
Reading comp.
(no zeros), % correct
Grade 2 Grade 2 Grade 2 Grade 2 Grade 2 Grade 2 Grade 3 Grade 3 Grade 3 Grade 3 Grade 3 Grade 3 Grade 4 Grade 4 Grade 4 Grade 4 Grade 4 Grade 4
Basa boys 1.521 1.344 1.905* 4.902** -0.0196 -0.0488* 1.272 0.304 0.708 -1.975 -0.00957 0.00255 -1.408 -0.410 -0.423 0.423
-0.0798**
-0.0899**
(0.234) (0.188) (0.0570) (0.0455) (0.436) (0.0717) (0.257) (0.798) (0.309) (0.353) (0.677) (0.907) (0.408) (0.774) (0.735) (0.813) (0.0295) (0.0156)
Filipino letters – G2 0.640***
(0)
Basa girls -0.901 0.401 -0.856 -1.352 0.0362 0.0489 -0.801 1.640 0.0733 2.889 0.0168 0.00209 3.691 -1.552 -0.654 -3.824 -0.0290 -0.0207
(0.629) (0.786) (0.426) (0.595) (0.352) (0.174) (0.544) (0.260) (0.939) (0.239) (0.601) (0.947) (0.175) (0.467) (0.633) (0.234) (0.465) (0.599)
G2 average class size -0.0630 -0.0747* -0.00699 -0.200**
-0.00256*
**
-0.00223*
*
(0.346) (0.0847) (0.814) (0.0132) (0.00685) (0.0121)
Households assets index 0.521 0.00175 0.0185 0.562 0.00979* 0.00210 0.536** 0.127 0.251 0.279 0.00765* 0.00640 0.967** 0.184 -0.271 -0.352 -0.00559 -0.00457
(0.194) (0.995) (0.923) (0.268) (0.0957) (0.749) (0.0436) (0.572) (0.128) (0.337) (0.0542) (0.108) (0.0116) (0.551) (0.212) (0.323) (0.542) (0.601)
Student attended kindergarten 8.520*** 0.663 0.433 -2.563 0.0922 0.0341 -0.176 1.736 -1.455 0.867 -0.0102 -0.00279 2.177 0.945 -0.218 0.449 0.0267 0.0237
(0.00186) (0.790) (0.797) (0.784) (0.182) (0.625) (0.937) (0.264) (0.177) (0.675) (0.734) (0.926) (0.417) (0.596) (0.885) (0.883) (0.580) (0.619)
Student’s age when first attended kindergarten -0.322 0.301 0.00476 -1.873 0.00561 0.0388 0.546 -0.207 0.130 0.281 -0.00883 -0.00796 -1.036 -0.885 -0.402 -0.185 -0.0202 -0.0147
(0.722) (0.745) (0.994) (0.398) (0.771) (0.106) (0.524) (0.770) (0.760) (0.772) (0.519) (0.584) (0.451) (0.327) (0.557) (0.872) (0.397) (0.543)
Student does homework 0.278 0.250 0.132 0.0364 -0.0121* -0.0149* 0.887** -0.355 0.143 0.269 0.00477 0.00347 0.175 0.0919 -0.0816 0.0577 -0.0118 -0.0128
(0.473) (0.378) (0.498) (0.943) (0.0674) (0.0708) (0.0115) (0.199) (0.426) (0.491) (0.309) (0.501) (0.674) (0.730) (0.693) (0.849) (0.200) (0.166)
Student receives homework help 0.461 -0.540 0.625 -0.0439 0.00308 -0.00598 0.0267 0.466 -0.157 -1.667 -0.00411 0.00453 0.936 -0.254 0.182 0.168 0.0140 0.00927

135 | USAID BASA PILIPINAS IMPACT EVALUATION USAID.GOV
from a family member
(0.646) (0.516) (0.301) (0.980) (0.884) (0.794) (0.977) (0.503) (0.776) (0.145) (0.806) (0.799) (0.485) (0.784) (0.789) (0.882) (0.610) (0.728)
Student has books at home 0.947 -0.0538 -0.291 -0.555 0.0596** 0.0597** -1.138 -1.654* -0.821 -0.525 0.00714 0.0141 0.945 1.668* 0.825 1.779 0.0397 0.0370
(0.475) (0.954) (0.726) (0.760) (0.0185) (0.0381) (0.358) (0.0599) (0.166) (0.693) (0.634) (0.370) (0.573) (0.0971) (0.231) (0.156) (0.210) (0.245)
Student brings books home from school -0.587 1.438 1.513 3.139 0.0647* -0.0147 -2.617** 1.910* 0.294 5.022*** 0.0125 0.00684 1.593 2.703 0.346 -1.758 0.00607 0.00517
(0.668) (0.216) (0.154) (0.304) (0.0752) (0.726) (0.0266) (0.0751) (0.758) (0.00091
8) (0.634) (0.805) (0.330) (0.137) (0.832) (0.373) (0.903) (0.920)
Highest level of education in the household 1.341*** -0.252 0.145 1.975* 0.00273
0.0658*** 1.036 1.136** 0.259 1.285
0.0208*** 0.0129** -0.605 0.367 0.260 0.696 0.0282** 0.0283**
(0.00549) (0.607) (0.630) (0.0947) (0.802) (0.00846) (0.102) (0.0164) (0.438) (0.227) (0.00524) (0.0121) (0.289) (0.672) (0.422) (0.341) (0.0121) (0.0129)
Age
when
student
was first
read to -0.413 -0.652 -0.355 -0.625 -0.0105 -0.00473 -0.918 -0.503 -0.430* -
1.445*** -0.0117 -0.00890 0.109 -0.161 -0.188 -0.828 -0.00452 0.000438
(0.489) (0.112) (0.286) (0.599) (0.343) (0.723) (0.146) (0.174) (0.0623) (0.00218) (0.207) (0.353) (0.889) (0.746) (0.626) (0.215) (0.734) (0.973)
School assets INDEX 0.0464 0.679 0.418 0.214 0.0244** 0.0138 -0.00369 -0.884** -0.740** 0.185 0.00257 0.00301 -0.922 -0.942* 0.267 -0.329 -0.00703 -0.00458
(0.951) (0.141) (0.203) (0.825) (0.0326) (0.215) (0.993) (0.0384) (0.0193) (0.713) (0.706) (0.665) (0.219) (0.0697) (0.521) (0.692) (0.743) (0.829)
Highest grade instructed at this school -1.534 -0.0303 -0.514 1.175 0.000471 0.00140 -1.063 -2.651** -1.145* 1.357 0.00294 0.000203 -1.434 0.905 -0.389 2.237
-0.124***
-0.118***
(0.149) (0.981) (0.545) (0.331) (0.971) (0.939) (0.336) (0.0261) (0.0937) (0.296) (0.896) (0.993) (0.530) (0.711) (0.781) (0.393) (0.00242) (0.00333)
# of days school is closed -0.0628 0.225 0.256** 0.274 0.00281 0.000419 -0.143 0.102 0.0196 -0.356 -0.00295 -0.00225 -0.0771 -0.0593 -0.00857 0.161 -0.00221 -0.00122
(0.777) (0.193) (0.0457) (0.297) (0.268) (0.852) (0.415) (0.422) (0.832) (0.125) (0.388) (0.552) (0.665) (0.634) (0.912) (0.203) (0.437) (0.670)
Total enrollment 0.00209 3.88e-06
0.00175**
0.00749***
8.56e-05***
7.54e-05***
-0.000308
0.00163**
-0.000124 0.00129 1.97e-05 2.09e-05
0.00677***
0.00483***
0.00546*** 0.00346
0.000143***
0.000118***
(0.328) (0.998) (0.0417) (0.00115) (3.32e-
05) (9.90e-
05) (0.725) (0.0327) (0.850) (0.467) (0.401) (0.347) (0.00013
0) (0.00239) (0.00063
2) (0.317) (0.00047
5) (0.00023
3)
Months of teaching -0.00300 0.00217 0.00112 0.00736 -5.62e-05 -5.39e-05 0.00884* 0.00665 0.00350 0.00135 0.000108 7.44e-05 0.000297 0.00140 0.000997
0.00980** 9.99e-05 6.43e-05

USAID.GOV USAID BASA PILIPINAS IMPACT EVALUATION | 136
experience
(0.645) (0.626) (0.691) (0.372) (0.564) (0.617) (0.0790) (0.106) (0.194) (0.809) (0.136) (0.304) (0.958) (0.769) (0.758) (0.0409) (0.454) (0.624)
Students are put into small reading groups 2.987 -0.0580 -0.514 -0.724 -0.00406 0.0175 0.532 -1.262 -0.881 0.660 -0.0192 -0.0194 2.218 1.069 -0.456 1.287 0.00847 0.00684
(0.139) (0.965) (0.600) (0.779) (0.924) (0.674) (0.706) (0.324) (0.294) (0.731) (0.436) (0.514) (0.168) (0.442) (0.716) (0.518) (0.849) (0.878)
Teacher has post-graduate degree 0.485 1.548 0.00482 11.88*** 0.0479 -0.00562 -3.589**
-3.072*** 0.184 4.135** 0.0127 0.0107 -3.275** -0.576 -1.738* -0.0758 -0.0275 -0.0181
(0.767) (0.186) (0.996) (0.00101) (0.133) (0.887) (0.0127) (0.00501) (0.825) (0.0174) (0.586) (0.690) (0.0156) (0.703) (0.0962) (0.953) (0.584) (0.720)
2017 outcomes
-4.348*** 5.557*** 0.471 7.745***
-0.0667**
-0.0950**
* -3.038** 6.357*** 3.411*** 3.424*** -
0.117*** -
0.109***
(0.00340) (1.29e-
07) (0.532) (0.00109) (0.0128) (0.00269) (0.0211) (4.66e-
10) (2.17e-
07) (0.00577) (6.50e-
10) (3.10e-
08)
Age of student 0.377 -0.616 -0.540 -0.604 -0.00784 -0.0151 -0.957 -0.662*
-0.722*** 0.338 -0.00900 -0.00807 0.508 0.589 0.582 0.838 0.0220 0.0155
(0.598) (0.309) (0.235) (0.577) (0.604) (0.340) (0.116) (0.0736) (0.00938
) (0.483) (0.289) (0.359) (0.585) (0.313) (0.251) (0.410) (0.175) (0.325)
Sex of student 3.812** 2.501** 2.876*** 10.41*** 0.0349 0.0108 3.403*** 0.200 1.500* 2.212 0.0349 0.0445 1.893 5.485*** 2.934** 7.018** 0.0568** 0.0496**
(0.0244) (0.0352) (0.00157) (2.02e-
06) (0.280) (0.687) (0.00136) (0.878) (0.0735) (0.328) (0.234) (0.115) (0.423) (0.00436) (0.0165) (0.0216) (0.0229) (0.0470)
Region 7 3.897 5.969*** 4.044*** 16.34*** 0.00659 -
0.137*** 2.596* -0.160 1.082 -
4.183*** -0.0203 -0.0359 1.376 -0.372 -1.919* 0.159 -0.136** -0.138**
(0.101) (1.55e-
05) (2.46e-
05) (1.76e-
05) (0.844) (0.00527) (0.0951) (0.894) (0.199) (0.00631) (0.353) (0.115) (0.392) (0.819) (0.0578) (0.920) (0.0161) (0.0136)
Mother tongue -2.988 -0.377 0.469 -1.049 -0.0676 -0.0650 -0.568 -0.320 0.929 -1.447 0.0375 0.0423 0.658 1.100 2.121 0.847 -0.0215 -0.0190
(0.392) (0.831) (0.775) (0.812) (0.163) (0.245) (0.816) (0.760) (0.429) (0.440) (0.218) (0.174) (0.870) (0.565) (0.224) (0.715) (0.816) (0.835)
Filipino familiar words – G2 0.993***
(0)
Filipino unfamiliar words – G2 0.842***
(0)
Filipino ORF -G2 0.621***
(0)
Filipino reading 0.645***

137 | USAID BASA PILIPINAS IMPACT EVALUATION USAID.GOV
comp – G2
(0)
Filipino reading comp excl. non-readers G2 0.494***
(0)
Filipino letters 0.606*** 0.647***
(0) (0)
G3 average class size 0.0625 0.00354 0.0495* 0.0270 0.00115 0.000921
(0.126) (0.925) (0.0820) (0.675) (0.129) (0.225)
Filipino familiar words 0.911*** 0.534***
(0) (0)
Filipino unfamiliar words 0.899*** 0.673***
(0) (0)
Filipino ORF 0.669*** 0.813***
(0) (0)
Filipino reading comp. 0.410*** 0.623***
(0) (0) Filipino reading comp excl. non-readers 0.372*** 0.604***
(0) (0)
G4 average class size -0.125** -0.0229 -0.0483 0.0591 0.000755 0.00106
(0.0129) (0.601) (0.163) (0.302) (0.560) (0.405)

USAID.GOV USAID BASA PILIPINAS IMPACT EVALUATION | 138
Constant 10.98 7.527 7.353 11.23 0.0954 0.266 23.96** 33.16*** 16.99*** 8.646 0.129 0.143 16.03 -6.110 5.679 -11.21 0.662* 0.649*
(0.295) (0.523) (0.373) (0.671) (0.650) (0.279) (0.0262) (0.00143) (0.00652
) (0.480) (0.507) (0.452) (0.473) (0.754) (0.645) (0.607) (0.0779) (0.0868)
Observations 2,530 2,535 2,533 2,531 2,537 1,824 2,564 2,567 2,568 2,567 2,568 2,242 1,179 1,180 1,179 1,179 1,180 1,121
Sex-Disaggregated Results – English
Regression Results
Letter sounds correct
per minute
Familiar words correct
per minute
Unfamiliar words correct
per minute
Oral reading fluency, correct
per minute
Reading comp., % correct
Reading comp.
(no zeros), % correct
Letter sounds correct
per minute
Familiar words correct
per minute
Unfamiliar words correct
per minute
Oral reading fluency, correct
per minute
Reading comp., % correct
Reading comp.
(no zeros), % correct
Letter sounds correct
per minute
Familiar words correct
per minute
Unfamiliar words correct
per minute
Oral reading fluency, correct
per minute
Reading comp., % correct
Reading comp.
(no zeros), % correct
Grade 2 Grade 2 Grade 2 Grade 2 Grade 2 Grade 2 Grade 3 Grade 3 Grade 3 Grade 3 Grade 3 Grade 3 Grade 4 Grade 4 Grade 4 Grade 4 Grade 4 Grade 4
Basa boys 3.528*** 2.250 2.594** 2.411 0.0508 0.0241 2.678** 1.369 1.590* 1.196 -0.0587 -0.0765 -0.0951 1.050 -0.421 1.624 -0.0364 -0.0487
(0.00289) (0.135) (0.0326) (0.239) (0.369) (0.678) (0.0346) (0.363) (0.0613) (0.382) (0.294) (0.121) (0.955) (0.634) (0.790) (0.513) (0.624) (0.507)
English letters 0.552***
(0)
Basa girls -2.707* -2.478 -2.373* 0.222 -0.0302 -0.0118 -1.242 1.122 -0.433 -0.776 -0.00456 0.00155 2.535 -1.817 0.115 -1.255 -0.0591 -0.0519
(0.0938) (0.218) (0.0773) (0.909) (0.592) (0.838) (0.404) (0.666) (0.745) (0.654) (0.930) (0.975) (0.308) (0.507) (0.949) (0.611) (0.548) (0.603)
G2 average Class size
-0.142*** -0.00209 0.0920** -0.0308
-0.000568
-0.000684
(0.00329) (0.972) (0.0174) (0.714) (0.710) (0.666)
Households assets index 0.928*** 0.773 0.421* 1.475*** 0.0271** 0.0249** 0.307 0.135 0.262 0.260
0.0365***
0.0346*** 0.206 0.377 0.0295 -0.349 0.0192 0.0206
(0.00131) (0.141) (0.0774) (0.00551) (0.0150) (0.0304) (0.170) (0.709) (0.337) (0.432) (0.00017
1) (0.00024
4) (0.604) (0.323) (0.926) (0.416) (0.148) (0.125)
Student attended kindergarten 6.798*** 4.715 3.915** 9.026 0.237** 0.213* 3.010 2.069 2.479 -0.0561 0.0936 0.0720 -1.654 -2.427 -3.347* 0.0739 0.0575 0.0529
(0.00233) (0.175) (0.0348) (0.139) (0.0437) (0.0811) (0.105) (0.439) (0.208) (0.978) (0.164) (0.288) (0.470) (0.277) (0.0763) (0.983) (0.550) (0.580)
Student’s age when first attended kindergarten -0.0144 -0.319 -0.0613 -1.223 -0.0228 -0.0211 0.551 -1.417 -0.784 0.179 0.0127 0.0310 -2.724** -0.222 -0.180 -0.814 -0.0674 -0.0599
(0.987) (0.781) (0.942) (0.353) (0.548) (0.551) (0.477) (0.135) (0.263) (0.856) (0.663) (0.283) (0.0442) (0.824) (0.838) (0.589) (0.128) (0.180)
Student does 0.170 0.0857 0.308 0.146 0.0118 0.0163 0.662** -0.198 0.0201 0.181 0.00771 0.00756 0.188 0.498 0.691** 0.529 0.000709 0.000613

139 | USAID BASA PILIPINAS IMPACT EVALUATION USAID.GOV
homework
(0.559) (0.843) (0.186) (0.741) (0.276) (0.166) (0.0164) (0.603) (0.936) (0.591) (0.571) (0.588) (0.615) (0.170) (0.0151) (0.299) (0.953) (0.960)
Student receives homework help from a family member -1.108 0.571 -0.962 -0.953 -0.0541
-0.0770** -0.647 -0.0904 -0.962 -0.862 0.00923 0.0228 0.999 -1.598 -1.135 0.895
-0.0979** -0.105**
(0.242) (0.655) (0.209) (0.440) (0.133) (0.0292) (0.398) (0.927) (0.204) (0.404) (0.785) (0.498) (0.435) (0.205) (0.280) (0.544) (0.0219) (0.0140)
Student has books at home -0.0483 0.836 -0.634 2.649 0.00730 -0.00374 -0.970 1.665 -0.148 -1.685 -0.0312 -0.0182 1.294 1.541 0.0611 1.516 0.0282 0.0273
(0.969) (0.658) (0.443) (0.105) (0.856) (0.927) (0.384) (0.193) (0.883) (0.142) (0.395) (0.640) (0.360) (0.243) (0.954) (0.338) (0.578) (0.600)
Student brings books home from school 2.158 0.676 1.358 7.381** 0.0845 0.0531 0.450 4.297** 0.116 3.379* -0.0362 -0.0706 -3.256 -4.054* 0.437 -1.324 -0.0194 -0.0356
(0.117) (0.723) (0.364) (0.0445) (0.173) (0.382) (0.711) (0.0486) (0.924) (0.0905) (0.549) (0.221) (0.341) (0.0996) (0.855) (0.732) (0.777) (0.601)
Highest level of education in the household 0.470 0.313 0.445 1.044 0.0219 0.0212 1.131* 1.426** 0.715* 1.279** 0.0225 0.0167 0.100 0.748 0.630 0.647 0.0506 0.0523
(0.212) (0.655) (0.331) (0.294) (0.236) (0.285) (0.0870) (0.0221) (0.0595) (0.0263) (0.276) (0.400) (0.908) (0.470) (0.218) (0.428) (0.164) (0.162)
Age
when
student
was first
read to 0.128 -1.019 -0.233 -1.244 -
0.0467** -
0.0438** -
1.492*** -0.601 -0.620 -0.796 -
0.0405** -
0.0344** -0.500 -1.106 -
1.670*** -1.342 -0.0179 -0.0116
(0.792) (0.114) (0.529) (0.181) (0.0234) (0.0293) (0.00057
1) (0.219) (0.136) (0.107) (0.0220) (0.0452) (0.432) (0.113) (0.00076
6) (0.101) (0.509) (0.674)
School assets INDEX 1.006 0.443 0.104 0.550 0.0367** 0.0225 0.183 -1.109* -0.264 -0.756 0.00337 0.00523 -0.0920 -1.030 -1.002* 0.370 -0.0353 -0.0308
(0.130) (0.528) (0.836) (0.468) (0.0459) (0.237) (0.669) (0.0605) (0.515) (0.204) (0.845) (0.776) (0.932) (0.172) (0.0605) (0.711) (0.137) (0.195)
Highest grade instructed at this school -2.213 0.221 -0.393 0.874 0.00839 0.0218 -1.263 -1.198 0.254 1.467 -0.0492 -0.0614 -2.700 0.134 2.427 6.297** -0.173* -0.177*
(0.152) (0.889) (0.651) (0.620) (0.833) (0.612) (0.329) (0.480) (0.843) (0.536) (0.367) (0.228) (0.364) (0.963) (0.407) (0.0249) (0.0800) (0.0752)
# of days school is closed -0.147 0.124 0.189* 0.238
-0.000183 -0.00202 0.0358 -0.361 -0.191 -0.306 -0.00975 -0.00777 -0.181 -0.144 -0.152 0.231
-0.0104**
-0.0106**
(0.306) (0.435) (0.0936) (0.346) (0.973) (0.700) (0.769) (0.147) (0.293) (0.126) (0.107) (0.170) (0.434) (0.377) (0.201) (0.382) (0.0324) (0.0363)

USAID.GOV USAID BASA PILIPINAS IMPACT EVALUATION | 140
Total enrollment
0.00273**
-0.000427 0.000344 0.00292
0.000138***
0.000144*** 0.000493 0.00229* 0.00146
0.00616*** 4.34e-05 2.99e-05 0.00429*
0.00632**
0.00507***
0.00755***
0.000235***
0.000198***
(0.0170) (0.835) (0.712) (0.249) (0.00131) (0.00041
2) (0.570) (0.0879) (0.317) (1.69e-
06) (0.313) (0.499) (0.0662) (0.0125) (0.00844) (0.00825) (5.93e-
08) (1.15e-
05)
Months of teaching experience -0.00132 0.00584 0.00131 0.00704 0.000188 0.000193 0.00232 0.00253 0.00333 0.00321 0.000284
0.000300*
-0.000280 0.00311
-0.000713 -0.00132 0.000285 0.000272
(0.807) (0.487) (0.711) (0.416) (0.272) (0.262) (0.583) (0.649) (0.359) (0.586) (0.115) (0.0711) (0.967) (0.581) (0.884) (0.844) (0.164) (0.185)
Students are put into small reading groups -0.207 1.761 -0.00401 -0.301 -0.0159 0.00905 -0.629 -0.467 0.0491 -1.181 0.0632 0.0870 2.268 3.017* 0.751 1.365 0.119** 0.127**
(0.916) (0.316) (0.998) (0.900) (0.790) (0.881) (0.702) (0.773) (0.972) (0.344) (0.457) (0.338) (0.375) (0.0919) (0.607) (0.559) (0.0308) (0.0212)
Teacher has post-graduate degree -0.409 2.351 0.578 3.628* 0.00646
-0.000159 -1.880 -3.147* -2.620** -3.062* -0.0639 -0.0492 -2.007 -0.0826 0.471 -0.155 -0.0356 -0.0261
(0.801) (0.138) (0.638) (0.0789) (0.909) (0.998) (0.102) (0.0548) (0.0411) (0.0863) (0.208) (0.327) (0.429) (0.969) (0.755) (0.937) (0.523) (0.652)
2017 outcomes 0.294 1.319
-5.760*** 9.164***
-0.130*** -0.121**
-4.745*** 6.237*** 0.441 10.88*** 0.0165 0.00477
(0.792) (0.309) (6.30e-
09) (0.00011
2) (0.00595) (0.0109) (3.14e-
06) (1.16e-
05) (0.673) (0) (0.664) (0.903)
Age of student 0.475 -1.248* -0.416 -0.0660 0.00625 0.0138 -0.529 -1.133 -1.107* -1.234* -0.0212 -0.0281 -0.317 0.451 0.187 1.171 0.0458 0.0383
(0.468) (0.0814) (0.427) (0.950) (0.819) (0.615) (0.406) (0.130) (0.0593) (0.0722) (0.333) (0.209) (0.735) (0.638) (0.839) (0.403) (0.102) (0.170)
Sex of student 5.195*** 8.310*** 4.800*** 8.702*** 0.105** 0.0603 3.188** -0.526 2.270* 3.980*** 0.140*** 0.118*** 0.616 4.501* 2.596* 2.359 0.137 0.130
(0.000301)
(1.26e-07)
(2.67e-05)
(8.09e-05) (0.0263) (0.202) (0.0119) (0.823) (0.0500) (0.00764)
(0.000678) (0.00269) (0.765) (0.0673) (0.0911) (0.229) (0.108) (0.136)
Region 7 3.635** 6.485*** 5.289*** 4.819* 0.0998* 0.0691 4.058*** 2.120 2.861** 0.753 0.154** 0.149** 1.598 4.629* 5.424*** 0.885 0.0165 0.0146
(0.0326) (0.00058
4) (2.14e-
05) (0.0895) (0.0696) (0.229) (0.00073
3) (0.230) (0.0173) (0.657) (0.0173) (0.0153) (0.517) (0.0528) (0.00031
8) (0.716) (0.818) (0.843)
Mother tongue -0.264 -1.112 2.063 -1.439 0.165 0.190* 1.380 -1.348 -0.653 0.173 0.0772 0.101 -1.449 1.115 -4.271** -13.25* 0.000645 0.00497
(0.919) (0.659) (0.199) (0.587) (0.131) (0.0649) (0.441) (0.588) (0.760) (0.934) (0.408) (0.265) (0.609) (0.708) (0.0224) (0.0845) (0.997) (0.975)
English familiar words – G2 0.954***
(0)
English unfamiliar words – G2 0.889***
(0)

141 | USAID BASA PILIPINAS IMPACT EVALUATION USAID.GOV
English ORF – G2 0.735***
(1.96e-06)
English reading comp – G2 0.767***
(0)
English reading comp excluding non-readers – G2 0.619***
(0)
English letters 0.625*** 0.623***
(0) (0)
G3 average class size 0.00786 -0.00129 -0.0126 -0.0488
-0.000812 -0.00123
(0.825) (0.978) (0.770) (0.375) (0.552) (0.402)
English familiar words 0.895*** 0.569***
(0) (0)
English unfamiliar words 0.855*** 0.732***
(0) (0)
English ORF 0.894*** 0.901***
(0) (0)
English reading comp 0.772*** 0.598***
(0) (0) English reading comp excl. non-readers 0.696*** 0.589***
(0) (0)
G4 average class size -0.103* 0.00289 0.00223 0.131** 0.000731 0.000988
(0.0733) (0.959) (0.958) (0.0449) (0.706) (0.614)

USAID.GOV USAID BASA PILIPINAS IMPACT EVALUATION | 142
Constant 15.27 4.151 -4.741 -6.804 -0.588 -0.571 21.69** 32.64** 17.97* 9.257 0.239 0.335 58.88** -4.456 -5.753 -26.16 0.668 0.717
(0.251) (0.781) (0.609) (0.678) (0.150) (0.178) (0.0480) (0.0356) (0.0938) (0.642) (0.629) (0.470) (0.0173) (0.847) (0.809) (0.293) (0.395) (0.363)
Observations 2,530 2,532 2,531 2,532 2,537 2,057 2,564 2,568 2,568 2,568 2,568 2,319 1,180 1,179 1,180 1,180 1,180 1,119

143 | USAID BASA PILIPINAS IMPACT EVALUATION USAID.GOV
ANNEX 8 – CORRELATIONS BETWEEN OBSERVED TEACHING
PRACTICES AND ORF
Category General "best practice" teaching behavior
Correlation with ORF
Classroom Materials Uses different instructional resources
.05
Uses materials besides
textbooks
.06
Opportunities for Reflection and Application
Connects to previous lessons .04
Asks probing questions .13
Provides opportunities to apply learning
.03
Provides opportunities for critical thinking
.13
Positive Learning Environment Effective classroom
management
.06
Treats students fairly .02
Other Manages time effectively .03
Assesses pupil learning .10
Cooperative learning strategies
.10
Category Reading-Specific teaching behavior
Opportunities for Developing Comprehension
Asks pre-reading questions .10
Asks learners to act something out
.10
Uses multiple methods for comp.
.06
Asks questions to assess reading comp.
.09
Asks questions to assess
listening comp.
.08
Allows learners to retell story .10
Opportunities for Learning to Decode and Spell Words
Encourages sounding it out .09
Provides instructions to decode
.02
Asks learners to recognize letters
.03
Asks learners to recite
alphabet
.03
Positive Learning Environment Avoids criticizing learners .01
Encourages learners to help each other
.09
Other Uses reading-level
appropriate activities
.04
Asks readers to read aloud .12
Teaches learners new words .05
Assigns individual reading .12
Provides methods for good writing skills
.05

USAID.GOV USAID BASA PILIPINAS IMPACT EVALUATION | 144
ANNEX 9 – EGRA ASSESSMENT EQUATING
SI is using Early Grade Reading Assessments (EGRA) designed and tested by RTI in Cebuano, Ilokano,
Filipino, and English, and Early Grade Math Assessments (EGMA) in mother tongue designed and tested
by DepEd. When learning scores are compared across time from a panel of students to infer impacts,
scores are obtained through different versions of EGRA tools used across data collection rounds. RTI
provided SI with two equivalent versions of the mother tongue EGRA instruments and DepEd provided
three equivalent versions of the EGMA instruments. SI developed alternate Filipino and English
instruments, as these were not available from either RTI or DepEd. These alternate versions were
developed following guidance from RTI to scramble items in the letters, familiar words, and unfamiliar
words subtests, and swap in a similar oral reading passage and accompanying reading comprehension
questions, which were constructed keeping sentence structure and length the same, only altering main
nouns and verbs with nouns and verbs of equal syntactic and lexical complexity. A third version of
English was introduced at follow-up, following the same procedure.
DECISION TO EQUATE
The two test versions for each instrument were compared during pilot testing to determine if students
were scoring systematically higher on either version of any test. No systematic differences were found
between the two test forms for any of the tests in the pilot sample. Rather than using a baseline version
and an endline version as is done in many EGRA studies, we took an added precaution of randomizing
both test versions at baseline. At follow-up, each student takes an alternate version that she/he did not
receive previously. This method allows us to identify and correct for any effects resulting from
differences in test difficulty or comparability.
Analysis of the full sample data confirms that the versions were successfully assigned at random, though
some discrepancies in difficulty were found in the EGRA and EGMA instruments. Table 1 displays
equivalence data with the full sample at baseline, and shows that statistically significant differences are
observed across each of the tools.
Table 1: Baseline EGRA tool differences
EGRA Grade 1 Form A Form B t-test
Mean
Standard
deviation Mean
Standard
deviation p-value
Level of
significance
Ilokan
o
Letters correct per minute 12.17 13.04 12.71 12.81 0.697
Familiar words correct per minute 12.32 13.76 13.64 15.49 0.398
Unfamiliar words correct per minute 8.93 12.78 11.44 14.84 0.087 *
Oral reading words correct per
minute 8.26 10.98 11.48 13.53 0.013 **
Reading comprehension (pct correct) 7% 0.18 10% 0.19 0.096 *
Cebuan
o
Letters correct per minute 15.82 15.47 17.20 16.87 0.178
Familiar words correct per minute 11.15 12.88 11.22 13.25 0.930
Unfamiliar words correct per minute 9.13 10.55 8.44 10.13 0.293
Oral reading words correct per
minute 11.65 13.97 14.06 14.68 0.008 ***
Reading comprehension (pct correct) 10% 0.19 16% 0.24 0.000 ***
EGRA Grade 2
Form A Form B t-test

145 | USAID BASA PILIPINAS IMPACT EVALUATION USAID.GOV
Mean
Standard
deviation Mean
Standard
deviation p-value
Level of
significance Fili
pin
o
Letters correct per minute 17.80 16.67 17.98 16.42 0.841
Familiar words correct per minute 31.23 23.49 32.22 21.93 0.428
Unfamiliar words correct per minute 18.94 14.47 18.38 13.44 0.459
Oral reading words correct per
minute 34.92 23.83 27.12 26.38 0.000 ***
Reading comprehension (pct correct) 24% 0.23 20% 0.26 0.002 ***
Engl
ish
Letters correct per minute 19.97 18.38 22.97 18.31 0.003 ***
Familiar words correct per minute 25.74 25.52 26.19 26.28 0.753
Unfamiliar words correct per minute 14.19 14.51 14.27 15.76 0.925
Oral reading words correct per
minute 33.42 28.80 37.57 32.02 0.013 **
Reading comprehension (pct correct) 12% 0.22 10% 0.18 0.038 **
EGRA Grade 3
Form A Form B t-test
Mean Standard
deviation Mean
Standard
deviation p-value
Level of
significanc
e
Fili
pin
o
Letters correct per minute 21.35 17.74 19.33 17.17 0.035 **
Familiar words correct per minute 48.07 25.36 45.63 25.87 0.083 *
Unfamiliar words correct per minute 28.34 15.64 25.89 15.62 0.004 ***
Oral reading words correct per
minute 48.35 25.69 46.79 25.53 0.268
Reading comprehension (pct correct) 14% 0.15 16% 0.19 0.134
Engl
ish
Letters correct per minute 22.81 17.99 25.06 17.79 0.022 **
Familiar words correct per minute 43.81 30.00 44.95 30.90 0.495
Unfamiliar words correct per minute 23.99 18.76 24.45 18.72 0.657
Oral reading words correct per
minute 53.80 34.76 61.59 37.74 0.000 ***
Reading comprehension (pct correct) 23% 0.29 15% 0.22 0.000 ***
Equating Method
SI will apply means equating to convert scores from multiple forms of a test to the same common
measurement scale. The conversion process obtained through equating adjusts for any difficulty
differences existing between forms so that a score on one form can be equated to its equivalent value
on another form. As a result, equating makes it possible to estimate the score that a person taking
one test form would have received had they taken a different test form. In other words, equating
ensures that any differences in scores between students taking different test versions are due to
student ability as opposed to differences in test difficulty. The most commonly equated EGRA
measure has consistently been ORF (USAID, EdData).
SI that calibrated the tools for equivalence with means equating method and obtained the following
conversion factors. These factors were then applied on basel ine and midline student scores for
analysis. These conversion factors are shown below.

USAID.GOV USAID BASA PILIPINAS IMPACT EVALUATION | 146
Table 2: Equating conversion factors for EGRA subtests
EGRA Ilokano Conversion factors used on baseline scores Conversion factors used on midline scores
Letter Sounds 0.958 0.991
Familiar Word Reading 0.904 1.101
Unfamiliar Word Reading 0.781 1.085
Oral Reading Fluency 0.719 1.023
Reading Comprehension 0.671 1.265
EGRA Cebuano Conversion factors used on baseline scores Conversion factors used on midline scores
Letter Sounds 0.900 1.006
Familiar Word Reading 0.980 1.051
Unfamiliar Word Reading 1.037 1.080
Oral Reading Fluency 0.815 0.934
Reading Comprehension 0.619 0.773
EGRA Filipino Grade 2 Conversion factors used on baseline scores Conversion factors used on midline scores
Letter Sounds 0.979 1.100
Familiar Word Reading 0.955 1.066
Unfamiliar Word Reading 1.023 1.130
Oral Reading Fluency 1.314 1.375
Reading Comprehension 1.203 1.010
EGRA Filipino Grade 3 Conversion factors used on baseline scores Conversion factors used on midline scores
Letter Sounds 1.099 0.958
Familiar Word Reading 1.047 0.980
Unfamiliar Word Reading 1.091 1.006
Oral Reading Fluency 1.042 0.959
Reading Comprehension 0.912 0.865
EGRA English (Version
B) Conversion factors used on baseline scores Conversion factors used on midline scores
Letter Sounds 0.887 0.956
Familiar Word Reading 0.991 0.983
Unfamiliar Word Reading 0.990 1.024
Oral Reading Fluency 0.869 0.876
Reading Comprehension 1.436 1.515
EGRA English (Version
C) Conversion factors used on baseline scores Conversion factors used on midline scores
Letter Sounds -- 0.995
Familiar Word Reading -- 1.010
Unfamiliar Word Reading -- 1.044
Oral Reading Fluency -- 0.983
Reading Comprehension -- 1.631

147 | USAID BASA PILIPINAS IMPACT EVALUATION USAID.GOV
ANNEX 10 – REVIEW OF TEST ORDER EFFECTS
The order of EGRA and EGMA assessments were randomly assigned in the Tangerine survey platform to mitigate against any biases that could
result due to the order in which assessments were administered. We analyzed scores on each EGRA and EGMA outcome variable, by grade, to
see how the order of tests effected scores. We do not observe any consistent trends on how the order of assessments affects student scores.
G1 EGRA:
21.5 21.5
15
16
17
18
19
20
21
22
23
24
25
EGMA, EGRA EGRA, EGMA
Letter Sounds, MT
21.622.4
15
17
19
21
23
25
27
EGMA, EGRA EGRA, EGMA
Familiar Words, MT

USAID.GOV USAID BASA PILIPINAS IMPACT EVALUATION | 148
17.317.6
15
15.5
16
16.5
17
17.5
18
18.5
19
19.5
20
EGMA, EGRA EGRA, EGMA
Unfamiliar Words, MT
22.623
20
21
22
23
24
25
26
EGMA, EGRA EGRA, EGMA
ORF, MT
1.4
1.6
1
1.1
1.2
1.3
1.4
1.5
1.6
1.7
1.8
1.9
EGMA, EGRA EGRA, EGMA
Reading Comprehension, MT

149 | USAID BASA PILIPINAS IMPACT EVALUATION USAID.GOV
G1 EGMA:
13.313.2
11.5
12
12.5
13
13.5
14
14.5
EGMA, EGRA EGRA, EGMA
Number identification, G1
6.1 6.1
5.2
5.4
5.6
5.8
6
6.2
6.4
6.6
6.8
EGMA, EGRA EGRA, EGMA
Quant Discr., G1

USAID.GOV USAID BASA PILIPINAS IMPACT EVALUATION | 150
2.9 2.9
2
2.2
2.4
2.6
2.8
3
3.2
3.4
EGMA, EGRA EGRA, EGMA
Missing Number, G1
7.2 7.2
6
6.2
6.4
6.6
6.8
7
7.2
7.4
7.6
7.8
EGMA, EGRA EGRA, EGMA
Addition 1, G1
4.6
4.8
4
4.2
4.4
4.6
4.8
5
5.2
5.4
EGMA, EGRA EGRA, EGMA
Subtraction 1, G1
1.3
1.4
1
1.1
1.2
1.3
1.4
1.5
1.6
1.7
EGMA, EGRA EGRA, EGMA
Word Problem, G1

151 | USAID BASA PILIPINAS IMPACT EVALUATION USAID.GOV
G2/G3 Filipino EGRA:
31.6
24
28.829.8
23
24.3
20
22
24
26
28
30
32
34
36
EGMA, Eng,Fil
EGMA, Fil,Eng
Eng, EGMA,Fil
Eng, Fil,EGMA
Fil, EGMA,Eng
Fil, Eng,EGMA
Letter Sounds, Filipino
37.336.9
35.8
36.9
38.737.8
30
32
34
36
38
40
42
EGMA, Eng,Fil
EGMA, Fil,Eng
Eng, EGMA,Fil
Eng, Fil,EGMA
Fil, EGMA,Eng
Fil, Eng,EGMA
Familiar Words, Filipino

USAID.GOV USAID BASA PILIPINAS IMPACT EVALUATION | 152
2625.7
25.3 25.1
26.827.3
22
23
24
25
26
27
28
29
30
EGMA, Eng,Fil
EGMA, Fil,Eng
Eng, EGMA,Fil
Eng, Fil,EGMA
Fil, EGMA,Eng
Fil, Eng,EGMA
Unfamiliar Words, Filipino
43.8
42.241.4
42
43.1
44.4
35
37
39
41
43
45
47
49
EGMA, Eng,Fil
EGMA, Fil,Eng
Eng, EGMA,Fil
Eng, Fil,EGMA
Fil, EGMA,Eng
Fil, Eng,EGMA
ORF, Filipino
1.3
1.2
1.3
1.2
1.3 1.3
1
1.1
1.2
1.3
1.4
1.5
1.6
EGMA, Eng,Fil
EGMA, Fil,Eng
Eng, EGMA,Fil
Eng, Fil,EGMA
Fil, EGMA,Eng
Fil, Eng,EGMA
Reading Comprehension, Filipino

153 | USAID BASA PILIPINAS IMPACT EVALUATION USAID.GOV
G2/G3 English EGRA:
29.4
32.1
26.527.5
31.9
33.2
22
24
26
28
30
32
34
36
38
EGMA, Eng,Fil
EGMA, Fil,Eng
Eng, EGMA,Fil
Eng, Fil,EGMA
Fil, EGMA,Eng
Fil, Eng,EGMA
Letter Sounds, English
32.732
31.4 31.1
34.4
32.9
25
27
29
31
33
35
37
39
EGMA, Eng,Fil
EGMA, Fil,Eng
Eng, EGMA,Fil
Eng, Fil,EGMA
Fil, EGMA,Eng
Fil, Eng,EGMA
Familiar Words, English

USAID.GOV USAID BASA PILIPINAS IMPACT EVALUATION | 154
22.9 22.9
22.1 21.9
23.724.3
18
19
20
21
22
23
24
25
26
27
28
EGMA, Eng,Fil
EGMA, Fil,Eng
Eng, EGMA,Fil
Eng, Fil,EGMA
Fil, EGMA,Eng
Fil, Eng,EGMA
Unfamiliar Words, English
42
39.740.4 40.1
43.1
41.8
35
37
39
41
43
45
47
EGMA, Eng,Fil
EGMA, Fil,Eng
Eng, EGMA,Fil
Eng, Fil,EGMA
Fil, EGMA,Eng
Fil, Eng,EGMA
ORF, English
0.6
0.7
0.8
0.7
0.9 0.9
0.5
0.55
0.6
0.65
0.7
0.75
0.8
0.85
0.9
0.95
1
EGMA, Eng,Fil
EGMA, Fil,Eng
Eng, EGMA,Fil
Eng, Fil,EGMA
Fil, EGMA,Eng
Fil, Eng,EGMA
English Reading Comp

155 | USAID BASA PILIPINAS IMPACT EVALUATION USAID.GOV
G2/G3 EGMA:
18.5
18.1
17.9
18.1
18.6
18.1
17
17.5
18
18.5
19
19.5
EGMA, Eng,Fil
EGMA, Fil,Eng
Eng, EGMA,Fil
Eng, Fil,EGMA
Fil, EGMA,Eng
Fil, Eng,EGMA
Number Identification, G2/G3
8.9
8.58.6
8.7
8.9
8.7
8
8.2
8.4
8.6
8.8
9
9.2
9.4
EGMA, Eng,Fil
EGMA, Fil,Eng
Eng, EGMA,Fil
Eng, Fil,EGMA
Fil, EGMA,Eng
Fil, Eng,EGMA
Quant Discr., G2/G3
54.9
5
5.25.3
5
4
4.2
4.4
4.6
4.8
5
5.2
5.4
5.6
5.8
EGMA, Eng,Fil
EGMA, Fil,Eng
Eng, EGMA,Fil
Eng, Fil,EGMA
Fil, EGMA,Eng
Fil, Eng,EGMA
Missing number, G2/G3
11.9
11.511.3
11.6
12.3
11.6
10
10.5
11
11.5
12
12.5
13
13.5
EGMA, Eng,Fil
EGMA, Fil,Eng
Eng, EGMA,Fil
Eng, Fil,EGMA
Fil, EGMA,Eng
Fil, Eng,EGMA
Addition 1, G2/G3

USAID.GOV USAID BASA PILIPINAS IMPACT EVALUATION | 156
2.7
2.5
2.6
2.5
2.7
2.6
2
2.1
2.2
2.3
2.4
2.5
2.6
2.7
2.8
2.9
3
EGMA, Eng,Fil
EGMA, Fil,Eng
Eng, EGMA,Fil
Eng, Fil,EGMA
Fil, EGMA,Eng
Fil, Eng,EGMA
Addition 2, G2/G3
8.3
7.5
8.28
9
8
6
6.5
7
7.5
8
8.5
9
9.5
10
EGMA, Eng,Fil
EGMA, Fil,Eng
Eng, EGMA,Fil
Eng, Fil,EGMA
Fil, EGMA,Eng
Fil, Eng,EGMA
Subtraction 1, G2/G3
1.8
1.6
1.8
1.7
1.9
1.6
1
1.2
1.4
1.6
1.8
2
2.2
EGMA, Eng,Fil
EGMA, Fil,Eng
Eng, EGMA,Fil
Eng, Fil,EGMA
Fil, EGMA,Eng
Fil, Eng,EGMA
Subtraction 2, G2/G3
2.1
1.8
2
1.9
2.2
2.1
1.4
1.6
1.8
2
2.2
2.4
2.6
EGMA, Eng,Fil
EGMA, Fil,Eng
Eng, EGMA,Fil
Eng, Fil,EGMA
Fil, EGMA,Eng
Fil, Eng,EGMA
Word problem, G2/G3

157 | USAID BASA PILIPINAS IMPACT EVALUATION USAID.GOV
ANNEX 11 – HISTOGRAMS OF ORF SCORES
Grade 1
Grade 2
0
.01
.02
.03
.04
.05
Den
sity
0 50 100 150 200Mother Tongue ORF
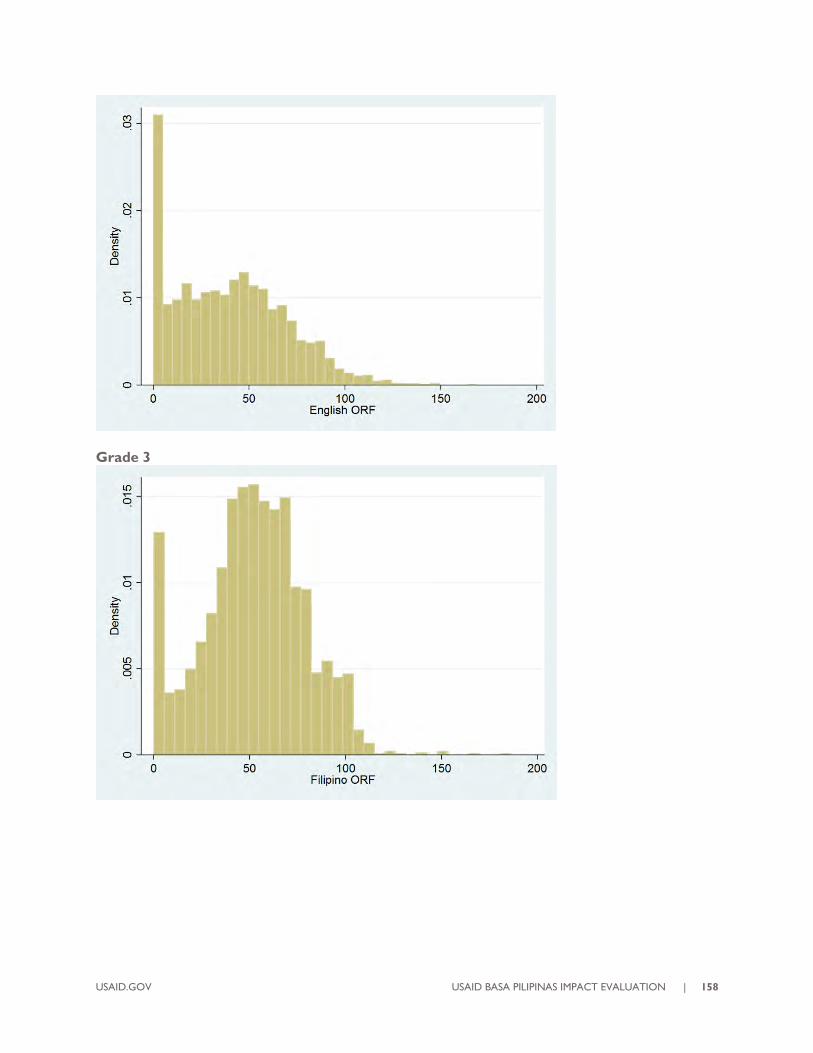
USAID.GOV USAID BASA PILIPINAS IMPACT EVALUATION | 158
Grade 3

159 | USAID BASA PILIPINAS IMPACT EVALUATION USAID.GOV
Grade 4

USAID.GOV USAID BASA PILIPINAS IMPACT EVALUATION | 160

161 | USAID BASA PILIPINAS IMPACT EVALUATION USAID.GOV
ANNEX 12 – DISCLOSURE OF CONFLICTS OF INTEREST
The evaluation team members disclosed that they had no potential conflicts of interest to conduct this
evaluation. Their Conflict of Interest forms are available upon request.
USAID.GOV USAID BASA PILIPINAS IMPACT EVALUATION | 162
ENDNOTES
i McEwan, P. J. (2015). Improving learning in primary schools of developing countries: a meta-analysis of
randomized experiments. http://academics.wellesley.edu/Economics/mcewan/PDF/meta.pdf
ii Özler, B., Fernald, L.C.H., Kariger, P., McConnell, C., Neuman, M., & Fraga, E. (2017). Combining preschool
teacher training with parenting education: a cluster-randomized controlled trial.
https://drive.google.com/file/d/0B274-JLBCKcdWVJDN1BNX05udkU/view
iii Snilstveit, B., Stevenson, J., Menon, R., Phillips, D., Gallagher, E., Geleen, M., Jobse, H., Schmidt, T., & Jimenez, E.
(2016). The impact of education programmes on learning and school participation in low- and middle-income
countries. http://www.3ieimpact.org/media/filer_public/2016/09/20/srs7-education-report.pdf
ivPiper B. & Mugenda, A. (2014). The Primary Math and Reading (PRIMR) Initiative: endline impact evaluation.
http://pdf.usaid.gov/pdf_docs/PA00K27S.pdf
v Raupp, M., Newman, B., Reves, L., Lauchande, C., Allan, E.J., Jordan, M.A. (2016). Impact Evaluation of the USAID
Aprender a Ler project in Mozambique. http://pdf.usaid.gov/pdf_docs/pa00m5d4.pdf
vi Elliott, F. & Goldenberg, C. (2016). Literacy Boost in Rwanda: impact evaluation of a 2-year randomized control
trial. https://globalreadingnetwork.net/publications-and-research/literacy-boost-rwanda-impact-evaluation-2-year-
randomized-control-trial
vii Abeberese, A. B., Kumler, T. J., & Linden, L.L. (2013). Improving Reading Skills by Encouraging Children to Read
in School: A Randomized Evaluation of the Sa Aklat Sisikat Reading Program in the Philippines. White Paper.
http://www.leighlinden.com/SAS%20Reading.pdf
viii Gowda, K., Kochar, A., Nagabhushana, C., & Raghunathan, N. (2013). Curriculum change and early learning: an
evaluation of an activity based learning program in Karnataka, India.
http://scid.stanford.edu/sites/default/files/publications/475wp_0.pdf
ix Spratt, J., King, S., & Bulant, J. (2013). Evaluation of Mali’s Read-Learn-Lead program: endline report.
https://www.rti.org/sites/default/files/resources/mali_rll_eval_endline_report.pdf