Embed Size (px)
Citation preview
Barter in Transition Economies:Competing Explanations Confront Ukrainian Data
Dalia MarinUniversity of Munich, CEPR, and RECEP
Daniel KaufmannThe World Bank
Bogdan GorochowskijHumboldt University Berlin
Januar 2000
This paper is a substantially revised version of an earlier paper which circulated under thetitle “Disorganization, Financial Squeeze, and Barter” in September 1998. Earlier versionsof this paper were presented at the European Bank for Reconstruction and Development,at the CEPR International Workshop in Transition Economics in Prague and at the RECEPConference on Economic and Social Reform in Russia: A European-Russian Dialogue inMoscow. We thank Alexis Giesen for very able research assistance and the HarvardInstitute for International Development for financial and logistic support.
1
Barter in Transition Economies:Competing Explanations Confront Ukrainian Data
Abstract
In this paper we survey the common explanations of barter in transitioneconomies and expose them to detailed survey data on 165 barter deals in Ukraine in1997. The evidence does not support the notion that soft budget constraints, lack ofrestructuring, or that the virtual economy are the driving forces behind barter.Further, tax avoidance is only weakly associated with the incidence of barter inUkraine. We then explore an alternative explanation of barter as a mechanism toaddress transitional challenges where capital markets and economic institutions arepoorly developed. First, barter helps to maintain production by creating a deal-specific collateral which softens the liquidity squeeze in the economy when creditenforcement is prohibitively costly. Second, barter helps to maintain production bypreventing firms to be exploited by their input suppliers when suppliers' bargainingposition is very strong due to high costs of switching suppliers. Thus, in the absenceof trust and functioning capital markets barter is a self-enforcing response toimperfect input and financial markets in the former Soviet Union. The paperconcludes by discussing potential long-term costs of barter arrangements, and bysuggesting particular pitfalls of expansionary monetary policy in barter economiessuch as Ukraine and Russia.
2
1. Introduction
One of the most striking puzzles of the recent development in the former SovietUnion (FSU) is the rise of barter trade. In a barter trade goods are paid with goods ormoney surrogates rather than cash. Under central planning this form of trade wasespecially observed in international trade among CMEA countries as well as in East-West trade.1 Barter in the domestic economy in Russia started to rise aftermacroeconomic stabilization in 1994 from 5 percent of GDP to 60 percent in 1998.2
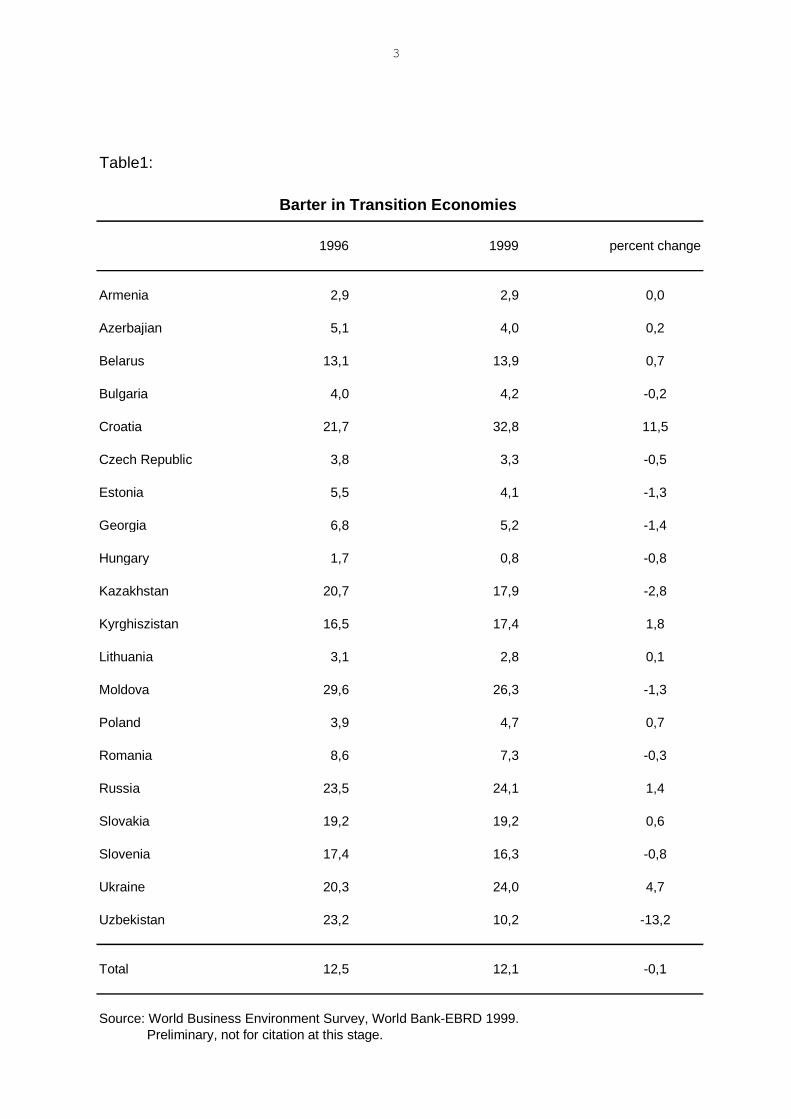
Our survey in the Ukraine gives an estimate of barter in industrial sales of 51 percentin 1997. The importance of barter varies across transition economies. The WorldBusiness Environment Survey in 20 transition economies shows that Croatiaexhibits the highest percent share of barter of 33 percent, Russia and the Ukraineshow a barter share of about 24 percent and Central Europe like Hungary, Poland ,and the Czech Republic have barter shares between 0.8 and 4.7 percent. It is alsointeresting to see that some of these countries experienced an increase in theimportance of barter over time like Croatia, Russia and the Ukraine, while barterdeclined in Uzbekistan, Kazakhstan, and Moldova. In Uzbekistan the fall of barterwas particularly pronounced. 3
1see Marin (1990) for the importance of barter in East-West trade, and Marin and Schnitzer (1995) foran explanation.2 For the development of barter over time see Transition Report 1997, for a recent estimate for Russiasee Commander and Mumssen (1998).3The reason why the estimates of barter of Commander and Mumssen (1998) on Russia and ourestimate on the Ukraine differ from the World Business Environment Survey estimates is that theformer two studies include bartering firms only while the latter considers bartering as well as non-bartering firms.
3
Table1:
1996 1999 percent change
Armenia 2,9 2,9 0,0
Azerbajian 5,1 4,0 0,2
Belarus 13,1 13,9 0,7
Bulgaria 4,0 4,2 -0,2
Croatia 21,7 32,8 11,5
Czech Republic 3,8 3,3 -0,5
Estonia 5,5 4,1 -1,3
Georgia 6,8 5,2 -1,4
Hungary 1,7 0,8 -0,8
Kazakhstan 20,7 17,9 -2,8
Kyrghiszistan 16,5 17,4 1,8
Lithuania 3,1 2,8 0,1
Moldova 29,6 26,3 -1,3
Poland 3,9 4,7 0,7
Romania 8,6 7,3 -0,3
Russia 23,5 24,1 1,4
Slovakia 19,2 19,2 0,6
Slovenia 17,4 16,3 -0,8
Ukraine 20,3 24,0 4,7
Uzbekistan 23,2 10,2 -13,2
Total 12,5 12,1 -0,1
Source: World Business Environment Survey, World Bank-EBRD 1999. Preliminary, not for citation at this stage.
Barter in Transition Economies
4
What explains the explosive increase of barter over time? Why does barter exist insome transition economies and not in others? In this paper we take a closer look atUkraine which clearly stands out to be a transition economy in which barter plays adominant role. By looking at one individual country we will try to understand theevolution of barter over time.4 We explore several explanations of barter in transitioneconomies which have been raised in the recent debate on the phenomenon. Amongthese explanations are soft-budget constraint, tax avoidance, delay in restructuring,the virtual economy, and lock-in. Delay in privatization and inefficient governancestructures are seen to lead to quantity targeting rather than profit maximization. Theabsence of hard budget constraints leads managers and workers to avoid the costsarising from restructuring by maintaining production in inefficient activities. Barteris seen to help to conceal the true market value of output.5 Furthermore, barter isseen by many experts to allow to avoid paying taxes by distorting the true value ofprofits. In addition, the banking sector is used as a tax collection agency bytransferring firm's incoming cash on bank accounts to the state to pay foroutstanding tax arrears. This way a payment in goods allows to circumvent payingtaxes. The virtual economy argument claims that barter helps to pretend that themanufacturing sector in Russia is producing value while in fact it is not. A finalexplanation of the use of non-monetary market exchange which is complementary tothe explanation of this paper accounts for its persistence over time once reciprocalexchange is established. When more people engage in barter, market search costsincrease and thus it becomes harder to exchange goods for money and the incentiveto maintain "personalized" exchange increases. Through this lock-in and networkeffect, this explanation points to possible long-term costs of using barter as anexchange system, because the latter system can persist even when it is inefficient. Itcannot, however, explain, why barter started to exist in the first place in the formerSoviet Union in 1994.6
We then proceed to explore an alternative explanation of barter in transitioneconomies. This sees barter as an economic institution to cope with problems arisingin the transition when the legal system and capital markets are poorly developed. Ina recent paper Blanchard and Kremer (1997) argue that the large decline in output inthe former Soviet Union has been caused by “disorganization” and hold-upproblems. The economy suffers from a lack of trust.7 Disorganization arises in a “no-future” environment when old relationships break down before new ones can be 4 In Kaufmann and Marin (1999) we focus on an explanation of the pattern of barter across transitioneconomies.5 The possibility of hiding in barter might make it an instrument for the unofficial economy andcorruption. We explore the connection between barter, the unofficial economy, and corruption inmore detail across transition economies in Kaufmann and Marin (1999). For the role of the unofficialeconomy to cope with the transition see Johnson, Kaufmann and Shleifer 1997.6 See R.E. Kranton (1996).7 see Johnson, Kaufmann, and Shleifer (1997) for why the official output fall might be overstated.
5
established. We argue in this paper that having no cash and requiring a trade creditfrom their input suppliers gives intermediate producers bargaining power whichhelps them do deal with disorganization and the lack of trust in the economy. Thebuyer’s lack of cash introduces also opportunities for hold-up on the other side ofthe transaction which helps to equalize bargaining power between the parties and toreduce distortions. However, it brings problems of its own, notably uncertaintyabout the enforceability of credit contracts, which can be dealt with by trading inbarter. This way barter can mitigate contractual hazards when capital markets areimperfect and it makes financing of business activities possible which otherwisewould not take place. Through this credit channel barter can prevent output fromdeclining even more than it otherwise would.
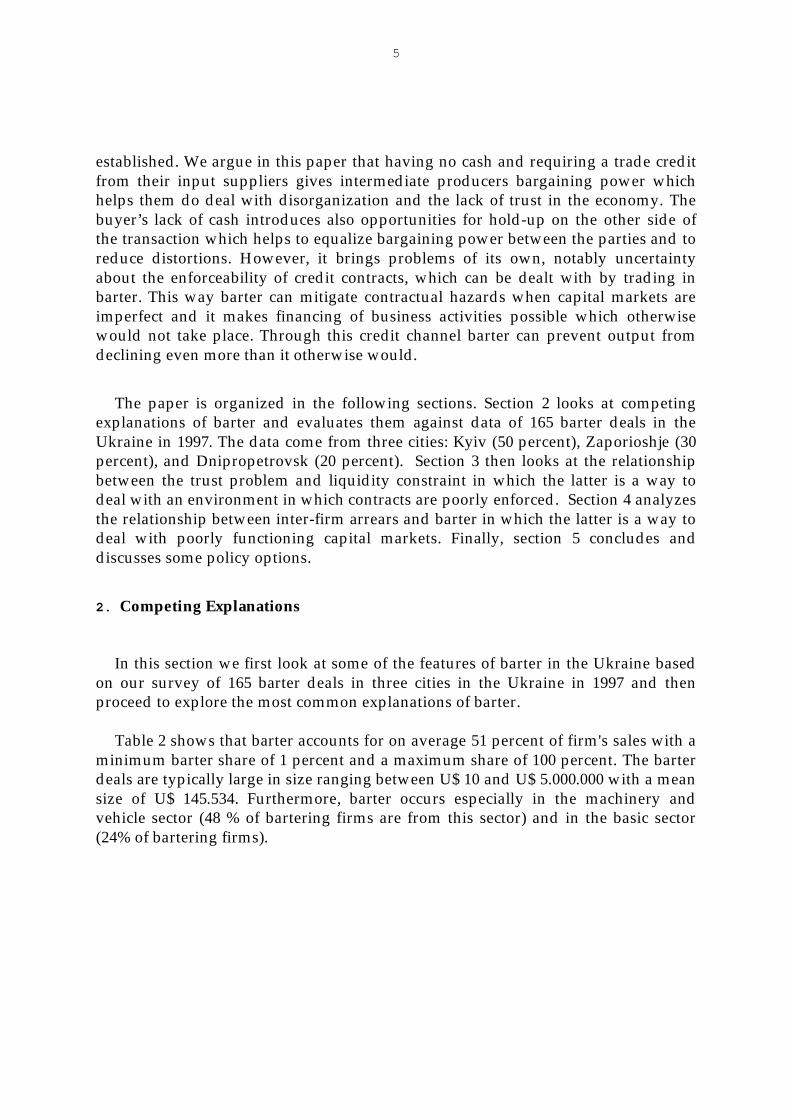
The paper is organized in the following sections. Section 2 looks at competingexplanations of barter and evaluates them against data of 165 barter deals in theUkraine in 1997. The data come from three cities: Kyiv (50 percent), Zaporioshje (30percent), and Dnipropetrovsk (20 percent). Section 3 then looks at the relationshipbetween the trust problem and liquidity constraint in which the latter is a way todeal with an environment in which contracts are poorly enforced. Section 4 analyzesthe relationship between inter-firm arrears and barter in which the latter is a way todeal with poorly functioning capital markets. Finally, section 5 concludes anddiscusses some policy options.
2. Competing Explanations
In this section we first look at some of the features of barter in the Ukraine basedon our survey of 165 barter deals in three cities in the Ukraine in 1997 and thenproceed to explore the most common explanations of barter.
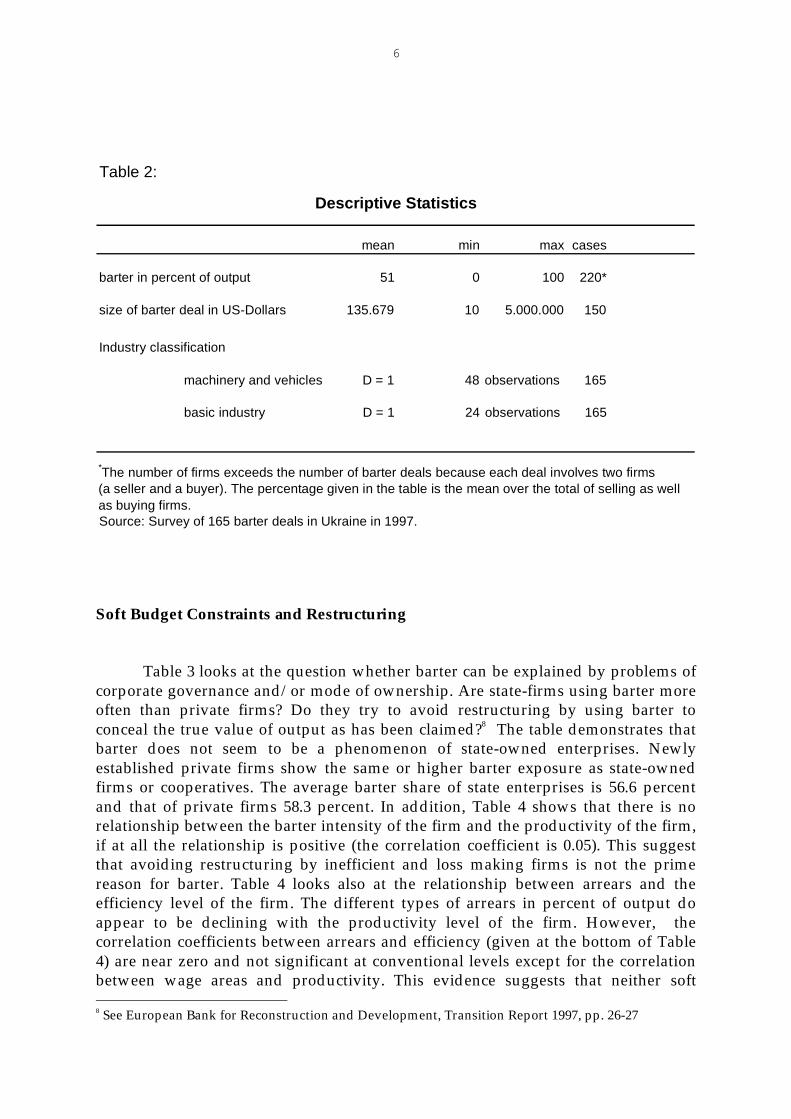
Table 2 shows that barter accounts for on average 51 percent of firm's sales with aminimum barter share of 1 percent and a maximum share of 100 percent. The barterdeals are typically large in size ranging between U$ 10 and U$ 5.000.000 with a meansize of U$ 145.534. Furthermore, barter occurs especially in the machinery andvehicle sector (48 % of bartering firms are from this sector) and in the basic sector(24% of bartering firms).
6
Soft Budget Constraints and Restructuring
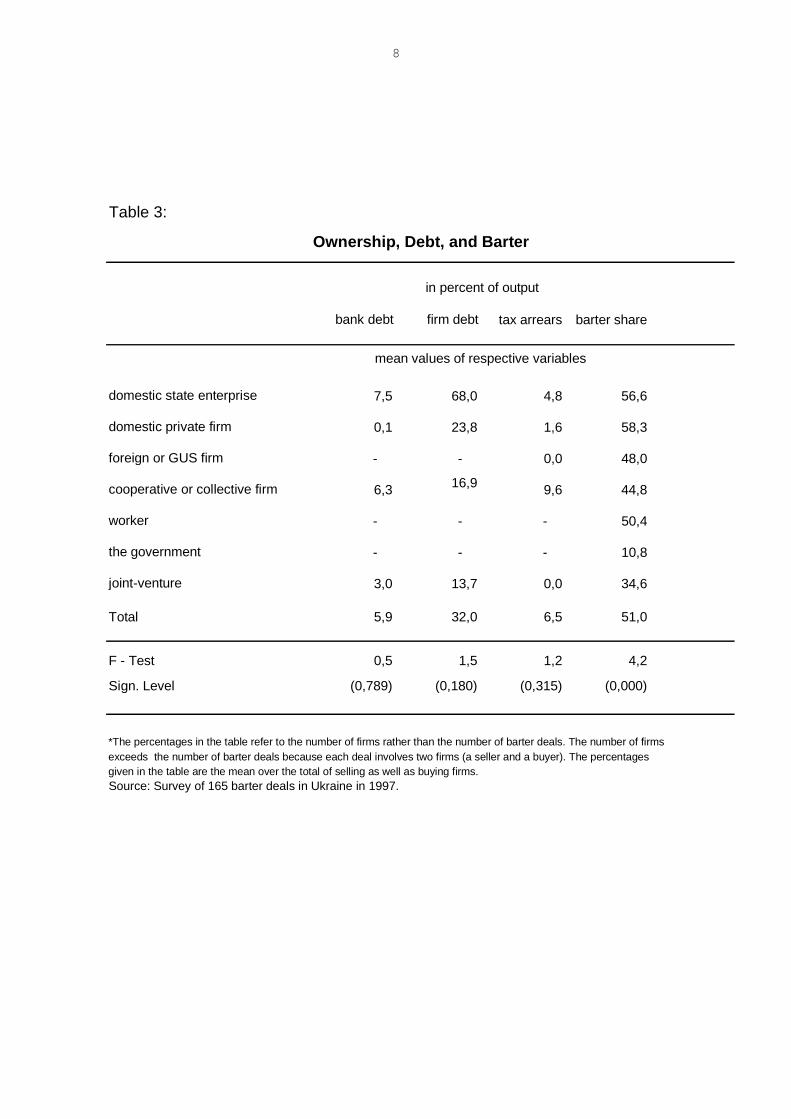
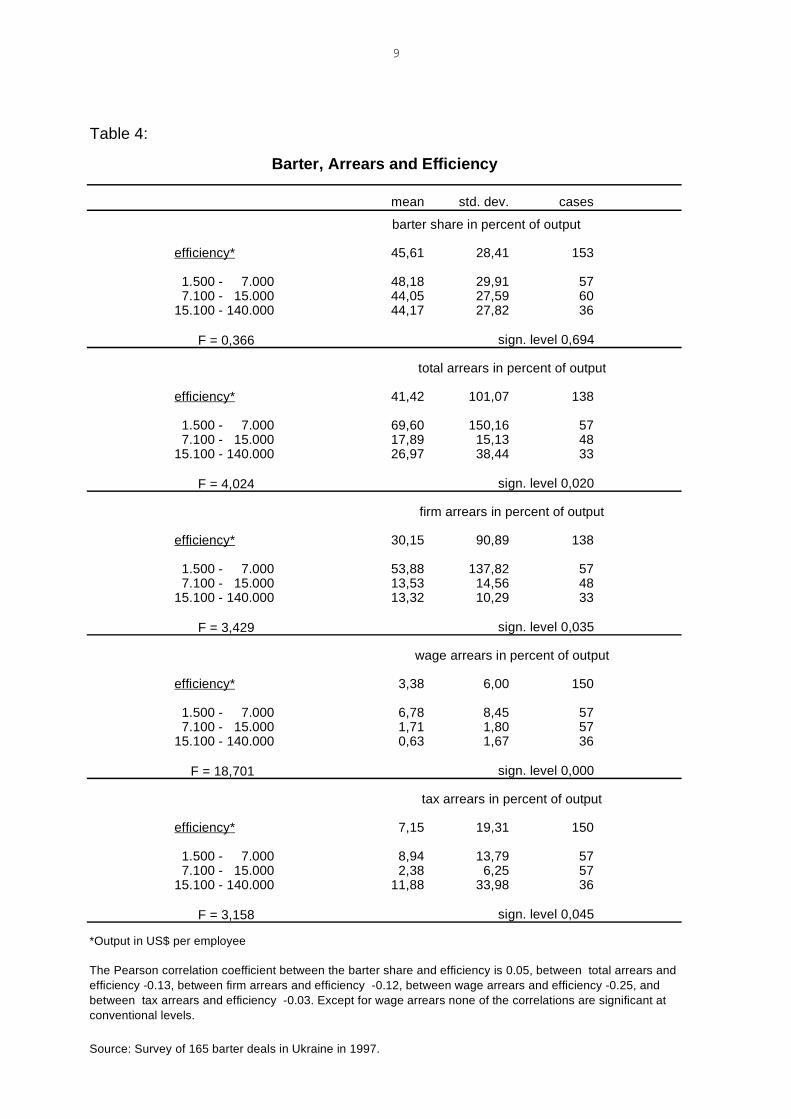
Table 3 looks at the question whether barter can be explained by problems ofcorporate governance and/or mode of ownership. Are state-firms using barter moreoften than private firms? Do they try to avoid restructuring by using barter toconceal the true value of output as has been claimed?8 The table demonstrates thatbarter does not seem to be a phenomenon of state-owned enterprises. Newlyestablished private firms show the same or higher barter exposure as state-ownedfirms or cooperatives. The average barter share of state enterprises is 56.6 percentand that of private firms 58.3 percent. In addition, Table 4 shows that there is norelationship between the barter intensity of the firm and the productivity of the firm,if at all the relationship is positive (the correlation coefficient is 0.05). This suggestthat avoiding restructuring by inefficient and loss making firms is not the primereason for barter. Table 4 looks also at the relationship between arrears and theefficiency level of the firm. The different types of arrears in percent of output doappear to be declining with the productivity level of the firm. However, thecorrelation coefficients between arrears and efficiency (given at the bottom of Table4) are near zero and not significant at conventional levels except for the correlationbetween wage areas and productivity. This evidence suggests that neither soft 8 See European Bank for Reconstruction and Development, Transition Report 1997, pp. 26-27
Table 2:
mean min max cases
barter in percent of output 51 0 100 220*
size of barter deal in US-Dollars 135.679 10 5.000.000 150
Industry classification
machinery and vehicles D = 1 48 observations 165
basic industry D = 1 24 observations 165
Source: Survey of 165 barter deals in Ukraine in 1997.
Descriptive Statistics
*The number of firms exceeds the number of barter deals because each deal involves two firms (a seller and a buyer). The percentage given in the table is the mean over the total of selling as well as buying firms.

7
budget constraints nor a reluctance to move into efficient activities seem to be thedriving force behind barter. The data do suggest, however, that very large arrears(firm arrears of more than 50 percent of firm’s output) tend to be a phenomenon ofless efficient firms.
8
Table 3:
bank debt firm debt tax arrears barter share
domestic state enterprise 7,5 68,0 4,8 56,6
domestic private firm 0,1 23,8 1,6 58,3
foreign or GUS firm - - 0,0 48,0
cooperative or collective firm 6,3 16,9 9,6 44,8
worker - - - 50,4
the government - - - 10,8
joint-venture 3,0 13,7 0,0 34,6
Total 5,9 32,0 6,5 51,0
F - Test 0,5 1,5 1,2 4,2
Sign. Level (0,789) (0,180) (0,315) (0,000)
*The percentages in the table refer to the number of firms rather than the number of barter deals. The number of firmsexceeds the number of barter deals because each deal involves two firms (a seller and a buyer). The percentagesgiven in the table are the mean over the total of selling as well as buying firms.Source: Survey of 165 barter deals in Ukraine in 1997.
Ownership, Debt, and Barter
in percent of output
mean values of respective variables
9
Table 4:
mean std. dev. cases
efficiency* 45,61 28,41 153
1.500 - 7.000 48,18 29,91 57 7.100 - 15.000 44,05 27,59 6015.100 - 140.000 44,17 27,82 36
F = 0,366
efficiency* 41,42 101,07 138
1.500 - 7.000 69,60 150,16 57 7.100 - 15.000 17,89 15,13 4815.100 - 140.000 26,97 38,44 33
F = 4,024
efficiency* 30,15 90,89 138
1.500 - 7.000 53,88 137,82 57 7.100 - 15.000 13,53 14,56 4815.100 - 140.000 13,32 10,29 33
F = 3,429
efficiency* 3,38 6,00 150
1.500 - 7.000 6,78 8,45 57 7.100 - 15.000 1,71 1,80 5715.100 - 140.000 0,63 1,67 36
F = 18,701
efficiency* 7,15 19,31 150
1.500 - 7.000 8,94 13,79 57 7.100 - 15.000 2,38 6,25 5715.100 - 140.000 11,88 33,98 36
F = 3,158
*Output in US$ per employee
Source: Survey of 165 barter deals in Ukraine in 1997.
The Pearson correlation coefficient between the barter share and efficiency is 0.05, between total arrears and efficiency -0.13, between firm arrears and efficiency -0.12, between wage arrears and efficiency -0.25, and between tax arrears and efficiency -0.03. Except for wage arrears none of the correlations are significant at conventional levels.
sign. level 0,000
tax arrears in percent of output
sign. level 0,045
sign. level 0,020
firm arrears in percent of output
sign. level 0,035
wage arrears in percent of output
Barter, Arrears and Efficiency
barter share in percent of output
sign. level 0,694
total arrears in percent of output
10
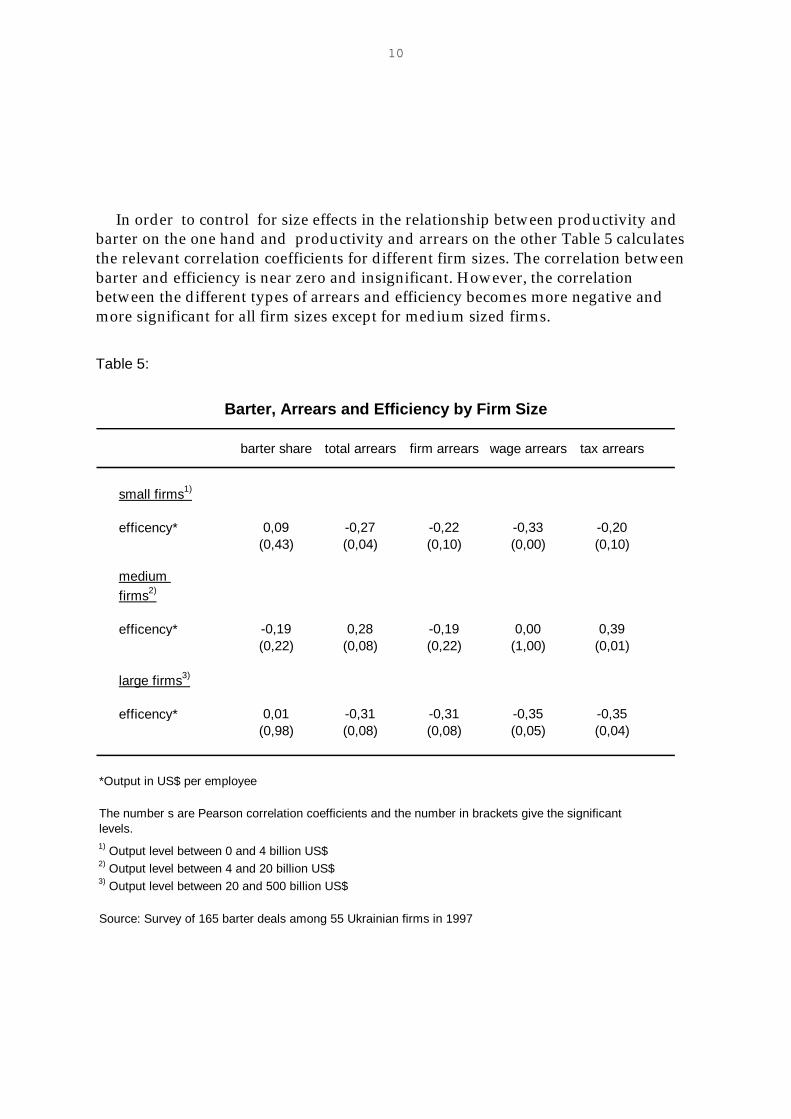
In order to control for size effects in the relationship between productivity andbarter on the one hand and productivity and arrears on the other Table 5 calculatesthe relevant correlation coefficients for different firm sizes. The correlation betweenbarter and efficiency is near zero and insignificant. However, the correlationbetween the different types of arrears and efficiency becomes more negative andmore significant for all firm sizes except for medium sized firms.
Table 5:
barter share total arrears firm arrears wage arrears tax arrears
small firms1)
efficency* 0,09 -0,27 -0,22 -0,33 -0,20(0,43) (0,04) (0,10) (0,00) (0,10)
medium
firms2)
efficency* -0,19 0,28 -0,19 0,00 0,39(0,22) (0,08) (0,22) (1,00) (0,01)
large firms3)
efficency* 0,01 -0,31 -0,31 -0,35 -0,35(0,98) (0,08) (0,08) (0,05) (0,04)
*Output in US$ per employee
Source: Survey of 165 barter deals among 55 Ukrainian firms in 1997
Barter, Arrears and Efficiency by Firm Size
3) Output level between 20 and 500 billion US$
2) Output level between 4 and 20 billion US$
1) Output level between 0 and 4 billion US$
The number s are Pearson correlation coefficients and the number in brackets give the significant levels.
11
The Virtual Economy
Next, we turn to the virtual economy argument of Gaddy & Ickes (1998). Theargument rests on the assumption that the manufacturing sector is value-substracting, but that most participants in the economy have an interest to pretendthat it is not. Barter allows the parties to pretend by allowing the manufacturingsector to sell its output at a higher price than its market value and the value-addingnatural resource sector (Gazprom) to accept this overpricing out of a lack of otheropportunities. But if the natural resource sector is producing valuable output, whyhas the sector nothing better to do than to subsidize the manufacturing sector? Letus pretend for a moment that the virtual economy argument does make economicsense (which it does not), is it actually true?
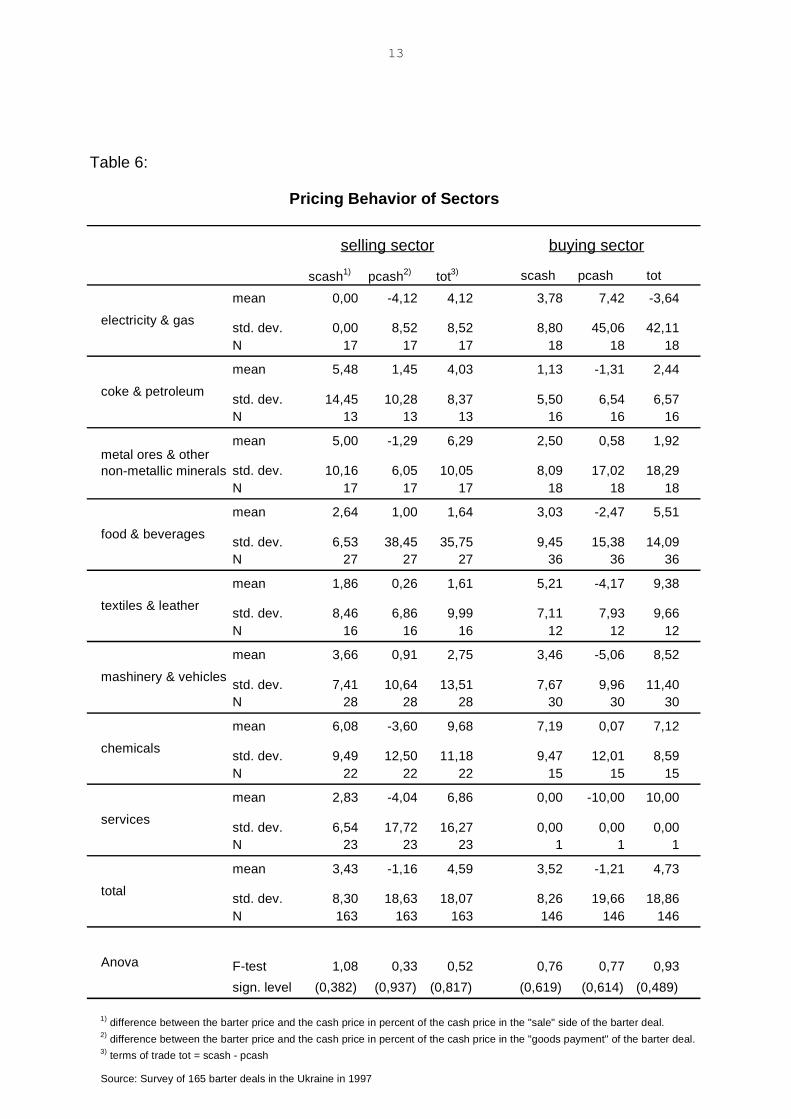
We can answer this question from our survey data, since we haveinformation on the percentage price difference between the barter price and the cashprice for each of the 165 barter deals in the sample. We have this information forboth sides (the “sale” and the “goods payment”) of each barter deal so that we cancalculate the net terms of trade effect of barter. Table 6 aggregates the 165 barterdeals into 8 sectors and looks at their pricing behavior in barter compared to cashdeals. The table distinguishes whether the sector is on the selling or buying end ofthe transaction. SCASH is the percentage difference between the barter price and thecash price on the “sale” side of the barter deal. PCASH is the percentage differencebetween the barter price and the cash price on the “goods payment” of the barterdeal.9 TOT measures the net terms of trade effect and is calculated by TOT = SCASH– PCASH. When the sector is on the selling end of the transaction and TOT takes apositive value, then barter allows the sector to shift the terms of trade in its favor.When the sector is on the buying end of the transaction and TOT takes a positivevalue, then barter shifts the terms of trade in its disfavor.
If the virtual economy argument were valid, we would expect thatmanufacturing sectors like textiles and leather, machinery and vehicles, andchemicals to shift the terms of trade in their favor, while the natural resource sectorslike electricity & gas, coke and petroleum would see the terms of trade move againstthem. What appears from Table 6 is that there is no systematic difference in thepricing behavior within barter across sectors (the F-test of the Analysis of Variance(ANOVA) is not statistically significant at conventional levels). Take the example ofmachinery and vehicles. When this sector is on the selling end of the barter deal, itoverprices its output on average by 3.66 percent relative to cash deals and is
9 We obtained this information from the following question: „What is the percentage difference between theprice you charge/you are charged in this barter deal as compared to the typical price you charge/you are chargedfor the same product in cash deals?“
12
overpriced on the “goods payment” by 0.91 percent on average, so that the sector’snet benefit from barter is 2.75 percent (in terms of its cash price). So far so good. Butthe same appears to be true for the natural resource sector like electricity and gas.This sector’s net benefit from barter is 4.12 percent (in terms of its cash price). Whatseems to matter here for the pricing behavior within barter is not the sector, butwhether the sector is on the selling or buying end of the transaction. Take again theexample of machinery and vehicles. When this sector is on the buying end of thebarter deal, it pays more for the “sale” by 3.46 percent on average and sells its “goodpayment” at a 5.06 percent discount compared to cash deals, so that the sector’s netloss from barter is 8.52 percent on average. This net loss from barter appears to behappening in all the other sectors as well except for electricity and gas, when thesector is a buyer rather than a seller. It appears then that the sectors gain from barterwhen they sell and they loose from barter when they buy.10 The only sector thatseems to be gaining from barter independent of its buying or selling status appearsto be the natural resource sector electricity and gas. This is just the opposite fromwhat we would have expected if we believed in the virtual economy argument ofRussia’s non-cash economy.
10 Marin and Schnitzer (1999) explain this pricing behavior by hold-up and incentive problems.
13
Table 6:
scash1) pcash2) tot3) scash pcash tot
mean 0,00 -4,12 4,12 3,78 7,42 -3,64
std. dev. 0,00 8,52 8,52 8,80 45,06 42,11N 17 17 17 18 18 18
mean 5,48 1,45 4,03 1,13 -1,31 2,44
std. dev. 14,45 10,28 8,37 5,50 6,54 6,57N 13 13 13 16 16 16
mean 5,00 -1,29 6,29 2,50 0,58 1,92
std. dev. 10,16 6,05 10,05 8,09 17,02 18,29N 17 17 17 18 18 18
mean 2,64 1,00 1,64 3,03 -2,47 5,51
std. dev. 6,53 38,45 35,75 9,45 15,38 14,09N 27 27 27 36 36 36
mean 1,86 0,26 1,61 5,21 -4,17 9,38
std. dev. 8,46 6,86 9,99 7,11 7,93 9,66N 16 16 16 12 12 12
mean 3,66 0,91 2,75 3,46 -5,06 8,52
std. dev. 7,41 10,64 13,51 7,67 9,96 11,40N 28 28 28 30 30 30
mean 6,08 -3,60 9,68 7,19 0,07 7,12
std. dev. 9,49 12,50 11,18 9,47 12,01 8,59N 22 22 22 15 15 15
mean 2,83 -4,04 6,86 0,00 -10,00 10,00
std. dev. 6,54 17,72 16,27 0,00 0,00 0,00N 23 23 23 1 1 1
mean 3,43 -1,16 4,59 3,52 -1,21 4,73
std. dev. 8,30 18,63 18,07 8,26 19,66 18,86N 163 163 163 146 146 146
F-test 1,08 0,33 0,52 0,76 0,77 0,93
sign. level (0,382) (0,937) (0,817) (0,619) (0,614) (0,489)
1) difference between the barter price and the cash price in percent of the cash price in the "sale" side of the barter deal. 2) difference between the barter price and the cash price in percent of the cash price in the "goods payment" of the barter deal. 3) terms of trade tot = scash - pcash
Source: Survey of 165 barter deals in the Ukraine in 1997
Pricing Behavior of Sectors
selling sector buying sector
electricity & gas
coke & petroleum
metal ores & other non-metallic minerals
food & beverages
textiles & leather
Anova
mashinery & vehicles
chemicals
services
total
14
Taxes
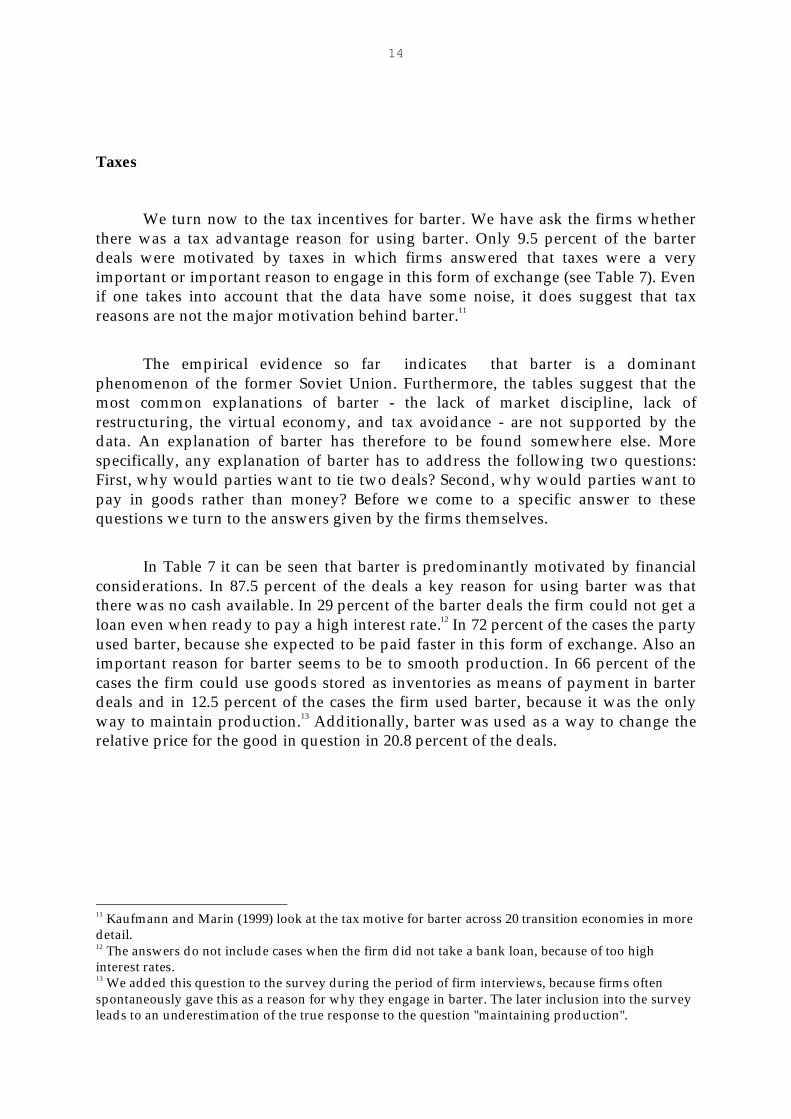
We turn now to the tax incentives for barter. We have ask the firms whetherthere was a tax advantage reason for using barter. Only 9.5 percent of the barterdeals were motivated by taxes in which firms answered that taxes were a veryimportant or important reason to engage in this form of exchange (see Table 7). Evenif one takes into account that the data have some noise, it does suggest that taxreasons are not the major motivation behind barter.11
The empirical evidence so far indicates that barter is a dominantphenomenon of the former Soviet Union. Furthermore, the tables suggest that themost common explanations of barter - the lack of market discipline, lack ofrestructuring, the virtual economy, and tax avoidance - are not supported by thedata. An explanation of barter has therefore to be found somewhere else. Morespecifically, any explanation of barter has to address the following two questions:First, why would parties want to tie two deals? Second, why would parties want topay in goods rather than money? Before we come to a specific answer to thesequestions we turn to the answers given by the firms themselves.
In Table 7 it can be seen that barter is predominantly motivated by financialconsiderations. In 87.5 percent of the deals a key reason for using barter was thatthere was no cash available. In 29 percent of the barter deals the firm could not get aloan even when ready to pay a high interest rate.12 In 72 percent of the cases the partyused barter, because she expected to be paid faster in this form of exchange. Also animportant reason for barter seems to be to smooth production. In 66 percent of thecases the firm could use goods stored as inventories as means of payment in barterdeals and in 12.5 percent of the cases the firm used barter, because it was the onlyway to maintain production.13 Additionally, barter was used as a way to change therelative price for the good in question in 20.8 percent of the deals.
11 Kaufmann and Marin (1999) look at the tax motive for barter across 20 transition economies in moredetail.12 The answers do not include cases when the firm did not take a bank loan, because of too highinterest rates.13 We added this question to the survey during the period of firm interviews, because firms oftenspontaneously gave this as a reason for why they engage in barter. The later inclusion into the surveyleads to an underestimation of the true response to the question "maintaining production".
15
In the following two sections we will look at an alternative explanation whichtakes into account that barter is primarily driven by financial reasons. Firms mightwant to tie two deals and they might want to pay in goods rather than moneybecause by doing so they can solve incentive and hold-up problems which otherwisewould prevent trade from taking place at all. In the next section we will argue thathaving no cash turns out to be a mechanism to cope with disorganization and hold-up when legal enforcement of contracts is poorly developed. In section 4 we willargue that barter creates a deal specific collateral and that this is a way of dealingwith the problem of creditworthiness of firms.
Table 7:
1997
in percent1
no cash 87,5
no bank loan 29,1
no trust in the value of money 6,0
faster payment compared to cash payment 72,1
no struggle with other creditors 7,8
no courts to enforce rights 6,0
to maintain production 12,5
goods in stock could be used 66,1
liquid good 1,8
better deal on the price in barter 20,8
reducing the tax burden 9,5
avoiding controls on foreign trade 1,8
reducing regulations 6,0
capital flight to the west 0,0
state pressure 1,8
others 1,2
1) answers have been ranked between very important and irrelevant. The percentages give very important responses.
Source: Survey of 165 barter deals in Ukraine in 1997
Motives for Barter
16
3. Disorganization and Liquidity Constraint
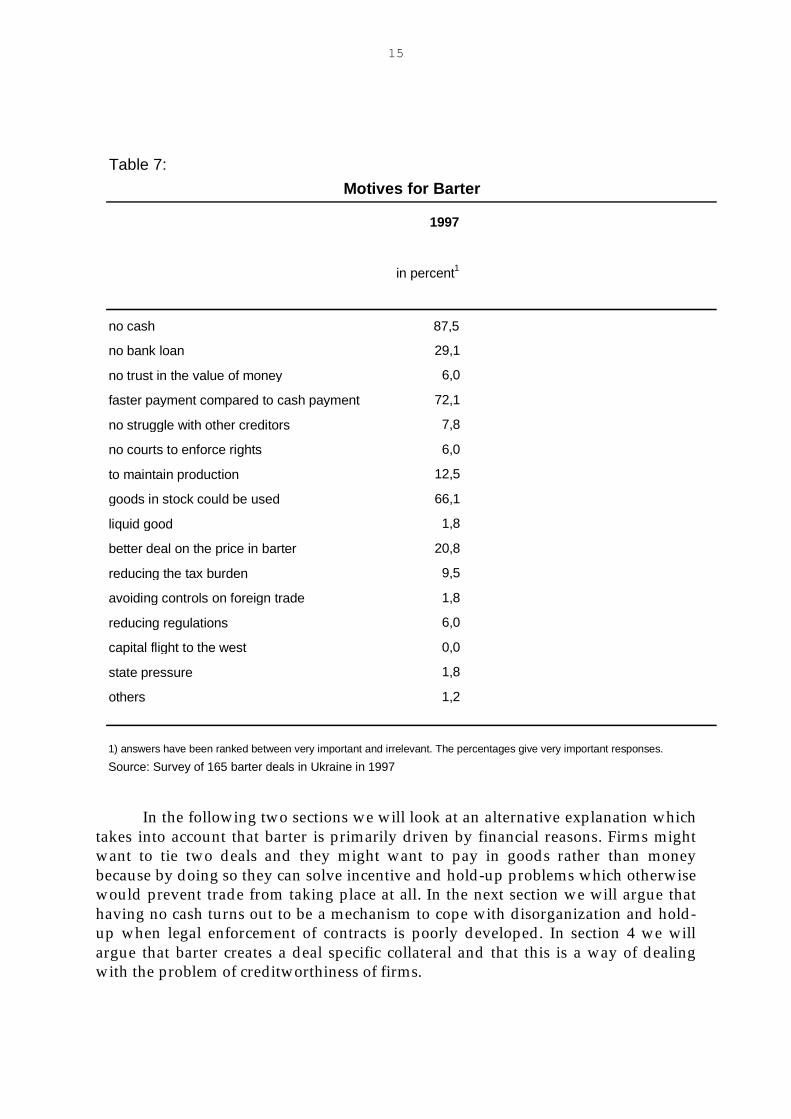
In a recent paper Blanchard and Kremer (1997) explain the rapid output decline in theformer Soviet Union by disorganization and hold-up problems. Central planning wascharacterized by a complex set of specific relations between firms. Many firms had only one
supplier from which to buy and knew of only one or a few buyers to whom to sell. Thispicture of little outside opportunities is still observed in the Ukraine in 1997. In 20 percent ofthe sales within barter deals the parties had no alternative partner and in 37 percentof the sales only a few alternative partners to carry out the business.
Such an environment with little outside opportunities - called specificity -typically creates hold-up problems and opens room for bargaining. Under centralplanning the main instrument to enforce production and delivery of goods was thecoercive power of the state. Transition eliminated the central planner and thus theinstrument to limit the adverse effects of specificity without creating institutions todeal with specificity such as vertical integration and the range of contracts that existin market economies. Furthermore, in times of transition the anticipation ofchanging business partners and the disappearance of firms shortens horizons andreduces the scope for long term relationships. Thus, in such a "no future"environment a typical mechanism to constraint opportunistic behavior such asreputation does not work. Blanchard and Kremer (henceforth BK) argue thatspecificity in the relations between firms together with incompleteness of contractsresults in disorganization - the breakdown of many economic relations before newones can be established - which in turn explains the large output losses.
In the BK model specificity arises in a chain of production with a largenumber of stages. Each buyer along the chain knows only the supplier it was pairedwith under
Table 8:
Lock-In:
Business Alternatives
sale goods paymentin percent
no alternative 20,2 6,0a few alternatives 36,9 32,1many alternatives 41,1 60,1
Source: Survey of 165 barter deals in Ukraine in 1997.
17
central planning. The primary input supplier has an alternative use for the inputwhile all intermediate producers along the chain of production are assumed to beable to sell to the next following buyer only. BK formulate the hold up problem byassuming that it is impossible for each firm in the chain to sign a contract with thebuyer (the next firm in the chain) before it has produced the good. Each firm mustfirst buy inputs and produce, and only then - once the cost of producing is sunk - canstrike a bargain with the next producer in the chain. At this stage, however, eachintermediate producer's reservation value is zero and thus the next producer in thechain can "hold him up" and exploit his dependency by offering to purchase thegood at a price only which does not cover each intermediate producer's costs. Thefear of being "held-up" by the following firm each intermediate producer will stop todeliver inputs and thus the chain of production breaks down. Output collapses dueto a shortage of inputs. In the BK model output collapses because firm relations arespecific (the intermediate producers cannot sell the good to someone else) andbecause contracts are incomplete (each intermediate producer must produce itsintermediate good before bargaining over the price for the input with the nextproducer along the chain). If the government retained its coercive power it couldforce suppliers to deliver and thus output would not decline.
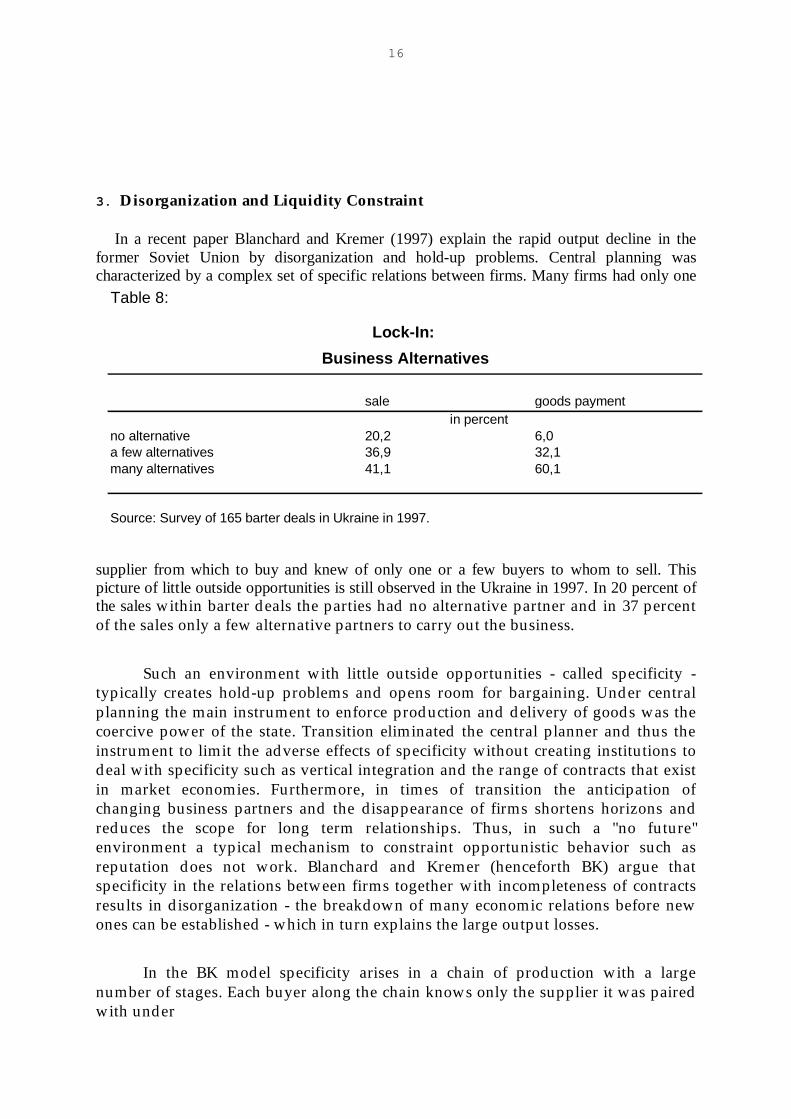
Is there another mechanism than the coercive power of the state by whichintermediate producers can be induced to trade inputs by preventing producersfurther down the chain from reneging and renegotiating the price? Marin andSchnitzer (1999) (henceforth MS) claim yes in a model which introduces liquidityand credit constraints into a BK type of production chain. Analogous to BK theyconsider a good which requires n steps of production. In contrast to BK, MSconsider a situation in which the supplier holds up the buyer rather than the otherway around. In MS formulation the buyer makes a firm-specific investment in orderto find an adequate input supplier (see Figure 1). This investment takes place at date0.9. At date 1.0 when the supplier delivers the input they negotiate over the inputprice. At this stage the buyer’s investment is already sunk and not taken into accountin the bargaining over the input price. Thus, the buyer might not invest in finding asupplier relationship because these costs are not taken into account. This is whatconstitutes the hold-up problem on the buyer’s side. MS claim that this formulationof the hold-up problem on the buyer’s rather than the supplier’s side to be moreplausible in the context of the former Soviet Union, since input suppliers are on theshort side of the market and thus input buyers have to spend time and money inorder to find adequate suppliers and to establish a business relationship. 14
14 MS provide empirical evidence which supports this formulation of the hold-up problem on thebuyer’s side.
18
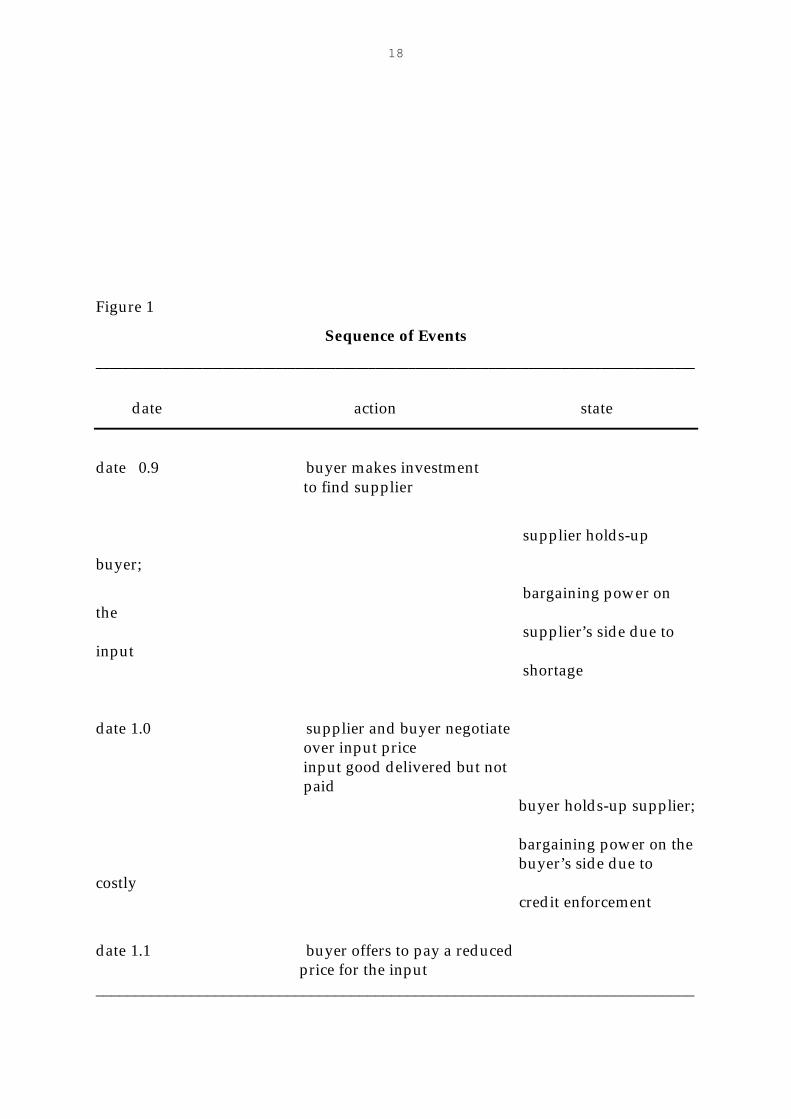
Figure 1
Sequence of Events
__________________________________________________________________________________________
date action state
date 0.9 buyer makes investment to find supplier
supplier holds-up
buyer;
bargaining power onthe supplier’s side due toinput shortage
date 1.0 supplier and buyer negotiate over input price input good delivered but not paid buyer holds-up supplier;
bargaining power on the buyer’s side due tocostly credit enforcement
date 1.1 buyer offers to pay a reduced price for the input___________________________________________________________________________
19
MS assume further that the intermediate producer has no cash to pay for the input atdate 1.0. He requires a trade credit from the input supplier which he can repay whenhe sell the input to the next firm. In order to make sure that his trade credit is repaid,the input supplier has to incur credit enforcement costs (he has to involve legal firmsor the Mafia). MS then show that the fact that the intermediate producer has no cashto pay for the input and thus requires a trade credit gives the input purchaser somecountervailing bargaining power. This bargaining power in turn reduces thepossibility that the input supplier can exploit the input purchaser’s need for theinput. More specifically, since the buyer has no cash to pay for the input upondelivery at date 1.0, once the input supplier delivers the input, the bargaining powerreverses and shifts to the buyer. Now the input supplier has to worry of being paid(see Figure 1). When it comes to paying for the input after the input buyer hasrealized his profits from selling the input to the next firm at date 1.1 (which the inputseller is assumed to be observing), the input buyer will hold up now the input sellerand renegotiates the price for the input. He will try to lower the input price by theenforcement costs which the seller has to incur if the buyer does not pay voluntarily.In equilibrium the input seller will accept this lower price, since his alternative is toinsist on the original price and to involve the Mafia.
However, the input supplier could attempt to compensate for this future pricereduction by the buyer at date 1.1 by raising its input price at date 1.0 when hedelivers the input. MS then show that marking up the input price at date 1.0 inanticipation of the future price renegotiations will be possible only at low creditenforcement costs. When these costs become sufficiently large, the buyer’s liquidityconstraint will make it impossible for the supplier to pass on these costs to him. Thereason is that the most the buyer can pay for the input is the cash he himself realizesfrom selling the intermediate good to the next buyer. If enforcement costs aresufficiently large the input buyer’s cash from the sale to the next firm will not beenough to cover these costs. This is the circumstance when the input buyer canexploit the fact that he is liquidity constraint to shift the surplus in his favor and thusprevent to be held up by the input supplier.
When credit enforcement costs become too large, however, the input supplier willrefuse to participate in the deal, since he cannot expect a positive profit. From thisstory of the model MS predict a hump shaped relationship between the firm’s outputgrowth and credit enforcement costs. The output decline will be less pronounced forfirms short of cash. Firms short of cash can use their liquidity constraint in thebargaining to prevent to be held-up by their input suppliers. When this constraintbecomes too large , however, it may be too costly for the supplier to enforce paymentand thus output declines due to a shortage of credit.
If the intermediate producer’s liquidity constraint is alleviating the hold-upproblem, what is then the role of barter? Barter becomes important when credit
20
enforcement becomes so costly that input suppliers will refuse to participate in thedeal. Thus, if the input buyer has no cash and requires a trade credit from the inputsupplier, but the legal system to enforce payment is poorly developed, a potentiallyvaluable transaction does not take place. Under these circumstances barter can helpto maintain production. Barter introduces a hostage, a commitment devise thatprevents the buyer from fully exploiting his bargaining power.15 More specifically,when enforcement costs become prohibitively costly for the input supplier toparticipate in the deal, introducing a second profitable deal in the form of the goodspayment allows the input buyer to commit not to exploit his bargaining power andto shift some of the profit back to the input supplier to make him participate in thedeal. Barter is a self enforcing arrangement which makes the intermediate producersalong the chain of production to loose from reneging the contract. This way barterhelps to cope with specificity without relying on the legal system16. From this storyMS predict a hump shaped relationship between the firm’s output growth and thefirm’s exposure to barter.
In order to see whether this story makes sense empirically we will look at therelationship between the firm’s change in output and the extend of the hold-up andthe credit problem and the firm’s exposure to barter. There are three implications.First, the more severe the hold-up problem, the lower will be the firm’s outputgrowth due to the breakdown of business relationships in response to a lack of trust.Second, the firm’s output growth is expected to be larger for intermediate levels ofcredit enforcement costs and to be lower when the credit problem becomes verylarge (hump shaped relation). Third, the firm’s output growth is expected to belarger for lower levels of barter exposure and to be lower when the barter exposurebecomes very large (hump shaped relation).
We gathered data of 165 barter deals in 1997. Although the unit of analysis ofthe survey is a barter deal, the survey includes information on the two firmsinvolved in each deal as well. We use these firm level information in the sample tolook at the performance of firms. First, we construct an output growth variable. Thisvariable is defined by the growth of output between 1994 and 1996 of an individualfirm relative to the average growth rate between 1994 and 1996 for the total sampleof the firms. We look also at the growth rate of output of the firm relative to thegrowth rate of GDP in the same period. We report both results in Table 9.
15 Oliver Williamson introduced the concept of a hostage to facilitate exchange, see Williamson (1983).16 Greif and Kandel (1994), Hay and Shleifer (1998), and Johnson, Kaufmann and Shleifer (1997) pointout that the deficiencies of the legal system are more pronounced in the FSU compared to the earlyTE.

21
22
Table 9:
firm's output to GDP growth 1) firm's output to sample growth 2)
mean std. dev. mean std. dev. cases
1. firm arrears 0,15 4,42 3,09 15,73 138
0% - 10% -0,59 1,71 0,46 6,08 6610% - 20% 1,76 7,88 8,81 28,10 3320% - 626% -0,04 2,98 2,24 15,73 45
F = 3.17 sign. level 0.045 F = 3.17 sign. level 0.045
2. barter share 0,01 4,2 2,60 15,0 153
0% - 20% -0,31 1,9 1,46 6,7 4620% - 60% 1,37 6,4 7,43 22,8 5860% - 100% -1,30 0,4 -2,05 1,3 49
F = 5.84 sign. level 0.004 F = 5.84 sign. level 0.004
3. complexity3) 0,14 4,4 3,05 16,6 141
.34 - .78 1,84 8,0 9,10 28,4 33
.79 - .83 0,48 2,9 4,28 10,4 36
.84 - .92 -0,82 1,6 -0,35 5,5 72
F = 4.543 sign. level 0.012 F = 5.84 sign. level 0.004
4. ownership 0,01 4,2 2,60 15,0 153
state 0,14 2,9 3,06 10,2 40privat -0,85 1,2 -0,47 4,4 12cooperative 0,16 5,1 3,12 18,1 92joint-venture -0,92 0,1 -0,70 0,2 9
F = 0.356 sign. level 0.785 F = 0.356 sign. level 0.785
1) percentage difference between the growth rate of firm's output and GDP growth in the period 1994 - 1996.2) percentage difference between the growth rate of firm's output and output growth of sample firms in the period 1994 - 1996. 3) see text for definition
Source: Survey of 165 barter deals in Ukraine in 1997
Barter and Output Decline
23
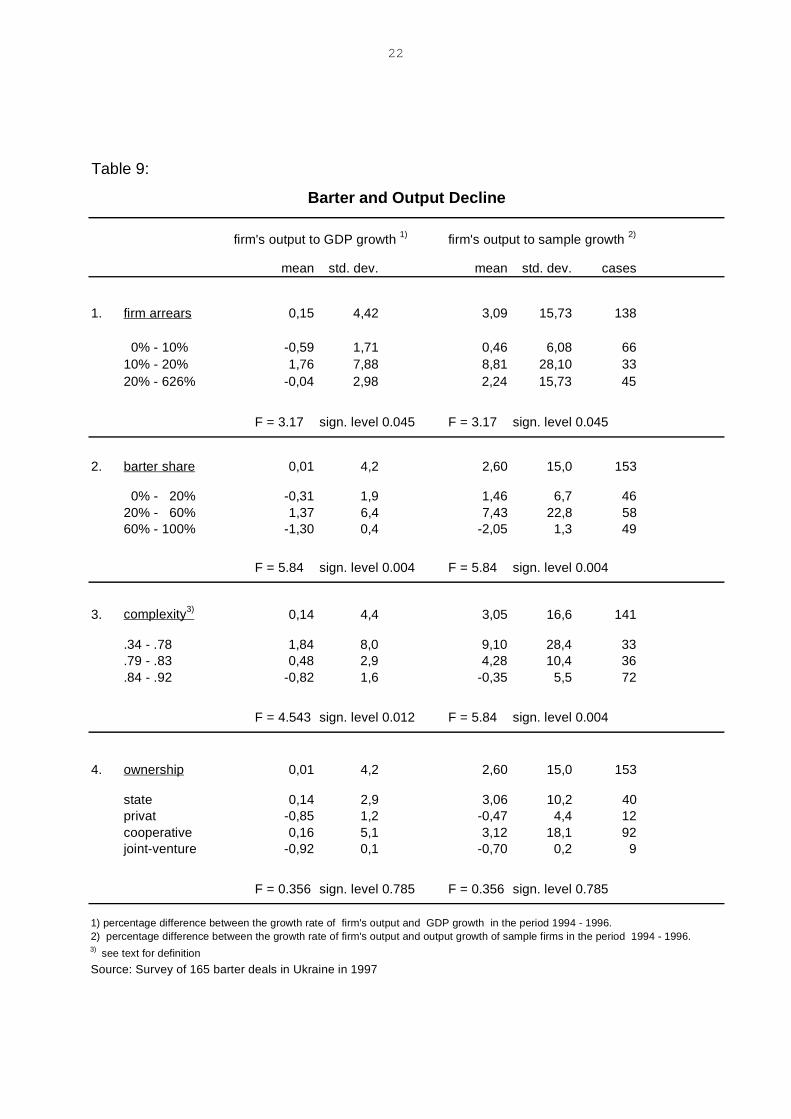
We first look at disorganization and the lack of trust as a reason for the outputdecline. We measure these problems with BK's index of complexity. According totheir theory the hold-up problem becomes more severe and thus the decline inoutput more pronounced for goods with more complex production processes. Theirmeasure of complexity is constructed on the bases of the 1990 "100-sector" input-output table for Russia. Complexity is equal to zero if the sector uses only one inputfrom another sector and it tends to one if the sector uses many inputs in equalproportions. We matched the ISIC sector of our bartering firms with the sector of thecomplexity index given by BK. This measure is obviously full of noise for severalreasons. BK's complexity index is based on the Russian input-output structure whichmight differ from that in the Ukraine. Further noise might be introduced because theproduction structure in the Ukraine might have changed since 1990. Finally, the ISICclassification of our sample could not always be perfectly matched with BK’sclassification of the index. In spite of all these caveats, we could reproduce BK'sfindings with firm level data. Table 6 reports that the firm's output growth becomessmaller compared to GDP growth of the economy when the firm’s production ismore complex. Firms producing goods which rank low in the complexity indexincreased their output by 1.8 percentage points compared to the economy as awhole, while the opposite was true for firms producing goods which ranked high onthe complexity scale. Again, the same picture emerges when the firm's outputgrowth is compared with the average growth of all firms in the sample rather thanthe economy as a whole. The association between the firms relative growth and thecomplexity measure is highly significant.
Next, we look at the credit problem. We measure the credit enforcement costsby the amount of arrears the firm has accumulated. The larger the accumulatedarrears, the more likely it is that the firm does not fulfill its debt obligations and thusthe larger are the credit enforcement costs assumed to be.17 As Table 9 shows there isindeed a hump shaped behavior between output growth and firm arrears. Whenarrears are small or very large the firm did less well in terms of output than theeconomy as a whole or the total sample of firms, while it exhibits a relative largeroutput growth for intermediate levels of arrears.
Furthermore, Table 9 shows that firms with a share of barter in output of upto 20 % had a growth rate of output of 0.3 percentage points lower than the totaleconomy, while firms with a barter share between 20% and 60% experienced agrowth rate of 1.37 percentage points higher than the total economy. However, whenthe exposure to barter becomes too large (exceeds 60%), then the firm's output 17 Arrears are assumed to measure the firm‘s current and future creditworthiness, since firms with large arrearsmust have been perceived as creditworthy to get into this state.
24
appears to have grown 1.29 percentage points less than the economy as a whole.These findings suggest that there is an optimal level of barter at which the outputdecline is minimized. The relationship between output growth and barter exposureis statistically significant at conventional levels. The same picture emerges when thefirm's output growth is related to the growth of the total sample of firms rather thanto the economy as a whole.18
We also investigated the influence of ownership patterns. It appears that privateenterprises are those with the least impressive performance in terms of outputgrowth. The relationship between ownership pattern and relative output growth isnot significant at conventional levels, however. 19
4. Inter-firm Arrears and Barter
The literature on inter-firm debt in transition economies asks the followingquestion. Why are firms giving loans to other firms when the same firms are notconsidered creditworthy enough by the banks and therefore do not get loans frombanks? The answer that is most commonly given is the absence of market discipline.State-owned firms who are seen to show the highest inter-firm debt are seen to beable to get loans from other firms because of the soft budget constraint. But if thestate-owned firms are creditworthy because of the backing of the government, theyare expected to be the least credit constrained and thus to show the highest bankdebt. As Table 3 shows, in our sample of bartering firms this is indeed the case.State-owned firms appear to have on average higher bank debt (7.5 percent ofoutput) while private firms have negligible bank debt outstanding (0.1 percent ofoutput). However, state owned firms show also the highest inter-firm arrearscompared to private firms (68 percent and 24 percent of output, respectively). Thissuggests that state firms used their privileged status of creditworthiness to get cashcredit from banks as well as trade credit from other firms.
An explanation for the phenomenon of inter-firm debt cannot, however, restexclusively on the argument of soft-budget constraint. Inter-firm arrears are not aphenomenon of state firms alone. In our sample of bartering firms only 29 percent
18 Table 9 gives univariate association between the relevant variables. We obtain qualitative similar results in amultivariate analysis which controls for other factors influencing output growth, see Marin and Schnitzer(1999).19 As we show in Table 3 and in the next section private firms where those which were hardest hit bythe liquidity squeeze in the economy which might have inhibited their growth. Furthermore, theresult might also be due to a selection bias in the sample, since the sample consists of bartering firmsonly. In Kaufmann and Marin (1999) we examine the difference between bartering and non-barteringfirms using a sample of 20 transition economies.
25
are state controlled. There must be additional forces at work here, which go beyondthe lack of market discipline.
Capital and credit market do not function well in transition economies for avariety of reasons. Creditors are inexperienced with credit evaluation. Banks havedifficulties in distinguishing bad from good debtors. There is no history to allowthem to judge credit risk because of the drastic changes in the environment. In someof the transforming economies a bankruptcy law has not yet been introduced.Defaulting on debt repayment remains without consequences and therefore firmshave little incentive to repay their loans from banks.
Many experts have suggested that one of the solutions to inter-firm debt is torestore the creditworthiness of firms by introducing a bankruptcy procedure. But inmany countries like Hungary and Ukraine, for example, a bankruptcy law has beenintroduced and inter-firm debt has not stopped from rising. Furthermore, a study byMitchell (1993) suggests that the introduction of a bankruptcy law by itself will notimprove debt repayment because creditors did not use the bankruptcy procedure toget to their money. Among other factors Mitchell'sexplanation for creditor passivity is the low expected value of their claims net ofbankruptcy costs. This is due to the poor state or vintage of the capital stock of adebtor firm, the absence of a market for capital, and the priority assigned to acreditor in a bankruptcy relative to the ordering of other creditors. Mitchell'sexplanation suggests that inter-firm debt is not going to go away with theintroduction of a bankruptcy law and that creditor passivity prevents bankruptcyfrom restoring the creditworthiness of firms.
The question remains: Why are firms able to give loans to other firms whenthe banking sector is reluctant to provide capital in spite of the availability of abankruptcy procedure to pursue non paying debtors? The possibility of undertakinga business in form of barter trade becomes important in this context. In a barter tradeone firm gives a trade credit to another firm which is repaid in goods rather thanmoney. Barter trade offers the following advantages.20
First, barter does not attempt to improve the overall creditworthiness of firms(as in bankruptcy) but rather restores the creditworthiness of the firm for onespecific deal. In a barter deal a deal-specific collateral is created in the form of thefuture goods payment. Depending on the degree of the credit problem of the debtor,the creditor can choose the value of the collateral relative to the trade credit that hegives to the debtor. This way the debtor's creditworthiness is restored for onespecific deal. Giving a trade credit in the form of a barter deal is available to firmsonly, since banks are not allowed to engage in the trading business.
20 For barter as a finance instrument in international trade see Marin and Schnitzer (1997).
26
Second, in the early stages of transition barter trade can compensate forcreditors´ passivity. Instead of relying on the low and unknown liquidation value ofthe firm (as in bankruptcy), the creditor and debtor create a deal-specific collateral ofpositive and known value. Furthermore, in a barter trade the creditor does not needto share the benefits from her legal actions with other creditors. In a barter deal thecreditor obtains property rights on goods - which effectively means that she does notneed to queue with other creditors for the money. Compared to bankruptcy, in abarter trade there is no priority ordering of creditors. This makes payment in goods asuperior credit enforcement mechanism compared to payment in money.
Thirdly, barter is a more information-intensive form of financing. Typically atrade credit is given between two firms which know each other from previoustransactions (one firm is a producer and the other firm is an input supplier).
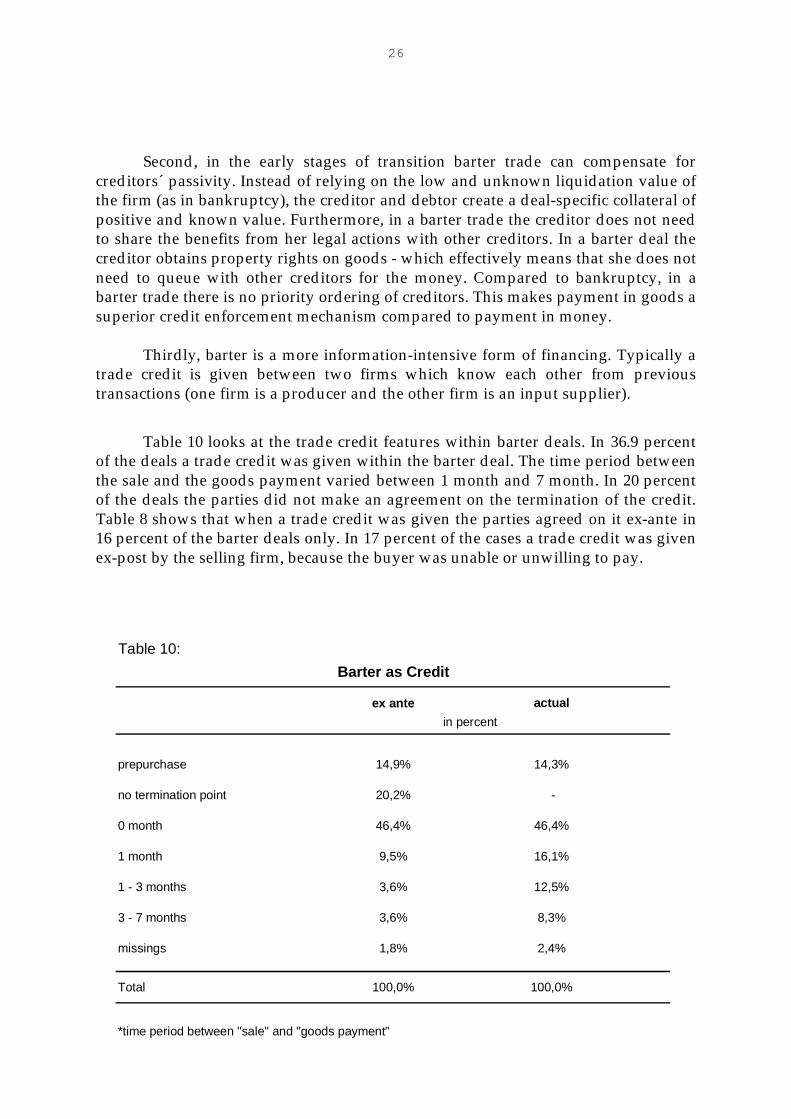
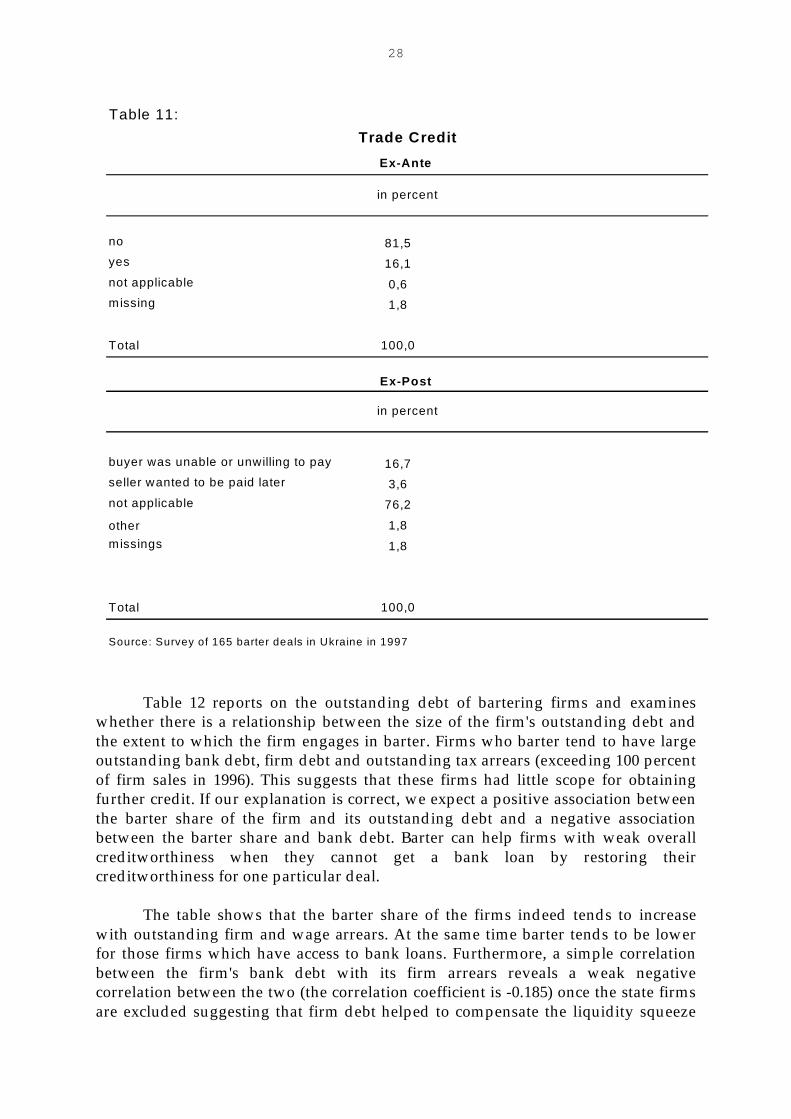
Table 10 looks at the trade credit features within barter deals. In 36.9 percentof the deals a trade credit was given within the barter deal. The time period betweenthe sale and the goods payment varied between 1 month and 7 month. In 20 percentof the deals the parties did not make an agreement on the termination of the credit.Table 8 shows that when a trade credit was given the parties agreed on it ex-ante in16 percent of the barter deals only. In 17 percent of the cases a trade credit was givenex-post by the selling firm, because the buyer was unable or unwilling to pay.
Table 10:
ex ante actual
prepurchase 14,9% 14,3%
no termination point 20,2% -
0 month 46,4% 46,4%
1 month 9,5% 16,1%
1 - 3 months 3,6% 12,5%
3 - 7 months 3,6% 8,3%
missings 1,8% 2,4%
Total 100,0% 100,0%
*time period between "sale" and "goods payment"
Barter as Credit
in percent

27
28
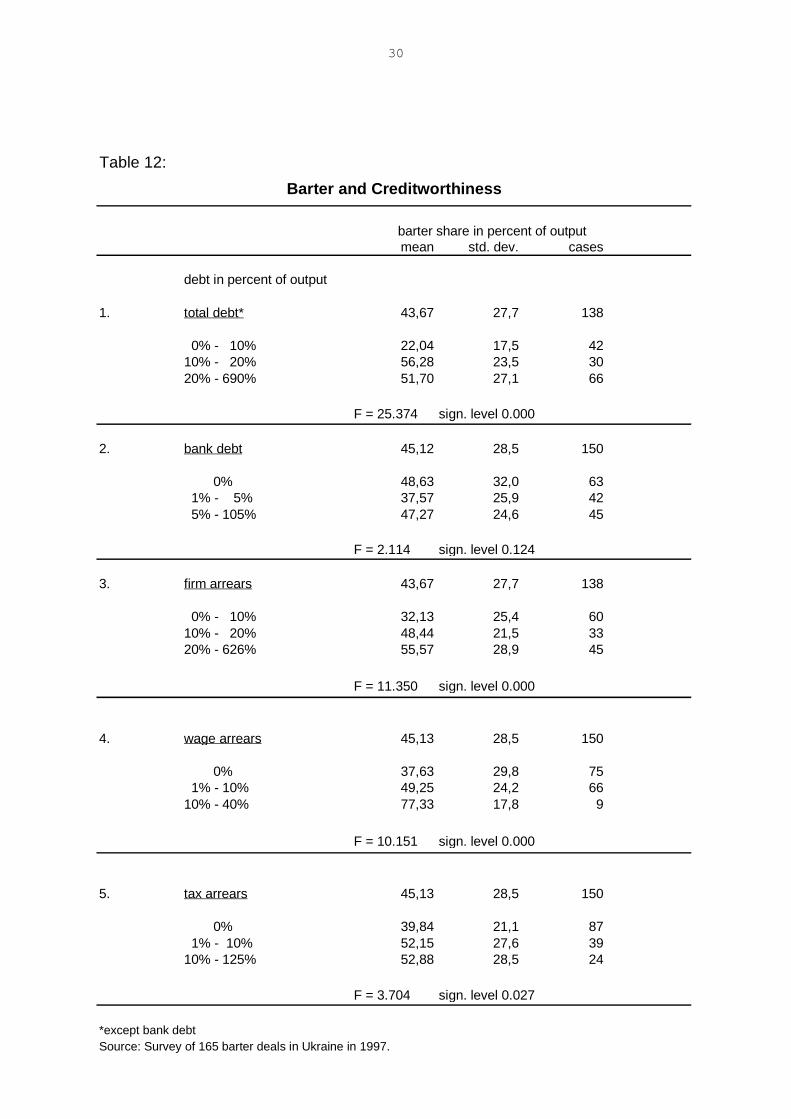
Table 12 reports on the outstanding debt of bartering firms and examineswhether there is a relationship between the size of the firm's outstanding debt andthe extent to which the firm engages in barter. Firms who barter tend to have largeoutstanding bank debt, firm debt and outstanding tax arrears (exceeding 100 percentof firm sales in 1996). This suggests that these firms had little scope for obtainingfurther credit. If our explanation is correct, we expect a positive association betweenthe barter share of the firm and its outstanding debt and a negative associationbetween the barter share and bank debt. Barter can help firms with weak overallcreditworthiness when they cannot get a bank loan by restoring theircreditworthiness for one particular deal.
The table shows that the barter share of the firms indeed tends to increasewith outstanding firm and wage arrears. At the same time barter tends to be lowerfor those firms which have access to bank loans. Furthermore, a simple correlationbetween the firm's bank debt with its firm arrears reveals a weak negativecorrelation between the two (the correlation coefficient is -0.185) once the state firmsare excluded suggesting that firm debt helped to compensate the liquidity squeeze
Table 11:
no 81,5
yes 16,1
not applicable 0,6
missing 1,8
Total 100,0
buyer was unable or unwilling to pay 16,7
seller wanted to be paid later 3,6
not applicable 76,2
other 1,8
missings 1,8
Total 100,0
Source: Survey of 165 barter deals in Ukraine in 1997
in percent
Trade Credit
Ex-Post
Ex-Ante
in percent
29
induced by low bank debt for those firms in the economy with restricted access tobank loans. 21
21 Calvo and Coricelli (1993) use a negative correlation between bank debt and firm arrears asevidence for whether inter-firm arrears helped to compensate for the liquidity squeeze in theirargument for the role of credit as a factor explaining the output fall in Poland. According to thisargument a positive correlation between bank debt and firm debt would indicate that firm debt hasnot alleviated the liquidity squeeze.
30
Table 12:
mean std. dev. cases
1. total debt* 43,67 27,7 138
0% - 10% 22,04 17,5 4210% - 20% 56,28 23,5 3020% - 690% 51,70 27,1 66
F = 25.374 sign. level 0.000
2. bank debt 45,12 28,5 150
0% 48,63 32,0 63 1% - 5% 37,57 25,9 42 5% - 105% 47,27 24,6 45
F = 2.114 sign. level 0.124
3. firm arrears 43,67 27,7 138
0% - 10% 32,13 25,4 6010% - 20% 48,44 21,5 3320% - 626% 55,57 28,9 45
F = 11.350 sign. level 0.000
4. wage arrears 45,13 28,5 150
0% 37,63 29,8 75 1% - 10% 49,25 24,2 6610% - 40% 77,33 17,8 9
F = 10.151 sign. level 0.000
5. tax arrears 45,13 28,5 150
0% 39,84 21,1 87 1% - 10% 52,15 27,6 3910% - 125% 52,88 28,5 24
F = 3.704 sign. level 0.027
*except bank debtSource: Survey of 165 barter deals in Ukraine in 1997.
Barter and Creditworthiness
barter share in percent of output
debt in percent of output
31
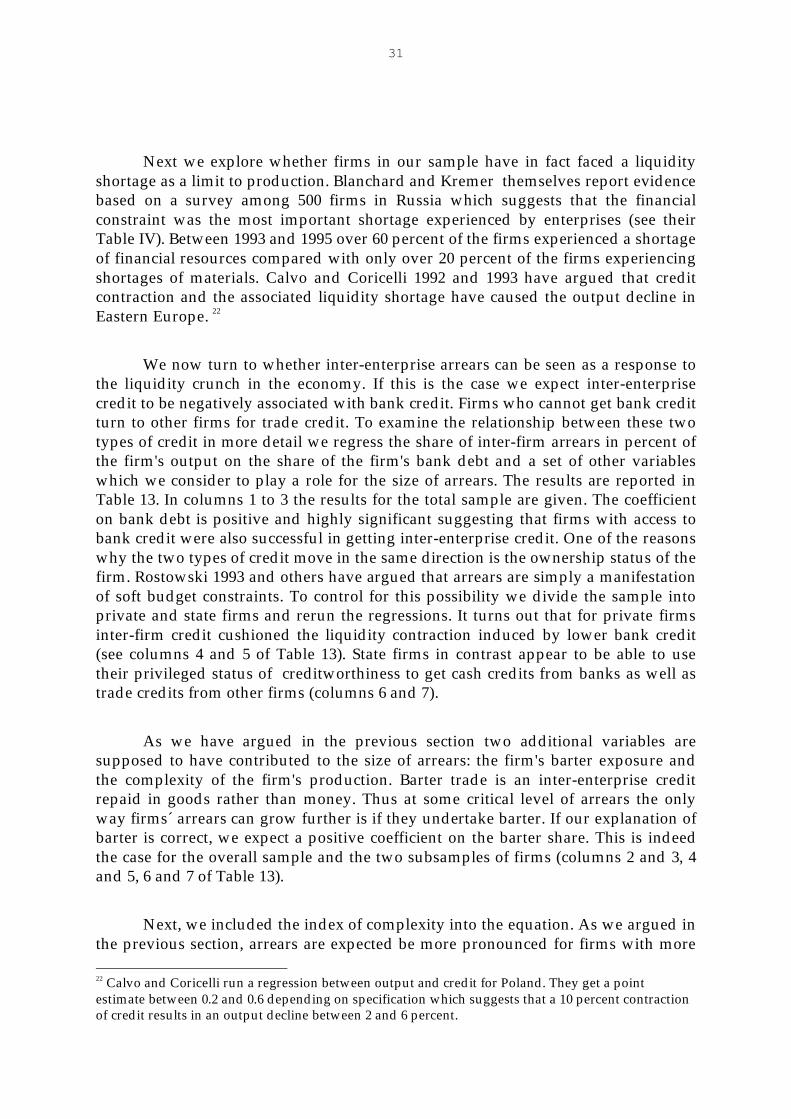
Next we explore whether firms in our sample have in fact faced a liquidityshortage as a limit to production. Blanchard and Kremer themselves report evidencebased on a survey among 500 firms in Russia which suggests that the financialconstraint was the most important shortage experienced by enterprises (see theirTable IV). Between 1993 and 1995 over 60 percent of the firms experienced a shortageof financial resources compared with only over 20 percent of the firms experiencingshortages of materials. Calvo and Coricelli 1992 and 1993 have argued that creditcontraction and the associated liquidity shortage have caused the output decline inEastern Europe. 22
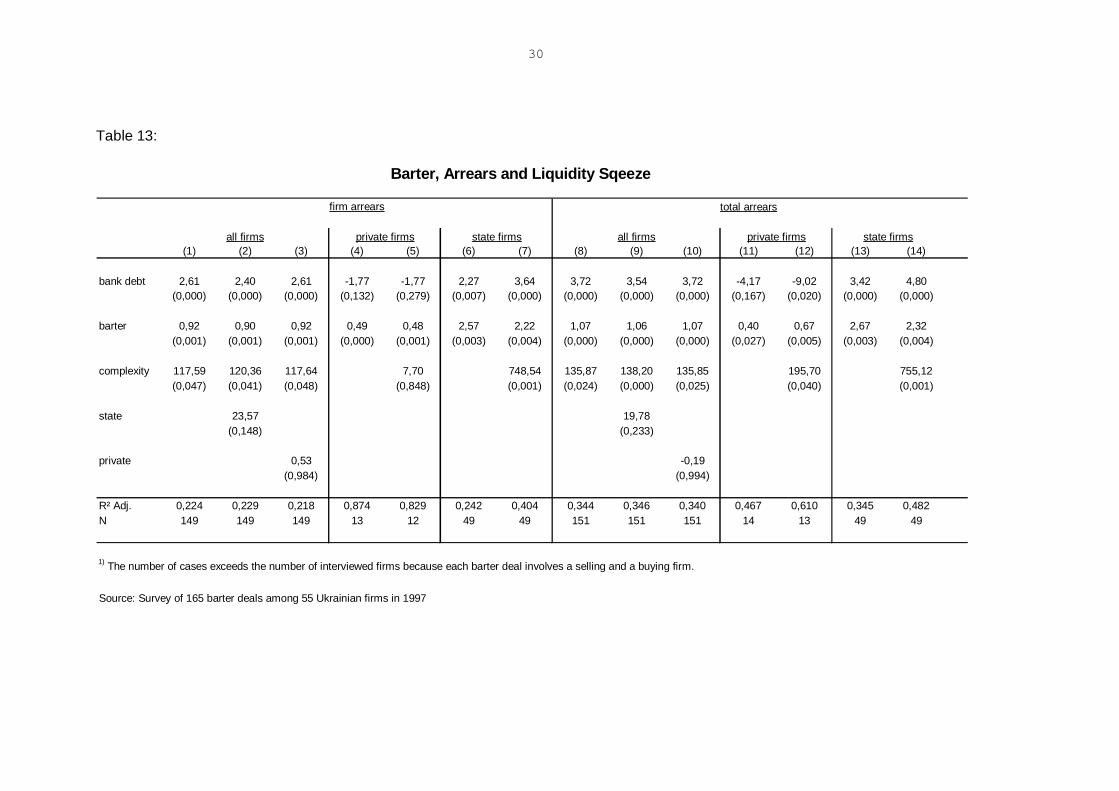
We now turn to whether inter-enterprise arrears can be seen as a response tothe liquidity crunch in the economy. If this is the case we expect inter-enterprisecredit to be negatively associated with bank credit. Firms who cannot get bank creditturn to other firms for trade credit. To examine the relationship between these twotypes of credit in more detail we regress the share of inter-firm arrears in percent ofthe firm's output on the share of the firm's bank debt and a set of other variableswhich we consider to play a role for the size of arrears. The results are reported inTable 13. In columns 1 to 3 the results for the total sample are given. The coefficienton bank debt is positive and highly significant suggesting that firms with access tobank credit were also successful in getting inter-enterprise credit. One of the reasonswhy the two types of credit move in the same direction is the ownership status of thefirm. Rostowski 1993 and others have argued that arrears are simply a manifestationof soft budget constraints. To control for this possibility we divide the sample intoprivate and state firms and rerun the regressions. It turns out that for private firmsinter-firm credit cushioned the liquidity contraction induced by lower bank credit(see columns 4 and 5 of Table 13). State firms in contrast appear to be able to usetheir privileged status of creditworthiness to get cash credits from banks as well astrade credits from other firms (columns 6 and 7).
As we have argued in the previous section two additional variables aresupposed to have contributed to the size of arrears: the firm's barter exposure andthe complexity of the firm's production. Barter trade is an inter-enterprise creditrepaid in goods rather than money. Thus at some critical level of arrears the onlyway firms´ arrears can grow further is if they undertake barter. If our explanation ofbarter is correct, we expect a positive coefficient on the barter share. This is indeedthe case for the overall sample and the two subsamples of firms (columns 2 and 3, 4and 5, 6 and 7 of Table 13).
Next, we included the index of complexity into the equation. As we argued inthe previous section, arrears are expected be more pronounced for firms with more 22 Calvo and Coricelli run a regression between output and credit for Poland. They get a pointestimate between 0.2 and 0.6 depending on specification which suggests that a 10 percent contractionof credit results in an output decline between 2 and 6 percent.

32
complex production structures, since their liquidity constraint is supposed to helpthem to deal with the hold up problem. This appears to be supported by the data.Finally, we rerun the regressions with total arrears (including wage and tax arrears)rather than firms´ arrears alone as the dependent variable with very similar results.The data seem to suggest that Ukrainian firms in fact experienced a liquidity squeezewhich barter has helped to alleviate.
30
Table 13:
(1) (2) (3) (4) (5) (6) (7) (8) (9) (10) (11) (12) (13) (14)
bank debt 2,61 2,40 2,61 -1,77 -1,77 2,27 3,64 3,72 3,54 3,72 -4,17 -9,02 3,42 4,80(0,000) (0,000) (0,000) (0,132) (0,279) (0,007) (0,000) (0,000) (0,000) (0,000) (0,167) (0,020) (0,000) (0,000)
barter 0,92 0,90 0,92 0,49 0,48 2,57 2,22 1,07 1,06 1,07 0,40 0,67 2,67 2,32(0,001) (0,001) (0,001) (0,000) (0,001) (0,003) (0,004) (0,000) (0,000) (0,000) (0,027) (0,005) (0,003) (0,004)
complexity 117,59 120,36 117,64 7,70 748,54 135,87 138,20 135,85 195,70 755,12(0,047) (0,041) (0,048) (0,848) (0,001) (0,024) (0,000) (0,025) (0,040) (0,001)
state 23,57 19,78(0,148) (0,233)
private 0,53 -0,19(0,984) (0,994)
R² Adj. 0,224 0,229 0,218 0,874 0,829 0,242 0,404 0,344 0,346 0,340 0,467 0,610 0,345 0,482N 149 149 149 13 12 49 49 151 151 151 14 13 49 49
1) The number of cases exceeds the number of interviewed firms because each barter deal involves a selling and a buying firm.
Source: Survey of 165 barter deals among 55 Ukrainian firms in 1997
Barter, Arrears and Liquidity Sqeeze
firm arrears total arrears
all firms private firms state firms all firms private firms state firms
31
5. Conclusions
In this paper we have explored several explanations for the explosion of barter in post-socialist economies: soft budget constraints, lack of restructuring, the virtual economy,and tax avoidance. Of these explanations only the tax reason for barter is weaklysupported by the data. The tax argument for barter can, however, not explain why barterexploded from about 5 percent to 60 percent within four years. Something else is at workhere and from our survey data in the Ukraine the following picture has emerged.
Barter is mainly driven by financial considerations. Firms lack the cash to pay for theirinputs and banks refuse to provide capital. This has led to the phenomenon of inter-firmarrears in which firms extend trade credits to each other. We have argued that these firm-arrears allowed intermediate producers to deal with the problem of trust in the economyand found supporting evidence for this role of arrears. We argued further that bartercomes into play when arrears become so critically large that firms will refuse to extendfurther trade credits to their buyers out of the worry of not being paid. By introducing ahostage barter then allows the debtor firm to make a commitment to repay the loan andthus restores creditworthiness for one specific deal at the time rather than for the firmsoverall. We found evidence to support this view of barter.
The view of barter as a substitute for a banking failure suggests the followingexplanation for the evolution of barter over time: The arrears crisis in Russia evolved in1992 while barter started to rise in 1994. Barter started to rise in 1994 because around thistime arrears reached a critical level at which production was unsustainable. Our datasuggest that this critical level was reached when arrears were around 30 to 40 percent offirm’s sales. At this point firms refused to extend further credit to each other. Barter thenstepped in as the only way to maintain production. At this point barter started tosubstitute for the non active banking sector as well as for trade credits in cash whichexplains the explosive increase.
Given this story of the role of barter in transition economies what follows for policy?Barter seems to have established itself as an economic institution to deal with the bankingfailure and capital markets imperfections in transition economies. We have argued thatbarter has produced short term benefits by allowing these economies to maintain orincrease production without a functioning banking sector. However, the short termefficiency gain might come at the costs of long term efficiency losses. Barter might haveestablished itself as an institution which hinders the banking sector from developing. Thistransition trap might arise because banks will not have an incentive to enter the marketgiven the existence of barter.
32
A major challenge in the transition to a market system is the replacement of acentralized credit system with decentralized financial discipline. We argue elsewhere thata decentralized banking system creates a coordination problem that a multi-bankingsystem cannot handle. Creditors may be more likely to finance credit-constrained firmsunder a financial system based on long-term relationships than one based on arms-lengthtransactions. There may be particular value therefore for such transition economies asRussia and Ukraine in the development of a German type banking system to avoid such atransition trap. 23
Reforming the banking sector in the former Soviet Union in order to remonetizetheir economies is urgent. Short term macroeconomic ‘fixes’ such as expansionarymonetary policy to overcome the liquidity shortage in these economies would makematters worse. In a barter economy a monetary expansion may have perverse effects. Thereason is that reducing arrears by infusing liquidity into the economy is likely to reduceintermediate producers’ bargaining power thereby taking away an instrument to dealwith disorganization and the trust problem. In other words, a monetary expansion in abarter economy works like introducing partial reform in an overall distorted economy.24
23 For the argument see Huang, Marin, and Xu (1999).24 For the argument why partial reform might make things worse in an overall distorted economy seeMurphy, Shleifer, and Vishny (1992).
33
Bibliography
Anderson, R.W., Berglöf, E. and Mizsei, K. (1996), Banking Sector Development in Centraland Eastern Europe, Economic Policy Initiative No. 1/CEPR
Begg, D. and Portes, R. (1993), Enterprise Debt and Economic Transformation: FinancialRestructuring in Central and Eastern Europe, in: C. Mayer and X. Vives (eds)Capital Markets and Financial Intermediation, Cambridge University Press
Blanchard, O. and Kremer, M. (1997) Disorganization, The Quarterly Journal of Economics,Nov. 97
Calvo, G.A. and Frenkel, J.A. (1991), Credit Markets, Credibility, and EconomicTransformation, Journal of Economic Perspectives, Vol. 5, (4), pp. 139-148
Calvo, G.A. and Coricelli, F. (1993), Output Collapse in Eastern Europe: The Role ofCredit, in: M.I. Blejer, G.A. Calvo, F. Corricelli and A.H. Gelb (eds), Eastern Europein Transition: From Recession to Growth? World Bank Discussion Paper 196, WorldBank, Washington, DC
Calvo, G.A. and Coricelli, F. (1995) Inter-Enterprise Arrears in Economies in Transition, inR. Holzmann, J. Gacs and G. Winckler (eds.): (1995): Output Decline in Eastern Europe.Unavoidable, External Influence or Homemade?, Kluwer, London
Commander, S. and Mummsen, C. (1998) Understanding Barter in Russia, European Bankfor Reconstruction and Development, London, mimeo.
European Bank of Reconstruction and Development, Transition Report 1997, pp. 26-27
Gaddy, C.G. and Ickes, B.W. (1998) Russia’s Virtual Economy, Foreign Affairs, Vol.77 No. 5,pp. 53- 67.
Greif, A. and Kandel, E. (1994), Contract Enforcement Institutions: Historical Perspectiveand Current Status in Russia, Chapter 8, in: E. Lazar (ed.) Economic Transition inEastern Europe and Russia: Realities of Reform, Stanford CA
34
Hay, J.R. and Shleifer, A. (1998), Government in Transition: Private Enforcement of PublicLaws: A Theory of Legal Reform, American Economic Review, Vol 88 (2), 398-403
Hellman, J., Jones, G., and Kaufmann, D. (1999), Political Capture, State and Firms inTransition: Evidence on Governance from an Enterprise Survey. (Forthcoming).
Huang, H., Marin, D., and Xu, C. (1999), A Transition Trap? Barter and the Development ofBanking, International Monetary Fund, University of Munich, and London School ofEconomics, mimeo.
Ickes, B.W. and Ryterman, R. (1992), The Inter-Enterprise Arrears Crisis in Russia, Post-Soviet Affairs, 8 (4), pp. 331-361
Ickes, B.W. and Ryterman, R. (1993), Roadblock to Economic Reform: Inter-EnterpriseDebt and the Transition to Markets, Post-Soviet Affairs, 9 (3), pp. 231-252
Johnson, S., Kaufmann, D. and Shleifer, A. (1997), The Unofficial Economy in Transition,Brookings Papers on Economic Activity, Fall (2), 1997, pp. 159-239
Johnson, S., Kaufmann, D. , Zoido-Lobaton, P. (1998), Regulatory Discretion and theUnofficial Economy, American Economic Review, May 1998, Vol. 88, No. 2, pp.387-392
Kaufmann, D. and Marin, D. (1999), The Non-Cash Economy: Evidence from 20 TransitionEconomies, The World Bank and University of Munich, mimeo.
Kranton, R.E. (1996), Reciprocal Exchange: A Self-Sustaining System, American EconomicReview, Sept. 96, 86 (4)
Marin, D. (1990) Tying in International Trade, The World Economy, 13(3), pp 445-62.
35
Marin, D. and Schnitzer, M. (1995) Tying Trade Flows: A Theory of Countertrade,Amercian Economic Review, 85/5, pp. 1047-1064
Marin, D. and Schnitzer, M. (1997), The Economic Institution of International Barter,Centre for Economic Policy Research CEPR, Discussion Paper No. 1658, London
Marin, D. and Schnitzer, M (1999), Disorganization and Financial Collapse, Centre forEconomic Policy Research CEPR, Discussion Paper No. 2245, London.
Mitchell, J. (1993) Creditor Passivity and Bankruptcy: Implications for Economic Reform,in: C. Mayer and X. Vives (eds) Capital Markets and Financial Intermediation,Cambridge University Press
Murphy, K., Shleifer, A. and R. Vishny (1992), The Transition to a Market Economy:Pitfalls of Partial Reform, Quarterly Journal of Economics, CVII (3), pp. 889-906.
Perotti, E.C. (1995), Inertial Credit and Opportunistic Arrears in Transition, EuropeanEconomic Review .
Russian Economic Barometer (1997), Survey of Industrial Firms, Institute of World Economyand International Relations, Moscow
Rostowski, J. (1993), The Inter-Enterprise Debt Explosion in the Former Soviet Union: Causes,Consequences, Cures. Centre for Economic Performance/ESRC Discussion Paper No.142
Williamson, O.E.(1983), Credible Commitments: Using Hostages to support Exchange.American Economic Review, September 1983, 73 (4) 519-40