Embed Size (px)
Citation preview

BARRIERS TO HOUSEHOLD RISK MANAGEMENT:
EVIDENCE FROM INDIA
Shawn Cole, Xavier Giné, Jeremy Tobacman,
Petia Topalova, Robert Townsend, and James Vickery
WP/12/195

© 2012 International Monetary Fund WP/12/195
IMF Working Paper
Research Department
Barriers to Household Risk Management: Evidence from India
Prepared by Shawn Cole, Xavier Giné, Jeremy Tobacman, Petia Topalova, Robert Townsend and James Vickery
Authorized for distribution by Thomas Helbling
July 2012
Abstract
Why do many households remain exposed to large exogenous sources of non-systematic income risk? We use a series of randomized field experiments in rural India to test the importance of price and non-price factors in the adoption of an innovative rainfall insurance product. Demand is significantly price sensitive, but widespread take-up would not be achieved even if the product offered a payout ratio comparable to U.S. insurance contracts. We present evidence suggesting that lack of trust, liquidity constraints and limited salience are significant non-price frictions that constrain demand. We suggest contract design improvements to mitigate these frictions.
JEL Classification Numbers: G22, C93, O16, D14, G11, G20
Keywords: Insurance, Household Finance, Trust, Liquidity Constraints, Economic Development
Author’s E-Mail Address: [email protected], [email protected], [email protected], [email protected], [email protected], [email protected]
This Working Paper should not be reported as representing the views of the IMF.
The views expressed in this Working Paper are those of the author(s) and do not necessarily represent those of the IMF or IMF policy. Working Papers describe research in progress by the author(s) and are published to elicit comments and to further debate.

2
Contents Page
Abstract ......................................................................................................................................1
I. Introduction ............................................................................................................................3
II. Insurance Contract Design and Summary Statistics .............................................................6 A. Product Description...................................................................................................6 B. Summary Statistics ....................................................................................................8
III. Experimental Design ..........................................................................................................12
IV. Experimental Results .........................................................................................................16 A. Andhra Pradesh .......................................................................................................16 B. Gujarat: Video Experiments ....................................................................................18 C. Gujarat: Flyer Experiments .....................................................................................19
V. Discussion of Experimental Results ...................................................................................22 A. Price Relative to Actuarial Value ............................................................................22 B. Trust ........................................................................................................................23 C. Liquidity Constraints ...............................................................................................24 D. Financial Literacy and Education ...........................................................................25 E. Framing, Salience and Other Behavioral Factors ....................................................25
VI. Non-Experimental Evidence ..............................................................................................26 A. Correlates of Insurance Purchase ............................................................................26 B. Self-Reported Explanations for Non-Purchase .......................................................28
VII. Improving Household Risk Management: Tentative Lessons and Conclusions ..............30
References ................................................................................................................................33
VIII. Appendix .........................................................................................................................36

3
I. INTRODUCTION
Pooling and diversifying risk is a central function of the financial system. This paper studies an innovative financial contract designed to insure rural Indian households against a key exogenous source of income risk: rainfall variation during the monsoon season. Rainfall is the primary determinant of income variability in semi-arid areas, with drought cited by 89 percent of households in our sample as the most important risk they face. The product, rainfall insurance, is sold commercially before the start of the monsoon and pays off based on rainfall recorded at a local weather station. Policies are sold in unit sizes as small as US$1, making the product accessible even to relatively poor households.
The product we study has inspired microfinance and development agencies around the world, and there are currently at least 36 pilot projects introducing index insurance in developing countries (Hazell et al., 2010). However, despite the potentially large welfare benefits of rainfall risk diversification, take-up of rainfall insurance, while growing over time, is still low. This fact motivates the major research question we address in this paper: What frictions limit the adoption of financial products that pool important sources of household income risk?
We test the importance of different barriers to rainfall insurance demand using randomized experiments in rural areas of two Indian states, Andhra Pradesh and Gujarat. One reason why rainfall insurance adoption is low is that prices are higher relative to expected payouts than retail insurance in developed countries. We estimate the slope of the demand curve by randomly varying the price of insurance, and find significant price sensitivity—a ten percent price decline leads to a ten to twelve percent increase in take-up. Combining this figure with calculations of relative payout ratios, our point estimates suggest that rainfall insurance demand would increase by 36 to 66 percent if it could be priced at payout ratios similar to US retail insurance contracts. Given low current adoption, however, even a demand increase of this magnitude would fall far short of universal participation. Most strikingly, amongst a subset of our sample given very large price discounts, less than half of households purchased insurance despite an expected return of around 70 percent, significantly better than actuarially fair.
As a result, we examine which non-price frictions further limit insurance demand (see also Giné, Townsend and Vickery, 2008, and Giné et al., 2012, for a discussion of these frictions). Our first finding is that households do not fully trust or understand the insurance product, and that their level of trust significantly affects demand. To isolate this effect, during household visits in Andhra Pradesh by an insurance educator we randomize whether the educator is first recommended to the household by a trusted local agent. Demand is 36 percent higher when the educator is endorsed in this way. This is amongst the first experimental evidence on the role of trust in financial market participation, extending related non-experimental research by Guiso, Sapienza and Zingales (2008) and Bryan (2010).
Trust is likely to be particularly important in our setting because many households have
limited numeracy and financial literacy, reducing their ability to independently evaluate the

4
product. For example, households are only able to correctly answer simple arithmetic questions 60 percent of the time. Consistent with these effects, demand is higher in villages which previously experienced a payout and amongst households with previous experience with insurance, higher financial literacy and greater facility with probability concepts.
We also find suggestive experimental and non-experimental evidence that liquidity
constraints reduce demand. Households buy insurance at the start of the growing season when there are many competing uses for limited funds. This may increase the opportunity cost of insurance (Rampini and Viswanathan, 2010). Experimentally, we randomly assign certain households high cash rewards as compensation for taking part in our study. Providing enough cash to buy one policy increases take up by 140 percent. This effect is magnified amongst poor households, which are likely to have less access to credit markets. We also find in cross-sectional regressions that wealthy households (likely to have greater access to finance) are more likely to purchase insurance. Finally, adopters generally only buy a single insurance policy, and non-purchasers cite “lack of funds” most frequently as their most frequent reason for not buying insurance. Liquidity constraints present one explanation for this set of findings, although other interpretations are also possible. For example, the large effect of cash rewards may in part reflect a feeling of obligation or reciprocity, because the reward is provided by the insurance educator.
We also note that, while approximately one-quarter of treated households in our study villages buy insurance, take-up is close to zero amongst the untreated general population in the same villages. Receiving a product flyer or a visit from an insurance educator increases take-up significantly, even if not combined with a high cash reward or large price discount, suggestive of the importance for demand of limited attention or salience (Reis, 2006).
A final piece of evidence consistent with the importance of non-price barriers to adoption
is the fact that even if households do purchase insurance, they almost universally purchase only one policy unit. If non-price barriers such as trust and liquidity constraints do not bind, most adopters should have purchased multiple policies to meaningfully insure their monsoon income against rainfall risk.
Our study also allows us to put bounds on the importance of some factors often thought
important for the demand for financial products, but which have little or no effect on demand in our setting. We assess the impact of a short insurance education module and a set of framing effects from the economics and psychology literature. The education module has no significant effect on demand. Our point estimates for the framing effects considered are generally close to zero, and the standard error bounds are tight enough to imply smaller effects than those found in Bertrand et al. (2010), to the extent that the estimates from the two studies are comparable.
To summarize our key finding: while rainfall insurance demand is price-sensitive, lower prices alone (generated for example through greater efficiency or competition, or subsidies) are unlikely to be sufficient to trigger widespread index insurance adoption, at least in the short run.
5
Non-price frictions such as lack of trust and financial literacy, liquidity constraints, and salience present important barriers to adoption.
We emphasize that our demand analysis is static in nature. As the rainfall insurance market matures, the importance of non-price barriers to adoption may decline, for example, as product familiarity increases. In this sense, lower prices today could have dynamic effects, by accelerating the process of learning and product diffusion. While interesting, a full analysis of this question is outside the scope of this paper. Improvements in insurance contract design could also help mitigate non-price frictions. To this end, we suggest some simple insurance design improvements in the conclusion, based on our empirical results.
Our research is motivated by the expectation that improved risk-sharing of weather shocks could generate significant welfare benefits. We note that while rainfall is a key source of income risk, formal insurance will be unnecessary if other risk-sharing channels already insulate consumption from rainfall shocks. One constraint, however, is that drought or flood affects all farmers in a local area, limiting risk-sharing between neighbors or through local credit and asset markets.1 Prior research shows that farmers do smooth rainfall shocks through borrowing and saving (Paxson, 1992) and remittances (Yang and Choi, 2007). But other evidence suggests that these channels are only partially effective. Rose (1999) finds that drought increases mortality amongst Indian girls, while Maccini and Yang (2009) show that women who experienced drought as young children are shorter, poorer and obtain less education. Rosenzweig and Binswanger (1993) and Morduch (1995) find that farmers engage in costly ex-ante “income smoothing,” shifting production behavior to reduce rainfall risk exposure, at the cost of lower average profits.2
Our evidence contributes to a large literature studying the role of the financial system in risk-sharing (Allen and Gale, 1994; Shiller, 1998; Athanasoulis and Shiller, 2000, 2001; Fuster and Willen, 2010). Unlike this previous work, which is primarily theoretical or relies on calibrations, we provide causal microeconomic evidence on the role of specific frictions that limit risk-pooling. We also contribute to research on household financial market participation and risk management (e.g. Campbell, 2006; Campbell and Cocco, 2003; Lusardi and Mitchell, 2007; Cai et al., 2010; Cole, Sampson and Zia, 2011; Gaurav, Cole and Tobacman, 2011), and on the price elasticity of insurance demand (e.g. Goodwin, 1993; Babbel, 1985).
Our results also contribute to research on technology and product adoption in developing
1 Indeed, Townsend (1994) finds that within-village risk-sharing in India is relatively close to the full insurance benchmark, even though aggregate village incomes and consumption vary significantly over time. Jayachandran (2006) shows that drought has general equilibrium effects by reducing local wages for landless households.
2 Rosenzweig and Binswanger (1993) estimate a one-standard deviation increase in rainfall volatility reduces expected profits by 15 percent for the median farmer, and 35 percent for a farmer at the lowest wealth quartile.

6
countries (Duflo, Kremer and Robinson, 2011; Giné and Yang, 2009). The benefits of index insurance are difficult to estimate at the time of purchase, since its payoff is uncertain, realized in the future, and may depend on the credit-worthiness of the insurer. Triggers set in millimeters of rainfall are also alien to many farmers, as compared to familiar triggers for traditional indemnity policies, such as the death of an animal in the case of livestock insurance. In this sense, our results may shed particular light on the determinants of demand for other “complex” products, such as new agricultural technologies.
II. INSURANCE CONTRACT DESIGN AND SUMMARY STATISTICS
A. Product Description
The rainfall insurance policies studied here are an example of “index insurance”, a type of insurance in which payouts are linked to a publicly observable index like rainfall, temperature or a commodity price. Policies were first offered on a pilot basis in Andhra Pradesh in 2003. Currently, rainfall insurance is offered by several firms and in many parts of India.
Key details of the policies offered in our study villages are briefly described below.
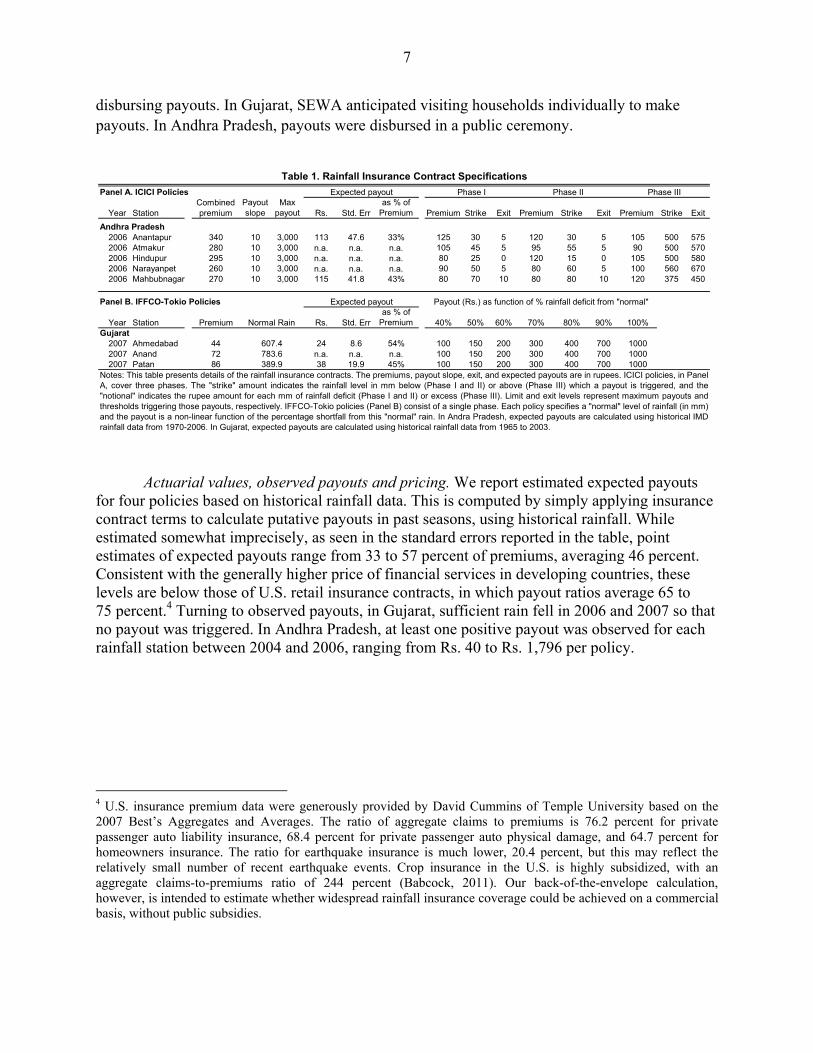
Contract details. Table 1 presents contract details for the insurance policies offered in our study areas in Andhra Pradesh in 2006 and Gujarat in 2007, the years of our field experiments. Policies are underwritten by ICICI Lombard in Andhra Pradesh and by IFFCO-Tokio in Gujarat. Payoffs are calculated based on measured rainfall at a nearby government rainfall station or an automated rain gauge operated by a private third-party vendor. ICICI Lombard policies divide the monsoon season into three contiguous phases. The first two cover deficit rainfall, and pay out Rs. 10 for each mm below a pre-specified amount (the strike). If rain is below the exit level, a contract pays Rs. 1,000. The third phase covers excess rainfall, paying Rs. 10 for each mm above the strike, with a maximum payout of 1,000 if rainfall meets or exceeds the exit level. Over 60 percent of adopters in our sample purchased Phase I. IFFCO-Tokio policies are based on cumulative rainfall over the entire monsoon season (June 1 to August 31). Households in both states were free to purchase any number of policies as desired.
Marketing and sales. In Gujarat, rainfall insurance is marketed to households by SEWA, a large NGO that serves women. In Andhra Pradesh, insurance is sold by BASIX, a microfinance institution with an extensive rural network of local agents known as Livelihood Services Agents (LSAs). These LSAs have close, enduring relationships with rural villages and offer a range of financial services including loans and other types of insurance.3 The seller is also responsible for 3 Even though BASIX LSAs offer both loans and insurance, they do not offer a bundled product where loan repayment is linked to rainfall. In fact, the BASIX credit and insurance departments operate different administrative software systems. According to BASIX management, a bundled product is not offered because of concerns that a poor understanding of the insurance component could undermine the culture of repayment. In other words, farmers may default on their loan obligations claiming that the insurance policy should have paid out but did not.
7
disbursing payouts. In Gujarat, SEWA anticipated visiting households individually to make payouts. In Andhra Pradesh, payouts were disbursed in a public ceremony.
Actuarial values, observed payouts and pricing. We report estimated expected payouts for four policies based on historical rainfall data. This is computed by simply applying insurance contract terms to calculate putative payouts in past seasons, using historical rainfall. While estimated somewhat imprecisely, as seen in the standard errors reported in the table, point estimates of expected payouts range from 33 to 57 percent of premiums, averaging 46 percent. Consistent with the generally higher price of financial services in developing countries, these levels are below those of U.S. retail insurance contracts, in which payout ratios average 65 to 75 percent.4 Turning to observed payouts, in Gujarat, sufficient rain fell in 2006 and 2007 so that no payout was triggered. In Andhra Pradesh, at least one positive payout was observed for each rainfall station between 2004 and 2006, ranging from Rs. 40 to Rs. 1,796 per policy.
4 U.S. insurance premium data were generously provided by David Cummins of Temple University based on the 2007 Best’s Aggregates and Averages. The ratio of aggregate claims to premiums is 76.2 percent for private passenger auto liability insurance, 68.4 percent for private passenger auto physical damage, and 64.7 percent for homeowners insurance. The ratio for earthquake insurance is much lower, 20.4 percent, but this may reflect the relatively small number of recent earthquake events. Crop insurance in the U.S. is highly subsidized, with an aggregate claims-to-premiums ratio of 244 percent (Babcock, 2011). Our back-of-the-envelope calculation, however, is intended to estimate whether widespread rainfall insurance coverage could be achieved on a commercial basis, without public subsidies.
Panel A. ICICI Policies
Year StationPayout slope
Max payout Rs. Std. Err
as % of Premium Premium Strike Exit Premium Strike Exit Premium Strike Exit
Andhra Pradesh2006 Anantapur 340 10 3,000 113 47.6 33% 125 30 5 120 30 5 105 500 5752006 Atmakur 280 10 3,000 n.a. n.a. n.a. 105 45 5 95 55 5 90 500 5702006 Hindupur 295 10 3,000 n.a. n.a. n.a. 80 25 0 120 15 0 105 500 5802006 Narayanpet 260 10 3,000 n.a. n.a. n.a. 90 50 5 80 60 5 100 560 6702006 Mahbubnagar 270 10 3,000 115 41.8 43% 80 70 10 80 80 10 120 375 450
Panel B. IFFCO-Tokio Policies
Year Station Premium Rs. Std. Erras % of
Premium 40% 50% 60% 70% 80% 90% 100%Gujarat
2007 Ahmedabad 44 24 8.6 54% 100 150 200 300 400 700 10002007 Anand 72 n.a. n.a. n.a. 100 150 200 300 400 700 10002007 Patan 86 38 19.9 45% 100 150 200 300 400 700 1000
Table 1. Rainfall Insurance Contract Specifications
Combined premium
Expected payout Phase I Phase II Phase III
Notes: This table presents details of the rainfall insurance contracts. The premiums, payout slope, exit, and expected payouts are in rupees. ICICI policies, in Panel A, cover three phases. The "strike" amount indicates the rainfall level in mm below (Phase I and II) or above (Phase III) which a payout is triggered, and the"notional" indicates the rupee amount for each mm of rainfall deficit (Phase I and II) or excess (Phase III). Limit and exit levels represent maximum payouts andthresholds triggering those payouts, respectively. IFFCO-Tokio policies (Panel B) consist of a single phase. Each policy specifies a "normal" level of rainfall (in mm)and the payout is a non-linear function of the percentage shortfall from this "normal" rain. In Andra Pradesh, expected payouts are calculated using historical IMDrainfall data from 1970-2006. In Gujarat, expected payouts are calculated using historical rainfall data from 1965 to 2003.
389.9
Expected payout Payout (Rs.) as function of % rainfall deficit from "normal"
Normal Rain
607.4783.6

8
B. Summary Statistics
We study households in the Mahbubnagar and Anantapur districts of Andhra Pradesh, and the Ahmedabad, Anand, and Patan districts of Gujarat. These areas were chosen because they are drought-prone, have a high reliance on rainfed agriculture, and have a BASIX or SEWA presence. Below, we describe household summary statistics based on surveys conducted in 2006.
Sample. In Andhra Pradesh, summary statistics are based on a survey of 1,047 landowner households in 37 villages. These households were originally selected in 2004 based on a stratified random sample from a census of approximately 7,000 landowner households (see Giné, Townsend and Vickery (2008) for details). This survey sample is exactly the same set of households used for our field experiments (details of the experimental design are presented in Section III).
In Gujarat, survey data are drawn from 100 villages selected on two criteria: SEWA operated in the village, and the village was within 30 km of a rainfall station. Summary statistics are based on a baseline survey of 1,500 SEWA members in these villages, conducted in May 2006. The survey sample is representative of SEWA members in these 100 villages.5 Field experiments in 2007 were conducted in a randomly selected 50 of these 100 villages6 but covered a larger set of households within these villages than those included in the 2006 baseline survey. (Again, see Section III for details).
Basic demographic characteristics. Table 2 presents summary statistics for both sets of surveyed households. While there are differences in survey design between Gujarat and Andhra Pradesh, we harmonize variable definitions to the extent possible. Full variable definitions are presented in the Data Appendix.
5 For the Gujarat household survey 15 households were selected per village: five randomly selected from the SEWA member list, five randomly selected from the remaining SEWA members with a positive savings account balance, and five selected (non-randomly) based on suggestions from a local SEWA employee that they would be likely to purchase rainfall insurance. However, the entire sample of 1,500 households has similar summary statistics to the 500 selected randomly from the SEWA list, implying that the sample is close to representative of SEWA’s overall membership in these 100 villages. All findings discussed in the paper are qualitatively unchanged if the households selected non-randomly are excluded from the analysis. These results are available upon request.
6 Subsequently, two of the 100 villages were found to be so close that it would not be possible to treat one and not the other, so they were grouped together and assigned the same treatment status.

9
Overall, the state of Gujarat has richer soil and is substantially wealthier than Andhra Pradesh. However, in Gujarat, insurance is sold to poor households (SEWA members), while in Andhra Pradesh, we study only landowners. In Gujarat, approximately 52 percent of households report owning no farmland. These households earn their primary income from agricultural labor, whose supply and wages depend importantly on the quality of the monsoon (Jayachandran, 2006). Reported consumption expenditures are higher in Gujarat (note that this is a measure of food consumption only, and thus substantially understates total consumption). However, a wealth index based on durable goods owned7 (not reported in table) is higher in Andhra Pradesh. The value of savings deposits is similar across the two study areas, at around Rs. 1,000 ($21 US). 7 Items include a television, radio, fan, tractor, thresher, bullock cart, furniture, bicycle, motorcycle, sewing machine, and telephone. The index is based on the first principal component of the inventory of these asset holdings.
Mean St. Dev. Mean St. Dev.
(1) (2) (3) (4)
Demographic characteristics
Household size 6.26 2.82 5.85 2.39
Scheduled Caste or Scheduled Tribe (1=Yes) 11.60% 32.04% 43.70% 49.60%
Muslim (1=Yes) 3.90% 19.37% 8.73% 28.20%
Household head is male (1=Yes) 93.75% 23.96% 75.70% 42.90%
Household head 's age 47.60 12.13 48.93 12.87
Wealth and consumption
Monthly per capita food expenditures 310.53 126.89 555.37 417.42
Total value of all savings deposits 1,030.42 2,891.43 1,060.13 2,314.97
Land holdings (in acres) 6.31 6.17 4.11 5.49
Utility function
Risk aversion 0.57 0.25 0.54 0.32
Subjective discount factor (value today of 1 Rs received in future 0.71 0.29 0.75 0.15
Exposure to risk
Pct. of cultivated land that is irrigated 43.93% 43.26% 43.70% 47.10%
Familiarity with insurance and insurance vendor
Frequency of insurance payouts in the village (2004 and 2005) 0.40 0.39 n.a. n.a.
Household bought weather insurance in 2004 (1=Yes) 25.31% 43.50% n.a. n.a.
Does not know BASIX (1=Yes) 26.46% 44.13% n.a. n.a.
Household has some type of insurance (1=Yes) 80.54% 39.25% 63.78% 48.08%
Technology diffusion / networks
Belongs to water user group (BUA or WUG) (1=Yes) 1.84% 13.35% n.a. n.a.
Number of groups that the household belongs to 0.72 0.62 n.a. n.a.
Table 2. Summary Statistics
Notes: This table presents summary statistics for our sample. Data from Andhra Pradesh come from surveys conducted in2006, and BASIX administrative records. Data from Gujarat come from the baseline survey conducted in 2006. Data fromboth Andhra Pradesh and Gujarat have been winsorized at 1% from the top and bottom tails. In Andhra Pradesh, astratified random sample was selected from a census of approximately 7,000 households. In Gujarat, the experimentsample includes 1,500 households selected from SEWA's membership.
Andhra Pradesh Gujarat

10
Risk Attitudes and Discounting. Following Binswanger (1980), we measure risk aversion by asking respondents to choose amongst cash lotteries varying in risk and expected return. Lotteries were played for real money, with payouts between zero and Rs. 110. We map lottery choices into an index between 0 and 1, where high values indicate greater risk aversion. Table 2 reports the index mean. Lottery details are reported in Appendix Table 3.
Discounting is measured at the start of the monsoon season, by asking hypothetically the minimum a household would accept in the future in lieu of a fixed payment today.8 Measured discounting is high: the average monthly discount factor is 0.75 in Gujarat (implying a rupee in one month is worth 75 percent of a rupee today) and 0.71 percent in Andhra Pradesh.
Education and Financial Literacy. Rainfall insurance is complex, and may not be fully understood by farmers. Table 3 reports measures of household education, financial literacy, and cognitive ability. Education levels are relatively low: 67 percent of household heads in Andhra Pradesh and 42 percent in Gujarat have at most primary school education.
In Gujarat, we also administer short tests of math, financial literacy, and understanding of probabilities, paying respondents Rs. 1 for each question answered correctly. The average math score is 62 percent. Levels of financial literacy are much lower, with respondents doing worse than had they simply guessed. Respondents perform better on questions testing simple probability concepts, with on average 72 percent of questions answered correctly.9
To understand how households process information about index-based insurance, in both study regions we read a brief description of a hypothetical insurance product. Households were then asked several simple questions about whether the policy would pay out. Respondents performed at a fair level on this test, recording correct answers 79 percent of the time in Andhra Pradesh, and 68 percent in Gujarat (see Table 3, Panel C for individual questions).
8 This question was asked hypothetically because of the prohibitive cost of revisiting farmers to disburse payouts. Estimated discounting appears very high, perhaps in part due to present-biasedness at the start of the monsoon (as in Duflo, Kremer and Robinson, 2011). It could also possibly reflect suspicion about default on the promised future payment, or measurement error because of the hypothetical nature of the question.
9 Financial literacy questions were adapted from Lusardi and Mitchell (2006). Probability tests involved asking farmers to gauge the likelihood of drawing a black ball from depictions of bags containing black and white balls.

11
Panel A. Education and Financial Literacy Andhra Pradesh GujaratHighest level of education:
Primary school or below 66.8% 42.0%Secondary school 7.5% 28.7%High school 18.2% 11.6%College or above 7.4% 17.6%
Average Score, Math Questions [simple addition and multiplication: e.g. 3 times 6 = ?] n.a. 61.7%
n.a. 71.8%
Average Score, Financial Literacy [see Panel B below for questions] n.a. 35.8%
Average Score, Insurance Questions [see Panel C below for questions] 79.3% 68.2%
23.3% n.a.
Panel B. Financial Literacy Questions
n.a. 59.1%
n.a. 23.5%
n.a. 24.8%
n.a. 30.6%
Panel C. Insurance QuestionsAndhra Pradesh
a) It rains 120 mm. Will you get an insurance payout? [Ans: No] 85.8% n.a.b) It does not rain at all:
i) Will you get an insurance payout? [Ans: Yes] 83.0% n.a.ii) How much of a payout would you receive? [Ans: Rs. 500] 80.6% n.a.
c) It rains 20mm:i) Will you get an insurance payout? [Ans: Yes] 81.5% n.a.ii) How much of a payout would you receive? [Ans: Rs. 200] 76.0% n.a.
Gujarat
n.a. 63.7%
n.a. 58.9%
n.a. 79.9%
Table 3. Cognitive Ability, Financial Literacy, and Insurance Comprehension
Average Score, Probability Questions [e.g. comparing simple fractions in terms of probabilities: see table notes for an example]
Understanding of millimeters
(a) Suppose you borrow Rs. 100 an an interest rate of 2% per month. After 3 months, if you had made no repayments, would you owe more than, less than, or exactly Rs. 102? [Ans: More than Rs. 102](b) Suppose you need to borrow Rs. 500, to be repaid in one month. Which loan would be more attractive for you: Loan 1, which requires a repayment of Rs. 600 in one month; or Loan 2, which requires a repayment of Rs. 500 plus 15% interest? [Ans: Loan 2]
Notes: This table describes the cognitive ability, financial literacy, and insurance comprehension in our sample. Data from Andhra Pradesh come from surveys conducted in 2006. Data from Gujarat come from the baseline survey conducted in 2006. Correct answers to the financial literacy and insurance questions are indicated in bold following each question. See Data Appendix for variable definitions.
(c) If you have Rs. 100 in a savings account earning 1% interest per annum, and prices for goods and services rise 2% over a one-year period, can you buy more, less, or the same amount of goods in one year, as you could today? [Ans: Less amount of goods]
(d) Is it safer to plant one single crop, or multiple crops? [Ans: Multiple Crops]
Imagine you have bought insurance against drought. If it rains less than 50mm by the end of Punavarsu Kartis, you will receive a payout of 10Rs for every mm of deficient rainfall (that is, each mm of rainfall below 50mm).
An insurance company is considering selling temperature insurance. This temperature insurance would pay up to Rs. 310 if the temperature is very high during the month of July. The company will measure the daily maximum temperature in the local district headquarters. For each day the temperature is above 35 Celsius in July, the insurer will pay Rs. 10. For example, if there were ten days in July during which the temperature were greater than 35 Celsius, the policy would pay Rs. 100. If the temperature were always below 35 Celsius, the company would not pay any money. We are now going to test your understanding of the product.
a) Suppose July was not hot, and the temperature never exceeded 28 Celsius. How much would the insurance company pay? [Ans: None]b) Suppose the temperature in July exceeded 35 for one day only in the month. How much would the policy pay? [Ans: Rs. 10]c) Suppose the temperature were greater than 35 degrees for every day in the month of July. How much would the insurance company pay? [Ans: Rs. 310]

12
III. EXPERIMENTAL DESIGN
Our field experiments were designed to estimate the slope of the demand curve for rainfall insurance and to determine the sensitivity of demand to a range of non-price factors, including trust, liquidity constraints and framing effects. The structure of these experiments is described below. Table 4 reports the share of households receiving the different treatments.
Andhra Pradesh. In May 2006, just prior to the start of the monsoon season, 700 households from the sample of 1,047 were randomly selected to be visited in their home by one of a group of trained ICRISAT insurance educators. A summary table of the study design is presented in Appendix Table 1. Visits were successfully completed for 660 households (40 households could not be located after three attempts). During each visit, the educator described basic features of the insurance and answered questions. Households could also purchase insurance policies on-the-spot or could buy policies later through their local BASIX branch or LSA. If the farmer did not have enough cash on hand during the initial visit, the educator sometimes offered to later revisit the household to complete the purchase.
We randomized the content of these household visits independently along three dimensions. First, we randomly assigned whether the ICRISAT insurance educator received an endorsement from the local BASIX LSA. Given BASIX’s good reputation and high penetration rate, this LSA agent is well known and trusted among village households. Two-thirds of villages were designated as endorsement-eligible; within these villages, the LSA endorsed the educator (who was unknown to the local villagers, and not affiliated with BASIX) for half the visits.10 The LSA briefly introduced the ICRISAT insurance educator, declared him or her trustworthy and encouraged the household to listen. The BASIX LSA then left before the insurance educator began describing the product.11 In non-endorsed visits the educator visited the household alone.
The goal of this treatment was to measure how trust in the insurance provider influences demand. Trust is likely to be important in an environment where households cannot fully assess a product’s quality, a plausible assumption in this context given the low numeracy skills of our sample and the difficulty of assessing the expected return of the insurance. Our test is related to Guiso, Sapienza and Zingales (2008), who present a simple model and non-experimental evidence that trust influences stock market participation.
10 This two-tiered assignment structure was implemented to measure possible spillovers of trust within the village. It also helped reduce the demands on BASIX staff time.
11 ICRISAT educators recorded the degree to which the BASIX LSA followed the instructions. Instructions were followed exactly in 56percent of cases. For the remainder, 25percent did not show up or stayed at the house for too short a time. The remaining 19percent stayed for the duration of the visit. In private conversations after the sales period, BASIX LSAs did not recall which individuals they had endorsed and whether they had purchased insurance.

13
Panel A. Andhra Pradesh (2006)
Treatments N % of total
Household visit 700 67%
Village endorsed 474 45%
Visit endorsed 238 23%
Education module 350 33%
High reward 302 29%
Panel B. Gujarat (2007)
Video Treatments Total Surveyed Non-Surveyed
N 1413 315 1098
Treatment Assignments
Strong SEWA Brand 62% 100% 51%
Peer Endorsed 59% 100% 47%
Positive Frame (Pays 2/10 Years) 52% 50% 52%
Vulnerability Frame 11% 51% 0%
Discount = Rs. 5 42% 48% 41%
Discount = Rs. 15 38% 34% 40%
Discount = Rs. 30 19% 18% 20%
Flyer Treatments (N = 2391) N % of totalIndividual Emphasis (not Group) 1232 52%
Muslim Emphasis 836 35%
Hindu Emphasis 809 34%
Neutral (Non-religious) Emphasis 746 31%
Table 4. Study Design
Share of households receiving treatment
Share of households receiving treatment
Notes: This table describes the experimental design. Panel A reports the share of survey householdsreceiving various marketing treatments in Andhra Pradesh in 2006. Panel B reports the share ofhouseholds receiving various marketing treatments in Gujarat in 2007. In Gujarat, video marketingtreatment was only used in villages where rainfall insurance was offered for the first time in 2007. Thevideo treatments are as follows. In "Strong SEWA Brand", videos include clear indications that theproduct is being offered by SEWA. In "Peer endorsed", product endorsement is delivered by a farmer(instead of a teacher). The "Positive frame" emphasized that the product would have paid out in 2 ofthe last 10 years. The "Vulnerability frame" warned households of the difficulties they may face if theydo not have insurance. Flyer treatments were used in villages where rainfall insurance was offered inboth 2006 and 2007 in Gujarat. In "Individual emphasis", the flyer emphasized the benefit of insurancefor the individual (not the family). In Muslim, Hindu, and Neutral emphasis, the flyer depicted a farmerstanding near a Mosque, Hindu temple, or a nondescript building, respectively. Full details of theexperimental design are provided in the Appendix.

14
Second, we offered a random amount of cash compensation for the household’s time, of either Rs. 25 or Rs. 100, paid at the end of the household visit (half the households received the larger amount). Since every survey respondent had received a cash payment as compensation for a prior survey in 2004, they were familiar with this type of compensation. Since the premium for one phase of insurance ranges between Rs. 80 and Rs. 125, Rs. 100 provides roughly enough cash-on-hand to purchase one policy. The intended goal of this treatment was to test the sensitivity of insurance demand to liquidity constraints. The model of Rampini and Viswanathan (2010) predicts that liquidity constraints may reduce demand for risk management, since purchasing insurance must compete with other uses for limited funds, such as investment.
Third, we randomized whether the household received additional education about the financial product. In consultation with agronomists and researchers at a local agricultural university, we decided to focus on the conversion between soil moisture and millimeters of rainfall. Farmers generally decide when to sow crops by measuring the depth of soil moisture in the ground at the onset of the monsoon. However, insurance contracts are set in terms of millimeters of rainfall, a unit of measurement that many farmers are unfamiliar with. (Table 3 shows that only 23 percent of households can accurately indicate the length of a fixed number of millimeters.) To improve understanding, for 350 households, we showed the household the length of 10mm and 100mm using a ruler. The household was then presented a chart showing how 100mm of rain translates into average soil moisture for the soil type of their farm.12 For the other 350 households, educators did not provide this information.
Gujarat: Basic experimental design. Field experiments in Gujarat were conducted in 2007. SEWA used several techniques to market rainfall insurance, including flyers, videos, and discount coupons. Our field experiments involved randomizing the content of these three marketing methods at the household level.
Our field experiments involved the 50 villages in Gujarat where rainfall insurance was offered in 2007. These villages were randomly selected for marketing phase-in, with 30 offered insurance in 2006, and an additional 20 (randomly selected) offered insurance in 2007. We used different field experiments for these two groups. For villages with no prior exposure to insurance, SEWA used portable video players to deliver a 90-second marketing message directly to household-decision makers.13 Each treated household was randomly assigned one of eight different videos. For villages where insurance had been offered in 2006, SEWA instead distributed flyers to households, containing one of six randomly assigned messages.
12 Based on time use surveys reported by the insurance educator team, this education was presented briefly (an additional two minutes relative to a standard household visit).
13 The use of video players allows SEWA to explain the product to the households in a consistent manner. It allows for a more careful experimental treatment, as the individual conducting the marketing was not solely responsible for delivering the experimental message.

15
These treatments were delivered to a cross-section of households in each village, including all households who participated in the 2006 survey. Each treated household received a non-transferable coupon bearing their name and address, to be presented for a discount when insurance was purchased. The coupon serial number indicated which marketing message the household received. The size of this discount was randomized in the 20 villages receiving video treatments: 40 percent of households received Rs. 5, 40 percent received Rs. 15, and 20 percent received Rs. 30. This randomization allows us to estimate the slope of the demand curve for the population of households initially introduced to insurance.14 In the 30 villages receiving flyer treatments, the discount was fixed at Rs. 5.
Gujarat: Details of video and flyer messages. We randomize the video message along four dimensions. One experiment tests the sensitivity of demand to the prominence of the trusted SEWA brand. The other three test the sensitivity of demand to framing effects. A summary table of these treatments is presented in Appendix Table 2.15 Basic features are as follows:
SEWA Brand (Yes or No): SEWA has worked for many years in the study villages, while IFFCO-TOKIO is almost unknown. In the “Strong SEWA brand” treatment, videos clearly indicated the product was marketed by SEWA, while control treatment did not mention SEWA.
Peer vs. Authority Figure: Farmers may weigh information sources differentially when learning about insurance. In the “Peer” treatment, a product endorsement was delivered by a local farmer. In the “Authority” treatment, a teacher delivered the endorsement.
Payout (“2/10 yes” or “8/10 no”): In the “2/10” treatment, households were told “the product would have paid out in approximately 2 of the previous 10 years”. In the “8/10” treatment, households were told that “the product would not have paid out in approximately 8 of the previous 10 years”. These statements convey the same information, but one through a positive frame, the other through a negative frame.
Safety or Vulnerability: The “Safety” treatment described the benefits of insurance in terms of it being something that will protect the household and ensure prosperity. The “Vulnerability” treatment warned the household of the difficulties it may face if it does not have insurance and a drought occurs.
14 Recall that these 20 villages were randomly selected from the original set of 100 villages.
15 For households that were part of our 2006 household survey, four videos are used (A-D in Appendix Table 2). For this group, the SEWA brand is included in all videos. For households that received a video marketing treatment but were not part of the original survey, one of the eight different videos was randomly assigned, four of which include the SEWA brand.
16
Flyers distributed in the remaining 30 villages were randomized along two dimensions designed to test how formal insurance interacts with informal risk-sharing arrangements. This was done through the emphasis of group identity, which has been found to be important for informal risk-sharing (Karlan et al., 2009) and trust. Treatments included:
Religion (Hindu, Muslim, or Neutral): This treatment provides cues on group identity. A photograph on the flyer depicted a farmer in front of a Hindu temple (Hindu Treatment), a Mosque (Muslim Treatment), or a neutral building. The farmer has a matching first name, which is characteristically Hindu, characteristically Muslim, or neutral.
Individual or Group (Individual or Group): In the Individual treatment, the flyer emphasized the potential benefits of the insurance product for the individual buying the policy. The Group flyer emphasized the value of the policy for the purchaser’s family.
IV. EXPERIMENTAL RESULTS
Because we randomized the assignment of treatments, our empirical strategy is straightforward. For each field experiment, we estimate a linear probability model of the probability of household insurance purchase as a function of the treatment variables, and in some specifications a set of treatment interaction terms. Results are presented in Tables 5, 6 and 7. In this section we present each set of results. In Section V, we synthesize our combined results in terms of their implications for the importance of different barriers to insurance demand.
A. Andhra Pradesh
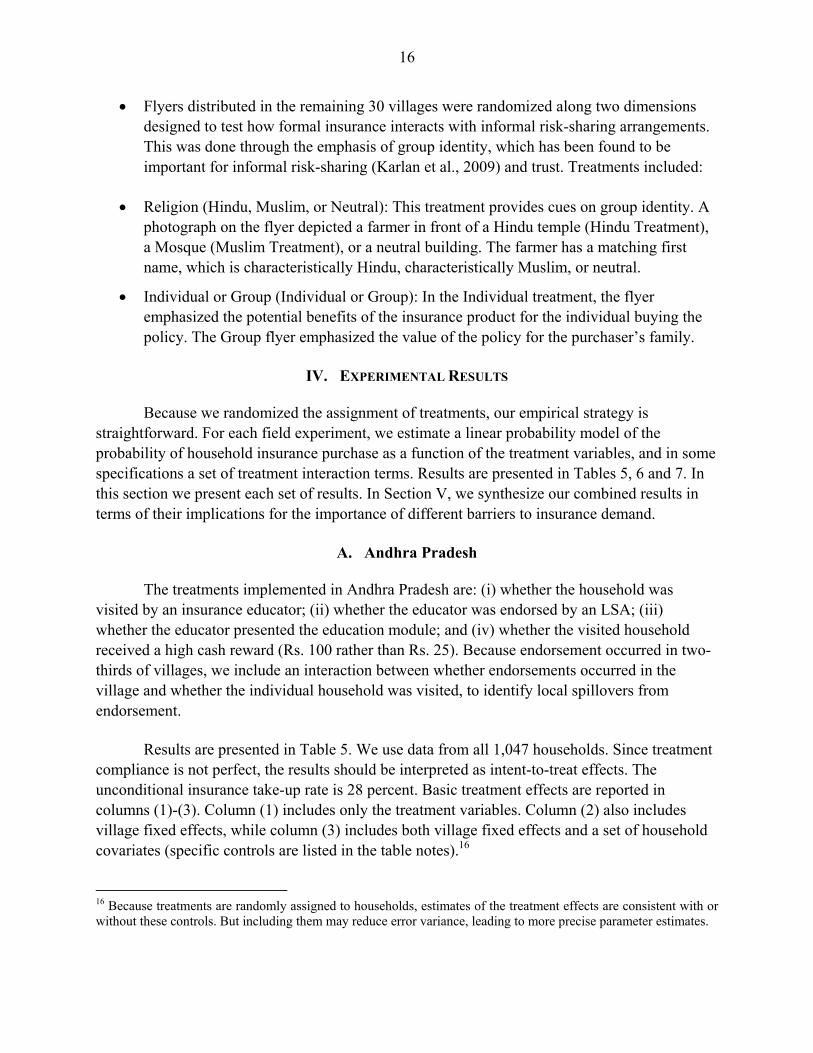
The treatments implemented in Andhra Pradesh are: (i) whether the household was visited by an insurance educator; (ii) whether the educator was endorsed by an LSA; (iii) whether the educator presented the education module; and (iv) whether the visited household received a high cash reward (Rs. 100 rather than Rs. 25). Because endorsement occurred in two-thirds of villages, we include an interaction between whether endorsements occurred in the village and whether the individual household was visited, to identify local spillovers from endorsement.
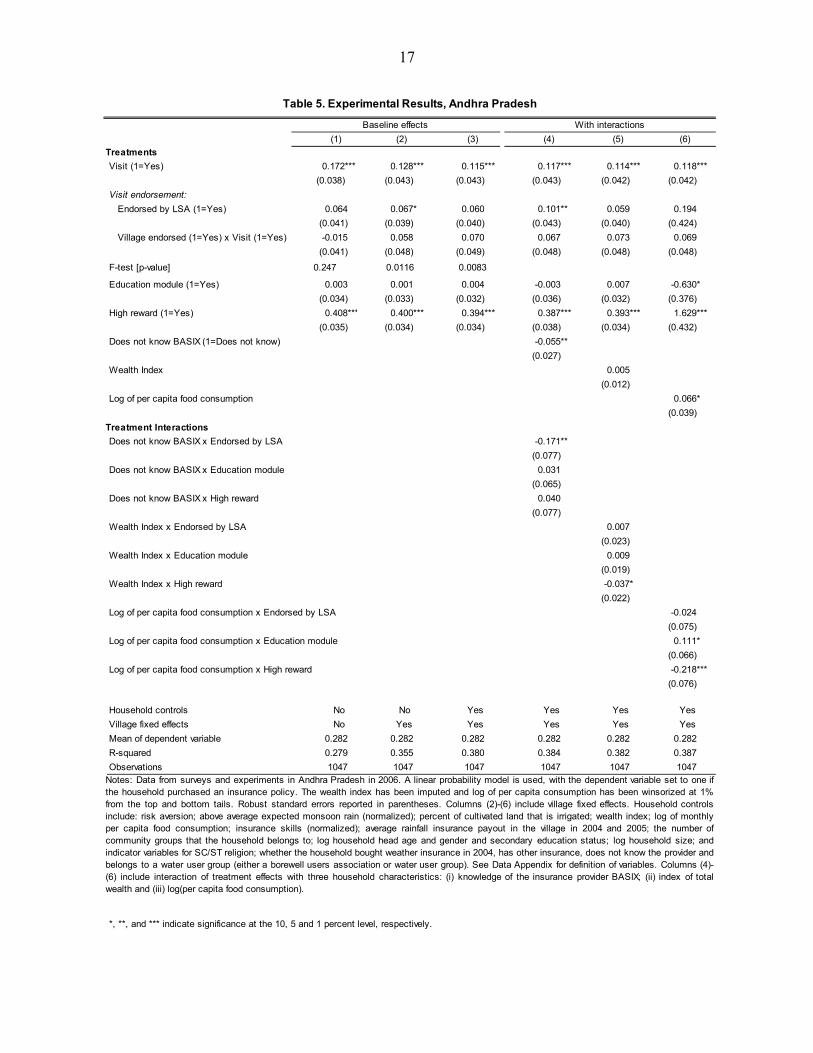
Results are presented in Table 5. We use data from all 1,047 households. Since treatment compliance is not perfect, the results should be interpreted as intent-to-treat effects. The unconditional insurance take-up rate is 28 percent. Basic treatment effects are reported in columns (1)-(3). Column (1) includes only the treatment variables. Column (2) also includes village fixed effects, while column (3) includes both village fixed effects and a set of household covariates (specific controls are listed in the table notes).16
16 Because treatments are randomly assigned to households, estimates of the treatment effects are consistent with or without these controls. But including them may reduce error variance, leading to more precise parameter estimates.
17
(1) (2) (3) (4) (5) (6)
Treatments
Visit (1=Yes) 0.172*** 0.128*** 0.115*** 0.117*** 0.114*** 0.118***
(0.038) (0.043) (0.043) (0.043) (0.042) (0.042)
Visit endorsement:
Endorsed by LSA (1=Yes) 0.064 0.067* 0.060 0.101** 0.059 0.194
(0.041) (0.039) (0.040) (0.043) (0.040) (0.424)
Village endorsed (1=Yes) x Visit (1=Yes) -0.015 0.058 0.070 0.067 0.073 0.069
(0.041) (0.048) (0.049) (0.048) (0.048) (0.048)
F-test [p-value] 0.247 0.0116 0.0083
Education module (1=Yes) 0.003 0.001 0.004 -0.003 0.007 -0.630*
(0.034) (0.033) (0.032) (0.036) (0.032) (0.376)
High reward (1=Yes) 0.408*** 0.400*** 0.394*** 0.387*** 0.393*** 1.629***
(0.035) (0.034) (0.034) (0.038) (0.034) (0.432)
Does not know BASIX (1=Does not know) -0.055**
(0.027)
Wealth Index 0.005
(0.012)
Log of per capita food consumption 0.066*
(0.039)
Treatment Interactions
Does not know BASIX x Endorsed by LSA -0.171**
(0.077)
Does not know BASIX x Education module 0.031
(0.065)
Does not know BASIX x High reward 0.040
(0.077)
Wealth Index x Endorsed by LSA 0.007
(0.023)
Wealth Index x Education module 0.009
(0.019)
Wealth Index x High reward -0.037*
(0.022)
Log of per capita food consumption x Endorsed by LSA -0.024
(0.075)
Log of per capita food consumption x Education module 0.111*
(0.066)
Log of per capita food consumption x High reward -0.218***
(0.076)
Household controls No No Yes Yes Yes Yes
Village fixed effects No Yes Yes Yes Yes Yes
Mean of dependent variable 0.282 0.282 0.282 0.282 0.282 0.282
R-squared 0.279 0.355 0.380 0.384 0.382 0.387
Observations 1047 1047 1047 1047 1047 1047
*, **, and *** indicate significance at the 10, 5 and 1 percent level, respectively.
Table 5. Experimental Results, Andhra Pradesh
Notes: Data from surveys and experiments in Andhra Pradesh in 2006. A linear probability model is used, with the dependent variable set to one ifthe household purchased an insurance policy. The wealth index has been imputed and log of per capita consumption has been winsorized at 1%from the top and bottom tails. Robust standard errors reported in parentheses. Columns (2)-(6) include village fixed effects. Household controlsinclude: risk aversion; above average expected monsoon rain (normalized); percent of cultivated land that is irrigated; wealth index; log of monthlyper capita food consumption; insurance skills (normalized); average rainfall insurance payout in the village in 2004 and 2005; the number ofcommunity groups that the household belongs to; log household head age and gender and secondary education status; log household size; andindicator variables for SC/ST religion; whether the household bought weather insurance in 2004, has other insurance, does not know the provider andbelongs to a water user group (either a borewell users association or water user group). See Data Appendix for definition of variables. Columns (4)-(6) include interaction of treatment effects with three household characteristics: (i) knowledge of the insurance provider BASIX; (ii) index of totalwealth and (iii) log(per capita food consumption).
Baseline effects With interactions
18
In each of these columns, being assigned a household visit alone increases take-up by
11.5 to 17.2 percentage points, while a high reward increases take-up by 39.4 to 40.8 percentage points. Each of these estimates is statistically significant at the 1 percent level. Individual LSA endorsement alone is positively signed and marginally statistically significant (t-stat between 1.5 and 1.7). However LSA-endorsement and the village endorsement variable are jointly significant at the 2 percent level in column (2) and the 1 percent level in (3), implying that part of the endorsement effect reflects spillovers to non-endorsed households in endorsed villages. Finally, the effect of the education module is economically small and statistically insignificant.
Columns (4)-(6) interact these treatments with three household variables in turn: an indicator for whether the household reports being unfamiliar with BASIX, an index of household wealth, and the log of per capita food consumption. Column (4) shows that LSA endorsement has sharply different effects depending on whether the household is familiar with BASIX, and thus is likely to have had past interactions with the LSA. For households familiar with BASIX, LSA endorsement increases take-up by 10.1 percentage points, statistically significant at the 5 percent level. In contrast, endorsement has no net effect on insurance demand amongst households unfamiliar with BASIX (the net effect is 10.1 - 17.1 = -7.0 and statistically insignificant). The other notable interaction is that in both columns (5) and (6) the effect of the high cash reward on demand is larger amongst poor households. This estimate is statistically significant at the 10 percent level in column (5), and at the 1 percent level in column (6).
B. Gujarat: Video Experiments
Amongst the 20 Gujarat villages where video treatments were implemented, we randomized the content of the video viewed and the size of the discount coupon the household received. Correspondingly, we regress insurance purchase on the discount amount in rupees and the randomized video features: (i) whether the video featured a strong SEWA brand emphasis, (ii) whether a peer rather than authority figure endorsed the product, (iii) whether the policy is framed positively as paying in 2 of 10 years (rather than not paying in 8 of 10 years), and (iv) whether the product is framed in terms of “safety” rather than “vulnerability”. We also include a dummy for whether the household was part of the 2006 baseline survey.
Results are presented in Table 6. Columns (1) and (2) report basic results with and without village fixed effects, respectively, while (3) and (4) include additional interaction terms. As shown in the table, the overall take-up rate is 29.4 percent.
The size of the discount has a large effect on take-up. The coefficient on discount size is positive and significant at the 1 percent level. The coefficient of 0.307 in column (1) implies that a 10 percent decline in the price of insurance increases the probability of purchase by 3.07 percentage points, or 10.4 percent of the baseline take-up rate. In other words, the implied elasticity is 1.04 (or 1.16 based on column (2)). In contrast, none of the framing effects is statistically significant, and they are also jointly insignificant. In columns (3) and (4) we interact the discount with each framing effect. While in some cases the price sensitivity of demand does

19
vary with framing, we are unable to reject the null that these interaction effects are jointly zero.
Finally, households who participated in the 2006 baseline survey are significantly more likely to purchase insurance. This result is consistent with evidence that being surveyed can change behavior (Zwane et al., 2010), as well as the overweighting of the original sample to include individuals thought likely to purchase insurance. Note, however, that our overall estimates are not driven by this group; estimates in Tables 6, 7 and 8 are similar when this group is excluded (results available on request).
Panel B of Table 6 reports the take-up rate in each district broken down by the discount amount. Insurance take-up is monotonically increasing in the discount in each district. We also report for two of the three policies the estimated gross rate of return on the insurance, calculated as the ratio of the estimated expected payoff (from Table 1) to the price net of discounts. Most strikingly, for farmers in Ahmedabad receiving the Rs. 30 discount, our estimates imply that the insurance is significantly better than actuarially fair – expected payouts are 169 percent of net premiums. Despite this, fewer than half of eligible farmers receiving this discount chose to buy insurance. This is perhaps the starkest evidence that lower market prices alone would be unlikely to generate near-universal insurance participation, at least in the short run.
C. Gujarat: Flyer Experiments
Flyer experiments involve randomizing the content of the flyer presented to households along two dimensions: (i) the religious emphasis of the flyer: Muslim, Hindu or neutral (the latter is the omitted dummy), and (ii) whether the flyer emphasizes the benefits of insurance to the group rather than the individual. We are interested in how cues related to religion and group identity affect perception of the insurance product. While in general Hindu and Muslim groups live in close proximity and harmony, Gujarat has been subject to ethnic tension, particularly in 2002 when there was significant violence between the two communities.
As before, we estimate a linear probability model of how insurance demand depends on these treatments. Results are presented in Table 7. Even-numbered columns include village fixed effects, while odd-numbered columns do not.
Columns (1) and (2) study the entire sample, including each intervention individually. The overall take-up rate is 23.8 percent (i.e., 23.8 percent of households given a flyer eventually purchased insurance), similar to that of the field experiments where video treatments were used. None of the baseline treatments is statistically significant, however, and the coefficients are small.
The next two columns include the interactions of the two different treatments. Notably, the group emphasis treatment now has a significant positive effect on take-up when combined with a neutral religious setting. However, the use of a Muslim religious setting on the flyer (instead of a neutral one) reduces take-up by 9-10 percentage points, statistically significant at
20
the 5 percent level in both cases.
The final four columns of Table 7 repeat this analysis separately for households with characteristically Muslim names (columns (5) and (6)) and characteristically Hindu names (columns (7) and (8)), as identified by our research team after the completion of all field experiments.17 We find that, amongst households receiving a group emphasis flyer, households identified as Muslim have a large and statistically significantly lower insurance take-up rate when the flyer includes Hindu symbols (by 32.8 or 34.2 percentage points compared to the neutral flyer). Symmetrically, for Hindu households, take-up is statistically significantly lower when the flyer includes Muslim symbols (by 10.1 or 9.6 percentage points).
Together, these results provide some evidence that emphasizing the communal nature of insurance stimulates demand for insurance products, but not if those cues emphasize group members different from the household. This finding holds for Hindu and Muslim households, although the point estimate of the effect is larger amongst the smaller Muslim population.
17 We emphasize that treatment status was assigned randomly and was orthogonal to the religious identity of the respondent. After the marketing effort was finished, Gujarati research assistants identified the religious identity of the respondent based on the respondent’s name. The 219 respondents on which our two independent coders disagreed have been omitted from the analysis in columns (5)-(8) of Table 7.

21
(1) (2) (3) (4)
Discount (fraction of initial price) 0.307*** 0.340*** 0.372** 0.405**
(0.076) (0.075) (0.148) (0.151)
Implied price elasticity of demand 1.04 1.16
Framing effects
Strong SEWA Brand -0.026 -0.031 -0.081* -0.082*
(0.027) (0.027) (0.040) (0.041)
Vulnerability Frame 0.046 0.041 0.131 0.134
(0.051) (0.050) (0.099) (0.097)
Positive Frame (Pays 2/10 Years) -0.027 -0.035 -0.037 -0.049
(0.023) (0.021) (0.039) (0.038)
Peer Endorsed -0.031 -0.021 0.022 0.036
(0.031) (0.031) (0.043) (0.046)
Surveyed Household 0.159** 0.179** 0.207*** 0.210***
(0.064) (0.064) (0.071) (0.074)
Discount interactions
Percentage Discount x Vulnerability Frame -0.427 -0.466
(0.335) (0.339)
Percentage Discount x Positive Frame 0.049 0.067
(0.133) (0.127)
Percentage Discount x Strong SEWA Brand 0.258** 0.236*
(0.124) (0.131)
Percentage Discount x Peer Endorsed -0.252 -0.268*
(0.152) (0.145)
Percentage Discount x Surveyed Household -0.231 -0.150
(0.309) (0.308)
F-test on all treatments (p-value) 0.013 0.004
F-test on discount interactions (p-value) 0.265 0.144
Village fixed effects no yes no yes
Mean of dependent variable 0.294 0.294 0.294 0.294
R-squared 0.033 0.134 0.041 0.142
Number of observations 1413 1413 1413 1413
Panel B. Rate of return on premium and insurance takeup rates
Return (gross) Take-up Return (gross) Take-up Return (gross) Take-up
5 61% 25% n/a 22% 47% 36%
15 82% 37% n/a 22% 54% 37%
30 169% 47% n/a 30% 69% 44%
*, **, and *** indicate significance at the 10, 5 and 1 percent level, respectively.
Notes: Panel A presents experimental results for the video treatments in Gujarat. Data come from surveys conducted in Gujarat in2007. A linear probability model is used, with the dependent variable set to one if the household purchased an insurance policy.Robust standard errors reported in parentheses. Columns (2) and (4) include village fixed effects.
Table 6. Experimental Results for Video Treatments, Gujarat
Panel A. Regression estimates
Baseline With interactions
Discount (Rs.)
Ahmedabad Anand Patan

22
V. DISCUSSION OF EXPERIMENTAL RESULTS
So far, we have presented a short summary of our results. In this section we discuss and synthesize our three sets of field experiments in terms of their implications for the importance of different barriers to insurance participation.
A. Price Relative to Actuarial Value
Rural finance is expensive to provide. Cull, Demirguc-Kunt and Morduch (2009) document that annual operating costs for non-bank microfinance loans range from 17–26 percent of loan value, far higher than corresponding costs in developed countries. We find strong evidence that rainfall insurance demand is significantly price-sensitive, suggesting that high insurance prices contribute to low demand.18 The relevant coefficient in columns (1) and (2) of Table 6 indicates that a price reduction of 10 percent increases demand by 10.4 to 11.6 percent.
These point estimates imply that, holding everything else constant, rainfall insurance demand would increase significantly (by approximately 36-66 percent) if insurance could be
18 Our findings are consistent with recent evidence documenting a significant elasticity of credit demand in developing countries (Karlan and Zinman, 2008), as well as previous evidence on the elasticity of insurance demand in the United States (Babbel, 1985; Pauly et al., 2003). Our estimates appear to exceed previous price elasticity estimates for U.S. crop insurance; for example Goodwin (1993) finds estimates between -0.32 and -0.73.
(1) (2) (3) (4) (5) (6) (7) (8)
Treatments
Muslim emphasis (1=Yes) -0.002 -0.004 0.043 0.045 0.134 0.160 0.041 0.041
(0.023) (0.023) (0.034) (0.034) (0.102) (0.113) (0.040) (0.039)
Hindu emphasis (1=Yes) 0.002 0.008 0.012 0.022 0.057 0.121 0.002 0.014
(0.019) (0.019) (0.030) (0.030) (0.086) (0.131) (0.034) (0.034)
Group emphasis (1=Yes) 0.020 0.015 0.060* 0.060** 0.247** 0.239* 0.058 0.053
(0.018) (0.018) (0.032) (0.028) (0.110) (0.135) (0.037) (0.033)
Surveyed Household 0.133*** 0.132*** 0.134*** 0.133*** 0.121 0.106 0.107*** 0.088**
(0.040) (0.040) (0.040) (0.040) (0.136) (0.155) (0.039) (0.038)
Religion treatment interactions
Muslim emphasis x group -0.094** -0.101** -0.223 -0.230 -0.101** -0.096*
(0.044) (0.042) (0.219) (0.192) (0.049) (0.048)
Hindu emphasis x group -0.019 -0.029 -0.328** -0.342* -0.000 -0.015
(0.047) (0.045) (0.132) (0.171) (0.053) (0.051)
Village fixed effects No Yes No Yes No Yes No Yes
Mean of dependent variable 0.238 0.238 0.238 0.238 0.167 0.167 0.268 0.268
R-squared 0.016 0.12 0.018 0.123 0.085 0.349 0.013 0.134
Observations 2391 2391 2391 2391 132 132 2040 2040
*, **, and *** indicate significance at the 10, 5 and 1 percent level, respectively.
Table 7. Experimental Results for Flyer Treatments, Gujarat
All households Muslim households only Hindu households only
Notes: This table presents experimental results for the flyer treatments in Gujarat. Data come from surveys conducted in Gujarat in 2007. A linear probability model is used, withthe dependent variable set to one if the household purchased an insurance policy. Robust standard errors reported in parentheses. "Group Emphasis" indicates that the flyeremphasized the benefit of insurance for the family (not the individual). In "Muslim, Hindu, and Neutral Emphasis", the flyer depicted a farmer standing near a Hindu temple,Mosque, or a nondescript building, respectively. Columns (2), (4), (6) and (8) include village fixed effects. Columns (1)-(4) present the results for the entire sample; columns (5)-(6) present the results for those with identifiably Muslim names, and columns (7)-(8) for those with identifiably Hindu names. 219 respondents on which our two independentcoders disagreed have been omitted from the analysis in columns (5)-(8).

23
offered with the same mark-up as US insurance contracts.19 However, even such an increase would still imply that only a small fraction of all households in our study areas purchase insurance, given the low current take-up rates. Most starkly, the results for Ahmedabad imply that more than half of households do not purchase rainfall insurance even when the policy price is set significantly below the actuarial value of the insurance policy. This, as well as our experimental results, suggests that non-price factors present significant barriers to take-up, at least in the current early stage of the insurance product’s life cycle.20
B. Trust
In contrast to credit or savings, purchasing insurance involves paying a known monetary premium today in return for an uncertain future payout. Evaluating the benefits of insurance may thus be difficult, relative to other types of microfinance, especially if the household has low financial literacy or little experience with the product. In such a setting, advice from trusted sources or the quality of the insurance seller’s reputation is likely to particularly influence household decisions. Consistent with this prediction, our Andhra Pradesh results show that a higher level of trust in the otherwise unknown insurance educator, due to an endorsement from the local BASIX LSA, significantly increases insurance take-up. Notably, this effect holds only amongst households already familiar with BASIX, and thus for whom the word of the LSA is credible. For this subgroup, LSA endorsement increases the insurance purchase probability by 10.1 percentage points, or 36 percent of the average take-up rate. In contrast, LSA endorsement has no demand effect amongst farmers unfamiliar with BASIX.
However, we do not find a statistically significant effect of SEWA brand endorsement in the Gujarat video treatments. This may be due to differences in reputation, or because the treatment was too subtle compared to the “live” in-person endorsement given in Andhra Pradesh.
While trust has previously been posited as an important determinant of demand for
19 To calculate these values, we multiply our coefficients by the difference in loading on Indian rainfall insurance contracts (from Table 1) and U.S. insurance data cited earlier. U.S. contracts provide an average payout-to-premia ratio of 70percent, compared to 46percent for the Indian rainfall insurance contracts, implying the price per unit of payout is 34percent lower for the US contracts. The point estimates of 0.3 to 0.34 suggest cutting the price of the Indian contracts by 34percent would increase demand by 35percent to 40percent. The upper bound of 65percent is calculated in a similar way, except comparing the price of the lowest-value Indian insurance contract to the highest-value U.S. contract. Note that our undiscounted insurance policies have a lower expected payout ratio than U.S. policies, while our highest discount treatments result in a product that is better than actuarially fair. Thus, this comparison with the U.S. does not require out-of-sample extrapolation relative to the support of data used to estimate the slope of the demand curve. 20 The elasticity of demand itself may also evolve as households become more familiar with the product over time. Note that the price elasticity of demand is estimated primarily from non-surveyed households, who did not receive anything other than a standard marketing visit. While a small fraction had also participated in a previous household survey in 2006, as mentioned earlier, in results available on request, we find that excluding these households has almost no effect on the estimated demand elasticity.

24
microinsurance (Cai et al., 2010) and financial products more generally (Doherty and Schlesinger, 1990; Guiso, Sapienza and Zingales, 2008), these results provide, to our knowledge, the first causal experimental evidence that trust matters. Trust is likely to be particularly relevant to demand for financial products in environments in which formal legal protections are weak, and household financial literacy and education is low. In such cases, strong consumer protection regulation that commits companies to honor their contracts may help build trust.
While we label our results as measuring “trust”, our findings could be consistent with a variety of different underlying decision-making mechanisms. For example, the endorsement may increase demand by narrowing the set of priors about the insurance product’s quality considered by an ambiguity-averse individual, along the lines of Bryan (2010). Alternatively, it may simply reduce perceived basis risk. One interesting related finding documented in Section VI.A is that measured household risk aversion is negatively correlated with insurance demand in both Andhra Pradesh and Gujarat. Giné, Townsend and Vickery (2008) also find the same result, which they show is concentrated amongst households without knowledge of BASIX or of insurance. One potential interpretation is that uninformed risk-averse or ambiguity-averse households are unwilling to experiment with the insurance product, given their limited experience with it.
C. Liquidity Constraints
Experimental results from Andhra Pradesh suggest that a positive liquidity shock provided at the time of the household visit has a large positive effect on household insurance demand. This effect is magnified amongst less wealthy households, who are likely to have less access to the financial system.
One interpretation is that this result suggests liquidity constraints are a significant barrier to rainfall insurance demand (consistent with Rampini and Viswanathan, 2010). The non-experimental evidence described in Section VI also includes two findings suggestive of the role of liquidity constraints: (i) cross-sectionally, insurance demand is larger amongst wealthy households; (ii) non-participating households self-report “lack of funds to buy” as their most common reason for not purchasing insurance.21 The fact that households generally purchase only a single insurance policy may also indicate liquidity constraints, at least in part.
While this evidence is suggestive, we note, however, that there are also plausible alternative explanations for each of these results. For example, reciprocity may provide an alternative interpretation for our experimental findings on the effect of the high cash reward. Since the cash is given to the farmer by the ICRISAT educator, the former may feel a sense of obligation to use those funds to purchase insurance, even though there was no requirement or pressure to do so. Poorer farmers may feel a stronger sense of obligation. Although each farmer 21 Of course, if respondents are concerned about offending the sales agent, they may simply use lack of funds as convenient excuse as to why they do not want insurance.

25
had past experience with receiving payouts as compensation for participating in interviews, we believe it is not possible to fully rule out this alternative explanation.
As such, we believe further research to buttress our evidence on the role of liquidity constraints would be valuable. Confirmatory evidence that liquidity constraints are important for demand could help explain low observed insurance take-up amongst the poor, and would imply that a potential side-effect of credit expansion (e.g. through greater use of central credit registries, or other improvements in enforcement) would be an increase in insurance demand.
D. Financial Literacy and Education
The education and financial literacy statistics in Table 3 document that a significant fraction of households in our study areas are unable to answer simple mathematics or financial questions, and a smaller fraction do not understand basic features of the rainfall insurance contracts. This provides prima facie evidence that households have only a limited understanding of the product and may make systematic mistakes about insurance purchase decisions.
The predicted effect of education on take-up is ambiguous, since it depends on how the education shifts the household’s priors about the quality of the insurance. We find that the short rainfall insurance education module administered in Andhra Pradesh has no significant effect on insurance demand. The inefficacy of this particular education module has subsequently been confirmed by Gaurav, Cole and Tobacman (2011), which offered a very similar module to a separate set of farmers, and also found no effect on take-up. In contrast, Gaurav, Cole and Tobacman (2011) do find that a two-day educational program, involving games that simulate rainfall insurance, did increase rainfall insurance demand by five percentage points. Thus, while evidence suggests an intensive education campaign can increase take-up, this shorter intervention, and perhaps other education modules that could be provided at low cost during a marketing visit, have little effect.
E. Framing, Salience and Other Behavioral Factors
We find only limited evidence that pure framing effects identified in the psychology and behavioral economics literatures (e.g. Tversky and Kahneman, 1981) significantly affect rainfall insurance demand. Specifically, there are no significant differences in take-up amongst eight different frames used in the Gujarat video experiments. While in some cases our power to reject the null is limited, a two standard deviation confidence interval for each individual framing treatment is generally no larger than ± 6 percentage points, and in nearly every case we can reject the null that frame shifts demand by more than 10 percentage points.
These confidence bounds are much closer to zero than the findings by Bertrand et al. (2010), who estimate that framing has significant effects on credit demand in a large field experiment in South Africa; they also appear at odds with laboratory experiments by Johnson et al. (1993) and Mittal and Ross (1998), who find framing to have important effects on

26
(hypothetical) demand for insurance. One interpretation is that the impact of framing effects is likely to be heavily context-specific and thus may vary significantly across different studies.
We find some evidence that framing matters in the flyer experiments, reported in Table 7. As discussed in Section IV, while the main effects of group and religion do not affect take up, the interaction of the two different treatments does. Notably, amongst households receiving a group emphasis flyer, households likely to be Muslim have a large and statistically significantly lower insurance take-up rate when the flyer includes Hindu symbols. Symmetrically, for Hindu households, take-up is statistically significantly lower when the flyer includes Muslim symbols. These findings suggest that emphasizing the communal nature of insurance stimulates demand but not if those cues emphasize members different from the household.
Finally, we find in Andhra Pradesh that being assigned a household visit significantly increases insurance take-up (Table 5), even when not combined with other treatments. We obtain this result even though the product is readily available to all village households. This may reflect the added convenience of being able to purchase insurance “on-the-spot”, or be due to the effect of the baseline information provided by the ICRISAT insurance educator. Alternatively, the household visit may simply make the insurance product more salient to the household, which in a model of limited attention (e.g. Reis, 2006) would be expected to influence demand.
VI. NON-EXPERIMENTAL EVIDENCE
To complement our experimental evidence, in this section we briefly discuss qualitative data on households’ self-reported explanations for their rainfall insurance purchase decisions. We also study correlations between insurance purchase decisions and household characteristics, such as proxies for access to finance, numeracy, and prior experience with insurance. Results from this correlation analysis can be checked against our earlier experimental results, and can provide suggestive evidence regarding other predicted determinants of insurance demand. For example, the simplest model of insurance demand predicts that demand is increasing in risk aversion, the variance of consumption and the correlation between consumption and insurance payouts. Of course, since these household characteristics are not exogenous, results of this analysis should be interpreted cautiously.
A. Correlates of Insurance Purchase
Similar to the analysis presented above, we regress a dummy for whether the household purchases a positive amount of insurance on a set of household characteristics drawn from the surveys conducted in Andhra Pradesh and Gujarat in 2006. Results are presented in Table 8. Similar variables from the two survey areas are defined in a consistent way for this analysis to allow a comparison of coefficient estimates.

27
First, as discussed above, measures of wealth are positively correlated with insurance purchase, especially for the Gujarat sample. This may reflect liquidity constraints, or possibly other factors (e.g., perhaps wealthier households have greater willingness to experiment with new products and technologies).
Second, variables presented in Table 3 measuring households’ ability to answer probability, math and insurance questions (measured by the variables “financial literacy,” “probability skill” and “insurance skills”) are in general positively correlated with insurance purchase, consistent with a hypothesis of limited cognition or imperfect information. Interestingly, the most robustly significant relationship is for “probability skill”. This may reflect the particular importance of an understanding of probability concepts for evaluating index insurance, a product whose returns are inherently probabilistic in nature.
Third, measures of prior experience with the insurance product and vendor are significantly positively correlated with insurance purchase. These are measured in a number of ways: by whether the household purchased insurance in previous years, whether the household is familiar with the insurance vendor, whether the household has other types of insurance, and, for Andhra Pradesh, whether the household’s village had experienced positive rainfall insurance payouts in 2004 and 2005. The importance of vendor familiarity is consistent with experimental findings about trust and salience; other results are suggestive of a progressive process of learning about the product over time.
Fourth, as already mentioned, higher risk aversion is negatively correlated with insurance purchase in both the Andhra Pradesh and Gujarat samples. This prediction is inconsistent with a standard model of insurance demand with no basis risk. However, as Clarke (2011) shows, the theoretical relationship between risk aversion and insurance demand is ambiguous in the presence of basis risk.22 As already discussed, an alternative explanation is that very risk-averse households may be unwilling to experiment with a new and less-tested financial product.
Fifth, we examine the correlation between demand and the fraction of irrigated land, as a proxy for income variance. This measure is not perfect, since it is also likely to be correlated with wealth. This measure is statistically insignificant in each multivariate specification.
These results extend the experimental evidence presented earlier and, where comparable, generally appear consistent with our experimental findings. They are also in line with the evidence in Giné, Townsend and Vickery (2008), which presents correlates of the determinants of insurance participation using an earlier 2004 household survey.
22 Clarke (2011) finds that in the presence of moderate basis risk, predicted demand for actuarially unfair index insurance follows an inverted U-shape (zero-increasing-decreasing) as the coefficient of risk aversion increases.

28
We note in closing that we do not directly analyze how basis risk affects insurance demand. Basis risk refers to the potential discrepancy between insurance payouts and the actual pre-insurance income or consumption loss suffered by the policy holder, for example, due to the fact that the measured rainfall index is imperfectly correlated with rainfall at any individual farm.23 None of our randomized treatments is specifically designed to measure the importance of basis risk for insurance demand; instead, we focus on within-village variation amongst farmers, each facing a similar level of index basis risk. However, further analysis of basis risk is an important and interesting topic for future research.
B. Self-Reported Explanations for Non-Purchase
In both Andhra Pradesh and Gujarat, our follow-up (post-harvest) household survey simply asks non-purchasers to explain the main reasons why they did not buy rainfall insurance. For the Andhra Pradesh sample, these statistics are reported in Giné et al. (2012). The most common primary reason cited by households in both study areas is “insufficient funds to buy insurance,” cited by 81 percent of non-purchasers in Andhra Pradesh, and 28 percent in Gujarat. Explanations relating to basis risk and the high product price, such as “it is not good value” and “it does not pay out when I suffer a loss”, are also cited, although less frequently. Few households cite “do not need insurance” as a reason for non-purchase (3 percent in Andhra Pradesh and 25 percent in Gujarat). While these qualitative results are suggestive, they appear consistent with our prior evidence that liquidity constraints reduce insurance participation, and support the view that households are not already fully insured against rainfall risk.
23 While we have no direct estimates of basis risk, we note that our survey villages in Andhra Pradesh are located relatively close on average (4.2 miles, or 6.8 km) from the reference weather station. Insurance payouts triggered by severe rainfall deficits are also likely to be spatially correlated. For these reasons, insurance payouts are likely to be strongly indicative of low rainfall and yields at the policyholder’s farm. However, while rainfall risk is identified by farmers as their most important income risk, the policy does not cover other risks (e.g. pestilence, health etc.). For this reason alone, insurance payouts will be imperfectly correlated with household income and consumption.

29
Andhra Pradesh
GujaratAndhra Pradesh
GujaratAndhra Pradesh
Gujarat
(1) (2) (3) (4) (5) (6)Risk aversion -0.217*** -0.298*** -0.142** -0.182*** -0.102* -0.082
(0.058) (0.056) (0.059) (0.055) (0.059) (0.056)Above average expected monsoon rain (normalized) 0.001 -0.164*** -0.008 -0.122*** -0.007 -0.110***
(0.014) (0.037) (0.014) (0.035) (0.015) (0.035)Pct. of cultivated land that is irrigated 0.081** 0.164** -0.013 0.051 -0.013 0.095
(0.033) (0.075) (0.036) (0.071) (0.037) (0.067)Wealth, income and credit constraints
Wealth Index 0.020** 0.054*** -0.004 0.023* -0.005 0.037***(0.010) (0.011) (0.013) (0.012) (0.013) (0.013)
Log of monthly per capita food expenditures (winsorized) 0.002 0.108*** -0.01 0.084** 0.019 0.088**(0.028) (0.036) (0.039) (0.037) (0.040) (0.039)
Familiarity with insurance and BASIXAverage insurance payouts in the village 2004 and 2005 0.160*** 0.073*
(0.036) (0.042)Household bought weather insurance in 2004 (1=Yes) 0.113*** 0.049 0.077**
(0.033) (0.035) (0.037)Financial literacy 0.037** 0.011 0.007
(0.018) (0.019) (0.019)Math skills 0.097 0.024 0.024
(0.061) (0.070) (0.071)Probability skills 0.056*** 0.042** 0.039**
(0.018) (0.017) (0.017)Insurance skills (normalized) 0.076*** -0.010 0.047*** -0.054*** 0.045*** -0.044**
(0.012) (0.018) (0.014) (0.020) (0.015) (0.020)Household has other insurance policy (1=Yes) 0.161*** 0.298*** 0.125*** 0.251*** 0.115*** 0.241***
(0.030) (0.039) (0.032) (0.038) (0.034) (0.039)Does not know BASIX (1=Yes) -0.138*** -0.105*** -0.117***
(0.029) (0.030) (0.032)Technology diffusion and networks
Household belongs to water user group (1=Yes) 0.139 0.109 0.049(0.114) (0.111) (0.112)
Number of groups household belongs to 0.047** 0.035 0.022(0.023) (0.023) (0.024)
Demographic CharacteristicsScheduled Caste or Scheduled Tribe (1=Yes) -0.062 -0.217*** -0.004 -0.143*** -0.005 -0.129***
(0.041) (0.038) (0.043) (0.037) (0.045) (0.041)Muslim (1=Yes) -0.033 0.156*** -0.03 0.105* -0.104 0.171***
(0.070) (0.059) (0.071) (0.056) (0.080) (0.066)Household head is male (1=Yes) 0.037 0.126*** 0.053 0.055 0.037 0.02
(0.056) (0.047) (0.058) (0.045) (0.056) (0.045)Log of household head's age 0.032 -0.14 0.085 -0.118 0.104* -0.282***
(0.054) (0.147) (0.056) (0.085) (0.058) (0.088)Log of household size 0.060 0.089** -0.005 0.079* 0.022 0.067
(0.039) (0.042) (0.050) (0.044) (0.050) (0.044)Education of head is secondary school or higher (1=Yes) 0.034 0.073 0.001 0.039 0.007 0.06
(0.030) (0.056) (0.032) (0.058) (0.033) (0.059)
Village fixed effects No No No No Yes Yes
Observations 1047 772 1047 772 1047 772
*, **, and *** indicate significance at the 10, 5 and 1 percent level, respectively.
Table 8. Correlates of Insurance Purchase Decisions
Univariate Multivariate
Notes: This table presents correlates of insurance purchase decisions. Data from Andhra Pradesh come from surveys conducted in2006 and BASIX administrative data. Data from Gujarat come from surveys conducted in 2006 and SEWA records. A linearprobability model is used, with the dependent variable set to one if the household purchased at least one insurance policy. Robuststandard errors are reported in parenthesis below the coefficients. Wealth index has been imputed and log of monthly per capita foodexpenditure has been winsorized at 1% from the top and bottom tails. Columns (1) and (2) report Univariate correlations computed byan OLS regression of the dependent variable against the variable shown in each row. Columns (3)-(6) report OLS regressions usingall the variables as regressors. Columns (5) and (6) include village fixed effects. See Data Appendix for definition of variables.

30
VII. IMPROVING HOUSEHOLD RISK MANAGEMENT: TENTATIVE LESSONS AND CONCLUSIONS
In recent years, financial innovations have emerged with the potential to improve household risk management, including futures based on home prices (Shiller, 2008), and index insurance for hedging weather, price and other agricultural risks. These products are designed to diversify key sources of risk, and have the feature that payouts are based on observable, exogenous events, eliminating adverse selection and moral hazard as sources of market failure.24
This paper studies demand for one such product, rainfall index insurance, designed to diversify households in our study areas against their most important source of income risk. We estimate that insurance demand is significantly price sensitive, with an elasticity of around unity. This result suggests that price reductions generated through greater efficiency or competition, or subsidies, would significantly increase take-up, but would not be sufficient to generate widespread diffusion of the risk management product, at least in the short run. Indeed, many farmers do not purchase insurance even when premiums are set significantly below estimated expected payouts. Furthermore, even insurance adopters generally purchase only a single policy, sufficient to cover only a small fraction of mean agricultural income.
Our field experiments and other evidence suggest several non-price frictions that further limit demand: limited trust and understanding of the product, product salience and liquidity constraints. Rainfall insurance markets are still in their infancy, and future improvements in insurance contract design hold the promise to significantly mitigate these frictions. From our results, we draw a number of tentative conclusions about specific changes in contract design that may improve the insurance product’s effectiveness.
First, the price-sensitivity of demand underlines the benefits of developing ways to minimize transactions costs and improve product market competition amongst suppliers of rainfall insurance. It also suggests that government subsidies for rainfall insurance, like those now offered in several Indian states (Giné et al., 2012), would boost participation, although it is not clear whether such subsidies improve overall welfare.
Second, the importance of trust and a history of positive past insurance payouts suggest that product diffusion through the population may be relatively slow until the product develops a track record of paying positive returns during drought periods. A potential design change to facilitate learning would be to amend the contract to pay a positive return with higher frequency. This needs to be weighed, however, against the goal of concentrating payouts in the worst states of nature, when marginal utility of consumption is highest.
An alternative solution could be to target index insurance to a group, such as an entire
24 The role of adverse selection and moral hazard in insurance markets has been the subject of a very large literature, see for example Chiappori and Salanié (2000), Cawley and Philipson (1999) and Rothschild and Stiglitz (1976).
31
village, a producer group or a cooperative, rather than to individuals. The insurance purchase decision would be taken by the group management, who are likely more educated and better able to invest resources to evaluate the product. The group could then decide or pre-arrange how best to allocate funds amongst its members in case of a payout. This alternative approach would reduce marketing costs; furthermore, since these groups are often formed to facilitate purchasing inputs or borrowing money, they may face less binding liquidity constraints.
Third, suggestive evidence of the role of liquidity constraints implies that policies should be designed to provide payouts as quickly as possible, especially during the monsoon when measured discounting of future cashflow is high. For example, payouts from a policy covering the first phase of the monsoon, if paid immediately, could be used to help fund crop replanting later in the monsoon. In practice to date, payouts are not made until after the end of the monsoon, in part because of delays in receiving certified rainfall data from government rainfall stations. ICICI Lombard has begun using automated rain gauges that report rainfall immediately. This in principle should allow payouts to be made more quickly, and also reduce basis risk by increasing the density of rainfall stations. Other changes to ameliorate liquidity constraints could include selling policies at harvest (Duflo, Kremer and Robinson, 2011), combining the product with a short-term loan or, equivalently, originating loans with state-contingent interest rates based on rainfall outcomes.25
We emphasize that our particular treatments are designed to cleanly test the importance of different barriers to demand; they are not necessarily the most scalable or cost-effective delivery methods. For example, the cost of a household visit from a well-trained insurance educator exceeds the usual commission earned from selling a policy. Alternative models, such as selling insurance alongside other financial services, or marketing insurance in a group setting, may be more cost-effective for vendors (Cole, 2007).
In the future, new technologies hold promise to further reduce basis risk and administrative costs. For example, satellite foliage data could be used to offer policies based on area crop yields, and premiums could be collected via mobile payment systems. The innovation already demonstrated by insurers and the potential for further contract improvements suggest that micro-insurance markets hold promise to become a significant channel for pooling important sources of household income risk.
25 Giné and Yang (2009) implement a field experiment in Malawi to test whether bundling insurance with credit increased farmers’ willingness to adopt a new agricultural technology. Unlike a standard loan, a bundled loan would not have to be repaid in case of drought. Uptake among farmers offered the bundled loan was actually lower than for the control group offered a standard loan. One possible explanation is that farmers were already implicitly insured via limited liability in the standard loan and hence did not value the insurance. The lender, however, was unambiguously made better off, and after the experiment was considering expanding the supply of bundled loans to reflect their lower risk.

32
REFERENCES
Allen, Franklin, and Douglas Gale. 1994. Financial Innovation and Risk Sharing. MIT Press, Cambridge MA.
Athanasoulis, Stefano, and Robert Shiller. 2000. “The Significance Of The Market Portfolio.” Review of Financial Studies, 13(2): 301-29.
Athanasoulis, Stefano, and Robert Shiller. 2001. “World Income Components: Measuring and Exploiting Risk-Sharing Opportunities.” American Economic Review, 91(4): 1031-54.
Babbel, David. 1985. “The Price Elasticity of Demand for Whole Life Insurance.” Journal of Finance, 40(1): 225-39.
Babcock, Bruce. 2011. “The Politics and Economics of the U.S. Crop Insurance Program.” in The Intended and Unintended Effects of US Agricultural and Biotechnology Policies, National Bureau of Economic Research.
Bertrand, Marianne, Dean Karlan, Sendhil Mullainathan, Eldar Shafir, and Jonathan Zinman. 2010. “What’s Advertising Content Worth? Evidence from a Consumer Credit Marketing Field Experiment.” Quarterly Journal of Economics, 125(1): 263-305.
Binswanger, Hans P. 1980. “Attitudes toward Risk: Experimental Measurement in Rural India.” American Journal of Agricultural Economics, 62: 395-407.
Bryan, Gharad. 2010. “Ambiguity and Insurance”. London School of Economics, mimeo.
Cai, Hongbin, Yuyu Chen, Hanming Fang, and Li-An Zhou. 2010. “The Effect of Microinsurance on Economic Activities: Evidence from a Randomized Natural Field Experiment.” Working Paper, University of Pennsylvania.
Campbell, John. 2006. “Household Finance.” Journal of Finance, 61(4): 1553-1604.
Campbell, John, and Joao Cocco. 2003. “Household Risk Management and Optimal Mortgage Choice.” Quarterly Journal of Economics, 118(4): 1449-94.
Cawley, John, and Tomas Philipson. 1999. “An Empirical Examination of Information Barriers to Trade in Insurance.” American Economic Review, 89(4): 827-46.
Chiappori, Pierre-André, and Bernard Salanié. 2000. “Testing Asymmetric Information in Insurance Markets.” Journal of Political Economy, 108(1): 56-78.

33
Clarke, Daniel. 2011. “A Theory of Rational Demand for Index Insurance.” Department of Economics Discussion Paper Series 572, University of Oxford.
Cole, Shawn. 2007. “BASIX Teaching Note 5-208-017.” Harvard Business School.
Cole, Shawn, Thomas Sampson, and Bilal Zia. 2011. “Prices or Knowledge? What Drives Demand for Financial Services in Emerging Markets?” Journal of Finance, 66(6): 1933-67.
Cull, Robert, Asli Demirguc-Kunt and Jonathan Morduch. 2009. “Microfinance Meets the Market.” Journal of Economic Perspectives, 23(1): 167-92.
Doherty, Neil and Harris Schlesinger. 1990. “Rational Insurance Purchasing: Consideration of Contract Nonperformance.” Quarterly Journal of Economics, 105(1): 243-253.
Duflo, Esther, Michael Kremer, and Jonathan Robinson. 2011. “Nudging Farmers to Use Fertilizer: Theory and Experimental Evidence from Kenya”. American Economic Review, 101(6): 2350-90.
Fuster, Andreas and Paul S. Willen. 2010. “Insuring Consumption using Income-linked Assets.” Review of Finance, forthcoming.
Gaurav, Sarthak, Shawn Cole, and Jeremy Tobacman. 2011. “Marketing Complex Financial Products in Emerging Markets: Evidence from Rainfall Insurance in India.” Journal of Marketing Research, 48: 150-62.
Giné, Xavier, Lev Menand, Robert Townsend and James Vickery. 2012. “Microinsurance: A Case Study of the Indian Rainfall Index Insurance Market” in Ghate, Chetan (ed.), Handbook of the Indian Economy, Oxford University Press.
Giné, Xavier, Robert Townsend and James Vickery. 2008. “Patterns of Rainfall Insurance Participation in Rural India.” World Bank Economic Review, 22(3): 539-66.
Giné, Xavier and Dean Yang. 2009. “Insurance, Credit and Technology Adoption: Field Experimental Evidence from Malawi.” Journal of Development Economics, 89(1): 1-11.
Goodwin, B. K.. 1993. “An Empirical Analysis of the Demand for Multiple Peril Crop Insurance.” American Journal of Agricultural Economics, 75: 423-34.
Guiso, Luigi, Paola Sapienza and Luigi Zingales. 2008. “Trusting the Stock Market.” Journal of Finance, 63(6): 2557-2600.

34
Hazell, Peter, Jamie Anderson, Niels Balzer, Andreas Hastrup Clemmensen, Ulrich Hess and Francesco Rispoli. 2010. “Potential for scale and sustainability in weather index insurance for agriculture and rural livelihoods.” International Fund for Agricultural Development and World Food Programme. Rome.
Jayachandran, Seema. 2006. “Selling Labor Low: Wage Responses to Productivity Shocks in Developing Countries.” Journal of Political Economy, 114(3): 538-75.
Johnson, Eric, John Hershey, Jaqueline Meszaros, and Howard Kunreuther. 1993. “Framing, Probability Distortions, and Insurance Decisions.” Journal of Risk and Uncertainty, 7(1): 35-51.
Karlan, Dean, Markus Mobius, Tanya Rosenblat and Adam Szeidl. 2009. “Trust and Social Collateral.” Quarterly Journal of Economics, 124(3): 1307-61.
Karlan, Dean and Jonathan Zinman. 2008. “Credit Elasticities in Less-Developed Economies: Implications for Microfinance.” American Economic Review, 98(3): 1040-68.
Lusardi, Annamaria, and Olivia S. Mitchell. 2006. “Financial Literacy and Planning: Implications for Retirement Well-Being.” Working Paper No. 1, Pension Research Council. Available http://www.rand.org/labor/aging/rsi/rsi_papers/2008/lusardi1.pdf
Lusardi, Annamaria and Olivia Mitchell. 2007. “Baby Boomer Retirement Security: The Roles of Planning, Financial Literacy, and Housing Wealth.” Journal of Monetary Economics, 54(1): 205-24.
Maccini, Sharon and Dean Yang. 2009. “Under the Weather: Health, Schooling and Economic Consequences of Early-Life Rainfall.” American Economic Review, 99(3): 1006-1026.
Mittal, Vikas, and William Ross. 1998. “The Impact of Positive and Negative Framing on Issue Interpretation and Risk Taking.” Organizational Behavior and Human Decision Processes, 76(3): 298-324.
Morduch, Jonathan. 1995. “Income Smoothing and Consumption Smoothing.” Journal of Economic Perspectives, 9(3): 103-14.
Pauly, Mark V., Kate H. Withers, Krupa S.Viswanathan, Jean Lemaire, John C. Hershey, Katrina Armstrong, and David A. Asch. 2003. “Price Elasticity of Demand for Term Life Insurance and Adverse Selection.” NBER Working Paper No. 9925.
Paxson, Christina. 1992 “Using Weather Variability to Estimate the Response of Savings to Transitory Income in Thailand.” American Economic Review, 82(1): 15-33.

35
Rampini, Adriano, and S. Viswanathan. 2010. “Collateral, Risk Management, and the Distribution of Debt Capacity.” Journal of Finance, 65(6): 2293-2322.
Reis, Ricardo. 2006. “Inattentive Consumers.” Journal of Monetary Economics, 53(8): 1761-1800.
Rose, Eliana. 1999. “Consumption Smoothing and Excess Female Mortality in Rural India.” Review of Economics and Statistics, 81(1):41-49.
Rosenzweig, Mark R. and Hans P. Binswanger. 1993. “Wealth, Weather Risk and the Profitability of Agricultural Investment.” Economic Journal, 103: 56-78.
Rothschild, Michael and Joseph Stiglitz. 1976. “Equilibrium in Competitive Insurance Markets: An Essay on the Economics of Imperfect Information.” Quarterly Journal of Economics, 90(4): 630-49.
Shiller, Robert. 1998. Macro Markets: Creating Institutions for Managing Society’s Largest Economic Risks. Oxford University Press, New York, NY.
Shiller, Robert. 2008. “Derivatives Markets for Home Prices.” NBER Working Paper 13962.
Townsend, Robert. 1994. “Risk and Insurance in Village India.” Econometrica, 62(3): 539-91.
Tversky, Amos, and Daniel Kahneman. 1981. “The Framing of Decisions and the Psychology of Choice.” Science, 211: 453-58.
Yang, Dean and Hwa Jung Choi. 2007. “Are Remittances Insurance? Evidence from Rainfall Shocks in the Philippines.” World Bank Economic Review, 21(2): 219-248.
Zwane, Alix Peterson, Jonathan Zinman, Eric Van Dusene, William Pariente, Clair Nul, Edward Miguel, Michael Kremer, Dean S. Karlan, Richard Hornbeck, Xavier Giné, Esther Duflo, Florencia Devoto, Bruno Crepon, and Abhijit Banerjee. 2010. “Being Surveyed Can Change Later Behavior and Related Parameter Estimates.” Proceedings of the National Academy of Sciences, 108(5): 1821-1826.

36
VIII. APPENDIX
Variable name Study Area
Definition of variable
Household Size Both Number of individuals (of any age) in the household.Scheduled Caste / Scheduled Tribe Both Dummy variable equal to 1 if household belongs to a scheduled caste or tribe.Muslim Both Dummy variable equal to 1 if household's religion is Muslim.Household head is male Both Dummy variable equal to 1 if the household head is male.Household head 's age Both Age of household head in years.
Risk aversion Both Constructed from the choice over several lotteries as in Binswanger (1980). Assigns value 1 to individualsthat choose the safe lottery, and for those who choose riskier lotteries, indicates the maximum rate atwhich they are revealed to accept additional risk (standard deviation) in return for higher expected return(ΔE / Δrisk). See online appendix for statistics on risk aversion in each sample.
Subjective discount rate Both Discount rate is defined as (X-Xnow)/Xnow where X is the amount that leaves the respondent indifferentbetween Xnow now and X in one month. In AP Xnow is Rs 200 and X can take the following values: Rs201, Rs 205, Rs 210, Rs 220, Rs 240, Rs 260, Rs 300, Rs 400 or Rs 1000. In Gujarat, Xnow is Rs 8and X can take the following values: Rs 7, 8, 9, 10, 11, 12
Above average expected monsoon rain (1=Yes)
Both Dummy variable equal to 1 if household's expectation for monsoon rainfall (relative to past years) is higherthan the average value of the sample as a whole. Elicited before the monsoon.
% cultivated land that is irrigated Both Acres of cultivated land that is irrigated over total owned land. 1% winsorization of each tail.
Wealth Index Both First component of PCA score for a set of dummy variables for each of the following items: tractor,thresher, bullock cart, furniture, bicycle, motorcycle, sewmach, electricity, telephone.
Monthly Per Capita Food Expenditures
Both Total monthly consumption expenditures on food divided by household size. Includes both consumptionfrom own production and expenditures on purchased products. Food items consist of cereals and cerealproducts, pulses and pulse products, milk and milk products, edible oil, vegetables, fruits, meat, fish,chicken and egges, beverages, tobacco, and other food items. 1% winsorization of left and right tail. Since Andra Pradesh figures are reported by the male household head, who does not generally prepare food,estimates may be subject to underreporting.
Total value of all savings deposits Both Value of all deposits with any bank, post office or financial institution. 1% winsorization of left and righttail.
Frequency of insurance payouts in the village (2004 and 2005)
AP Equal to 1 if there were insurance payouts in the village in both 2004 and 2005. Equal to 0.5 if there wasa payout in either 2004 or 2005, but not both. Equals 0 if no payouts in either year.
HH bought rainfall insurance in 2004 (1=Yes)
AP Dummy variable equal to 1 if household bought weather insurance in 2004
Does not know BASIX (1=Yes) AP Dummy variable equal to 1 if respondent does not know BASIX, the insurance providerHousehold has other insurance (1=Yes)
Both Dummy variable equal to 1 if household has other insurances of any type besides rainfall insurance sold byeither BASIX (AP) or SEWA (Gujarat).
Insurance Questions Both Number of correct answers to the hypothetical questions detailed in Table 3, Panel C.Math Questions Gujarat Number of correct answers to the following 8 questions: (1) How much is 4 + 3; (2) If you have 2
Rupees and a friend gives you Rs. 5, how many Rupees do you have?; (3) How much is 35 + 82; (4) Ifyou have Rs. 48 and someone gives you Rs. 58, how much money do you have?; (5) What is 3 times 6?;(6) If you have four friends and would like to give each one four sweets, how many sweets must youhave to give away?; (7) What is one one-tenth of 400?; (8) Suppose you want to buy misti that costs 37Rs. You only have one 100 Rs note. How much change will you get?
Probability Questions Gujarat Number of correct answers to simple probability problems such as "a red bag has 2 black and 5 whitemarbles, a blue bag has 2 black and 10 white marbles, which bag are you more likely to draw a blackmarble from?"
Financial Literacy Gujarat Number of correct answers to the hypothetical questions detailed in Table 3, Panel B.Understanding of millimeters (1=Yes)
AP Dummy variable equal to 1 if respondent correctly measured the distance between two points in ahypothetical ruler. The respondent was shown a plastified paper with a ruler containing the letters A, B,C, D and E, placed in such a way that A was closest from the starting point and E furthest away. Theywere then asked to report the letter located 60mm from the starting point along the ruler.
HH belongs to a water user group (BUA or WUG) group (1=Yes)
AP Dummy variable equal to 1 if any household member belongs to a water user group.
Number of groups that the household belongs to
AP Total number of groups that the household belongs to out of the following: Raithu Mitra group, SHG(women), e.g. DWACRA, Velugu, Sanga Mitra, BUA/WUG, NGO, Education committees, GramPanchayat / any elected body, Caste committees / caste Panchayat, other group.
Familiarity with insurance and BASIX
Technology diffusion and networks
Data Appendix: Definition of Variables
Demographic Characteristics
Utility function
Beliefs about return on insurance
Exposure to risk
Wealth and Consumption
37
Institutional Details Regarding Insurance Policies
Rainfall insurance policies are an example of a weather-based index product; this is simply an insurance contract in which the payout is determined as a function of a publicly observable and contractible index like rainfall, temperature or another climatic parameter.
One advantage of index insurance is that payouts can be calculated and disbursed quickly
and automatically without the need for households to formally file a claim. In addition, index products are free of adverse selection and moral hazard because payouts are based only on publicly observed data rather than on private information reported by the beneficiary. These factors make insurance easier and cheaper to administer, in contrast to traditional indemnity insurance that covers actual losses and thus suffer from asymmetric information problems. On the other hand, index insurance may introduce basis risk, to the extent that the realization of the index is not perfectly correlated with the loss experienced by an individual policyholder.
Index insurance markets are expanding in many emerging market economies (World
Bank, 2005; Skees, 2008). The first Indian rainfall insurance policies were developed by ICICI Lombard, a large general insurer, with technical support from the World Bank (Hess, 2003; Bryla and Syroka, 2007). There are many technical requirements and practical challenges in the design and implementation of a weather index insurance pilot. These are covered in detail in World Bank (2011). The ICICI Lombard product was piloted in 2003 in a semi-arid district of Andhra Pradesh. Over time, rainfall insurance has become more available across many parts of India, and policies are also now underwritten by competing firms, including the government company Agricultural Insurance Company of India (AIC).
Contract design. – Table 1 of the main text presents contract details for the 2006
insurance policies in Andhra Pradesh and the 2007 policies in Gujarat. Policies are underwritten by ICICI Lombard in Andhra Pradesh and by IFFCO-Tokio in Gujarat, though a Swiss reinsurance company provides re-insurance for ICICI Lombard. Payoffs are calculated based on measured rainfall at a nearby weather station maintained by the Indian Meteorological Department (IMD) or at an automated rain gauge operated by a private third-party vendor such as NCMSL.
ICICI Lombard policies divide the monsoon season, known as the “Kharif”, into three
contiguous phases of 35-45 days, corresponding to sowing, flowering, and harvest.26,27 Separate
26 Since monsoon onset varies across years, the start of the first phase is defined as the day in June when accumulated rainfall since June 1 exceeds 50mm. If <50mm of rain falls in June, the first phase begins automatically on July 1.
27 The three phase ICICI Lombard contract was designed in 2004 in an attempt to simplify the initial 2003 contract. The 2003 product was based on an index that weighted each day differently to maximize the correlation between yields and rainfall. It was hard to market because it was difficult to understand. The 2004 payoff structure is based on crop models. Lack of rainfall is critical during planting and vegetative growth (Phases I and II), but yields are not much affected by lack of rainfall during the harvest (Phase III). However, excess rainfall during that period can destroy the harvest, and as a result, Phase III covers excess rainfall (World Bank 2011).

38
policies are sold for each phase at a premium between Rs. 80 and Rs. 120 ($2-3 US).28 A policy covering all three phases (column “Combined Premium”) costs Rs. 260 to Rs. 340 ($6-8 US), including a Rs. 10 discount. IFFCO-Tokio policies are based on cumulative rainfall over the entire monsoon season (defined as June 1 to August 31) at government rainfall stations. Policy premiums are lower, between Rs. 44 and Rs. 86 ($1-2 US), reflecting a commitment to make policies accessible to even the poorest households. Households in both regions were free to purchase any whole number of policies as desired.
Each insurance contract specifies a threshold amount of rainfall, designed to approximate
the minimum required for successful crop growth. As an example, the Phase I ICICI Lombard policy in Mahbubnagar pays zero when cumulative rainfall during the 35-day coverage phase exceeds the strike of 70mm. Payouts are then linear in the rainfall deficit relative to this threshold, jumping to Rs. 1000 when cumulative rainfall is below the exit of 10mm, meant to correspond approximately to a point of crop failure. Thus an Anantapur Phase I policy would pay Rs. 30 for a realized rainfall of 27 mm. IFFCO-Tokio policies have a similar structure, paying out whenever rainfall during the entire monsoon season is at least 40 percent below a specified average level for that district (normal rain).
The exception to this basic structure is the Phase III ICICI Lombard contracts, which
cover the harvest, and pay off when rainfall is excessively high (rather than low), to insure against flood or excess rain that damages crops (see World Bank, 2011). The policies were designed by the insurance companies, in consultation with BASIX in AP and SEWA in Gujarat.
Marketing – Indian rainfall insurance underwriters do not generally sell insurance
policies directly. Instead they use brokers, or partner with local financial institutions in each rural area, which have well-established networks for the provision of financial services to rural households.29
An important advantage of rainfall insurance is that payouts are calculated automatically
by the insurer based on measured rainfall: households do not need to file a claim or provide proof of loss. This significantly reduces administrative expenses. Since all policies linked to a given rainfall station pay out the same amount, disbursal of payment is also relatively simple: the distributor (BASIX or SEWA) announces in advance it will visit a village, and pays all claimants in a single day. Any policy-members unable to collect their payments that day may collect them from the NGO subsequently.
Actuarial values, observed payouts and pricing. – For four policies in Table 1 of the main
text, we calculate a simple measure of expected payouts, using historical rainfall data. Historical daily rainfall data is available from 1970-2006 for the Andhra Pradesh contracts, and from 1965- 28 As a point of reference, the average daily wage for agricultural laborers in our survey areas at the time of the study is around Rs. 50, although the incomes of landed farmers and more skilled workers are significantly higher.
29 Thanks to the 2005 Insurance Regulatory and Development Authority (IRDA) regulations, non-governmental organizations, microfinance institution and self-help groups are legally recognized as micro-insurance agents, thus increasing the potential for coverage (IRDA, 2005).

39
2003 for the Gujarat contracts. These data are not available for three Andhra Pradesh stations, where payouts are based on automated rain gauges, or for Anand in Gujarat.
Table 1 also reports the standard error of the expected payout. We note that individuals
may have difficulty assessing the value of the policies because probabilities are often misjudged (Kahneman and Tversky, 1979 and Barseghyan, Molinari, O’Donoghue and Teitelbaum, 2011) and because information about expected payouts and standard errors was not provided during marketing.
In addition, this simple method likely misstates the true value of the insurance policy, as
it does not correctly measure the frequency of low-probability events. The distribution of insurance returns on ICICI Lombard rainfall insurance contracts is highly skewed. Analyzing a large sample of policies, Giné et al. (2007) show policy-holders obtain a positive return in only 11 percent of phases, and that the maximum return, observed in about 1 percent of phases, is 900 percent. Clarke et al. (2012) discuss insurance pricing in India in greater detail.
Using administrative data for all policies sold by BASIX in Andhra Pradesh from 2003 to
2009, Giné et al. (2012) find an average ratio of total insurance payouts to total premiums of 138 percent. The difference between this figure and our historical estimated return may reflect unusual shocks such as the severe drought of 2009. They may also reflect structural changes such as greater monsoon volatility (Goswami et al., 2006), although given the limited existing history of rainfall data and the skewness of the insurance return distribution, statistical tests of structural change are unlikely to be sufficiently powerful to detect changes.

40
No No No No No 112
No Yes No No No 235
Yes No No Yes No 67
Yes No No Yes Yes 45
Yes No No No Yes 45
Yes No No No No 69
Yes Yes No Yes Yes 57
Yes Yes No Yes No 62
Yes Yes No No Yes 56
Yes Yes No No No 61
Yes Yes Yes Yes Yes 54
Yes Yes Yes No Yes 45
Yes Yes Yes Yes No 65
Yes Yes Yes No No 74
Total sample 1,047
Sample Size
Appendix Table 1. Study Design, Andhra Pradesh
This table describes the experimental design for Andhra Pradesh in 2006. Study villages werefirst randomly assigned to two groups: those in which no endorsement visits would take placeand those in which half of the visits would be endorsed. Households assigned a marketing visitin no-endorsement villages were randomly assigned one of four possible combinations ofmarketing treatments (education module x high reward), while households that received amarketing visit in endorsement villages were assigned one of eight possible combinations(endorsement x education module x high reward).
Individual Treatment
VisitVillage
EndorsedHousehold Endorsed
Education Module
High Reward

41
Group 1: Flyer TreatmentsGroup Individual/Group Religion1A Individual Neutral 3781B Individual Muslim 4381C Individual Hindu 4161D Group Neutral 3681E Group Muslim 3981F Group Hindu 393
Total sample 2,391
Group 2: Video--Surveyed Respondents in New Treatment VillagesSurveyed Households Sample sizeGroup Payouts Frame2A 8/10 no Safety 752B 8/10 no Vulnerability 812C 2/10 yes Safety 782D 2/10 yes Vulnerability 81
Total sample 315
Group 3: Video--Non-Surveyed Respondents in New Treatment VillagesGroup SEWA Brand Peer / Authority Payouts3A Yes Peer 8/10 no 1243B No Peer 8/10 no 1263C Yes Authority 8/10 no 1503D No Authority 8/10 no 1313E Yes Peer 2/10 yes 1373F No Peer 2/10 yes 1353G Yes Authority 2/10 yes 1473H No Authority 2/10 yes 150
Total sample 1,100
Discounts (All Video Households)D1 Rs. 5 566 D2 Rs. 10 566 D3 Rs. 20 283
Total sample 1,415
Appendix Table 2. Study Design, GujaratThis table describes the experimental design for Gujarat in 2007. Households in the 21villages which were offered insurance for the first time in 2007 received video treatments.Households receiving video treatments that were in the original survey sample were shownone of four videos; other households were shown one of eight different videos. Allhouseholds observing videos were offered a discount of either Rs. 5, 10, or 20 on their firstpolicy. Households in the 30 villages where insurance was offered in both 2006 and 2007were given one of six flyers.

42
Heads Tails ΔE / ΔriskPercent choosing this lottery 2006
25 25 1.00 10.3%20 60 0.75 25.6%15 80 0.60 18.0%10 95 0.50 25.3%5 105 0.33 11.0%0 110 0.00 9.9%
Average ΔE / Δrisk 0.57
Heads Tails ΔE / ΔriskMain Sample
(N=1500)25 25 1.00 14.0%22 47 0.76 12.3%20 60 0.73 15.4%17 63 0.72 15.6%15 75 0.71 9.3%10 80 0.58 15.6%5 95 0.45 7.9%0 100 0 9.9%
Average ΔE / Δrisk 0.42
Appendix Table 3. Binswanger Lotteries
Andhra Pradesh
Gujarat
This table describes the Binswanger Lotteries used to measure risk aversionamongst sample groups in Andhra Pradesh and Gujarat. Each respondentchose one of the listed lotteries, which increased in risk and expected value.Our measure of risk aversion assigns a value of 1 to those who choose thesafe lottery and, for those who choose riskier lotteries, indicates themaximum rate at which they are revealed to accept additional risk (standarddeviation) in return for higher expected return.


![STATE COUNCIL FOR OPEN AND LIFELONG EDUCATION - …scolekerala.org/pdf/Orientaionforms2019-211stYr.pdf · STATE COUNCIL FOR OPEN AND LIFELONG EDUCATION - KERALA [SCOLE-Kerala] [Formerly](https://img.pdfslide.us/doc/110x75/5e6c7b91fe93c0147a61d723/state-council-for-open-and-lifelong-education-state-council-for-open-and-lifelong.jpg)