Embed Size (px)
Citation preview
Barriers to advancing the science and practice of marketingAndrew Scott Barona, Gerald Zaltmanb,c and Jerry Olsonc,d
aDepartment of Psychology and Affiliate at the National Core for Neuroethics, University of BritishColumbia, Vancouver, BC, Canada; bHarvard Business School, Cambridge, MA, USA; cOlson ZaltmanAssociates, Pittsburgh, PA, USA; dPenn State University, State College, PA, USA
ABSTRACTFrom focus groups to clinical interviews to cognitive, neurologicaland biological approaches, market research borrows heavily from thebehavioural sciences. Borrowing ideas and methods from other dis-ciplines, often with adaptations, while clearly valuable, also brings asignificant risk of ‘getting it wrong’. Problems arise when researchersdo not follow best practices carefully developed in the originatingdiscipline. To maintain competitive advantage, marketing research-ers often ‘black box’ the details of how they apply those proceduresof method design and analysis. This lack of transparency provideslittle evidence that best practices are followed. This, in turn, raisesquestions about the validity and reliability of the resulting insightsand their implications. To illustrate this issue, we examine twodomains where there is strong evidence to suggest that currentpractices are not best (or even good) practices – implicit associationtesting and neuroscience.
KEYWORDSCognitive science;marketing; marketingresearch; implicit associationtesting; neuromarketing;consumer cognition
Introduction
Advances in the marketing discipline depend on the quality of the ideas and methods itemploys and how they are implemented by managers. Reflecting its applied orientation,the marketing discipline may be unique in how much it relies on advances made inother fields. Indeed, marketing borrows theories, concepts and methods extensivelyfrom the social sciences such as psychology, anthropology, sociology and linguistics,from the natural sciences such as neuroscience and biology and from economics,statistics and mathematics.
Marketing’s practice of borrowing ideas and methodologies from many disciplines iscommendable and even essential. However, a serious problem arises when thefoundational principles and methodological rigour developed in the originatingdiscipline are not carried over. Being careful borrowers also requires being transparentabout our use of ideas and methods to ensure they are properly applied (Varan, Lang,Barwise, Weber, & Bellman, 2015). Of course, the importance of transparency is not new.For example, after others wrote extensively about the importance of transparency indata analysis to guard against the frequent practice of p-hacking or significance hacking
CONTACT Andrew Scott Baron [email protected] Department of Psychology, University of BritishColumbia, 2136 West Mall, Vancouver, BC V6T1Z4, Canada
JOURNAL OF MARKETING MANAGEMENT, 2017https://doi.org/10.1080/0267257X.2017.1323839
© 2017 Westburn Publishers Ltd.
in published studies (Errington et al., 2014; Fanelli, 2010; Ioannidis, Munafo, Fusar-Poli,Nosek, & David, 2014; Klein et al., 2014; Miguel et al., 2014; OSF, 2015; Simonsohn,Nelson, & Simmons, 2014; Simonsohn, Simmons, & Nelson, 2015; Vogel, 2011), manymajor academic journals adopted safeguards against this behaviour by requiring thereporting of different statistics and the preregistration of study methods and analyticapproaches.
The lack of transparency in marketing research is especially obvious when researchersturn already difficult-to-understand methodologies into proprietary black boxes thathide critical design and analysis decisions essential to ensuring the validity of theresults. Indeed, the lack of opacity is likely why the issues that led to the ‘crisis insocial neuroscience’ in the late 2000s (Vul, Harris, Winkielman, & Pashler, 2009) appear toplague the growing field of neuromarketing.
In this paper, we explore this problem with examples drawn from neuromarketing.Specifically, we examine two increasingly popular and potentially valuable methodologiesborrowed by market researchers – implicit association testing and neuroimaging. Weselect these tools because of their rapid rise in use over the past decade among bothresearchers and practitioners. Unfortunately, despite a robust academic literature thatidentifies best practices in research design and data analytic procedures, marketersoften ignore such guidelines, compromising the integrity of marketing science and themanagerial actions that result. Finally, we provide strategic recommendations forresearchers and practitioners when utilising these methods.
Measuring implicit associations
Implicit association testing is frequently used to measure consumers’ more automatic,uncontrolled thoughts and feelings regarding brands and products. Its popularity stemslargely from the finding that such responses are difficult to fake, are not subject to socialdesirability concerns and thus able to capture elusive ‘System 1’ thinking (Kahneman,2011). In academic research, the most common approach to measuring implicitassociations is to use variants of the implicit association test (IAT; Greenwald, McGhee,& Schwartz, 1998; Karpinski & Hilton, 2001; Nosek et al., 2007; Sriram & Greenwald, 2009),the affect misattribution procedure (AMP; Payne, Cheng, Govorun, & Stewart, 2005) orSemantic Priming (Meyer & Schvaneveldt, 1971). In addition, practitioners often employtheir own proprietary adaptations of these methods. These reinvented methods areapplied to a variety of marketing issues such as brand tracking, concept evaluation andcopy testing. However, these methods are often developed without independent peerreview and used without the transparency necessary to enable other researchers andmanagers to answer important questions such as
Is the particular method appropriate for the marketing issue at hand?Is the method being used appropriately?What is the evidence for answering these first two questions?
As we will demonstrate, it is very easy to compromise the reliability and validity ofany method when it is adapted to different marketing problems and theoretical issues.This possibility, of course, is not unique to the marketing discipline.
2 A. S. BARON ET AL.
The Implicit Association Test
Let us consider the IAT (Greenwald et al., 1998), perhaps the most popular tool formeasuring unconscious associations. The IAT has been used globally in hundreds ofpeer-reviewed studies conducted in dozens of independent laboratories over the pasttwo decades. To ensure validity and reliability, best practices in design and analyticprocedures have evolved and are now well established (e.g. Cvencek, Greenwald, Brown,Snowden, & Gray, 2010; Greenwald & Nosek, 2001; Greenwald, Nosek, & Banaji, 2003;Lane, Banaji, Nosek, & Greenwald, 2007; Nosek, Bar-Anan, Sriram, Axt, & Greenwald,2014; Nosek, Greenwald, & Banaji, 2005, 2007; Sherman et al., 2008).
The logic of the IAT is simple. The stronger two concepts are associated in the mind, thefaster and more accurate it is for that person to pair them together. For example, mostpeople more strongly associate doctors with nurses than they do bananas with pillows.The IAT was designed to measure the strength of such associations. A demonstration ofthis basic method can be found at www.implicit.harvard.edu.
In marketing, the IAT is frequently used to measure how strongly consumersunconsciously prefer various brands (for a general review, see Brunel, Tietje, &Greenwald, 2004; Greenwald, Poehlman, Uhlmann, & Banaji, 2009; Maison, Greenwald,& Bruin, 2004; Ratliff, Swinkels, Klerx, & Nosek, 2012) or how advertising impacts brandevaluation (e.g. Venkatraman et al., 2015). Following is an example involving brandpreference for Apple versus Samsung and how a properly designed IAT would work.
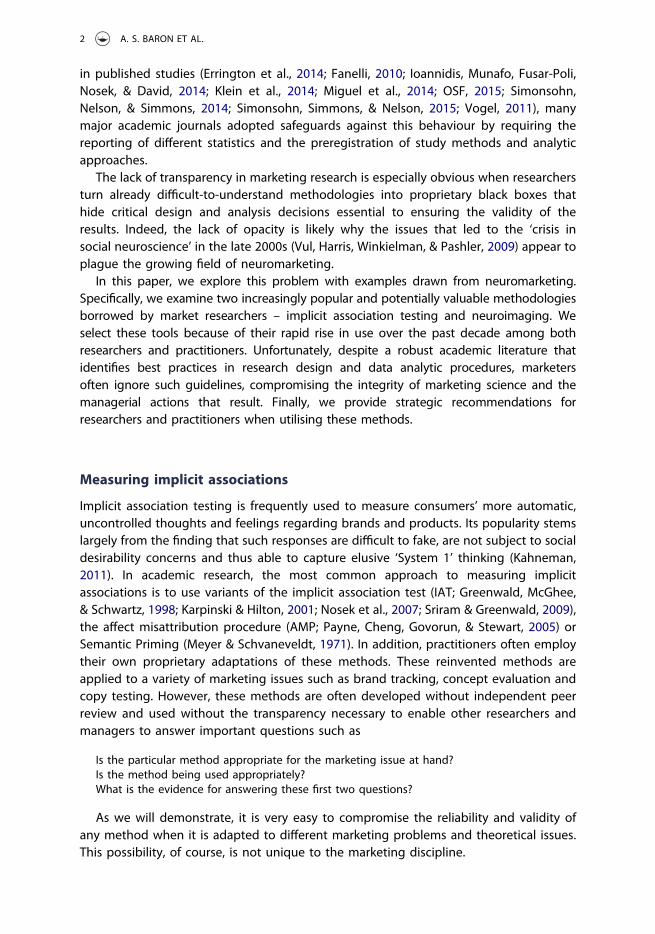
Participants begin by using two response keys to sort product images into two categories(e.g. left key for Apple products and right key for Samsung products; see Figure 1(a)). Theproduct images appear one at a time in themiddle of a computer screen for a series of trials.For each trial, participants must decide if the image that just appeared is an Apple productor a Samsung product. Next, participants similarly practise sortingwords into two categories(e.g. left key for positive words and right key for negative words, see Figure 1(b)). Again,these words appear one at a time in the middle of the screen for a series of trials.
Figure 1. Participants begin by sorting product images into two categories (Apple products andSamsung products) using two response keys (a). These images appear one at a time in the middle ofthe screen for typically 20 trials. Category labels are placed on the left and right side of the screen toremind participants which button to press (left or right key) in response to the stimuli that appear inthe middle of the screen. In (b), participants practise sorting words into two categories (positive andnegative) using the same two response keys. These words are also presented one at a time in themiddle of the screen for typically 20 trials.
JOURNAL OF MARKETING MANAGEMENT 3
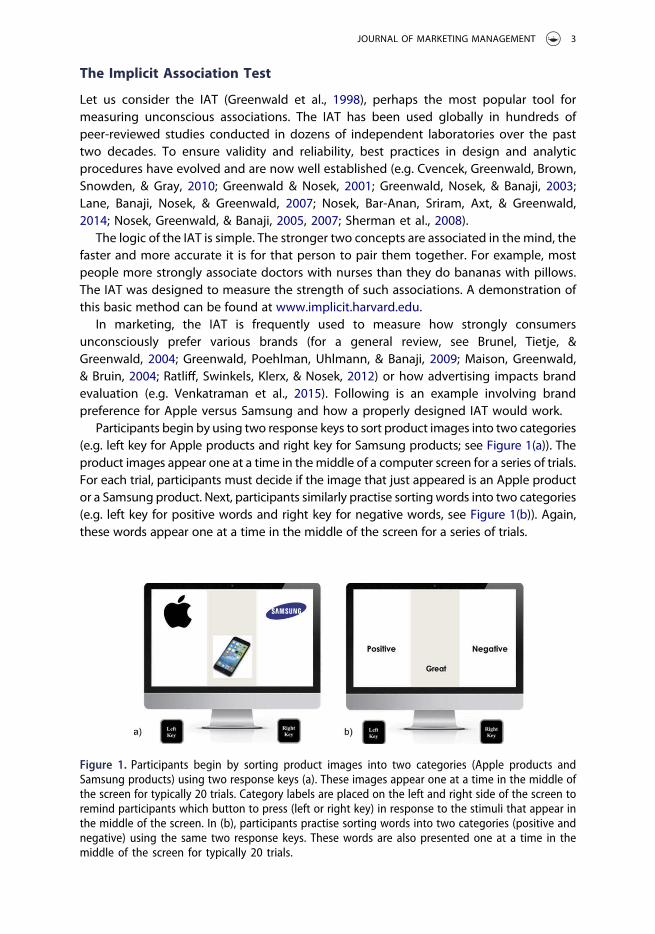
After this warm up phase to learn the task and begin thinking about the brands,participants complete two blocks of ‘critical trials’ in which they are asked to sortproduct images and positive and negative words using the same left and rightresponse keys as before. During these critical trials, product images and good andbad words are presented on alternating trials. For one block of critical trials (typically40–60 trials), participants are asked to press the left key any time an image of an Appleproduct or a positive word appears in the middle of the screen (and to press the rightkey anytime an image of a Samsung product or a negative word appears in the middleof the screen (see Figure 2(a)). For the other block of critical trials, the brands switchsides (see Figure 2(b)). Now, the left key is used to respond to Samsung products andto positive words and the right key is used to respond to Apple products and tonegative words.1 To help remind participants which buttons to press for each stimulus(left or right key), category labels are positioned on the left- and right-hand side of thescreen.
The IAT calculates how quickly and accurately people can pair positive and negativewords with each brand. The stronger the preference for Apple over Samsung, forexample, the faster and more accurate participants will be to respond on trials whenApple products and positive words share the same response key (and Samsungproducts and negative words share the same response key). The logic is simple. Theeasier it is to pair ideas in mind, the easier (measured by speed and accuracy) it will beto pair those ideas together on a keyboard. Because reaction time measures can be‘noisy’ (e.g. a response on a single trial might be influenced by unexpected events likea sneeze), it is necessary to average data over many trials, with best practices callingfor anywhere from 80 to 120 per respondent. When following best practices, this toolcan quantify how strongly consumers unconsciously (implicitly) prefer one brand overanother.
Figure 2. After getting familiar with the task, participants complete two blocks of ‘critical trials’. In(a), participants rapidly classify images of Apple products and positive words using the left key andthey similarly classify images of Samsung products and negative words using the right key. For thesecond block of critical trials (b), the pairings reverse. Now, Images of Samsung products andpositive words are classified with the left key and images of Apple products and negative words areclassified with the right key. For each ‘critical block’, there are typically 40–60 trials.
4 A. S. BARON ET AL.
As with most methods, small, seemingly minor modifications in how the IAT is usedcan diminish its accuracy and legitimacy. Psychologists, over many studies, havedeveloped best practice guidelines for the IAT necessary to achieve reliable and validresults. Among them are well-established criteria for the number of trials (pairings)needed in an IAT (80–120 critical trials), which in turn also limits the number ofdifferent associations that can be measured per participant in a single session. Inaddition, substantial research underscores the importance of selecting the ‘right’language to capture the key associations of strategic interest. Regarding this latterpoint, Mitchell et al. (2003) demonstrated how implicit race bias towards European-American and Africa-American people differed dramatically depending on whether thelight-skinned and dark-skinned faces used as stimuli were labelled African-American andEuropean-American or as athlete and politician. While the same faces were presentedacross both conditions, participants nonetheless showed a strong preference for light-skinned faces when the labels referred to race and a stronger preference for dark-skinned faces when the labels represented an occupation. In our branded exampleabove, this would mean that we might expect different results if instead of using thecategory labels Apple and Samsung, we used labels such as American products andKorean products while participants responded to the same product images. Marketingresearchers using the IAT should select stimulus labels that are relevant to the studygoals and that are meaningful to participants. This does not always happen.
A recent study (Venkatraman et al., 2015) illustrates some of the consequences of notfollowing the established guidelines for using the IAT. This effort sought to assess thestrengths and weaknesses of several methods for predicting advertising success, animportant goal. The authors used the IAT to measure how strongly participantsevaluated (positively or negatively) 37 ads, most of which were for branded consumerpackage goods. The study explored whether the strength of ad preference as measuredby the IAT predicted the marketplace success of the ad as measured by severalperformance metrics.
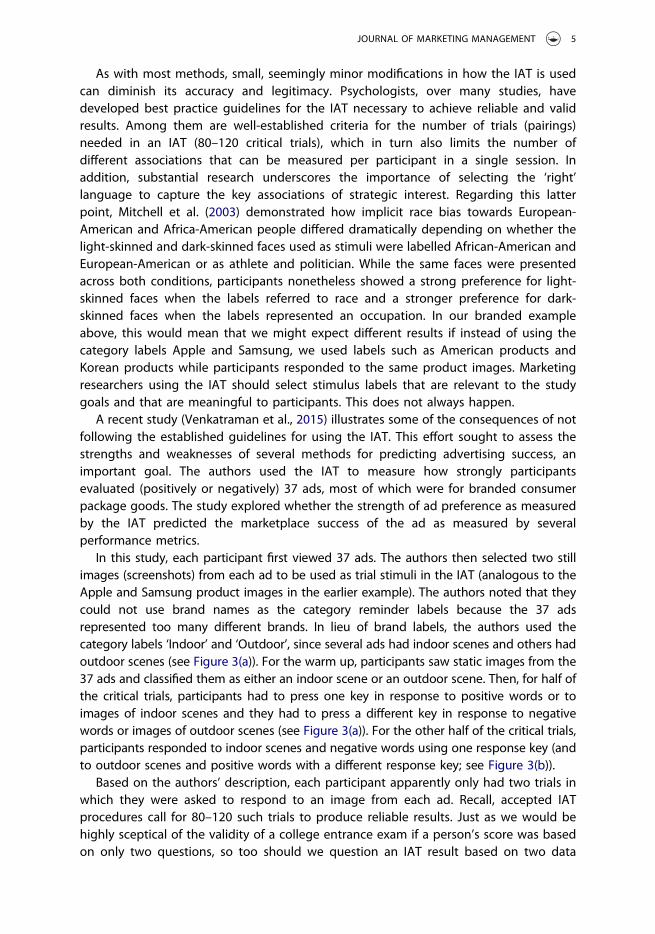
In this study, each participant first viewed 37 ads. The authors then selected two stillimages (screenshots) from each ad to be used as trial stimuli in the IAT (analogous to theApple and Samsung product images in the earlier example). The authors noted that theycould not use brand names as the category reminder labels because the 37 adsrepresented too many different brands. In lieu of brand labels, the authors used thecategory labels ‘Indoor’ and ‘Outdoor’, since several ads had indoor scenes and others hadoutdoor scenes (see Figure 3(a)). For the warm up, participants saw static images from the37 ads and classified them as either an indoor scene or an outdoor scene. Then, for half ofthe critical trials, participants had to press one key in response to positive words or toimages of indoor scenes and they had to press a different key in response to negativewords or images of outdoor scenes (see Figure 3(a)). For the other half of the critical trials,participants responded to indoor scenes and negative words using one response key (andto outdoor scenes and positive words with a different response key; see Figure 3(b)).
Based on the authors’ description, each participant apparently only had two trials inwhich they were asked to respond to an image from each ad. Recall, accepted IATprocedures call for 80–120 such trials to produce reliable results. Just as we would behighly sceptical of the validity of a college entrance exam if a person’s score was basedon only two questions, so too should we question an IAT result based on two data
JOURNAL OF MARKETING MANAGEMENT 5
points for measuring an individual ad’s association. Further, to our earlier point aboutthe importance of getting the ‘right’ language, by not using brand names, conclusionscan only be drawn about whether participants evaluated indoor scenes used in adsmore (or less) positively than outdoor scenes. Nothing can be learned here about howads affect brand associations, which was the central issue of interest.
Affect Misattribution Procedure (AMP)
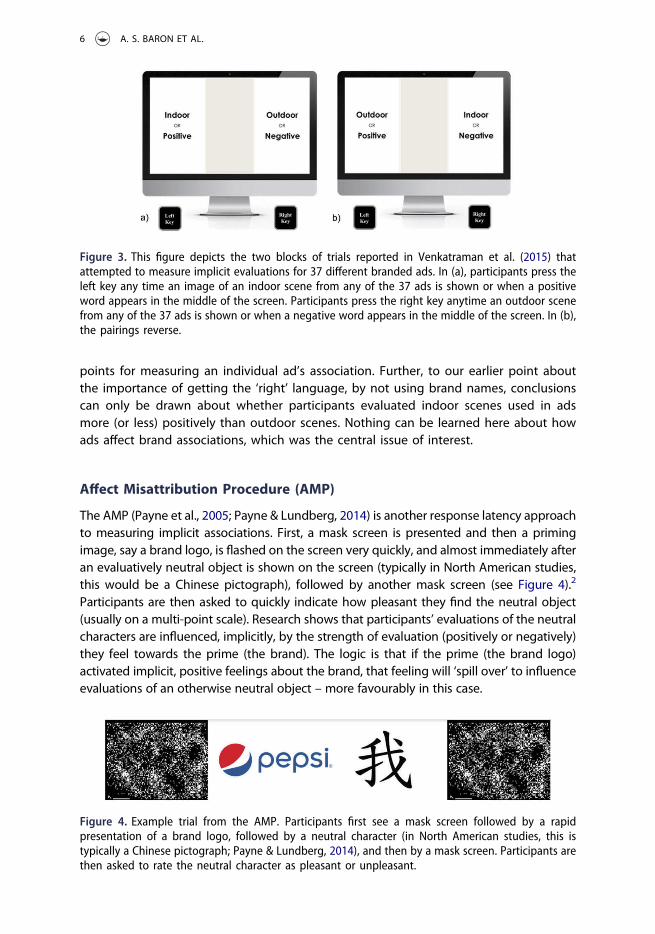
The AMP (Payne et al., 2005; Payne & Lundberg, 2014) is another response latency approachto measuring implicit associations. First, a mask screen is presented and then a primingimage, say a brand logo, is flashed on the screen very quickly, and almost immediately afteran evaluatively neutral object is shown on the screen (typically in North American studies,this would be a Chinese pictograph), followed by another mask screen (see Figure 4).2
Participants are then asked to quickly indicate how pleasant they find the neutral object(usually on a multi-point scale). Research shows that participants’ evaluations of the neutralcharacters are influenced, implicitly, by the strength of evaluation (positively or negatively)they feel towards the prime (the brand). The logic is that if the prime (the brand logo)activated implicit, positive feelings about the brand, that feeling will ‘spill over’ to influenceevaluations of an otherwise neutral object – more favourably in this case.
Figure 3. This figure depicts the two blocks of trials reported in Venkatraman et al. (2015) thatattempted to measure implicit evaluations for 37 different branded ads. In (a), participants press theleft key any time an image of an indoor scene from any of the 37 ads is shown or when a positiveword appears in the middle of the screen. Participants press the right key anytime an outdoor scenefrom any of the 37 ads is shown or when a negative word appears in the middle of the screen. In (b),the pairings reverse.
Figure 4. Example trial from the AMP. Participants first see a mask screen followed by a rapidpresentation of a brand logo, followed by a neutral character (in North American studies, this istypically a Chinese pictograph; Payne & Lundberg, 2014), and then by a mask screen. Participants arethen asked to rate the neutral character as pleasant or unpleasant.
6 A. S. BARON ET AL.
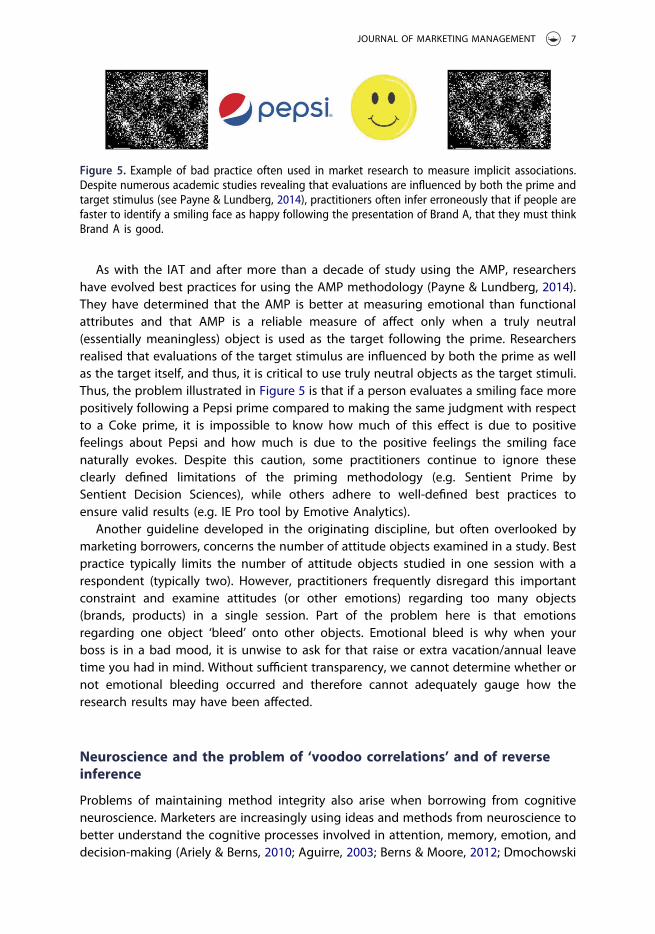
As with the IAT and after more than a decade of study using the AMP, researchershave evolved best practices for using the AMP methodology (Payne & Lundberg, 2014).They have determined that the AMP is better at measuring emotional than functionalattributes and that AMP is a reliable measure of affect only when a truly neutral(essentially meaningless) object is used as the target following the prime. Researchersrealised that evaluations of the target stimulus are influenced by both the prime as wellas the target itself, and thus, it is critical to use truly neutral objects as the target stimuli.Thus, the problem illustrated in Figure 5 is that if a person evaluates a smiling face morepositively following a Pepsi prime compared to making the same judgment with respectto a Coke prime, it is impossible to know how much of this effect is due to positivefeelings about Pepsi and how much is due to the positive feelings the smiling facenaturally evokes. Despite this caution, some practitioners continue to ignore theseclearly defined limitations of the priming methodology (e.g. Sentient Prime bySentient Decision Sciences), while others adhere to well-defined best practices toensure valid results (e.g. IE Pro tool by Emotive Analytics).
Another guideline developed in the originating discipline, but often overlooked bymarketing borrowers, concerns the number of attitude objects examined in a study. Bestpractice typically limits the number of attitude objects studied in one session with arespondent (typically two). However, practitioners frequently disregard this importantconstraint and examine attitudes (or other emotions) regarding too many objects(brands, products) in a single session. Part of the problem here is that emotionsregarding one object ‘bleed’ onto other objects. Emotional bleed is why when yourboss is in a bad mood, it is unwise to ask for that raise or extra vacation/annual leavetime you had in mind. Without sufficient transparency, we cannot determine whether ornot emotional bleeding occurred and therefore cannot adequately gauge how theresearch results may have been affected.
Neuroscience and the problem of ‘voodoo correlations’ and of reverseinference
Problems of maintaining method integrity also arise when borrowing from cognitiveneuroscience. Marketers are increasingly using ideas and methods from neuroscience tobetter understand the cognitive processes involved in attention, memory, emotion, anddecision-making (Ariely & Berns, 2010; Aguirre, 2003; Berns & Moore, 2012; Dmochowski
Figure 5. Example of bad practice often used in market research to measure implicit associations.Despite numerous academic studies revealing that evaluations are influenced by both the prime andtarget stimulus (see Payne & Lundberg, 2014), practitioners often infer erroneously that if people arefaster to identify a smiling face as happy following the presentation of Brand A, that they must thinkBrand A is good.
JOURNAL OF MARKETING MANAGEMENT 7
et al., 2014; Dmochowski, Sajda, Dias, & Parra, 2012; Gabrieli, Ghosh, & Whitfield-Gabrieli,2015; Karmarkar & Yoon, 2016; Plassmann, Venkatraman, Huettel, & Yoon, 2015; Poldracket al., 2011; Poldrack & Yarkoni, 2016; Turk et al., 2011; Winkielman & Cacioppo, 2001;Zaltman, 2003). The initial allure of methods like fMRI and EEG was partly fuelled by afalse hope that we could locate the infamous ‘buy button’ and by studies reportingpuzzlingly high correlations between patterns of brain activation and behaviour(sometimes called ‘voodoo correlations’) (Vul et al., 2009; Vul & Kanwisher, 2010; Vul &Pashler, 2012). Underlying this early belief was the view by some that brain activationsare somehow more valid and/or diagnostic of what a person really thinks than whatother means such as questionnaires or behavioural measures provide.
Another early intuition that fed the buy button belief was that a given thought orfeeling produced a unique pattern of brain activation such that one could conclude thata particular pattern of brain activation was necessarily due only to the presentedstimulus. This is the problem of reverse inference which has frequently led to falseconclusions in neuroscience studies (Henson, 2006; Plassmann et al., 2015; Poldrack,2006; Poldrack & Wagner, 2004). Despite these well-documented problems and theexistence of strict rules to prevent their occurrence among cognitive neuroscientists,the same problems appear frequently in market research when these methods areborrowed without also adopting best practices for eliminating their occurrence.
Below, we provide examples of ‘voodoo’ correlations and unsubstantiated reverseinferences, highlighting why it is essential for researchers and practitioners to be transparentabout their design details and analytic approaches. Doing so ensures that research users canhave confidence in their data and the marketing decisions these data inform.
Neuroscience and the problem of voodoo correlations
Many peer-reviewed academic papers and industry white papers using neuroscienceapproaches have reported surprisingly high correlations between patterns of brainactivity and measures of behaviour. These correlations are as high as .7, .8, and even.9 (e.g. see Vul et al., 2009). Although correlations don’t imply causation, the beliefpersists, based on such correlations, that we might predict with 70%, 80%, or even 90%accuracy what consumers will do based on observed patterns of brain activationinvolving fMRI, EEG, etc. when viewing, for example, a print or video ad. Concernsabout this interpretation have been expressed (Kriegeskorte, Simmons, Bellgowan, &Baker, 2009; Plassmann et al., 2015; Poldrack, 2006; Poldrack & Wagner, 2004; Vul et al.,2009; Yarkoni, Poldrack, Nichols, Van Essen, & Wager, 2011). When unusually highcorrelations are re-analysed using proper analytic procedures, the correlations oftenturned out to be much smaller than previously thought or disappeared outright,indicating that no valid, replicable, generalisable relationship existed in the first place.
The voodoo correlation problem has major implications for drawing conclusions aboutthe mind. The basic issue concerns how, mathematically, correlations are calculated. Themaximum correlation between two variables A and B is limited by the reliability of eachmeasure of A and B (Nunnally, 1970; Vul et al., 2009). This is captured by the formula:
rðObservedA; ObservedBÞ¼rA;B � sqrt ReliabilityA � ReliabilityBð Þ
8 A. S. BARON ET AL.

That is, the correlation between two measures can never exceed the product of thereliability of those two measures. With respect to neuroscience measures, a problem ariseswhen researchers select, a posteriori, only those brain regions that were most active duringthe experiment (at the exclusion of other areas that were less active). When this practiceoccurs, it can mistakenly produce an overestimate of the true reliability of the (fMRI or EEG)signal in general, resulting in artificially high correlations. Indeed, as Vul and colleagues note(2009), when a particular pattern of brain activity is used to identify brain regions of interesta posteriori and then is also used to assess how that pattern correlates with anothermeasure, the resulting correlations will be inflated (see Vul et al., 2009, for a morethorough description of this issue). This is the problem of non-independence of data.
Indeed, neuromarketing is particularly susceptible to the non-independence-of-dataproblem because the stimuli tested are often novel (ads, brand messaging, logos) andthus there is little or no basis for a priori hypothesising about expected patterns of brainactivation. As such, researchers end up having to conduct exploratory analyses withthese data (e.g. looking to anywhere in the brain that seems more active during a task –and for arbitrary reasons, there will almost always be some area that’s more active – andthen selecting that area to conduct all the analyses within). When this area is thenselected on the basis of its prior activity to correlate with another measure (e.g. actualbehaviour), this can lead to overestimating the correlation between those two measuresand thus lead to Type 1 errors (thinking a result is significant when it is not). It is forthese reasons we should be particularly sceptical of claims reporting ‘an unprecedentedability to predict advertising success’ based on neuroscience methods with 70% or 80%accuracy.3 Indeed, a meta-analysis by Varan and colleagues (2015), of the reliability ofvarious neuromarketing measures, suggests that such high correlations with behaviourare mathematically unlikely if not impossible to observe (see also Kong et al., 2007).Thus, any claim that consumers’ behaviour can be predicted with incredible accuracyfrom neuroscience measures alone should be met with an equal or greater amount ofscepticism because the best scientific practices simply do not support such wild claims.
To avoid these and related problems (e.g. multi-collinearity), cognitive neuroscientistshave developed best practices including full transparency regarding design and dataanalysis (e.g. whole brain analysis, region of interest [ROIs], multiple corrections, clusteror individual voxels, independence/non-independence of data, Bayesian statistics, meta-analytics, principled multivariate analyses, test–retest reliability scores of a specificpattern of brain activation, controls for the heterogeneity of signal responseselectivity, use of classifiers, multi-voxel pattern analysis [mvpa] and representationalsimilarity analysis [RSA], to name a few) (see Charest, Kievit, Schmitz, Deca, &Kriegeskorte, 2014; Poldrack, 2006; Poldrack & Farah, 2015; Poldrack & Yarkoni, 2016;Schulz, Zherdin, Tiemann, Plant, & Ploner, 2012; Vul et al., 2009; Vul & Kanwisher, 2010;Vul & Pashler, 2012). Unfortunately, these best practices are slow to make their way intomarket research. To be fair, they are also slow to be adopted across other disciplinesincluding social neuroscience. Nevertheless, published white papers and conferencepresentations suggest that the problem of voodoo correlations is still very prevalent inneuromarketing research.4 Indeed, the persistence of this problem, especially sinceneuroscientists have known about ways to detect and avoid it since the late 2000s,should raise alarm bells.
JOURNAL OF MARKETING MANAGEMENT 9
Neuroscience and the problem of reverse inference
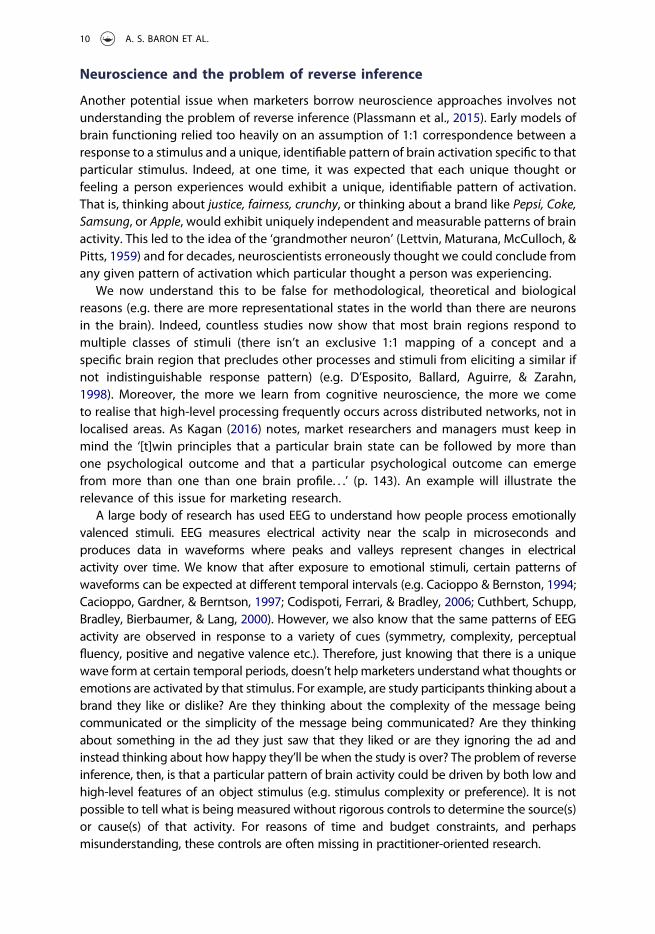
Another potential issue when marketers borrow neuroscience approaches involves notunderstanding the problem of reverse inference (Plassmann et al., 2015). Early models ofbrain functioning relied too heavily on an assumption of 1:1 correspondence between aresponse to a stimulus and a unique, identifiable pattern of brain activation specific to thatparticular stimulus. Indeed, at one time, it was expected that each unique thought orfeeling a person experiences would exhibit a unique, identifiable pattern of activation.That is, thinking about justice, fairness, crunchy, or thinking about a brand like Pepsi, Coke,Samsung, or Apple, would exhibit uniquely independent and measurable patterns of brainactivity. This led to the idea of the ‘grandmother neuron’ (Lettvin, Maturana, McCulloch, &Pitts, 1959) and for decades, neuroscientists erroneously thought we could conclude fromany given pattern of activation which particular thought a person was experiencing.
We now understand this to be false for methodological, theoretical and biologicalreasons (e.g. there are more representational states in the world than there are neuronsin the brain). Indeed, countless studies now show that most brain regions respond tomultiple classes of stimuli (there isn’t an exclusive 1:1 mapping of a concept and aspecific brain region that precludes other processes and stimuli from eliciting a similar ifnot indistinguishable response pattern) (e.g. D’Esposito, Ballard, Aguirre, & Zarahn,1998). Moreover, the more we learn from cognitive neuroscience, the more we cometo realise that high-level processing frequently occurs across distributed networks, not inlocalised areas. As Kagan (2016) notes, market researchers and managers must keep inmind the ‘[t]win principles that a particular brain state can be followed by more thanone psychological outcome and that a particular psychological outcome can emergefrom more than one than one brain profile. . .’ (p. 143). An example will illustrate therelevance of this issue for marketing research.
A large body of research has used EEG to understand how people process emotionallyvalenced stimuli. EEG measures electrical activity near the scalp in microseconds andproduces data in waveforms where peaks and valleys represent changes in electricalactivity over time. We know that after exposure to emotional stimuli, certain patterns ofwaveforms can be expected at different temporal intervals (e.g. Cacioppo & Bernston, 1994;Cacioppo, Gardner, & Berntson, 1997; Codispoti, Ferrari, & Bradley, 2006; Cuthbert, Schupp,Bradley, Bierbaumer, & Lang, 2000). However, we also know that the same patterns of EEGactivity are observed in response to a variety of cues (symmetry, complexity, perceptualfluency, positive and negative valence etc.). Therefore, just knowing that there is a uniquewave form at certain temporal periods, doesn’t helpmarketers understand what thoughts oremotions are activated by that stimulus. For example, are study participants thinking about abrand they like or dislike? Are they thinking about the complexity of the message beingcommunicated or the simplicity of the message being communicated? Are they thinkingabout something in the ad they just saw that they liked or are they ignoring the ad andinstead thinking about how happy they’ll be when the study is over? The problem of reverseinference, then, is that a particular pattern of brain activity could be driven by both low andhigh-level features of an object stimulus (e.g. stimulus complexity or preference). It is notpossible to tell what is being measured without rigorous controls to determine the source(s)or cause(s) of that activity. For reasons of time and budget constraints, and perhapsmisunderstanding, these controls are often missing in practitioner-oriented research.
10 A. S. BARON ET AL.
Although some researchers have suggested that it is possible to use EEG to measuredifferences in how consumers positively and negatively evaluate brand logos (Handy,Smilek, Geiger, Liu, & Schooler, 2010), individual brand logos could not be distinguishedfrom one another in their unique wave form. The clear implication from this and relatedpublished studies is that EEG measures cannot discriminate among (a) individual brandsor (b) individual ads unless those brands or ads are quite distinct from one another inhow they are evaluated using behavioural measures (e.g. one is rated highly positive,the other quite negative; Herr & Page, 2004), begging the question what EEG is addingto our understanding of brand preference beyond traditional behavioural methods.
While advanced statistical methods including multi-voxel pattern analysis and RSA havedemonstrated exciting promise in the ability to use neuroimaging data to discriminatebetween differentmental states including specific ideas and or categories of objects such asplants, birds or body parts (see Charest et al., 2014; Poldrack & Farah, 2015; Poldrack &Yarkoni, 2016; Schulz et al., 2012; Visser, Scholte, & Kindt, 2011) and some suggestions thatcertain emotional states can also be discriminated at a neural level (Baucom, Wedell, Wang,Blitzer, & Shinkareva, 2012; Kragel, Knodt, Hariri, & LaBar, 2016; Kragel & LaBar, 2016), thesetechniques are quite new, haven’t yet been applied to marketing and have yet todemonstrate an ability to discriminate among the kinds of emotions and thoughts thatwould be particularly informative for practitioners of marketing science.
In sum, neuroscience methods have much promise if applied correctly to marketingissues such as understanding the role of attention during ad viewing or understanding thebrain circuits involved in consumer decision-making (Gabrieli et al., 2015; Karmarkar,Plassmann, & Yoon, 2015; Karmarkar & Yoon, 2016; Plassmann & Karmarkar, 2015;Plassmann et al., 2015). Achieving that promise requires, however, successfully followingbest practices developed in the basic neuroscience discipline and being transparent indescribing the details of research design, measurement and analysis (includingestablishing and reporting the reliability estimates for the observed response patterns).
Conclusion
The marketing discipline continues to progress by borrowing advances in knowledgeand methods of inquiry developed in other disciplines. As this occurs, it is essential thatborrowers adopt best practices developed in those disciplines regarding the appropriateuse of this knowledge and related methodologies. Then, marketing borrowers must betransparent about design details and analytic processes they use to demonstrate thatbest practices were followed. As Varan and his colleagues note, marketing advocates ofnewly borrowed methods ‘will have to show that they have sufficient confidence in theirmeasures that they are willing to let others test them independently . . . [they shouldcompete] . . . on the quality of their data, not the uniqueness of their tools’ (p. 189).Stated differently, research practitioners should move away from a black box model andinstead differentiate themselves not just by the shiny new methodological tools theyemploy, but by their careful rigour in leveraging those tools to generate valid andmeaningful insights for their clients.
JOURNAL OF MARKETING MANAGEMENT 11
Notes
1. The order of pairings is counterbalanced across participants (e.g. half see Apple + Positivewords and Samsung + Negative words paired together first and half see Samsung + Positivewords and Apple + Negative words paired together first).
2. Here, mask screens are used to fixate attention to the centre of the screen and to mark theend of a trial.
3. http://www.nielsen.com/content/dam/corporate/us/en/reports-downloads/2015-reports/nielsen-neuro-report-april-2015.pdf
4. http://www.nielsen.com/content/dam/corporate/us/en/reports-downloads/2015-reports/nielsen-neuro-report-april-2015.pdf; https://www.youtube.com/watch?v=0i8dpTTge_k; and‘But our customers said they’d buy it’ by Sentient Decision Sciences at http://iiexforums.insightinnovation.org/page/1281625/2016-presentations
Disclosure statement
No potential conflict of interest was reported by the authors.
Notes on contributors
Jerry Olson is the Earl Strong Professor Emeritus in the Smeal College of Business at Penn StateUniversity. He holds PhD and MS degrees in psychology from Purdue University. His past andcurrent research interests concern meaning, especially how consumers create meaning (aboutbrands, companies, and their problems) and use it to navigate the marketing world. He haspublished many articles about those topics as well as several books, including the textbook,Consumer Behavior and Marketing Strategy. In 1997 he cofounded Olson Zaltman, a consultancydevoted to digging deep into the thoughts and feelings of consumers and helping managersleverage those insights in their marketing programs. He is Managing Partner of Olson Zaltman.
Gerald Zaltman is the Joseph. C. Wilson Professor Emeritus, Harvard Business School. He was amember of Harvard University’s Mind, Brain, Behavior Initiative Steering Committee and studygroup. He has held three U.S. Patents involving research methods rooted in the mind sciences. Heholds a PhD in Sociology from the Johns Hopkins University and an MBA from the U. of Chicago.Professor Zaltman's research interests include the dynamics of knowledge use, customer behavior,imagination, and organizational innovation. He has published many books and articles on thesetopics. He is also the recipient of numerous professional awards and honors including mostrecently selection by the American Marketing Association as a Legend in Marketing. ProfessorZaltman is a founding partner of Olson Zaltman Associates whose work brings advances in thebehavioral sciences to leading business and non profit organizations around the globe.
Andrew Baron is an Associate Professor of Psychology at the University of British Columbia and anaffiliate at the National Core for Neuroethics at the University of British Columbia. He received hisPhD (and MA) in Psychology from Harvard University and his BA in Psychology from the Universityof Michigan. In 2013 he was selected as a Rising Star by the Association for Psychological Sciencefor his research examining the foundations of implicit associations. His research draws on methodsand theories from social, cognitive and developmental psychology to study how implicit associa-tions form and to identify optimal strategies to change unconscious bias. This work focuses onestablishing best practices for measuring implicit associations across the lifespan. In 2016 Baronco-edited Core Knowledge and Conceptual Change published by Oxford University Press. Since2007 Baron has also served as a consumer neuroscience advisor to Olson Zaltman, providingguidance on best practices for measuring implicit associations for marketing applications.
12 A. S. BARON ET AL.
References
Aguirre, G. K. (2003). Functional imaging in behavioral neurology and cognitive neuropsychology. In T.E. Feinberg &M. J. Farah (Eds.), Behavioral neurology and cognitive neuropsychology (pp. 35–46). NewYork: McGraw-Hill.
Ariely, D., & Berns, G. S. (2010). Neuromarketing: The hope and hype of neuroimaging in business.Nature Reviews Neuroscience, 11, 284–292. doi:10.1038/nrn2795
Baucom, L. B., Wedell, D. H., Wang, J., Blitzer, D. N., & Shinkareva, S. V. (2012). Decoding the neuralrepresentation of affective states. Neuroimage, 59(1), 718–727. doi:10.1016/j.neuroimage.2011.07.037
Berns, G. S., & Moore, S. (2012). A neural predictor of cultural popularity. Journal of ConsumerPsychology, 22, 154–160. doi:10.1016/j.jcps.2011.05.001
Brunel, F. F., Tietje, B. C., & Greenwald, A. G. (2004). Is the Implicit Association Test a valid andvaluable measure of implicit consumer social cognition. Journal of Consumer Psychology, 14,385–404. doi:10.1207/s15327663jcp1404_8
Cacioppo, J. T., & Berntson, G. G. (1994). Relationship between attitudes and evaluative space: Acritical review, with emphasis on the separability of positive and negative substrates.Psychological Bulletin, 115, 401–423. doi:10.1037/0033-2909.115.3.401
Cacioppo, J. T., Gardner, W. L., & Berntson, G. G. (1997). Beyond bipolar conceptualizations andmeasures: The case of attitudes and evaluative space. Personality and Social Psychology Review,1, 3–25. doi:10.1207/s15327957pspr0101_2
Charest, I., Kievit, R. A., Schmitz, T. W., Deca, D., & Kriegeskorte, N. (2014). Unique semantic space inthe brain of each beholder predicts perceived similarity. PNAS Proceedings of the NationalAcademy of Sciences, 111(40), 14565–14570. doi:10.1073/pnas.1402594111
Codispoti, M., Ferrari, V., & Bradley, M. M. (2006). Repetitive picture processing: Automatic andcortical correlates. Brain Research, 1068, 213–220. doi:10.1016/j.brainres.2005.11.009
Cuthbert, B. N., Schupp, H. T., Bradley, M. M., Bierbaumer, N., & Lang, P. J. (2000). Brain potentials inaffective picture processing: Covariation with autonomic arousal and affective report. BiologicalPsychology, 52, 95–111. doi:10.1016/S0301-0511(99)00044-7
Cvencek, D., Greenwald, A. G., Brown, A., Snowden, R., & Gray, N. (2010). Faking of the ImplicitAssociation Test is statistically detectable and partly correctable. Basic and Applied SocialPsychology, 32, 302–314. doi:10.1080/01973533.2010.519236
D’Esposito, M., Ballard, D., Aguirre, G. K., & Zarahn, E. (1998). Human prefrontal cortex is not specificfor working memory: A functional MRI study. Neuroimage, 8, 274–282. doi:10.1006/nimg.1998.0364
Dmochowski, J. P., Bezdek, M. A., Abelson, B. P., Johnson, J. S., Schumacher, E. H., & Parra, L. C.(2014). Audience preferences are predicted by temporal reliability of neural processing. NatureCommunications, 5. doi:10.1038/ncomms5567
Dmochowski, J. P., Sajda, P., Dias, J., & Parra, L. C. (2012). Correlated components of ongoing EEGpoint to emotionally laden attention–a possible marker of engagement? Frontiers in HumanNeuroscience, 6. doi:10.3389/fnhum.2012.00112
Errington, T., Iorns, E., Gunn, W., Tan, F., Lomax, J., & Nosek, B. A. (2014). An open investigation ofthe reproducibility of cancer biology research. Elife, 3, e04333. doi:10.7554/eLife.04333
Fanelli, D. (2010). “Positive” results increase down the hierarchy of the sciences. Plos One, 5,e10068. doi:10.1371/journal.pone.0010068
Gabrieli, J. E., Ghosh, S. S., & Whitfield-Gabrieli, S. (2015). Prediction as a humanitarian andpragmatic contribution from human cognitive neuroscience. Neuron, 85, 11–26. doi:10.1016/j.neuron.2014.10.047
Greenwald, A. G., McGhee, D. E., & Schwartz, J. L. K. (1998). Measuring individual differences inimplicit cognition: The implicit association test. Journal of Personality and Social Psychology, 74(6), 1464–1480. doi:10.1037/0022-3514.74.6.1464
Greenwald, A. G., & Nosek, B. A. (2001). Health of the implicit association test at age 3. Zeitschrift forExperimentelle Psychologie, 48, 85–93. doi:10.1026//0949-3946.48.2.85
JOURNAL OF MARKETING MANAGEMENT 13
Greenwald, A. G., Nosek, B. A., & Banaji, M. R. (2003). Understanding and using the implicitassociation test: I. An improved scoring algorithm. Journal of Personality and SocialPsychology, 85, 197–216. doi:10.1037/0022-3514.85.2.197
Greenwald, A. G., Poehlman, T. A., Uhlmann, E. L., & Banaji, M. R. (2009). Understanding and usingthe implicit association test: III. Meta-analysis of predictive validity. Journal of Personality andSocial Psychology, 97(1), 17–41. doi:10.1037/a0015575
Handy, T. C., Smilek, D., Geiger, L., Liu, C., & Schooler, J. W. (2010). ERP evidence for rapid hedonicevaluation of logos. Journal of Cognitive Neuroscience, 22, 124–138. doi:10.1162/jocn.2008.21180
Henson, R. (2006). Forward inference using functional neuroimaging: Dissociations versusassociations. Trends in Cognitive Science, 10(2), 64–69. doi:10.1016/j.tics.2005.12.005
Herr, P., & Page, C. (2004). Asymmetric association of liking and disliking judgments: So what’s notto dislike? Journal of Consumer Research, 30, 588–601. doi:10.1086/380291
Ioannidis, J. P. A., Munafo, M. R., Fusar-Poli, P., Nosek, B. A., & David, S. P. (2014). Publication andother reporting biases in cognitive sciences: Detection, prevalence, and prevention. Trends inCognitive Sciences, 18, 235–241. doi:10.1016/j.tics.2014.02.010
Kagan, J. (2016). On being human: Why mind matters (pp. 143). New Haven, CT: Yale Univerisity Press.Kahneman, D. (2011). Thinking, fast and slow. New York: Farrar, Straus and Giroux.Karmarkar, U. R., Plassmann, H., & Yoon, C. (2015). Marketers should pay attention to fMRI. Harvard
Business Review. Retrieved from https://hbr.org/2015/11/marketers-should-pay-attention-to-fmriKarmarkar, U. R., & Yoon, C. (2016). Consumer neuroscience: Advances in understanding consumer
psychology. Current Opinion in Psychology, 10, 160–165. doi:10.1016/j.copsyc.2016.01.010Karpinski, A., & Hilton, J. L. (2001). Attitudes and the implicit association test. Journal of Personality
and Social Psychology, 81, 774–788. doi:10.1037/0022-3514.81.5.774Klein, R. A., Ratliff, K. A., Vianello, M., Adams, R. B., Bahník, S., Bernstein, M. J., & Nosek, B. A. (2014).
Investigating variation in replicability: A “many labs” replication project. Social Psychology, 45,142–152. doi:10.1027/1864-9335/a000178
Kong, J., Gollub, R. L., Webb, J. M., Kong, J.-T., Vangel, M. G., & Kwong, K. (2007). Test-retest study offMRI signal change evoked by electroacupuncture stimulation. NeuroImage, 34, 1171–1181.doi:10.1016/j.neuroimage.2006.10.019
Kragel, P. A., Knodt, A. R., Hariri, A. R., & LaBar, K. S. (2016). Decoding spontaneous emotional statesin the human brain. Plos Biology, 14(9), e2000106. doi:10.1371/journal.pbio.2000106
Kragel, P. A., & LaBar, K. S. (2016). Decoding the nature of emotion in the brain. Trends In CognitiveSciences, 20(6), 444–455. doi:10.1016/j.tics.2016.03.011
Kriegeskorte, N., Simmons, W. K., Bellgowan, P. S., & Baker, C. I. (2009). Circular analysis in systemsneuroscience – the dangers of double dipping. Nature Neuroscience, 12(5), 535–540.doi:10.1038/nn.2303
Lane, K. A., Banaji, M. R., Nosek, B. A., & Greenwald, A. G. (2007). Understanding and using theimplicit association test: IV. What we know (so far). In B. Wittenbrink & N. S. Schwarz (Eds.),Implicit measures of attitudes: Procedures and controversies (pp. 59–102). New York: GuilfordPress.
Lettvin, J. Y., Maturana, H. R., McCulloch, W. S., & Pitts, W. H. (1959). What the Frog’s eye tells theFrog’s brain. Proceedings of the IRE, 47, 1940–1951. doi:10.1109/JRPROC.1959.287207
Maison, D., Greenwald, A. G., & Bruin, R. H. (2004). Predictive validity of the implicit association testin studies of brands, consumer attitudes, and behavior. Journal of Consumer Psychology, 14,405–415. doi:10.1207/s15327663jcp1404_9
Meyer, D. E., & Schvaneveldt, R. W. (1971). Facilitation in recognizing pairs of words: Evidence of adependence between retrieval operations. Journal of Experimental Psychology, 90(2), 227–234.doi:10.1037/h0031564
Miguel, E., Camerer, C., Casey, K., Cohen, J., Esterling, K. M., Gerber, A., . . . Van Der Laan, M. (2014).Promoting transparency in social science research. Science, 343, 30–31. doi:10.1126/science.1245317
Mitchell, J. (2003). Contextual variations in implicit evaluation. Journal Of Experimental Psychology:General, 132, :455.
14 A. S. BARON ET AL.
Nosek, B. A., Bar-Anan, Y., Sriram, N., Axt, J., & Greenwald, A. G. (2014). Understanding and usingthe brief implicit association test: Recommended scoring procedures. Plos ONE, 9(12), e110938.doi:10.1371/journal.pone.0110938
Nosek, B. A., Greenwald, A. G., & Banaji, M. R. (2005). Understanding and using the implicitassociation test: II. Method variables and construct validity. Personality and Social PsychologyBulletin, 31, 166–180. doi:10.1177/0146167204271418
Nosek, B. A., Greenwald, A. G., & Banaji, M. R. (2007). The implicit association test at age 7: Amethodological and conceptual review. In J. A. Bargh (Ed.), Automatic processes in social thinkingand behavior (pp. 265–292). Hove, UK: Psychology Press.
Nosek, B. A., Smyth, F. L., Hansen, J. J., Devos, T., Lindner, N. M., Ranganath, K. A., & Banaji, M. R.(2007). Pervasiveness and correlates of implicit attitudes and stereotypes. European Review ofSocial Psychology, 18, 36–88. doi:10.1080/10463280701489053
Nunnally, J. C. (1970). Introduction to psychological measurement. New York: McGraw-Hill.Open Science Collaboration. (2015). Estimating the reproducibility of psychological science.
Science, 349(6251). doi:10.1126/science.aac4716Payne, B. K., Cheng, C. M., Govorun, O., & Stewart, B. (2005). An inkblot for attitudes: Affect
misattribution as implicit measurement. Journal of Personality and Social Psychology, 89, 277–293.doi:10.1037/0022-3514.89.3.277
Payne, B. K., & Lundberg, K. B. (2014). The affect misattribution procedure: Ten years of evidenceon reliability, validity, and mechanisms. Social and Personality Psychology Compass, 8, 672–686.doi:10.1111/spc3.12148
Plassmann, H., & Karmarkar, U. R. (2015). Consumer neuroscience: Revealing meaningfulrelationships between brain and consumer behavior. In C. Lamberton, M. Norton, & D. Rucker(Eds.), Cambridge handbook of consumer psychology. Cambridge: Cambridge University Press.
Plassmann, H., Venkatraman, V., Huettel, S., & Yoon, C. (2015). Consumer neuroscience:Applications, challenges, and possible solutions. Journal of Marketing Research, 52(4), 427–435.doi:10.1509/jmr.14.0048
Poldrack, R. A. (2006). Can cognitive processes be inferred from neuroimaging data? Trends inCognitive Science, 10, 59–63. doi:10.1016/j.tics.2005.12.004
Poldrack, R. A., & Farah, M. J. (2015). Progress and challenges in probing the human brain. Nature,526(7573), 371–379. doi:10.1038/nature15692
Poldrack, R. A., Kittur, A., Kalar, D., Miller, E., Seppa, C., Gil, Y., . . . Bilder, R. M. (2011). The cognitiveatlas: Toward a knowledge foundation for cognitive neuroscience. Frontiers in Neuroinformatics,5, 17. doi:10.3389/fninf.2011.00017
Poldrack, R. A., & Wagner, A. D. (2004). What can neuroimaging tell us about the mind?Insights from prefrontal cortex. Curr. Dir. Psychol. Sci., 13, 177–181. doi:10.1111/j.0963-7214.2004.00302.x
Poldrack, R. A., & Yarkoni, T. (2016). From brain maps to cognitive ontologies: Informatics and thesearch for mental structure. Annual Review Of Psychology, 67, 587–612. doi:10.1146/annurev-psych-122414-033729
Ratliff, K. A., Swinkels, B. A. P., Klerx, K., & Nosek, B. A. (2012). Does one bad apple(juice) spoil thebunch? Implicit attitudes toward one product transfer to other products by the same brand.Psychology and Marketing, 29, 531–540. doi:10.1002/mar.20540
Schulz, E., Zherdin, A., Tiemann, L., Plant, C., & Ploner, M. (2012). Decoding an individual’s sensitivity topain from the multivariate analysis of EEG data. Cerebral Cortex, 22(5), 1118–1123. doi:10.1093/cercor/bhr186
Sherman, J. W., Gawronski, B., Gonsalkorale, K., Hugenberg, K., Allen, T. J., & Groom, C. J. (2008). Theself-regulation of automatic associations and behavioral impulses. Psychological Review, 115,314–335. doi:10.1037/0033-295X.115.2.314
Simonsohn, U., Nelson, L. D., & Simmons, J. P. (2014). P-curve: A key to the file-drawer. Journal ofExperimental Psychology: General, 143, 534–547. doi:10.1037/a0033242
Simonsohn, U., Simmons, J. P., & Nelson, L. D. (2015). Better p-curves: Making p-curve analysismore robust to errors, fraud, and ambitious p-hacking, a reply to Ulrich and Miller (2015).Journal of Experimental Psychology: General, 144, 1146–1152. doi:10.1037/xge0000104
JOURNAL OF MARKETING MANAGEMENT 15
Sriram, N., & Greenwald, A. G. (2009). The brief implicit association test. Experimental Psychology,56, 283–294. doi:10.1027/1618-3169.56.4.283
Turk, D. J., Van Bussel, K., Brebner, J. L., Toma, A., Krigolson, O., & Handy, T. C. (2011). When itbecomes mine: Attentional biases triggered by object ownership. Journal of CognitiveNeuroscience, 23, 3725–3733. doi:10.1162/jocn_a_00101
Varan, D., Lang, A., Barwise, P., Weber, R., & Bellman, S. (2015). How reliable are neuromarketers’measures of advertising effectiveness: data from ongoing research holds no common truthamong vendors. Journal of Advertising Research, 55(2), 176–191. doi:10.2501/JAR-55-2-176-191
Venkatraman, V., Dimoka, A., Pavlou, P. A., Vo, K., Hampton, W., Bollinger, B., . . . Winer, R. S. (2015).Predicting advertising success beyond traditional measures: New insights fromneurophysiological methods and market response modeling. Journal of Marketing Research,52(4), 436–452. doi:10.1509/jmr.13.0593
Visser, R. M., Scholte, H. S., & Kindt, M. (2011). Associative learning increases trial-by- trial similarityof BOLD-MRI patterns. The Journal Of Neuroscience, 31(33), 12021–12028. doi:10.1523/JNEUROSCI.2178-11.2011
Vogel, G. (2011). Scientific misconduct. Psychologist accused of fraud on ‘astonishing scale’.Science, 334, 579. doi:10.1126/science.334.6056.579
Vul, E., Harris, C., Winkielman, P., & Pashler, H. (2009). Puzzlingly high correlations in fMRI studies ofemotion, personality, and social cognition. Perspectives on Psychological Science, 4(3), 274–290.doi:10.1111/j.1745-6924.2009.01125.x
Vul, E., & Kanwisher, N. (2010). Begging the question: The nonindependence error in fMRIdata analysis. In S. Hanson & M. Bunzl (Eds.), Foundational issues for human brain mapping(pp. 71–91). Cambridge, MA: MIT Press.
Vul, E., & Pashler, H. (2012). Voodoo and circularity errors. Neuroimage, 62(2), 945–948. doi:10.1016/j.neuroimage.2012.01.027
Winkielman, P., & Cacioppo, J. T. (2001). Mind at ease puts a smile on the face: Psychophysiologicalevidence that processing facilitation elicits positive affect. Journal of Personality and SocialPsychology, 81, 989–1000. doi:10.1037/0022-3514.81.6.989
Yarkoni, T., Poldrack, R. A., Nichols, T. E., Van Essen, D. C., & Wager, T. D. (2011). Large-scaleautomated synthesis of human functional neuroimaging data. Nature Methods, 8, 665–670.doi:10.1038/nmeth.1635
Zaltman, G. (2003). How customers think: Essential insights into the mind of the market. Boston, MA:Harvard Business School Press.
16 A. S. BARON ET AL.