Embed Size (px)
Citation preview

BioOne sees sustainable scholarly publishing as an inherently collaborative enterprise connecting authors nonprofit publishers academic institutions researchlibraries and research funders in the common goal of maximizing access to critical research
Barrier Island Morphodynamic Classification Based on Lidar Metrics for NorthAssateague Island MarylandAuthor(s) John C Brock William B Krabill and Asbury H SallengerSource Journal of Coastal Research Number 202498-509 2004Published By Coastal Education and Research FoundationDOI httpdxdoiorg1021121551-5036(2004)020[0498BIMCBO]20CO2URL httpwwwbiooneorgdoifull1021121551-5036282004290205B04983ABIMCBO5D20CO3B2
BioOne (wwwbiooneorg) is a nonprofit online aggregation of core research in the biological ecological andenvironmental sciences BioOne provides a sustainable online platform for over 170 journals and books publishedby nonprofit societies associations museums institutions and presses
Your use of this PDF the BioOne Web site and all posted and associated content indicates your acceptance ofBioOnersquos Terms of Use available at wwwbiooneorgpageterms_of_use
Usage of BioOne content is strictly limited to personal educational and non-commercial use Commercial inquiriesor rights and permissions requests should be directed to the individual publisher as copyright holder
Journal of Coastal Research 20 2 498ndash509 West Palm Beach Florida Spring 2004
Barrier Island Morphodynamic Classification Based onLidar Metrics for North Assateague Island MarylandJohn C Brockdagger William B KrabillDagger and Asbury H Sallengerdagger
daggerUSGS Center for Coastaland Regional MarineStudies
600 4th Street SouthSt Petersburg FL 33701
USAjbrockusgsgov
DaggerNASA Goddard Space FlightCenter
Wallops Flight FacilityWallops Island VA 23337
USAkrabillosb1wffnasagov
ABSTRACT
BROCK JC KRABILL WB and SALLENGER AH 2004 Barrier island morphodynamic classification based onlidar metrics for North Assateague Island Maryland Journal of Coastal Research 20(2) 498ndash509 West Palm Beach(Florida) ISSN 0749-0208
In order to reap the potential of airborne lidar surveys to provide geological information useful in understandingcoastal sedimentary processes acting on various time scales a new set of analysis methods are needed This paperpresents a multi-temporal lidar analysis of north Assateague Island Maryland and demonstrates the calculation oflidar metrics that condense barrier island morphology and morphological change into attributed linear features thatmay be used to analyze trends in coastal evolution The new methods proposed in this paper are also of significantpractical value because lidar metric analysis reduces large volumes of point elevations into linear features attributedwith essential morphological variables that are ideally suited for inclusion in Geographic Information Systems
A morphodynamic classification of north Assategue Island for a recent 10 month time period that is based on therecognition of simple patterns described by lidar change metrics is presented Such morphodynamic classificationreveals the relative magnitude and the fine scale alongshore variation in the importance of coastal changes over thestudy area during a defined time period More generally through the presentation of this morphodynamic classifi-cation of north Assateague Island the value of lidar metrics in both examining large lidar data sets for coherenttrends and in building hypotheses regarding processes driving barrier evolution is demonstrated
ADDITIONAL INDEX WORDS Remote sensing lidar Airborne Topographic Mapper barrier islands geomorphologyAssateague Island
INTRODUCTION
The topography of much of the contiguous US coastlinehas recently been surveyed using a NASA airborne topo-graphic lidar system (BROCK et al 1999 GROAT et al 2001KRABILL et al 2000 SALLENGER et al 1999a SALLENGER etal 1999b SALLENGER et al submitted a) This data set in-cludes repeat coverage over many coastal reaches is unprec-edented in its areal coverage and fine scale and undoubtedlycontains a wealth of geological information However in or-der to realize the potential of this extensive data set to ad-vance understanding of coastal change there is a need tocreate a set of new analysis methods Essentially the re-quirement is to develop unique algorithms that can reducelidar-based digital elevation models to parameters that cap-ture fundamental aspects of morphology and morphologicalchange at a fine scale in the alongshore direction
In the case of barrier islands that have been surveyed re-petitively to detect modification it is desirable to devise pat-tern recognition techniques that use these distilled parame-ters or lidar metrics in an alongshore classification of mor-phodynamic behavior Ultimately the aim is to associate li-
01048 received and accepted in revision 25 July 2002
dar-based morphodynamic classification to sedimentaryprocesses that modify barrier islands over various timescales We present an approach that is based upon the cal-culation of lidar metrics that synthesize the information pro-vided by both single and repeated lidar surveys of barrierislands
Northern Assateague Island National Seashore (ASIS) waschosen as the demonstration site (Figure 1) for analysis ofmorphological change mainly because of the ongoing and dy-namic evolution that is evident at this location (LEATHERMAN1983) The creation of Ocean City Inlet by a hurricane in 1933separated Assateague Island from Fenwick Island to thenorth Subsequent stabilization of the inlet by jetty construc-tion in 1935 interrupted the dominantly southward longshoresediment transport and caused severe erosion rates up to 12m per year at the northern end of Assateague Island (UN-
DERWOOD and HILAND 1995) Trapping of the littoral drift atOcean City has also created extreme alongshore gradients insand starvation and erosion rates over the northern 10 kmof Assateague Island (LEATHERMAN 1979)
The disequilibrium conditions caused by the Ocean Cityjetties have greatly accelerated overwash processes and bar-rier migration within the study area creating an excellentsite to investigate coastal change Frequent overwash has re-
499Barrier Island Lidar Metrics
Journal of Coastal Research Vol 20 No 2 2004
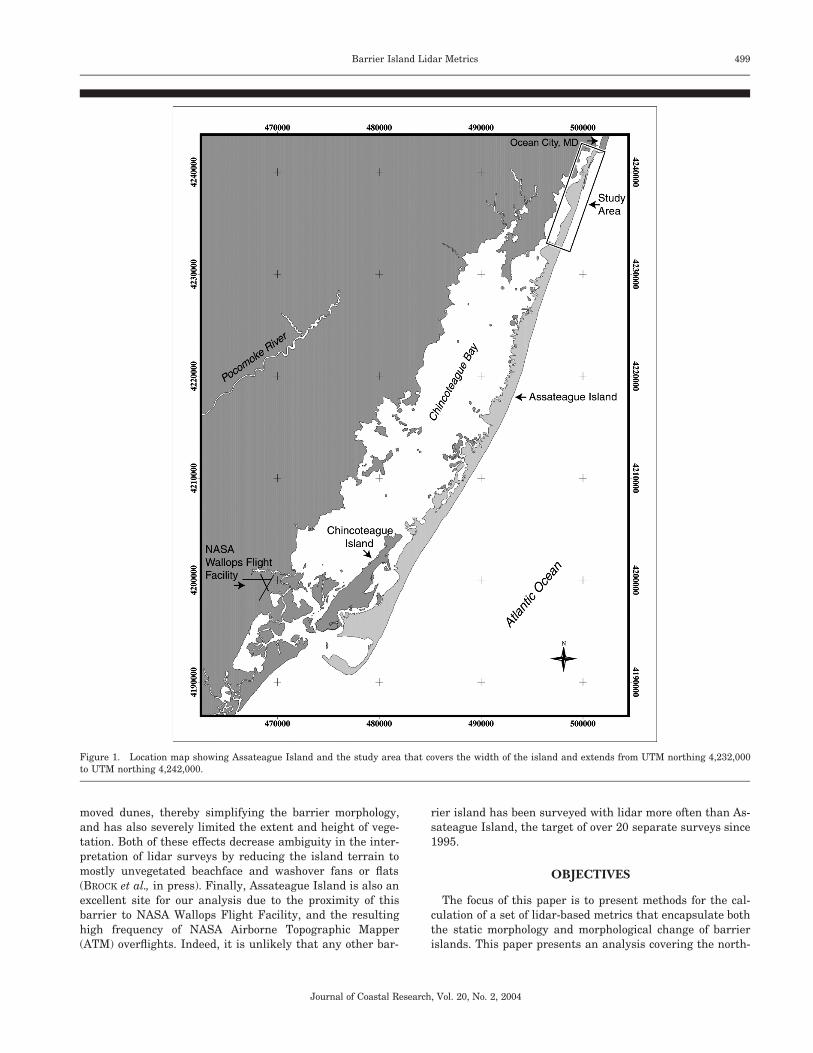
Figure 1 Location map showing Assateague Island and the study area that covers the width of the island and extends from UTM northing 4232000to UTM northing 4242000
moved dunes thereby simplifying the barrier morphologyand has also severely limited the extent and height of vege-tation Both of these effects decrease ambiguity in the inter-pretation of lidar surveys by reducing the island terrain tomostly unvegetated beachface and washover fans or flats(BROCK et al in press) Finally Assateague Island is also anexcellent site for our analysis due to the proximity of thisbarrier to NASA Wallops Flight Facility and the resultinghigh frequency of NASA Airborne Topographic Mapper(ATM) overflights Indeed it is unlikely that any other bar-
rier island has been surveyed with lidar more often than As-sateague Island the target of over 20 separate surveys since1995
OBJECTIVES
The focus of this paper is to present methods for the cal-culation of a set of lidar-based metrics that encapsulate boththe static morphology and morphological change of barrierislands This paper presents an analysis covering the north-
500 Brock Krabill and Sallenger
Journal of Coastal Research Vol 20 No 2 2004
Figure 2 Flowchart for the lidar static metrics analysis
Figure 3 East-to-west volume slice at UTM northing 4239590 depict-ing the barrier island elevation profile and the calculated UTM eastinglocations of the ocean shoreline (red) the bay shoreline (purple) and theeast-to-west volume balanceline (green)ern 10 km of ASIS (Figure 1) MarylandVirginia to address
the following objectives
(1) to develop lidar static metrics that condense the mor-phology of a barrier island into a set of attributed linesassociated with both a shoreline datum and the along-shore variation in island volume
(2) to describe the calculation of lidar change metrics basedon the differencing of static metrics estimated for repeat-ed topographic lidar surveys of north ASIS separated bya 10 month time interval
(3) to present a morphodynamic classification of north ASISfor this 10 month time period that is based on lidarchange metrics
METHODS
The NASA ATM (KRABILL et al 2000) was used to surveyASIS on October 1 1999 and again 10 months later on Au-gust 1 2000 These surveys each resulted in a data set ofelevation measurements at densities up to about one pointper square meter and referenced to the WGS-84 ellipsoidThese point elevations were converted to the NAD83 horizon-tal datum and the NAVD88 vertical datum and to the UTMhorizontal coordinate system by use of the LaserMap pro-cessing system developed at the USGS Center for Coastaland Regional Marine Studies One km by one km grid tilesthat cover the area of each survey were created and thesetiles were composited and scaled to produce two digital ele-vation models (DEMs) at a one meter grid cell dimension thatcover the study area the northernmost 10 km of ASIS Com-parisons to ground-based systems have shown that the ver-tical accuracy of elevation measurements acquired by theNASA ATM over beaches is approximately 15 cm RMS (SAL-
LENGER et al submitted b)A lidar metrics analysis was performed on one meter-wide
east-to-west DEM rows or volume slices that represent a
rigidly defined set of cross-shore profiles extracted from asurface created from the individual elevation measurementsNorth ASIS trends north-northeast to south-southwest (Fig-ure 1) and accordingly a fixed east-to-west orientationroughly normal to the general shoreline orientation was cho-sen for the analysis This uniform azimuth for the analysissimplified the computation and is preferable because the lin-ear static metrics essentially attributed lines that traversethe islandrsquos length are not necessarily parallel and also varyin their compass bearing with both location and time Assuch it is not practical to perform the lidar metrics analysiseverywhere in a shorenormal orientation In fact it is notnecessary to maintain a shorenormal bearing in calculatingthe lidar metrics described in this paper provided that theorientation used is reported along with the results and a con-sistent approach is used for all surveys to be reduced to lidarmetrics and compared for a given coastal reach
Static Metrics
Static lidar metrics use the entire DEM over the breadthof the barrier island to condense morphology at the time of aparticular lidar survey into a limited set of variables Thereare three types of static metrics (linear volumetric and com-bined linearvolumetric) and all are evaluated for each vol-ume slice Following the preparation of a lidar DEM the stat-ic metrics analysis begins with the extraction of the volumeslice at the southernmost UTM northing position (Figure 2)
Next the ocean and bay shorelines herein called the linearstatic metrics are determined There are a number of possi-ble approaches to fix the map position of the shoreline onlidar-based cross-shore profiles The development of methodsfor the definition of shorelines based on airborne lidar sur-
501Barrier Island Lidar Metrics
Journal of Coastal Research Vol 20 No 2 2004
Figure 4 Lidar elevation image of a one km north-south section of ASIS with the estimated linear static metrics plotted (red ocean shoreline greenvolume balanceline purple bay shoreline) The lidar elevation image is scaled from 10 m NAVD88 (black) to 30 m NAVD88 (white) and the regionslandward of the bay shoreline and oceanward of the ocean shoreline or above 30 m NAVD88 are masked to black The elevation image and the lidarmetrics shown are based on the October 1 1999 NASA ATM lidar survey
Figure 5 Flowchart for the change metrics analysis
veys is an area of active research (MOORE 2000) One chal-lenge is to accurately determine a lidar-based shoreline po-sition at a datum that may fall quite low on the beachfacewhile avoiding the use of any slightly oceanward water sur-face elevations that introduce errors Should that datum belower than the wave crests at the time of the lidar surveyreliable evaluation of the shoreline position using beachfaceelevations about the shoreline datum requires the discrimi-nation of land versus water surface elevations in the lidarpoints or grid cells Improvements in methods to identify thewater surface based on either the lidar data itself or on an-cillary multispectral images will help resolve this difficultyin the near future
In this study we avoided this complication by fixing theshoreline datum at 10 m NAVD88 well above the highestwater surface elevations encountered during either lidar sur-vey used in the analyses Elevations along the current vol-ume slice that exceed the selected shoreline datum are iso-lated (Figure 3) and the most oceanward of these cells thepreliminary shoreline cell is identified Next both the ele-vation of this preliminary shoreline cell and that of the im-mediately adjacent oceanward cell are compared to the ele-
502 Brock Krabill and Sallenger
Journal of Coastal Research Vol 20 No 2 2004
Figure 6 Plot of the UTM easting position of the ocean shoreline (red)and the volume balanceline (green) versus barrier island UTM northingposition for October 1 1999
Figure 7 Plot of the total barrier island volume in an east-west sliceone meter-wide and above the shoreline datum versus barrier islandUTM northing position for October 1 1999
vation of the chosen shoreline datum and the member of thiscell-pair closest in elevation to the datum is fixed as the finalocean shoreline slice cell The UTM easting and northing co-ordinates of the identified ocean shoreline cell are recordedas a shoreline point In order to allow linear extrapolation tothe shoreline UTM easting position at lower even sub-merged datums the mean slope of the beachface at eleva-tions above the tops of the highest ocean swells is also re-corded A parallel procedure is followed to determine the bayshoreline slice cell and the UTM easting value of the iden-tified bay shoreline cell
The total slice volume is then determined by summing thecell volume above the shoreline datum and between the oceanand bay shoreline UTM easting positions This value is thendivided by a factor of two in order to determine the half-volume of the current slice The UTM easting value of thevolume balance point of the current slice is then determinedby summing the slice volume from the bay shoreline to thepoint at which the summed partial volume equals the slicehalf-volume The UTM easting value for this point along theislandrsquos east-to-west volume balanceline a combined linearvolumetric static metric is recorded and the entire processis repeated for each of the cross-shore slices in the DEM Thisprocedure results in attributed lines or lsquolsquovectorsrsquorsquo that consti-tute the static linear and volumetric metrics for the barrierreach under study at a one-meter resolution in UTM northing(Figure 4) Note that the reduction of lidar data sets into met-rics converts large volumes of point elevations into attributedlinear features that are ideally suited for inclusion in a Geo-graphic Information System
Change Metrics
Two types of lidar change metrics linear and volumetricmay be calculated if two surveys separated in time are con-ducted over the same coastal reach First the static metrics
described above are generated for each separate survey andthe region of survey overlap is determined (Figure 5) Thechange metrics algorithm reads the static metrics for boththe first and second surveys and determines the region ofoverlap as a range in UTM northing Within the overlap re-gion the static linear metrics are compared at a one-meterresolution in UTM northing to calculate the eastward (ocean-ward) or westward (landward) displacements of the volumebalanceline and the ocean and bay shorelines Similarly theslice volume change is calculated at each UTM northing po-sition within the overlap region Next the DEM created fromthe second survey is analyzed with respect to the volume bal-anceline determined from the first survey DEM in order tocalculate the remaining volumetric change metrics 1) theslice volume change oceanward of the original volume bal-anceline and 2) the slice volume change landward of the orig-inal volume balanceline This step involves summing the slicevolume for the second survey east of the new bay shorelineabove the shoreline datum and west of the volume balance-line determined for the first survey This quantity is thendifferenced from the first survey half-volume at the sameUTM northing position An analogous calculation is also car-ried out for the second survey partial slice east of the firstsurvey volume balanceline and the entire change metricanalysis is repeated for each UTM northing position at a one-meter north-south resolution
RESULTS
Static Metrics
As expected the ocean shoreline determined from the Oc-tober 1 1999 lidar survey is highly linear but the corre-sponding volume balanceline displays relatively high vari-ability with significant and coherent landward and ocean-ward perturbations (Figure 6) The slice volume vector deter-mined for this date reveals a broad volumetric minimum in
503Barrier Island Lidar Metrics
Journal of Coastal Research Vol 20 No 2 2004
Figure 8a Plot of eastward ocean shoreline displacement versus barrierisland UTM northing position for time period between October 1 1999and August 1 2000Figure 8b Plot of eastward volume balanceline displacement versusbarrier island UTM northing position for time period between October 11999 and August 1 2000
Figure 9 Plot of one meter-wide slice volume change versus barrier is-land UTM northing position for time period between October 1 1999 andAugust 1 2000
the center of the study area (UTM northing 4234500 to4238000) where the east-to-west island volume was lessthan 150 m3 Slice volume exceeded 500 m3 at both the southand north end of the study area and appeared to vary onseveral spatial scales alongshore (Figure 7)
Change Metrics
The ocean shoreline migrated 5 to 15 m oceanward overmost of the southern portion of the study area between Oc-tober 1 1999 and August 1 2000 with the exception of land-ward incursions centered near UTM northing 4232100 and4233500 (Figure 8a) Along most of the northern 5 km of thestudy region shoreline change varied between oceanwardand landward within an absolute maximum magnitude ofabout 10 m However between UTM northing 4236100 and
4238000 the shoreline shift was dominantly landward up toabout 12 m and north of UTM northing 4240200 an ocean-ward shift of up to 50 m along a roughly 800 m long reachwas evident
The volume balanceline change (Figure 8b) is markedly dis-similar to ocean shoreline change in both sign and amplitudeVolume balanceline displacement displays much greater var-iablity and oscillates widely about zero on a very fine along-shore scale Focused and extreme landward and oceanwardvolume balanceline shifts exceeding 40 m are apparent Anextreme landward shift in the northernmost 05 km of thestudy area is matched by a sharp increase in slice volume(Figure 9) but is not associated with any significant oceanshoreline displacement
The general trend of shoreline movement over much of thestudy region was oceanward and the slice volume decreasedover most of this coastal reach during the 10 month studytime period (Figure 9) outside of regions of predominant vol-ume increase in the northernmost and southernmost one kmcoastal segments The change in slice volume reveals a dis-tinct oscillation with latitude producing localized peaks ofpositive slice volume change that are apparent throughoutmost of the study area
The slice volume change in the oceanward and landwardbarrier compartments to the east and the west of the October1 1999 volume balanceline reveal similar patterns (Figure10) Generally both the oceanward and landward barriercomponents typically lost about 10 m3 of volume but bothgains and losses of slice volume exceeded 50 m3 at varioussites Alongshore variability of slice volume change is appar-ent in both components on several spatial scales In thesouthernmost and northernmost three km of the study areathe landward component has a much more diffuse pattern ofvolume change alongshore This more scattered pattern ofslice volume change alongshore may be due to the greater
504 Brock Krabill and Sallenger
Journal of Coastal Research Vol 20 No 2 2004
Figure 10a Plot of the one meter-wide slice volume change oceanwardof the October 1 1999 volume balanceline versus barrier island UTMnorthing position for time period between October 1 1999 and August 12000Figure 10b Plot of the one meter-wide slice volume change landward ofthe October 1 1999 volume balanceline versus barrier island UTM north-ing position for time period between October 1 1999 and August 1 2000 Figure 11a Plot of eastward ocean shoreline displacement (m) versus
eastward volume balanceline displacement (m) for time period betweenOctober 1 1999 and August 1 2000Figure 11b Plot of eastward ocean shoreline displacement (m) versuseastward volume balanceline displacement (m) for time period betweenOctober 1 1999 and August 1 2000relative importance of areally extensive eolian processes over
the wider reaches of the barrierThe authors recognize that the apparent slice volume
changes between the two lidar surveys of ASIS are in somepart a result of errors in the elevation measurements provid-ed by the NASA ATM system (SALLENGER et al submitted b)A thorough understanding of the complex interaction of thevertical and horizontal accuracies of the NASA ATM data setacross variable ground morphology is necessary to fully eval-uate the error in volume estimation Evaluation of the accu-racy of barrier island volume change based on multiple sur-veys involves additional factors related to the repeatability oftopographic mapping by airborne lidar over differing time
scales As such a complete assessment of the errors in lidar-based volume and volume change estimates is outside thescope of this paper The authors recommend further study ofthe magnitudes and sources of error in barrier volume met-rics based on airborne lidar
DISCUSSION
Change in shoreline position is typically used as a primeindicator of coastal behavior in studies of coastal storm re-
505Barrier Island Lidar Metrics
Journal of Coastal Research Vol 20 No 2 2004
Figure 12 Lidar elevation image map depicting ocean shorelines (red)volume balancelines (green) and bay shorelines (purple) for both October1 1999 (dots with black centers) and August 1 2000 (dots with whitecenters) Note that the volume balanceline has shifted up to about 10 mlandward at sites where no significant change has occurred in the oceanor bay shoreline position
Figure 13 Flowchart depicting a simple morphodynamic classificationscheme
sponse (DOLAN and HAYDEN 1981) or historical coastal evo-lution (LEATHERMAN 1983) However over the 10 months ex-amined here shoreline change does not predict whole islandmorphological behavior as measured by two other lidarchange metrics volume balanceline displacement or slice vol-ume change (Figures 11a and 11b) This result is likely dueto this studyrsquos restriction to one annual cycle and also thelack of any major storm during the study time period verifiedby inspection of meteorological variables recorded at theNOAA buoy located southeast of Cape May New Jersey
Generally the volume balanceline for a barrier islandshould provide a great deal of information that may not bepreserved in the ocean shoreline because the volume bal-anceline reflects the integration of all processes that haveacted to create or modify the island Alongshore undulationsin the volume balanceline correspond to events that are sig-nificant to island evolution and such events may span a widerange of time scales from long-term eolian dune formationto abrupt storm events that can result in overwash and inletformation As demonstrated here the volume balanceline ofa barrier may be evaluated at a very fine scale alongshorethrough lidar surveying Although it is a highly sensitive in-dicator of the integrated set of processes that define islandmorphology the position of the volume balanceline is mini-mally effected by seasonal change of the beachface as theposition is buffered by the entire barrier slice volume at anypoint We propose that the volume balanceline is complimen-tary to the shoreline as it provides a precise measure of thebarrier position by collapsing the entire DEM over an islandto create a composite linear feature
A displacement of the volume balanceline is by definitiona shift in the overall island position Depending on the driv-ing process our analysis reveals that shifts in the volumebalanceline may become decoupled to shifts in the adjacentshoreline This result demonstrates the value of lidar topog-raphy in understanding barrier island evolution For exam-ple within the 200 m north-south range centered about UTMnorthing 4235100 the volume balanceline shifted up toabout 15 m landward with no significant shift in either theocean or the bay shorelines Only minimal change in slicevolume ranging from 0 to minus 25 m3 (Figure 12) occurredin this region This shift in barrier volumetric position ap-parently occurred without change in either shoreline throughberm relocation a change in the internal volume distributionof the barrier
Similar but more extreme and oceanward rather thanlandward displacement of the volume balanceline was ob-served south of the study area due to the construction of anartificial dune This suggests that the volume balancelinemay be useful in resource management applications such asthe monitoring of barrier island change during and subse-quent to beach renourishment Investigation of the sensitiv-ity of the volume balanceline to the chosen shoreline datumand also the impact of divergence of the lidar metrics analysisfrom a strict shorenormal orientation warrant further inves-tigation
Morphodynamic Classification
We applied a simple pattern recognition technique to thelidar change metrics in order to classify morphodynamic be-havior over the entire study area and 10 month time periodat a one meter resolution in UTM northing This morphody-namic classification is based on the most detailed lidar vol-umetriclinear change metrics the slice volume changes forthe landward and oceanward barrier compartments relativeto the volume balanceline developed from the first surveyMorphodynamic classification reveals the relative magnitudeand the fine scale alongshore variation in the importance of
506 Brock Krabill and Sallenger
Journal of Coastal Research Vol 20 No 2 2004
Figure 14a Morphodynamic classification for the 10000 one meter-wideeast-west slices along the northernmost ten km of ASIS depicted as ascatterplotFigure 14b Plot of eastward volume balanceline displacement versusbarrier island UTM northing position for time period between October 11999 and August 1 2000 with individual points color-coded by morpho-dynamic class (Red Degradational Green Transgressive Purple Pro-gradational Black Aggradational)
rarr
Figure 15a Lidar elevation image map over Region A two km south of the northern tip of Assateague Island Depicted on this image map are oceanshorelines (red) volume balancelines (green) and bay shorelines (purple) for both October 1 1999 (dots with black centers) and August 1 2000 (dotswith white centers) The vertical bar on the left side of the map depicts the morphodynamic class (Red Degradational Green Transgressive) at analongshore spatial resolution of one meter in UTM northingFigure 15b Lidar elevation image map over Region B eight km south of the northern tip of Assateague Island Depicted on this image map are oceanshorelines (red) volume balancelines (green) and bay shorelines (purple) for both October 1 1999 (dots with black centers) and August 1 2000 (dotswith white centers) The vertical bar on the left side of the map depicts the morphodynamic class (Red Degradational Green Transgressive) at analongshore spatial resolution of one meter in UTM northing
coastal changes over the study area during a defined timeperiod In the implementation presented here each of the10000 slice volumes within the 10 km north-south study re-gion is classified separately based solely on whether thechanges in the ocean and bay side barrier compartments arenegative or positive The classification takes the form of adecision tree with an initial separation based on the sign ofthe oceanward compartment volume change followed by asecond split guided by the sign of the change in the landwardcompartment volume (Figure 13) All of the volume slicesrepresented by their UTM northing value must fall into oneof four possible morphodynamic classes associated with thefollowing four patterns described in Table 1
If the island at a given location alongshore is categorizedas Aggradational it is gaining volume on both sides in con-trast to the Degradational Class which is associated withvolume loss in both the ocean and bay side compartmentsWithin these two classes the volume balanceline may be mov-ing either landward or oceanward depending on the relativemagnitudes of the changes in the two barrier compartmentsGenerally the Progradational Class implies oceanwardmovement of the volume balanceline and the TransgressiveClass implies a landward shift of this line However over the10 month time period analyzed here this volume balancelinebehavior is not a strict requirement because our pattern rec-ognition is based on only the signs of volume changes andthe eastndashwest distribution of that volume change within acompartment is not considered
A plot of the morphodynamic classification of the 10000one meter-wide volume slices that comprise the study areareveals that most of the northern 10 km of ASIS was in eitherthe Degradational or Transgressive Class during the 10months between October 1 1999 and August 1 2000 (Figure14a) This result is based on the net change of the islandduring this time period and may not be valid over eitherlonger or shorter time scales The classification may be de-picted in an alongshore sense by a plot of UTM northing ver-sus volume balanceline displacement with all plotted pointscolor-coded to represent their morphodynamic class (Figure14b) This representation reveals that the central 65 km ofthe study area between UTM northing 4234500 and4241000 was almost entirely Degradational However inthe southern 25 km and in the northern 10 km Degrada-tional and Transgressive segments are finely interspersed ata scale of one to tens of meters alongshore
Given near ubiquitous volume loss in the ocean side barriercompartment the classification of most volume slices as ei-ther Degradational or Transgressive depends upon thechange in the landward barrier component In other words
507Barrier Island Lidar Metrics
Journal of Coastal Research Vol 20 No 2 2004
508 Brock Krabill and Sallenger
Journal of Coastal Research Vol 20 No 2 2004
Table 1 Changes in lidar metrics associated with four defined morpho-dynamic classes
Sign of VolumeChange
Morphodynamic Class
Aggrada-tional
Prograda-tional
Trans-gressive
Degrada-tional
OceanwardCompartment Positive Positive Negative Negative
LandwardCompartment Positive Negative Positive Negative
the sign of the volume change in the landward compartmentgenerally controls the class assignment within our northASIS demonstration LEATHERMAN (1979) investigated thesediment budget over northern ASIS during a 26 month pe-riod (February 1973 to April 1975) and determined that inspite of the occurrence of 7 discrete overwash events a smallnet loss of material occurred at each of 5 overwash fans stud-ied LEATHERMAN (1979) attributed this result to strong win-ter northeast winds that act to severely deflate washover fansand flats between overwash events
The morphodynamic classification presented herein is com-patible with the conclusion of LEATHERMAN (1979) that alongnorthern Assateague Island on overwash fans at elevationsabove the water table and in the absence of major stormseolian processes driven by strong winter northwest windsdominate over overwash deposition Region A spanning4239000 to 4240000 in UTM northing appears to typifythis style of barrier modification (Figure 14b Figure 15a)The landward barrier surface within Region A is a broad ov-erwash flat that exceeds 200 m in width over which eolianerosion likely operates quite effectively Almost all of RegionA is classed as Degradational with volume loss in both bar-rier components and little systematic change in the positionof the volume balanceline (Figure 15a) In contrast withinRegion B (UTM northing 4232700 to 4233700) 6 km to thesouth of Region A the landward barrier surface is narrowerand partially vegetated possibly limiting eolian erosion Heresites of volume gain in the landward component occur alongthe barrier and at such points the morphodynamic classswitches to Transgressive but elsewhere the classification isDegradational as is the case over much of Region A
We infer that eolian erosion is less effective at Region B increating negative sediment fluxes over the landward barriercompartment As such overwash deposition and eolian ero-sion appear to be nearly in balance on the barrierrsquos bay sidein Region B As the sign of the landward compartment vol-ume change in Region B oscillates alongshore the classifi-cation alternates between Degradational and TransgressiveGiven the strong negative change in oceanward componentvolume everywhere in Region B low net landward componentvolume change results in subtle but ubiquitous landwardshift of the volumebalance line within Region B (Figure 15b)
CONCLUSIONS
The lidar change metrics calculated for the northern 10 kmof Assateague Island for a recent annual cycle demonstratethat lidar surveys can reveal even minor barrier island evo-
lution During this 10 month period ocean shoreline changedid not correlate well with whole island geomorphic modifi-cation Overall the barrier volume balanceline a combinedlinear-volumetric static lidar metric appears to provide agreat deal of information on barrier dynamics that compli-ments analyses of the ocean shoreline change
Lidar change metrics can be used to morphodynamicallyclassify barrier islands at a fine scale in the alongshore di-rection over any desired time period that is bracketed by sep-arate airborne lidar surveys that cover the entire breadth ofthe island Morphodynamic classification reveals the relativemagnitude and the fine scale alongshore variation in geo-morphic changes and is proposed as a new method for ex-amining large lidar data sets for coherent trends and in build-ing hypotheses regarding processes driving barrier islandevolution
Overall most of the study area was determined to be De-gradational during the annual cycle investigated with vol-ume loss in both the oceanward and landward compartmentsIn general greater island width is associated with the De-gradational class possibly because exposure of washover flatsand fans above the water table is more extensive where theisland as a whole is wider This may result in eolian erosionover the bayside component that exceeds overwash depositionof the magnitude that occurs in the absence of strongnorrsquoeasters or hurricanes resulting in a net loss of volume inthe bayside component consistent with the finding of LEATH-
ERMAN (1979)
ACKNOWLEDGEMENTS
The authors thank Robert Swift for his very significant con-tributions to the success of all NASAndashUSGS coastal researchactivities We are grateful to NOAArsquos Aircraft OperationsCenter Tampa Florida for their professionalism in providingaircraft support We also thank Mr Mark Duffy of Assa-teague Island National Seashore for building the strong part-nership between ASIS USGS and NASA that has enabledthis research
LITERATURE CITED
BROCK J SALLENGER A KRABILL W SWIFT R MANIZADE SMEREDITH A JANSEN M and ESLINGER D 1999 Aircraft la-ser altimetry for coastal processes studies Coastal Sediments 99rsquo2414ndash2428
BROCK JC SALLENGER A KRABILL W SWIFT R and WRIGHTCW In press Recognition of fiducial surfaces in lidar surveys ofcoastal topography Photogrammetric Engineering and RemoteSensing
DOLAN R and HAYDEN B 1981 Storms and shoreline configura-tion Journal of Sedimentary Petrology 51 737ndash744
GROAT CG 2001 The US Geological Survey Integrated scienceto meet Americarsquos needs Sea Technology January 34ndash37
KRABILL WB WRIGHT CW SWIFT RN FREDRICK EB MAN-IZADE SS YUNGEL JK MARTIN CF SONNTAG JG DUFFYM HULSLANDER W and BROCK JC 2000 Airborne laser map-ping of Assateague National Seashore Beach PhotogrammetricEngineering and Remote Sensing 66 65ndash71
LEATHERMAN SP 1979 Migration of Assateague Island Mary-land by inlet and overwash processes Geology 7 104ndash107
LEATHERMAN SP 1983 Historical and projected shoreline chang-es Ocean City and north Assateague Island Maryland Comple-
509Barrier Island Lidar Metrics
Journal of Coastal Research Vol 20 No 2 2004
tion Report A-065-MD Maryland Water Resources Research Cen-ter 39p
MOORE L J 2000 Shoreline mapping techniques Journal of Coast-al Research 16(1) 111ndash124
SALLENGER AH KRABILL WB BROCK JC SWIFT RN JAN-SEN M MANIZADE S RICHMOND B HAMPTON M and ESLIN-GER D 1999a Airborne laser study quantifies El Nino-inducedcoastal change EOS Transactions American Geophysical Union80(8) 89 92ndash93
SALLENGER AH HOWD P BROCK J KRABILL WB SWIFTRN MANIZADE S and DUFFY M 1999b Scaling winter stormimpacts on Assateague Island MD VA Proceedings of the 4th In-ternational Symposium on Coastal Engineering and Science ofCoastal Sediment Processes 3 1814ndash1825
SALLENGER AH 2000 Storm impact scale for barrier islands Jour-nal of Coastal Research 16(3) 890ndash895
SALLENGER A KRABILL W BROCK J SWIFT R MANIZADE Sand STOCKDON H submitted a Seacliff erosion as a function ofbeach changes and extreme wave runup during the 1997ndash98 ElNino Marine Geology 21p
SALLENGER AH KRABILL WB SWIFT RN BROCK J LIST JHANSEN M HOLMAN RA MANIZADE S SONTAG J MERE-DITH A MORGAN K YUNKEL JK FREDERICK EB andSTOCKDON H submitted b Evaluation of airborne scanning laserfor coastal change applications 1 Beach topography and changessubmitted to the Journal of Coastal Research 16p
UNDERWOOD SG and HILAND MW 1995 Historical developmentof Ocean City Inlet ebb shoal and its effect on northern AssateagueIsland Report prepared for the US Army Engineer Waterways Ex-periment Station Coastal Engineering Research Center Vicks-burg Mississippi 130p
Journal of Coastal Research 20 2 498ndash509 West Palm Beach Florida Spring 2004
Barrier Island Morphodynamic Classification Based onLidar Metrics for North Assateague Island MarylandJohn C Brockdagger William B KrabillDagger and Asbury H Sallengerdagger
daggerUSGS Center for Coastaland Regional MarineStudies
600 4th Street SouthSt Petersburg FL 33701
USAjbrockusgsgov
DaggerNASA Goddard Space FlightCenter
Wallops Flight FacilityWallops Island VA 23337
USAkrabillosb1wffnasagov
ABSTRACT
BROCK JC KRABILL WB and SALLENGER AH 2004 Barrier island morphodynamic classification based onlidar metrics for North Assateague Island Maryland Journal of Coastal Research 20(2) 498ndash509 West Palm Beach(Florida) ISSN 0749-0208
In order to reap the potential of airborne lidar surveys to provide geological information useful in understandingcoastal sedimentary processes acting on various time scales a new set of analysis methods are needed This paperpresents a multi-temporal lidar analysis of north Assateague Island Maryland and demonstrates the calculation oflidar metrics that condense barrier island morphology and morphological change into attributed linear features thatmay be used to analyze trends in coastal evolution The new methods proposed in this paper are also of significantpractical value because lidar metric analysis reduces large volumes of point elevations into linear features attributedwith essential morphological variables that are ideally suited for inclusion in Geographic Information Systems
A morphodynamic classification of north Assategue Island for a recent 10 month time period that is based on therecognition of simple patterns described by lidar change metrics is presented Such morphodynamic classificationreveals the relative magnitude and the fine scale alongshore variation in the importance of coastal changes over thestudy area during a defined time period More generally through the presentation of this morphodynamic classifi-cation of north Assateague Island the value of lidar metrics in both examining large lidar data sets for coherenttrends and in building hypotheses regarding processes driving barrier evolution is demonstrated
ADDITIONAL INDEX WORDS Remote sensing lidar Airborne Topographic Mapper barrier islands geomorphologyAssateague Island
INTRODUCTION
The topography of much of the contiguous US coastlinehas recently been surveyed using a NASA airborne topo-graphic lidar system (BROCK et al 1999 GROAT et al 2001KRABILL et al 2000 SALLENGER et al 1999a SALLENGER etal 1999b SALLENGER et al submitted a) This data set in-cludes repeat coverage over many coastal reaches is unprec-edented in its areal coverage and fine scale and undoubtedlycontains a wealth of geological information However in or-der to realize the potential of this extensive data set to ad-vance understanding of coastal change there is a need tocreate a set of new analysis methods Essentially the re-quirement is to develop unique algorithms that can reducelidar-based digital elevation models to parameters that cap-ture fundamental aspects of morphology and morphologicalchange at a fine scale in the alongshore direction
In the case of barrier islands that have been surveyed re-petitively to detect modification it is desirable to devise pat-tern recognition techniques that use these distilled parame-ters or lidar metrics in an alongshore classification of mor-phodynamic behavior Ultimately the aim is to associate li-
01048 received and accepted in revision 25 July 2002
dar-based morphodynamic classification to sedimentaryprocesses that modify barrier islands over various timescales We present an approach that is based upon the cal-culation of lidar metrics that synthesize the information pro-vided by both single and repeated lidar surveys of barrierislands
Northern Assateague Island National Seashore (ASIS) waschosen as the demonstration site (Figure 1) for analysis ofmorphological change mainly because of the ongoing and dy-namic evolution that is evident at this location (LEATHERMAN1983) The creation of Ocean City Inlet by a hurricane in 1933separated Assateague Island from Fenwick Island to thenorth Subsequent stabilization of the inlet by jetty construc-tion in 1935 interrupted the dominantly southward longshoresediment transport and caused severe erosion rates up to 12m per year at the northern end of Assateague Island (UN-
DERWOOD and HILAND 1995) Trapping of the littoral drift atOcean City has also created extreme alongshore gradients insand starvation and erosion rates over the northern 10 kmof Assateague Island (LEATHERMAN 1979)
The disequilibrium conditions caused by the Ocean Cityjetties have greatly accelerated overwash processes and bar-rier migration within the study area creating an excellentsite to investigate coastal change Frequent overwash has re-
499Barrier Island Lidar Metrics
Journal of Coastal Research Vol 20 No 2 2004
Figure 1 Location map showing Assateague Island and the study area that covers the width of the island and extends from UTM northing 4232000to UTM northing 4242000
moved dunes thereby simplifying the barrier morphologyand has also severely limited the extent and height of vege-tation Both of these effects decrease ambiguity in the inter-pretation of lidar surveys by reducing the island terrain tomostly unvegetated beachface and washover fans or flats(BROCK et al in press) Finally Assateague Island is also anexcellent site for our analysis due to the proximity of thisbarrier to NASA Wallops Flight Facility and the resultinghigh frequency of NASA Airborne Topographic Mapper(ATM) overflights Indeed it is unlikely that any other bar-
rier island has been surveyed with lidar more often than As-sateague Island the target of over 20 separate surveys since1995
OBJECTIVES
The focus of this paper is to present methods for the cal-culation of a set of lidar-based metrics that encapsulate boththe static morphology and morphological change of barrierislands This paper presents an analysis covering the north-
500 Brock Krabill and Sallenger
Journal of Coastal Research Vol 20 No 2 2004
Figure 2 Flowchart for the lidar static metrics analysis
Figure 3 East-to-west volume slice at UTM northing 4239590 depict-ing the barrier island elevation profile and the calculated UTM eastinglocations of the ocean shoreline (red) the bay shoreline (purple) and theeast-to-west volume balanceline (green)ern 10 km of ASIS (Figure 1) MarylandVirginia to address
the following objectives
(1) to develop lidar static metrics that condense the mor-phology of a barrier island into a set of attributed linesassociated with both a shoreline datum and the along-shore variation in island volume
(2) to describe the calculation of lidar change metrics basedon the differencing of static metrics estimated for repeat-ed topographic lidar surveys of north ASIS separated bya 10 month time interval
(3) to present a morphodynamic classification of north ASISfor this 10 month time period that is based on lidarchange metrics
METHODS
The NASA ATM (KRABILL et al 2000) was used to surveyASIS on October 1 1999 and again 10 months later on Au-gust 1 2000 These surveys each resulted in a data set ofelevation measurements at densities up to about one pointper square meter and referenced to the WGS-84 ellipsoidThese point elevations were converted to the NAD83 horizon-tal datum and the NAVD88 vertical datum and to the UTMhorizontal coordinate system by use of the LaserMap pro-cessing system developed at the USGS Center for Coastaland Regional Marine Studies One km by one km grid tilesthat cover the area of each survey were created and thesetiles were composited and scaled to produce two digital ele-vation models (DEMs) at a one meter grid cell dimension thatcover the study area the northernmost 10 km of ASIS Com-parisons to ground-based systems have shown that the ver-tical accuracy of elevation measurements acquired by theNASA ATM over beaches is approximately 15 cm RMS (SAL-
LENGER et al submitted b)A lidar metrics analysis was performed on one meter-wide
east-to-west DEM rows or volume slices that represent a
rigidly defined set of cross-shore profiles extracted from asurface created from the individual elevation measurementsNorth ASIS trends north-northeast to south-southwest (Fig-ure 1) and accordingly a fixed east-to-west orientationroughly normal to the general shoreline orientation was cho-sen for the analysis This uniform azimuth for the analysissimplified the computation and is preferable because the lin-ear static metrics essentially attributed lines that traversethe islandrsquos length are not necessarily parallel and also varyin their compass bearing with both location and time Assuch it is not practical to perform the lidar metrics analysiseverywhere in a shorenormal orientation In fact it is notnecessary to maintain a shorenormal bearing in calculatingthe lidar metrics described in this paper provided that theorientation used is reported along with the results and a con-sistent approach is used for all surveys to be reduced to lidarmetrics and compared for a given coastal reach
Static Metrics
Static lidar metrics use the entire DEM over the breadthof the barrier island to condense morphology at the time of aparticular lidar survey into a limited set of variables Thereare three types of static metrics (linear volumetric and com-bined linearvolumetric) and all are evaluated for each vol-ume slice Following the preparation of a lidar DEM the stat-ic metrics analysis begins with the extraction of the volumeslice at the southernmost UTM northing position (Figure 2)
Next the ocean and bay shorelines herein called the linearstatic metrics are determined There are a number of possi-ble approaches to fix the map position of the shoreline onlidar-based cross-shore profiles The development of methodsfor the definition of shorelines based on airborne lidar sur-
501Barrier Island Lidar Metrics
Journal of Coastal Research Vol 20 No 2 2004
Figure 4 Lidar elevation image of a one km north-south section of ASIS with the estimated linear static metrics plotted (red ocean shoreline greenvolume balanceline purple bay shoreline) The lidar elevation image is scaled from 10 m NAVD88 (black) to 30 m NAVD88 (white) and the regionslandward of the bay shoreline and oceanward of the ocean shoreline or above 30 m NAVD88 are masked to black The elevation image and the lidarmetrics shown are based on the October 1 1999 NASA ATM lidar survey
Figure 5 Flowchart for the change metrics analysis
veys is an area of active research (MOORE 2000) One chal-lenge is to accurately determine a lidar-based shoreline po-sition at a datum that may fall quite low on the beachfacewhile avoiding the use of any slightly oceanward water sur-face elevations that introduce errors Should that datum belower than the wave crests at the time of the lidar surveyreliable evaluation of the shoreline position using beachfaceelevations about the shoreline datum requires the discrimi-nation of land versus water surface elevations in the lidarpoints or grid cells Improvements in methods to identify thewater surface based on either the lidar data itself or on an-cillary multispectral images will help resolve this difficultyin the near future
In this study we avoided this complication by fixing theshoreline datum at 10 m NAVD88 well above the highestwater surface elevations encountered during either lidar sur-vey used in the analyses Elevations along the current vol-ume slice that exceed the selected shoreline datum are iso-lated (Figure 3) and the most oceanward of these cells thepreliminary shoreline cell is identified Next both the ele-vation of this preliminary shoreline cell and that of the im-mediately adjacent oceanward cell are compared to the ele-
502 Brock Krabill and Sallenger
Journal of Coastal Research Vol 20 No 2 2004
Figure 6 Plot of the UTM easting position of the ocean shoreline (red)and the volume balanceline (green) versus barrier island UTM northingposition for October 1 1999
Figure 7 Plot of the total barrier island volume in an east-west sliceone meter-wide and above the shoreline datum versus barrier islandUTM northing position for October 1 1999
vation of the chosen shoreline datum and the member of thiscell-pair closest in elevation to the datum is fixed as the finalocean shoreline slice cell The UTM easting and northing co-ordinates of the identified ocean shoreline cell are recordedas a shoreline point In order to allow linear extrapolation tothe shoreline UTM easting position at lower even sub-merged datums the mean slope of the beachface at eleva-tions above the tops of the highest ocean swells is also re-corded A parallel procedure is followed to determine the bayshoreline slice cell and the UTM easting value of the iden-tified bay shoreline cell
The total slice volume is then determined by summing thecell volume above the shoreline datum and between the oceanand bay shoreline UTM easting positions This value is thendivided by a factor of two in order to determine the half-volume of the current slice The UTM easting value of thevolume balance point of the current slice is then determinedby summing the slice volume from the bay shoreline to thepoint at which the summed partial volume equals the slicehalf-volume The UTM easting value for this point along theislandrsquos east-to-west volume balanceline a combined linearvolumetric static metric is recorded and the entire processis repeated for each of the cross-shore slices in the DEM Thisprocedure results in attributed lines or lsquolsquovectorsrsquorsquo that consti-tute the static linear and volumetric metrics for the barrierreach under study at a one-meter resolution in UTM northing(Figure 4) Note that the reduction of lidar data sets into met-rics converts large volumes of point elevations into attributedlinear features that are ideally suited for inclusion in a Geo-graphic Information System
Change Metrics
Two types of lidar change metrics linear and volumetricmay be calculated if two surveys separated in time are con-ducted over the same coastal reach First the static metrics
described above are generated for each separate survey andthe region of survey overlap is determined (Figure 5) Thechange metrics algorithm reads the static metrics for boththe first and second surveys and determines the region ofoverlap as a range in UTM northing Within the overlap re-gion the static linear metrics are compared at a one-meterresolution in UTM northing to calculate the eastward (ocean-ward) or westward (landward) displacements of the volumebalanceline and the ocean and bay shorelines Similarly theslice volume change is calculated at each UTM northing po-sition within the overlap region Next the DEM created fromthe second survey is analyzed with respect to the volume bal-anceline determined from the first survey DEM in order tocalculate the remaining volumetric change metrics 1) theslice volume change oceanward of the original volume bal-anceline and 2) the slice volume change landward of the orig-inal volume balanceline This step involves summing the slicevolume for the second survey east of the new bay shorelineabove the shoreline datum and west of the volume balance-line determined for the first survey This quantity is thendifferenced from the first survey half-volume at the sameUTM northing position An analogous calculation is also car-ried out for the second survey partial slice east of the firstsurvey volume balanceline and the entire change metricanalysis is repeated for each UTM northing position at a one-meter north-south resolution
RESULTS
Static Metrics
As expected the ocean shoreline determined from the Oc-tober 1 1999 lidar survey is highly linear but the corre-sponding volume balanceline displays relatively high vari-ability with significant and coherent landward and ocean-ward perturbations (Figure 6) The slice volume vector deter-mined for this date reveals a broad volumetric minimum in
503Barrier Island Lidar Metrics
Journal of Coastal Research Vol 20 No 2 2004
Figure 8a Plot of eastward ocean shoreline displacement versus barrierisland UTM northing position for time period between October 1 1999and August 1 2000Figure 8b Plot of eastward volume balanceline displacement versusbarrier island UTM northing position for time period between October 11999 and August 1 2000
Figure 9 Plot of one meter-wide slice volume change versus barrier is-land UTM northing position for time period between October 1 1999 andAugust 1 2000
the center of the study area (UTM northing 4234500 to4238000) where the east-to-west island volume was lessthan 150 m3 Slice volume exceeded 500 m3 at both the southand north end of the study area and appeared to vary onseveral spatial scales alongshore (Figure 7)
Change Metrics
The ocean shoreline migrated 5 to 15 m oceanward overmost of the southern portion of the study area between Oc-tober 1 1999 and August 1 2000 with the exception of land-ward incursions centered near UTM northing 4232100 and4233500 (Figure 8a) Along most of the northern 5 km of thestudy region shoreline change varied between oceanwardand landward within an absolute maximum magnitude ofabout 10 m However between UTM northing 4236100 and
4238000 the shoreline shift was dominantly landward up toabout 12 m and north of UTM northing 4240200 an ocean-ward shift of up to 50 m along a roughly 800 m long reachwas evident
The volume balanceline change (Figure 8b) is markedly dis-similar to ocean shoreline change in both sign and amplitudeVolume balanceline displacement displays much greater var-iablity and oscillates widely about zero on a very fine along-shore scale Focused and extreme landward and oceanwardvolume balanceline shifts exceeding 40 m are apparent Anextreme landward shift in the northernmost 05 km of thestudy area is matched by a sharp increase in slice volume(Figure 9) but is not associated with any significant oceanshoreline displacement
The general trend of shoreline movement over much of thestudy region was oceanward and the slice volume decreasedover most of this coastal reach during the 10 month studytime period (Figure 9) outside of regions of predominant vol-ume increase in the northernmost and southernmost one kmcoastal segments The change in slice volume reveals a dis-tinct oscillation with latitude producing localized peaks ofpositive slice volume change that are apparent throughoutmost of the study area
The slice volume change in the oceanward and landwardbarrier compartments to the east and the west of the October1 1999 volume balanceline reveal similar patterns (Figure10) Generally both the oceanward and landward barriercomponents typically lost about 10 m3 of volume but bothgains and losses of slice volume exceeded 50 m3 at varioussites Alongshore variability of slice volume change is appar-ent in both components on several spatial scales In thesouthernmost and northernmost three km of the study areathe landward component has a much more diffuse pattern ofvolume change alongshore This more scattered pattern ofslice volume change alongshore may be due to the greater
504 Brock Krabill and Sallenger
Journal of Coastal Research Vol 20 No 2 2004
Figure 10a Plot of the one meter-wide slice volume change oceanwardof the October 1 1999 volume balanceline versus barrier island UTMnorthing position for time period between October 1 1999 and August 12000Figure 10b Plot of the one meter-wide slice volume change landward ofthe October 1 1999 volume balanceline versus barrier island UTM north-ing position for time period between October 1 1999 and August 1 2000 Figure 11a Plot of eastward ocean shoreline displacement (m) versus
eastward volume balanceline displacement (m) for time period betweenOctober 1 1999 and August 1 2000Figure 11b Plot of eastward ocean shoreline displacement (m) versuseastward volume balanceline displacement (m) for time period betweenOctober 1 1999 and August 1 2000relative importance of areally extensive eolian processes over
the wider reaches of the barrierThe authors recognize that the apparent slice volume
changes between the two lidar surveys of ASIS are in somepart a result of errors in the elevation measurements provid-ed by the NASA ATM system (SALLENGER et al submitted b)A thorough understanding of the complex interaction of thevertical and horizontal accuracies of the NASA ATM data setacross variable ground morphology is necessary to fully eval-uate the error in volume estimation Evaluation of the accu-racy of barrier island volume change based on multiple sur-veys involves additional factors related to the repeatability oftopographic mapping by airborne lidar over differing time
scales As such a complete assessment of the errors in lidar-based volume and volume change estimates is outside thescope of this paper The authors recommend further study ofthe magnitudes and sources of error in barrier volume met-rics based on airborne lidar
DISCUSSION
Change in shoreline position is typically used as a primeindicator of coastal behavior in studies of coastal storm re-
505Barrier Island Lidar Metrics
Journal of Coastal Research Vol 20 No 2 2004
Figure 12 Lidar elevation image map depicting ocean shorelines (red)volume balancelines (green) and bay shorelines (purple) for both October1 1999 (dots with black centers) and August 1 2000 (dots with whitecenters) Note that the volume balanceline has shifted up to about 10 mlandward at sites where no significant change has occurred in the oceanor bay shoreline position
Figure 13 Flowchart depicting a simple morphodynamic classificationscheme
sponse (DOLAN and HAYDEN 1981) or historical coastal evo-lution (LEATHERMAN 1983) However over the 10 months ex-amined here shoreline change does not predict whole islandmorphological behavior as measured by two other lidarchange metrics volume balanceline displacement or slice vol-ume change (Figures 11a and 11b) This result is likely dueto this studyrsquos restriction to one annual cycle and also thelack of any major storm during the study time period verifiedby inspection of meteorological variables recorded at theNOAA buoy located southeast of Cape May New Jersey
Generally the volume balanceline for a barrier islandshould provide a great deal of information that may not bepreserved in the ocean shoreline because the volume bal-anceline reflects the integration of all processes that haveacted to create or modify the island Alongshore undulationsin the volume balanceline correspond to events that are sig-nificant to island evolution and such events may span a widerange of time scales from long-term eolian dune formationto abrupt storm events that can result in overwash and inletformation As demonstrated here the volume balanceline ofa barrier may be evaluated at a very fine scale alongshorethrough lidar surveying Although it is a highly sensitive in-dicator of the integrated set of processes that define islandmorphology the position of the volume balanceline is mini-mally effected by seasonal change of the beachface as theposition is buffered by the entire barrier slice volume at anypoint We propose that the volume balanceline is complimen-tary to the shoreline as it provides a precise measure of thebarrier position by collapsing the entire DEM over an islandto create a composite linear feature
A displacement of the volume balanceline is by definitiona shift in the overall island position Depending on the driv-ing process our analysis reveals that shifts in the volumebalanceline may become decoupled to shifts in the adjacentshoreline This result demonstrates the value of lidar topog-raphy in understanding barrier island evolution For exam-ple within the 200 m north-south range centered about UTMnorthing 4235100 the volume balanceline shifted up toabout 15 m landward with no significant shift in either theocean or the bay shorelines Only minimal change in slicevolume ranging from 0 to minus 25 m3 (Figure 12) occurredin this region This shift in barrier volumetric position ap-parently occurred without change in either shoreline throughberm relocation a change in the internal volume distributionof the barrier
Similar but more extreme and oceanward rather thanlandward displacement of the volume balanceline was ob-served south of the study area due to the construction of anartificial dune This suggests that the volume balancelinemay be useful in resource management applications such asthe monitoring of barrier island change during and subse-quent to beach renourishment Investigation of the sensitiv-ity of the volume balanceline to the chosen shoreline datumand also the impact of divergence of the lidar metrics analysisfrom a strict shorenormal orientation warrant further inves-tigation
Morphodynamic Classification
We applied a simple pattern recognition technique to thelidar change metrics in order to classify morphodynamic be-havior over the entire study area and 10 month time periodat a one meter resolution in UTM northing This morphody-namic classification is based on the most detailed lidar vol-umetriclinear change metrics the slice volume changes forthe landward and oceanward barrier compartments relativeto the volume balanceline developed from the first surveyMorphodynamic classification reveals the relative magnitudeand the fine scale alongshore variation in the importance of
506 Brock Krabill and Sallenger
Journal of Coastal Research Vol 20 No 2 2004
Figure 14a Morphodynamic classification for the 10000 one meter-wideeast-west slices along the northernmost ten km of ASIS depicted as ascatterplotFigure 14b Plot of eastward volume balanceline displacement versusbarrier island UTM northing position for time period between October 11999 and August 1 2000 with individual points color-coded by morpho-dynamic class (Red Degradational Green Transgressive Purple Pro-gradational Black Aggradational)
rarr
Figure 15a Lidar elevation image map over Region A two km south of the northern tip of Assateague Island Depicted on this image map are oceanshorelines (red) volume balancelines (green) and bay shorelines (purple) for both October 1 1999 (dots with black centers) and August 1 2000 (dotswith white centers) The vertical bar on the left side of the map depicts the morphodynamic class (Red Degradational Green Transgressive) at analongshore spatial resolution of one meter in UTM northingFigure 15b Lidar elevation image map over Region B eight km south of the northern tip of Assateague Island Depicted on this image map are oceanshorelines (red) volume balancelines (green) and bay shorelines (purple) for both October 1 1999 (dots with black centers) and August 1 2000 (dotswith white centers) The vertical bar on the left side of the map depicts the morphodynamic class (Red Degradational Green Transgressive) at analongshore spatial resolution of one meter in UTM northing
coastal changes over the study area during a defined timeperiod In the implementation presented here each of the10000 slice volumes within the 10 km north-south study re-gion is classified separately based solely on whether thechanges in the ocean and bay side barrier compartments arenegative or positive The classification takes the form of adecision tree with an initial separation based on the sign ofthe oceanward compartment volume change followed by asecond split guided by the sign of the change in the landwardcompartment volume (Figure 13) All of the volume slicesrepresented by their UTM northing value must fall into oneof four possible morphodynamic classes associated with thefollowing four patterns described in Table 1
If the island at a given location alongshore is categorizedas Aggradational it is gaining volume on both sides in con-trast to the Degradational Class which is associated withvolume loss in both the ocean and bay side compartmentsWithin these two classes the volume balanceline may be mov-ing either landward or oceanward depending on the relativemagnitudes of the changes in the two barrier compartmentsGenerally the Progradational Class implies oceanwardmovement of the volume balanceline and the TransgressiveClass implies a landward shift of this line However over the10 month time period analyzed here this volume balancelinebehavior is not a strict requirement because our pattern rec-ognition is based on only the signs of volume changes andthe eastndashwest distribution of that volume change within acompartment is not considered
A plot of the morphodynamic classification of the 10000one meter-wide volume slices that comprise the study areareveals that most of the northern 10 km of ASIS was in eitherthe Degradational or Transgressive Class during the 10months between October 1 1999 and August 1 2000 (Figure14a) This result is based on the net change of the islandduring this time period and may not be valid over eitherlonger or shorter time scales The classification may be de-picted in an alongshore sense by a plot of UTM northing ver-sus volume balanceline displacement with all plotted pointscolor-coded to represent their morphodynamic class (Figure14b) This representation reveals that the central 65 km ofthe study area between UTM northing 4234500 and4241000 was almost entirely Degradational However inthe southern 25 km and in the northern 10 km Degrada-tional and Transgressive segments are finely interspersed ata scale of one to tens of meters alongshore
Given near ubiquitous volume loss in the ocean side barriercompartment the classification of most volume slices as ei-ther Degradational or Transgressive depends upon thechange in the landward barrier component In other words
507Barrier Island Lidar Metrics
Journal of Coastal Research Vol 20 No 2 2004
508 Brock Krabill and Sallenger
Journal of Coastal Research Vol 20 No 2 2004
Table 1 Changes in lidar metrics associated with four defined morpho-dynamic classes
Sign of VolumeChange
Morphodynamic Class
Aggrada-tional
Prograda-tional
Trans-gressive
Degrada-tional
OceanwardCompartment Positive Positive Negative Negative
LandwardCompartment Positive Negative Positive Negative
the sign of the volume change in the landward compartmentgenerally controls the class assignment within our northASIS demonstration LEATHERMAN (1979) investigated thesediment budget over northern ASIS during a 26 month pe-riod (February 1973 to April 1975) and determined that inspite of the occurrence of 7 discrete overwash events a smallnet loss of material occurred at each of 5 overwash fans stud-ied LEATHERMAN (1979) attributed this result to strong win-ter northeast winds that act to severely deflate washover fansand flats between overwash events
The morphodynamic classification presented herein is com-patible with the conclusion of LEATHERMAN (1979) that alongnorthern Assateague Island on overwash fans at elevationsabove the water table and in the absence of major stormseolian processes driven by strong winter northwest windsdominate over overwash deposition Region A spanning4239000 to 4240000 in UTM northing appears to typifythis style of barrier modification (Figure 14b Figure 15a)The landward barrier surface within Region A is a broad ov-erwash flat that exceeds 200 m in width over which eolianerosion likely operates quite effectively Almost all of RegionA is classed as Degradational with volume loss in both bar-rier components and little systematic change in the positionof the volume balanceline (Figure 15a) In contrast withinRegion B (UTM northing 4232700 to 4233700) 6 km to thesouth of Region A the landward barrier surface is narrowerand partially vegetated possibly limiting eolian erosion Heresites of volume gain in the landward component occur alongthe barrier and at such points the morphodynamic classswitches to Transgressive but elsewhere the classification isDegradational as is the case over much of Region A
We infer that eolian erosion is less effective at Region B increating negative sediment fluxes over the landward barriercompartment As such overwash deposition and eolian ero-sion appear to be nearly in balance on the barrierrsquos bay sidein Region B As the sign of the landward compartment vol-ume change in Region B oscillates alongshore the classifi-cation alternates between Degradational and TransgressiveGiven the strong negative change in oceanward componentvolume everywhere in Region B low net landward componentvolume change results in subtle but ubiquitous landwardshift of the volumebalance line within Region B (Figure 15b)
CONCLUSIONS
The lidar change metrics calculated for the northern 10 kmof Assateague Island for a recent annual cycle demonstratethat lidar surveys can reveal even minor barrier island evo-
lution During this 10 month period ocean shoreline changedid not correlate well with whole island geomorphic modifi-cation Overall the barrier volume balanceline a combinedlinear-volumetric static lidar metric appears to provide agreat deal of information on barrier dynamics that compli-ments analyses of the ocean shoreline change
Lidar change metrics can be used to morphodynamicallyclassify barrier islands at a fine scale in the alongshore di-rection over any desired time period that is bracketed by sep-arate airborne lidar surveys that cover the entire breadth ofthe island Morphodynamic classification reveals the relativemagnitude and the fine scale alongshore variation in geo-morphic changes and is proposed as a new method for ex-amining large lidar data sets for coherent trends and in build-ing hypotheses regarding processes driving barrier islandevolution
Overall most of the study area was determined to be De-gradational during the annual cycle investigated with vol-ume loss in both the oceanward and landward compartmentsIn general greater island width is associated with the De-gradational class possibly because exposure of washover flatsand fans above the water table is more extensive where theisland as a whole is wider This may result in eolian erosionover the bayside component that exceeds overwash depositionof the magnitude that occurs in the absence of strongnorrsquoeasters or hurricanes resulting in a net loss of volume inthe bayside component consistent with the finding of LEATH-
ERMAN (1979)
ACKNOWLEDGEMENTS
The authors thank Robert Swift for his very significant con-tributions to the success of all NASAndashUSGS coastal researchactivities We are grateful to NOAArsquos Aircraft OperationsCenter Tampa Florida for their professionalism in providingaircraft support We also thank Mr Mark Duffy of Assa-teague Island National Seashore for building the strong part-nership between ASIS USGS and NASA that has enabledthis research
LITERATURE CITED
BROCK J SALLENGER A KRABILL W SWIFT R MANIZADE SMEREDITH A JANSEN M and ESLINGER D 1999 Aircraft la-ser altimetry for coastal processes studies Coastal Sediments 99rsquo2414ndash2428
BROCK JC SALLENGER A KRABILL W SWIFT R and WRIGHTCW In press Recognition of fiducial surfaces in lidar surveys ofcoastal topography Photogrammetric Engineering and RemoteSensing
DOLAN R and HAYDEN B 1981 Storms and shoreline configura-tion Journal of Sedimentary Petrology 51 737ndash744
GROAT CG 2001 The US Geological Survey Integrated scienceto meet Americarsquos needs Sea Technology January 34ndash37
KRABILL WB WRIGHT CW SWIFT RN FREDRICK EB MAN-IZADE SS YUNGEL JK MARTIN CF SONNTAG JG DUFFYM HULSLANDER W and BROCK JC 2000 Airborne laser map-ping of Assateague National Seashore Beach PhotogrammetricEngineering and Remote Sensing 66 65ndash71
LEATHERMAN SP 1979 Migration of Assateague Island Mary-land by inlet and overwash processes Geology 7 104ndash107
LEATHERMAN SP 1983 Historical and projected shoreline chang-es Ocean City and north Assateague Island Maryland Comple-
509Barrier Island Lidar Metrics
Journal of Coastal Research Vol 20 No 2 2004
tion Report A-065-MD Maryland Water Resources Research Cen-ter 39p
MOORE L J 2000 Shoreline mapping techniques Journal of Coast-al Research 16(1) 111ndash124
SALLENGER AH KRABILL WB BROCK JC SWIFT RN JAN-SEN M MANIZADE S RICHMOND B HAMPTON M and ESLIN-GER D 1999a Airborne laser study quantifies El Nino-inducedcoastal change EOS Transactions American Geophysical Union80(8) 89 92ndash93
SALLENGER AH HOWD P BROCK J KRABILL WB SWIFTRN MANIZADE S and DUFFY M 1999b Scaling winter stormimpacts on Assateague Island MD VA Proceedings of the 4th In-ternational Symposium on Coastal Engineering and Science ofCoastal Sediment Processes 3 1814ndash1825
SALLENGER AH 2000 Storm impact scale for barrier islands Jour-nal of Coastal Research 16(3) 890ndash895
SALLENGER A KRABILL W BROCK J SWIFT R MANIZADE Sand STOCKDON H submitted a Seacliff erosion as a function ofbeach changes and extreme wave runup during the 1997ndash98 ElNino Marine Geology 21p
SALLENGER AH KRABILL WB SWIFT RN BROCK J LIST JHANSEN M HOLMAN RA MANIZADE S SONTAG J MERE-DITH A MORGAN K YUNKEL JK FREDERICK EB andSTOCKDON H submitted b Evaluation of airborne scanning laserfor coastal change applications 1 Beach topography and changessubmitted to the Journal of Coastal Research 16p
UNDERWOOD SG and HILAND MW 1995 Historical developmentof Ocean City Inlet ebb shoal and its effect on northern AssateagueIsland Report prepared for the US Army Engineer Waterways Ex-periment Station Coastal Engineering Research Center Vicks-burg Mississippi 130p
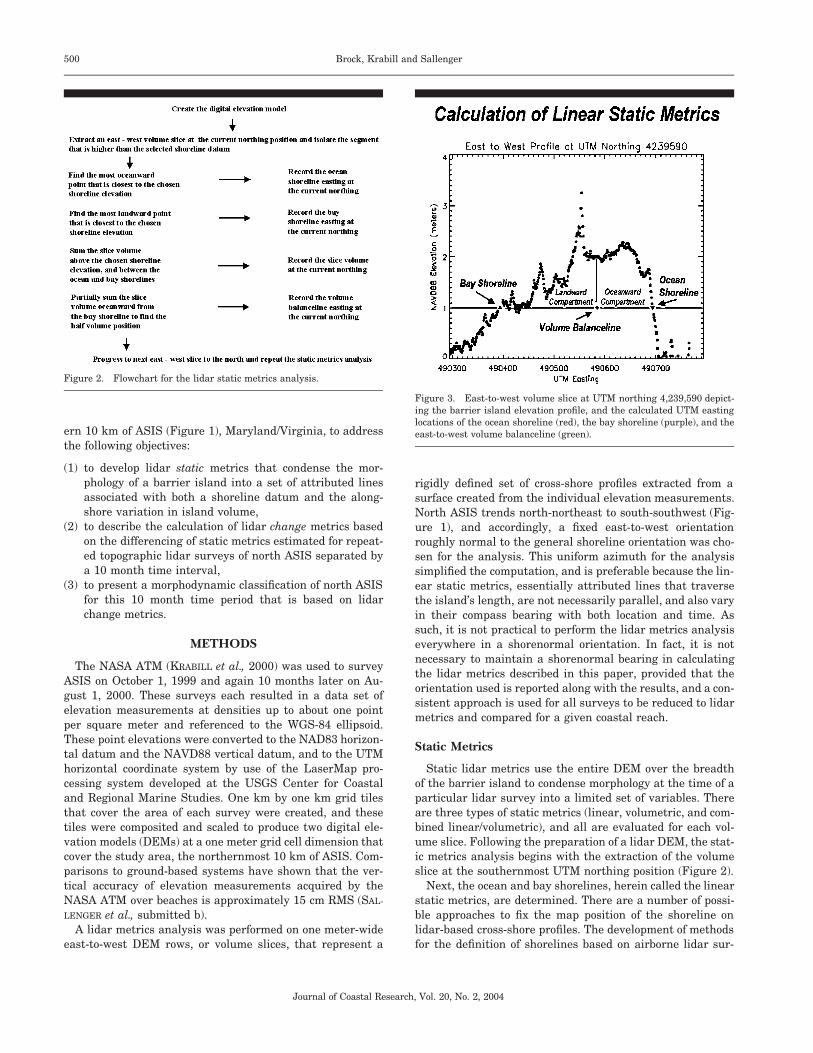
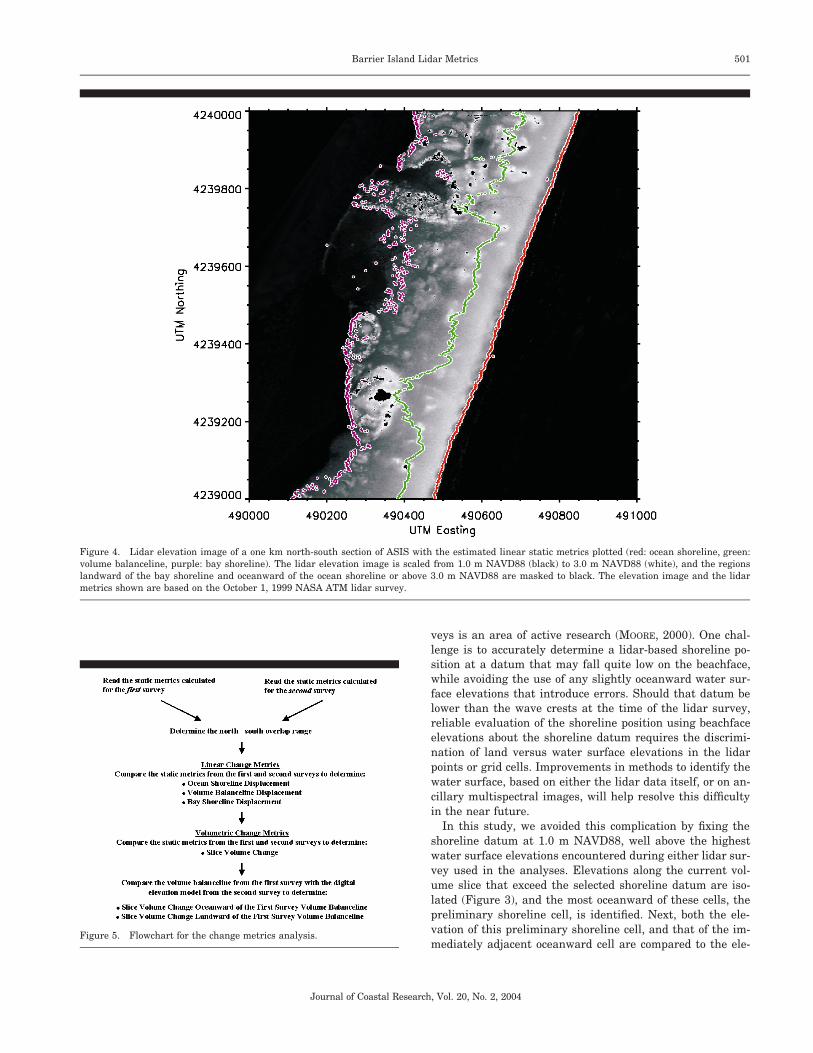
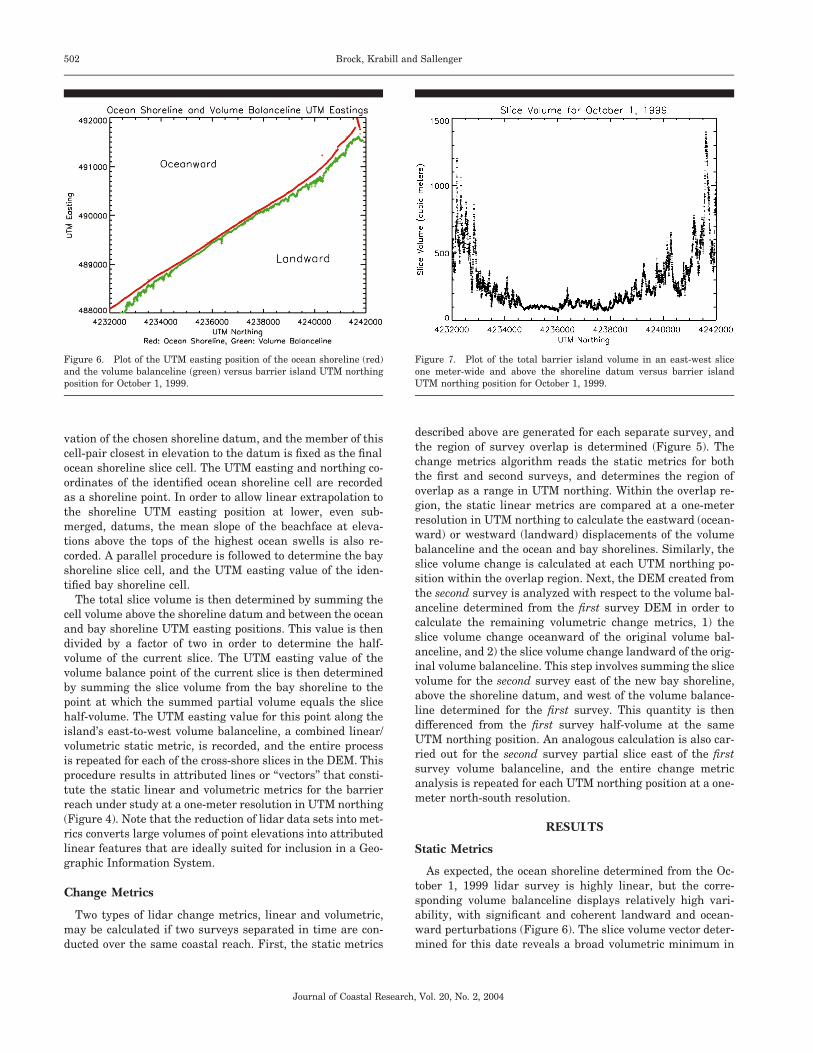
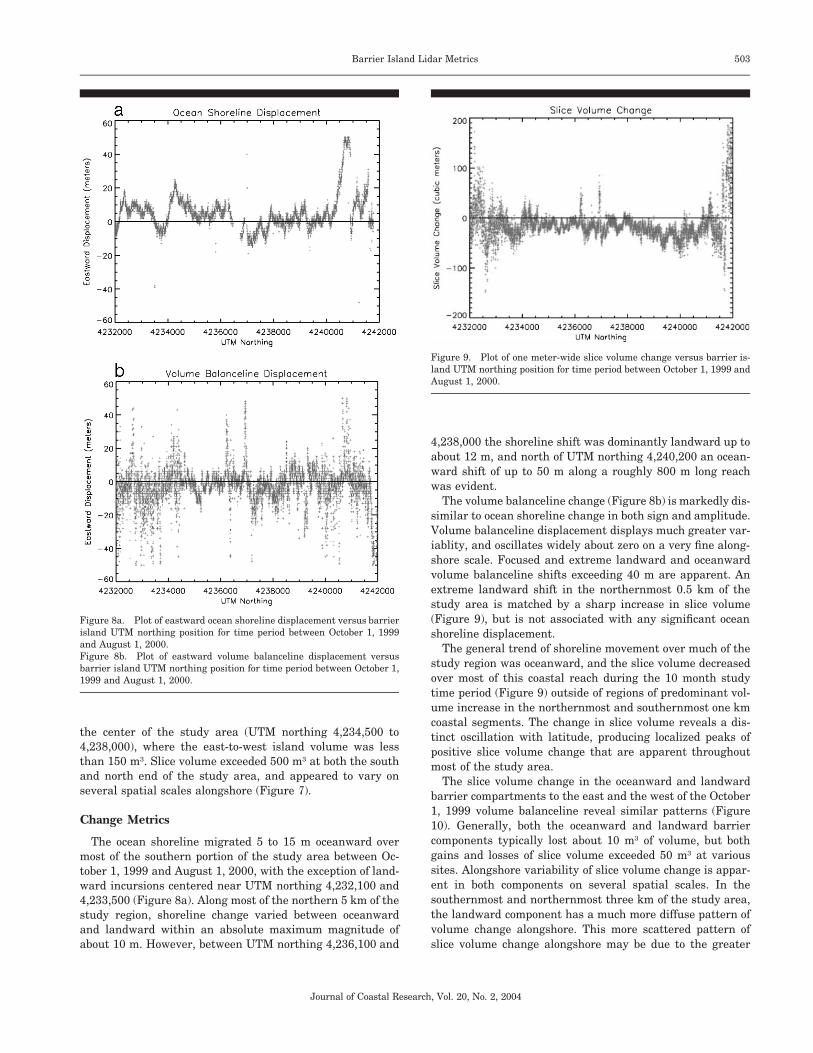
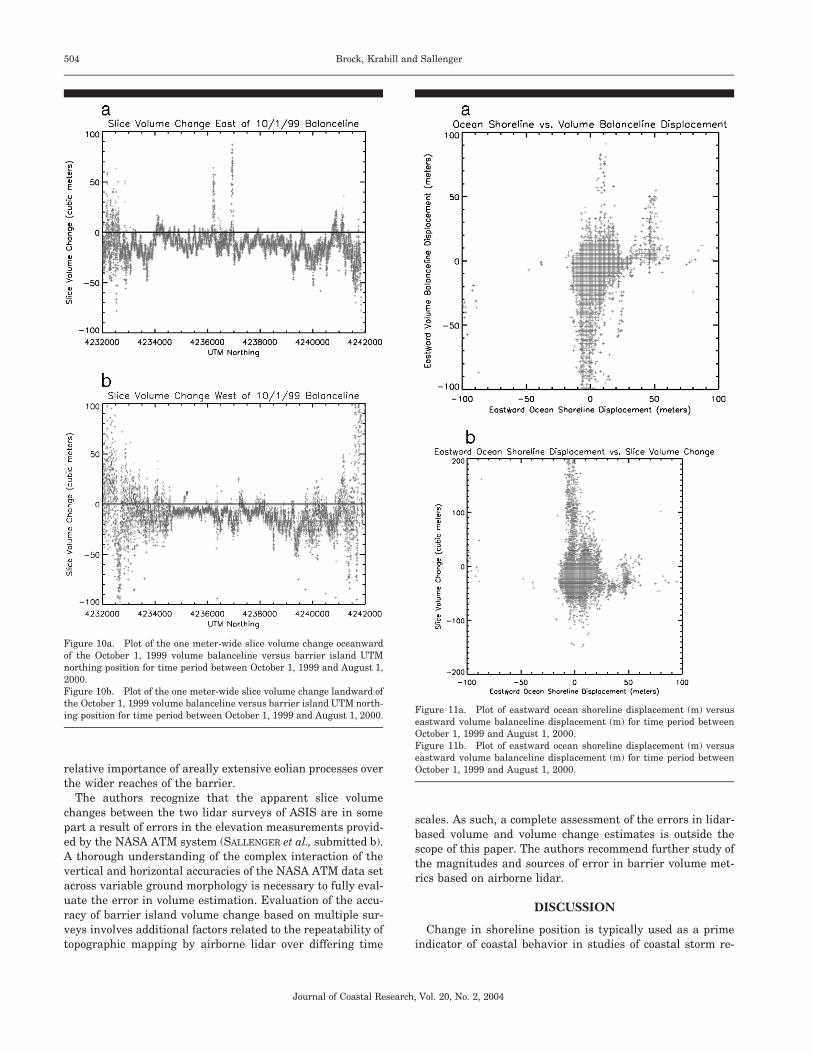
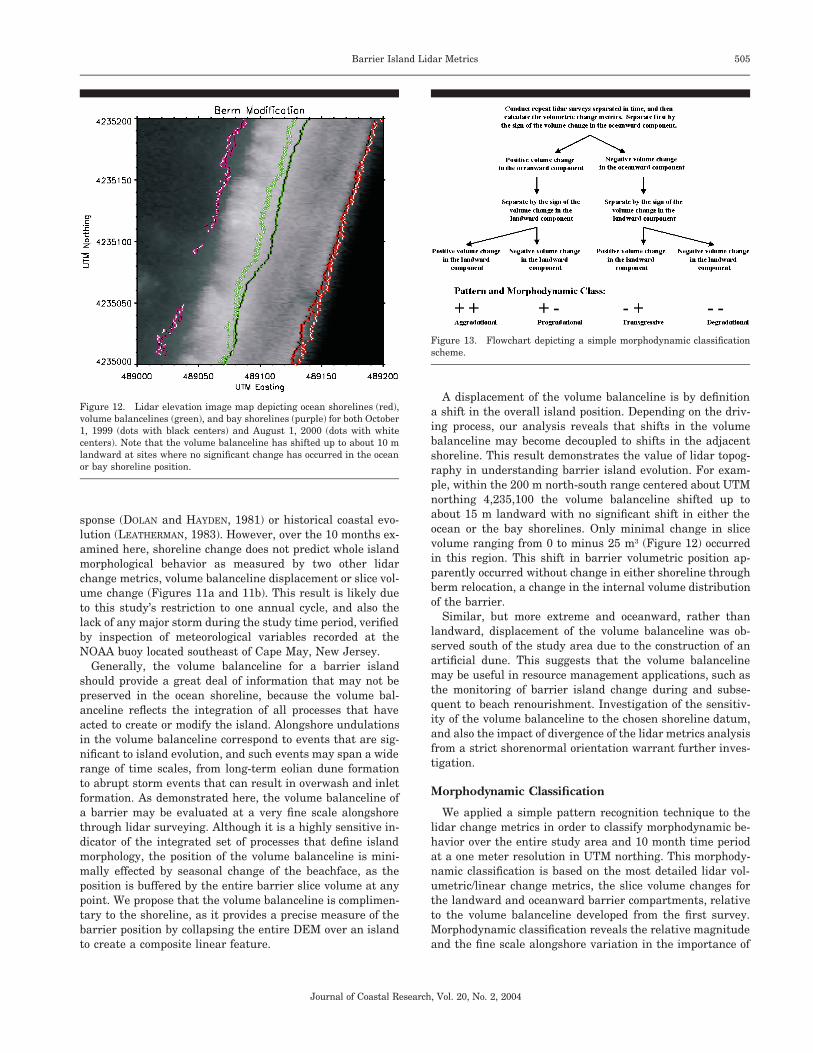
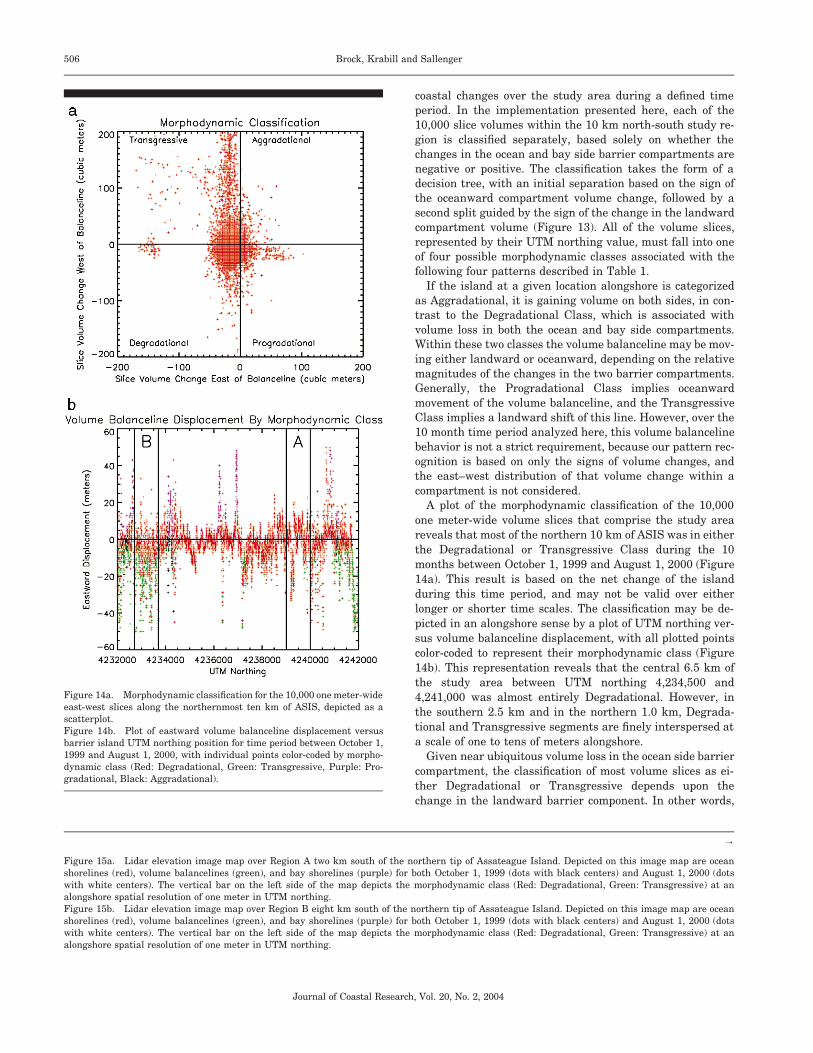
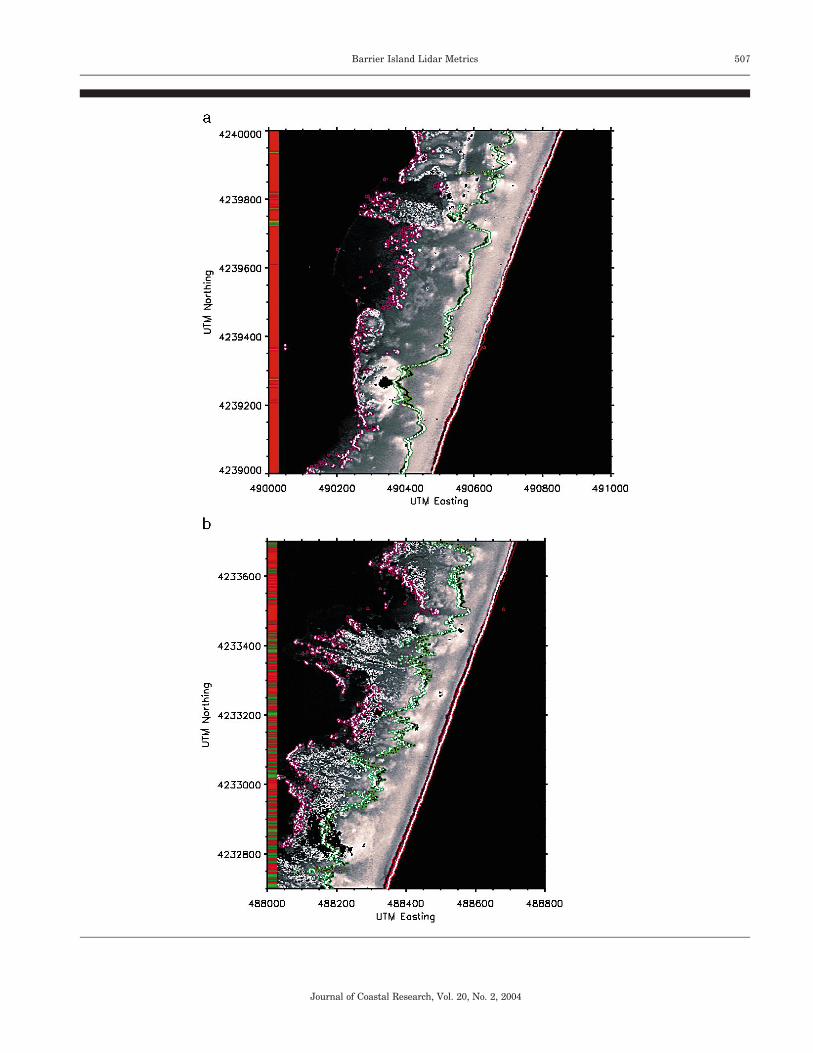
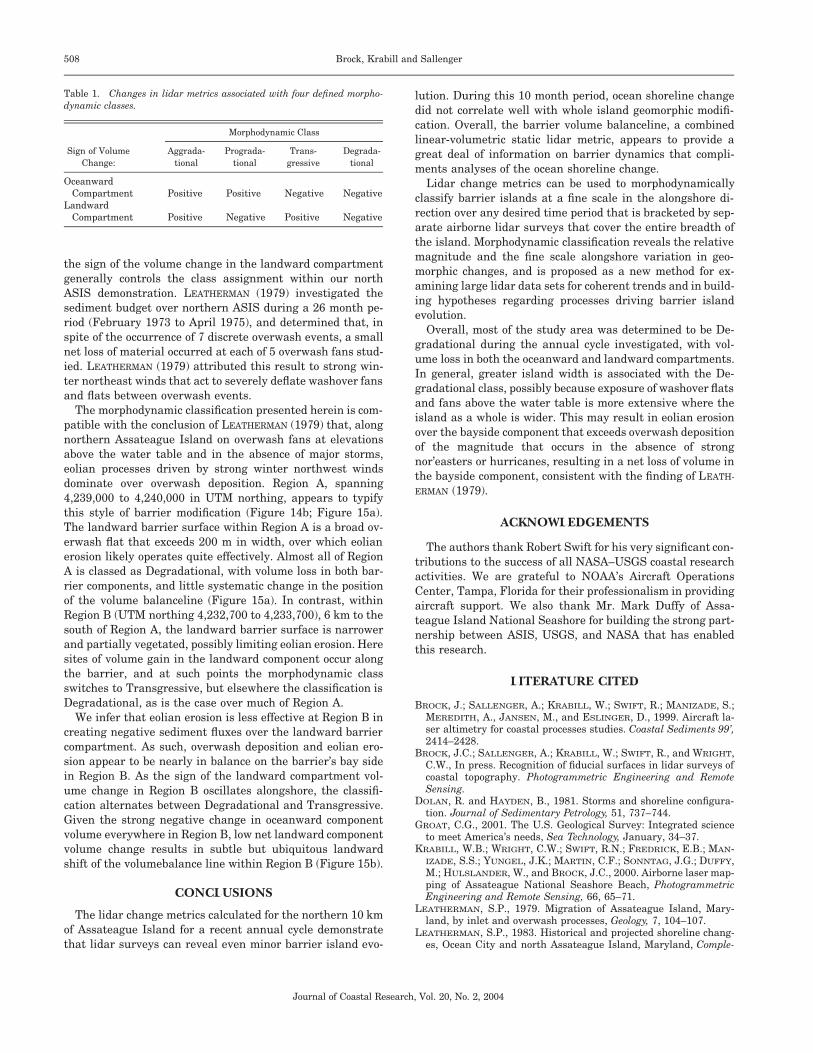