Embed Size (px)
Citation preview

BARRETT RANCH EAST PROJECT Air Quality Technical Report
Prepared for November 2014
Barrett Winn, LLC &
Antelope RBVP, LP
Appendix B
B - 1

B - 1

BARRETT RANCH EAST PROJECT Air Quality Technical Report
Prepared for November 2014
Barrett Winn, LLC &
Antelope RBVP, LP
2600 Capitol Avenue
Sacramento, California 95816
916-231-1266
www.esassoc.com
Oakland
Orlando
Palm Springs
Petaluma
Portland
Sacramento
San Diego
Santa Cruz
San Francisco
Seattle
Tampa
Woodland Hills
B - 2

B - 3
Barrett Ranch East i ESA / 140728 Air Quality Technical Report November 2014
Table of Contents
Introduction ............................................................................................................................... 1
Project Description.................................................................................................................... 1
Environmental Setting .............................................................................................................. 1
Climate and Topography..................................................................................................... 1
Federal and State Ambient Air Quality Standards .............................................................. 4
Toxic Air Contaminants ...................................................................................................... 9
Sensitive Receptors ............................................................................................................. 9
Greenhouse Gases and Climate Change ........................................................................... 10
Air Quality Regulatory Setting ............................................................................................... 11
Federal............................................................................................................................... 11
State................................................................................................................................... 12
Local ................................................................................................................................. 12
Climate Change and Greenhouse Gas Regulatory Setting ..................................................... 12
Significance Thresholds .......................................................................................................... 14
Project Specific Thresholds - Criteria Pollutants, Toxic Air
Contaminants, and Odors .................................................................................................. 14
Cumulative Thresholds - Criteria Pollutants..................................................................... 15
Cumulative Thresholds - Greenhouse Gases .................................................................... 15
Approach and Methodology ................................................................................................... 15
Construction Emissions Methodology .............................................................................. 15
Operational Emissions Methodology ................................................................................ 16
Greenhouse Gas Emissions Methodology ........................................................................ 17
Project Impacts........................................................................................................................ 18
Construction Impacts ........................................................................................................ 18
Operational Impacts .......................................................................................................... 21
Cumulative Impacts .......................................................................................................... 23
References ............................................................................................................................... 26
Appendix A – Criteria Pollutant Emissions
Appendix B – Greenhouse Gas Emissions
Appendix C – Operational Air Quality Mitigation Plan
B - 4

Barrett Ranch East ii ESA / 140728 Air Quality Technical Report November 2014
Figures and Tables
Figure 1. General Location of Barrett Ranch East Project ................................................. 2
Figure 2. Specific Location of Barrett Ranch East Project ................................................. 3
Table 1. State and National Ambient Air Quality Standards .............................................. 5
Table 2. State and National Ambient Air Quality Attainment Status for Sacramento
County ................................................................................................................................. 6
Table 3. Ozone Monitoring Results .................................................................................... 7
Table 4. Carbon Monoxide Monitoring Results ................................................................. 7
Table 5. Particulate Matter Monitoring Results .................................................................. 9
Table 6. Maximum Daily Construction Emissions (unmitigated) .................................... 18
Table 7. Daily Operational Emissions (pounds per day) .................................................. 22
Table 8. Operational GHG Emissions (metric tons per year, mitigated) .......................... 25
Table 9. Comparison of Operational Energy and Mobile Source GHG Emissions .......... 25
B - 5
Barrett Ranch East 1 ESA / 140728 Air Quality Technical Report November 2014
Introduction
This air quality technical report has been prepared to evaluate the potential air quality impacts of
the Barrett Ranch East Project (Project) located in the northeastern portion of Sacramento
County, California. This report describes the existing air quality in the Project area and evaluates
potential short- and long-term air quality impacts associated with the Project. The report describes
the Project’s criteria pollutant, toxic air contaminant (TAC), and greenhouse gas (GHG) impacts.
Measures to mitigate or minimize pollutant emissions associated with the proposed Project are
included, where applicable.
Project Description
The Project consists of an approximately 128-acre site that would include 495 single-family
detached residential units, 196 multi-family homes, a shopping center and parks. Figure 1 shows
the general Project location in Sacramento County, while Figure 2 shows the specific Project
location.
Environmental Setting
Climate and Topography
The Project site is located in northern Sacramento County within the Sacramento Valley Air
Basin (SVAB). The SVAB includes Sacramento County and all or portions of ten other counties
including Placer, Shasta, Tehama, Colusa, Yolo, Solano, Butte, Yuba, Sutter, and Glenn.
The SVAB is surrounded by the Coast Range to the west, the Cascade Range to the north, and
Sierra Nevada mountains to the east. The winters are wet and cool and the summers are hot and
dry.
Air pollution can be transported into the basin, but on smoggy days, air pollution emissions from
within the basin are the most significant. The southern portions of the SVAB receive air pollution
inflow, transported from the Bay Area or San Joaquin Valley air basins. On many summer days,
a “delta breeze” blows toward Sacramento from the ocean through the Carquinez Strait. These
winds can transport air pollution from the Bay Area to the SVAB.
B - 6

Barrett Ranch East 2 ESA / 140728 Air Quality Technical Report November 2014
Figure 1. General Location of Barrett Ranch East Project
Project Location
B - 7

Barrett Ranch East 3 ESA / 140728 Air Quality Technical Report November 2014
Figure 2. Specific Location of Barrett Ranch East Project
B - 8
Barrett Ranch East 4 ESA / 140728 Air Quality Technical Report November 2014
The delta breeze blows Sacramento’s air pollution toward the north end of the Sacramento Valley
and east into the Sierra Nevada foothills. On days when wind blows from the north, Sacramento
air pollution can be transported to the south into the San Joaquin Valley Air Basin.
Federal and State Ambient Air Quality Standards
Ambient air quality is affected by pollutants emitted from stationary and mobile sources.
Stationary sources are often divided into point and area sources. Point sources consist of one or
more emission sources at a facility with an identified location and are usually associated with
manufacturing and industrial processing plants. Area sources are widely distributed and consist
of many small emission sources. Area source examples include lawnmowers and other landscape
maintenance equipment, natural gas fired water and space heaters, and consumer products such as
paints, hairspray, deodorant, and similar products with evaporative emissions. Mobile sources
refer to emissions from motor vehicles, including tailpipe, evaporative, and fugitive emissions.
Air pollutants emitted by stationary and mobile sources are regulated by federal and state law.
These regulated pollutants are known as “criteria air pollutants”, and are emitted as primary and
secondary pollutants.
Primary criteria air pollutants are those that are emitted directly from sources. Carbon monoxide
(CO), nitrogen oxides (NOx), sulfur dioxide (SO2), and most forms of particulate matter (PM10
and PM2.5) are primary air pollutants. Secondary criteria air pollutants are those formed by
chemical and photochemical reactions in the atmosphere. Ozone and nitrogen dioxide are the
principal secondary pollutants.
The U.S. Environmental Protection Agency has developed National Ambient Air Quality
Standards (NAAQS) for the criteria air pollutants. At the state level, the California Air Resources
Board has developed California Ambient Air Quality Standards (CAAQS). Table 1 shows the
NAAQS and CAAQS. Areas that do not meet the NAAQS and/or CAAQS are classified as
nonattainment areas.
B - 9
Air Quality Technical Report
Barrett Ranch East 5 ESA / 140728 Air Quality Technical Report November 2014
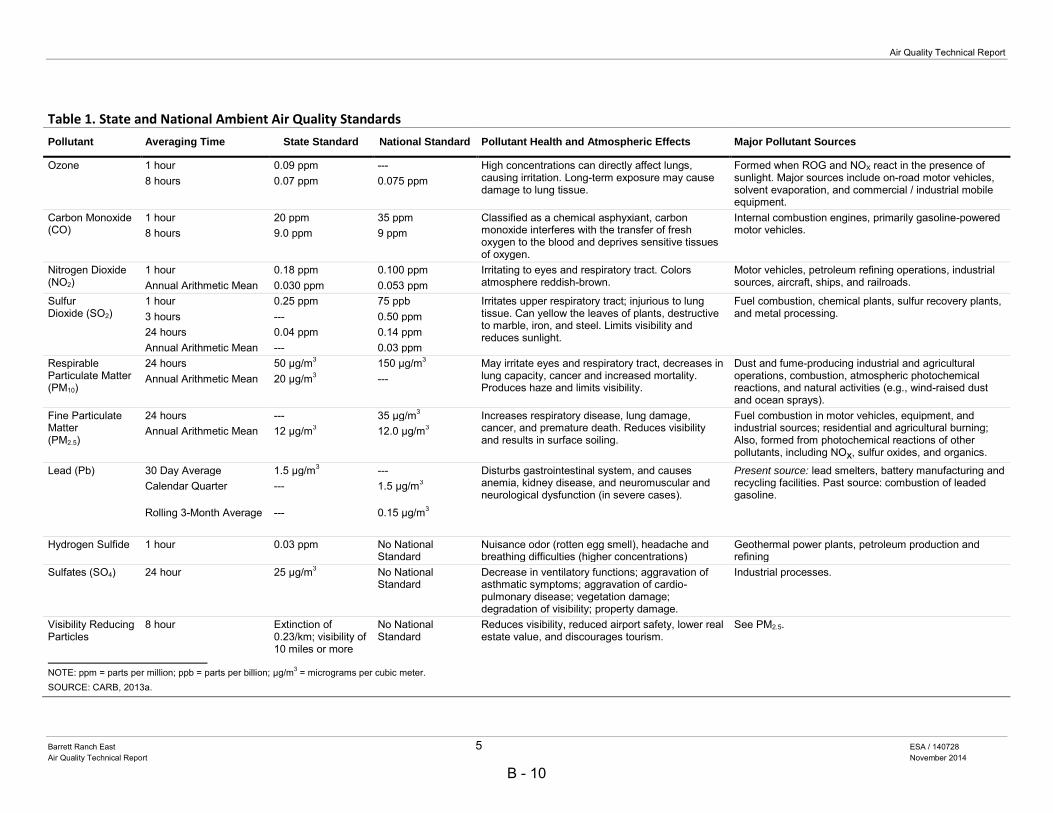
Table 1. State and National Ambient Air Quality Standards
Pollutant Averaging Time State Standard National Standard Pollutant Health and Atmospheric Effects Major Pollutant Sources
Ozone 1 hour 0.09 ppm --- High concentrations can directly affect lungs, causing irritation. Long-term exposure may cause damage to lung tissue.
Formed when ROG and NOX react in the presence of sunlight. Major sources include on-road motor vehicles, solvent evaporation, and commercial / industrial mobile equipment.
8 hours 0.07 ppm 0.075 ppm
Carbon Monoxide (CO)
1 hour 20 ppm 35 ppm Classified as a chemical asphyxiant, carbon monoxide interferes with the transfer of fresh oxygen to the blood and deprives sensitive tissues of oxygen.
Internal combustion engines, primarily gasoline-powered motor vehicles. 8 hours 9.0 ppm 9 ppm
Nitrogen Dioxide (NO2)
1 hour 0.18 ppm 0.100 ppm Irritating to eyes and respiratory tract. Colors atmosphere reddish-brown.
Motor vehicles, petroleum refining operations, industrial sources, aircraft, ships, and railroads. Annual Arithmetic Mean 0.030 ppm 0.053 ppm
Sulfur Dioxide (SO2)
1 hour 0.25 ppm 75 ppb Irritates upper respiratory tract; injurious to lung tissue. Can yellow the leaves of plants, destructive to marble, iron, and steel. Limits visibility and reduces sunlight.
Fuel combustion, chemical plants, sulfur recovery plants, and metal processing. 3 hours --- 0.50 ppm
24 hours 0.04 ppm 0.14 ppm Annual Arithmetic Mean --- 0.03 ppm
Respirable Particulate Matter (PM10)
24 hours 50 µg/m3 150 µg/m3 May irritate eyes and respiratory tract, decreases in lung capacity, cancer and increased mortality. Produces haze and limits visibility.
Dust and fume-producing industrial and agricultural operations, combustion, atmospheric photochemical reactions, and natural activities (e.g., wind-raised dust and ocean sprays).
Annual Arithmetic Mean 20 µg/m3 ---
Fine Particulate Matter (PM2.5)
24 hours --- 35 µg/m3 Increases respiratory disease, lung damage, cancer, and premature death. Reduces visibility and results in surface soiling.
Fuel combustion in motor vehicles, equipment, and industrial sources; residential and agricultural burning; Also, formed from photochemical reactions of other pollutants, including NOx, sulfur oxides, and organics.
Annual Arithmetic Mean 12 µg/m3 12.0 µg/m3
Lead (Pb) 30 Day Average 1.5 µg/m3 --- Disturbs gastrointestinal system, and causes anemia, kidney disease, and neuromuscular and neurological dysfunction (in severe cases).
Present source: lead smelters, battery manufacturing and recycling facilities. Past source: combustion of leaded gasoline.
Calendar Quarter --- 1.5 µg/m3
Rolling 3-Month Average --- 0.15 µg/m3
Hydrogen Sulfide 1 hour 0.03 ppm No National Standard
Nuisance odor (rotten egg smell), headache and breathing difficulties (higher concentrations)
Geothermal power plants, petroleum production and refining
Sulfates (SO4) 24 hour 25 µg/m3 No National Standard
Decrease in ventilatory functions; aggravation of asthmatic symptoms; aggravation of cardio-pulmonary disease; vegetation damage; degradation of visibility; property damage.
Industrial processes.
Visibility Reducing Particles
8 hour Extinction of 0.23/km; visibility of 10 miles or more
No National Standard
Reduces visibility, reduced airport safety, lower real estate value, and discourages tourism.
See PM2.5.
NOTE: ppm = parts per million; ppb = parts per billion; µg/m3 = micrograms per cubic meter. SOURCE: CARB, 2013a.
B - 10

Barrett Ranch East 6 ESA / 140728 Air Quality Technical Report November 2014
The SVAB is nonattainment for the federal and state ozone standards, the state PM10 standards,
and the state and federal PM2.5 standards. The Sacramento County portion of the SVAB is in
attainment for the federal PM10 standards, and the state and federal CO standards (Table 2).
Table 2. State and National Ambient Air Quality Attainment Status for Sacramento County Air Pollutant Attainment Status – SVAB
Ozone (O3) Nonattainment for NAAQS 8–hour; nonattainment for CAAQS
1-hour and 8-hour
Carbon monoxide (CO) Attainment/maintenance for federal standards; unclassified for
state standards
Nitrogen dioxide (NO2) Attainment
Sulfur dioxide (SO2) Attainment
Particulate matter (PM10) Attainment for NAAQS; nonattainment for CAAQS
Particulate matter (PM2.5) Nonattainment for NAAQS; nonattainment for CAAQS
Sulfates Attainment
Lead (Pb) Attainment
Hydrogen sulfide Unclassified
Source: California Air Resources Board, 2014a.
Ozone
Ozone is a respiratory irritant and an oxidant that increases susceptibility to respiratory infections
and can cause substantial damage to vegetation and other materials. Ozone is a severe eye, nose,
and throat irritant. Ozone also attacks synthetic rubber, textiles, plants, and other materials; it
causes extensive damage to plants, such as leaf discoloration and cell damage.
State standards for ozone have been set for a 1-hour averaging time. The state 1-hour ozone
standard is 0.09 ppm, not to be exceeded. EPA recently replaced the 1-hour federal ozone
standard with an 8-hour standard of 0.075 ppm, while ARB recently enacted a state 8-hour
standard of 0.07 ppm.
Ozone is not emitted directly into the air, but is formed by a photochemical reaction in the
atmosphere. Ozone precursors, including reactive organic gases (ROGs) and oxides of nitrogen
(NOx), react in the atmosphere in the presence of sunlight to form ozone. Because photochemical
reaction rates depend on the intensity of ultraviolet light and air temperature, ozone is primarily a
summer pollution problem. ROG and NOx are emitted by mobile sources, area sources, and
stationary combustion equipment.
Table 3 shows monitoring results for the ozone monitoring station closest to the proposed Project.
This station shows several violations of the state and federal ozone standards during the most
recent three years of available monitoring data.
B - 11

Air Quality Technical Report
Barrett Ranch East 7 ESA / 140728 Air Quality Technical Report November 2014
Table 3. Ozone Monitoring Results
Ozone (O3) 2011 2012 2013 Highest 8-hour average, ppm 0.078 0080 0.072
Days > state 8-hour standard 2 7 2
Days > federal 8-hour standard 1 4 0
Percent of year covered 90 92 87
Underlined values represent those in excess of applicable NAAQS. Bold values
represent those in excess of the applicable CAAQS. Monitoring results for
Sacramento – Goldenland Court monitoring station
Source: California Air Resources Board 2014b.
Carbon Monoxide
CO is inert to plants and materials but can significantly affect human health. CO is a public health
concern because it combines readily with hemoglobin and thus reduces the amount of oxygen
transported in the bloodstream. Effects on humans range from slight headaches and nausea to
death.
State and federal CO standards have been set for both 1- and 8-hour averaging times. The state
1-hour standard is 20 ppm, and the federal 1-hour standard is 35 ppm. Both the state and federal
standards for the 8-hour averaging period are 9 ppm.
Motor vehicles are the dominant source of CO emissions in most areas. High CO levels develop
primarily during winter when light winds combine with the formation of ground-level
temperature inversions typically from evening through early morning. These conditions result in
reduced dispersion of vehicle emissions. Motor vehicles also exhibit increased CO emission rates
at low air temperatures.
The results from the last three years of CO monitoring are shown in Table 4. No violations of
either the state or federal CO standards were recorded at this monitoring station during the most
three recent years.
Table 4. Carbon Monoxide Monitoring Results Carbon Monoxide (CO) 2011 2012 2013
Highest 1-hour average, ppm 1.9 1.9 1.9
Highest 8-hour average, ppm 1.6 1.6 1.7
Notes: Monitoring results for Sacramento - Goldenland Court monitoring station.
Source: U.S. Environmental Protection Agency, 2014.
Oxides of Nitrogen
NOx contributes to smog and can injure plants and animals and affect human health. NOx also
contributes to acidic deposition and reacts with ROG in the presence of sunlight to form
B - 12

Barrett Ranch East 8 ESA / 140728 Air Quality Technical Report November 2014
photochemical smog. NOx concentrations result in a brownish color because they absorb the blue-
green area of the visible spectrum, greatly affecting visibility.
NOx is emitted primarily by combustion sources, including both mobile and stationary sources.
NOx also is emitted by a variety of area sources, ranging from wildfires and prescribed fires to
water-heating and space-heating systems powered by fossil fuels.
The state NOx standard is 0.18 ppm for the 1-hour average and 0.03 ppm for the annual average.
The federal NOx standard is 0.053 ppm on an annual average and 0.100 ppm for the 1-hour
average. No violations of the NOx standard were recorded in the SVAB during the three most
recent years of available monitoring data.
PM10 and PM2.5
Health concerns associated with suspended particulate matter (PM) focus on those particles small
enough to reach the lungs when inhaled. PM can damage human health and retard plant growth,
as well as reduce visibility, soil buildings and other structures, and corrode materials.
The state PM10 standards are 50 µg/m3 as a 24-hour average and 20 µg/m
3 as an annual geometric
mean. The federal PM10 standard is 150 µg/m3 as a 24-hour average.
The federal PM2.5 standards are 35 µg/m3 as a 24-hour average and 12 µg/m
3 as an annual
average. The state PM2.5 standard equals 12 µg/m3 on an annual average.
PM10 and PM2.5 emissions are generated by a wide variety of sources, including agriculture,
industrial activities, dust suspended by vehicle traffic, and secondary aerosols formed by
reactions in the atmosphere.
Table 5 shows the most recent three years of monitoring results for PM10 and PM2.5 at the Del
Paso Manor monitoring station. Violations of the PM10 and PM2.5 air quality standards were
recorded during 2011, 2012 and 2013.
Sulfur Dioxide
The major health concerns associated with inhalation of SO2 include effects on breathing,
respiratory illness, alterations in pulmonary defenses, and aggravation of existing cardiovascular
disease. Children, the elderly, and people with asthma, cardiovascular disease, or chronic lung
diseases—such as bronchitis or emphysema—are most susceptible to adverse health effects from
exposure to SO2. SO2 is a precursor to sulfates, which are associated with acidification of lakes
and streams, accelerated corrosion of buildings and monuments, reduced visibility, and other
adverse health effects.
B - 13

Air Quality Technical Report
Barrett Ranch East 9 ESA / 140728 Air Quality Technical Report November 2014
Table 5. Particulate Matter Monitoring Results Particulate Matter (PM10) 2011 2012 2013
Highest 24-hour average, µg/m3 66.0 43 63.5
Days > state standarda 2.0 0.0 4.0
Days > federal standarda 0.0 0.0 0.0
Percent of year covered 100 100 92
Particulate Matter (PM2.5) 2011 2012 2013
Highest 24-hour average, µg/m3 54.3 35.3 53.8
Days > federal standarda 9.5 0.0 13.0
Percent of year covered 95 100 93
Note: Underlined values represent those in excess of applicable NAAQS. Bold values
represent those in excess of the applicable CAAQS. Based on Sacramento – Del Paso
Manor monitoring station.
Source: California Air Resources Board, 2014b. aDays over state or federal standards are estimated days.
EPA’s health-based NAAQS for SO2 is 0.03 ppm measured as an annual arithmetic mean
concentration, 0.14 ppm measured over a 24-hour period, and 0.5 ppm measured over a 3-hour
average period. California’s SO2 standard is 0.04 ppm measured over a 24-hour average period
and 0.25 ppm measured over 1-hour.
SO2 belongs to the family of gases called sulfur oxides (SOx). These gases are formed when fuel
containing sulfur (mainly coal and oil) is burned, and during metal smelting and other industrial
processes. SOx emissions are typically not a concern for land use development projects.
Toxic Air Contaminants
Concentrations of toxic air contaminants (TACs), or in federal parlance, hazardous air pollutants
(HAPs), are also used as indicators of ambient air quality conditions. A TAC is defined as an air
pollutant that may cause or contribute to an increase in mortality or in serious illness, or that may
pose a hazard to human health. TACs are usually present in minute quantities in the ambient air;
however, their high toxicity or health risk may pose a threat to public health even at low
concentrations.
According to The California Almanac of Emissions and Air Quality (CARB, 2009), the majority
of the estimated health risk from TACs can be attributed to relatively few compounds, the most
important being particulate matter from diesel-fueled engines (diesel PM or DPM). DPM differs
from other TACs in that it is not a single substance, but rather a complex mixture of hundreds of
substances.
Sensitive Receptors
Some receptors are considered more sensitive than others to air pollutants. The reasons for greater
than average sensitivity include health problems, proximity to emission sources, or duration of
B - 14

Barrett Ranch East 10 ESA / 140728 Air Quality Technical Report November 2014
exposure to air pollutants. Sensitive receptors are typically defined as locations where human
populations, especially children, seniors, or sick persons, are found, and there is reasonable
expectation of continuous human exposure. Examples of land uses considered sensitive receptors
are residences, hospitals, day cares, and schools.
The proposed Project outer boundary is surrounded by single-family residential homes. In
addition to the single-family homes, other nearby sensitive receptors includes the Antelope
Community Park, Antelope High School and Barrett Ranch Elementary School.
Greenhouse Gases and Climate Change
Global climate change results from greenhouse gas (GHG) emissions, which are caused by
several activities, including combustion of fossil fuels, deforestation, and land use change.
GHGs play a critical role in the Earth’s radiation budget by trapping infrared radiation emitted
from the Earth’s surface, which could have otherwise escaped to space. Prominent GHGs
contributing to this process include carbon dioxide (CO2), methane (CH4), nitrous oxide (N2O),
and certain refrigerants that include chlorofluorocarbons (CFCs), hydrochlorofluorocarbons
(HCFCs), and hydrofluorocarbons (HFCs). This phenomenon, known as the “greenhouse effect”,
keeps the Earth’s atmosphere near the surface warmer than it would be otherwise and allows for
successful habitation by humans and other forms of life.
Global warming potential (GWP) is a measure of how much a given mass of GHG is estimated to
contribute to global warming. A relative scale compares the gas in question to that of the same
mass of carbon dioxide (whose GWP is by definition 1). In this analysis, CH4 is assumed to have
a GWP of 21 and N2O has a GWP of 310. Refrigerants have GWP’s that range from 76 up to
12,240. Consequently, using each pollutant’s GWP, emissions of CO2, CH4, N2O, CFCs, HCFCs,
and HFCs can be converted into CO2 equivalence, also denoted as CO2e (California Climate
Action Registry, 2009).
Fossil fuel combustion removes carbon stored underground and releases it into the active carbon
cycle, thus increasing concentrations of GHGs in the atmosphere. Emissions of GHGs in excess
of natural ambient concentrations are theorized to be responsible for the enhancement of the
greenhouse effect and contribute to what is termed “global warming”, a trend of unnatural
warming of the Earth’s natural climate. Increases in these gases lead to more absorption of
radiation and warm the lower atmosphere further, thereby increasing evaporation rates and
temperatures near the surface. Climate change is a global problem, and GHGs are global
pollutants, unlike criteria pollutants (such as ozone, carbon monoxide, and particulate matter) and
TACs, which are pollutants of regional and local concern.
The Intergovernmental Panel on Climate Change (IPCC) was established by the World
Meteorological Organization and United Nations Environment Programme. IPCC’s mission is to
assess scientific, technical, and socioeconomic information relevant to the understanding of
climate change, including the potential impacts and options for adaptation and mitigation. IPCC
predicts substantial increases in global temperatures of between 1.1 to 6.4 degrees Celsius,
depending on the scenario (Intergovernmental Panel on Climate Change 2013).
B - 15

Air Quality Technical Report
Barrett Ranch East 11 ESA / 140728 Air Quality Technical Report November 2014
Climate change could affect California’s natural environment in the following ways (California
Energy Commission 2012):
Rising sea levels along the California coastline, particularly in San Francisco and the
Sacramento-San Joaquin River Delta due to ocean expansion;
Extreme heat conditions, such as heat waves and very high temperatures, which could
last longer and become more frequent;
An increase in heat-related human deaths and infectious diseases and a higher risk of
respiratory problems caused by deteriorating air quality;
Reduced snow pack and stream flow in the Sierra Nevada mountains, affecting winter
recreation and water supplies;
Potential increase in the severity of winter storms, affecting peak stream flows and
flooding;
Changes in growing season conditions that could affect California agriculture, causing
variations in crop quality and yield; and
Changes in distribution of plant and wildlife species due to changes in temperature,
competition of colonizing species, changes in hydrologic cycles, changes in sea levels,
and other climate-related effects.
These changes in California’s climate and ecosystems could occur at a time when California’s
population is expected to increase from 34 million to 59 million by the year 2040 (California
Energy Commission 2012).
Air Quality Regulatory Setting
Federal
Federal air quality laws regulate air pollutants, primarily through industry-specific standards and
planning requirements. The primary legislation that governs federal air quality regulations is the
Clean Air Act Amendments of 1990. Federal air quality laws regulate criteria, toxic, and nuisance
air pollutant emissions from industrial sources.
As mentioned earlier, criteria pollutants are substances for which the U.S. Environmental
Protection Agency (EPA) has established the NAAQS. Noncriteria air pollutants, also known as
toxic air contaminants (TACs), are airborne substances capable of causing adverse health effects
as a result of short-term (acute) or long-term (chronic) exposure.
Nuisance pollutants are substances that can result in complaints from the population about
adverse impacts on quality of life. The nuisance pollutants regulated by the air districts are odors
and visible plumes (smoke).
B - 16

Barrett Ranch East 12 ESA / 140728 Air Quality Technical Report November 2014
State
Criteria Pollutants
The California Air Resources Board (ARB), which is part of the California Environmental
Protection Agency (Cal-EPA), develops air quality regulations at the state level. The state
regulations mirror federal regulations by establishing industry-specific pollution controls for
criteria, toxic, and nuisance pollutants. California also requires areas to develop plans and
strategies for attaining California ambient air quality standards (CAAQS) as set forth in the
California Clean Air Act of 1988. As described above, California has developed ambient
standards for the criteria pollutants equal to or more stringent than the federal standards.
Air Toxics
State requirements specifically address air toxics issues through Assembly Bill (AB) 1807
(known as the Tanner Bill), which established the state air toxics program, and AB 2588, the Air
Toxics Hot Spots Information and Assessment Act. The Air Toxics Hot Spots Information and
Assessment Act (AB 2588, 1987, Connelly) (Hot Spots Act) was enacted in September 1987.
Under this bill, stationary sources of emissions are required to report the types and quantities of
certain substances that their facilities routinely release into the air.
Local
At the local level, air quality is managed through land use and development planning practices.
These practices are implemented through general planning processes.
The Sacramento Metropolitan Air Quality Management District (SMAQMD) is responsible for
establishing and enforcing local air quality rules and regulations that address the requirements of
federal and state air quality laws. Specifically, the SMAQMD is responsible for monitoring air
quality and planning, implementing, and enforcing programs designed to attain and maintain state
and federal ambient air quality standards in the area. Programs developed include air quality
rules and regulations that regulate stationary source emissions, including area and point sources
and certain mobile source emissions.
The SMAQMD is also responsible for establishing permitting requirements and issuing permits
for stationary sources and ensuring that new, modified, or relocated stationary sources do not
create net emissions increases. The SMAQMD enforces air quality rules and regulations through
a variety of means, including inspections, educational and training programs, and fines.
Climate Change and Greenhouse Gas Regulatory Setting
Several recent state-level actions have been taken to limit greenhouse gas (GHG) emissions
implicated in global warming. Those actions are described below.
B - 17
Air Quality Technical Report
Barrett Ranch East 13 ESA / 140728 Air Quality Technical Report November 2014
Executive Order S-3-05
On June 1, 2005, California Governor Arnold Schwarzenegger issued Executive Order S-3-05. It
included the following GHG emission reduction targets: by 2010, reduce GHG emissions to 2000
levels; by 2020, reduce GHG emissions to 1990 levels; by 2050, reduce GHG emissions to 80%
below 1990 levels. To meet the targets, the governor directed several state agencies to cooperate
in the development of a climate action plan. The secretary of Cal-EPA leads the Climate Action
Team (CAT), whose goal is to implement global warming emission reduction programs identified
in the climate action plan and to report on the progress made toward meeting the emission
reduction targets established in the executive order.
California Global Warming Solutions Act (Assembly Bill 32)
In 2006, the California state legislature adopted the California Global Warming Solutions Act of
2006 (AB 32). AB 32 establishes a cap on statewide GHG emissions and sets forth the regulatory
framework to achieve the corresponding reduction in statewide emission levels. Under AB 32,
GHGs are defined as carbon dioxide (CO2), methane, nitrous oxide, hydrofluorocarbons,
perfluorocarbons, and sulfur hexafluoride.
AB 32 requires that ARB:
adopt early action measures to reduce GHGs.;
establish a statewide GHG emissions cap for 2020 based on 1990 emissions;
adopt mandatory report rules for significant GHG sources;
adopt a scoping plan indicating how emission reductions will be achieved via regulations,
market mechanisms, and other actions; and
adopt regulations needed to achieve the maximum technologically feasible and cost-
effective reductions in GHGs.
California’s Scoping Plan and GHG Emissions Cap
Pursuant to AB 32, the CARB adopted a Climate Change Scoping Plan in December 2008
(CARB, 2008) outlining measures to meet the 2020 GHG reduction goals. In order to meet these
goals, California must reduce its GHG emissions by 30 percent below projected 2020 business-
as-usual emissions levels or about 15 percent from today’s levels. The Scoping Plan recommends
measures that are worth studying further, and that the State of California may implement, such as
new fuel regulations. It estimates that a reduction of 174 million metric tons of CO2e (about
191 million U.S. tons) from the transportation, energy, agriculture, forestry, and other sources
could be achieved should the state implement all of the measures in the Scoping Plan. The
Scoping Plan relies on the requirements of Senate Bill (SB) 375 (discussed below) to implement the
carbon emission reductions anticipated from land use decisions.
B - 18

Barrett Ranch East 14 ESA / 140728 Air Quality Technical Report November 2014
SB 375
This regulation, enacted in September 2008, is designed to control GHGs by limiting urban
sprawl. It requires metropolitan planning organizations (MPOs) to include sustainable
communities strategies (SCS), as defined, in their regional transportation plans (RTPs) for
reducing greenhouse gas emissions. SB 375 also aligns planning for transportation and housing,
and creates specified incentives for the implementation of the strategies.
Senate Bill 97
Senate Bill (SB) 97, signed in August 2007, acknowledges that climate change is an important
environmental issue that requires analysis under the California Environmental Quality Act
(CEQA). The bill directs the Governor’s Office of Planning and Research (OPR) to prepare,
develop, and transmit to the California Resources Agency guidelines for the feasible mitigation of
GHG emissions or the effects of GHG emissions, by July 1, 2009. The Resources Agency
certified those guidelines prior to January 1, 2010.
Actions Taken by the California Natural Resources Agency
On February 16, 2010, the Office of Administrative Law approved the GHG CEQA
Amendments, and filed them with the Secretary of State for inclusion in the California Code of
Regulations.
On March 18, 2010, the Natural Resources Agency adopted the proposed CEQA Guideline
amendments as proposed by OPR. The adopted CEQA Guideline amendments require lead
agencies to:
Calculate or estimate the amount of GHGs produced by a project using either a
quantitative modeling approach or a qualitative approach that includes performance
standards,
Use one or more of several approaches to determine the significance of emissions,
including the amount of the project’s emissions increase over existing conditions, the
level of emissions compared to a significance threshold, and/or whether the project
complies with an existing statewide, regional, or local plan to mitigate GHG emissions.
Significance Thresholds
Project Specific Thresholds - Criteria Pollutants, Toxic Air Contaminants, and Odors
The SMAQMD regulates and oversees air quality within Sacramento County and has
recommended the following thresholds to determine if a project will result in a significant impact
to air quality (SMAQMD, 2013a):
B - 19

Air Quality Technical Report
Barrett Ranch East 15 ESA / 140728 Air Quality Technical Report November 2014
Conflict with or obstruct implementation of an applicable air quality plan;
Result in short-term (construction) emissions of NOx above 85 pounds per day;
Result in long-term (operational) emissions of NOx or ROG above 65 pounds per day;
Result in PM10 concentrations equal to or greater than five percent of the state ambient
air quality standard (i.e., 50 micrograms/cubic meter for 24 hours) in areas where there is
evidence of existing or projected violations of this standard. Further, the SMAQMD
holds that if project emissions of NOx and ROG are below the emission thresholds given
above, then the project would not threaten violations of the PM10 ambient air quality
standards;
Result in CO concentrations that exceed the 1-hour state ambient air quality standard
(i.e., 20.0 ppm) or the 8-hour state ambient standard (i.e., 9.0 ppm);
Create objectionable odors affecting a substantial number of people;
TAC exposures create a lifetime cancer risk exceeding 10 in 1 million for stationary
sources, or substantially increase the lifetime cancer risk because of increased exposure
to TACs from mobile sources.
GHGs are considered cumulative pollutants. Consequently, the threshold for GHGs is discussed
below under cumulative thresholds.
Cumulative Thresholds - Criteria Pollutants
The SMAQMD’s approach for cumulative impacts is that if a project’s emissions would be less
than the individual project thresholds of significance, then the project would not be expected to
result in a cumulatively considerable contribution to significant cumulative impacts.
Cumulative Thresholds - Greenhouse Gases
Sacramento County has developed significance thresholds for GHG emissions. For residential
energy, the threshold is 1.33 metric tons of CO2e per year and for transportation, the threshold is
2.64 metric tons of CO2e per capita (Inman, J., 2014). Although SMAQMD has recently
developed GHG thresholds, this analysis uses Sacramento County’s energy and transportation
thresholds.
Approach and Methodology
Construction Emissions Methodology
The CalEEMod2013.2.2 model was used to estimate emissions resulting from construction of the
Project. Construction of the Project will likely proceed in phases based on economic conditions.
As a worst case for construction emissions, this analysis assumes that construction would begin in
2016 and to be completed by the end of 2019, with 2020 representing the first full year of Project
B - 20

Barrett Ranch East 16 ESA / 140728 Air Quality Technical Report November 2014
operation. Emissions were estimated for each year of construction. The CalEEMod model is
recommended by the SMAQMD. A detailed list of the assumptions used to estimate construction
emissions is included in Appendix A.
Toxic Air Contaminants
The California Air Resources Board has identified diesel particulate matter (DPM) as a TAC.
DPM is generated during construction by on- and off-road construction vehicles. DPM is also
generated in substantial quantities by high volume freeways, stationary diesel engines, and
facilities attracting heavy and constant diesel vehicle traffic.
Health risks from TACs are a function of the concentration of emissions and the duration of
exposure. The primary source of TACs during construction is DPM from construction equipment
exhaust. The evaluation of TACs from construction is conducted qualitatively due to the short-
term nature of construction and the distance of construction from the closest sensitive receptors.
Operational Emissions Methodology
Criteria Pollutant Emissions
The Project would generate operational emissions of the criteria pollutants, including ozone
precursors (ROG and NOx), CO, PM10, PM2.5, and SOx. SOx emissions are typically a minor
source of emissions and are not considered a concern with land use development projects.
Therefore, SOx emissions are not discussed further in this report.
On-road vehicle emissions generated by the Project were estimated using CalEEMod. Trip
generation information was provided by the traffic consultant (Kimley-Horn and Associates, Inc.
2014). The CalEEMod model was also used to estimate area source emissions. Area sources
include emissions associated with burning natural gas for space and water heating, gasoline
combustion to operate landscape maintenance machinery, and evaporative emissions from the use
of architectural coatings.
Toxic Air Contaminants
The Project would not be a generator of significant levels of TACs. The SMAQMD’s
Recommended Protocol for Evaluating the Location of Sensitive Land Uses Adjacent to Major
Roadways was used to evaluate whether the Proposed Project would expose residents to
significant levels of TACs (SMAQMD, 2011).
Odors
Odor analyses typically evaluate the potential for a proposed project to generate odors and for the
proposed project to be affected by odors from nearby sources of odors. The Project is not
considered an odor source. Consequently, the focus of the odor analysis is on the potential for
existing sources of odors to affect future residents.
B - 21
Air Quality Technical Report
Barrett Ranch East 17 ESA / 140728 Air Quality Technical Report November 2014
Potential odor impacts were evaluated by examining the distances from existing and proposed
odor sources (areas designated for industrial land uses) to the Project. The analysis also considers
prevailing wind direction and policies designed to minimize odor impacts. Odor sources typically
include industrial land uses, such as fiberglass manufacturing, coating operations, foundries,
refineries, sewage treatment plants, landfills, and recycling facilities.
Greenhouse Gas Emissions Methodology
For this analysis, construction-related GHG emissions were estimated using the CalEEMod
model. Although neither SMAQMD nor Sacramento County identify significance thresholds for
construction GHGs, SMAQMD has identified mitigation measures that they recommend for
construction activities. Measures that are applicable to this Project are specified in the GHG
construction impact analysis.
Sacramento County has developed operational GHG thresholds and methodologies that were used
in this analysis (Sacramento County, 2012). Sacramento County has residential project GHG
thresholds for transportation emissions and for residential energy use. Sacramento County
guidance requires that the comparison of project emissions to thresholds be conducted for 2020.
Although the Project is not expected to be built out by 2020, emissions were estimated for 2020
assuming full buildout.
For transportation-related GHG emissions, project specific vehicle miles traveled (VMT) were
provided by speed bin (Kimley-Horn Associates, Inc., 2014b). CO2 vehicle emission rates for
Sacramento County in 2020 were developed using the California Air Resources Board’s
EMFAC2011 model (California Air Resources Board, 2013b). Using the EMFAC2011 emission
rates, individual rates were estimated by speed bin. Then, for each speed bin, VMT estimates
were multiplied by the speed bin specific emission rates, and the results were converted to annual
metric tons of CO2. Finally, emissions were totaled for all speed bins to obtain total CO2
emissions.
EMFAC2011 does not include emission rates for CH4 or N2O. Consequently, CH4 emissions
were estimated by taking the ratio of CH4 to CO2 estimated for vehicle emissions by CalEEMod,
and that ratio was then multiplied by the EMFAC2011 estimated CO2 to estimate CH4 emissions.
Emissions of N2O were assumed negligible because CalEEMod does not show N2O emissions for
vehicles.
Total CO2e emissions were estimated (assuming a global warming potential of 21 for CH4), and
the total CO2e was divided by the Project’s estimated population to obtain an emissions per capita
value. The Project’s total population was estimated at 1,805 using CalEEMod. The emissions per
capita value was then compared to Sacramento County’s emissions per capita threshold of 2.64.
For energy emissions, CaleeMod was used to estimate annual Project’s 2020 residential and
elementary school GHG emissions from electricity and natural gas consumption. This year
represents the earliest year that buildout would occur. Actual buildout could take longer,
depending on market conditions. SMUD’s 2020 GHG emission factors in pounds per megawatt-
hour were also entered into the model (E3, 2010). The Project’s building energy use estimates
were divided by the estimated Project population to obtain energy-related GHG emissions per
B - 22

Barrett Ranch East 18 ESA / 140728 Air Quality Technical Report November 2014
capita. This value was compared to Sacramento County’s emissions per capita energy threshold
to determine significance.
Project Impacts
Construction Impacts
Criteria Pollutant Emissions
Construction activities associated with the proposed Project would generate pollutant emissions
from the following construction activities: (1) site preparation, (2) grading, (3) trenching, (4)
internal road construction, (5) building construction; and 6) application of architectural coatings.
These construction activities would temporarily create emissions of dust, fumes, equipment
exhaust, and other air contaminants. The amount of emissions generated on a daily basis would
vary, depending on the intensity and types of construction activities occurring simultaneously at
the time. The Project will be constructed from 2016 through 2019. This four-year period
represents a worst-case estimate from an emissions standard. Actual construction could take
longer, depending on market conditions.
The maximum daily construction emissions for the proposed Project during each year of
construction were estimated using CalEEMod, which is designed to model construction emissions
for land use development projects. Project emissions of criteria air pollutants were modeled
based on Project-specific information as well as model defaults. The modeled worst-case daily
emissions of criteria air pollutants associated with the proposed Project’s construction activities
are summarized in Table 6 (refer to Appendix A for a detailed summary of the CalEEMod
modeling assumptions, inputs, and outputs). The construction emissions estimates shown in Table
6 assume full build out of the Project’s residences, shopping center and parks.
Table 6. Maximum Daily Construction Emissions (unmitigated)
ROG
(ppd)
NOx
(ppd)
PM10
(ppd)
PM2.5
(ppd)
Maximum Daily – 2016 7.3 75.8 94.6 13.6
Maximum Daily – 2017 6.5 38.9 94.3 11.9
Maximum Daily – 2018 5.6 34.5 94.0 11.6
Maximum Daily – 2019 337.1 31.2 93.8 11.4
Construction Significance Threshold N/A 85 N/A N/A
Exceed Construction Threshold? No No No No
Unmitigated emissions estimated using CalEEMod2013.2.2. Detailed
CalEEMod results found in Appendix A.
As shown in Table 6, the maximum daily construction emissions generated by the proposed
Project would not exceed SMAQMD’s significance thresholds for NOx in 2016 through 2019.
Thus, NOx-related air quality impacts from construction are less than significant.
B - 23

Air Quality Technical Report
Barrett Ranch East 19 ESA / 140728 Air Quality Technical Report November 2014
In addition to the mass emission estimates shown in Table 6, Project construction would result in
the daily disturbance of more than 15 acres per day. Total disturbance could consist of up to 75
acres per day, or 25% of total Project acreage. This is a significant impact.
Mitigation Measure Air – 1. Reduce Construction Emissions
The following mitigation measures are recommended by the SMAQMD to reduce construction
emissions.
Mitigation Measures
Approval of any grading or improvement plans shall include the following SMAQMD Basic
Construction Emission Control Practices, including:
Exposed surfaces include, but are not limited to soil piles, graded areas, unpaved parking areas, staging areas, and access roads.
Cover or maintain at least two feet of free board space on haul trucks transporting soil, sand, or other loose material on the site. Any haul trucks that would be traveling along freeways or major roadways shall be covered.
Use wet power vacuum street sweepers to remove any visible trackout mud or dirt onto adjacent public roads at least once a day. Use of dry power sweeping is prohibited.
Limit vehicle speeds on unpaved roads to 15 miles per hour.
All roadways, driveways, sidewalks, parking lots shall be paved as soon as possible. In addition, building pads shall be laid as soon as possible after grading unless seeding or soil binders are used.
Minimize idling time either by shutting equipment off when not in use or reducing
the time of idling to 5 minutes (as required by the state airborne toxics control measure [Title 13, Section 2485 of the California Code of Regulations]). Provide clear signage that posts this requirement for workers at the entrances to the site.
Maintain all construction equipment in proper working condition according to manufacturer’s specifications. The equipment shall be checked by a certified mechanic and determine to be running in proper condition before it is operated.
Approval of any grading or improvement plans shall include the following SMAQMD
Enhanced Exhaust Control Practices, including:
Provide a comprehensive inventory of all off-road construction equipment, equal to or greater than 50 horsepower, that will be used an aggregate of 40 or more hours during any portion of the Proposed Project to the City and the SMAQMD. The inventory shall include the horsepower rating, engine model year, and projected hours of use for each piece of equipment. The construction contractor shall provide the anticipated construction timeline including start date, and name and phone number of the project manager and on-site foreman. This information shall be submitted at least four business days prior to the use of subject heavy-duty off-road equipment. The inventory shall be updated and submitted monthly throughout the duration of the Proposed Project, except that an inventory shall not be required for any 30-day period in which no construction activity occurs.
B - 24

Barrett Ranch East 20 ESA / 140728 Air Quality Technical Report November 2014
Provide a plan in conjunction with the equipment inventory, approved by the SMAQMD, demonstrating that the heavy-duty (50 horsepower or more) off-road vehicles to be used in the construction project, including owned, leased, and subcontractor vehicles, will achieve a project wide fleet-average 20% NOx reduction and 45% particulate reduction compared to the most recent CARB fleet average1. Acceptable options for reducing emissions may include use of late model engines, low-emission diesel products, alternative fuels, engine retrofit technology, after-treatment products, and/or other options as they become available.
Emissions from all off-road diesel powered equipment used on the Project site shall not exceed 40% opacity for more than three minutes in any one hour. Any equipment found to exceed 40 percent opacity (or Ringelmann 2.0) shall be repaired immediately, and the City and SMAQMD shall be notified within 48 hours of identification of non-compliant equipment. A visual survey of all in-operation equipment shall be made at least weekly, and a monthly summary of the visual survey results shall be submitted throughout the duration of the Project, except that the monthly summary shall not be required for any 30-day period in which no construction activity occurs. The monthly summary shall include the quantity and type of vehicles surveyed as well as the dates of each survey. The SMAQMD and/or other officials may conduct periodic site inspections to determine compliance. Nothing in this measure shall supercede other SMAQMD or state rules or regulations.
If at the time of granting of each building permit, the SMAQMD has adopted a regulation applicable to construction emissions, compliance with the regulation may completely or partially replace this mitigation. Consultation with the SMAQMD prior to construction will be necessary to make this determination.
Impact Significance After Mitigation: Onsite PM10 concentrations from construction were
estimated using Project specific mitigated emissions from CalEEMod. Those emissions were
used as inputs to the AERMOD dispersion model to estimate the Project’s contribution to PM10
concentrations. The dispersion modeling found that the Project’s worst-case daily PM10
emissions during site preparation and grading would result in a maximum concentration of 1.6
µg/m3 at the maximally exposed receptor, which would not exceed SMAQMD’s threshold of 2.5
µg/m3 for the 24-hour average (five percent of the 50 µg/m
3 PM10 24-hour standard). In addition,
the dispersion modeling found that the Project’s worst-case annual PM10 emissions would result
in a maximum concentration of 0.25 µg/m3 at the maximally exposed receptor, which would not
exceed SMAQMD’s threshold of 1.0 µg/m3 for the annual average (five percent of the 20 µg/m
3
annual PM10 standard). These modeling results are based on emissions that have been mitigated
as described in Mitigation Measure Air-1. Details of this modeling analysis, including modeling
assumptions, are included in Appendix A. With implementation of Mitigation Measure Air-1,
PM10 impacts would be less than significant.
Toxic Air Contaminant Emissions
Project construction would result in short-term emissions of DPM, which is a TAC. Off-road
heavy-duty diesel equipment would emit diesel PM during site preparation (e.g., excavation and
1 Although NOx emissions during construction are shown to be less than significant, changes in the construction
schedule or equipment use could potentially result in higher levels of emissions than those estimated here. Therefore, the NOx mitigation recommended by SMAQMD has not been removed from this measure.
B - 25
Air Quality Technical Report
Barrett Ranch East 21 ESA / 140728 Air Quality Technical Report November 2014
grading); paving; installation of utilities, materials transport and handling; building construction;
and other miscellaneous activities. Construction hours are assumed to take place for eight hours a
day, Monday through Friday for four years. No construction activities are expected to take place
during the weekends and major holidays. Although construction is conservatively estimated to
last four years, exposure of sensitive receptors to DPM would be for only brief periods when
excavation and grading activities are being conducted near individual residents.
The Project would not result in significant construction-related health risks for the following
reasons:
the intermittent nature of construction activities,
the relatively short-term construction period in any one location, and
the Mitigation Measure Air-1 requirement that substantially reduces DPM emissions.
This is a less than significant impact.
Odors
Construction activities could generate odors associated with diesel equipment exhaust. However,
such odors would be temporary, intermittent, and would not occur in the same location for more
than a few days at a time. This impact is less than significant.
Operational Impacts
Criteria Pollutant Emissions
Implementation of the proposed Project would result in long-term regional emissions of criteria
air pollutants associated with area sources, such as natural gas consumption, landscaping, in
addition to operational mobile emissions. Operational emissions associated with the Project were
modeled using CalEEMod and the results are presented in Table 7 (refer to Appendix A for a
detailed summary of the CalEEMod modeling assumptions, inputs, and outputs). As shown in
Table 7, implementation of the proposed Project would result in long-term regional emissions of
ROG that exceeds SMAQMD’s ROG significance threshold. Therefore, the Project’s
operational emissions of ROG would result in a significant impact.
Mitigation Measure Air-2: Implement Air Quality Mitigation Plan Measures
When operational emissions exceed significance thresholds, the SMAQMD recommends the
development of an Air Quality Mitigation Plan (AQMP) to minimize emission impacts
(SMAQMD, 2013b). The SMAQMD notes that an AQMP should focus on feasible mitigation.
SMAQMD considers that all feasible mitigation has been implemented if the AQMP reduces
ozone precursors below unmitigated levels by 15 percent for projects considered part of the State
Implementation Plan (SIP) and by 35 percent for projects not considered part of the SIP. The
B - 26
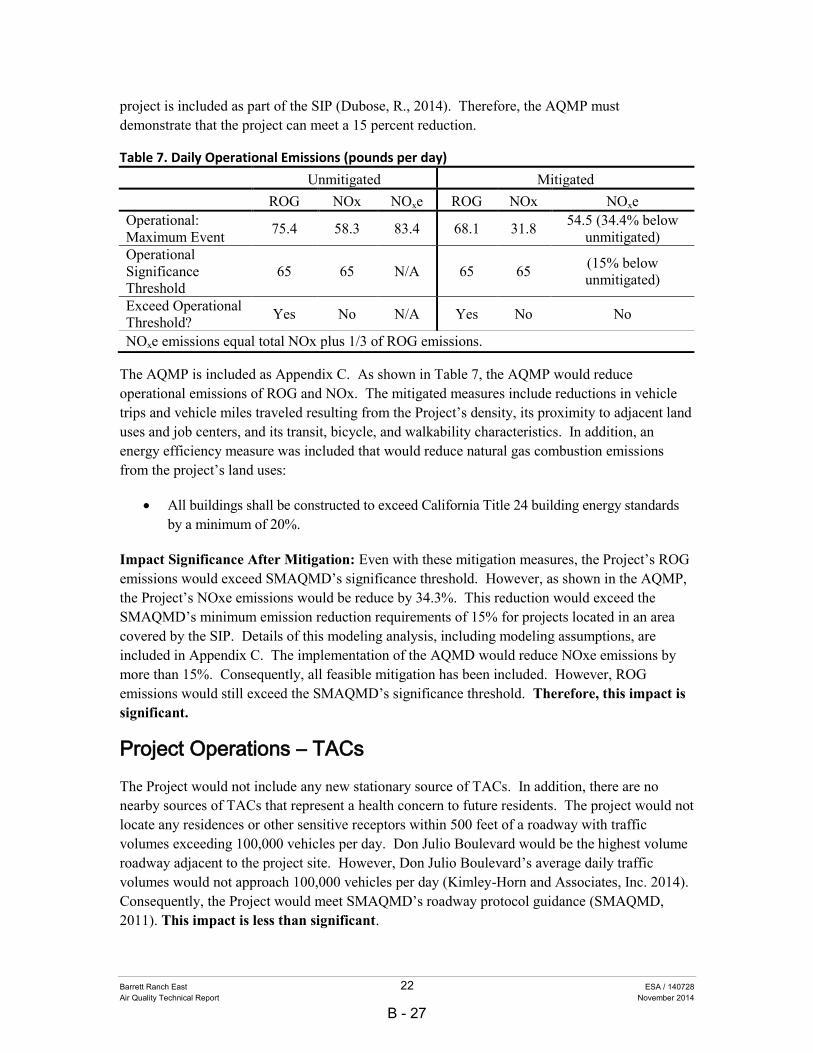
Barrett Ranch East 22 ESA / 140728 Air Quality Technical Report November 2014
project is included as part of the SIP (Dubose, R., 2014). Therefore, the AQMP must
demonstrate that the project can meet a 15 percent reduction.
Table 7. Daily Operational Emissions (pounds per day)
Unmitigated Mitigated
ROG NOx NOxe ROG NOx NOxe
Operational:
Maximum Event 75.4 58.3 83.4 68.1 31.8
54.5 (34.4% below
unmitigated)
Operational
Significance
Threshold
65 65 N/A 65 65 (15% below
unmitigated)
Exceed Operational
Threshold? Yes No N/A Yes No No
NOxe emissions equal total NOx plus 1/3 of ROG emissions.
The AQMP is included as Appendix C. As shown in Table 7, the AQMP would reduce
operational emissions of ROG and NOx. The mitigated measures include reductions in vehicle
trips and vehicle miles traveled resulting from the Project’s density, its proximity to adjacent land
uses and job centers, and its transit, bicycle, and walkability characteristics. In addition, an
energy efficiency measure was included that would reduce natural gas combustion emissions
from the project’s land uses:
All buildings shall be constructed to exceed California Title 24 building energy standards
by a minimum of 20%.
Impact Significance After Mitigation: Even with these mitigation measures, the Project’s ROG
emissions would exceed SMAQMD’s significance threshold. However, as shown in the AQMP,
the Project’s NOxe emissions would be reduce by 34.3%. This reduction would exceed the
SMAQMD’s minimum emission reduction requirements of 15% for projects located in an area
covered by the SIP. Details of this modeling analysis, including modeling assumptions, are
included in Appendix C. The implementation of the AQMD would reduce NOxe emissions by
more than 15%. Consequently, all feasible mitigation has been included. However, ROG
emissions would still exceed the SMAQMD’s significance threshold. Therefore, this impact is
significant.
Project Operations – TACs
The Project would not include any new stationary source of TACs. In addition, there are no
nearby sources of TACs that represent a health concern to future residents. The project would not
locate any residences or other sensitive receptors within 500 feet of a roadway with traffic
volumes exceeding 100,000 vehicles per day. Don Julio Boulevard would be the highest volume
roadway adjacent to the project site. However, Don Julio Boulevard’s average daily traffic
volumes would not approach 100,000 vehicles per day (Kimley-Horn and Associates, Inc. 2014).
Consequently, the Project would meet SMAQMD’s roadway protocol guidance (SMAQMD,
2011). This impact is less than significant.
B - 27
Air Quality Technical Report
Barrett Ranch East 23 ESA / 140728 Air Quality Technical Report November 2014
Objectionable Odors
The Project is not considered a source of objectionable odors. Although diesel emissions would
be generated during construction, they would be short-term and would be located at a distance
from sensitive receptors that they would not be detectable. During operation, the project would
not generate objectionable odors.
In addition, Project residents would not be exposed to objectionable odors from nearby land uses.
Land uses associated with odor complaints typically include agricultural uses, wastewater
treatment plants, food-processing plants, chemical plants, composting, refineries, landfills,
dairies, and fiberglass molding. No significant generators of odor are located near the Project.
Thus, the Project’s residents would not be exposed to objectionable odors. Impacts associated
with objectionable odors would be less than significant.
Cumulative Impacts
Criteria Air Pollutants, Toxic Air Contaminants, and Odors
A cumulative impact arises when two or more individual effects which, when considered
together, are considerable or which compound or increase other environmental impacts.
Cumulative impacts can result from individually minor but collectively significant impacts,
meaning that the Project’s incremental effects must be viewed in connection with the effects of
past, current, and probable future projects.
As described earlier, SMAQMD uses the project specific thresholds to assess whether a project
would have a cumulatively significant contribution to air pollution. With construction Mitigation
Measure Air-1, PM10 emissions during construction are less than significant with implementation
of all feasible mitigation. Consequently, the Project’s construction activities would result in a
less than significant cumulative criteria pollutant impact. Since the Project’s operational
emissions of criteria pollutants would be significant, the Project would result in a significant
cumulative criteria pollutant impact.
The Project would not have significant odor impacts during project construction or operation.
Therefore, the Project would not cause or contribute to significant cumulative odor impacts.
Similarly, the Project would not result in significant TAC impacts or health risks during Project
construction or operation. Therefore, the Project would not cause or contribute to significant
cumulative health risk impacts.
Greenhouse Gas Emissions
Construction GHG Emissions
Neither SMAQMD nor Sacramento County has established thresholds for construction GHG
emissions (construction-related GHGs are summarized in Appendix B). However, SMAQMD
has developed the following measures that should be considered to be best management practices
(BMP) for reducing GHG emissions from construction projects. Those BMPs are as follows:
B - 28
Barrett Ranch East 24 ESA / 140728 Air Quality Technical Report November 2014
Minimize idling time either by shutting equipment off when not in use or reducing the
time of idling to no more than 3 minutes (5 minute limit is required by the state airborne
toxics control measure [Title 13, sections 2449(d)(3) and 2485 of the California Code of
Regulations]).
Provide clear signage that posts this requirement for workers at the entrances to the site.
Maintain all construction equipment in proper working condition according to
manufacturer’s specifications. The equipment must be checked by a certified mechanic
and determined to be running in proper condition before it is operated.
Train equipment operators in proper use of equipment.
Use the proper size of equipment for the job.
Use equipment with new technologies (repowered engines, electric drive trains).
Perform on-site material hauling with trucks equipped with on-road engines (if
determined to be less emissive than the off-road engines).
Use alternative fuels for generators at construction sites such as propane or solar, or use
electrical power.
Use an ARB approved low carbon fuel for construction equipment. (NOx emissions from
the use of low carbon fuel must be reviewed and increases mitigated.)
Encourage and provide carpools, shuttle vans, transit passes and/or secure bicycle
parking for construction worker commutes.
Reduce electricity use in the construction office by using compact fluorescent bulbs,
powering off computers every day, and replacing heating and cooling units with more
efficient ones.
Recycle or salvage non-hazardous construction and demolition debris (goal of at least
75% by weight).
Use locally sourced or recycled materials for construction materials (goal of at least 20%
based on costs for building materials, and based on volume for roadway, parking lot,
sidewalk and curb materials). Wood products utilized should be certified through a
sustainable forestry program.
Minimize the amount of concrete for paved surfaces or utilize a low carbon concrete
option.
Produce concrete on-site if determined to be less emissive than transporting ready mix.
Use SmartWay certified trucks for deliveries and equipment transport.
Develop a plan to use efficiently water for adequate dust control.
B - 29
Air Quality Technical Report
Barrett Ranch East 25 ESA / 140728 Air Quality Technical Report November 2014
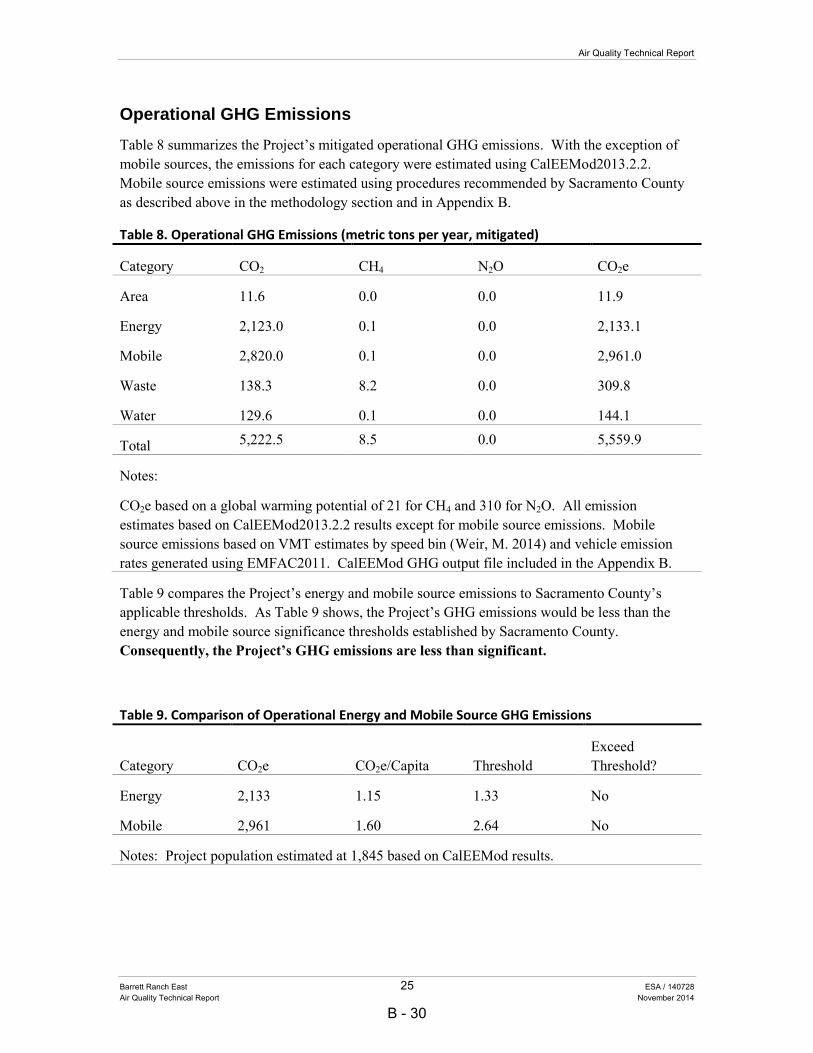
Operational GHG Emissions
Table 8 summarizes the Project’s mitigated operational GHG emissions. With the exception of
mobile sources, the emissions for each category were estimated using CalEEMod2013.2.2.
Mobile source emissions were estimated using procedures recommended by Sacramento County
as described above in the methodology section and in Appendix B.
Table 8. Operational GHG Emissions (metric tons per year, mitigated)
Category CO2 CH4 N2O CO2e
Area 11.6 0.0 0.0 11.9
Energy 2,123.0 0.1 0.0 2,133.1
Mobile 2,820.0 0.1 0.0 2,961.0
Waste 138.3 8.2 0.0 309.8
Water 129.6 0.1 0.0 144.1
Total 5,222.5 8.5 0.0 5,559.9
Notes:
CO2e based on a global warming potential of 21 for CH4 and 310 for N2O. All emission
estimates based on CalEEMod2013.2.2 results except for mobile source emissions. Mobile
source emissions based on VMT estimates by speed bin (Weir, M. 2014) and vehicle emission
rates generated using EMFAC2011. CalEEMod GHG output file included in the Appendix B.
Table 9 compares the Project’s energy and mobile source emissions to Sacramento County’s
applicable thresholds. As Table 9 shows, the Project’s GHG emissions would be less than the
energy and mobile source significance thresholds established by Sacramento County.
Consequently, the Project’s GHG emissions are less than significant.
Table 9. Comparison of Operational Energy and Mobile Source GHG Emissions
Category CO2e CO2e/Capita Threshold
Exceed
Threshold?
Energy 2,133 1.15 1.33 No
Mobile 2,961 1.60 2.64 No
Notes: Project population estimated at 1,845 based on CalEEMod results.
B - 30
Barrett Ranch East 26 ESA / 140728 Air Quality Technical Report November 2014
References
California Air Resources Board (CARB). 2014a. Area Designation Maps/State and National.
http://www.arb.ca.gov/desig/desig.htm. Last revised August 22, 2014. Accessed November 12,
2014.
California Air Resources Board (CARB). 2014b. Aerometric Data Analysis and Management
System. Available: http://www.arb.ca.gov/adam/welcome.html Accessed: November 12, 2014.
California Air Resources Board (CARB). 2013a. Ambient Air Quality Standards. Last revised:
June 4, 2013. Available: http://www.arb.ca.gov/research/aaqs/aaqs2.pdf. Accessed: November
12, 2014.
California Air Resources Board (CARB). 2013b. Mobile Source Emission Inventory – Current
Methods and Data, EMFAC2011. Available: http://www.arb.ca.gov/msei/modeling.htm.
Accessed: May 2, 2014.
California Air Resources Board (CARB). 2009. The California Almanac of Emissions and Air
Quality – 2009 Edition. Available:
http://www.arb.ca.gov/aqd/almanac/almanac09/almanac09.htm.
California Air Resources Board, 2008. Climate Change Scoping Plan. Adopted December 11,
2008, re-approved by the CARB on August 24, 2011. pp. ES-1 and 17.
California Climate Action Registry. 2009. General Reporting Protocol 3.1
California Energy Commission, 2012. Our Changing Climate, Vulnerability and Adaptation to
the Increasing Risks from Climate Change in California.
Dubose, R, 2014. November 6, 2014, e-mail from Rachel Dubose, Sacramento Metropolitan Air
Quality Management District to Tim Rimpo, ESA, regarding Barrett Ranch East’s inclusion in
the SIP.
E3 (Energy+Environmental Economics), 2010. Greenhouse Gas Calculator for the California
Electricity Sector. Version: GHG Calculator v3b. CO2 Allocations tab. Available:
https://ethree.com/public_projects/cpuc2.php.
Intergovernmental Panel on Climate Change, 2013. Climate Change 2013: The Physical Science
Basis.
Inman, J., 2014. March 19, 2014 e-mail from Joelle Inman, Associated Environmental Analysis,
Sacramento County Department of Community Development – Planning and Environmental
Review to Tim Rimpo, ESA, regarding Sacramento County’s GHG thresholds.
Kimley-Horn and Associates, Inc. 2014. Traffic Impact Analysis, Barrett Ranch East, Sacramento
County, California. Draft. October 14, 2014.
Sacramento County. 2012. Sacramento County Greenhouse Gas Thresholds: Guidance on
Application.
B - 31
Air Quality Technical Report
Barrett Ranch East 27 ESA / 140728 Air Quality Technical Report November 2014
Sacramento Metropolitan Air Quality Management District. 2013a. Guide to Air Quality
Assessment in Sacramento County. December 2009. Revised September 2010, April 2011, May
2011, and April 2013.
Sacramento Metropolitan Air Quality Management District, 2013b. Recommended Guidance for
Land Use Emission Reductions Version 3.0 (for Operational Emissions). July 2013
Sacramento Metropolitan Air Quality Management District, 2011. Recommended Protocol for
Evaluating the Location of Sensitive Land Uses Adjacent to Major Roadways. March 2011,
version 2.4.
U.S. EPA. 2014. AirData, Monitor Values Report. Last Revised: October 8, 2014. Available:
http://www.epa.gov/airdata/ad_rep_mon.html. Accessed: November 12, 2014.
Weir, M. September 25, 2014, e-mail from Matt Weir, Kimley-Horn to Tim Rimpo, ESA,
regarding Barrett Ranch East VMT.
B - 32

Barrett Ranch East Air Quality Technical Report Appendix A - 1 ESA / 140728
Appendix A – Criteria Pollutant Emissions
Table of Contents Appendix A – Criteria Pollutant Emissions ................................................................................................................................................ 1
Unmitigated CalEEMod Criteria Pollutant Daily Emission Estimates ................................................................................................... 2
Mitigated CalEEMod Criteria Pollutant Daily Emission Estimates ..................................................................................................... 40
PM10 Modeling Results ........................................................................................................................................................................ 96
PM10 Emission Estimates for PM10 Modeling ................................................................................................................................ 96
AERMOD Graphical Results ............................................................................................................................................................ 97
AERMOD Summary Output File .................................................................................................................................................... 100
B - 33

Barrett Ranch East Air Quality Technical Report Appendix A - 2 ESA / 140728
Unmitigated CalEEMod Criteria Pollutant Daily Emission Estimates
Barrett Ranch East
Sacramento County, Summer
1.0 Project Characteristics
1.1 Land Usage
Land Uses Size Metric Lot Acreage Floor Surface Area Population
Parking Lot 27.20 1000sqft 0.62 27,200.00 0
City Park 7.80 Acre 7.80 339,768.00 0
Apartments Low Rise 196.00 Dwelling Unit 10.50 196,000.00 523
Single Family Housing 495.00 Dwelling Unit 95.50 891,000.00 1322
Regional Shopping Center 108.90 1000sqft 6.40 108,900.00 0
1.2 Other Project Characteristics
Urbanization
Urban
Wind Speed (m/s)
3.5
Precipitation Freq (Days)
58
Climate Zone
6
Operational Year
2020
Utility Company
Sacramento Municipal Utility District
CO2 Intensity (lb/MWhr)
590.31
CH4 Intensity (lb/MWhr)
0.029
N2O Intensity (lb/MWhr)
0.006
1.3 User Entered Comments & Non-Default Data
Project Characteristics -
Land Use - Land use, unit amount and ot acreage infomation was provided by the Applicant.
B - 34
Barrett Ranch East Air Quality Technical Report Appendix A - 3 ESA / 140728
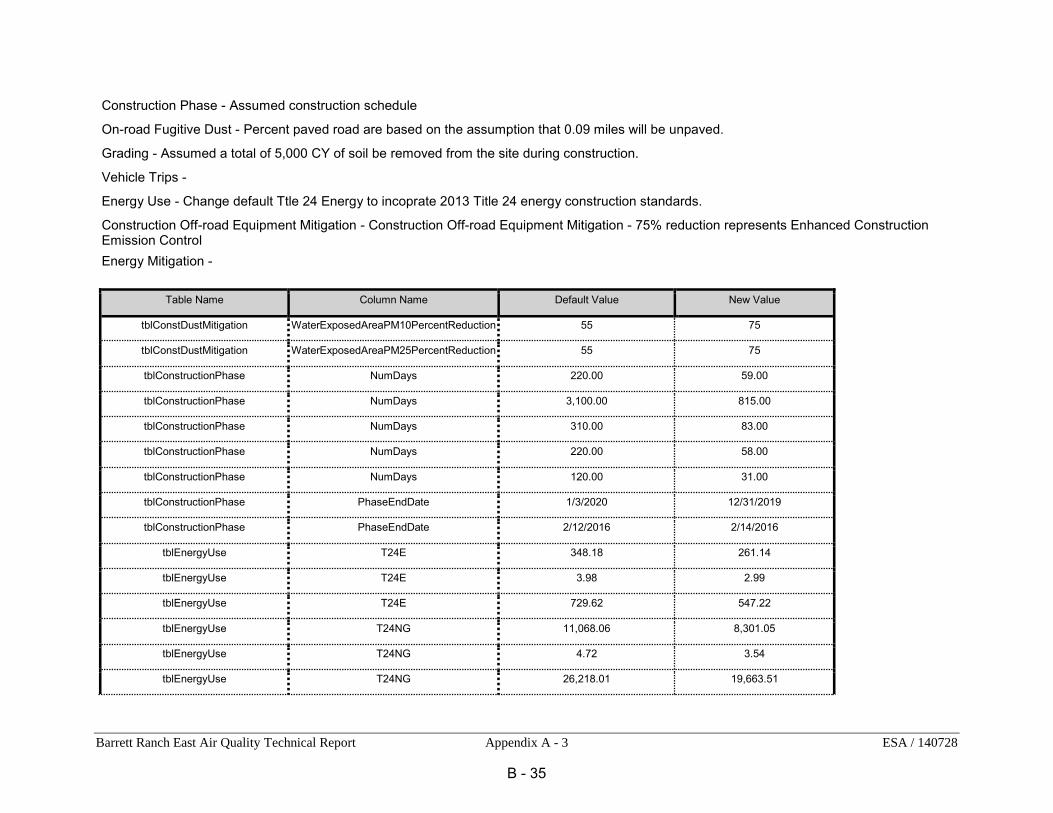
Construction Phase - Assumed construction schedule
On-road Fugitive Dust - Percent paved road are based on the assumption that 0.09 miles will be unpaved.
Grading - Assumed a total of 5,000 CY of soil be removed from the site during construction.
Vehicle Trips -
Energy Use - Change default Ttle 24 Energy to incoprate 2013 Title 24 energy construction standards.
Construction Off-road Equipment Mitigation - Construction Off-road Equipment Mitigation - 75% reduction represents Enhanced Construction Emission Control
Energy Mitigation -
Table Name Column Name Default Value New Value
tblConstDustMitigation WaterExposedAreaPM10PercentReduction 55 75
tblConstDustMitigation WaterExposedAreaPM25PercentReduction 55 75
tblConstructionPhase NumDays 220.00 59.00
tblConstructionPhase NumDays 3,100.00 815.00
tblConstructionPhase NumDays 310.00 83.00
tblConstructionPhase NumDays 220.00 58.00
tblConstructionPhase NumDays 120.00 31.00
tblConstructionPhase PhaseEndDate 1/3/2020 12/31/2019
tblConstructionPhase PhaseEndDate 2/12/2016 2/14/2016
tblEnergyUse T24E 348.18 261.14
tblEnergyUse T24E 3.98 2.99
tblEnergyUse T24E 729.62 547.22
tblEnergyUse T24NG 11,068.06 8,301.05
tblEnergyUse T24NG 4.72 3.54
tblEnergyUse T24NG 26,218.01 19,663.51
B - 35

Barrett Ranch East Air Quality Technical Report Appendix A - 4 ESA / 140728
tblGrading AcresOfGrading 207.50 128.00
tblGrading AcresOfGrading 0.00 128.00
tblGrading MaterialImported 0.00 2,500.00
tblGrading MaterialImported 0.00 2,500.00
tblLandUse LotAcreage 12.25 10.50
tblLandUse LotAcreage 160.71 95.50
tblLandUse LotAcreage 2.50 6.40
tblOnRoadDust HaulingPercentPave 100.00 99.60
tblOnRoadDust HaulingPercentPave 100.00 99.60
tblOnRoadDust VendorPercentPave 100.00 98.60
tblOnRoadDust WorkerPercentPave 100.00 99.10
tblOnRoadDust WorkerPercentPave 100.00 99.10
tblOnRoadDust WorkerPercentPave 100.00 99.10
tblProjectCharacteristics OperationalYear 2014 2020
2.0 Emissions Summary
2.1 Overall Construction (Maximum Daily Emission)
Unmitigated Construction
ROG NOx CO SO2 Fugitive PM10
Exhaust PM10
PM10 Total
Fugitive PM2.5
Exhaust PM2.5
PM2.5 Total
Bio- CO2
NBio- CO2 Total CO2 CH4 N2O CO2e
Year
lb/day lb/day
B - 36

Barrett Ranch East Air Quality Technical Report Appendix A - 5 ESA / 140728
2016
7.2786
75.8133
64.4410
0.1080
92.3658
3.5998
94.5617
10.8464
3.3118
13.5863
0.0000
9,903.8997
9,903.8997
1.9446
0.0000
9,944.7367
2017
6.5012
38.8547
59.2565
0.1079
92.3660
1.9773
94.3433
10.0152
1.8532
11.8684
0.0000
9,660.8346
9,660.8346
0.8520
0.0000
9,678.7255
2018
5.6133
34.4817
54.0656
0.1078
92.3658
1.6761
94.0419
10.0151
1.5721
11.5872
0.0000
9,426.1915
9,426.1915
0.8261
0.0000
9,443.5393
2019
337.0643
31.1878
51.0012
0.1075
92.3660
1.4550
93.8210
10.0152
1.3647
11.3799
0.0000
9,195.3890
9,195.3890
0.8032
0.0000
9,212.2564
Total 356.4574
180.3375
228.7644
0.4313
369.4636
8.7082
376.7679
40.8918
8.1018
48.4218
0.0000
38,186.3148
38,186.3148
4.4259
0.0000
38,279.2578
B - 37

Barrett Ranch East Air Quality Technical Report Appendix A - 6 ESA / 140728
Mitigated Construction
ROG NOx CO SO2 Fugitive PM10
Exhaust PM10
PM10 Total
Fugitive PM2.5
Exhaust PM2.5
PM2.5 Total
Bio- CO2
NBio- CO2 Total CO2 CH4 N2O CO2e
Year
lb/day lb/day
2016
7.2786
75.8133
64.4410
0.1080
58.3827
3.5998
60.5786
6.6168
3.3118
8.6751
0.0000
9,903.8997
9,903.8997
1.9446
0.0000
9,944.7367
2017
6.5012
38.8547
59.2565
0.1079
58.3829
1.9773
60.3602
6.6169
1.8532
8.4700
0.0000
9,660.8346
9,660.8346
0.8520
0.0000
9,678.7255
2018
5.6133
34.4817
54.0656
0.1078
58.3827
1.6761
60.0589
6.6168
1.5721
8.1889
0.0000
9,426.1915
9,426.1915
0.8261
0.0000
9,443.5393
2019
337.0643
31.1878
51.0012
0.1075
58.3830
1.4550
59.8379
6.6169
1.3647
7.9816
0.0000
9,195.3890
9,195.3890
0.8032
0.0000
9,212.2564
Total 356.4574
180.3375
228.7644
0.4313
233.5313
8.7082
240.8356
26.4673
8.1018
33.3156
0.0000
38,186.3148
38,186.3148
4.4259
0.0000
38,279.2578
B - 38
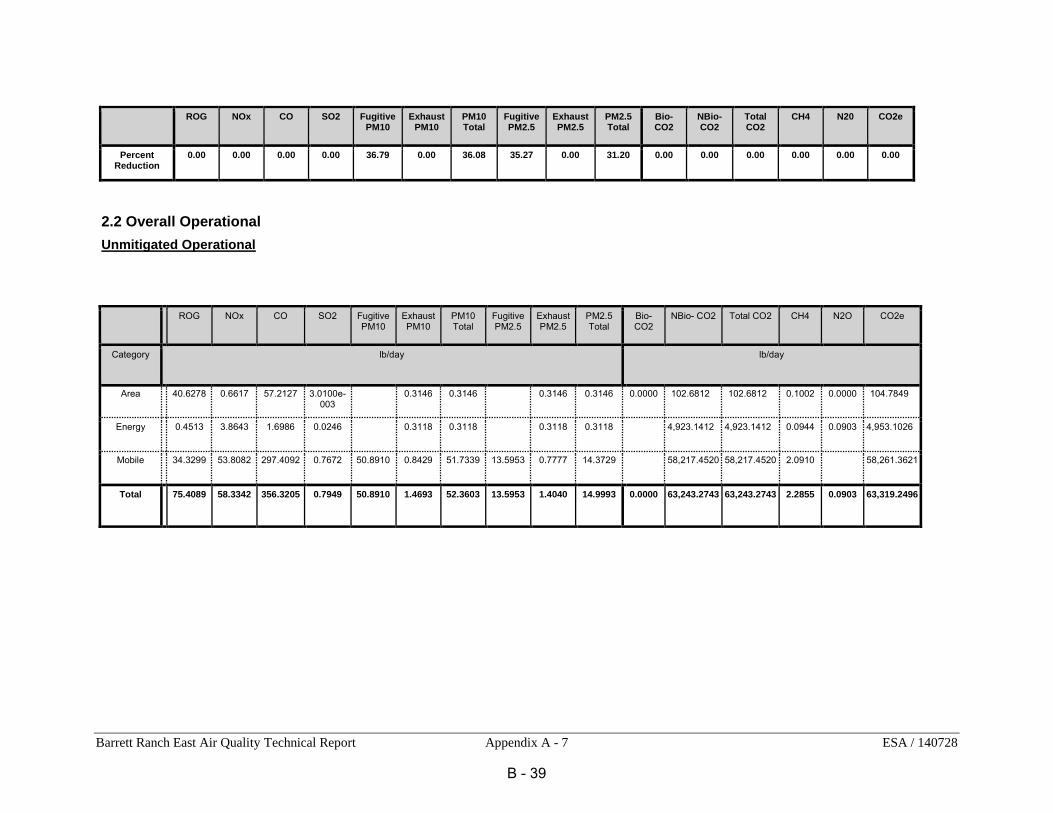
Barrett Ranch East Air Quality Technical Report Appendix A - 7 ESA / 140728
ROG
NOx
CO
SO2
Fugitive PM10
Exhaust PM10
PM10 Total
Fugitive PM2.5
Exhaust PM2.5
PM2.5 Total
Bio- CO2
NBio-CO2
Total CO2
CH4
N20
CO2e
Percent Reduction
0.00
0.00
0.00
0.00
36.79
0.00
36.08
35.27
0.00
31.20
0.00
0.00
0.00
0.00
0.00
0.00
2.2 Overall Operational
Unmitigated Operational
ROG NOx CO SO2 Fugitive PM10
Exhaust PM10
PM10 Total
Fugitive PM2.5
Exhaust PM2.5
PM2.5 Total
Bio- CO2
NBio- CO2 Total CO2 CH4 N2O CO2e
Category
lb/day lb/day
Area
40.6278
0.6617
57.2127
3.0100e-003
0.3146
0.3146
0.3146
0.3146
0.0000
102.6812
102.6812
0.1002
0.0000
104.7849
Energy
0.4513
3.8643
1.6986
0.0246
0.3118
0.3118
0.3118
0.3118
4,923.1412
4,923.1412
0.0944
0.0903
4,953.1026
Mobile
34.3299
53.8082
297.4092
0.7672
50.8910
0.8429
51.7339
13.5953
0.7777
14.3729
58,217.4520
58,217.4520
2.0910
58,261.3621
Total 75.4089
58.3342
356.3205
0.7949
50.8910
1.4693
52.3603
13.5953
1.4040
14.9993
0.0000
63,243.2743
63,243.2743
2.2855
0.0903
63,319.2496
B - 39

Barrett Ranch East Air Quality Technical Report Appendix A - 8 ESA / 140728
Mitigated Operational
ROG NOx CO SO2 Fugitive PM10
Exhaust PM10
PM10 Total
Fugitive PM2.5
Exhaust PM2.5
PM2.5 Total
Bio- CO2
NBio- CO2 Total CO2 CH4 N2O CO2e
Category
lb/day lb/day
Area
40.6278
0.6617
57.2127
3.0100e-003
0.3146
0.3146
0.3146
0.3146
0.0000
102.6812
102.6812
0.1002
0.0000
104.7849
Energy
0.4513
3.8643
1.6986
0.0246
0.3118
0.3118
0.3118
0.3118
4,923.1412
4,923.1412
0.0944
0.0903
4,953.1026
Mobile
34.3299
53.8082
297.4092
0.7672
50.8910
0.8429
51.7339
13.5953
0.7777
14.3729
58,217.4520
58,217.4520
2.0910
58,261.3621
Total 75.4089
58.3342
356.3205
0.7949
50.8910
1.4693
52.3603
13.5953
1.4040
14.9993
0.0000
63,243.2743
63,243.2743
2.2855
0.0903
63,319.2496
B - 40

Barrett Ranch East Air Quality Technical Report Appendix A - 9 ESA / 140728
ROG
NOx
CO
SO2
Fugitive PM10
Exhaust PM10
PM10 Total
Fugitive PM2.5
Exhaust PM2.5
PM2.5 Total
Bio- CO2
NBio-CO2
Total CO2
CH4
N20
CO2e
Percent Reduction
0.00
0.00
0.00
0.00
0.00
0.00
0.00
0.00
0.00
0.00
0.00
0.00
0.00
0.00
0.00
0.00
3.0 Construction Detail
Construction Phase
Phase Number
Phase Name Phase Type Start Date End Date Num Days Week
Num Days
Phase Description
1 Site Preparation Site Preparation 1/1/2016 2/14/2016 5 31
2 Grading Grading 2/15/2016 6/8/2016 5 83
3 Building Construction Building Construction 6/9/2016 7/24/2019 5 815
4 Paving Paving 7/25/2019 10/14/2019 5 58
5 Architectural Coating Architectural Coating 10/15/2019 12/31/2019 5 59
Acres of Grading (Site Preparation Phase): 128
Acres of Grading (Grading Phase): 128
Acres of Paving: 0
Residential Indoor: 2,201,175; Residential Outdoor: 733,725; Non-Residential Indoor: 674,226; Non-Residential Outdoor: 224,742 (Architectural Coating – sqft)
OffRoad Equipment
Phase Name Offroad Equipment Type Amount Usage Hours Horse Power Load Factor
Site Preparation Rubber Tired Dozers 3 8.00 255 0.40
B - 41
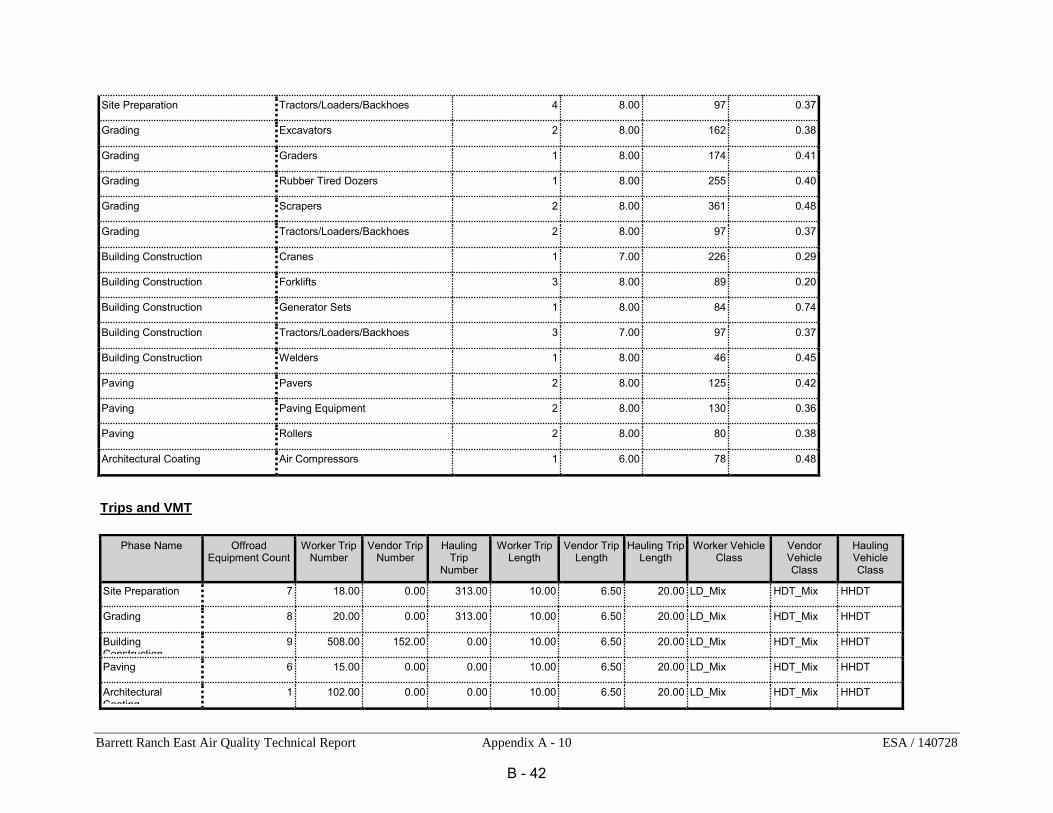
Barrett Ranch East Air Quality Technical Report Appendix A - 10 ESA / 140728
Site Preparation Tractors/Loaders/Backhoes 4 8.00 97 0.37
Grading Excavators 2 8.00 162 0.38
Grading Graders 1 8.00 174 0.41
Grading Rubber Tired Dozers 1 8.00 255 0.40
Grading Scrapers 2 8.00 361 0.48
Grading Tractors/Loaders/Backhoes 2 8.00 97 0.37
Building Construction Cranes 1 7.00 226 0.29
Building Construction Forklifts 3 8.00 89 0.20
Building Construction Generator Sets 1 8.00 84 0.74
Building Construction Tractors/Loaders/Backhoes 3 7.00 97 0.37
Building Construction Welders 1 8.00 46 0.45
Paving Pavers 2 8.00 125 0.42
Paving Paving Equipment 2 8.00 130 0.36
Paving Rollers 2 8.00 80 0.38
Architectural Coating Air Compressors 1 6.00 78 0.48
Trips and VMT
Phase Name
Offroad Equipment Count
Worker Trip Number
Vendor Trip Number
Hauling Trip
Number
Worker Trip Length
Vendor Trip Length
Hauling Trip Length
Worker Vehicle Class
Vendor Vehicle Class
Hauling Vehicle Class
Site Preparation
7
18.00
0.00
313.00
10.00
6.50
20.00
LD_Mix
HDT_Mix
HHDT
Grading
8
20.00
0.00
313.00
10.00
6.50
20.00
LD_Mix
HDT_Mix
HHDT
Building Construction
9
508.00
152.00
0.00
10.00
6.50
20.00
LD_Mix
HDT_Mix
HHDT
Paving
6
15.00
0.00
0.00
10.00
6.50
20.00
LD_Mix
HDT_Mix
HHDT
Architectural Coating
1
102.00
0.00
0.00
10.00
6.50
20.00
LD_Mix
HDT_Mix
HHDT
B - 42
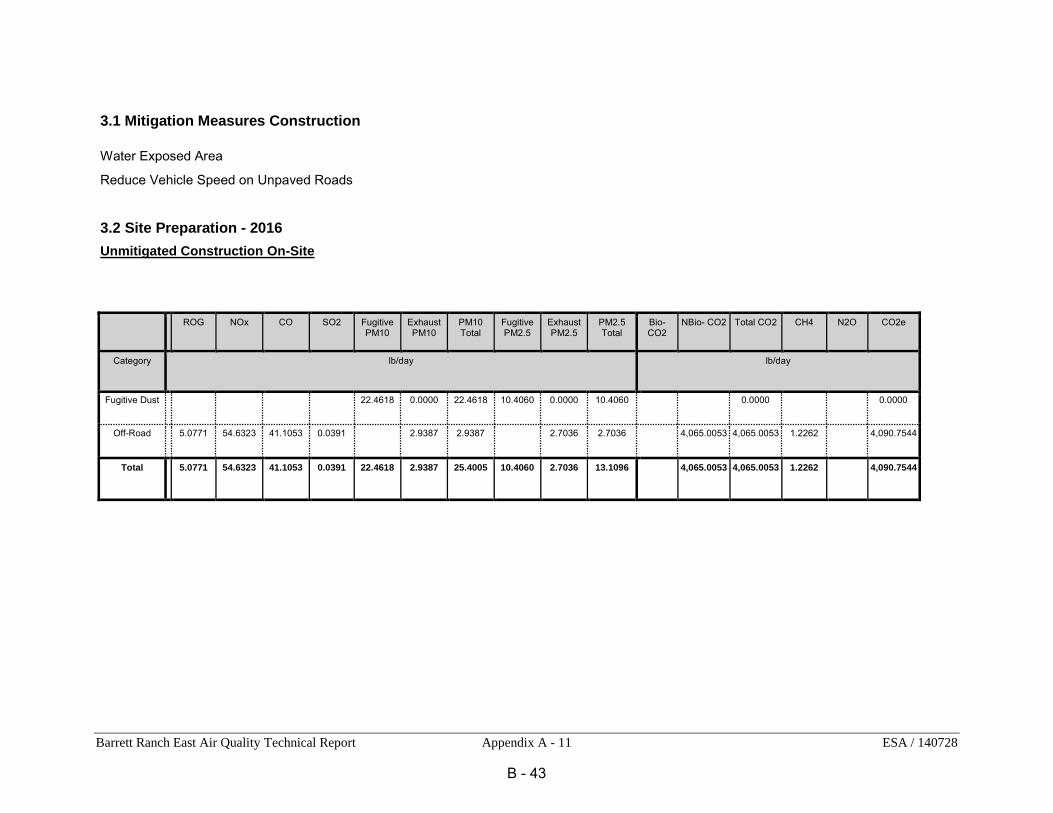
Barrett Ranch East Air Quality Technical Report Appendix A - 11 ESA / 140728
3.1 Mitigation Measures Construction
Water Exposed Area
Reduce Vehicle Speed on Unpaved Roads
3.2 Site Preparation - 2016
Unmitigated Construction On-Site
ROG NOx CO SO2 Fugitive PM10
Exhaust PM10
PM10 Total
Fugitive PM2.5
Exhaust PM2.5
PM2.5 Total
Bio- CO2
NBio- CO2 Total CO2 CH4 N2O CO2e
Category
lb/day lb/day
Fugitive Dust
22.4618
0.0000
22.4618
10.4060
0.0000
10.4060
0.0000
0.0000
Off-Road
5.0771
54.6323
41.1053
0.0391
2.9387
2.9387
2.7036
2.7036
4,065.0053
4,065.0053
1.2262
4,090.7544
Total 5.0771
54.6323
41.1053
0.0391
22.4618
2.9387
25.4005
10.4060
2.7036
13.1096
4,065.0053
4,065.0053
1.2262
4,090.7544
B - 43

Barrett Ranch East Air Quality Technical Report Appendix A - 12 ESA / 140728
Unmitigated Construction Off-Site
ROG NOx CO SO2 Fugitive PM10
Exhaust PM10
PM10 Total
Fugitive PM2.5
Exhaust PM2.5
PM2.5 Total
Bio- CO2
NBio- CO2
Total CO2 CH4 N2O CO2e
Category
lb/day lb/day
Hauling
0.2404
2.4832
3.1683
7.2900e-003
1.3633
0.0386
1.4019
0.1664
0.0355
0.2018
732.3098
732.3098
5.1100e-003
732.4172
Vendor
0.0000
0.0000
0.0000
0.0000
0.0000
0.0000
0.0000
0.0000
0.0000
0.0000
0.0000
0.0000
0.0000
0.0000
Worker
0.0721
0.0649
0.8686
1.7500e-003
2.5202
1.0100e-003
2.5212
0.2740
9.2000e-004
0.2749
143.8975
143.8975
6.9500e-003
144.0434
Total 0.3125
2.5481
4.0369
9.0400e-003
3.8835
0.0396
3.9231
0.4403
0.0364
0.4767
876.2073
876.2073
0.0121
876.4606
Mitigated Construction On-Site
ROG NOx CO SO2 Fugitive PM10
Exhaust PM10
PM10 Total
Fugitive PM2.5
Exhaust PM2.5
PM2.5 Total
Bio- CO2 NBio- CO2 Total CO2 CH4 N2O CO2e
Category
lb/day lb/day
Fugitive Dust
5.6154
0.0000
5.6154
2.6015
0.0000
2.6015
0.0000
0.0000
Off-Road
5.0771
54.6323
41.1053
0.0391
2.9387
2.9387
2.7036
2.7036
0.0000
4,065.0053
4,065.0053
1.2262
4,090.7544
B - 44
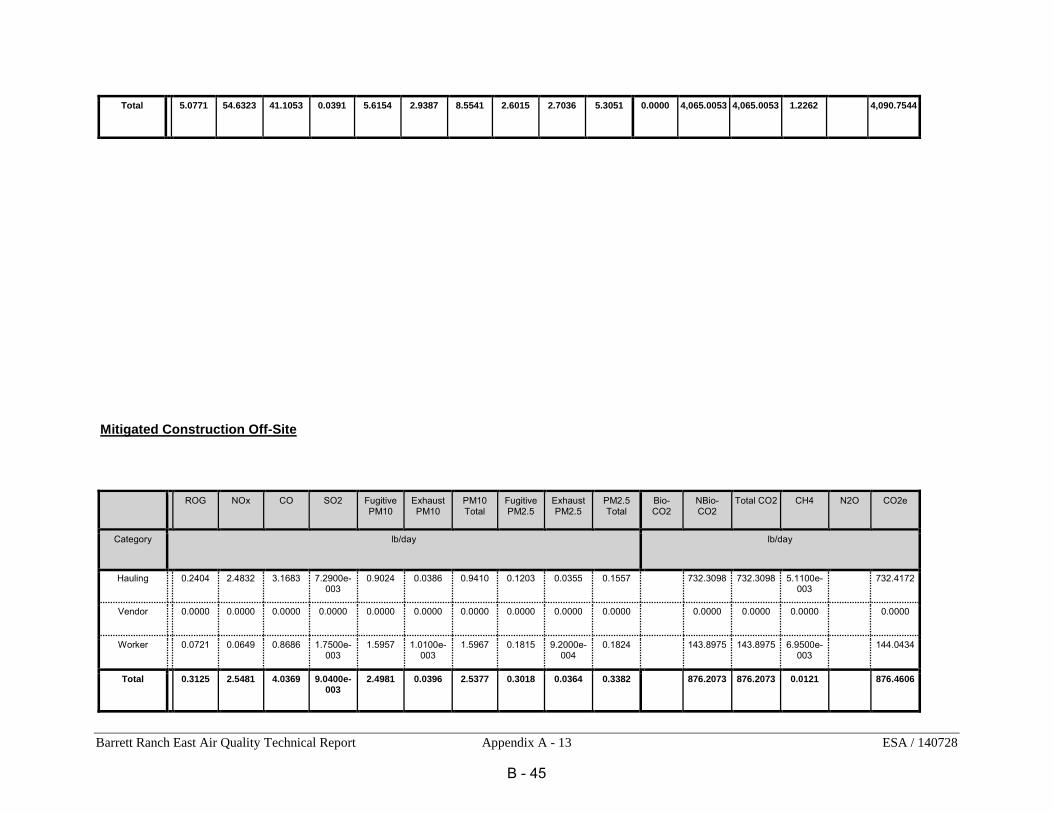
Barrett Ranch East Air Quality Technical Report Appendix A - 13 ESA / 140728
Total 5.0771
54.6323
41.1053
0.0391
5.6154
2.9387
8.5541
2.6015
2.7036
5.3051
0.0000
4,065.0053
4,065.0053
1.2262
4,090.7544
Mitigated Construction Off-Site
ROG NOx CO SO2 Fugitive PM10
Exhaust PM10
PM10 Total
Fugitive PM2.5
Exhaust PM2.5
PM2.5 Total
Bio- CO2
NBio- CO2
Total CO2 CH4 N2O CO2e
Category
lb/day lb/day
Hauling
0.2404
2.4832
3.1683
7.2900e-003
0.9024
0.0386
0.9410
0.1203
0.0355
0.1557
732.3098
732.3098
5.1100e-003
732.4172
Vendor
0.0000
0.0000
0.0000
0.0000
0.0000
0.0000
0.0000
0.0000
0.0000
0.0000
0.0000
0.0000
0.0000
0.0000
Worker
0.0721
0.0649
0.8686
1.7500e-003
1.5957
1.0100e-003
1.5967
0.1815
9.2000e-004
0.1824
143.8975
143.8975
6.9500e-003
144.0434
Total 0.3125
2.5481
4.0369
9.0400e-003
2.4981
0.0396
2.5377
0.3018
0.0364
0.3382
876.2073
876.2073
0.0121
876.4606
B - 45
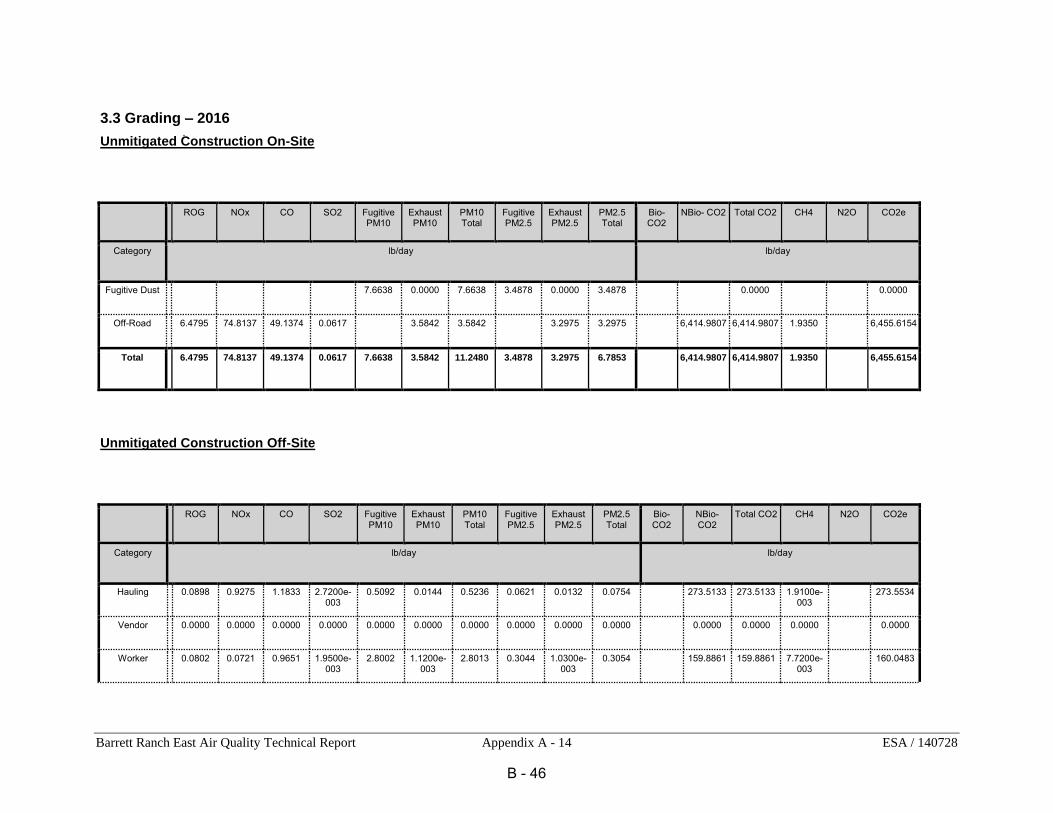
Barrett Ranch East Air Quality Technical Report Appendix A - 14 ESA / 140728
3.3 Grading – 2016
Unmitigated Construction On-Site
ROG NOx CO SO2 Fugitive PM10
Exhaust PM10
PM10 Total
Fugitive PM2.5
Exhaust PM2.5
PM2.5 Total
Bio- CO2
NBio- CO2 Total CO2 CH4 N2O CO2e
Category
lb/day lb/day
Fugitive Dust
7.6638
0.0000
7.6638
3.4878
0.0000
3.4878
0.0000
0.0000
Off-Road
6.4795
74.8137
49.1374
0.0617
3.5842
3.5842
3.2975
3.2975
6,414.9807
6,414.9807
1.9350
6,455.6154
Total 6.4795
74.8137
49.1374
0.0617
7.6638
3.5842
11.2480
3.4878
3.2975
6.7853
6,414.9807
6,414.9807
1.9350
6,455.6154
Unmitigated Construction Off-Site
ROG NOx CO SO2 Fugitive PM10
Exhaust PM10
PM10 Total
Fugitive PM2.5
Exhaust PM2.5
PM2.5 Total
Bio- CO2
NBio- CO2
Total CO2 CH4 N2O CO2e
Category
lb/day lb/day
Hauling
0.0898
0.9275
1.1833
2.7200e-003
0.5092
0.0144
0.5236
0.0621
0.0132
0.0754
273.5133
273.5133
1.9100e-003
273.5534
Vendor
0.0000
0.0000
0.0000
0.0000
0.0000
0.0000
0.0000
0.0000
0.0000
0.0000
0.0000
0.0000
0.0000
0.0000
Worker
0.0802
0.0721
0.9651
1.9500e-003
2.8002
1.1200e-003
2.8013
0.3044
1.0300e-003
0.3054
159.8861
159.8861
7.7200e-003
160.0483
B - 46

Barrett Ranch East Air Quality Technical Report Appendix A - 15 ESA / 140728
Total 0.1699
0.9996
2.1485
4.6700e-003
3.3094
0.0155
3.3249
0.3665
0.0143
0.3808
433.3994
433.3994
9.6300e-003
433.6017
Mitigated Construction On-Site
ROG NOx CO SO2 Fugitive PM10
Exhaust PM10
PM10 Total
Fugitive PM2.5
Exhaust PM2.5
PM2.5 Total
Bio- CO2 NBio- CO2 Total CO2 CH4 N2O CO2e
Category
lb/day lb/day
Fugitive Dust
1.9160
0.0000
1.9160
0.8719
0.0000
0.8719
0.0000
0.0000
Off-Road
6.4795
74.8137
49.1374
0.0617
3.5842
3.5842
3.2975
3.2975
0.0000
6,414.9807
6,414.9807
1.9350
6,455.6154
Total 6.4795
74.8137
49.1374
0.0617
1.9160
3.5842
5.5002
0.8719
3.2975
4.1694
0.0000
6,414.9807
6,414.9807
1.9350
6,455.6154
B - 47

Barrett Ranch East Air Quality Technical Report Appendix A - 16 ESA / 140728
Mitigated Construction Off-Site
ROG NOx CO SO2 Fugitive PM10
Exhaust PM10
PM10 Total
Fugitive PM2.5
Exhaust PM2.5
PM2.5 Total
Bio- CO2
NBio- CO2
Total CO2 CH4 N2O CO2e
Category
lb/day lb/day
Hauling
0.0898
0.9275
1.1833
2.7200e-003
0.3370
0.0144
0.3515
0.0449
0.0132
0.0582
273.5133
273.5133
1.9100e-003
273.5534
Vendor
0.0000
0.0000
0.0000
0.0000
0.0000
0.0000
0.0000
0.0000
0.0000
0.0000
0.0000
0.0000
0.0000
0.0000
Worker
0.0802
0.0721
0.9651
1.9500e-003
1.7730
1.1200e-003
1.7741
0.2017
1.0300e-003
0.2027
159.8861
159.8861
7.7200e-003
160.0483
Total 0.1699
0.9996
2.1485
4.6700e-003
2.1101
0.0155
2.1256
0.2466
0.0143
0.2609
433.3994
433.3994
9.6300e-003
433.6017
3.4 Building Construction - 2016
Unmitigated Construction On-Site
ROG NOx CO SO2 Fugitive PM10
Exhaust PM10
PM10 Total
Fugitive PM2.5
Exhaust PM2.5
PM2.5 Total
Bio- CO2
NBio- CO2 Total CO2 CH4 N2O CO2e
Category
lb/day lb/day
Off-Road
3.4062
28.5063
18.5066
0.0268
1.9674
1.9674
1.8485
1.8485
2,669.2864
2,669.2864
0.6620
2,683.1890
Total 3.4062
28.5063
18.5066
0.0268
1.9674
1.9674
1.8485
1.8485
2,669.2864
2,669.2864
0.6620
2,683.1890
B - 48
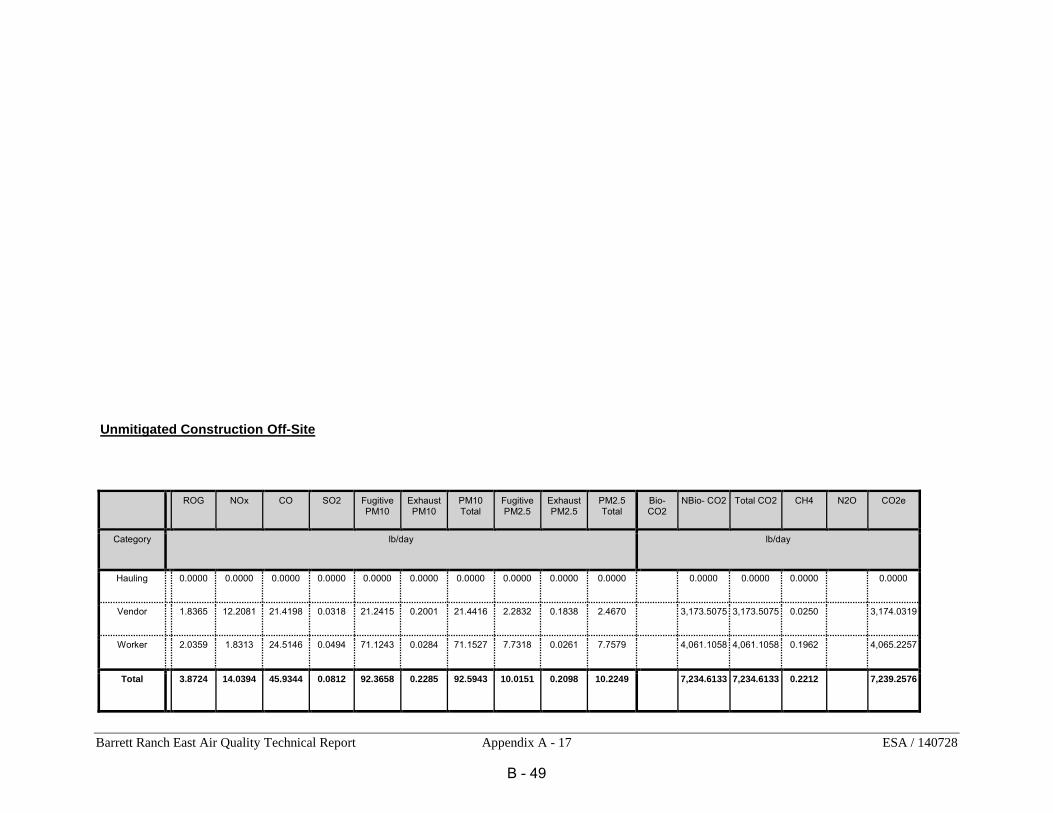
Barrett Ranch East Air Quality Technical Report Appendix A - 17 ESA / 140728
Unmitigated Construction Off-Site
ROG NOx CO SO2 Fugitive PM10
Exhaust PM10
PM10 Total
Fugitive PM2.5
Exhaust PM2.5
PM2.5 Total
Bio- CO2
NBio- CO2 Total CO2 CH4 N2O CO2e
Category
lb/day lb/day
Hauling
0.0000
0.0000
0.0000
0.0000
0.0000
0.0000
0.0000
0.0000
0.0000
0.0000
0.0000
0.0000
0.0000
0.0000
Vendor
1.8365
12.2081
21.4198
0.0318
21.2415
0.2001
21.4416
2.2832
0.1838
2.4670
3,173.5075
3,173.5075
0.0250
3,174.0319
Worker
2.0359
1.8313
24.5146
0.0494
71.1243
0.0284
71.1527
7.7318
0.0261
7.7579
4,061.1058
4,061.1058
0.1962
4,065.2257
Total 3.8724
14.0394
45.9344
0.0812
92.3658
0.2285
92.5943
10.0151
0.2098
10.2249
7,234.6133
7,234.6133
0.2212
7,239.2576
B - 49

Barrett Ranch East Air Quality Technical Report Appendix A - 18 ESA / 140728
Mitigated Construction On-Site
ROG NOx CO SO2 Fugitive PM10
Exhaust PM10
PM10 Total
Fugitive PM2.5
Exhaust PM2.5
PM2.5 Total
Bio- CO2 NBio- CO2 Total CO2 CH4 N2O CO2e
Category
lb/day lb/day
Off-Road
3.4062
28.5063
18.5066
0.0268
1.9674
1.9674
1.8485
1.8485
0.0000
2,669.2864
2,669.2864
0.6620
2,683.1890
Total 3.4062
28.5063
18.5066
0.0268
1.9674
1.9674
1.8485
1.8485
0.0000
2,669.2864
2,669.2864
0.6620
2,683.1890
Mitigated Construction Off-Site
ROG NOx CO SO2 Fugitive PM10
Exhaust PM10
PM10 Total
Fugitive PM2.5
Exhaust PM2.5
PM2.5 Total
Bio- CO2
NBio- CO2 Total CO2 CH4 N2O CO2e
Category
lb/day lb/day
Hauling
0.0000
0.0000
0.0000
0.0000
0.0000
0.0000
0.0000
0.0000
0.0000
0.0000
0.0000
0.0000
0.0000
0.0000
Vendor
1.8365
12.2081
21.4198
0.0318
13.3483
0.2001
13.5484
1.4939
0.1838
1.6777
3,173.5075
3,173.5075
0.0250
3,174.0319
Worker
2.0359
1.8313
24.5146
0.0494
45.0344
0.0284
45.0628
5.1229
0.0261
5.1489
4,061.1058
4,061.1058
0.1962
4,065.2257
B - 50

Barrett Ranch East Air Quality Technical Report Appendix A - 19 ESA / 140728
Total 3.8724
14.0394
45.9344
0.0812
58.3827
0.2285
58.6112
6.6168
0.2098
6.8266
7,234.6133
7,234.6133
0.2212
7,239.2576
3.4 Building Construction - 2017
Unmitigated Construction On-Site
ROG NOx CO SO2 Fugitive PM10
Exhaust PM10
PM10 Total
Fugitive PM2.5
Exhaust PM2.5
PM2.5 Total
Bio- CO2
NBio- CO2 Total CO2 CH4 N2O CO2e
Category
lb/day lb/day
Off-Road
3.1024
26.4057
18.1291
0.0268
1.7812
1.7812
1.6730
1.6730
2,639.8053
2,639.8053
0.6497
2,653.4490
Total 3.1024
26.4057
18.1291
0.0268
1.7812
1.7812
1.6730
1.6730
2,639.8053
2,639.8053
0.6497
2,653.4490
B - 51

Barrett Ranch East Air Quality Technical Report Appendix A - 20 ESA / 140728
Unmitigated Construction Off-Site
ROG NOx CO SO2 Fugitive PM10
Exhaust PM10
PM10 Total
Fugitive PM2.5
Exhaust PM2.5
PM2.5 Total
Bio- CO2
NBio- CO2 Total CO2 CH4 N2O CO2e
Category
lb/day lb/day
Hauling
0.0000
0.0000
0.0000
0.0000
0.0000
0.0000
0.0000
0.0000
0.0000
0.0000
0.0000
0.0000
0.0000
0.0000
Vendor
1.5836
10.8120
19.1813
0.0317
21.2417
0.1687
21.4103
2.2833
0.1549
2.4382
3,120.1018
3,120.1018
0.0233
3,120.5905
Worker
1.8152
1.6371
21.9461
0.0494
71.1243
0.0274
71.1517
7.7318
0.0253
7.7572
3,900.9275
3,900.9275
0.1790
3,904.6860
Total 3.3988
12.4490
41.1274
0.0811
92.3660
0.1961
92.5621
10.0152
0.1802
10.1954
7,021.0292
7,021.0292
0.2023
7,025.2764
Mitigated Construction On-Site
ROG NOx CO SO2 Fugitive PM10
Exhaust PM10
PM10 Total
Fugitive PM2.5
Exhaust PM2.5
PM2.5 Total
Bio- CO2 NBio- CO2 Total CO2 CH4 N2O CO2e
Category
lb/day lb/day
Off-Road
3.1024
26.4057
18.1291
0.0268
1.7812
1.7812
1.6730
1.6730
0.0000
2,639.8053
2,639.8053
0.6497
2,653.4490
Total 3.1024
26.4057
18.1291
0.0268
1.7812
1.7812
1.6730
1.6730
0.0000
2,639.8053
2,639.8053
0.6497
2,653.4490
B - 52

Barrett Ranch East Air Quality Technical Report Appendix A - 21 ESA / 140728
Mitigated Construction Off-Site
ROG NOx CO SO2 Fugitive PM10
Exhaust PM10
PM10 Total
Fugitive PM2.5
Exhaust PM2.5
PM2.5 Total
Bio- CO2
NBio- CO2 Total CO2 CH4 N2O CO2e
Category
lb/day lb/day
Hauling
0.0000
0.0000
0.0000
0.0000
0.0000
0.0000
0.0000
0.0000
0.0000
0.0000
0.0000
0.0000
0.0000
0.0000
Vendor
1.5836
10.8120
19.1813
0.0317
13.3485
0.1687
13.5172
1.4940
0.1549
1.6489
3,120.1018
3,120.1018
0.0233
3,120.5905
Worker
1.8152
1.6371
21.9461
0.0494
45.0344
0.0274
45.0618
5.1229
0.0253
5.1482
3,900.9275
3,900.9275
0.1790
3,904.6860
Total 3.3988
12.4490
41.1274
0.0811
58.3829
0.1961
58.5790
6.6169
0.1802
6.7971
7,021.0292
7,021.0292
0.2023
7,025.2764
B - 53
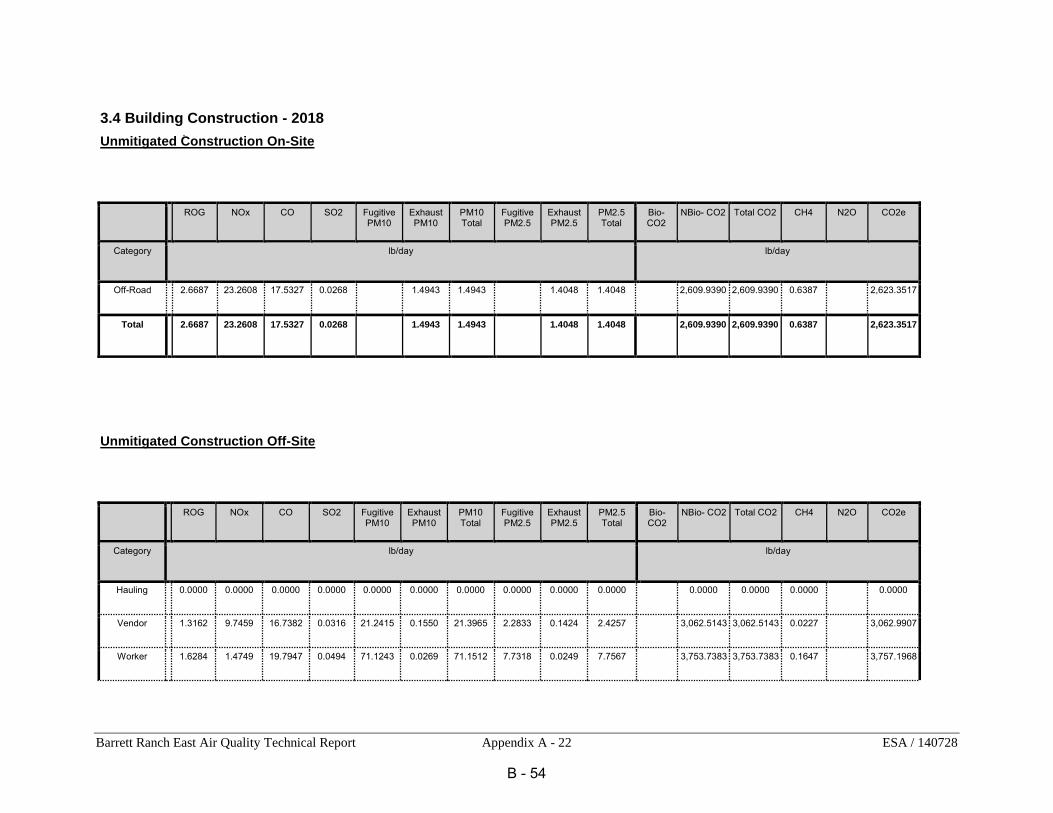
Barrett Ranch East Air Quality Technical Report Appendix A - 22 ESA / 140728
3.4 Building Construction - 2018
Unmitigated Construction On-Site
ROG NOx CO SO2 Fugitive PM10
Exhaust PM10
PM10 Total
Fugitive PM2.5
Exhaust PM2.5
PM2.5 Total
Bio- CO2
NBio- CO2 Total CO2 CH4 N2O CO2e
Category
lb/day lb/day
Off-Road
2.6687
23.2608
17.5327
0.0268
1.4943
1.4943
1.4048
1.4048
2,609.9390
2,609.9390
0.6387
2,623.3517
Total 2.6687
23.2608
17.5327
0.0268
1.4943
1.4943
1.4048
1.4048
2,609.9390
2,609.9390
0.6387
2,623.3517
Unmitigated Construction Off-Site
ROG NOx CO SO2 Fugitive PM10
Exhaust PM10
PM10 Total
Fugitive PM2.5
Exhaust PM2.5
PM2.5 Total
Bio- CO2
NBio- CO2 Total CO2 CH4 N2O CO2e
Category
lb/day lb/day
Hauling
0.0000
0.0000
0.0000
0.0000
0.0000
0.0000
0.0000
0.0000
0.0000
0.0000
0.0000
0.0000
0.0000
0.0000
Vendor
1.3162
9.7459
16.7382
0.0316
21.2415
0.1550
21.3965
2.2833
0.1424
2.4257
3,062.5143
3,062.5143
0.0227
3,062.9907
Worker
1.6284
1.4749
19.7947
0.0494
71.1243
0.0269
71.1512
7.7318
0.0249
7.7567
3,753.7383
3,753.7383
0.1647
3,757.1968
B - 54

Barrett Ranch East Air Quality Technical Report Appendix A - 23 ESA / 140728
Total 2.9446
11.2208
36.5329
0.0810
92.3658
0.1819
92.5477
10.0151
0.1673
10.1824
6,816.2526
6,816.2526
0.1874
6,820.1875
Mitigated Construction On-Site
ROG NOx CO SO2 Fugitive PM10
Exhaust PM10
PM10 Total
Fugitive PM2.5
Exhaust PM2.5
PM2.5 Total
Bio- CO2 NBio- CO2 Total CO2 CH4 N2O CO2e
Category
lb/day lb/day
Off-Road
2.6687
23.2608
17.5327
0.0268
1.4943
1.4943
1.4048
1.4048
0.0000
2,609.9389
2,609.9389
0.6387
2,623.3517
Total 2.6687
23.2608
17.5327
0.0268
1.4943
1.4943
1.4048
1.4048
0.0000
2,609.9389
2,609.9389
0.6387
2,623.3517
B - 55
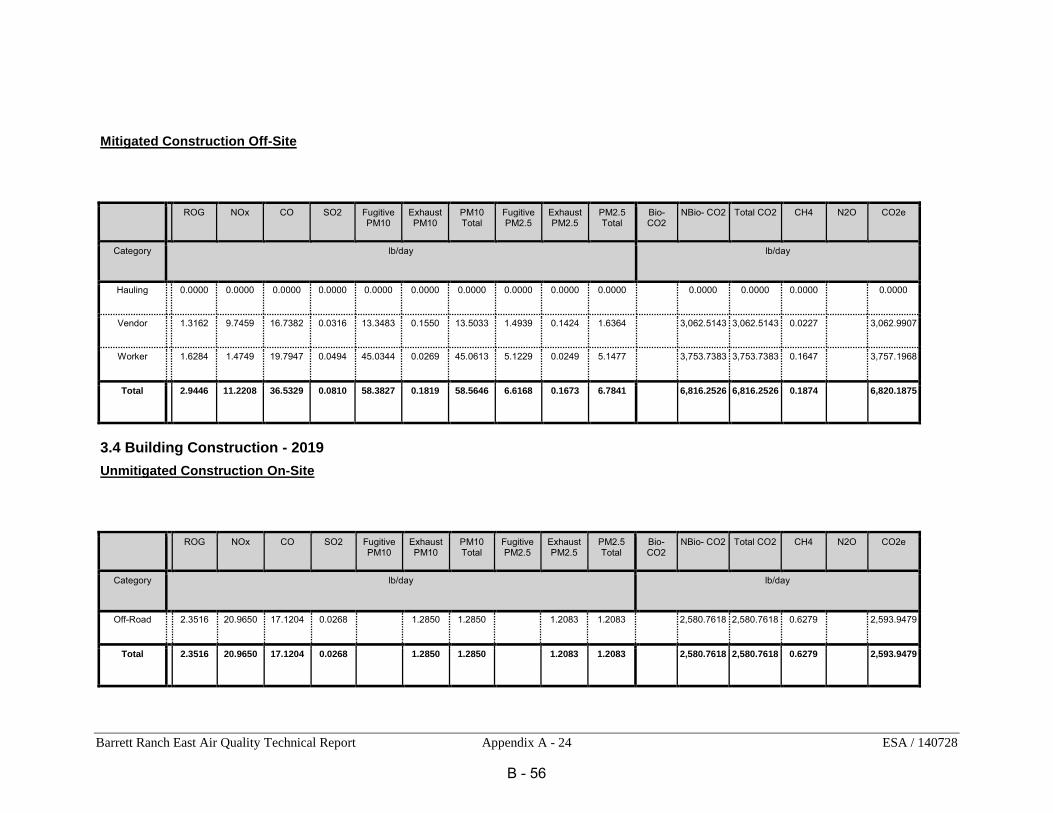
Barrett Ranch East Air Quality Technical Report Appendix A - 24 ESA / 140728
Mitigated Construction Off-Site
ROG NOx CO SO2 Fugitive PM10
Exhaust PM10
PM10 Total
Fugitive PM2.5
Exhaust PM2.5
PM2.5 Total
Bio- CO2
NBio- CO2 Total CO2 CH4 N2O CO2e
Category
lb/day lb/day
Hauling
0.0000
0.0000
0.0000
0.0000
0.0000
0.0000
0.0000
0.0000
0.0000
0.0000
0.0000
0.0000
0.0000
0.0000
Vendor
1.3162
9.7459
16.7382
0.0316
13.3483
0.1550
13.5033
1.4939
0.1424
1.6364
3,062.5143
3,062.5143
0.0227
3,062.9907
Worker
1.6284
1.4749
19.7947
0.0494
45.0344
0.0269
45.0613
5.1229
0.0249
5.1477
3,753.7383
3,753.7383
0.1647
3,757.1968
Total 2.9446
11.2208
36.5329
0.0810
58.3827
0.1819
58.5646
6.6168
0.1673
6.7841
6,816.2526
6,816.2526
0.1874
6,820.1875
3.4 Building Construction - 2019
Unmitigated Construction On-Site
ROG NOx CO SO2 Fugitive PM10
Exhaust PM10
PM10 Total
Fugitive PM2.5
Exhaust PM2.5
PM2.5 Total
Bio- CO2
NBio- CO2 Total CO2 CH4 N2O CO2e
Category
lb/day lb/day
Off-Road
2.3516
20.9650
17.1204
0.0268
1.2850
1.2850
1.2083
1.2083
2,580.7618
2,580.7618
0.6279
2,593.9479
Total 2.3516
20.9650
17.1204
0.0268
1.2850
1.2850
1.2083
1.2083
2,580.7618
2,580.7618
0.6279
2,593.9479
B - 56

Barrett Ranch East Air Quality Technical Report Appendix A - 25 ESA / 140728
Unmitigated Construction Off-Site
ROG NOx CO SO2 Fugitive PM10
Exhaust PM10
PM10 Total
Fugitive PM2.5
Exhaust PM2.5
PM2.5 Total
Bio- CO2
NBio- CO2 Total CO2 CH4 N2O CO2e
Category
lb/day lb/day
Hauling
0.0000
0.0000
0.0000
0.0000
0.0000
0.0000
0.0000
0.0000
0.0000
0.0000
0.0000
0.0000
0.0000
0.0000
Vendor
1.1949
8.8732
15.5901
0.0316
21.2417
0.1434
21.3851
2.2833
0.1318
2.4152
3,012.9083
3,012.9083
0.0221
3,013.3722
Worker
1.4973
1.3496
18.2908
0.0492
71.1243
0.0266
71.1509
7.7318
0.0246
7.7565
3,601.7189
3,601.7189
0.1532
3,604.9363
Total 2.6922
10.2228
33.8809
0.0807
92.3660
0.1699
92.5360
10.0152
0.1564
10.1716
6,614.6272
6,614.6272
0.1753
6,618.3085
B - 57

Barrett Ranch East Air Quality Technical Report Appendix A - 26 ESA / 140728
Mitigated Construction On-Site
ROG NOx CO SO2 Fugitive PM10
Exhaust PM10
PM10 Total
Fugitive PM2.5
Exhaust PM2.5
PM2.5 Total
Bio- CO2 NBio- CO2 Total CO2 CH4 N2O CO2e
Category
lb/day lb/day
Off-Road
2.3516
20.9650
17.1204
0.0268
1.2850
1.2850
1.2083
1.2083
0.0000
2,580.7618
2,580.7618
0.6279
2,593.9479
Total 2.3516
20.9650
17.1204
0.0268
1.2850
1.2850
1.2083
1.2083
0.0000
2,580.7618
2,580.7618
0.6279
2,593.9479
Mitigated Construction Off-Site
ROG NOx CO SO2 Fugitive PM10
Exhaust PM10
PM10 Total
Fugitive PM2.5
Exhaust PM2.5
PM2.5 Total
Bio- CO2
NBio- CO2 Total CO2 CH4 N2O CO2e
Category
lb/day lb/day
Hauling
0.0000
0.0000
0.0000
0.0000
0.0000
0.0000
0.0000
0.0000
0.0000
0.0000
0.0000
0.0000
0.0000
0.0000
Vendor
1.1949
8.8732
15.5901
0.0316
13.3486
0.1434
13.4919
1.4940
0.1318
1.6258
3,012.9083
3,012.9083
0.0221
3,013.3722
Worker
1.4973
1.3496
18.2908
0.0492
45.0344
0.0266
45.0610
5.1229
0.0246
5.1475
3,601.7189
3,601.7189
0.1532
3,604.9363
B - 58

Barrett Ranch East Air Quality Technical Report Appendix A - 27 ESA / 140728
Total 2.6922
10.2228
33.8809
0.0807
58.3830
0.1699
58.5529
6.6169
0.1564
6.7733
6,614.6272
6,614.6272
0.1753
6,618.3085
3.5 Paving - 2019
Unmitigated Construction On-Site
ROG NOx CO SO2 Fugitive PM10
Exhaust PM10
PM10 Total
Fugitive PM2.5
Exhaust PM2.5
PM2.5 Total
Bio- CO2
NBio- CO2 Total CO2 CH4 N2O CO2e
Category
lb/day lb/day
Off-Road
1.4259
14.9353
14.3652
0.0223
0.8094
0.8094
0.7447
0.7447
2,208.9731
2,208.9731
0.6989
2,223.6499
Paving
0.0280
0.0000
0.0000
0.0000
0.0000
0.0000
0.0000
Total 1.4539
14.9353
14.3652
0.0223
0.8094
0.8094
0.7447
0.7447
2,208.9731
2,208.9731
0.6989
2,223.6499
B - 59
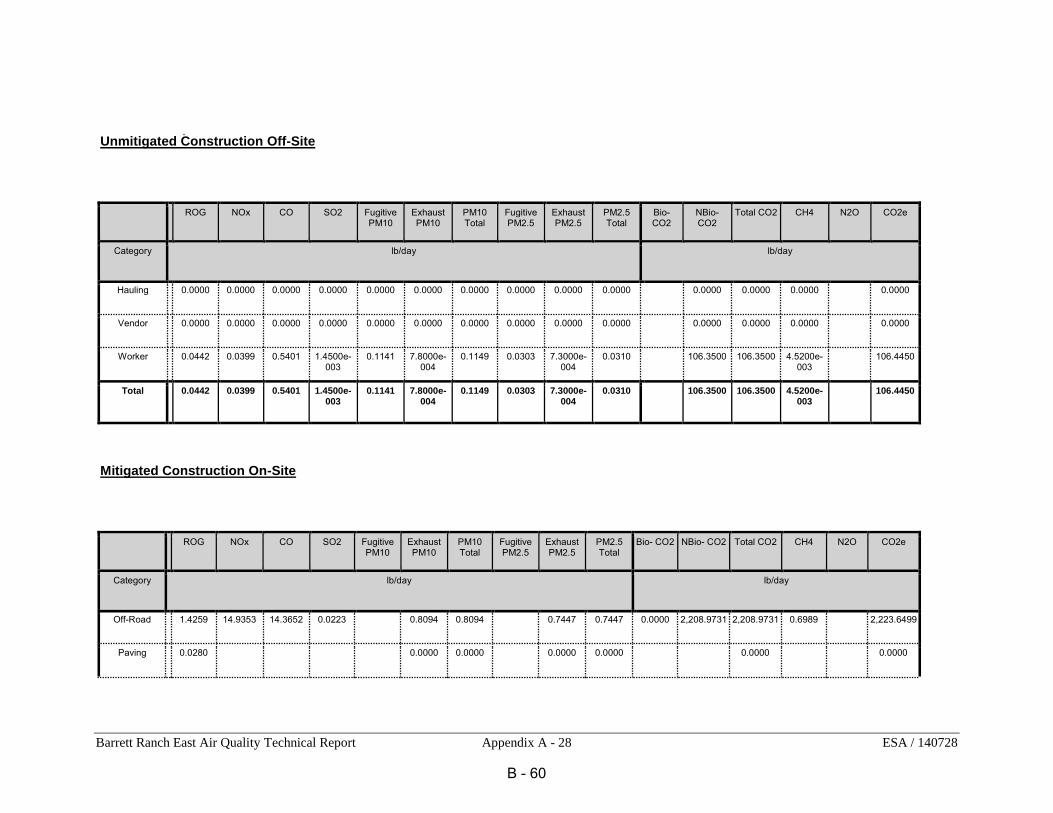
Barrett Ranch East Air Quality Technical Report Appendix A - 28 ESA / 140728
Unmitigated Construction Off-Site
ROG NOx CO SO2 Fugitive PM10
Exhaust PM10
PM10 Total
Fugitive PM2.5
Exhaust PM2.5
PM2.5 Total
Bio- CO2
NBio- CO2
Total CO2 CH4 N2O CO2e
Category
lb/day lb/day
Hauling
0.0000
0.0000
0.0000
0.0000
0.0000
0.0000
0.0000
0.0000
0.0000
0.0000
0.0000
0.0000
0.0000
0.0000
Vendor
0.0000
0.0000
0.0000
0.0000
0.0000
0.0000
0.0000
0.0000
0.0000
0.0000
0.0000
0.0000
0.0000
0.0000
Worker
0.0442
0.0399
0.5401
1.4500e-003
0.1141
7.8000e-004
0.1149
0.0303
7.3000e-004
0.0310
106.3500
106.3500
4.5200e-003
106.4450
Total 0.0442
0.0399
0.5401
1.4500e-003
0.1141
7.8000e-004
0.1149
0.0303
7.3000e-004
0.0310
106.3500
106.3500
4.5200e-003
106.4450
Mitigated Construction On-Site
ROG NOx CO SO2 Fugitive PM10
Exhaust PM10
PM10 Total
Fugitive PM2.5
Exhaust PM2.5
PM2.5 Total
Bio- CO2 NBio- CO2 Total CO2 CH4 N2O CO2e
Category
lb/day lb/day
Off-Road
1.4259
14.9353
14.3652
0.0223
0.8094
0.8094
0.7447
0.7447
0.0000
2,208.9731
2,208.9731
0.6989
2,223.6499
Paving
0.0280
0.0000
0.0000
0.0000
0.0000
0.0000
0.0000
B - 60
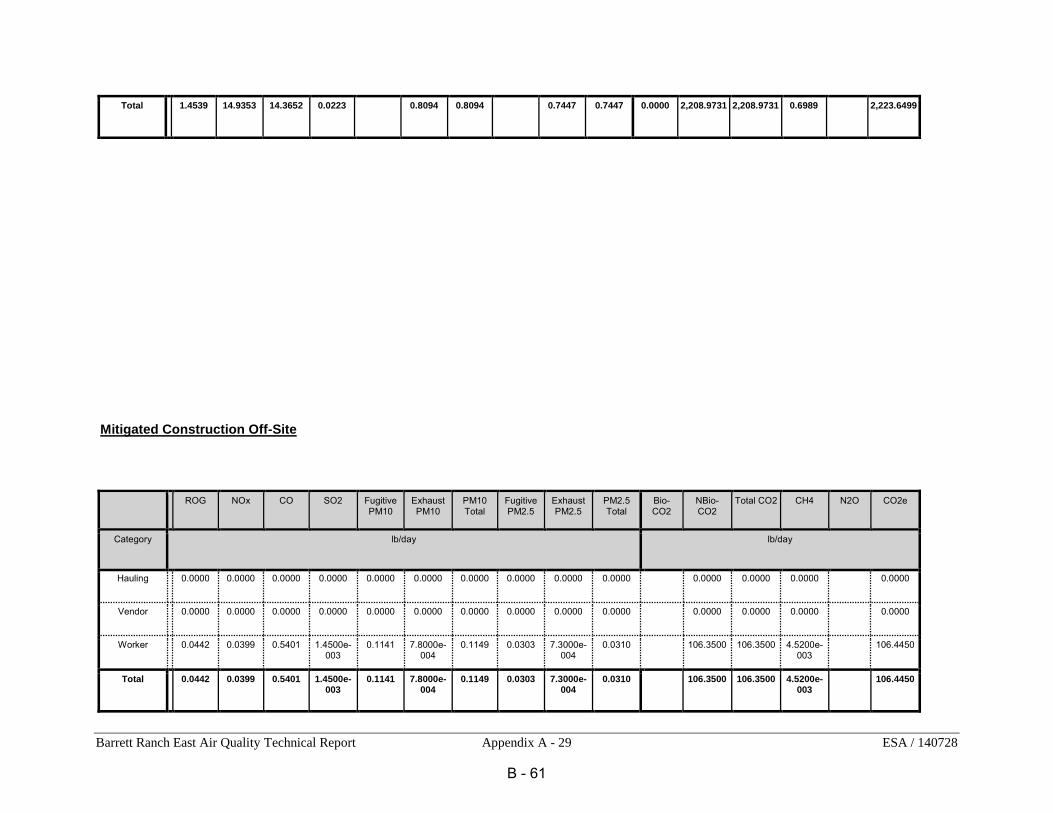
Barrett Ranch East Air Quality Technical Report Appendix A - 29 ESA / 140728
Total 1.4539
14.9353
14.3652
0.0223
0.8094
0.8094
0.7447
0.7447
0.0000
2,208.9731
2,208.9731
0.6989
2,223.6499
Mitigated Construction Off-Site
ROG NOx CO SO2 Fugitive PM10
Exhaust PM10
PM10 Total
Fugitive PM2.5
Exhaust PM2.5
PM2.5 Total
Bio- CO2
NBio- CO2
Total CO2 CH4 N2O CO2e
Category
lb/day lb/day
Hauling
0.0000
0.0000
0.0000
0.0000
0.0000
0.0000
0.0000
0.0000
0.0000
0.0000
0.0000
0.0000
0.0000
0.0000
Vendor
0.0000
0.0000
0.0000
0.0000
0.0000
0.0000
0.0000
0.0000
0.0000
0.0000
0.0000
0.0000
0.0000
0.0000
Worker
0.0442
0.0399
0.5401
1.4500e-003
0.1141
7.8000e-004
0.1149
0.0303
7.3000e-004
0.0310
106.3500
106.3500
4.5200e-003
106.4450
Total 0.0442
0.0399
0.5401
1.4500e-003
0.1141
7.8000e-004
0.1149
0.0303
7.3000e-004
0.0310
106.3500
106.3500
4.5200e-003
106.4450
B - 61
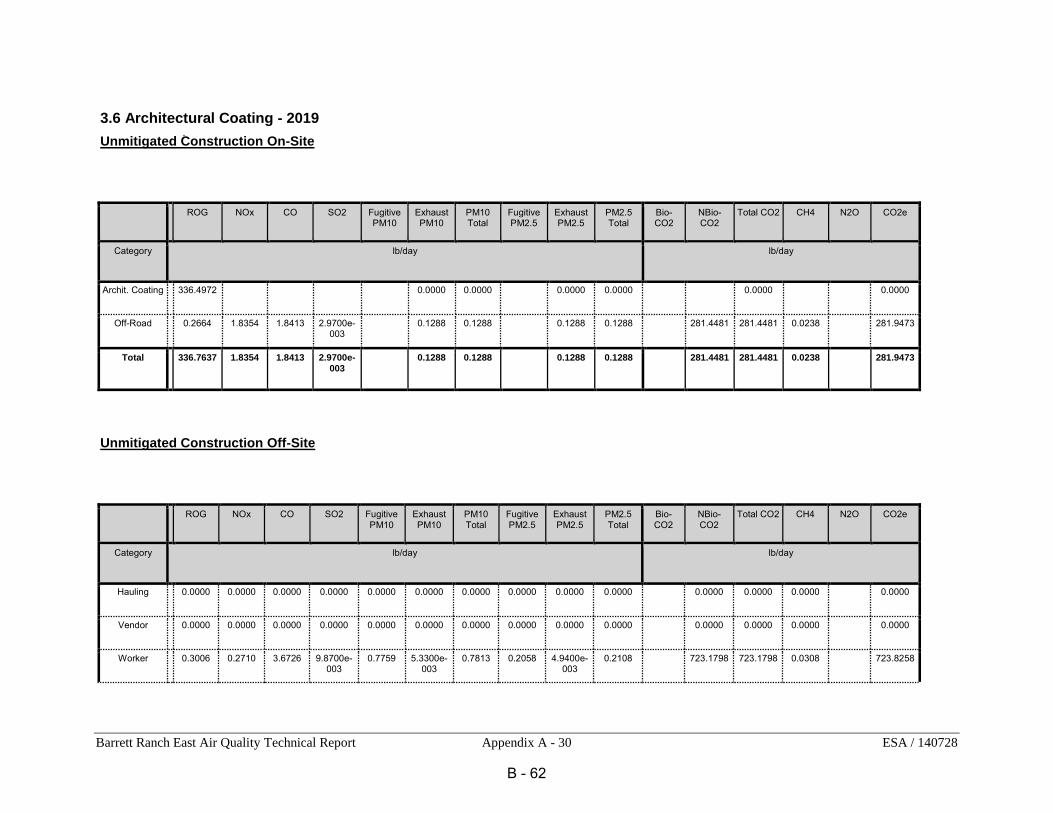
Barrett Ranch East Air Quality Technical Report Appendix A - 30 ESA / 140728
3.6 Architectural Coating - 2019
Unmitigated Construction On-Site
ROG NOx CO SO2 Fugitive PM10
Exhaust PM10
PM10 Total
Fugitive PM2.5
Exhaust PM2.5
PM2.5 Total
Bio- CO2
NBio- CO2
Total CO2 CH4 N2O CO2e
Category
lb/day lb/day
Archit. Coating
336.4972
0.0000
0.0000
0.0000
0.0000
0.0000
0.0000
Off-Road
0.2664
1.8354
1.8413
2.9700e-003
0.1288
0.1288
0.1288
0.1288
281.4481
281.4481
0.0238
281.9473
Total 336.7637
1.8354
1.8413
2.9700e-003
0.1288
0.1288
0.1288
0.1288
281.4481
281.4481
0.0238
281.9473
Unmitigated Construction Off-Site
ROG NOx CO SO2 Fugitive PM10
Exhaust PM10
PM10 Total
Fugitive PM2.5
Exhaust PM2.5
PM2.5 Total
Bio- CO2
NBio- CO2
Total CO2 CH4 N2O CO2e
Category
lb/day lb/day
Hauling
0.0000
0.0000
0.0000
0.0000
0.0000
0.0000
0.0000
0.0000
0.0000
0.0000
0.0000
0.0000
0.0000
0.0000
Vendor
0.0000
0.0000
0.0000
0.0000
0.0000
0.0000
0.0000
0.0000
0.0000
0.0000
0.0000
0.0000
0.0000
0.0000
Worker
0.3006
0.2710
3.6726
9.8700e-003
0.7759
5.3300e-003
0.7813
0.2058
4.9400e-003
0.2108
723.1798
723.1798
0.0308
723.8258
B - 62

Barrett Ranch East Air Quality Technical Report Appendix A - 31 ESA / 140728
Total 0.3006
0.2710
3.6726
9.8700e-003
0.7759
5.3300e-003
0.7813
0.2058
4.9400e-003
0.2108
723.1798
723.1798
0.0308
723.8258
Mitigated Construction On-Site
ROG NOx CO SO2 Fugitive PM10
Exhaust PM10
PM10 Total
Fugitive PM2.5
Exhaust PM2.5
PM2.5 Total
Bio- CO2 NBio- CO2
Total CO2 CH4 N2O CO2e
Category
lb/day lb/day
Archit. Coating
336.4972
0.0000
0.0000
0.0000
0.0000
0.0000
0.0000
Off-Road
0.2664
1.8354
1.8413
2.9700e-003
0.1288
0.1288
0.1288
0.1288
0.0000
281.4481
281.4481
0.0238
281.9473
Total 336.7637
1.8354
1.8413
2.9700e-003
0.1288
0.1288
0.1288
0.1288
0.0000
281.4481
281.4481
0.0238
281.9473
B - 63

Barrett Ranch East Air Quality Technical Report Appendix A - 32 ESA / 140728
Mitigated Construction Off-Site
ROG NOx CO SO2 Fugitive PM10
Exhaust PM10
PM10 Total
Fugitive PM2.5
Exhaust PM2.5
PM2.5 Total
Bio- CO2
NBio- CO2
Total CO2 CH4 N2O CO2e
Category
lb/day lb/day
Hauling
0.0000
0.0000
0.0000
0.0000
0.0000
0.0000
0.0000
0.0000
0.0000
0.0000
0.0000
0.0000
0.0000
0.0000
Vendor
0.0000
0.0000
0.0000
0.0000
0.0000
0.0000
0.0000
0.0000
0.0000
0.0000
0.0000
0.0000
0.0000
0.0000
Worker
0.3006
0.2710
3.6726
9.8700e-003
0.7759
5.3300e-003
0.7813
0.2058
4.9400e-003
0.2108
723.1798
723.1798
0.0308
723.8258
Total 0.3006
0.2710
3.6726
9.8700e-003
0.7759
5.3300e-003
0.7813
0.2058
4.9400e-003
0.2108
723.1798
723.1798
0.0308
723.8258
4.0 Operational Detail - Mobile
4.1 Mitigation Measures Mobile
ROG NOx CO SO2 Fugitive PM10
Exhaust PM10
PM10 Total
Fugitive PM2.5
Exhaust PM2.5
PM2.5 Total
Bio- CO2
NBio- CO2 Total CO2 CH4 N2O CO2e
Category
lb/day lb/day
Mitigated
34.3299
53.8082
297.4092
0.7672
50.8910
0.8429
51.7339
13.5953
0.7777
14.3729
58,217.4520
58,217.4520
2.0910
58,261.3621
B - 64
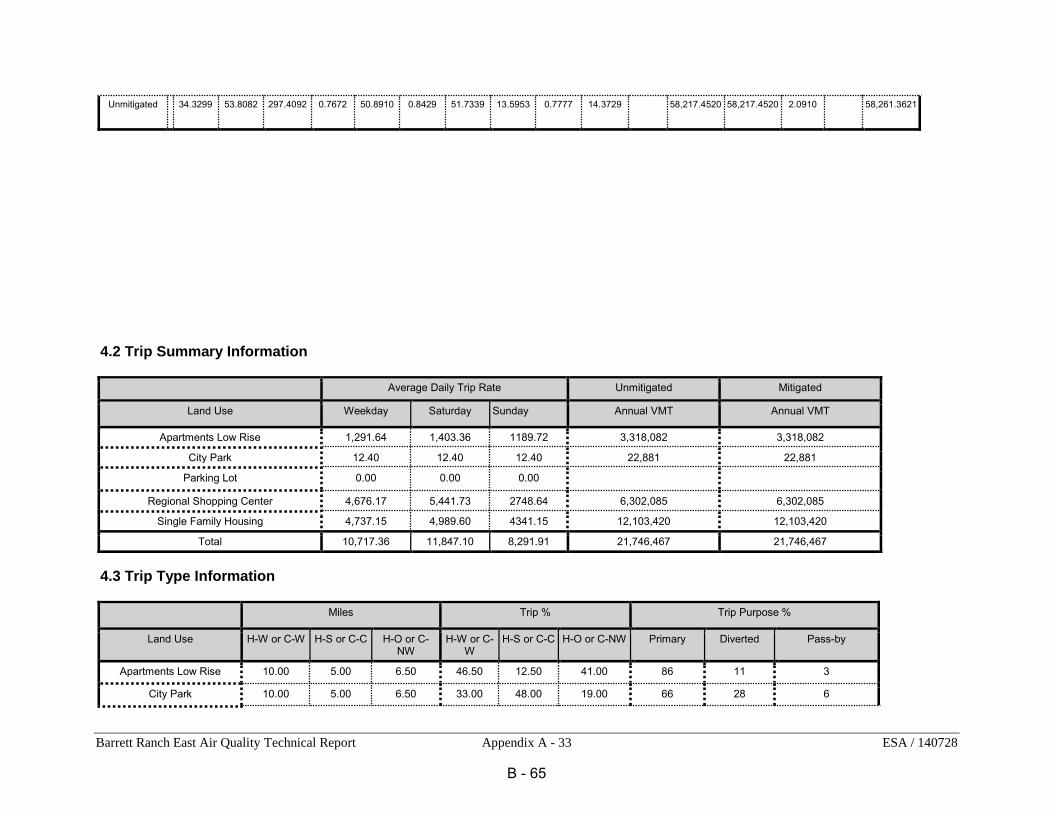
Barrett Ranch East Air Quality Technical Report Appendix A - 33 ESA / 140728
Unmitigated
34.3299
53.8082
297.4092
0.7672
50.8910
0.8429
51.7339
13.5953
0.7777
14.3729
58,217.4520
58,217.4520
2.0910
58,261.3621
4.2 Trip Summary Information
Average Daily Trip Rate Unmitigated Mitigated
Land Use Weekday Saturday Sunday Annual VMT Annual VMT
Apartments Low Rise 1,291.64 1,403.36 1189.72 3,318,082 3,318,082
City Park 12.40 12.40 12.40 22,881 22,881
Parking Lot 0.00 0.00 0.00
Regional Shopping Center 4,676.17 5,441.73 2748.64 6,302,085 6,302,085
Single Family Housing 4,737.15 4,989.60 4341.15 12,103,420 12,103,420
Total 10,717.36 11,847.10 8,291.91 21,746,467 21,746,467
4.3 Trip Type Information
Miles Trip % Trip Purpose %
Land Use H-W or C-W H-S or C-C H-O or C-NW
H-W or C-W
H-S or C-C H-O or C-NW Primary Diverted Pass-by
Apartments Low Rise
10.00
5.00
6.50
46.50
12.50
41.00
86
11
3
City Park
10.00
5.00
6.50
33.00
48.00
19.00
66
28
6
B - 65
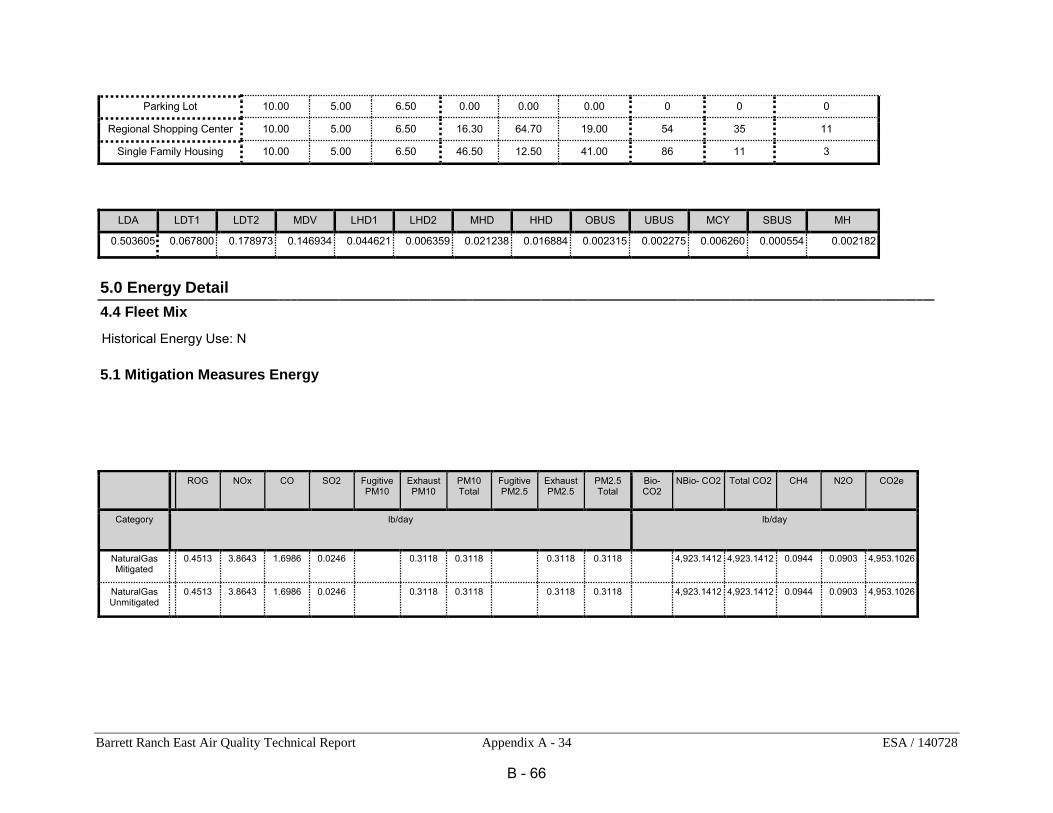
Barrett Ranch East Air Quality Technical Report Appendix A - 34 ESA / 140728
Parking Lot
10.00
5.00
6.50
0.00
0.00
0.00
0
0
0
Regional Shopping Center
10.00
5.00
6.50
16.30
64.70
19.00
54
35
11
Single Family Housing
10.00
5.00
6.50
46.50
12.50
41.00
86
11
3
LDA LDT1 LDT2 MDV LHD1 LHD2 MHD HHD OBUS UBUS MCY SBUS MH
0.503605 0.067800 0.178973 0.146934 0.044621 0.006359 0.021238 0.016884 0.002315 0.002275 0.006260 0.000554 0.002182
5.0 Energy Detail
4.4 Fleet Mix
Historical Energy Use: N
5.1 Mitigation Measures Energy
ROG NOx CO SO2 Fugitive PM10
Exhaust PM10
PM10 Total
Fugitive PM2.5
Exhaust PM2.5
PM2.5 Total
Bio- CO2
NBio- CO2 Total CO2 CH4 N2O CO2e
Category
lb/day lb/day
NaturalGas Mitigated
0.4513
3.8643
1.6986
0.0246
0.3118
0.3118
0.3118
0.3118
4,923.1412
4,923.1412
0.0944
0.0903
4,953.1026
NaturalGas Unmitigated
0.4513
3.8643
1.6986
0.0246
0.3118
0.3118
0.3118
0.3118
4,923.1412
4,923.1412
0.0944
0.0903
4,953.1026
B - 66
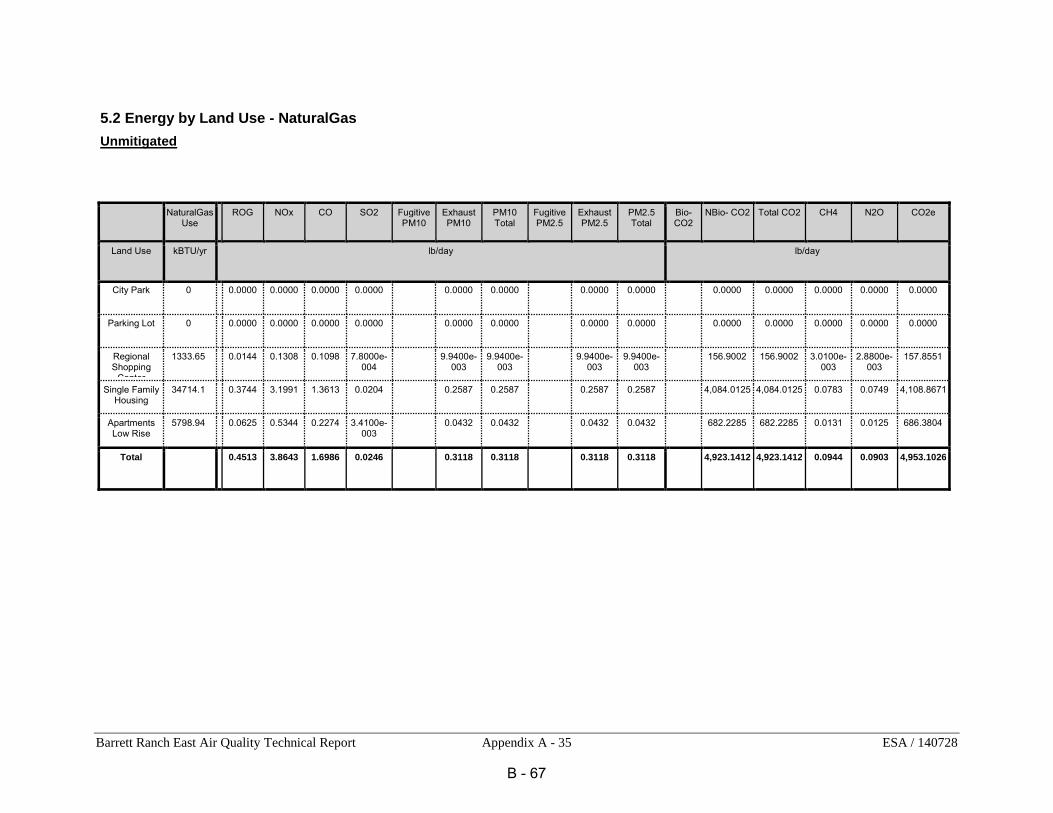
Barrett Ranch East Air Quality Technical Report Appendix A - 35 ESA / 140728
5.2 Energy by Land Use - NaturalGas
Unmitigated
NaturalGas Use
ROG NOx CO SO2 Fugitive PM10
Exhaust PM10
PM10 Total
Fugitive PM2.5
Exhaust PM2.5
PM2.5 Total
Bio- CO2
NBio- CO2 Total CO2 CH4 N2O CO2e
Land Use
kBTU/yr lb/day lb/day
City Park
0
0.0000
0.0000
0.0000
0.0000
0.0000
0.0000
0.0000
0.0000
0.0000
0.0000
0.0000
0.0000
0.0000
Parking Lot
0
0.0000
0.0000
0.0000
0.0000
0.0000
0.0000
0.0000
0.0000
0.0000
0.0000
0.0000
0.0000
0.0000
Regional Shopping
Center
1333.65
0.0144
0.1308
0.1098
7.8000e-004
9.9400e-003
9.9400e-003
9.9400e-003
9.9400e-003
156.9002
156.9002
3.0100e-003
2.8800e-003
157.8551
Single Family Housing
34714.1
0.3744
3.1991
1.3613
0.0204
0.2587
0.2587
0.2587
0.2587
4,084.0125
4,084.0125
0.0783
0.0749
4,108.8671
Apartments Low Rise
5798.94
0.0625
0.5344
0.2274
3.4100e-003
0.0432
0.0432
0.0432
0.0432
682.2285
682.2285
0.0131
0.0125
686.3804
Total 0.4513
3.8643
1.6986
0.0246
0.3118
0.3118
0.3118
0.3118
4,923.1412
4,923.1412
0.0944
0.0903
4,953.1026
B - 67
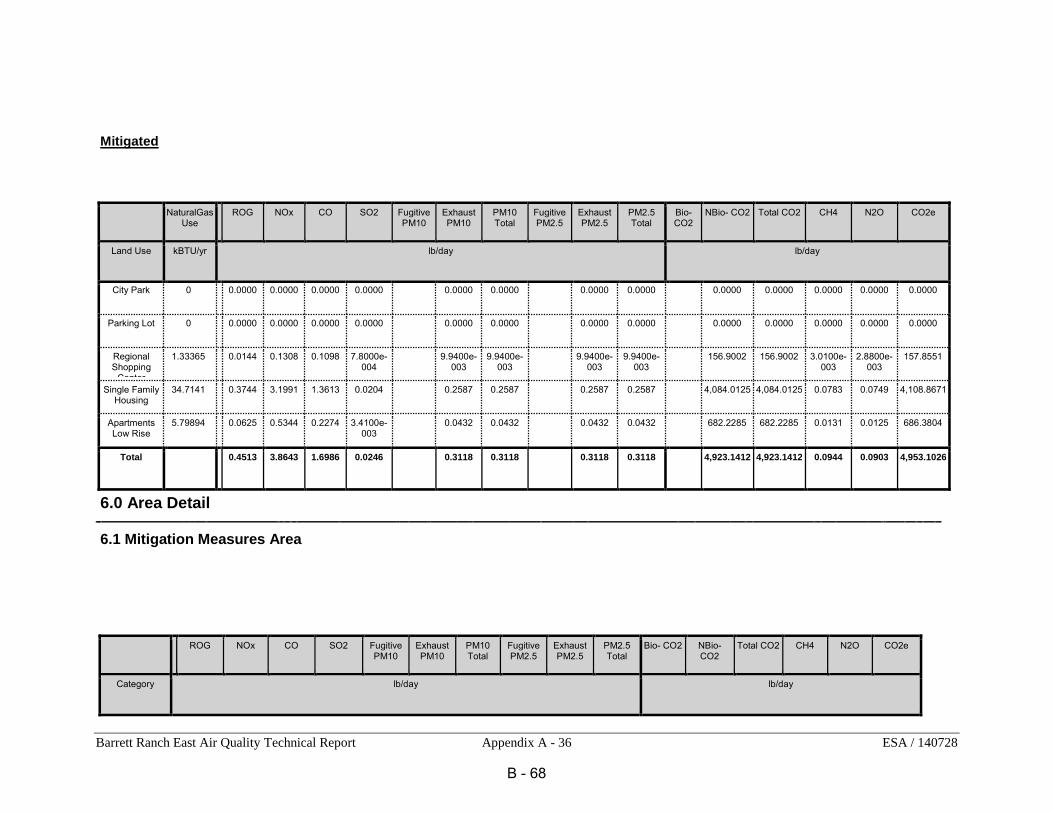
Barrett Ranch East Air Quality Technical Report Appendix A - 36 ESA / 140728
Mitigated
NaturalGas Use
ROG NOx CO SO2 Fugitive PM10
Exhaust PM10
PM10 Total
Fugitive PM2.5
Exhaust PM2.5
PM2.5 Total
Bio- CO2
NBio- CO2 Total CO2 CH4 N2O CO2e
Land Use
kBTU/yr lb/day lb/day
City Park
0
0.0000
0.0000
0.0000
0.0000
0.0000
0.0000
0.0000
0.0000
0.0000
0.0000
0.0000
0.0000
0.0000
Parking Lot
0
0.0000
0.0000
0.0000
0.0000
0.0000
0.0000
0.0000
0.0000
0.0000
0.0000
0.0000
0.0000
0.0000
Regional Shopping
Center
1.33365
0.0144
0.1308
0.1098
7.8000e-004
9.9400e-003
9.9400e-003
9.9400e-003
9.9400e-003
156.9002
156.9002
3.0100e-003
2.8800e-003
157.8551
Single Family Housing
34.7141
0.3744
3.1991
1.3613
0.0204
0.2587
0.2587
0.2587
0.2587
4,084.0125
4,084.0125
0.0783
0.0749
4,108.8671
Apartments Low Rise
5.79894
0.0625
0.5344
0.2274
3.4100e-003
0.0432
0.0432
0.0432
0.0432
682.2285
682.2285
0.0131
0.0125
686.3804
Total 0.4513
3.8643
1.6986
0.0246
0.3118
0.3118
0.3118
0.3118
4,923.1412
4,923.1412
0.0944
0.0903
4,953.1026
6.0 Area Detail
6.1 Mitigation Measures Area
ROG NOx CO SO2 Fugitive PM10
Exhaust PM10
PM10 Total
Fugitive PM2.5
Exhaust PM2.5
PM2.5 Total
Bio- CO2 NBio- CO2
Total CO2 CH4 N2O CO2e
Category
lb/day lb/day
B - 68

Barrett Ranch East Air Quality Technical Report Appendix A - 37 ESA / 140728
Mitigated
40.6278
0.6617
57.2127
3.0100e-003
0.3146
0.3146
0.3146
0.3146
0.0000
102.6812
102.6812
0.1002
0.0000
104.7849
Unmitigated
40.6278
0.6617
57.2127
3.0100e-003
0.3146
0.3146
0.3146
0.3146
0.0000
102.6812
102.6812
0.1002
0.0000
104.7849
6.2 Area by SubCategory
Unmitigated
ROG NOx CO SO2 Fugitive PM10
Exhaust PM10
PM10 Total
Fugitive PM2.5
Exhaust PM2.5
PM2.5 Total
Bio- CO2 NBio- CO2
Total CO2 CH4 N2O CO2e
SubCategory
lb/day lb/day
Architectural Coating
5.4393
0.0000
0.0000
0.0000
0.0000
0.0000
0.0000
Consumer Products
33.4454
0.0000
0.0000
0.0000
0.0000
0.0000
0.0000
Hearth
0.0000
0.0000
0.0000
0.0000
0.0000
0.0000
0.0000
0.0000
0.0000
0.0000
0.0000
0.0000
0.0000
0.0000
Landscaping
1.7431
0.6617
57.2127
3.0100e-003
0.3146
0.3146
0.3146
0.3146
102.6812
102.6812
0.1002
104.7849
Total 40.6278
0.6617
57.2127
3.0100e-003
0.3146
0.3146
0.3146
0.3146
0.0000
102.6812
102.6812
0.1002
0.0000
104.7849
B - 69

Barrett Ranch East Air Quality Technical Report Appendix A - 38 ESA / 140728
Mitigated
ROG NOx CO SO2 Fugitive PM10
Exhaust PM10
PM10 Total
Fugitive PM2.5
Exhaust PM2.5
PM2.5 Total
Bio- CO2 NBio- CO2
Total CO2 CH4 N2O CO2e
SubCategory
lb/day lb/day
Architectural Coating
5.4393
0.0000
0.0000
0.0000
0.0000
0.0000
0.0000
Consumer Products
33.4454
0.0000
0.0000
0.0000
0.0000
0.0000
0.0000
Hearth
0.0000
0.0000
0.0000
0.0000
0.0000
0.0000
0.0000
0.0000
0.0000
0.0000
0.0000
0.0000
0.0000
0.0000
Landscaping
1.7431
0.6617
57.2127
3.0100e-003
0.3146
0.3146
0.3146
0.3146
102.6812
102.6812
0.1002
104.7849
Total 40.6278
0.6617
57.2127
3.0100e-003
0.3146
0.3146
0.3146
0.3146
0.0000
102.6812
102.6812
0.1002
0.0000
104.7849
7.0 Water Detail
7.1 Mitigation Measures Water
8.0 Waste Detail
8.1 Mitigation Measures Waste
9.0 Operational Offroad
Equipment Type Number Hours/Day Days/Year Horse Power Load Factor Fuel Type
B - 70

Barrett Ranch East Air Quality Technical Report Appendix A - 39 ESA / 140728
10.0 Vegetation
B - 71

Barrett Ranch East Air Quality Technical Report Appendix A - 40 ESA / 140728
Mitigated CalEEMod Criteria Pollutant Daily Emission Estimates
Barrett Ranch East
Sacramento County, Summer
1.0 Project Characteristics
1.1 Land Usage
Land Uses Size Metric Lot Acreage Floor Surface Area Population
Parking Lot 27.20 1000sqft 0.62 27,200.00 0
City Park 7.80 Acre 7.80 339,768.00 0
Apartments Low Rise 196.00 Dwelling Unit 10.50 196,000.00 523
Single Family Housing 495.00 Dwelling Unit 95.50 891,000.00 1322
Regional Shopping Center 108.90 1000sqft 6.40 108,900.00 0
1.2 Other Project Characteristics
Urbanization
Urban
Wind Speed (m/s)
3.5
Precipitation Freq (Days)
58
Climate Zone
6
Operational Year
2020
B - 72

Barrett Ranch East Air Quality Technical Report Appendix A - 41 ESA / 140728
Utility Company
Sacramento Municipal Utility District
CO2 Intensity
(lb/MWhr)
590.31
CH4 Intensity
(lb/MWhr)
0.029
N2O Intensity
(lb/MWhr)
0.006
1.3 User Entered Comments & Non-Default Data
Project Characteristics -
Land Use - Land use, unit amount and ot acreage infomation was provided by the Applicant.
Construction Phase - Assumed construction schedule
On-road Fugitive Dust - Percent paved road are based on the assumption that 100% of travel will be on paved road
Grading - Assumed all material will be balanced on site, so no net import or export.
Vehicle Trips - Used daily trip rates provided by the Applicant with a 18% trip reduction.
Energy Use - Change default Ttle 24 Energy to incoprate 2013 Title 24 energy construction standards.
Construction Off-road Equipment Mitigation - Construction Off-road Equipment Mitigation - 75% reduction represents Enhanced Construction Emission Control to control fugitive dust.
Energy Mitigation -
Table Name Column Name Default Value New Value
tblConstDustMitigation WaterExposedAreaPM10PercentReduction 55 75
tblConstDustMitigation WaterExposedAreaPM25PercentReduction 55 75
B - 73

Barrett Ranch East Air Quality Technical Report Appendix A - 42 ESA / 140728
tblConstructionPhase NumDays 220.00 59.00
tblConstructionPhase NumDays 3,100.00 815.00
tblConstructionPhase NumDays 310.00 83.00
tblConstructionPhase NumDays 220.00 58.00
tblConstructionPhase NumDays 120.00 31.00
tblEnergyUse T24E 348.18 261.14
tblEnergyUse T24E 3.98 2.99
tblEnergyUse T24E 729.62 547.22
tblEnergyUse T24NG 11,068.06 8,301.05
tblEnergyUse T24NG 4.72 3.54
tblEnergyUse T24NG 26,218.01 19,663.51
tblGrading AcresOfGrading 207.50 128.00
tblGrading AcresOfGrading 0.00 128.00
tblLandUse LotAcreage 12.25 10.50
tblLandUse LotAcreage 160.71 95.50
tblLandUse LotAcreage 2.50 6.40
tblProjectCharacteristics OperationalYear 2014 2020
tblVehicleTrips CC_TL 5.00 2.33
B - 74

Barrett Ranch East Air Quality Technical Report Appendix A - 43 ESA / 140728
tblVehicleTrips CNW_TL 6.50 3.02
tblVehicleTrips CW_TL 10.00 4.65
tblVehicleTrips HO_TL 6.50 3.02
tblVehicleTrips HO_TL 6.50 3.02
tblVehicleTrips HS_TL 5.00 2.33
tblVehicleTrips HS_TL 5.00 2.33
tblVehicleTrips HW_TL 10.00 4.65
tblVehicleTrips HW_TL 10.00 4.65
tblVehicleTrips ST_TR 7.16 5.49
tblVehicleTrips ST_TR 1.59 0.00
tblVehicleTrips ST_TR 49.97 27.03
tblVehicleTrips ST_TR 10.08 7.50
tblVehicleTrips SU_TR 6.07 5.49
tblVehicleTrips SU_TR 1.59 0.00
tblVehicleTrips SU_TR 25.24 27.03
tblVehicleTrips SU_TR 8.77 7.50
tblVehicleTrips WD_TR 6.59 5.49
tblVehicleTrips WD_TR 1.59 0.00
B - 75

Barrett Ranch East Air Quality Technical Report Appendix A - 44 ESA / 140728
tblVehicleTrips WD_TR 42.94 54.06
tblVehicleTrips WD_TR 9.57 7.50
2.0 Emissions Summary
2.1 Overall Construction (Maximum Daily Emission)
Unmitigated Construction
ROG NOx CO SO2 Fugitive PM10
Exhaust PM10
PM10 Total
Fugitive PM2.5
Exhaust PM2.5
PM2.5 Total
Bio- CO2
NBio- CO2
Total CO2
CH4 N2O CO2e
Year
lb/day lb/day
2016
7.2786
74.8858
64.4410
0.1080
22.5820
3.5854
25.5217
10.4398
3.2985
13.1443
2017
6.5012
38.8547
59.2565
0.1079
4.7574
1.9773
6.7347
1.2793
1.8532
3.1325
2018
5.6133
34.4817
54.0656
0.1078
4.7572
1.6761
6.4334
1.2793
1.5721
2.8514
2019
337.0643
31.1878
51.0012
0.1075
4.7575
1.4550
6.2124
1.2793
1.3647
2.6441
2020
337.0203
1.9350
5.2539
0.0128
0.7759
0.1163
0.8922
0.2058
0.1159
0.3217
Total 693.4777
181.3450
234.0183
0.4441
37.6300
8.8101
45.7944
14.4836
8.2044
22.0939
B - 76

Barrett Ranch East Air Quality Technical Report Appendix A - 45 ESA / 140728
Mitigated Construction
ROG NOx CO SO2 Fugitive PM10
Exhaust PM10
PM10 Total
Fugitive PM2.5
Exhaust PM2.5
PM2.5 Total
Bio- CO2
NBio- CO2
Total CO2
CH4 N2O CO2e
Year
lb/day lb/day
2016
7.2786
74.8858
64.4410
0.1080
5.7482
3.5854
8.6879
2.6372
3.2985
5.3417
2017
6.5012
38.8547
59.2565
0.1079
4.7574
1.9773
6.7347
1.2793
1.8532
3.1325
2018
5.6133
34.4817
54.0656
0.1078
4.7572
1.6761
6.4334
1.2793
1.5721
2.8514
2019
337.0643
31.1878
51.0012
0.1075
4.7575
1.4550
6.2124
1.2793
1.3647
2.6441
2020
337.0203
1.9350
5.2539
0.0128
0.7759
0.1163
0.8922
0.2058
0.1159
0.3217
Total 693.4777
181.3450
234.0183
0.4441
20.7962
8.8101
28.9606
6.6809
8.2044
14.2913
B - 77

Barrett Ranch East Air Quality Technical Report Appendix A - 46 ESA / 140728
ROG
NOx
CO
SO2
Fugitive
PM10
Exhaust
PM10
PM10
Total
Fugitive
PM2.5
Exhaust
PM2.5
PM2.5
Total
Bio-
CO2
NBio-
CO2
Total
CO2
CH4
N20
CO2e
Percent
Reduction
0.00
0.00
0.00
0.00
44.74
0.00
36.76
53.87
0.00
35.32
0.00
0.00
0.00
0.00
0.00
0.00
2.2 Overall Operational
Unmitigated Operational
ROG NOx CO SO2 Fugitive PM10
Exhaust PM10
PM10 Total
Fugitive PM2.5
Exhaust PM2.5
PM2.5 Total
Bio- CO2
NBio- CO2
Total CO2
CH4 N2O CO2e
Category
lb/day lb/day
Area
40.6278
0.6617
57.2127
3.0100e-003
0.3146
0.3146
0.3146
0.3146
Energy
0.4513
3.8643
1.6986
0.0246
0.3118
0.3118
0.3118
0.3118
Mobile
27.0562
27.8336
157.1488
0.3202
20.2396
0.3866
20.6262
5.4069
0.3568
5.7637
Total 68.1353
32.3596
216.0601
0.3479
20.2396
1.0130
21.2526
5.4069
0.9832
6.3901
B - 78

Barrett Ranch East Air Quality Technical Report Appendix A - 47 ESA / 140728
Mitigated Operational
ROG NOx CO SO2 Fugitive PM10
Exhaust PM10
PM10 Total
Fugitive PM2.5
Exhaust PM2.5
PM2.5 Total
Bio- CO2
NBio- CO2
Total CO2
CH4 N2O CO2e
Category
lb/day lb/day
Area
40.6278
0.6617
57.2127
3.0100e-003
0.3146
0.3146
0.3146
0.3146
Energy
0.3819
3.2699
1.4371
0.0208
0.2638
0.2638
0.2638
0.2638
Mobile
27.0562
27.8336
157.1488
0.3202
20.2396
0.3866
20.6262
5.4069
0.3568
5.7637
Total 68.0659
31.7652
215.7986
0.3441
20.2396
0.9650
21.2046
5.4069
0.9352
6.3421
B - 79
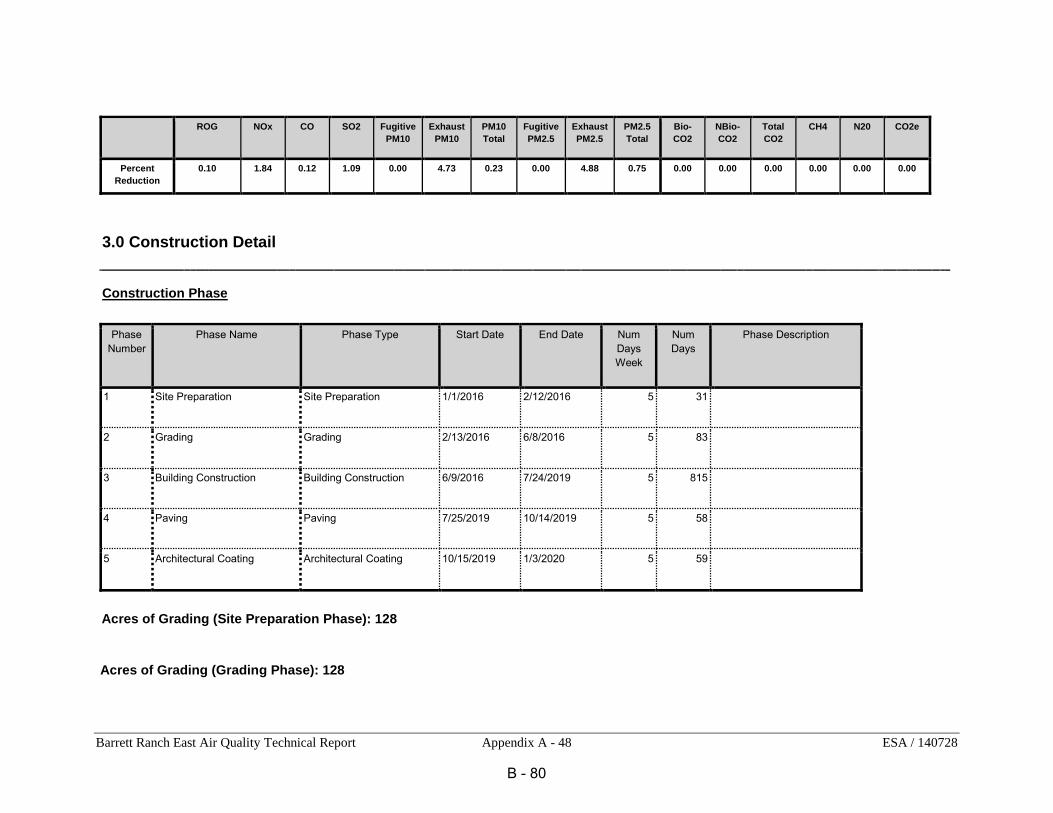
Barrett Ranch East Air Quality Technical Report Appendix A - 48 ESA / 140728
ROG
NOx
CO
SO2
Fugitive
PM10
Exhaust
PM10
PM10
Total
Fugitive
PM2.5
Exhaust
PM2.5
PM2.5
Total
Bio-
CO2
NBio-
CO2
Total
CO2
CH4
N20
CO2e
Percent
Reduction
0.10
1.84
0.12
1.09
0.00
4.73
0.23
0.00
4.88
0.75
0.00
0.00
0.00
0.00
0.00
0.00
3.0 Construction Detail
Construction Phase
Phase Number
Phase Name Phase Type Start Date End Date Num Days Week
Num Days
Phase Description
1 Site Preparation Site Preparation 1/1/2016 2/12/2016 5 31
2 Grading Grading 2/13/2016 6/8/2016 5 83
3 Building Construction Building Construction 6/9/2016 7/24/2019 5 815
4 Paving Paving 7/25/2019 10/14/2019 5 58
5 Architectural Coating Architectural Coating 10/15/2019 1/3/2020 5 59
Acres of Grading (Site Preparation Phase): 128
Acres of Grading (Grading Phase): 128
B - 80
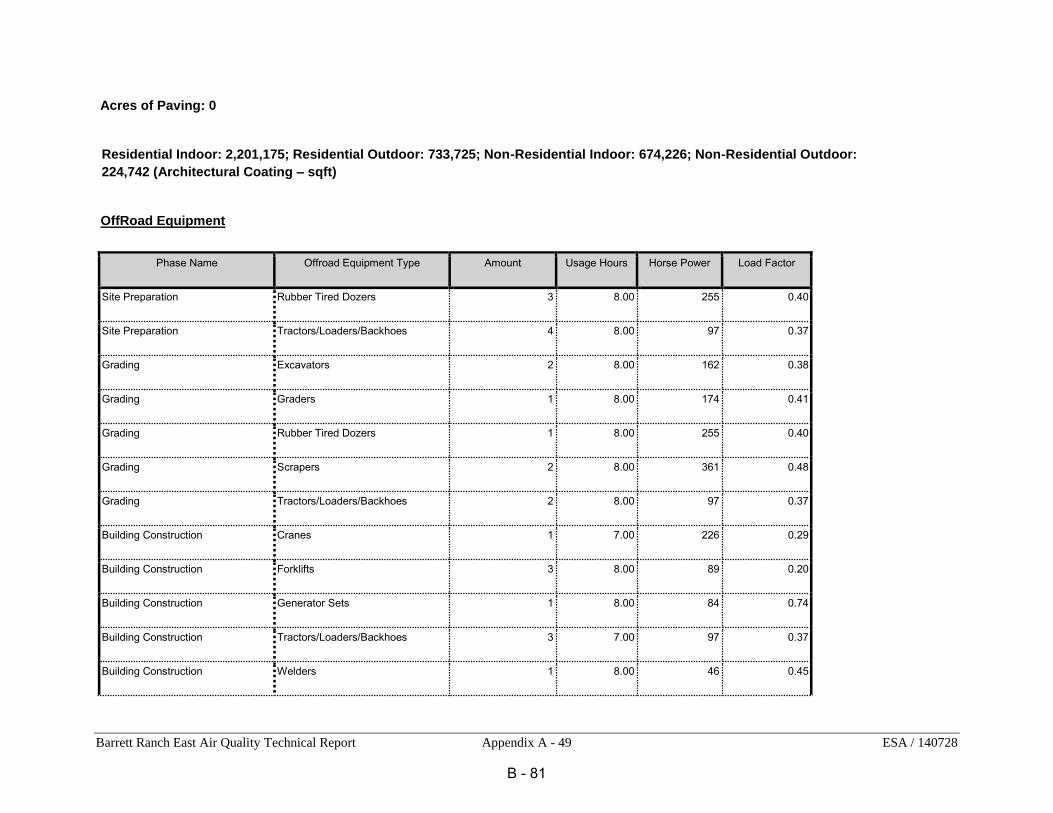
Barrett Ranch East Air Quality Technical Report Appendix A - 49 ESA / 140728
Acres of Paving: 0
Residential Indoor: 2,201,175; Residential Outdoor: 733,725; Non-Residential Indoor: 674,226; Non-Residential Outdoor:
224,742 (Architectural Coating – sqft)
OffRoad Equipment
Phase Name Offroad Equipment Type Amount Usage Hours Horse Power Load Factor
Site Preparation Rubber Tired Dozers 3 8.00 255 0.40
Site Preparation Tractors/Loaders/Backhoes 4 8.00 97 0.37
Grading Excavators 2 8.00 162 0.38
Grading Graders 1 8.00 174 0.41
Grading Rubber Tired Dozers 1 8.00 255 0.40
Grading Scrapers 2 8.00 361 0.48
Grading Tractors/Loaders/Backhoes 2 8.00 97 0.37
Building Construction Cranes 1 7.00 226 0.29
Building Construction Forklifts 3 8.00 89 0.20
Building Construction Generator Sets 1 8.00 84 0.74
Building Construction Tractors/Loaders/Backhoes 3 7.00 97 0.37
Building Construction Welders 1 8.00 46 0.45
B - 81
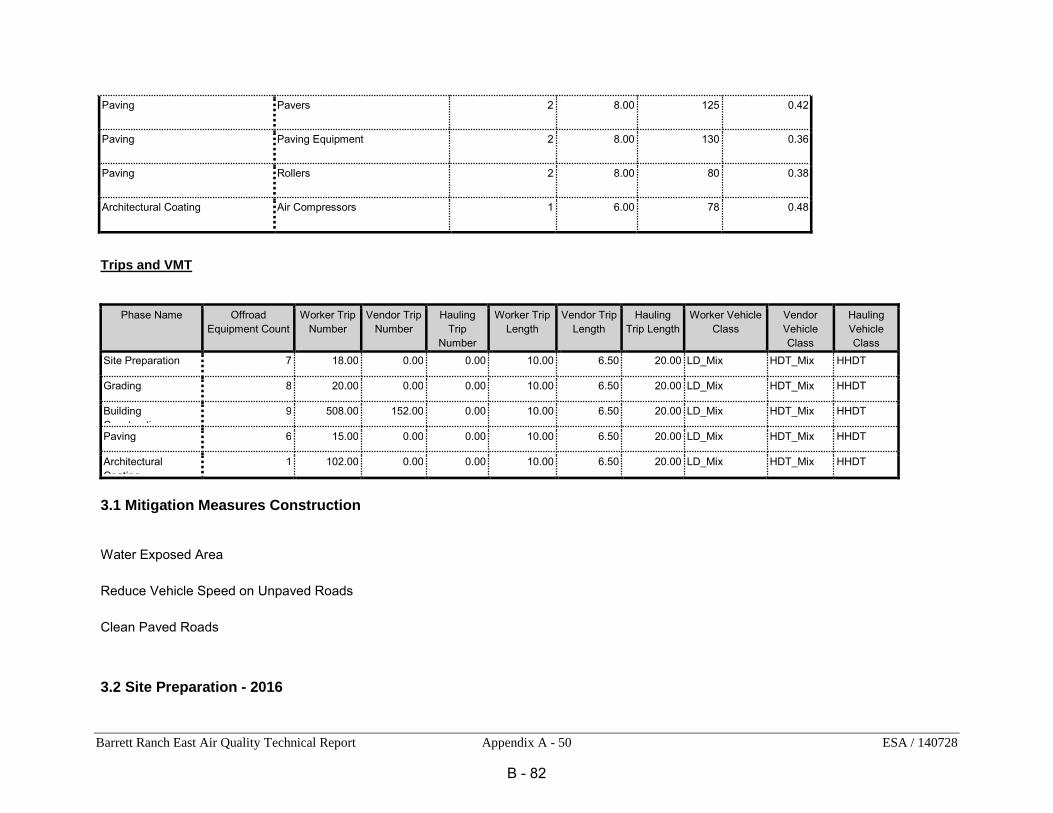
Barrett Ranch East Air Quality Technical Report Appendix A - 50 ESA / 140728
Paving Pavers 2 8.00 125 0.42
Paving Paving Equipment 2 8.00 130 0.36
Paving Rollers 2 8.00 80 0.38
Architectural Coating Air Compressors 1 6.00 78 0.48
Trips and VMT
Phase Name
Offroad Equipment Count
Worker Trip Number
Vendor Trip Number
Hauling Trip
Number
Worker Trip Length
Vendor Trip Length
Hauling Trip Length
Worker Vehicle Class
Vendor Vehicle Class
Hauling Vehicle Class
Site Preparation
7
18.00
0.00
0.00
10.00
6.50
20.00
LD_Mix
HDT_Mix
HHDT
Grading
8
20.00
0.00
0.00
10.00
6.50
20.00
LD_Mix
HDT_Mix
HHDT
Building Construction
9
508.00
152.00
0.00
10.00
6.50
20.00
LD_Mix
HDT_Mix
HHDT
Paving
6
15.00
0.00
0.00
10.00
6.50
20.00
LD_Mix
HDT_Mix
HHDT
Architectural Coating
1
102.00
0.00
0.00
10.00
6.50
20.00
LD_Mix
HDT_Mix
HHDT
3.1 Mitigation Measures Construction
Water Exposed Area
Reduce Vehicle Speed on Unpaved Roads
Clean Paved Roads
3.2 Site Preparation - 2016
B - 82

Barrett Ranch East Air Quality Technical Report Appendix A - 51 ESA / 140728
Unmitigated Construction On-Site
ROG NOx CO SO2 Fugitive PM10
Exhaust PM10
PM10 Total
Fugitive PM2.5
Exhaust PM2.5
PM2.5 Total
Bio- CO2
NBio- CO2
Total CO2
CH4 N2O CO2e
Category
lb/day lb/day
Fugitive Dust
22.4451
0.0000
22.4451
10.4035
0.0000
10.4035
Off-Road
5.0771
54.6323
41.1053
0.0391
2.9387
2.9387
2.7036
2.7036
Total 5.0771
54.6323
41.1053
0.0391
22.4451
2.9387
25.3838
10.4035
2.7036
13.1071
Unmitigated Construction Off-Site
ROG NOx CO SO2 Fugitive PM10
Exhaust PM10
PM10 Total
Fugitive PM2.5
Exhaust PM2.5
PM2.5 Total
Bio- CO2
NBio- CO2
Total CO2
CH4 N2O CO2e
Category
lb/day lb/day
Hauling
0.0000
0.0000
0.0000
0.0000
0.0000
0.0000
0.0000
0.0000
0.0000
0.0000
Vendor
0.0000
0.0000
0.0000
0.0000
0.0000
0.0000
0.0000
0.0000
0.0000
0.0000
B - 83

Barrett Ranch East Air Quality Technical Report Appendix A - 52 ESA / 140728
Worker
0.0721
0.0649
0.8686
1.7500e-003
0.1369
1.0100e-003
0.1379
0.0363
9.2000e-004
0.0373
Total 0.0721
0.0649
0.8686
1.7500e-
003
0.1369
1.0100e-
003
0.1379
0.0363
9.2000e-
004
0.0373
Mitigated Construction On-Site
ROG NOx CO SO2 Fugitive PM10
Exhaust PM10
PM10 Total
Fugitive PM2.5
Exhaust PM2.5
PM2.5 Total
Bio- CO2 NBio- CO2
Total CO2
CH4 N2O CO2e
Category
lb/day lb/day
Fugitive Dust
5.6113
0.0000
5.6113
2.6009
0.0000
2.6009
Off-Road
5.0771
54.6323
41.1053
0.0391
2.9387
2.9387
2.7036
2.7036
B - 84

Barrett Ranch East Air Quality Technical Report Appendix A - 53 ESA / 140728
Total 5.0771
54.6323
41.1053
0.0391
5.6113
2.9387
8.5500
2.6009
2.7036
5.3045
Mitigated Construction Off-Site
ROG NOx CO SO2 Fugitive PM10
Exhaust PM10
PM10 Total
Fugitive PM2.5
Exhaust PM2.5
PM2.5 Total
Bio- CO2
NBio- CO2
Total CO2
CH4 N2O CO2e
Category
lb/day lb/day
Hauling
0.0000
0.0000
0.0000
0.0000
0.0000
0.0000
0.0000
0.0000
0.0000
0.0000
Vendor
0.0000
0.0000
0.0000
0.0000
0.0000
0.0000
0.0000
0.0000
0.0000
0.0000
B - 85

Barrett Ranch East Air Quality Technical Report Appendix A - 54 ESA / 140728
Worker
0.0721
0.0649
0.8686
1.7500e-003
0.1369
1.0100e-003
0.1379
0.0363
9.2000e-004
0.0373
Total 0.0721
0.0649
0.8686
1.7500e-
003
0.1369
1.0100e-
003
0.1379
0.0363
9.2000e-
004
0.0373
3.3 Grading - 2016
Unmitigated Construction On-Site
ROG NOx CO SO2 Fugitive PM10
Exhaust PM10
PM10 Total
Fugitive PM2.5
Exhaust PM2.5
PM2.5 Total
Bio- CO2
NBio- CO2
Total CO2
CH4 N2O CO2e
Category
lb/day lb/day
Fugitive Dust
7.6576
0.0000
7.6576
3.4868
0.0000
3.4868
Off-Road
6.4795
74.8137
49.1374
0.0617
3.5842
3.5842
3.2975
3.2975
B - 86

Barrett Ranch East Air Quality Technical Report Appendix A - 55 ESA / 140728
Total 6.4795
74.8137
49.1374
0.0617
7.6576
3.5842
11.2418
3.4868
3.2975
6.7843
Unmitigated Construction Off-Site
ROG NOx CO SO2 Fugitive PM10
Exhaust PM10
PM10 Total
Fugitive PM2.5
Exhaust PM2.5
PM2.5 Total
Bio- CO2
NBio- CO2
Total CO2
CH4 N2O CO2e
Category
lb/day lb/day
Hauling
0.0000
0.0000
0.0000
0.0000
0.0000
0.0000
0.0000
0.0000
0.0000
0.0000
Vendor
0.0000
0.0000
0.0000
0.0000
0.0000
0.0000
0.0000
0.0000
0.0000
0.0000
B - 87

Barrett Ranch East Air Quality Technical Report Appendix A - 56 ESA / 140728
Worker
0.0802
0.0721
0.9651
1.9500e-003
0.1521
1.1200e-003
0.1533
0.0404
1.0300e-003
0.0414
Total 0.0802
0.0721
0.9651
1.9500e-
003
0.1521
1.1200e-
003
0.1533
0.0404
1.0300e-
003
0.0414
Mitigated Construction On-Site
ROG NOx CO SO2 Fugitive PM10
Exhaust PM10
PM10 Total
Fugitive PM2.5
Exhaust PM2.5
PM2.5 Total
Bio- CO2 NBio- CO2
Total CO2
CH4 N2O CO2e
Category
lb/day lb/day
Fugitive Dust
1.9144
0.0000
1.9144
0.8717
0.0000
0.8717
Off-Road
6.4795
74.8137
49.1374
0.0617
3.5842
3.5842
3.2975
3.2975
B - 88
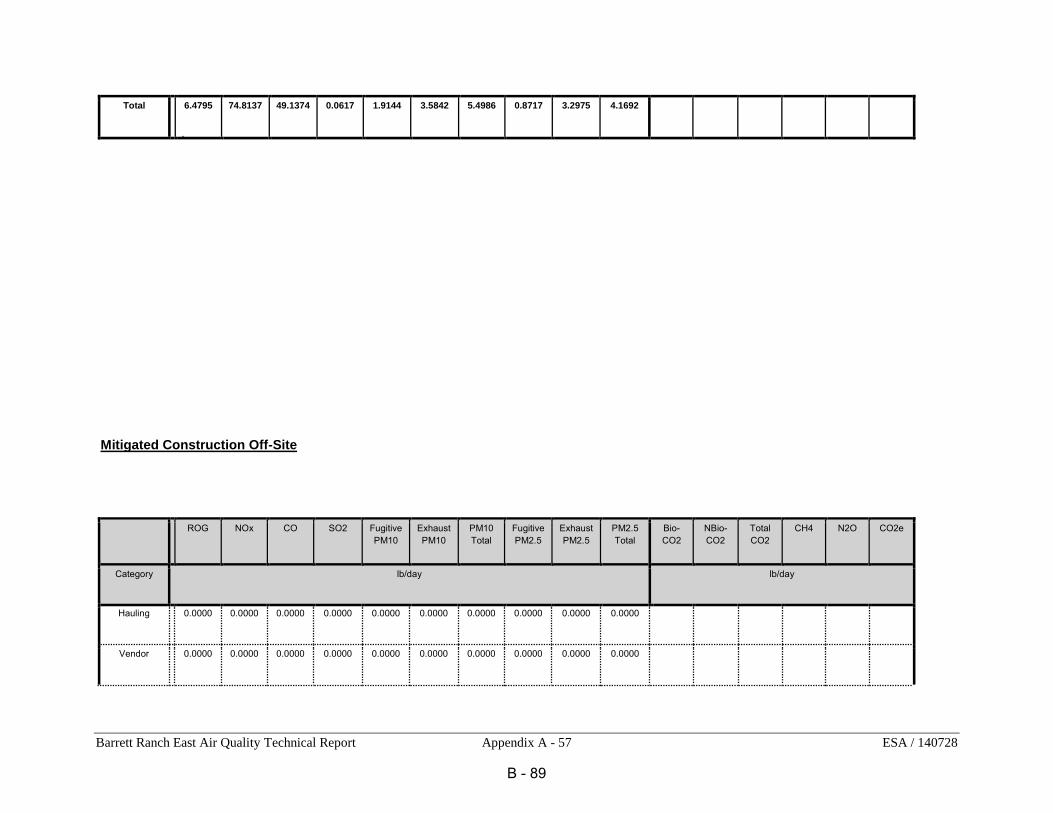
Barrett Ranch East Air Quality Technical Report Appendix A - 57 ESA / 140728
Total 6.4795
74.8137
49.1374
0.0617
1.9144
3.5842
5.4986
0.8717
3.2975
4.1692
Mitigated Construction Off-Site
ROG NOx CO SO2 Fugitive PM10
Exhaust PM10
PM10 Total
Fugitive PM2.5
Exhaust PM2.5
PM2.5 Total
Bio- CO2
NBio- CO2
Total CO2
CH4 N2O CO2e
Category
lb/day lb/day
Hauling
0.0000
0.0000
0.0000
0.0000
0.0000
0.0000
0.0000
0.0000
0.0000
0.0000
Vendor
0.0000
0.0000
0.0000
0.0000
0.0000
0.0000
0.0000
0.0000
0.0000
0.0000
B - 89

Barrett Ranch East Air Quality Technical Report Appendix A - 58 ESA / 140728
Worker
0.0802
0.0721
0.9651
1.9500e-003
0.1521
1.1200e-003
0.1533
0.0404
1.0300e-003
0.0414
Total 0.0802
0.0721
0.9651
1.9500e-
003
0.1521
1.1200e-
003
0.1533
0.0404
1.0300e-
003
0.0414
3.4 Building Construction - 2016
Unmitigated Construction On-Site
ROG NOx CO SO2 Fugitive PM10
Exhaust PM10
PM10 Total
Fugitive PM2.5
Exhaust PM2.5
PM2.5 Total
Bio- CO2 NBio- CO2
Total CO2
CH4 N2O CO2e
Category
lb/day lb/day
Off-Road
3.4062
28.5063
18.5066
0.0268
1.9674
1.9674
1.8485
1.8485
Total 3.4062
28.5063
18.5066
0.0268
1.9674
1.9674
1.8485
1.8485
B - 90

Barrett Ranch East Air Quality Technical Report Appendix A - 59 ESA / 140728
Unmitigated Construction Off-Site
ROG NOx CO SO2 Fugitive PM10
Exhaust PM10
PM10 Total
Fugitive PM2.5
Exhaust PM2.5
PM2.5 Total
Bio- CO2 NBio- CO2
Total CO2
CH4 N2O CO2e
Category
lb/day lb/day
Hauling
0.0000
0.0000
0.0000
0.0000
0.0000
0.0000
0.0000
0.0000
0.0000
0.0000
Vendor
1.8365
12.2081
21.4198
0.0318
0.8928
0.2001
1.0929
0.2542
0.1838
0.4379
B - 91

Barrett Ranch East Air Quality Technical Report Appendix A - 60 ESA / 140728
Worker
2.0359
1.8313
24.5146
0.0494
3.8644
0.0284
3.8928
1.0251
0.0261
1.0511
Total 3.8724
14.0394
45.9344
0.0812
4.7572
0.2285
4.9857
1.2793
0.2098
1.4891
Mitigated Construction On-Site
ROG NOx CO SO2 Fugitive PM10
Exhaust PM10
PM10 Total
Fugitive PM2.5
Exhaust PM2.5
PM2.5 Total
Bio- CO2 NBio- CO2
Total CO2
CH4 N2O CO2e
Category
lb/day lb/day
Off-Road
3.4062
28.5063
18.5066
0.0268
1.9674
1.9674
1.8485
1.8485
Total 3.4062
28.5063
18.5066
0.0268
1.9674
1.9674
1.8485
1.8485
B - 92

Barrett Ranch East Air Quality Technical Report Appendix A - 61 ESA / 140728
Mitigated Construction Off-Site
ROG NOx CO SO2 Fugitive PM10
Exhaust PM10
PM10 Total
Fugitive PM2.5
Exhaust PM2.5
PM2.5 Total
Bio- CO2 NBio- CO2
Total CO2
CH4 N2O CO2e
Category
lb/day lb/day
Hauling
0.0000
0.0000
0.0000
0.0000
0.0000
0.0000
0.0000
0.0000
0.0000
0.0000
Vendor
1.8365
12.2081
21.4198
0.0318
0.8928
0.2001
1.0929
0.2542
0.1838
0.4379
B - 93

Barrett Ranch East Air Quality Technical Report Appendix A - 62 ESA / 140728
Worker
2.0359
1.8313
24.5146
0.0494
3.8644
0.0284
3.8928
1.0251
0.0261
1.0511
Total 3.8724
14.0394
45.9344
0.0812
4.7572
0.2285
4.9857
1.2793
0.2098
1.4891
3.4 Building Construction - 2017
Unmitigated Construction On-Site
ROG NOx CO SO2 Fugitive PM10
Exhaust PM10
PM10 Total
Fugitive PM2.5
Exhaust PM2.5
PM2.5 Total
Bio- CO2 NBio- CO2
Total CO2
CH4 N2O CO2e
Category
lb/day lb/day
Off-Road
3.1024
26.4057
18.1291
0.0268
1.7812
1.7812
1.6730
1.6730
Total 3.1024
26.4057
18.1291
0.0268
1.7812
1.7812
1.6730
1.6730
B - 94

Barrett Ranch East Air Quality Technical Report Appendix A - 63 ESA / 140728
Unmitigated Construction Off-Site
ROG NOx CO SO2 Fugitive PM10
Exhaust PM10
PM10 Total
Fugitive PM2.5
Exhaust PM2.5
PM2.5 Total
Bio- CO2 NBio- CO2
Total CO2
CH4 N2O CO2e
Category
lb/day lb/day
Hauling
0.0000
0.0000
0.0000
0.0000
0.0000
0.0000
0.0000
0.0000
0.0000
0.0000
Vendor
1.5836
10.8120
19.1813
0.0317
0.8931
0.1687
1.0617
0.2543
0.1549
0.4092
B - 95

Barrett Ranch East Air Quality Technical Report Appendix A - 64 ESA / 140728
Worker
1.8152
1.6371
21.9461
0.0494
3.8644
0.0274
3.8918
1.0251
0.0253
1.0504
Total 3.3988
12.4490
41.1274
0.0811
4.7574
0.1961
4.9535
1.2793
0.1802
1.4595
Mitigated Construction On-Site
ROG NOx CO SO2 Fugitive PM10
Exhaust PM10
PM10 Total
Fugitive PM2.5
Exhaust PM2.5
PM2.5 Total
Bio- CO2 NBio- CO2
Total CO2
CH4 N2O CO2e
Category
lb/day lb/day
Off-Road
3.1024
26.4057
18.1291
0.0268
1.7812
1.7812
1.6730
1.6730
Total 3.1024
26.4057
18.1291
0.0268
1.7812
1.7812
1.6730
1.6730
B - 96
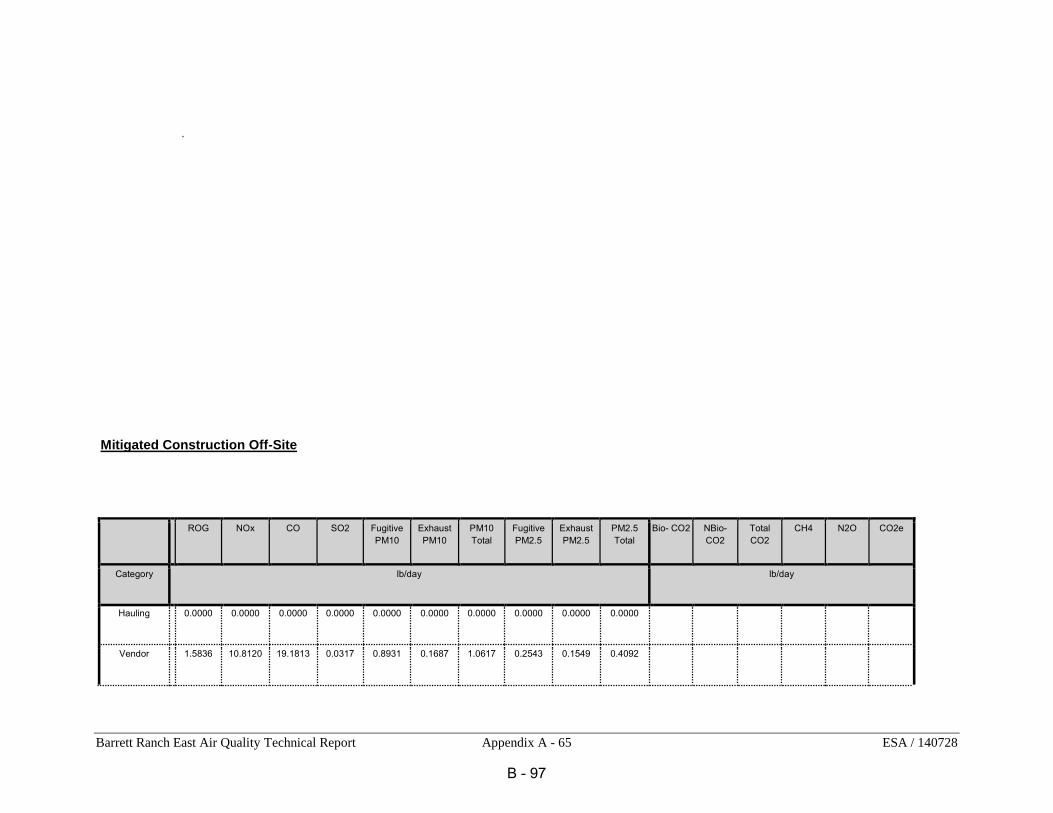
Barrett Ranch East Air Quality Technical Report Appendix A - 65 ESA / 140728
Mitigated Construction Off-Site
ROG NOx CO SO2 Fugitive PM10
Exhaust PM10
PM10 Total
Fugitive PM2.5
Exhaust PM2.5
PM2.5 Total
Bio- CO2 NBio- CO2
Total CO2
CH4 N2O CO2e
Category
lb/day lb/day
Hauling
0.0000
0.0000
0.0000
0.0000
0.0000
0.0000
0.0000
0.0000
0.0000
0.0000
Vendor
1.5836
10.8120
19.1813
0.0317
0.8931
0.1687
1.0617
0.2543
0.1549
0.4092
B - 97

Barrett Ranch East Air Quality Technical Report Appendix A - 66 ESA / 140728
Worker
1.8152
1.6371
21.9461
0.0494
3.8644
0.0274
3.8918
1.0251
0.0253
1.0504
Total 3.3988
12.4490
41.1274
0.0811
4.7574
0.1961
4.9535
1.2793
0.1802
1.4595
3.4 Building Construction - 2018
Unmitigated Construction On-Site
ROG NOx CO SO2 Fugitive PM10
Exhaust PM10
PM10 Total
Fugitive PM2.5
Exhaust PM2.5
PM2.5 Total
Bio- CO2 NBio- CO2
Total CO2
CH4 N2O CO2e
Category
lb/day lb/day
Off-Road
2.6687
23.2608
17.5327
0.0268
1.4943
1.4943
1.4048
1.4048
Total 2.6687
23.2608
17.5327
0.0268
1.4943
1.4943
1.4048
1.4048
B - 98

Barrett Ranch East Air Quality Technical Report Appendix A - 67 ESA / 140728
Unmitigated Construction Off-Site
ROG NOx CO SO2 Fugitive PM10
Exhaust PM10
PM10 Total
Fugitive PM2.5
Exhaust PM2.5
PM2.5 Total
Bio- CO2 NBio- CO2
Total CO2
CH4 N2O CO2e
Category
lb/day lb/day
Hauling
0.0000
0.0000
0.0000
0.0000
0.0000
0.0000
0.0000
0.0000
0.0000
0.0000
Vendor
1.3162
9.7459
16.7382
0.0316
0.8929
0.1550
1.0478
0.2542
0.1424
0.3966
B - 99

Barrett Ranch East Air Quality Technical Report Appendix A - 68 ESA / 140728
Worker
1.6284
1.4749
19.7947
0.0494
3.8644
0.0269
3.8912
1.0251
0.0249
1.0499
Total 2.9446
11.2208
36.5329
0.0810
4.7572
0.1819
4.9391
1.2793
0.1673
1.4466
Mitigated Construction On-Site
ROG NOx CO SO2 Fugitive PM10
Exhaust PM10
PM10 Total
Fugitive PM2.5
Exhaust PM2.5
PM2.5 Total
Bio- CO2 NBio- CO2
Total CO2
CH4 N2O CO2e
Category
lb/day lb/day
Off-Road
2.6687
23.2608
17.5327
0.0268
1.4943
1.4943
1.4048
1.4048
Total 2.6687
23.2608
17.5327
0.0268
1.4943
1.4943
1.4048
1.4048
B - 100

Barrett Ranch East Air Quality Technical Report Appendix A - 69 ESA / 140728
Mitigated Construction Off-Site
ROG NOx CO SO2 Fugitive PM10
Exhaust PM10
PM10 Total
Fugitive PM2.5
Exhaust PM2.5
PM2.5 Total
Bio- CO2 NBio- CO2
Total CO2
CH4 N2O CO2e
Category
lb/day lb/day
Hauling
0.0000
0.0000
0.0000
0.0000
0.0000
0.0000
0.0000
0.0000
0.0000
0.0000
Vendor
1.3162
9.7459
16.7382
0.0316
0.8929
0.1550
1.0478
0.2542
0.1424
0.3966
B - 101

Barrett Ranch East Air Quality Technical Report Appendix A - 70 ESA / 140728
Worker
1.6284
1.4749
19.7947
0.0494
3.8644
0.0269
3.8912
1.0251
0.0249
1.0499
Total 2.9446
11.2208
36.5329
0.0810
4.7572
0.1819
4.9391
1.2793
0.1673
1.4466
3.4 Building Construction - 2019
Unmitigated Construction On-Site
ROG NOx CO SO2 Fugitive PM10
Exhaust PM10
PM10 Total
Fugitive PM2.5
Exhaust PM2.5
PM2.5 Total
Bio- CO2 NBio- CO2
Total CO2
CH4 N2O CO2e
Category
lb/day lb/day
Off-Road
2.3516
20.9650
17.1204
0.0268
1.2850
1.2850
1.2083
1.2083
Total 2.3516
20.9650
17.1204
0.0268
1.2850
1.2850
1.2083
1.2083
B - 102

Barrett Ranch East Air Quality Technical Report Appendix A - 71 ESA / 140728
Unmitigated Construction Off-Site
ROG NOx CO SO2 Fugitive PM10
Exhaust PM10
PM10 Total
Fugitive PM2.5
Exhaust PM2.5
PM2.5 Total
Bio- CO2 NBio- CO2
Total CO2
CH4 N2O CO2e
Category
lb/day lb/day
Hauling
0.0000
0.0000
0.0000
0.0000
0.0000
0.0000
0.0000
0.0000
0.0000
0.0000
Vendor
1.1949
8.8732
15.5901
0.0316
0.8931
0.1434
1.0365
0.2543
0.1318
0.3861
B - 103
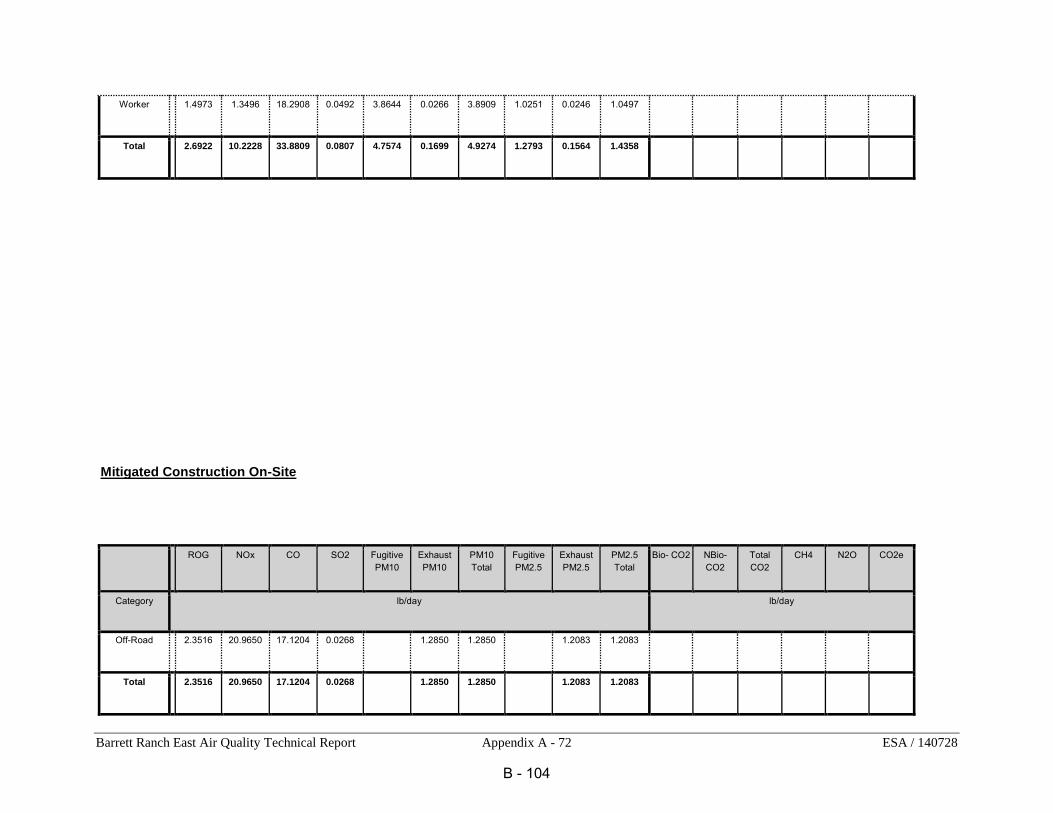
Barrett Ranch East Air Quality Technical Report Appendix A - 72 ESA / 140728
Worker
1.4973
1.3496
18.2908
0.0492
3.8644
0.0266
3.8909
1.0251
0.0246
1.0497
Total 2.6922
10.2228
33.8809
0.0807
4.7574
0.1699
4.9274
1.2793
0.1564
1.4358
Mitigated Construction On-Site
ROG NOx CO SO2 Fugitive PM10
Exhaust PM10
PM10 Total
Fugitive PM2.5
Exhaust PM2.5
PM2.5 Total
Bio- CO2 NBio- CO2
Total CO2
CH4 N2O CO2e
Category
lb/day lb/day
Off-Road
2.3516
20.9650
17.1204
0.0268
1.2850
1.2850
1.2083
1.2083
Total 2.3516
20.9650
17.1204
0.0268
1.2850
1.2850
1.2083
1.2083
B - 104

Barrett Ranch East Air Quality Technical Report Appendix A - 73 ESA / 140728
Mitigated Construction Off-Site
ROG NOx CO SO2 Fugitive PM10
Exhaust PM10
PM10 Total
Fugitive PM2.5
Exhaust PM2.5
PM2.5 Total
Bio- CO2 NBio- CO2
Total CO2
CH4 N2O CO2e
Category
lb/day lb/day
Hauling
0.0000
0.0000
0.0000
0.0000
0.0000
0.0000
0.0000
0.0000
0.0000
0.0000
Vendor
1.1949
8.8732
15.5901
0.0316
0.8931
0.1434
1.0365
0.2543
0.1318
0.3861
B - 105
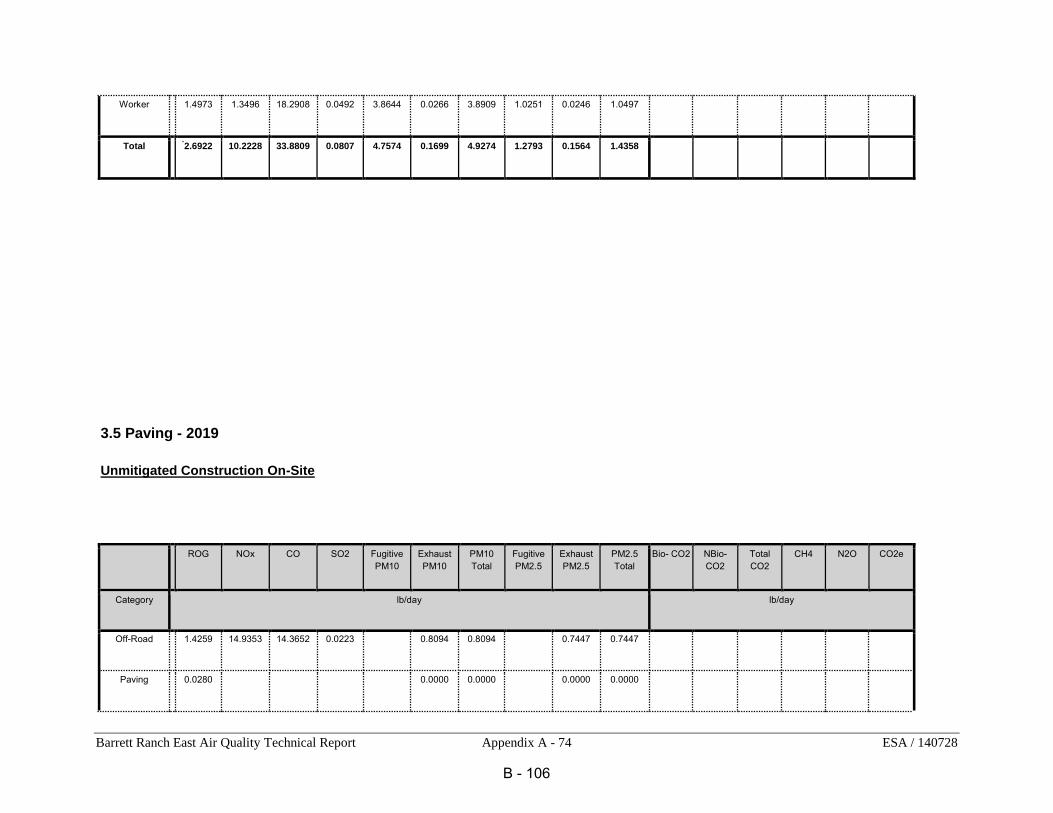
Barrett Ranch East Air Quality Technical Report Appendix A - 74 ESA / 140728
Worker
1.4973
1.3496
18.2908
0.0492
3.8644
0.0266
3.8909
1.0251
0.0246
1.0497
Total 2.6922
10.2228
33.8809
0.0807
4.7574
0.1699
4.9274
1.2793
0.1564
1.4358
3.5 Paving - 2019
Unmitigated Construction On-Site
ROG NOx CO SO2 Fugitive PM10
Exhaust PM10
PM10 Total
Fugitive PM2.5
Exhaust PM2.5
PM2.5 Total
Bio- CO2 NBio- CO2
Total CO2
CH4 N2O CO2e
Category
lb/day lb/day
Off-Road
1.4259
14.9353
14.3652
0.0223
0.8094
0.8094
0.7447
0.7447
Paving
0.0280
0.0000
0.0000
0.0000
0.0000
B - 106

Barrett Ranch East Air Quality Technical Report Appendix A - 75 ESA / 140728
Total 1.4539
14.9353
14.3652
0.0223
0.8094
0.8094
0.7447
0.7447
Unmitigated Construction Off-Site
ROG NOx CO SO2 Fugitive PM10
Exhaust PM10
PM10 Total
Fugitive PM2.5
Exhaust PM2.5
PM2.5 Total
Bio- CO2
NBio- CO2
Total CO2
CH4 N2O CO2e
Category
lb/day lb/day
Hauling
0.0000
0.0000
0.0000
0.0000
0.0000
0.0000
0.0000
0.0000
0.0000
0.0000
Vendor
0.0000
0.0000
0.0000
0.0000
0.0000
0.0000
0.0000
0.0000
0.0000
0.0000
B - 107

Barrett Ranch East Air Quality Technical Report Appendix A - 76 ESA / 140728
Worker
0.0442
0.0399
0.5401
1.4500e-003
0.1141
7.8000e-004
0.1149
0.0303
7.3000e-004
0.0310
Total 0.0442
0.0399
0.5401
1.4500e-
003
0.1141
7.8000e-
004
0.1149
0.0303
7.3000e-
004
0.0310
Mitigated Construction On-Site
ROG NOx CO SO2 Fugitive PM10
Exhaust PM10
PM10 Total
Fugitive PM2.5
Exhaust PM2.5
PM2.5 Total
Bio- CO2 NBio- CO2
Total CO2
CH4 N2O CO2e
Category
lb/day lb/day
Off-Road
1.4259
14.9353
14.3652
0.0223
0.8094
0.8094
0.7447
0.7447
Paving
0.0280
0.0000
0.0000
0.0000
0.0000
B - 108

Barrett Ranch East Air Quality Technical Report Appendix A - 77 ESA / 140728
Total 1.4539
14.9353
14.3652
0.0223
0.8094
0.8094
0.7447
0.7447
Mitigated Construction Off-Site
ROG NOx CO SO2 Fugitive PM10
Exhaust PM10
PM10 Total
Fugitive PM2.5
Exhaust PM2.5
PM2.5 Total
Bio- CO2
NBio- CO2
Total CO2
CH4 N2O CO2e
Category
lb/day lb/day
Hauling
0.0000
0.0000
0.0000
0.0000
0.0000
0.0000
0.0000
0.0000
0.0000
0.0000
Vendor
0.0000
0.0000
0.0000
0.0000
0.0000
0.0000
0.0000
0.0000
0.0000
0.0000
B - 109
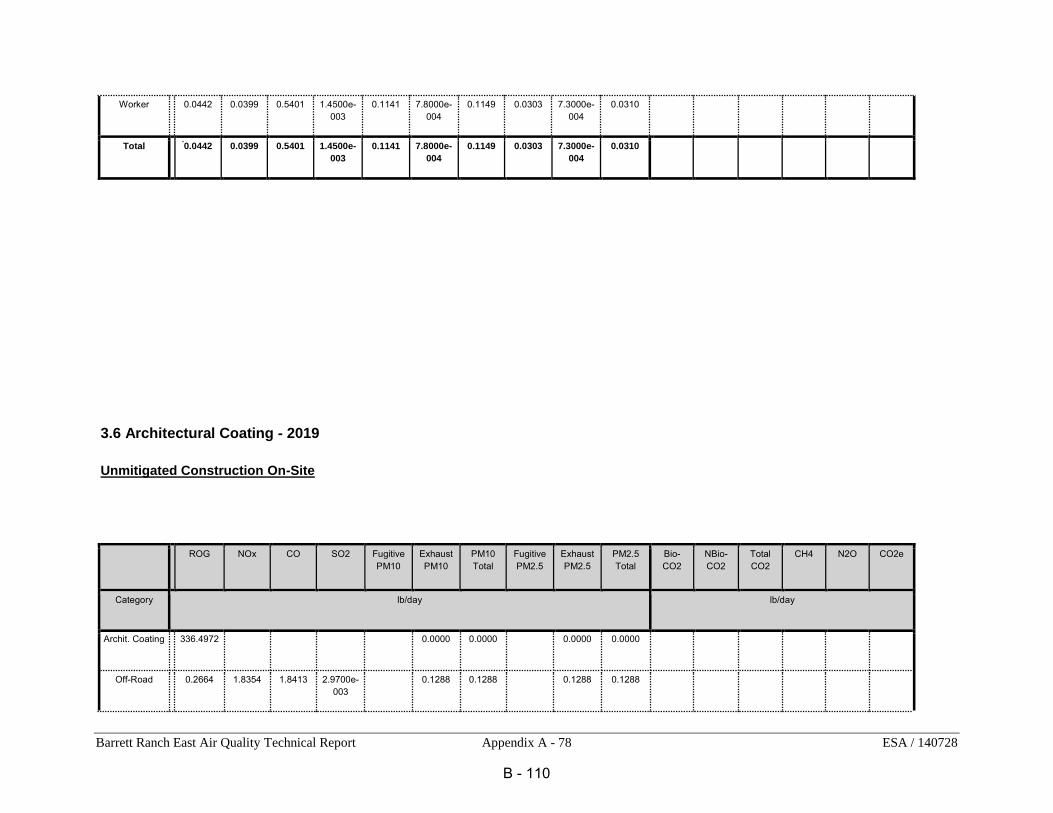
Barrett Ranch East Air Quality Technical Report Appendix A - 78 ESA / 140728
Worker
0.0442
0.0399
0.5401
1.4500e-003
0.1141
7.8000e-004
0.1149
0.0303
7.3000e-004
0.0310
Total 0.0442
0.0399
0.5401
1.4500e-
003
0.1141
7.8000e-
004
0.1149
0.0303
7.3000e-
004
0.0310
3.6 Architectural Coating - 2019
Unmitigated Construction On-Site
ROG NOx CO SO2 Fugitive PM10
Exhaust PM10
PM10 Total
Fugitive PM2.5
Exhaust PM2.5
PM2.5 Total
Bio- CO2
NBio- CO2
Total CO2
CH4 N2O CO2e
Category
lb/day lb/day
Archit. Coating
336.4972
0.0000
0.0000
0.0000
0.0000
Off-Road
0.2664
1.8354
1.8413
2.9700e-003
0.1288
0.1288
0.1288
0.1288
B - 110

Barrett Ranch East Air Quality Technical Report Appendix A - 79 ESA / 140728
Total 336.7637
1.8354
1.8413
2.9700e-
003
0.1288
0.1288
0.1288
0.1288
Unmitigated Construction Off-Site
ROG NOx CO SO2 Fugitive PM10
Exhaust PM10
PM10 Total
Fugitive PM2.5
Exhaust PM2.5
PM2.5 Total
Bio- CO2
NBio- CO2
Total CO2
CH4 N2O CO2e
Category
lb/day lb/day
Hauling
0.0000
0.0000
0.0000
0.0000
0.0000
0.0000
0.0000
0.0000
0.0000
0.0000
Vendor
0.0000
0.0000
0.0000
0.0000
0.0000
0.0000
0.0000
0.0000
0.0000
0.0000
B - 111

Barrett Ranch East Air Quality Technical Report Appendix A - 80 ESA / 140728
Worker
0.3006
0.2710
3.6726
9.8700e-003
0.7759
5.3300e-003
0.7813
0.2058
4.9400e-003
0.2108
Total 0.3006
0.2710
3.6726
9.8700e-
003
0.7759
5.3300e-
003
0.7813
0.2058
4.9400e-
003
0.2108
Mitigated Construction On-Site
ROG NOx CO SO2 Fugitive PM10
Exhaust PM10
PM10 Total
Fugitive PM2.5
Exhaust PM2.5
PM2.5 Total
Bio- CO2
NBio- CO2
Total CO2
CH4 N2O CO2e
Category
lb/day lb/day
Archit. Coating
336.4972
0.0000
0.0000
0.0000
0.0000
Off-Road
0.2664
1.8354
1.8413
2.9700e-003
0.1288
0.1288
0.1288
0.1288
B - 112

Barrett Ranch East Air Quality Technical Report Appendix A - 81 ESA / 140728
Total 336.7637
1.8354
1.8413
2.9700e-
003
0.1288
0.1288
0.1288
0.1288
Mitigated Construction Off-Site
ROG NOx CO SO2 Fugitive PM10
Exhaust PM10
PM10 Total
Fugitive PM2.5
Exhaust PM2.5
PM2.5 Total
Bio- CO2
NBio- CO2
Total CO2
CH4 N2O CO2e
Category
lb/day lb/day
Hauling
0.0000
0.0000
0.0000
0.0000
0.0000
0.0000
0.0000
0.0000
0.0000
0.0000
Vendor
0.0000
0.0000
0.0000
0.0000
0.0000
0.0000
0.0000
0.0000
0.0000
0.0000
B - 113

Barrett Ranch East Air Quality Technical Report Appendix A - 82 ESA / 140728
Worker
0.3006
0.2710
3.6726
9.8700e-003
0.7759
5.3300e-003
0.7813
0.2058
4.9400e-003
0.2108
Total 0.3006
0.2710
3.6726
9.8700e-
003
0.7759
5.3300e-
003
0.7813
0.2058
4.9400e-
003
0.2108
3.6 Architectural Coating - 2020
Unmitigated Construction On-Site
ROG NOx CO SO2 Fugitive PM10
Exhaust PM10
PM10 Total
Fugitive PM2.5
Exhaust PM2.5
PM2.5 Total
Bio- CO2
NBio- CO2
Total CO2
CH4 N2O CO2e
Category
lb/day lb/day
Archit. Coating
336.4972
0.0000
0.0000
0.0000
0.0000
Off-Road
0.2422
1.6838
1.8314
2.9700e-003
0.1109
0.1109
0.1109
0.1109
B - 114

Barrett Ranch East Air Quality Technical Report Appendix A - 83 ESA / 140728
Total 336.7394
1.6838
1.8314
2.9700e-
003
0.1109
0.1109
0.1109
0.1109
Unmitigated Construction Off-Site
ROG NOx CO SO2 Fugitive PM10
Exhaust PM10
PM10 Total
Fugitive PM2.5
Exhaust PM2.5
PM2.5 Total
Bio- CO2
NBio- CO2
Total CO2
CH4 N2O CO2e
Category
lb/day lb/day
Hauling
0.0000
0.0000
0.0000
0.0000
0.0000
0.0000
0.0000
0.0000
0.0000
0.0000
Vendor
0.0000
0.0000
0.0000
0.0000
0.0000
0.0000
0.0000
0.0000
0.0000
0.0000
B - 115

Barrett Ranch East Air Quality Technical Report Appendix A - 84 ESA / 140728
Worker
0.2809
0.2511
3.4225
9.8700e-003
0.7759
5.3400e-003
0.7813
0.2058
4.9500e-003
0.2108
Total 0.2809
0.2511
3.4225
9.8700e-
003
0.7759
5.3400e-
003
0.7813
0.2058
4.9500e-
003
0.2108
Mitigated Construction On-Site
ROG NOx CO SO2 Fugitive PM10
Exhaust PM10
PM10 Total
Fugitive PM2.5
Exhaust PM2.5
PM2.5 Total
Bio- CO2
NBio- CO2
Total CO2
CH4 N2O CO2e
Category
lb/day lb/day
Archit. Coating
336.4972
0.0000
0.0000
0.0000
0.0000
Off-Road
0.2422
1.6838
1.8314
2.9700e-003
0.1109
0.1109
0.1109
0.1109
B - 116

Barrett Ranch East Air Quality Technical Report Appendix A - 85 ESA / 140728
Total 336.7394
1.6838
1.8314
2.9700e-
003
0.1109
0.1109
0.1109
0.1109
Mitigated Construction Off-Site
ROG NOx CO SO2 Fugitive PM10
Exhaust PM10
PM10 Total
Fugitive PM2.5
Exhaust PM2.5
PM2.5 Total
Bio- CO2
NBio- CO2
Total CO2
CH4 N2O CO2e
Category
lb/day lb/day
Hauling
0.0000
0.0000
0.0000
0.0000
0.0000
0.0000
0.0000
0.0000
0.0000
0.0000
Vendor
0.0000
0.0000
0.0000
0.0000
0.0000
0.0000
0.0000
0.0000
0.0000
0.0000
B - 117

Barrett Ranch East Air Quality Technical Report Appendix A - 86 ESA / 140728
Worker
0.2809
0.2511
3.4225
9.8700e-003
0.7759
5.3400e-003
0.7813
0.2058
4.9500e-003
0.2108
Total 0.2809
0.2511
3.4225
9.8700e-
003
0.7759
5.3400e-
003
0.7813
0.2058
4.9500e-
003
0.2108
4.0 Operational Detail - Mobile
4.1 Mitigation Measures Mobile
B - 118
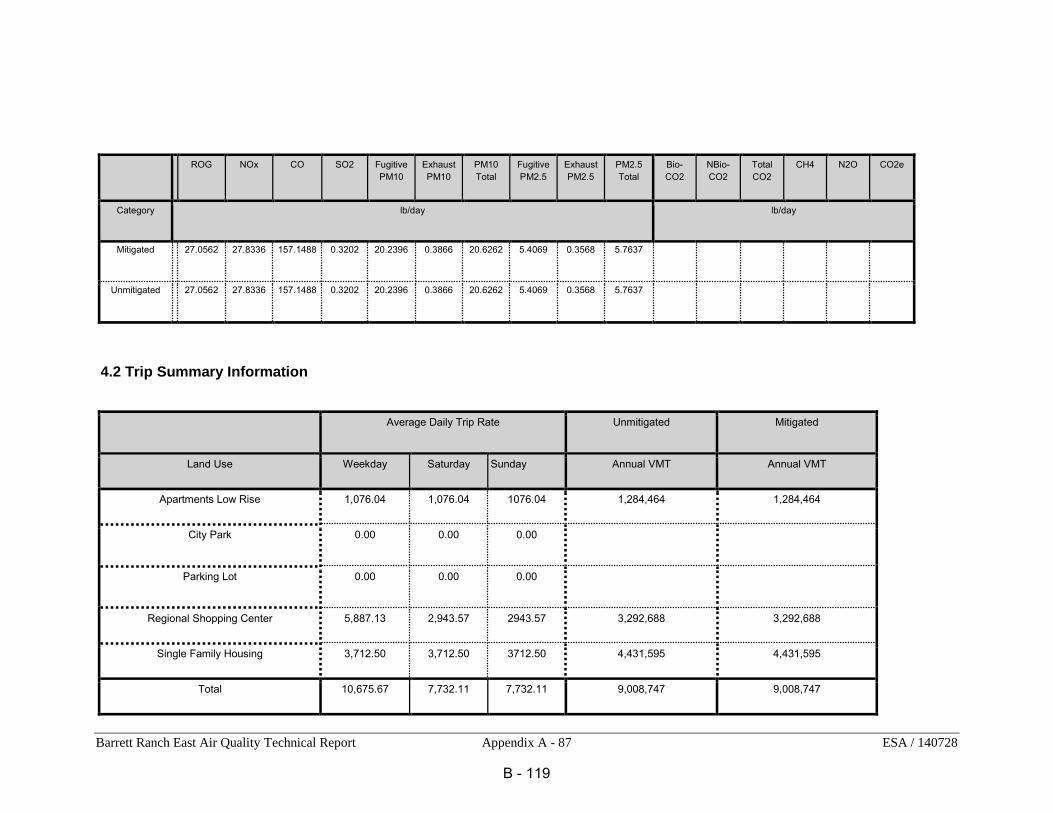
Barrett Ranch East Air Quality Technical Report Appendix A - 87 ESA / 140728
ROG NOx CO SO2 Fugitive PM10
Exhaust PM10
PM10 Total
Fugitive PM2.5
Exhaust PM2.5
PM2.5 Total
Bio- CO2
NBio- CO2
Total CO2
CH4 N2O CO2e
Category
lb/day lb/day
Mitigated
27.0562
27.8336
157.1488
0.3202
20.2396
0.3866
20.6262
5.4069
0.3568
5.7637
Unmitigated
27.0562
27.8336
157.1488
0.3202
20.2396
0.3866
20.6262
5.4069
0.3568
5.7637
4.2 Trip Summary Information
Average Daily Trip Rate Unmitigated Mitigated
Land Use Weekday Saturday Sunday Annual VMT Annual VMT
Apartments Low Rise 1,076.04 1,076.04 1076.04 1,284,464 1,284,464
City Park 0.00 0.00 0.00
Parking Lot 0.00 0.00 0.00
Regional Shopping Center 5,887.13 2,943.57 2943.57 3,292,688 3,292,688
Single Family Housing 3,712.50 3,712.50 3712.50 4,431,595 4,431,595
Total 10,675.67 7,732.11 7,732.11 9,008,747 9,008,747
B - 119

Barrett Ranch East Air Quality Technical Report Appendix A - 88 ESA / 140728
4.3 Trip Type Information
Miles Trip % Trip Purpose %
Land Use H-W or C-W H-S or C-C H-O or C-NW
H-W or C-W
H-S or C-C H-O or C-NW Primary Diverted Pass-by
Apartments Low Rise
4.65
2.33
3.02
46.50
12.50
41.00
86
11
3
City Park
10.00
5.00
6.50
33.00
48.00
19.00
66
28
6
Parking Lot
10.00
5.00
6.50
0.00
0.00
0.00
0
0
0
Regional Shopping Center
4.65
2.33
3.02
16.30
64.70
19.00
54
35
11
Single Family Housing
4.65
2.33
3.02
46.50
12.50
41.00
86
11
3
LDA LDT1 LDT2 MDV LHD1 LHD2 MHD HHD OBUS UBUS MCY SBUS MH
0.503605 0.067800 0.178973 0.146934 0.044621 0.006359 0.021238 0.016884 0.002315 0.002275 0.006260 0.000554 0.002182
5.0 Energy Detail
4.4 Fleet Mix
Historical Energy Use: N
5.1 Mitigation Measures Energy
Exceed Title 24
B - 120

Barrett Ranch East Air Quality Technical Report Appendix A - 89 ESA / 140728
Install High Efficiency Lighting
ROG NOx CO SO2 Fugitive PM10
Exhaust PM10
PM10 Total
Fugitive PM2.5
Exhaust PM2.5
PM2.5 Total
Bio- CO2
NBio- CO2
Total CO2
CH4 N2O CO2e
Category
lb/day lb/day
NaturalGas Mitigated
0.3819
3.2699
1.4371
0.0208
0.2638
0.2638
0.2638
0.2638
NaturalGas Unmitigated
0.4513
3.8643
1.6986
0.0246
0.3118
0.3118
0.3118
0.3118
B - 121
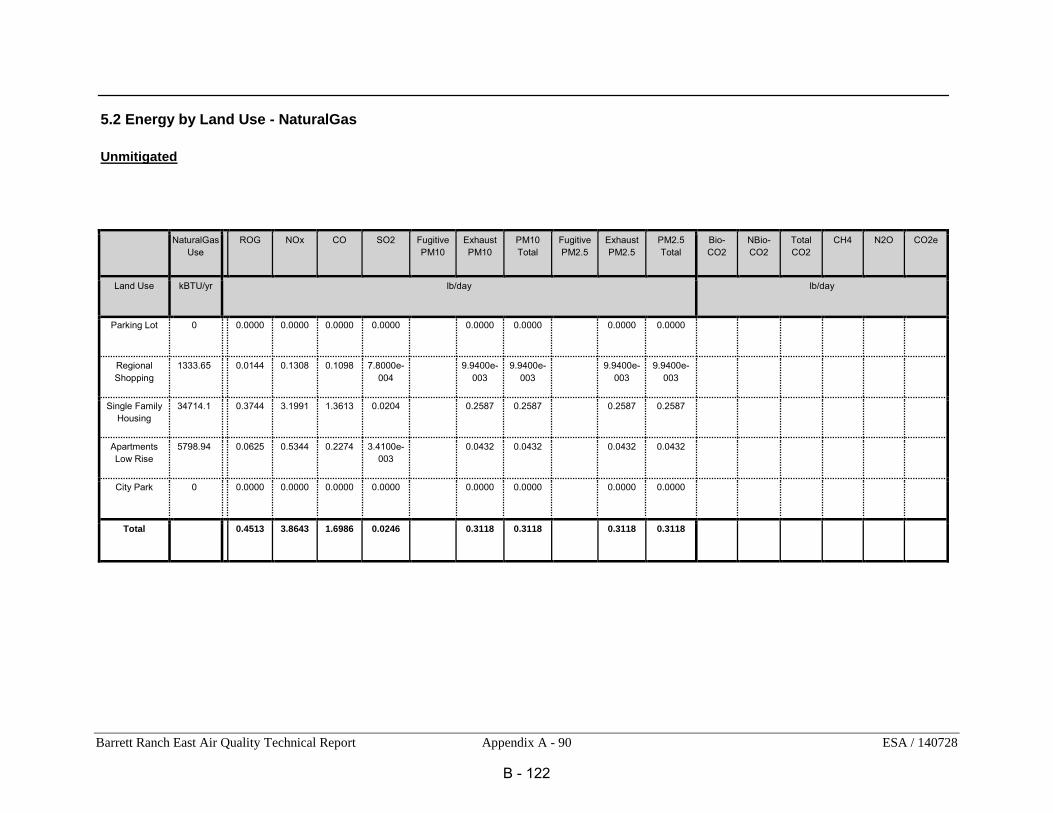
Barrett Ranch East Air Quality Technical Report Appendix A - 90 ESA / 140728
5.2 Energy by Land Use - NaturalGas
Unmitigated
NaturalGas Use ROG NOx CO SO2 Fugitive
PM10 Exhaust PM10
PM10 Total
Fugitive PM2.5
Exhaust PM2.5
PM2.5 Total
Bio- CO2
NBio- CO2
Total CO2
CH4 N2O CO2e
Land Use
kBTU/yr lb/day lb/day
Parking Lot
0
0.0000
0.0000
0.0000
0.0000
0.0000
0.0000
0.0000
0.0000
Regional Shopping
Center
1333.65
0.0144
0.1308
0.1098
7.8000e-004
9.9400e-003
9.9400e-003
9.9400e-003
9.9400e-003
Single Family Housing
34714.1
0.3744
3.1991
1.3613
0.0204
0.2587
0.2587
0.2587
0.2587
Apartments Low Rise
5798.94
0.0625
0.5344
0.2274
3.4100e-003
0.0432
0.0432
0.0432
0.0432
City Park
0
0.0000
0.0000
0.0000
0.0000
0.0000
0.0000
0.0000
0.0000
Total 0.4513
3.8643
1.6986
0.0246
0.3118
0.3118
0.3118
0.3118
B - 122

Barrett Ranch East Air Quality Technical Report Appendix A - 91 ESA / 140728
Mitigated
NaturalGas Use ROG NOx CO SO2 Fugitive
PM10 Exhaust PM10
PM10 Total
Fugitive PM2.5
Exhaust PM2.5
PM2.5 Total
Bio- CO2
NBio- CO2
Total CO2
CH4 N2O CO2e
Land Use
kBTU/yr lb/day lb/day
Parking Lot
0
0.0000
0.0000
0.0000
0.0000
0.0000
0.0000
0.0000
0.0000
Regional Shopping
Center
1.12242
0.0121
0.1100
0.0924
6.6000e-004
8.3600e-003
8.3600e-003
8.3600e-003
8.3600e-003
Single Family Housing
29.3807
0.3169
2.7076
1.1522
0.0173
0.2189
0.2189
0.2189
0.2189
Apartments Low Rise
4.90743
0.0529
0.4523
0.1925
2.8900e-003
0.0366
0.0366
0.0366
0.0366
City Park
0
0.0000
0.0000
0.0000
0.0000
0.0000
0.0000
0.0000
0.0000
Total 0.3819
3.2699
1.4371
0.0208
0.2639
0.2639
0.2639
0.2639
6.0 Area Detail
6.1 Mitigation Measures Area
B - 123
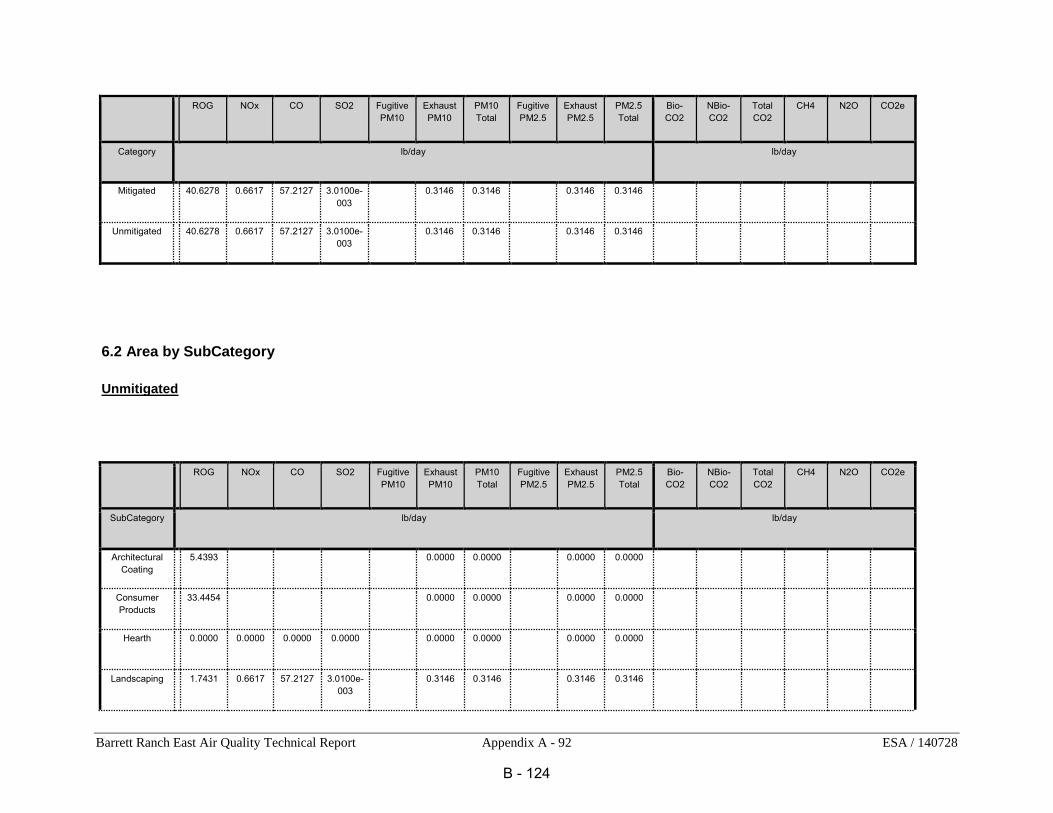
Barrett Ranch East Air Quality Technical Report Appendix A - 92 ESA / 140728
ROG NOx CO SO2 Fugitive PM10
Exhaust PM10
PM10 Total
Fugitive PM2.5
Exhaust PM2.5
PM2.5 Total
Bio- CO2
NBio- CO2
Total CO2
CH4 N2O CO2e
Category
lb/day lb/day
Mitigated
40.6278
0.6617
57.2127
3.0100e-003
0.3146
0.3146
0.3146
0.3146
Unmitigated
40.6278
0.6617
57.2127
3.0100e-003
0.3146
0.3146
0.3146
0.3146
6.2 Area by SubCategory
Unmitigated
ROG NOx CO SO2 Fugitive PM10
Exhaust PM10
PM10 Total
Fugitive PM2.5
Exhaust PM2.5
PM2.5 Total
Bio- CO2
NBio- CO2
Total CO2
CH4 N2O CO2e
SubCategory
lb/day lb/day
Architectural Coating
5.4393
0.0000
0.0000
0.0000
0.0000
Consumer Products
33.4454
0.0000
0.0000
0.0000
0.0000
Hearth
0.0000
0.0000
0.0000
0.0000
0.0000
0.0000
0.0000
0.0000
Landscaping
1.7431
0.6617
57.2127
3.0100e-003
0.3146
0.3146
0.3146
0.3146
B - 124

Barrett Ranch East Air Quality Technical Report Appendix A - 93 ESA / 140728
Total 40.6278
0.6617
57.2127
3.0100e-
003
0.3146
0.3146
0.3146
0.3146
B - 125

Barrett Ranch East Air Quality Technical Report Appendix A - 94 ESA / 140728
Mitigated
ROG NOx CO SO2 Fugitive PM10
Exhaust PM10
PM10 Total
Fugitive PM2.5
Exhaust PM2.5
PM2.5 Total
Bio- CO2
NBio- CO2
Total CO2
CH4 N2O CO2e
SubCategory
lb/day lb/day
Architectural Coating
5.4393
0.0000
0.0000
0.0000
0.0000
Consumer Products
33.4454
0.0000
0.0000
0.0000
0.0000
Hearth
0.0000
0.0000
0.0000
0.0000
0.0000
0.0000
0.0000
0.0000
Landscaping
1.7431
0.6617
57.2127
3.0100e-003
0.3146
0.3146
0.3146
0.3146
Total 40.6278
0.6617
57.2127
3.0100e-
003
0.3146
0.3146
0.3146
0.3146
7.0 Water Detail
7.1 Mitigation Measures Water
8.0 Waste Detail
B - 126

Barrett Ranch East Air Quality Technical Report Appendix A - 95 ESA / 140728
8.1 Mitigation Measures Waste
9.0 Operational Offroad
Equipment Type Number Hours/Day Days/Year Horse Power Load Factor Fuel Type
10.0 Vegetation
B - 127
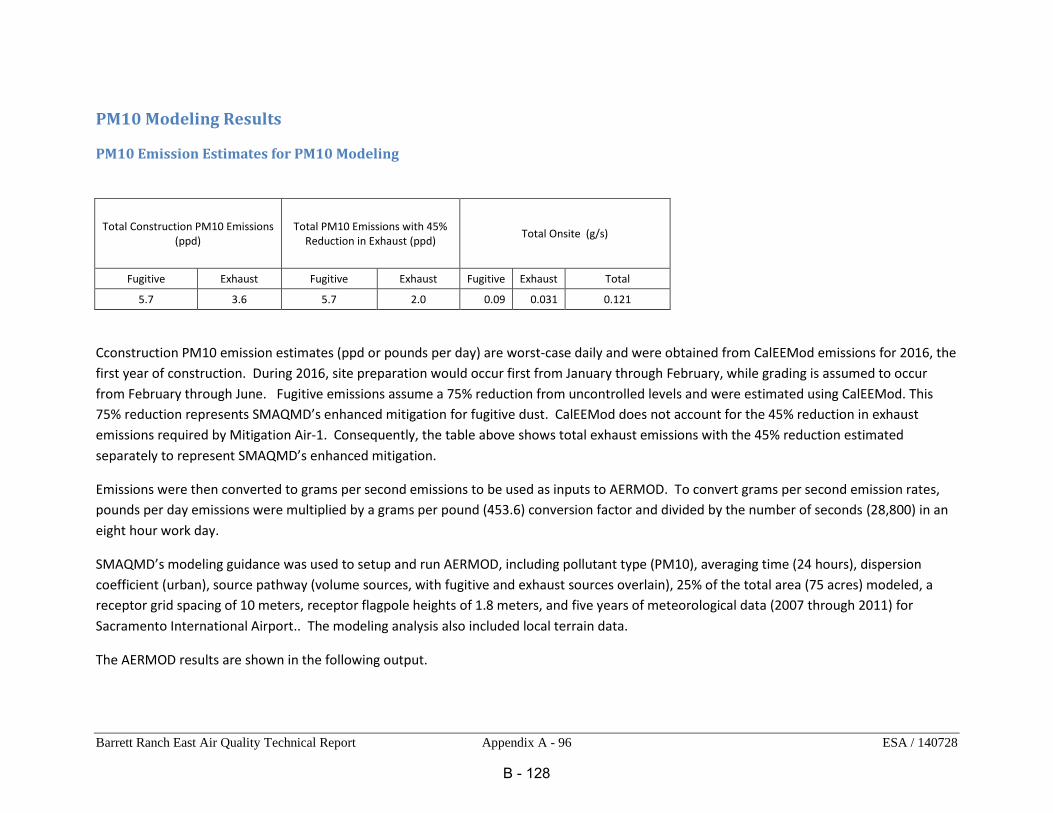
Barrett Ranch East Air Quality Technical Report Appendix A - 96 ESA / 140728
PM10 Modeling Results
PM10 Emission Estimates for PM10 Modeling
Total Construction PM10 Emissions (ppd)
Total PM10 Emissions with 45% Reduction in Exhaust (ppd)
Total Onsite (g/s)
Fugitive Exhaust Fugitive Exhaust Fugitive Exhaust Total
5.7 3.6 5.7 2.0 0.09 0.031 0.121
Cconstruction PM10 emission estimates (ppd or pounds per day) are worst-case daily and were obtained from CalEEMod emissions for 2016, the
first year of construction. During 2016, site preparation would occur first from January through February, while grading is assumed to occur
from February through June. Fugitive emissions assume a 75% reduction from uncontrolled levels and were estimated using CalEEMod. This
75% reduction represents SMAQMD’s enhanced mitigation for fugitive dust. CalEEMod does not account for the 45% reduction in exhaust
emissions required by Mitigation Air-1. Consequently, the table above shows total exhaust emissions with the 45% reduction estimated
separately to represent SMAQMD’s enhanced mitigation.
Emissions were then converted to grams per second emissions to be used as inputs to AERMOD. To convert grams per second emission rates,
pounds per day emissions were multiplied by a grams per pound (453.6) conversion factor and divided by the number of seconds (28,800) in an
eight hour work day.
SMAQMD’s modeling guidance was used to setup and run AERMOD, including pollutant type (PM10), averaging time (24 hours), dispersion
coefficient (urban), source pathway (volume sources, with fugitive and exhaust sources overlain), 25% of the total area (75 acres) modeled, a
receptor grid spacing of 10 meters, receptor flagpole heights of 1.8 meters, and five years of meteorological data (2007 through 2011) for
Sacramento International Airport.. The modeling analysis also included local terrain data.
The AERMOD results are shown in the following output.
B - 128

Barrett Ranch East Air Quality Technical Report Appendix A - 97 ESA / 140728
AERMOD Graphical Results
Overview (red dotted outline area represents area sources included in the modeling {128 acres})
B - 129
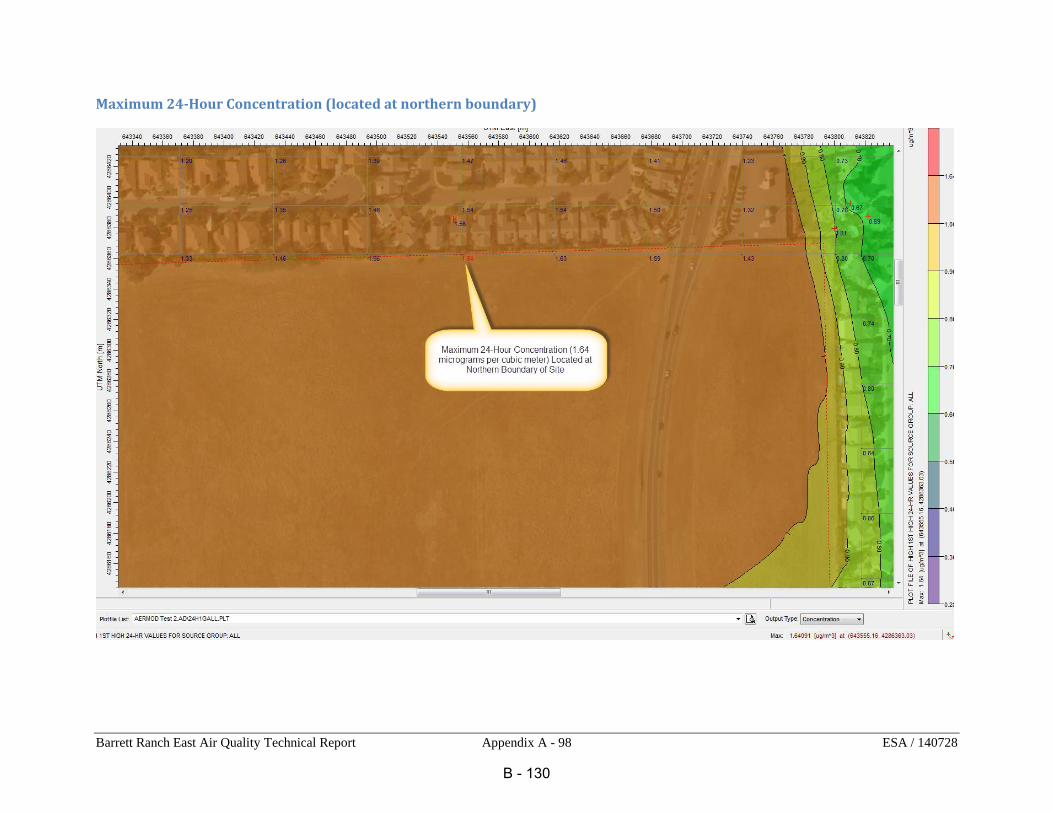
Barrett Ranch East Air Quality Technical Report Appendix A - 98 ESA / 140728
Maximum 24-Hour Concentration (located at northern boundary)
B - 130

Barrett Ranch East Air Quality Technical Report Appendix A - 99 ESA / 140728
Maximum Annual PM10 Concentration
B - 131

Barrett Ranch East Air Quality Technical Report Appendix A - 100 ESA / 140728
AERMOD Summary Output File *** AERMOD - VERSION 12060 *** *** C:\Users\sda\Desktop\AERMOD Test 2\AERMOD Test 2.isc *** 11/12/14
*** *** 10:54:11
PAGE 1
**MODELOPTs: NonDFAULT CONC FLAT and ELEV
*** MODEL SETUP OPTIONS SUMMARY ***
- - - - - - - - - - - - - - - - - - - - - - - - - - - - - - - - - - - - - - - - - - - - - - - - - - - - - - - - - - - - - - -
**Model Is Setup For Calculation of Average CONCentration Values.
-- DEPOSITION LOGIC --
**NO GAS DEPOSITION Data Provided.
**NO PARTICLE DEPOSITION Data Provided.
**Model Uses NO DRY DEPLETION. DRYDPLT = F
**Model Uses NO WET DEPLETION. WETDPLT = F
**Model Uses RURAL Dispersion Only.
**Model Allows User-Specified Options:
1. Stack-tip Downwash.
2. Allow FLAT/ELEV Terrain Option by Source,
with 0 FLAT and 1 ELEV Source(s).
3. Use Calms Processing Routine.
4. Use Missing Data Processing Routine.
5. No Exponential Decay.
**Model Assumes No FLAGPOLE Receptor Heights.
**Model Calculates 1 Short Term Average(s) of: 24-HR
and Calculates PERIOD Averages
**This Run Includes: 1 Source(s); 1 Source Group(s); and 982 Receptor(s)
**The Model Assumes A Pollutant Type of: PM_10
**Model Set To Continue RUNning After the Setup Testing.
**Output Options Selected:
Model Outputs Tables of PERIOD Averages by Receptor
Model Outputs Tables of Highest Short Term Values by Receptor (RECTABLE Keyword)
Model Outputs External File(s) of High Values for Plotting (PLOTFILE Keyword)
Model Outputs Separate Summary File of High Ranked Values (SUMMFILE Keyword)
**NOTE: The Following Flags May Appear Following CONC Values: c for Calm Hours
m for Missing Hours
b for Both Calm and Missing Hours
B - 132
Barrett Ranch East Air Quality Technical Report Appendix A - 101 ESA / 140728
**Misc. Inputs: Base Elev. for Pot. Temp. Profile (m MSL) = 10.00 ; Decay Coef. = 0.000 ; Rot. Angle = 0.0
Emission Units = GRAMS/SEC ; Emission Rate Unit Factor = 0.10000E+07
Output Units = MICROGRAMS/M**3
**Approximate Storage Requirements of Model = 3.6 MB of RAM.
**Detailed Error/Message File: AERMOD Test 2.err
**File for Summary of Results: AERMOD Test 2.sum
B - 133

Barrett Ranch East Air Quality Technical Report Appendix A - 102 ESA / 140728
*** AERMOD - VERSION 12060 *** *** C:\Users\sda\Desktop\AERMOD Test 2\AERMOD Test 2.isc *** 11/12/14
*** *** 10:54:11
PAGE 2
**MODELOPTs: NonDFAULT CONC FLAT and ELEV
*** METEOROLOGICAL DAYS SELECTED FOR PROCESSING ***
(1=YES; 0=NO)
1 1 1 1 1 1 1 1 1 1 1 1 1 1 1 1 1 1 1 1 1 1 1 1 1 1 1 1 1 1 1 1 1 1 1 1 1 1 1 1 1 1 1 1 1 1 1 1 1 1
1 1 1 1 1 1 1 1 1 1 1 1 1 1 1 1 1 1 1 1 1 1 1 1 1 1 1 1 1 1 1 1 1 1 1 1 1 1 1 1 1 1 1 1 1 1 1 1 1 1
1 1 1 1 1 1 1 1 1 1 1 1 1 1 1 1 1 1 1 1 1 1 1 1 1 1 1 1 1 1 1 1 1 1 1 1 1 1 1 1 1 1 1 1 1 1 1 1 1 1
1 1 1 1 1 1 1 1 1 1 1 1 1 1 1 1 1 1 1 1 1 1 1 1 1 1 1 1 1 1 1 1 1 1 1 1 1 1 1 1 1 1 1 1 1 1 1 1 1 1
1 1 1 1 1 1 1 1 1 1 1 1 1 1 1 1 1 1 1 1 1 1 1 1 1 1 1 1 1 1 1 1 1 1 1 1 1 1 1 1 1 1 1 1 1 1 1 1 1 1
1 1 1 1 1 1 1 1 1 1 1 1 1 1 1 1 1 1 1 1 1 1 1 1 1 1 1 1 1 1 1 1 1 1 1 1 1 1 1 1 1 1 1 1 1 1 1 1 1 1
1 1 1 1 1 1 1 1 1 1 1 1 1 1 1 1 1 1 1 1 1 1 1 1 1 1 1 1 1 1 1 1 1 1 1 1 1 1 1 1 1 1 1 1 1 1 1 1 1 1
1 1 1 1 1 1 1 1 1 1 1 1 1 1 1 1
METEOROLOGICAL DATA PROCESSED BETWEEN START DATE: 2007 1 1 1
AND END DATE: 2009 12 31 24
NOTE: METEOROLOGICAL DATA ACTUALLY PROCESSED WILL ALSO DEPEND ON WHAT IS INCLUDED IN THE DATA FILE.
*** UPPER BOUND OF FIRST THROUGH FIFTH WIND SPEED CATEGORIES ***
(METERS/SEC)
1.54, 3.09, 5.14, 8.23, 10.80,
B - 134

Barrett Ranch East Air Quality Technical Report Appendix A - 103 ESA / 140728
*** AERMOD - VERSION 12060 *** *** C:\Users\sda\Desktop\AERMOD Test 2\AERMOD Test 2.isc *** 11/12/14
*** *** 10:54:11
PAGE 3
**MODELOPTs: NonDFAULT CONC FLAT and ELEV
*** UP TO THE FIRST 24 HOURS OF METEOROLOGICAL DATA ***
Surface file: Int07-11N1MD.SFC Met Version: 11059
Profile file: Int07-11N1MD.PFL
Surface format: FREE
Profile format: FREE
Surface station no.: 93225 Upper air station no.: 23230
Name: UNKNOWN Name: OAKLAND/WSO_AP
Year: 2007 Year: 2007
First 24 hours of scalar data
YR MO DY JDY HR H0 U* W* DT/DZ ZICNV ZIMCH M-O LEN Z0 BOWEN ALBEDO REF WS WD HT REF TA HT
- - - - - - - - - - - - - - - - - - - - - - - - - - - - - - - - - - - - - - - - - - - - - - - - - - - - - - - - - - - - -
07 01 01 1 01 -999.0 -9.000 -9.000 -9.000 -999. -999. -99999.0 0.06 0.69 1.00 0.00 0. 10.0 275.9 2.0
07 01 01 1 02 -999.0 -9.000 -9.000 -9.000 -999. -999. -99999.0 0.06 0.69 1.00 0.00 0. 10.0 275.4 2.0
07 01 01 1 03 -999.0 -9.000 -9.000 -9.000 -999. -999. -99999.0 0.06 0.69 1.00 0.00 0. 10.0 276.4 2.0
07 01 01 1 04 -5.4 0.073 -9.000 -9.000 -999. 45. 6.5 0.08 0.69 1.00 1.76 293. 10.0 274.2 2.0
07 01 01 1 05 -30.3 0.259 -9.000 -9.000 -999. 303. 52.3 0.07 0.69 1.00 3.86 323. 10.0 275.4 2.0
07 01 01 1 06 -25.3 0.216 -9.000 -9.000 -999. 231. 36.3 0.08 0.69 1.00 3.36 292. 10.0 275.4 2.0
07 01 01 1 07 -50.3 0.431 -9.000 -9.000 -999. 651. 145.6 0.06 0.69 1.00 5.96 335. 10.0 276.4 2.0
07 01 01 1 08 -9.0 0.093 -9.000 -9.000 -999. 275. 8.2 0.06 0.69 1.00 2.36 999. 10.0 275.9 2.0
07 01 01 1 09 11.9 -9.000 -9.000 -9.000 -999. -999. -99999.0 0.06 0.69 0.41 0.00 0. 10.0 277.0 2.0
07 01 01 1 10 32.8 0.167 0.478 0.012 122. 157. -13.0 0.06 0.69 0.28 1.76 351. 10.0 279.2 2.0
07 01 01 1 11 62.9 0.552 0.800 0.006 297. 942. -243.3 0.06 0.69 0.24 6.96 334. 10.0 285.9 2.0
07 01 01 1 12 79.2 0.573 0.948 0.005 392. 998. -216.9 0.07 0.69 0.22 6.96 326. 10.0 287.0 2.0
07 01 01 1 13 82.1 0.629 0.989 0.005 430. 1146. -276.0 0.06 0.69 0.22 7.96 333. 10.0 289.2 2.0
07 01 01 1 14 70.5 0.734 0.963 0.005 462. 1445. -511.1 0.07 0.69 0.23 9.06 319. 10.0 289.2 2.0
07 01 01 1 15 45.9 0.744 0.848 0.005 483. 1476. -817.0 0.06 0.69 0.26 9.56 332. 10.0 289.9 2.0
07 01 01 1 16 10.2 0.655 0.515 0.005 487. 1229. -2509.3 0.06 0.69 0.35 8.46 334. 10.0 289.2 2.0
07 01 01 1 17 -54.1 0.535 -9.000 -9.000 -999. 915. 258.3 0.07 0.69 0.61 6.96 321. 10.0 287.0 2.0
07 01 01 1 18 -60.0 0.533 -9.000 -9.000 -999. 895. 229.6 0.07 0.69 1.00 6.96 307. 10.0 285.4 2.0
07 01 01 1 19 -10.4 0.097 -9.000 -9.000 -999. 447. 8.0 0.03 0.69 1.00 2.86 34. 10.0 283.8 2.0
07 01 01 1 20 -9.4 0.096 -9.000 -9.000 -999. 149. 8.7 0.07 0.69 1.00 2.36 167. 10.0 282.0 2.0
07 01 01 1 21 -16.7 0.146 -9.000 -9.000 -999. 128. 16.9 0.07 0.69 1.00 2.86 170. 10.0 280.9 2.0
07 01 01 1 22 -24.7 0.215 -9.000 -9.000 -999. 229. 36.6 0.07 0.69 1.00 3.36 162. 10.0 280.4 2.0
07 01 01 1 23 -8.0 0.087 -9.000 -9.000 -999. 70. 7.4 0.04 0.69 1.00 2.36 130. 10.0 279.2 2.0
07 01 01 1 24 -27.0 0.234 -9.000 -9.000 -999. 260. 43.1 0.04 0.69 1.00 3.86 120. 10.0 278.8 2.0
First hour of profile data
YR MO DY HR HEIGHT F WDIR WSPD AMB_TMP sigmaA sigmaW sigmaV
07 01 01 01 10.0 1 -999. -99.00 276.0 99.0 -99.00 -99.00
F indicates top of profile (=1) or below (=0)
B - 135

Barrett Ranch East Air Quality Technical Report Appendix A - 104 ESA / 140728
*** AERMOD - VERSION 12060 *** *** C:\Users\sda\Desktop\AERMOD Test 2\AERMOD Test 2.isc *** 11/12/14
*** *** 10:54:11
PAGE 4
**MODELOPTs: NonDFAULT CONC FLAT and ELEV
*** THE SUMMARY OF MAXIMUM PERIOD ( 26304 HRS) RESULTS ***
** CONC OF PM_10 IN MICROGRAMS/M**3 **
NETWORK
GROUP ID AVERAGE CONC RECEPTOR (XR, YR, ZELEV, ZHILL, ZFLAG) OF TYPE GRID-ID
- - - - - - - - - - - - - - - - - - - - - - - - - - - - - - - - - - - - - - - - - - - - - - - - - - - - - - - - - - - -
ALL 1ST HIGHEST VALUE IS 0.24669 AT ( 643820.12, 4285580.32, 45.99, 45.99, 0.00) DC
2ND HIGHEST VALUE IS 0.23323 AT ( 643821.38, 4285593.78, 45.80, 45.80, 0.00) GC UCART1
3RD HIGHEST VALUE IS 0.21009 AT ( 643821.38, 4285635.29, 45.70, 45.70, 0.00) GC UCART1
4TH HIGHEST VALUE IS 0.19363 AT ( 643821.38, 4285676.80, 46.60, 46.60, 0.00) GC UCART1
5TH HIGHEST VALUE IS 0.19112 AT ( 643616.53, 4286363.03, 44.60, 44.60, 0.00) GC UCART3
6TH HIGHEST VALUE IS 0.18918 AT ( 643677.90, 4286363.03, 44.20, 44.20, 0.00) GC UCART3
7TH HIGHEST VALUE IS 0.18916 AT ( 643555.16, 4286363.03, 44.80, 44.80, 0.00) GC UCART3
8TH HIGHEST VALUE IS 0.18502 AT ( 643855.61, 4285593.78, 46.60, 46.60, 0.00) GC UCART1
9TH HIGHEST VALUE IS 0.18056 AT ( 643821.38, 4285718.31, 46.80, 46.80, 0.00) GC UCART1
10TH HIGHEST VALUE IS 0.17990 AT ( 643493.79, 4286363.03, 45.70, 45.70, 0.00) GC UCART3
*** RECEPTOR TYPES: GC = GRIDCART
GP = GRIDPOLR
DC = DISCCART
DP = DISCPOLR
B - 136
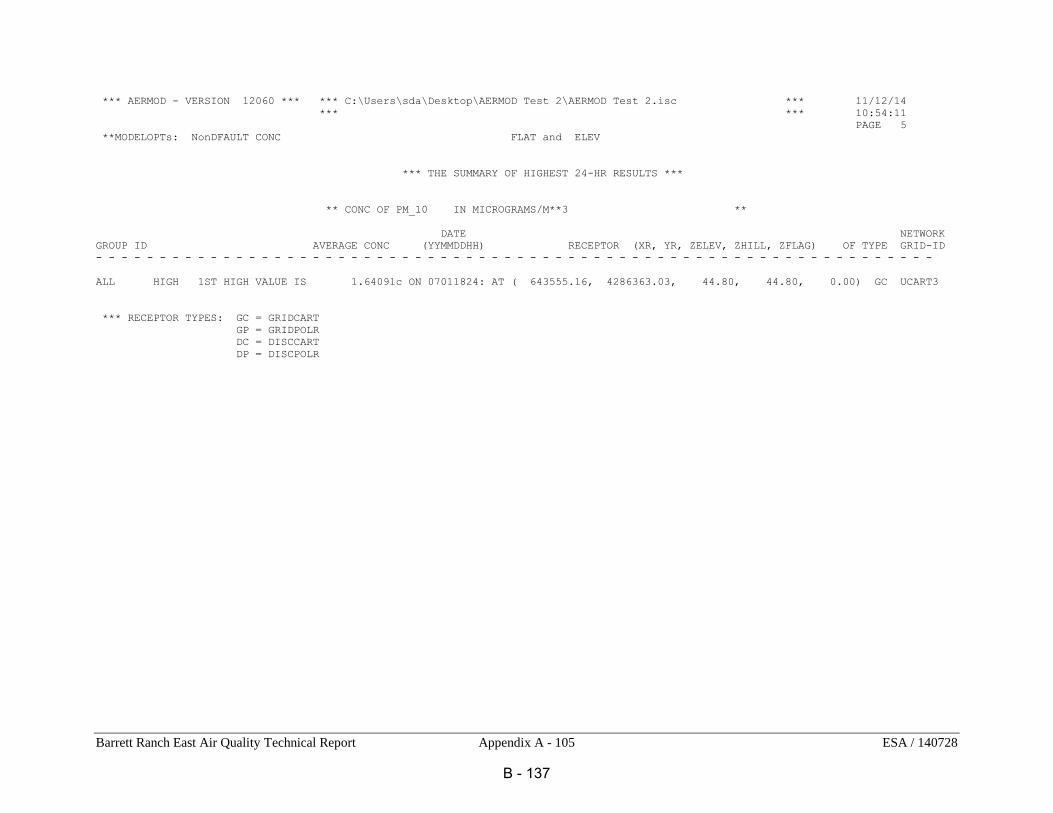
Barrett Ranch East Air Quality Technical Report Appendix A - 105 ESA / 140728
*** AERMOD - VERSION 12060 *** *** C:\Users\sda\Desktop\AERMOD Test 2\AERMOD Test 2.isc *** 11/12/14
*** *** 10:54:11
PAGE 5
**MODELOPTs: NonDFAULT CONC FLAT and ELEV
*** THE SUMMARY OF HIGHEST 24-HR RESULTS ***
** CONC OF PM_10 IN MICROGRAMS/M**3 **
DATE NETWORK
GROUP ID AVERAGE CONC (YYMMDDHH) RECEPTOR (XR, YR, ZELEV, ZHILL, ZFLAG) OF TYPE GRID-ID
- - - - - - - - - - - - - - - - - - - - - - - - - - - - - - - - - - - - - - - - - - - - - - - - - - - - - - - - - - - - - - - - - -
ALL HIGH 1ST HIGH VALUE IS 1.64091c ON 07011824: AT ( 643555.16, 4286363.03, 44.80, 44.80, 0.00) GC UCART3
*** RECEPTOR TYPES: GC = GRIDCART
GP = GRIDPOLR
DC = DISCCART
DP = DISCPOLR
B - 137
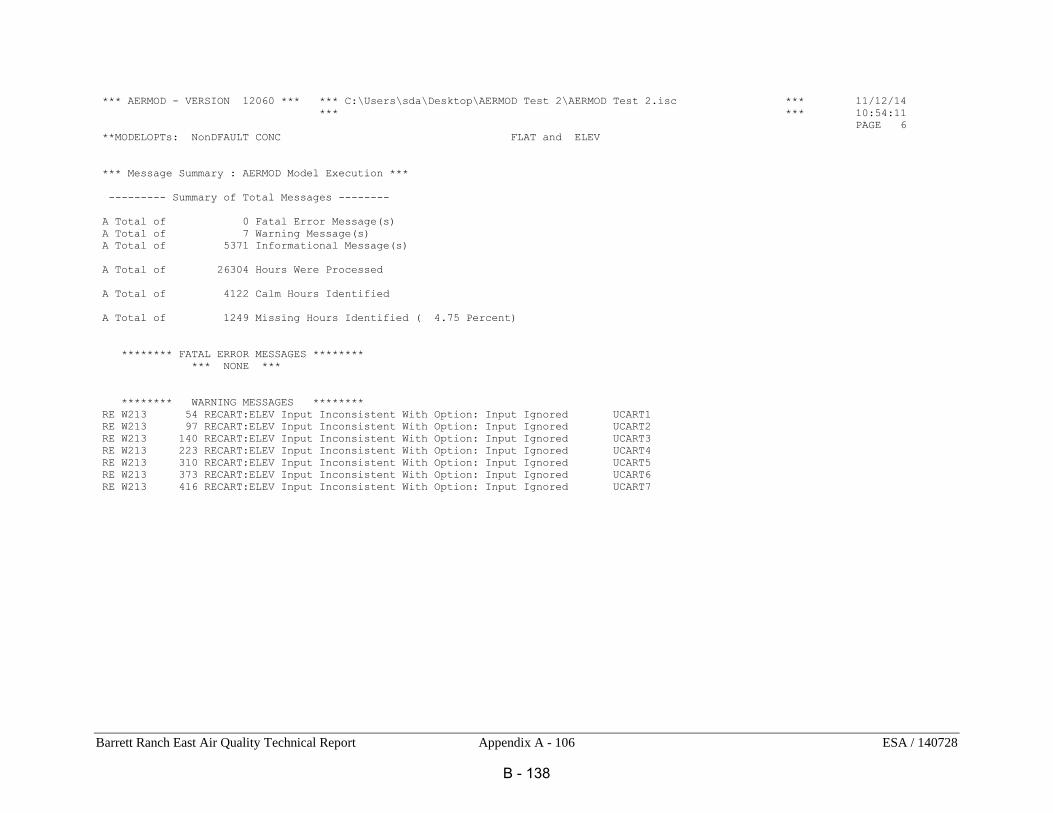
Barrett Ranch East Air Quality Technical Report Appendix A - 106 ESA / 140728
*** AERMOD - VERSION 12060 *** *** C:\Users\sda\Desktop\AERMOD Test 2\AERMOD Test 2.isc *** 11/12/14
*** *** 10:54:11
PAGE 6
**MODELOPTs: NonDFAULT CONC FLAT and ELEV
*** Message Summary : AERMOD Model Execution ***
--------- Summary of Total Messages --------
A Total of 0 Fatal Error Message(s)
A Total of 7 Warning Message(s)
A Total of 5371 Informational Message(s)
A Total of 26304 Hours Were Processed
A Total of 4122 Calm Hours Identified
A Total of 1249 Missing Hours Identified ( 4.75 Percent)
******** FATAL ERROR MESSAGES ********
*** NONE ***
******** WARNING MESSAGES ********
RE W213 54 RECART:ELEV Input Inconsistent With Option: Input Ignored UCART1
RE W213 97 RECART:ELEV Input Inconsistent With Option: Input Ignored UCART2
RE W213 140 RECART:ELEV Input Inconsistent With Option: Input Ignored UCART3
RE W213 223 RECART:ELEV Input Inconsistent With Option: Input Ignored UCART4
RE W213 310 RECART:ELEV Input Inconsistent With Option: Input Ignored UCART5
RE W213 373 RECART:ELEV Input Inconsistent With Option: Input Ignored UCART6
RE W213 416 RECART:ELEV Input Inconsistent With Option: Input Ignored UCART7
B - 138
Barrett Rach East Air Quality Technical Report Appendix B - 1 ESA / 140728
Appendix B – Greenhouse Gas Emissions
Table of Contents Appendix B – Greenhouse Gas Emissions ..................................................................................... 1
Greenhouse Gas Emission Estimates .......................................................................................... 2
EMFAC2011 Emissions .......................................................................................................... 2
VMT Estimates and Metric Tons CO2e per capita for Transportation ................................... 4
CalEEMod Annual GHG Emission Estimates ........................................................................ 6
Metric Tons GHG per Capita Energy Estimates ................................................................... 69
B - 139

Barrett Rach East Air Quality Technical Report Appendix B - 2 ESA / 140728
Greenhouse Gas Emission Estimates
EMFAC2011 Emissions
itle : Sacramento County Subarea Summer 45 CYrs 1990 to 2035 Default Title
Version : Emfac2011-LDV V2.50.58.094 Sp: Trip Assign Santa Clara County
Run Date : 2014/10/23 14:43:37
Scen Year: 1990 -- All model years in the range 1965 to 1990 selected
Season : Annual
Area : Sacramento
*************************************************************************************
****
Year: 1990 -- Model Years 1965 to 1990 Inclusive -- Annual
Emfac2011-LDV Emission Factors: V2.50.58.094 Sp: Trip Assign Santa Clara County
County Average Sacramento County Average
Table 1: Running Exhaust Emissions (grams/mile)
Pollutant Name: Carbon Dioxide Temperature: 70F Relative Humidity: 0%
Speed
MPH LDA LDT MDT HDT UBUS MCY ALL
5 1068.033 1292.658 1827.577 2513.997 2886.175 193.385 1212.716
10 807.947 977.315 1335.637 1675.394 2652.348 165.448 911.682
15 634.448 766.955 1024.584 1179.395 2514.265 143.751 713.107
20 517.125 624.707 823.133 877.083 2430.188 126.844 579.987
25 437.464 528.122 690.973 689.737 2377.936 113.668 490.211
B - 140

Barrett Rach East Air Quality Technical Report Appendix B - 3 ESA / 140728
30 384.054 463.365 604.735 572.878 2345.383 103.447 430.322
35 349.863 421.909 550.724 502.443 2325.795 95.611 392.132
40 330.688 398.661 521.080 465.260 2315.484 89.744 370.789
45 324.285 390.897 511.750 454.847 2312.637 85.549 363.721
50 329.923 397.733 521.519 469.472 2316.770 82.819 370.103
55 348.245 419.948 551.725 511.658 2328.588 81.425 390.694
60 381.391 460.135 606.582 588.908 2350.190 81.301 427.992
65 433.419 523.218 694.228 715.973 2385.707 82.441 486.751
70 433.419 523.218 748.647 919.625 2442.630 84.899 493.978
75 433.419 523.218 836.448 1248.137 2534.469 88.791 505.637
B - 141
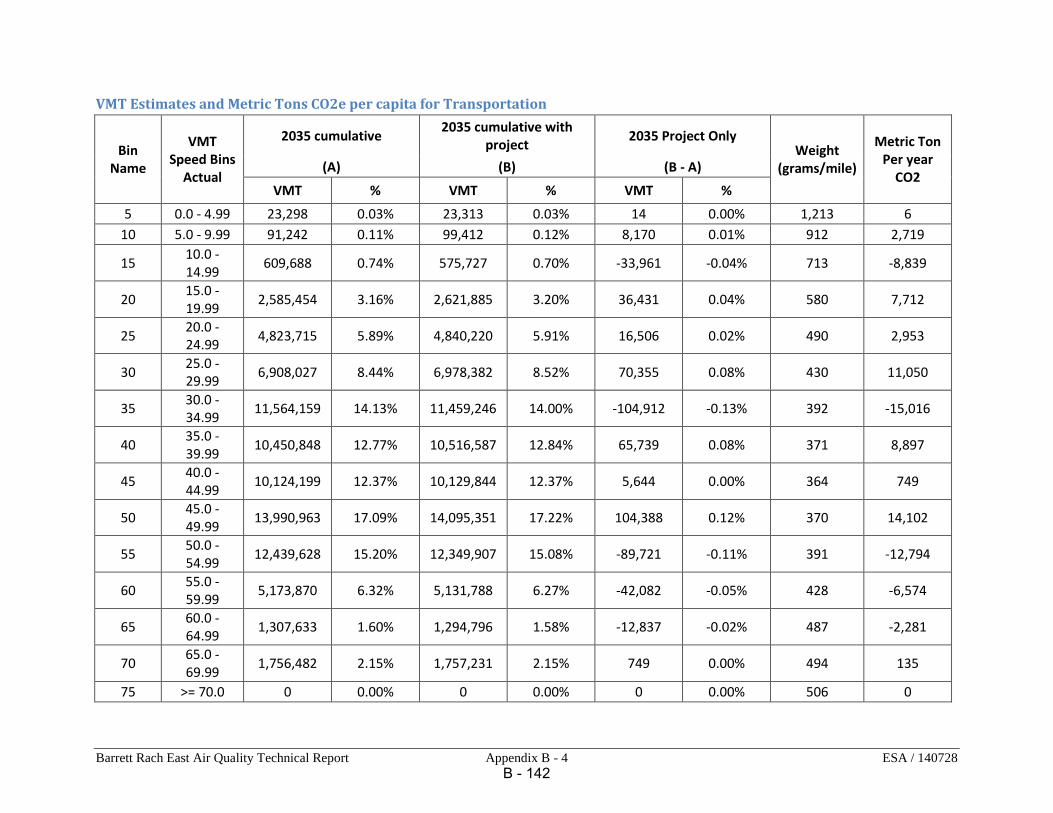
Barrett Rach East Air Quality Technical Report Appendix B - 4 ESA / 140728
VMT Estimates and Metric Tons CO2e per capita for Transportation
Bin Name
VMT Speed Bins
Actual
2035 cumulative 2035 cumulative with
project 2035 Project Only
Weight (grams/mile)
Metric Ton Per year
CO2 (A) (B) (B - A)
VMT % VMT % VMT %
5 0.0 - 4.99 23,298 0.03% 23,313 0.03% 14 0.00% 1,213 6
10 5.0 - 9.99 91,242 0.11% 99,412 0.12% 8,170 0.01% 912 2,719
15 10.0 - 14.99
609,688 0.74% 575,727 0.70% -33,961 -0.04% 713 -8,839
20 15.0 - 19.99
2,585,454 3.16% 2,621,885 3.20% 36,431 0.04% 580 7,712
25 20.0 - 24.99
4,823,715 5.89% 4,840,220 5.91% 16,506 0.02% 490 2,953
30 25.0 - 29.99
6,908,027 8.44% 6,978,382 8.52% 70,355 0.08% 430 11,050
35 30.0 - 34.99
11,564,159 14.13% 11,459,246 14.00% -104,912 -0.13% 392 -15,016
40 35.0 - 39.99
10,450,848 12.77% 10,516,587 12.84% 65,739 0.08% 371 8,897
45 40.0 - 44.99
10,124,199 12.37% 10,129,844 12.37% 5,644 0.00% 364 749
50 45.0 - 49.99
13,990,963 17.09% 14,095,351 17.22% 104,388 0.12% 370 14,102
55 50.0 - 54.99
12,439,628 15.20% 12,349,907 15.08% -89,721 -0.11% 391 -12,794
60 55.0 - 59.99
5,173,870 6.32% 5,131,788 6.27% -42,082 -0.05% 428 -6,574
65 60.0 - 64.99
1,307,633 1.60% 1,294,796 1.58% -12,837 -0.02% 487 -2,281
70 65.0 - 69.99
1,756,482 2.15% 1,757,231 2.15% 749 0.00% 494 135
75 >= 70.0 0 0.00% 0 0.00% 0 0.00% 506 0
B - 142

Barrett Rach East Air Quality Technical Report Appendix B - 5 ESA / 140728
Total MT CO2 per Year
MT CO2e per Year
Population MT per Capita
Threshold
2,820 2,961 1,845 1.60 2.64
Notes: The EMFAC2011 run was made for Sacramento County for 2020 with emission rates generated by speed. A CO2 emission rate was
estimated for each speed bin based on the percentage of vehicle miles traveled (weighted by vehicle class and fuel type) within that bin. VMT
estimates for 2035 cumulative and 2035 with project were used for the GHG estimates (2020 VMT was unavailable). The Barrett Rach East
project VMT per day is the difference between 2035 cumulative and 2035 cumulative with project. VMT per day for each speed bin was
multiplied by weighted grams/mile for that speed bin and converted to metric tons per day, which then multiplied by 365 to obtain metric tons
per year. EMFAC2011 does not include emission rates for CH4 or N20. CH4 and N20 were included in the MT of CO2e per year by multiplying
the MT of CO2 per year by 1.051
1 U.S. Environmental Protection Agency (EPA). Greenhouse Gas Emissions from a Typical Passenger Vehicle (EPA-420-F-14-040). May 2014
B - 143
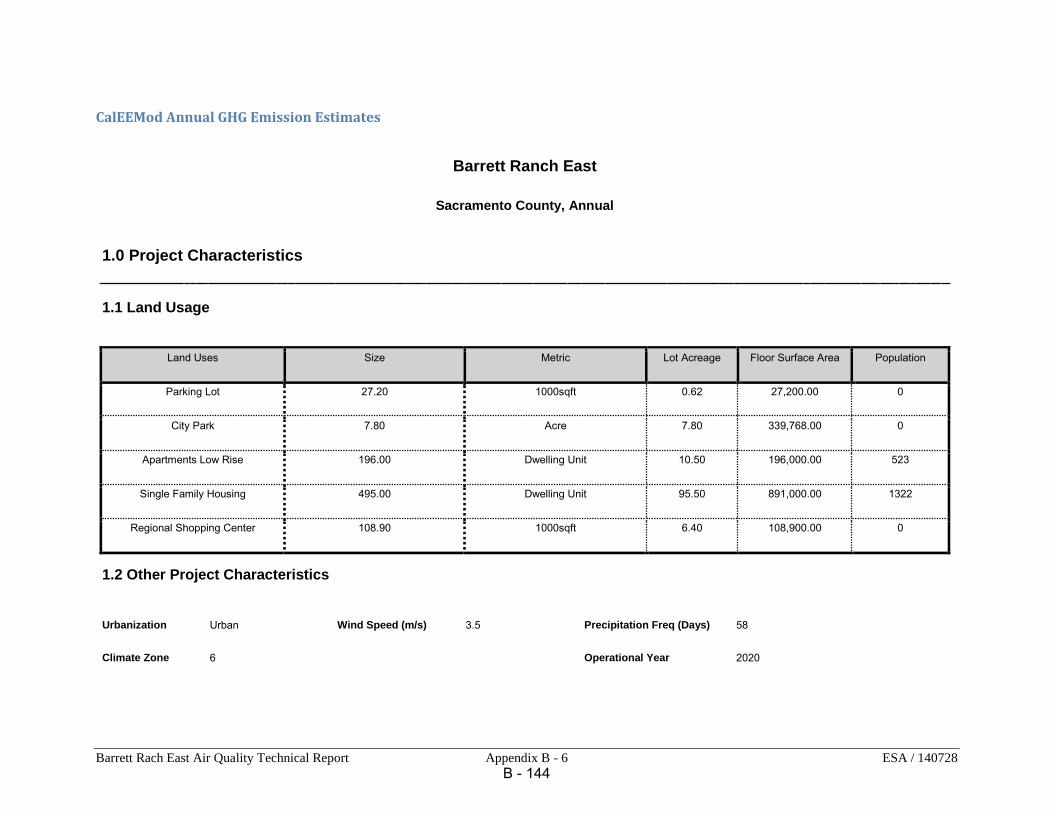
Barrett Rach East Air Quality Technical Report Appendix B - 6 ESA / 140728
CalEEMod Annual GHG Emission Estimates
Barrett Ranch East
Sacramento County, Annual
1.0 Project Characteristics
1.1 Land Usage
Land Uses Size Metric Lot Acreage Floor Surface Area Population
Parking Lot 27.20 1000sqft 0.62 27,200.00 0
City Park 7.80 Acre 7.80 339,768.00 0
Apartments Low Rise 196.00 Dwelling Unit 10.50 196,000.00 523
Single Family Housing 495.00 Dwelling Unit 95.50 891,000.00 1322
Regional Shopping Center 108.90 1000sqft 6.40 108,900.00 0
1.2 Other Project Characteristics
Urbanization
Urban
Wind Speed (m/s)
3.5
Precipitation Freq (Days)
58
Climate Zone
6
Operational Year
2020
B - 144
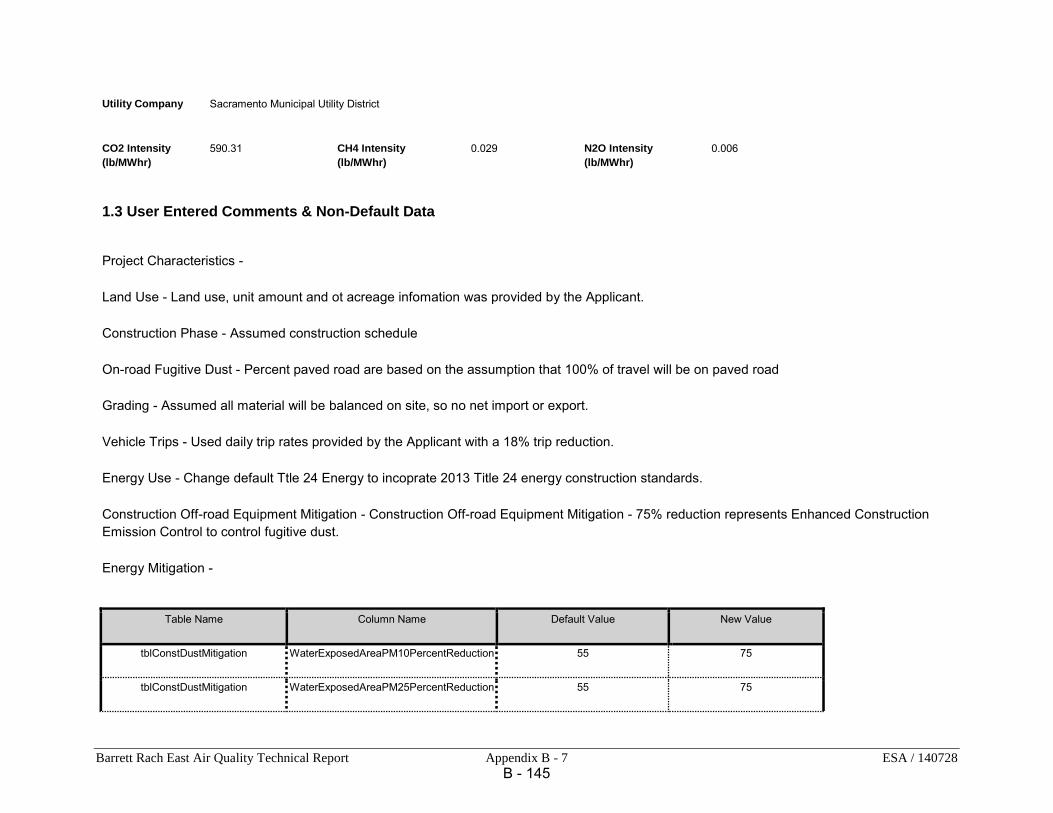
Barrett Rach East Air Quality Technical Report Appendix B - 7 ESA / 140728
Utility Company
Sacramento Municipal Utility District
CO2 Intensity
(lb/MWhr)
590.31
CH4 Intensity
(lb/MWhr)
0.029
N2O Intensity
(lb/MWhr)
0.006
1.3 User Entered Comments & Non-Default Data
Project Characteristics -
Land Use - Land use, unit amount and ot acreage infomation was provided by the Applicant.
Construction Phase - Assumed construction schedule
On-road Fugitive Dust - Percent paved road are based on the assumption that 100% of travel will be on paved road
Grading - Assumed all material will be balanced on site, so no net import or export.
Vehicle Trips - Used daily trip rates provided by the Applicant with a 18% trip reduction.
Energy Use - Change default Ttle 24 Energy to incoprate 2013 Title 24 energy construction standards.
Construction Off-road Equipment Mitigation - Construction Off-road Equipment Mitigation - 75% reduction represents Enhanced Construction Emission Control to control fugitive dust.
Energy Mitigation -
Table Name Column Name Default Value New Value
tblConstDustMitigation WaterExposedAreaPM10PercentReduction 55 75
tblConstDustMitigation WaterExposedAreaPM25PercentReduction 55 75
B - 145

Barrett Rach East Air Quality Technical Report Appendix B - 8 ESA / 140728
tblConstructionhase NumDays 220.00 59.00
tblConstructionPhase NumDays 3,100.00 815.00
tblConstructionPhase NumDays 310.00 83.00
tblConstructionPhase NumDays 220.00 58.00
tblConstructionPhase NumDays 120.00 31.00
tblEnergyUse T24E 348.18 261.14
tblEnergyUse T24E 3.98 2.99
tblEnergyUse T24E 729.62 547.22
tblEnergyUse T24NG 11,068.06 8,301.05
tblEnergyUse T24NG 4.72 3.54
tblEnergyUse T24NG 26,218.01 19,663.51
tblGrading AcresOfGrading 207.50 128.00
tblGrading AcresOfGrading 0.00 128.00
tblLandUse LotAcreage 12.25 10.50
tblLandUse LotAcreage 160.71 95.50
tblLandUse LotAcreage 2.50 6.40
tblProjectCharacteristics OperationalYear 2014 2020
tblVehicleTrips CC_TL 5.00 2.33
B - 146

Barrett Rach East Air Quality Technical Report Appendix B - 9 ESA / 140728
tblVehicleTrips CNW_TL 6.50 3.02
tblVehicleTrips CW_TL 10.00 4.65
tblVehicleTrips HO_TL 6.50 3.02
tblVehicleTrips HO_TL 6.50 3.02
tblVehicleTrips HS_TL 5.00 2.33
tblVehicleTrips HS_TL 5.00 2.33
tblVehicleTrips HW_TL 10.00 4.65
tblVehicleTrips HW_TL 10.00 4.65
tblVehicleTrips ST_TR 7.16 5.49
tblVehicleTrips ST_TR 1.59 0.00
tblVehicleTrips ST_TR 49.97 27.03
tblVehicleTrips ST_TR 10.08 7.50
tblVehicleTrips SU_TR 6.07 5.49
tblVehicleTrips SU_TR 1.59 0.00
tblVehicleTrips SU_TR 25.24 27.03
tblVehicleTrips SU_TR 8.77 7.50
tblVehicleTrips WD_TR 6.59 5.49
tblVehicleTrips WD_TR 1.59 0.00
B - 147

Barrett Rach East Air Quality Technical Report Appendix B - 10 ESA / 140728
tblVehicleTrips WD_TR 42.94 54.06
tblVehicleTrips WD_TR 9.57 7.50
2.0 Emissions Summary
ROG
NOx
CO
SO2
Fugitive
PM10
Exhaust
PM10
PM10
Total
Fugitive
PM2.5
Exhaust
PM2.5
PM2.5
Total
Bio-
CO2
NBio-
CO2
Total
CO2
CH4
N20
CO2e
Percent
Reduction
0.00
0.00
0.00
0.00
0.00
0.00
0.00
0.00
0.00
0.00
0.00
0.00
0.00
0.00
0.00
0.00
2.2 Overall Operational
Unmitigated Operational
ROG NOx CO SO2 Fugitive PM10
Exhaust PM10
PM10 Total
Fugitive PM2.5
Exhaust PM2.5
PM2.5 Total
Bio- CO2 NBio- CO2 Total CO2 CH4 N2O CO2e
Category
tons/yr MT/yr
Area
0.0000
11.6439
11.6439
0.0114
0.0000
11.8824
Energy
0.0000
2,326.7393
2,326.7393
0.0899
0.0303
2,338.0223
Mobile
0.0000
3,506.6398
3,506.6398
0.1500
0.0000
3,509.7896
Waste
138.2571
0.0000
138.2571
8.1708
0.0000
309.8432
B - 148

Barrett Rach East Air Quality Technical Report Appendix B - 11 ESA / 140728
Water
18.7826
110.7692
129.5518
0.0701
0.0420
144.0349
Total 157.0397
5,955.7921
6,112.8319
8.4921
0.0723
6,313.5724
B - 149
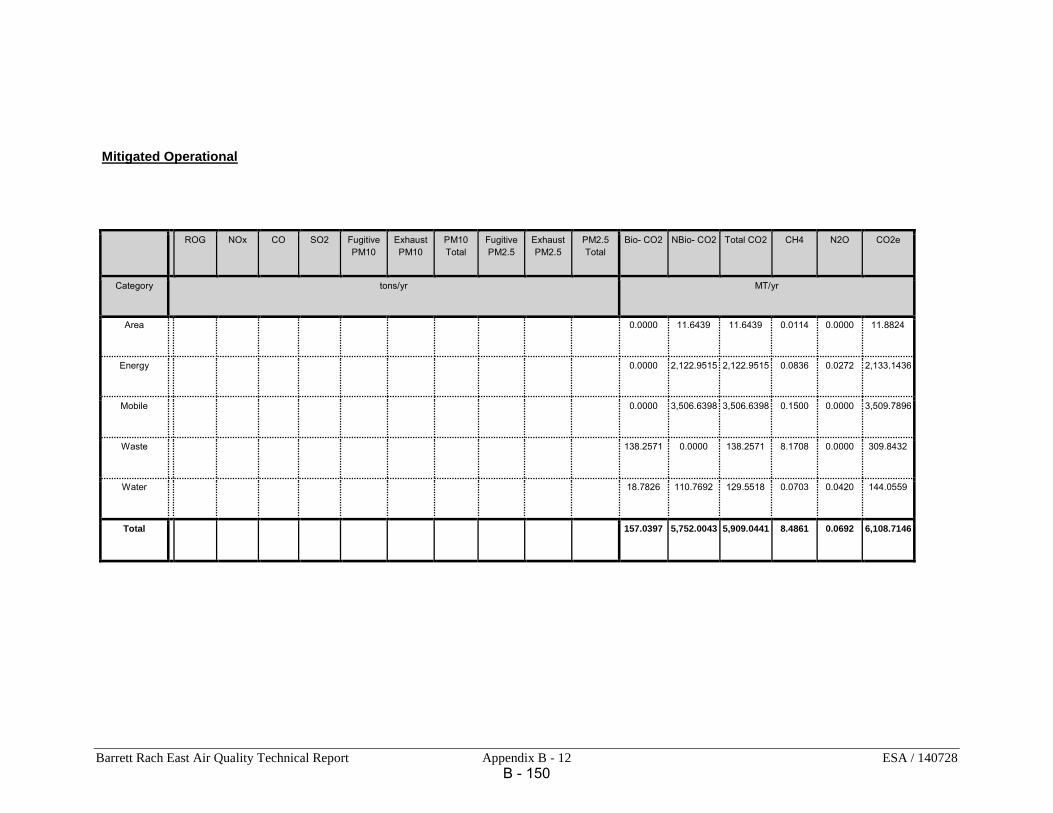
Barrett Rach East Air Quality Technical Report Appendix B - 12 ESA / 140728
Mitigated Operational
ROG NOx CO SO2 Fugitive PM10
Exhaust PM10
PM10 Total
Fugitive PM2.5
Exhaust PM2.5
PM2.5 Total
Bio- CO2 NBio- CO2 Total CO2 CH4 N2O CO2e
Category
tons/yr MT/yr
Area
0.0000
11.6439
11.6439
0.0114
0.0000
11.8824
Energy
0.0000
2,122.9515
2,122.9515
0.0836
0.0272
2,133.1436
Mobile
0.0000
3,506.6398
3,506.6398
0.1500
0.0000
3,509.7896
Waste
138.2571
0.0000
138.2571
8.1708
0.0000
309.8432
Water
18.7826
110.7692
129.5518
0.0703
0.0420
144.0559
Total 157.0397
5,752.0043
5,909.0441
8.4861
0.0692
6,108.7146
B - 150

Barrett Rach East Air Quality Technical Report Appendix B - 13 ESA / 140728
ROG
NOx
CO
SO2
Fugitive
PM10
Exhaust
PM10
PM10
Total
Fugitive
PM2.5
Exhaust
PM2.5
PM2.5
Total
Bio-
CO2
NBio-
CO2
Total
CO2
CH4
N20
CO2e
Percent
Reduction
0.00
0.00
0.00
0.00
0.00
0.00
0.00
0.00
0.00
0.00
0.00
3.42
3.33
0.07
4.22
3.24
3.0 Construction Detail
Construction Phase
Phase Number
Phase Name Phase Type Start Date End Date Num Days Week
Num Days
Phase Description
1 Site Preparation Site Preparation 1/1/2016 2/12/2016 5 31
2 Grading Grading 2/13/2016 6/8/2016 5 83
3 Building Construction Building Construction 6/9/2016 7/24/2019 5 815
4 Paving Paving 7/25/2019 10/14/2019 5 58
5 Architectural Coating Architectural Coating 10/15/2019 1/3/2020 5 59
Acres of Grading (Site Preparation Phase): 128
Acres of Grading (Grading Phase): 128
B - 151

Barrett Rach East Air Quality Technical Report Appendix B - 14 ESA / 140728
Acres of Paving: 0
Residential Indoor: 2,201,175; Residential Outdoor: 733,725; Non-Residential Indoor: 674,226; Non-Residential Outdoor:
224,742 (Architectural Coating – sqft)
OffRoad Equipment
Phase Name Offroad Equipment Type Amount Usage Hours Horse Power Load Factor
Site Preparation Rubber Tired Dozers 3 8.00 255 0.40
Site Preparation Tractors/Loaders/Backhoes 4 8.00 97 0.37
Grading Excavators 2 8.00 162 0.38
Grading Graders 1 8.00 174 0.41
Grading Rubber Tired Dozers 1 8.00 255 0.40
Grading Scrapers 2 8.00 361 0.48
Grading Tractors/Loaders/Backhoes 2 8.00 97 0.37
Building Construction Cranes 1 7.00 226 0.29
Building Construction Forklifts 3 8.00 89 0.20
Building Construction Generator Sets 1 8.00 84 0.74
Building Construction Tractors/Loaders/Backhoes 3 7.00 97 0.37
Building Construction Welders 1 8.00 46 0.45
B - 152

Barrett Rach East Air Quality Technical Report Appendix B - 15 ESA / 140728
Paving Pavers 2 8.00 125 0.42
Paving Paving Equipment 2 8.00 130 0.36
Paving Rollers 2 8.00 80 0.38
Architectural Coating Air Compressors 1 6.00 78 0.48
Trips and VMT
Phase Name
Offroad Equipment Count
Worker Trip Number
Vendor Trip Number
Hauling Trip
Number
Worker Trip Length
Vendor Trip Length
Hauling Trip Length
Worker Vehicle Class
Vendor Vehicle Class
Hauling Vehicle Class
Site Preparation
7
18.00
0.00
0.00
10.00
6.50
20.00
LD_Mix
HDT_Mix
HHDT
Grading
8
20.00
0.00
0.00
10.00
6.50
20.00
LD_Mix
HDT_Mix
HHDT
Building Construction
9
508.00
152.00
0.00
10.00
6.50
20.00
LD_Mix
HDT_Mix
HHDT
Paving
6
15.00
0.00
0.00
10.00
6.50
20.00
LD_Mix
HDT_Mix
HHDT
Architectural Coating
1
102.00
0.00
0.00
10.00
6.50
20.00
LD_Mix
HDT_Mix
HHDT
3.1 Mitigation Measures Construction
Water Exposed Area
Reduce Vehicle Speed on Unpaved Roads
Clean Paved Roads
3.2 Site Preparation - 2016
B - 153
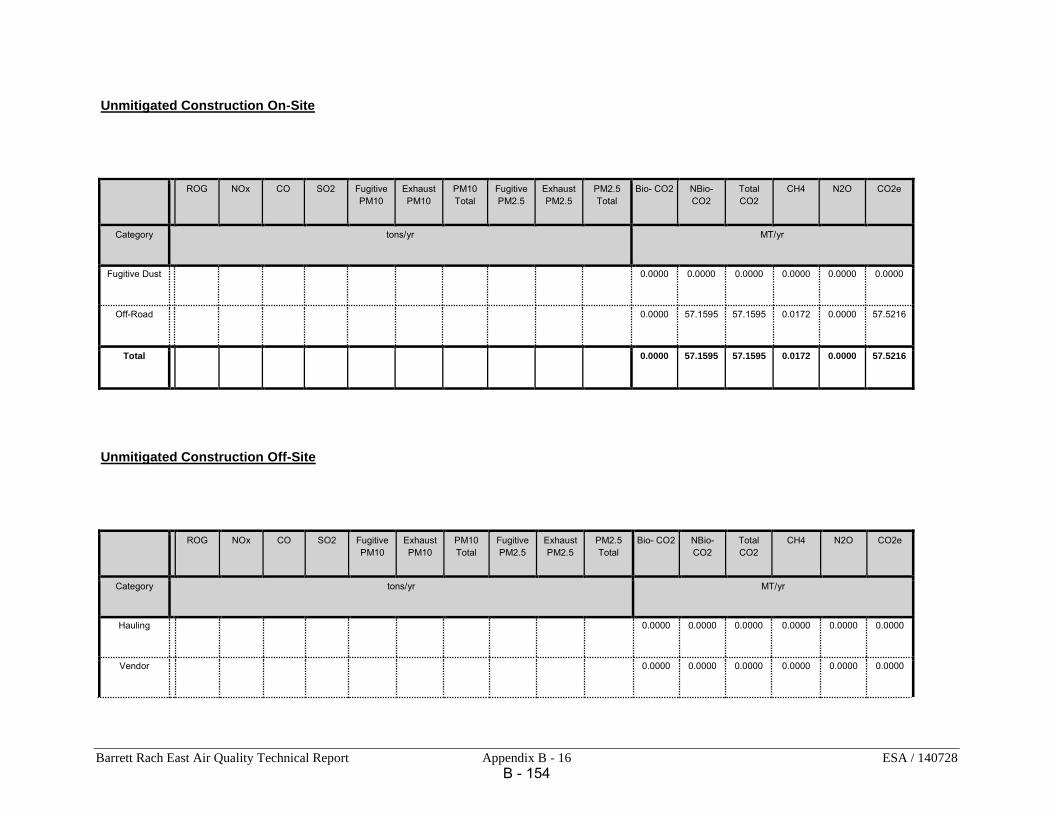
Barrett Rach East Air Quality Technical Report Appendix B - 16 ESA / 140728
Unmitigated Construction On-Site
ROG NOx CO SO2 Fugitive PM10
Exhaust PM10
PM10 Total
Fugitive PM2.5
Exhaust PM2.5
PM2.5 Total
Bio- CO2 NBio- CO2
Total CO2
CH4 N2O CO2e
Category
tons/yr MT/yr
Fugitive Dust
0.0000
0.0000
0.0000
0.0000
0.0000
0.0000
Off-Road
0.0000
57.1595
57.1595
0.0172
0.0000
57.5216
Total 0.0000
57.1595
57.1595
0.0172
0.0000
57.5216
Unmitigated Construction Off-Site
ROG NOx CO SO2 Fugitive PM10
Exhaust PM10
PM10 Total
Fugitive PM2.5
Exhaust PM2.5
PM2.5 Total
Bio- CO2 NBio- CO2
Total CO2
CH4 N2O CO2e
Category
tons/yr MT/yr
Hauling
0.0000
0.0000
0.0000
0.0000
0.0000
0.0000
Vendor
0.0000
0.0000
0.0000
0.0000
0.0000
0.0000
B - 154
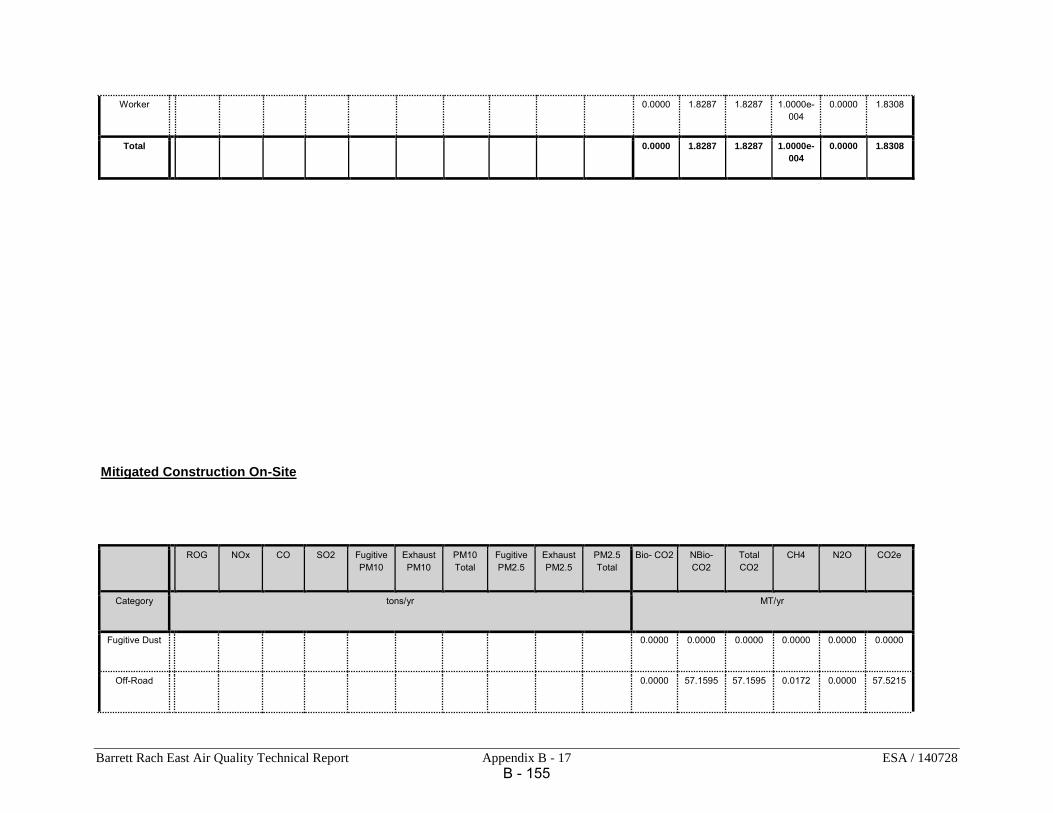
Barrett Rach East Air Quality Technical Report Appendix B - 17 ESA / 140728
Worker
0.0000
1.8287
1.8287
1.0000e-004
0.0000
1.8308
Total 0.0000
1.8287
1.8287
1.0000e-
004
0.0000
1.8308
Mitigated Construction On-Site
ROG NOx CO SO2 Fugitive PM10
Exhaust PM10
PM10 Total
Fugitive PM2.5
Exhaust PM2.5
PM2.5 Total
Bio- CO2 NBio- CO2
Total CO2
CH4 N2O CO2e
Category
tons/yr MT/yr
Fugitive Dust
0.0000
0.0000
0.0000
0.0000
0.0000
0.0000
Off-Road
0.0000
57.1595
57.1595
0.0172
0.0000
57.5215
B - 155

Barrett Rach East Air Quality Technical Report Appendix B - 18 ESA / 140728
Total 0.0000
57.1595
57.1595
0.0172
0.0000
57.5215
Mitigated Construction Off-Site
ROG NOx CO SO2 Fugitive PM10
Exhaust PM10
PM10 Total
Fugitive PM2.5
Exhaust PM2.5
PM2.5 Total
Bio- CO2 NBio- CO2
Total CO2
CH4 N2O CO2e
Category
tons/yr MT/yr
Hauling
0.0000
0.0000
0.0000
0.0000
0.0000
0.0000
Vendor
0.0000
0.0000
0.0000
0.0000
0.0000
0.0000
B - 156

Barrett Rach East Air Quality Technical Report Appendix B - 19 ESA / 140728
Worker
0.0000
1.8287
1.8287
1.0000e-004
0.0000
1.8308
Total 0.0000
1.8287
1.8287
1.0000e-
004
0.0000
1.8308
3.3 Grading - 2016
Unmitigated Construction On-Site
ROG NOx CO SO2 Fugitive PM10
Exhaust PM10
PM10 Total
Fugitive PM2.5
Exhaust PM2.5
PM2.5 Total
Bio- CO2 NBio- CO2
Total CO2 CH4 N2O CO2e
Category
tons/yr MT/yr
Fugitive Dust
0.0000
0.0000
0.0000
0.0000
0.0000
0.0000
Off-Road
0.0000
241.5123
241.5123
0.0729
0.0000
243.0421
B - 157

Barrett Rach East Air Quality Technical Report Appendix B - 20 ESA / 140728
Total 0.0000
241.5123
241.5123
0.0729
0.0000
243.0421
Unmitigated Construction Off-Site
ROG NOx CO SO2 Fugitive PM10
Exhaust PM10
PM10 Total
Fugitive PM2.5
Exhaust PM2.5
PM2.5 Total
Bio- CO2 NBio- CO2
Total CO2
CH4 N2O CO2e
Category
tons/yr MT/yr
Hauling
0.0000
0.0000
0.0000
0.0000
0.0000
0.0000
Vendor
0.0000
0.0000
0.0000
0.0000
0.0000
0.0000
B - 158

Barrett Rach East Air Quality Technical Report Appendix B - 21 ESA / 140728
Worker
0.0000
5.4403
5.4403
2.9000e-004
0.0000
5.4464
Total 0.0000
5.4403
5.4403
2.9000e-
004
0.0000
5.4464
Mitigated Construction On-Site
ROG NOx CO SO2 Fugitive PM10
Exhaust PM10
PM10 Total
Fugitive PM2.5
Exhaust PM2.5
PM2.5 Total
Bio- CO2 NBio- CO2
Total CO2 CH4 N2O CO2e
Category
tons/yr MT/yr
Fugitive Dust
0.0000
0.0000
0.0000
0.0000
0.0000
0.0000
Off-Road
0.0000
241.5120
241.5120
0.0729
0.0000
243.0418
B - 159

Barrett Rach East Air Quality Technical Report Appendix B - 22 ESA / 140728
Total 0.0000
241.5120
241.5120
0.0729
0.0000
243.0418
Mitigated Construction Off-Site
ROG NOx CO SO2 Fugitive PM10
Exhaust PM10
PM10 Total
Fugitive PM2.5
Exhaust PM2.5
PM2.5 Total
Bio- CO2 NBio- CO2
Total CO2
CH4 N2O CO2e
Category
tons/yr MT/yr
Hauling
0.0000
0.0000
0.0000
0.0000
0.0000
0.0000
Vendor
0.0000
0.0000
0.0000
0.0000
0.0000
0.0000
B - 160
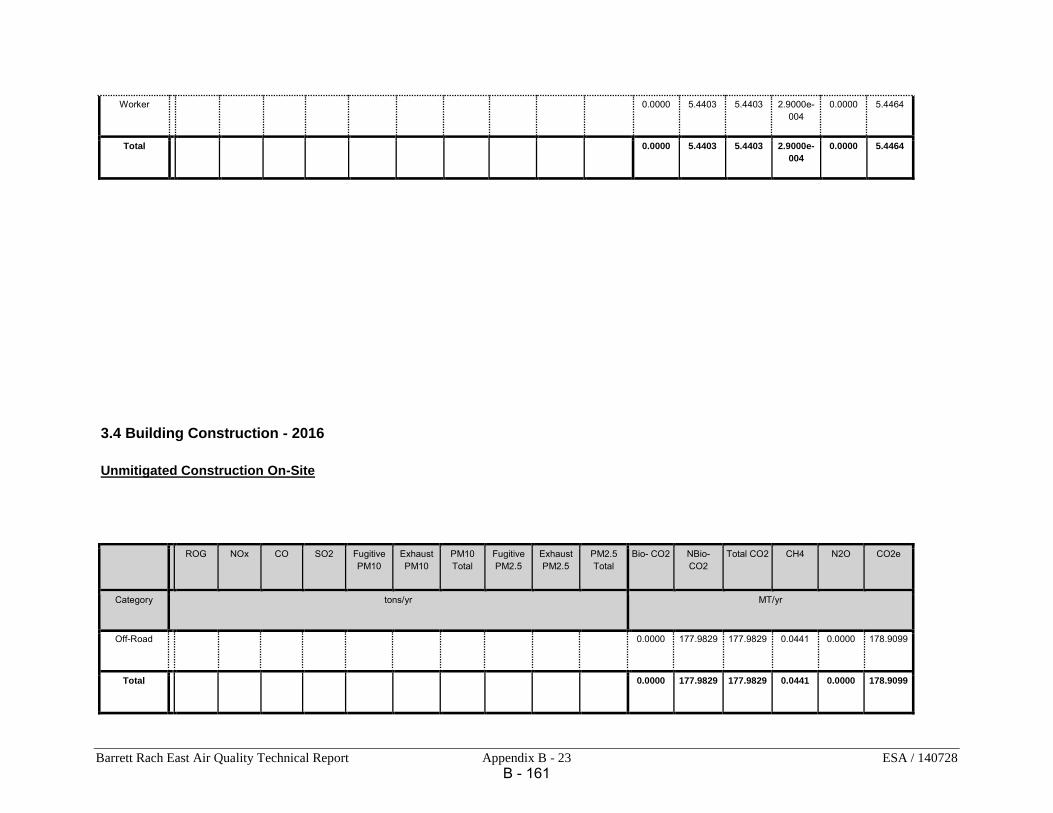
Barrett Rach East Air Quality Technical Report Appendix B - 23 ESA / 140728
Worker
0.0000
5.4403
5.4403
2.9000e-004
0.0000
5.4464
Total 0.0000
5.4403
5.4403
2.9000e-
004
0.0000
5.4464
3.4 Building Construction - 2016
Unmitigated Construction On-Site
ROG NOx CO SO2 Fugitive PM10
Exhaust PM10
PM10 Total
Fugitive PM2.5
Exhaust PM2.5
PM2.5 Total
Bio- CO2 NBio- CO2
Total CO2 CH4 N2O CO2e
Category
tons/yr MT/yr
Off-Road
0.0000
177.9829
177.9829
0.0441
0.0000
178.9099
Total 0.0000
177.9829
177.9829
0.0441
0.0000
178.9099
B - 161

Barrett Rach East Air Quality Technical Report Appendix B - 24 ESA / 140728
Unmitigated Construction Off-Site
ROG NOx CO SO2 Fugitive PM10
Exhaust PM10
PM10 Total
Fugitive PM2.5
Exhaust PM2.5
PM2.5 Total
Bio- CO2 NBio- CO2
Total CO2 CH4 N2O CO2e
Category
tons/yr MT/yr
Hauling
0.0000
0.0000
0.0000
0.0000
0.0000
0.0000
Vendor
0.0000
210.8291
210.8291
1.6900e-003
0.0000
210.8645
B - 162

Barrett Rach East Air Quality Technical Report Appendix B - 25 ESA / 140728
Worker
0.0000
244.7340
244.7340
0.0131
0.0000
245.0087
Total 0.0000
455.5631
455.5631
0.0148
0.0000
455.8732
Mitigated Construction On-Site
ROG NOx CO SO2 Fugitive PM10
Exhaust PM10
PM10 Total
Fugitive PM2.5
Exhaust PM2.5
PM2.5 Total
Bio- CO2 NBio- CO2
Total CO2 CH4 N2O CO2e
Category
tons/yr MT/yr
Off-Road
0.0000
177.9827
177.9827
0.0441
0.0000
178.9097
Total 0.0000
177.9827
177.9827
0.0441
0.0000
178.9097
B - 163

Barrett Rach East Air Quality Technical Report Appendix B - 26 ESA / 140728
Mitigated Construction Off-Site
ROG NOx CO SO2 Fugitive PM10
Exhaust PM10
PM10 Total
Fugitive PM2.5
Exhaust PM2.5
PM2.5 Total
Bio- CO2 NBio- CO2
Total CO2 CH4 N2O CO2e
Category
tons/yr MT/yr
Hauling
0.0000
0.0000
0.0000
0.0000
0.0000
0.0000
Vendor
0.0000
210.8291
210.8291
1.6900e-003
0.0000
210.8645
B - 164

Barrett Rach East Air Quality Technical Report Appendix B - 27 ESA / 140728
Worker
0.0000
244.7340
244.7340
0.0131
0.0000
245.0087
Total 0.0000
455.5631
455.5631
0.0148
0.0000
455.8732
3.4 Building Construction - 2017
Unmitigated Construction On-Site
ROG NOx CO SO2 Fugitive PM10
Exhaust PM10
PM10 Total
Fugitive PM2.5
Exhaust PM2.5
PM2.5 Total
Bio- CO2 NBio- CO2
Total CO2 CH4 N2O CO2e
Category
tons/yr MT/yr
Off-Road
0.0000
311.3228
311.3228
0.0766
0.0000
312.9319
Total 0.0000
311.3228
311.3228
0.0766
0.0000
312.9319
B - 165

Barrett Rach East Air Quality Technical Report Appendix B - 28 ESA / 140728
Unmitigated Construction Off-Site
ROG NOx CO SO2 Fugitive PM10
Exhaust PM10
PM10 Total
Fugitive PM2.5
Exhaust PM2.5
PM2.5 Total
Bio- CO2 NBio- CO2
Total CO2 CH4 N2O CO2e
Category
tons/yr MT/yr
Hauling
0.0000
0.0000
0.0000
0.0000
0.0000
0.0000
Vendor
0.0000
366.6143
366.6143
2.7800e-003
0.0000
366.6727
B - 166

Barrett Rach East Air Quality Technical Report Appendix B - 29 ESA / 140728
Worker
0.0000
415.7387
415.7387
0.0211
0.0000
416.1820
Total 0.0000
782.3530
782.3530
0.0239
0.0000
782.8547
Mitigated Construction On-Site
ROG NOx CO SO2 Fugitive PM10
Exhaust PM10
PM10 Total
Fugitive PM2.5
Exhaust PM2.5
PM2.5 Total
Bio- CO2 NBio- CO2
Total CO2 CH4 N2O CO2e
Category
tons/yr MT/yr
Off-Road
0.0000
311.3225
311.3225
0.0766
0.0000
312.9315
Total 0.0000
311.3225
311.3225
0.0766
0.0000
312.9315
B - 167

Barrett Rach East Air Quality Technical Report Appendix B - 30 ESA / 140728
Mitigated Construction Off-Site
ROG NOx CO SO2 Fugitive PM10
Exhaust PM10
PM10 Total
Fugitive PM2.5
Exhaust PM2.5
PM2.5 Total
Bio- CO2 NBio- CO2
Total CO2 CH4 N2O CO2e
Category
tons/yr MT/yr
Hauling
0.0000
0.0000
0.0000
0.0000
0.0000
0.0000
Vendor
0.0000
366.6143
366.6143
2.7800e-003
0.0000
366.6727
B - 168

Barrett Rach East Air Quality Technical Report Appendix B - 31 ESA / 140728
Worker
0.0000
415.7387
415.7387
0.0211
0.0000
416.1820
Total 0.0000
782.3530
782.3530
0.0239
0.0000
782.8547
3.4 Building Construction - 2018
Unmitigated Construction On-Site
ROG NOx CO SO2 Fugitive PM10
Exhaust PM10
PM10 Total
Fugitive PM2.5
Exhaust PM2.5
PM2.5 Total
Bio- CO2 NBio- CO2
Total CO2 CH4 N2O CO2e
Category
tons/yr MT/yr
Off-Road
0.0000
308.9844
308.9844
0.0756
0.0000
310.5723
Total 0.0000
308.9844
308.9844
0.0756
0.0000
310.5723
B - 169

Barrett Rach East Air Quality Technical Report Appendix B - 32 ESA / 140728
Unmitigated Construction Off-Site
ROG NOx CO SO2 Fugitive PM10
Exhaust PM10
PM10 Total
Fugitive PM2.5
Exhaust PM2.5
PM2.5 Total
Bio- CO2 NBio- CO2
Total CO2 CH4 N2O CO2e
Category
tons/yr MT/yr
Hauling
0.0000
0.0000
0.0000
0.0000
0.0000
0.0000
Vendor
0.0000
361.2264
361.2264
2.7200e-003
0.0000
361.2836
B - 170

Barrett Rach East Air Quality Technical Report Appendix B - 33 ESA / 140728
Worker
0.0000
401.5615
401.5615
0.0195
0.0000
401.9710
Total 0.0000
762.7879
762.7879
0.0222
0.0000
763.2546
Mitigated Construction On-Site
ROG NOx CO SO2 Fugitive PM10
Exhaust PM10
PM10 Total
Fugitive PM2.5
Exhaust PM2.5
PM2.5 Total
Bio- CO2 NBio- CO2
Total CO2 CH4 N2O CO2e
Category
tons/yr MT/yr
Off-Road
0.0000
308.9841
308.9841
0.0756
0.0000
310.5720
Total 0.0000
308.9841
308.9841
0.0756
0.0000
310.5720
B - 171

Barrett Rach East Air Quality Technical Report Appendix B - 34 ESA / 140728
Mitigated Construction Off-Site
ROG NOx CO SO2 Fugitive PM10
Exhaust PM10
PM10 Total
Fugitive PM2.5
Exhaust PM2.5
PM2.5 Total
Bio- CO2 NBio- CO2
Total CO2 CH4 N2O CO2e
Category
tons/yr MT/yr
Hauling
0.0000
0.0000
0.0000
0.0000
0.0000
0.0000
Vendor
0.0000
361.2264
361.2264
2.7200e-003
0.0000
361.2836
B - 172

Barrett Rach East Air Quality Technical Report Appendix B - 35 ESA / 140728
Worker
0.0000
401.5615
401.5615
0.0195
0.0000
401.9710
Total 0.0000
762.7879
762.7879
0.0222
0.0000
763.2546
3.4 Building Construction - 2019
Unmitigated Construction On-Site
ROG NOx CO SO2 Fugitive PM10
Exhaust PM10
PM10 Total
Fugitive PM2.5
Exhaust PM2.5
PM2.5 Total
Bio- CO2 NBio- CO2
Total CO2 CH4 N2O CO2e
Category
tons/yr MT/yr
Off-Road
0.0000
172.0802
172.0802
0.0419
0.0000
172.9595
Total 0.0000
172.0802
172.0802
0.0419
0.0000
172.9595
B - 173

Barrett Rach East Air Quality Technical Report Appendix B - 36 ESA / 140728
Unmitigated Construction Off-Site
ROG NOx CO SO2 Fugitive PM10
Exhaust PM10
PM10 Total
Fugitive PM2.5
Exhaust PM2.5
PM2.5 Total
Bio- CO2 NBio- CO2
Total CO2 CH4 N2O CO2e
Category
tons/yr MT/yr
Hauling
0.0000
0.0000
0.0000
0.0000
0.0000
0.0000
Vendor
0.0000
200.1529
200.1529
1.4900e-003
0.0000
200.1842
B - 174

Barrett Rach East Air Quality Technical Report Appendix B - 37 ESA / 140728
Worker
0.0000
217.0061
217.0061
0.0102
0.0000
217.2206
Total 0.0000
417.1590
417.1590
0.0117
0.0000
417.4049
Mitigated Construction On-Site
ROG NOx CO SO2 Fugitive PM10
Exhaust PM10
PM10 Total
Fugitive PM2.5
Exhaust PM2.5
PM2.5 Total
Bio- CO2 NBio- CO2
Total CO2 CH4 N2O CO2e
Category
tons/yr MT/yr
Off-Road
0.0000
172.0800
172.0800
0.0419
0.0000
172.9593
Total 0.0000
172.0800
172.0800
0.0419
0.0000
172.9593
B - 175
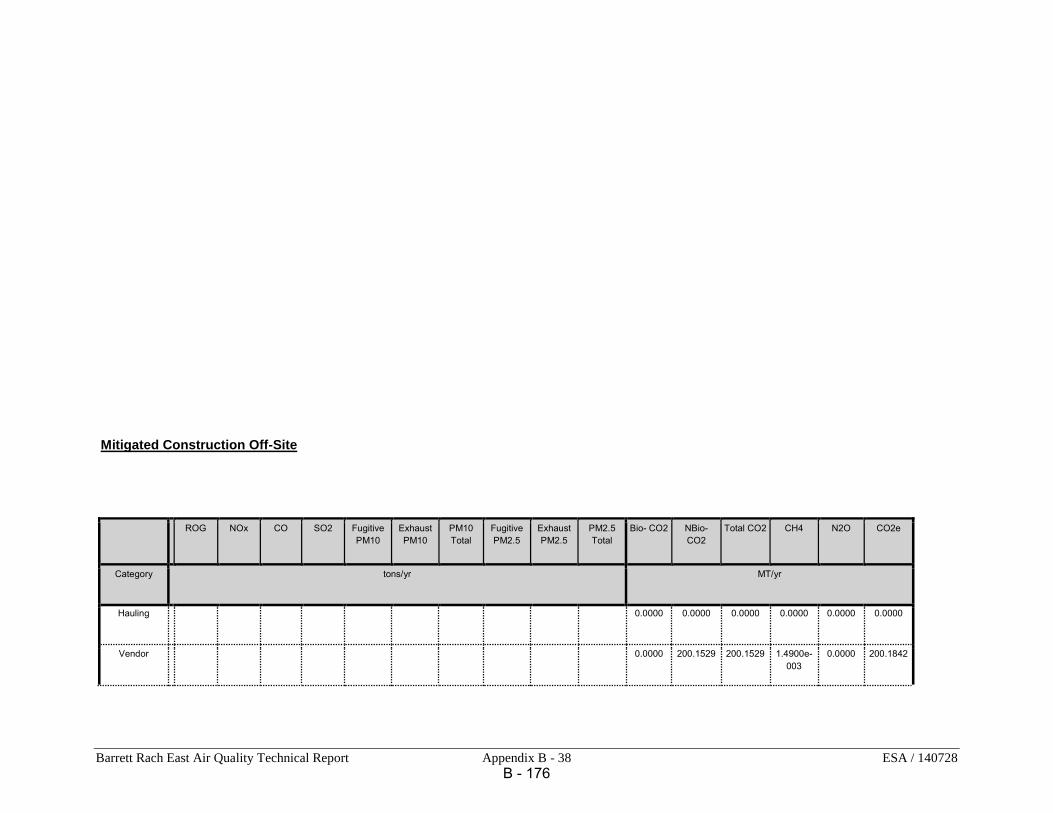
Barrett Rach East Air Quality Technical Report Appendix B - 38 ESA / 140728
Mitigated Construction Off-Site
ROG NOx CO SO2 Fugitive PM10
Exhaust PM10
PM10 Total
Fugitive PM2.5
Exhaust PM2.5
PM2.5 Total
Bio- CO2 NBio- CO2
Total CO2 CH4 N2O CO2e
Category
tons/yr MT/yr
Hauling
0.0000
0.0000
0.0000
0.0000
0.0000
0.0000
Vendor
0.0000
200.1529
200.1529
1.4900e-003
0.0000
200.1842
B - 176

Barrett Rach East Air Quality Technical Report Appendix B - 39 ESA / 140728
Worker
0.0000
217.0061
217.0061
0.0102
0.0000
217.2206
Total 0.0000
417.1590
417.1590
0.0117
0.0000
417.4049
3.5 Paving - 2019
Unmitigated Construction On-Site
ROG NOx CO SO2 Fugitive PM10
Exhaust PM10
PM10 Total
Fugitive PM2.5
Exhaust PM2.5
PM2.5 Total
Bio- CO2 NBio- CO2
Total CO2
CH4 N2O CO2e
Category
tons/yr MT/yr
Off-Road
0.0000
58.1145
58.1145
0.0184
0.0000
58.5006
Paving
0.0000
0.0000
0.0000
0.0000
0.0000
0.0000
B - 177
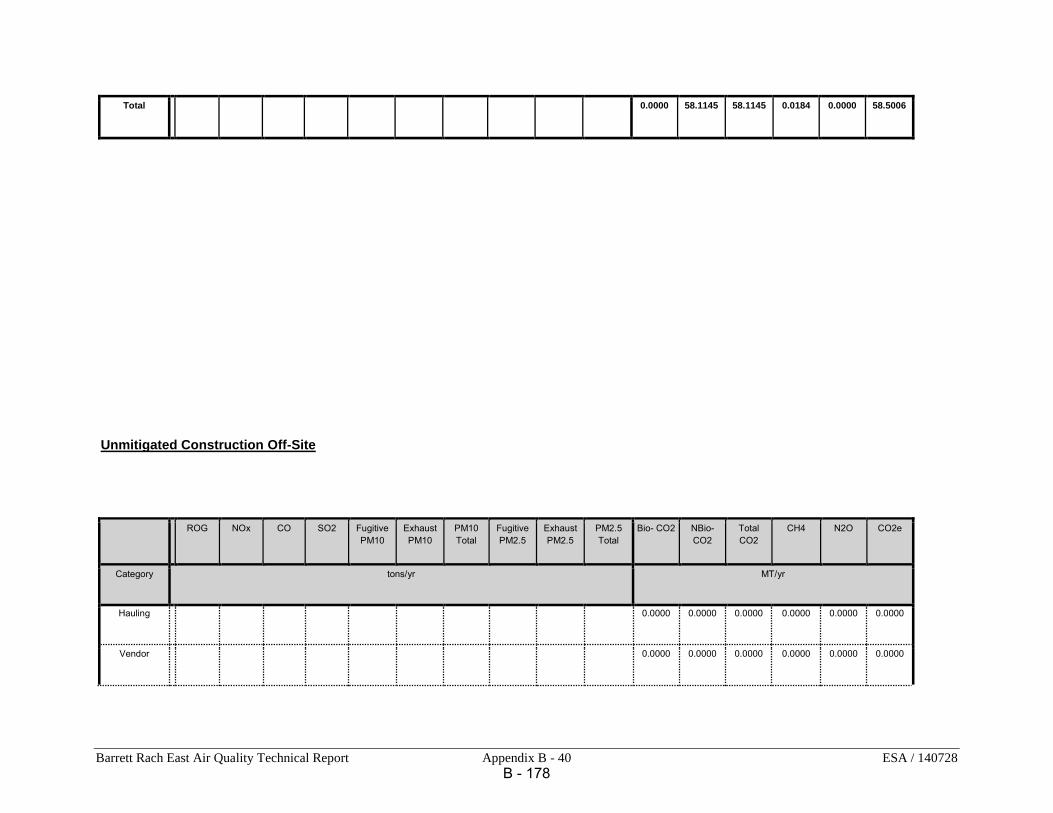
Barrett Rach East Air Quality Technical Report Appendix B - 40 ESA / 140728
Total 0.0000
58.1145
58.1145
0.0184
0.0000
58.5006
Unmitigated Construction Off-Site
ROG NOx CO SO2 Fugitive PM10
Exhaust PM10
PM10 Total
Fugitive PM2.5
Exhaust PM2.5
PM2.5 Total
Bio- CO2 NBio- CO2
Total CO2
CH4 N2O CO2e
Category
tons/yr MT/yr
Hauling
0.0000
0.0000
0.0000
0.0000
0.0000
0.0000
Vendor
0.0000
0.0000
0.0000
0.0000
0.0000
0.0000
B - 178

Barrett Rach East Air Quality Technical Report Appendix B - 41 ESA / 140728
Worker
0.0000
2.5282
2.5282
1.2000e-004
0.0000
2.5307
Total 0.0000
2.5282
2.5282
1.2000e-
004
0.0000
2.5307
Mitigated Construction On-Site
ROG NOx CO SO2 Fugitive PM10
Exhaust PM10
PM10 Total
Fugitive PM2.5
Exhaust PM2.5
PM2.5 Total
Bio- CO2 NBio- CO2
Total CO2
CH4 N2O CO2e
Category
tons/yr MT/yr
Off-Road
0.0000
58.1144
58.1144
0.0184
0.0000
58.5005
Paving
0.0000
0.0000
0.0000
0.0000
0.0000
0.0000
B - 179

Barrett Rach East Air Quality Technical Report Appendix B - 42 ESA / 140728
Total 0.0000
58.1144
58.1144
0.0184
0.0000
58.5005
Mitigated Construction Off-Site
ROG NOx CO SO2 Fugitive PM10
Exhaust PM10
PM10 Total
Fugitive PM2.5
Exhaust PM2.5
PM2.5 Total
Bio- CO2 NBio- CO2
Total CO2
CH4 N2O CO2e
Category
tons/yr MT/yr
Hauling
0.0000
0.0000
0.0000
0.0000
0.0000
0.0000
Vendor
0.0000
0.0000
0.0000
0.0000
0.0000
0.0000
B - 180
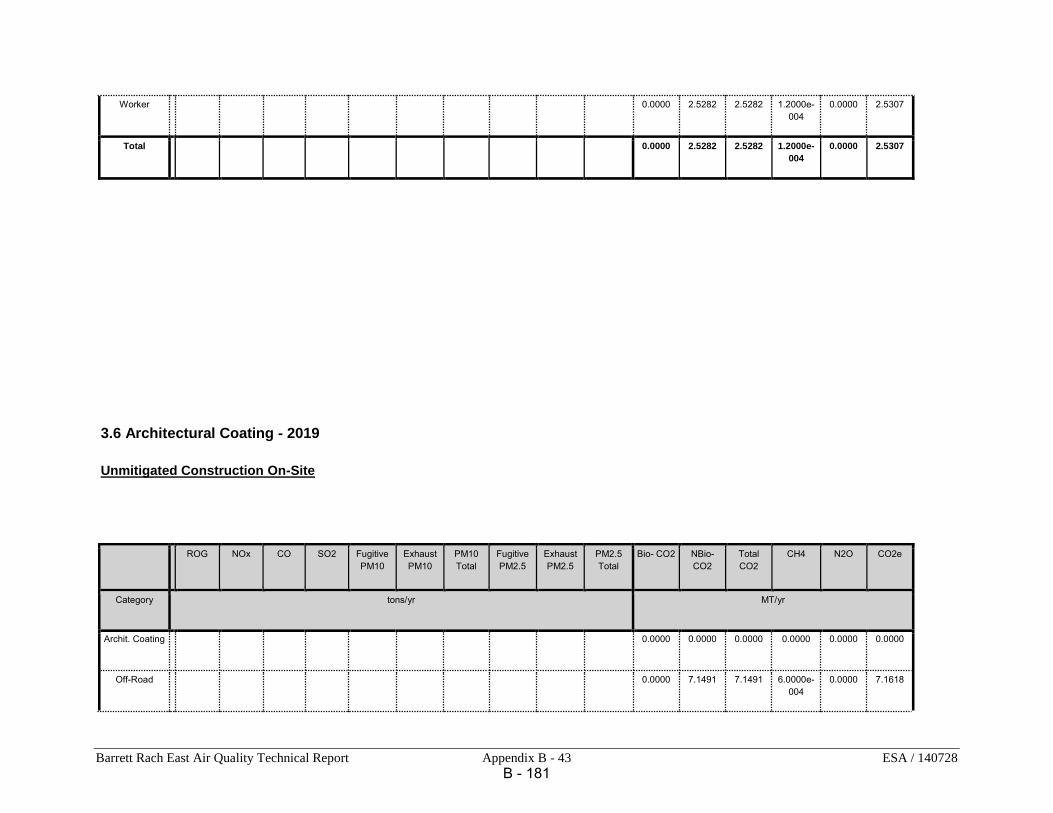
Barrett Rach East Air Quality Technical Report Appendix B - 43 ESA / 140728
Worker
0.0000
2.5282
2.5282
1.2000e-004
0.0000
2.5307
Total 0.0000
2.5282
2.5282
1.2000e-
004
0.0000
2.5307
3.6 Architectural Coating - 2019
Unmitigated Construction On-Site
ROG NOx CO SO2 Fugitive PM10
Exhaust PM10
PM10 Total
Fugitive PM2.5
Exhaust PM2.5
PM2.5 Total
Bio- CO2 NBio- CO2
Total CO2
CH4 N2O CO2e
Category
tons/yr MT/yr
Archit. Coating
0.0000
0.0000
0.0000
0.0000
0.0000
0.0000
Off-Road
0.0000
7.1491
7.1491
6.0000e-004
0.0000
7.1618
B - 181
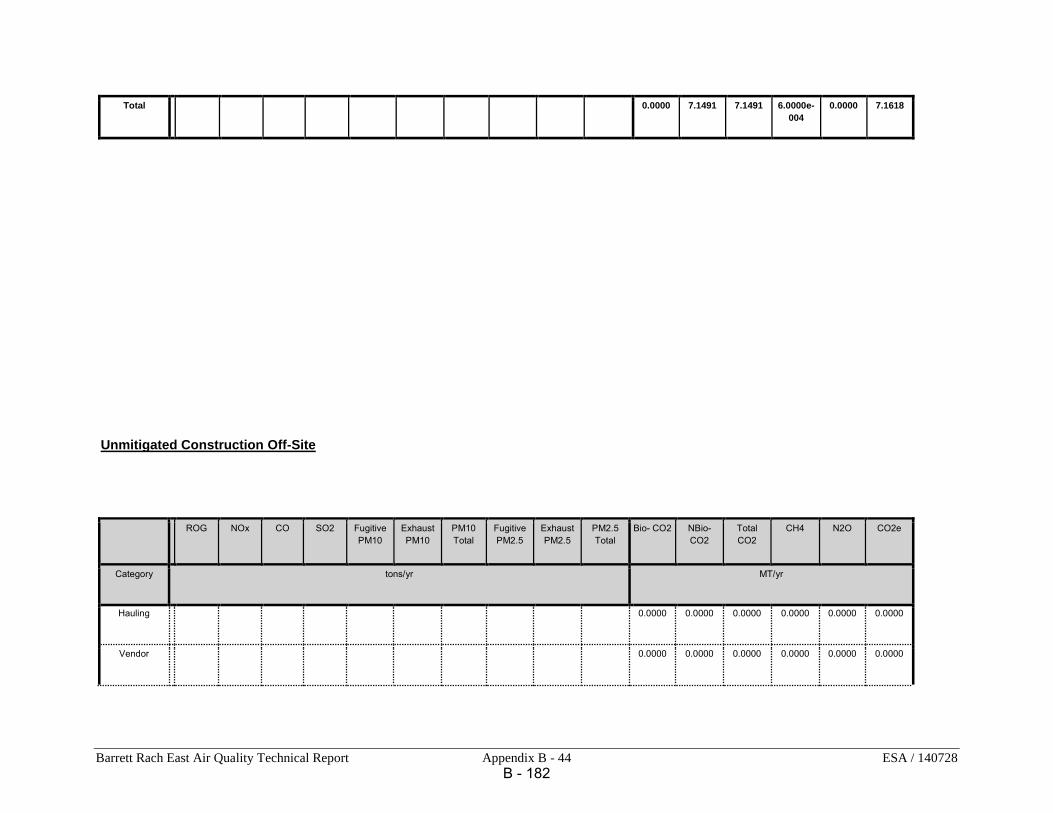
Barrett Rach East Air Quality Technical Report Appendix B - 44 ESA / 140728
Total 0.0000
7.1491
7.1491
6.0000e-
004
0.0000
7.1618
Unmitigated Construction Off-Site
ROG NOx CO SO2 Fugitive PM10
Exhaust PM10
PM10 Total
Fugitive PM2.5
Exhaust PM2.5
PM2.5 Total
Bio- CO2 NBio- CO2
Total CO2
CH4 N2O CO2e
Category
tons/yr MT/yr
Hauling
0.0000
0.0000
0.0000
0.0000
0.0000
0.0000
Vendor
0.0000
0.0000
0.0000
0.0000
0.0000
0.0000
B - 182
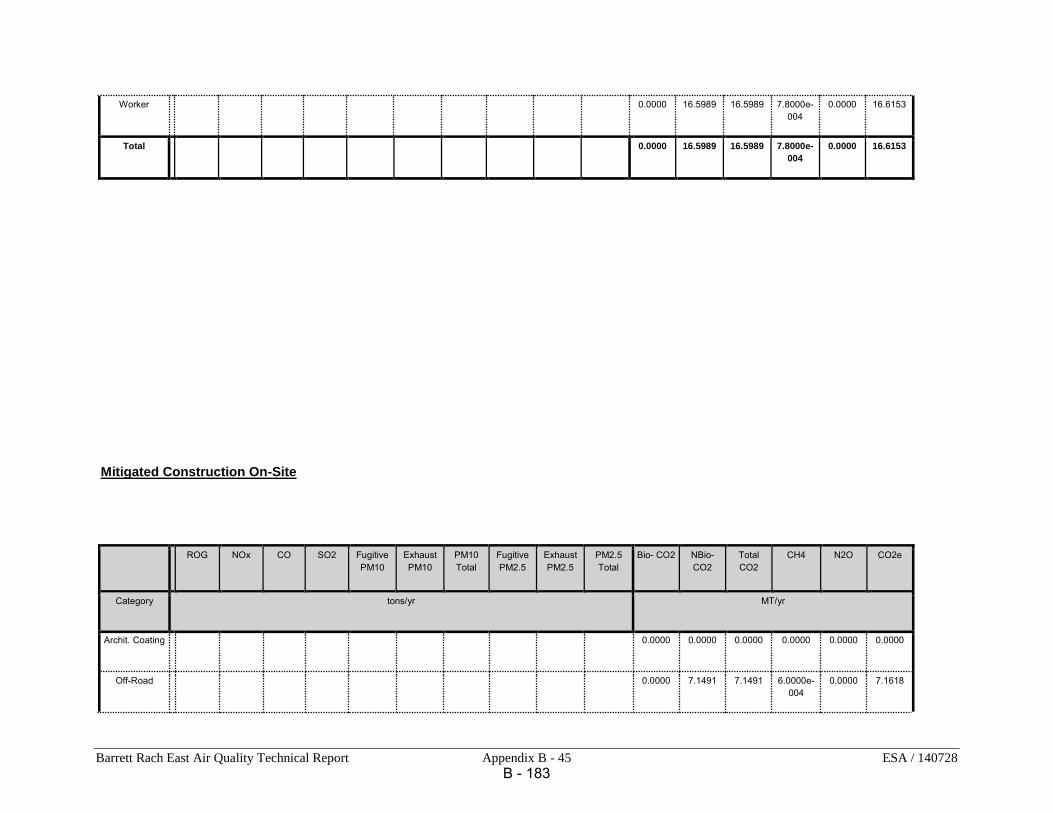
Barrett Rach East Air Quality Technical Report Appendix B - 45 ESA / 140728
Worker
0.0000
16.5989
16.5989
7.8000e-004
0.0000
16.6153
Total 0.0000
16.5989
16.5989
7.8000e-
004
0.0000
16.6153
Mitigated Construction On-Site
ROG NOx CO SO2 Fugitive PM10
Exhaust PM10
PM10 Total
Fugitive PM2.5
Exhaust PM2.5
PM2.5 Total
Bio- CO2 NBio- CO2
Total CO2
CH4 N2O CO2e
Category
tons/yr MT/yr
Archit. Coating
0.0000
0.0000
0.0000
0.0000
0.0000
0.0000
Off-Road
0.0000
7.1491
7.1491
6.0000e-004
0.0000
7.1618
B - 183

Barrett Rach East Air Quality Technical Report Appendix B - 46 ESA / 140728
Total 0.0000
7.1491
7.1491
6.0000e-
004
0.0000
7.1618
Mitigated Construction Off-Site
ROG NOx CO SO2 Fugitive PM10
Exhaust PM10
PM10 Total
Fugitive PM2.5
Exhaust PM2.5
PM2.5 Total
Bio- CO2 NBio- CO2
Total CO2
CH4 N2O CO2e
Category
tons/yr MT/yr
Hauling
0.0000
0.0000
0.0000
0.0000
0.0000
0.0000
Vendor
0.0000
0.0000
0.0000
0.0000
0.0000
0.0000
B - 184

Barrett Rach East Air Quality Technical Report Appendix B - 47 ESA / 140728
Worker
0.0000
16.5989
16.5989
7.8000e-004
0.0000
16.6153
Total 0.0000
16.5989
16.5989
7.8000e-
004
0.0000
16.6153
3.6 Architectural Coating - 2020
Unmitigated Construction On-Site
ROG NOx CO SO2 Fugitive PM10
Exhaust PM10
PM10 Total
Fugitive PM2.5
Exhaust PM2.5
PM2.5 Total
Bio- CO2 NBio- CO2
Total CO2
CH4 N2O CO2e
Category
tons/yr MT/yr
Archit. Coating
0.0000
0.0000
0.0000
0.0000
0.0000
0.0000
Off-Road
0.0000
0.3830
0.3830
3.0000e-005
0.0000
0.3836
B - 185

Barrett Rach East Air Quality Technical Report Appendix B - 48 ESA / 140728
Total 0.0000
0.3830
0.3830
3.0000e-
005
0.0000
0.3836
Unmitigated Construction Off-Site
ROG NOx CO SO2 Fugitive PM10
Exhaust PM10
PM10 Total
Fugitive PM2.5
Exhaust PM2.5
PM2.5 Total
Bio- CO2 NBio- CO2
Total CO2
CH4 N2O CO2e
Category
tons/yr MT/yr
Hauling
0.0000
0.0000
0.0000
0.0000
0.0000
0.0000
Vendor
0.0000
0.0000
0.0000
0.0000
0.0000
0.0000
B - 186

Barrett Rach East Air Quality Technical Report Appendix B - 49 ESA / 140728
Worker
0.0000
0.8540
0.8540
4.0000e-005
0.0000
0.8549
Total 0.0000
0.8540
0.8540
4.0000e-
005
0.0000
0.8549
Mitigated Construction On-Site
ROG NOx CO SO2 Fugitive PM10
Exhaust PM10
PM10 Total
Fugitive PM2.5
Exhaust PM2.5
PM2.5 Total
Bio- CO2 NBio- CO2
Total CO2
CH4 N2O CO2e
Category
tons/yr MT/yr
Archit. Coating
0.0000
0.0000
0.0000
0.0000
0.0000
0.0000
Off-Road
0.0000
0.3830
0.3830
3.0000e-005
0.0000
0.3836
B - 187
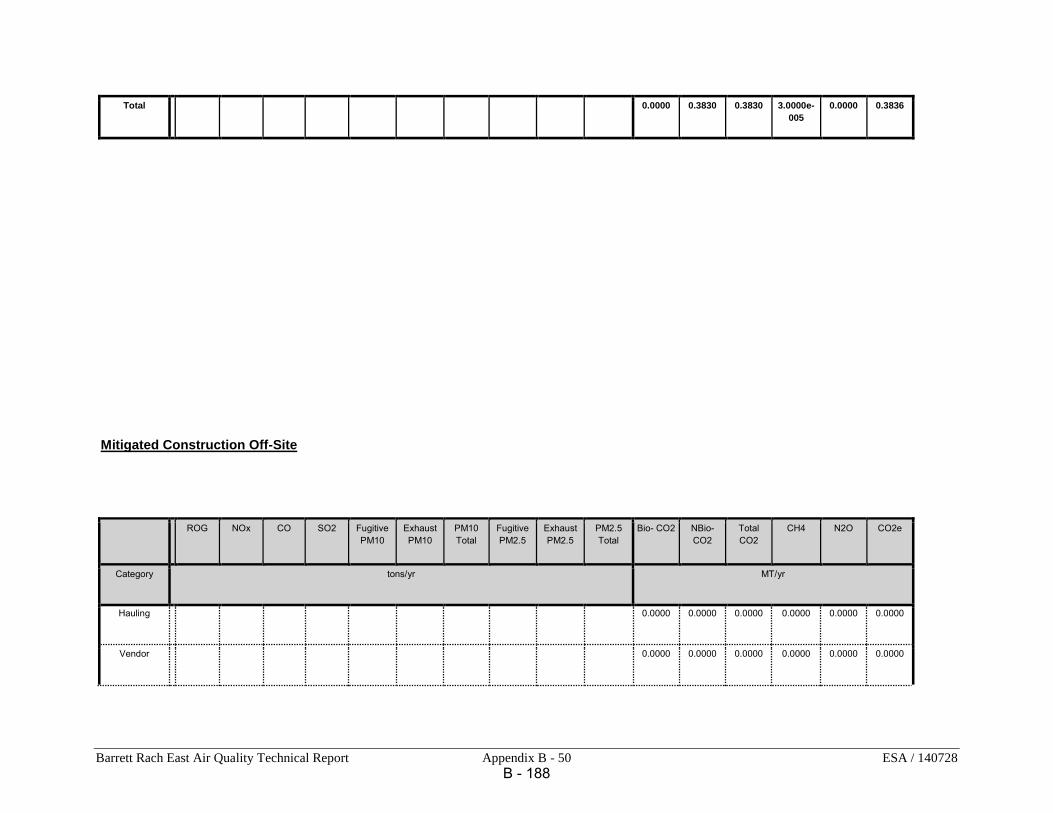
Barrett Rach East Air Quality Technical Report Appendix B - 50 ESA / 140728
Total 0.0000
0.3830
0.3830
3.0000e-
005
0.0000
0.3836
Mitigated Construction Off-Site
ROG NOx CO SO2 Fugitive PM10
Exhaust PM10
PM10 Total
Fugitive PM2.5
Exhaust PM2.5
PM2.5 Total
Bio- CO2 NBio- CO2
Total CO2
CH4 N2O CO2e
Category
tons/yr MT/yr
Hauling
0.0000
0.0000
0.0000
0.0000
0.0000
0.0000
Vendor
0.0000
0.0000
0.0000
0.0000
0.0000
0.0000
B - 188
Barrett Rach East Air Quality Technical Report Appendix B - 51 ESA / 140728
Worker
0.0000
0.8540
0.8540
4.0000e-005
0.0000
0.8549
Total 0.0000
0.8540
0.8540
4.0000e-
005
0.0000
0.8549
4.0 Operational Detail - Mobile
4.1 Mitigation Measures Mobile
B - 189

Barrett Rach East Air Quality Technical Report Appendix B - 52 ESA / 140728
ROG NOx CO SO2 Fugitive PM10
Exhaust PM10
PM10 Total
Fugitive PM2.5
Exhaust PM2.5
PM2.5 Total
Bio- CO2 NBio- CO2 Total CO2 CH4 N2O CO2e
Category
tons/yr MT/yr
Mitigated
0.0000
3,506.6398
3,506.6398
0.1500
0.0000
3,509.7896
Unmitigated
0.0000
3,506.6398
3,506.6398
0.1500
0.0000
3,509.7896
4.2 Trip Summary Information
Average Daily Trip Rate Unmitigated Mitigated
Land Use Weekday Saturday Sunday Annual VMT Annual VMT
Apartments Low Rise 1,076.04 1,076.04 1076.04 1,284,464 1,284,464
City Park 0.00 0.00 0.00
Parking Lot 0.00 0.00 0.00
Regional Shopping Center 5,887.13 2,943.57 2943.57 3,292,688 3,292,688
Single Family Housing 3,712.50 3,712.50 3712.50 4,431,595 4,431,595
Total 10,675.67 7,732.11 7,732.11 9,008,747 9,008,747
B - 190

Barrett Rach East Air Quality Technical Report Appendix B - 53 ESA / 140728
4.3 Trip Type Information
Miles Trip % Trip Purpose %
Land Use H-W or C-W H-S or C-C H-O or C-NW
H-W or C-W
H-S or C-C H-O or C-NW Primary Diverted Pass-by
Apartments Low Rise
4.65
2.33
3.02
46.50
12.50
41.00
86
11
3
City Park
10.00
5.00
6.50
33.00
48.00
19.00
66
28
6
Parking Lot
10.00
5.00
6.50
0.00
0.00
0.00
0
0
0
Regional Shopping Center
4.65
2.33
3.02
16.30
64.70
19.00
54
35
11
Single Family Housing
4.65
2.33
3.02
46.50
12.50
41.00
86
11
3
LDA LDT1 LDT2 MDV LHD1 LHD2 MHD HHD OBUS UBUS MCY SBUS MH
0.503605 0.067800 0.178973 0.146934 0.044621 0.006359 0.021238 0.016884 0.002315 0.002275 0.006260 0.000554 0.002182
5.0 Energy Detail
4.4 Fleet Mix
Historical Energy Use: N
5.1 Mitigation Measures Energy
Exceed Title 24
B - 191

Barrett Rach East Air Quality Technical Report Appendix B - 54 ESA / 140728
Install High Efficiency Lighting
ROG NOx CO SO2 Fugitive PM10
Exhaust PM10
PM10 Total
Fugitive PM2.5
Exhaust PM2.5
PM2.5 Total
Bio- CO2 NBio- CO2 Total CO2 CH4 N2O CO2e
Category
tons/yr MT/yr
Electricity Mitigated
0.0000
1,433.2320
1,433.2320
0.0704
0.0146
1,439.2265
Electricity Unmitigated
0.0000
1,511.6581
1,511.6581
0.0743
0.0154
1,517.9807
NaturalGas Mitigated
0.0000
689.7195
689.7195
0.0132
0.0126
693.9170
NaturalGas Unmitigated
0.0000
815.0812
815.0812
0.0156
0.0149
820.0417
B - 192

Barrett Rach East Air Quality Technical Report Appendix B - 55 ESA / 140728
5.2 Energy by Land Use - NaturalGas
Unmitigated
NaturalGas Use ROG NOx CO SO2 Fugitive
PM10 Exhaust PM10
PM10 Total
Fugitive PM2.5
Exhaust PM2.5
PM2.5 Total
Bio- CO2 NBio- CO2
Total CO2 CH4 N2O CO2e
Land Use
kBTU/yr tons/yr MT/yr
City Park
0
0.0000
0.0000
0.0000
0.0000
0.0000
0.0000
Parking Lot
0
0.0000
0.0000
0.0000
0.0000
0.0000
0.0000
Regional Shopping
Center
486783
0.0000
25.9766
25.9766
5.0000e-004
4.8000e-004
26.1347
Single Family Housing
1.26706e+007
0.0000
676.1541
676.1541
0.0130
0.0124
680.2690
Apartments Low Rise
2.11661e+006
0.0000
112.9506
112.9506
2.1600e-003
2.0700e-003
113.6380
Total 0.0000
815.0812
815.0812
0.0156
0.0150
820.0417
B - 193

Barrett Rach East Air Quality Technical Report Appendix B - 56 ESA / 140728
Mitigated
NaturalGas Use ROG NOx CO SO2 Fugitive
PM10 Exhaust PM10
PM10 Total
Fugitive PM2.5
Exhaust PM2.5
PM2.5 Total
Bio- CO2 NBio- CO2
Total CO2 CH4 N2O CO2e
Land Use
kBTU/yr tons/yr MT/yr
Parking Lot
0
0.0000
0.0000
0.0000
0.0000
0.0000
0.0000
Regional Shopping
Center
409682
0.0000
21.8622
21.8622
4.2000e-004
4.0000e-004
21.9952
Single Family Housing
1.0724e+007
0.0000
572.2714
572.2714
0.0110
0.0105
575.7542
Apartments Low Rise
1.79121e+006
0.0000
95.5859
95.5859
1.8300e-003
1.7500e-003
96.1677
City Park
0
0.0000
0.0000
0.0000
0.0000
0.0000
0.0000
Total 0.0000
689.7195
689.7195
0.0132
0.0126
693.9170
B - 194
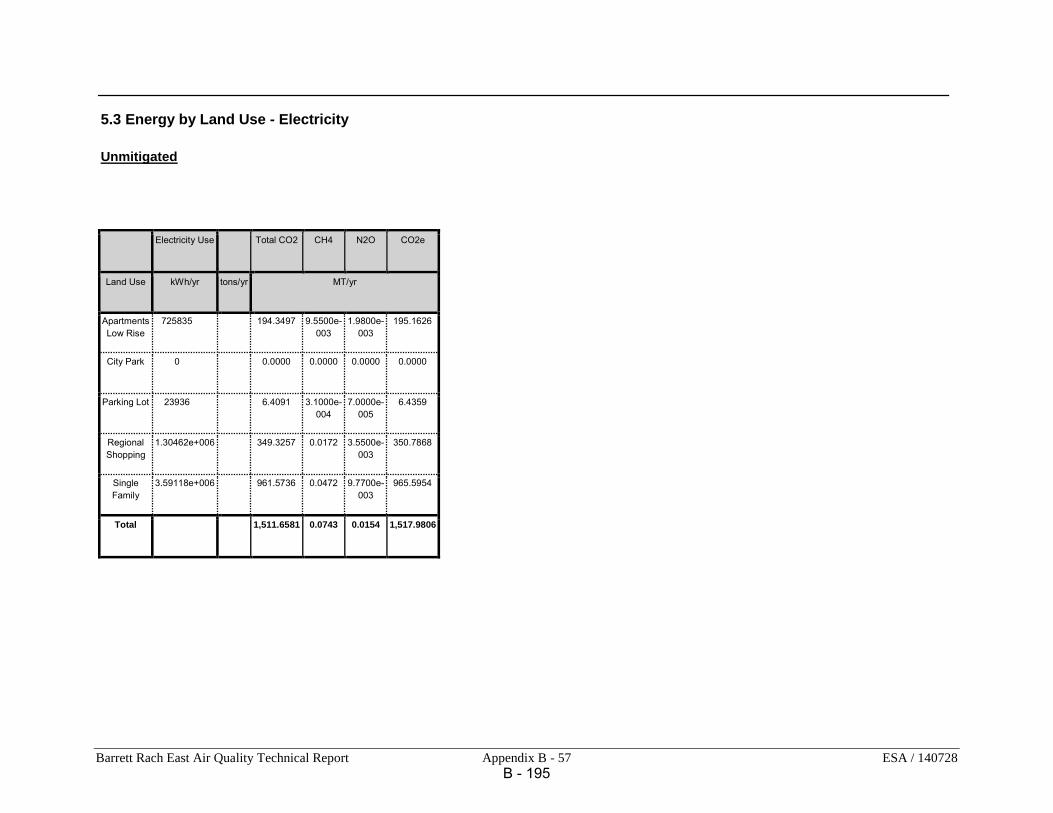
Barrett Rach East Air Quality Technical Report Appendix B - 57 ESA / 140728
5.3 Energy by Land Use - Electricity
Unmitigated
Electricity Use Total CO2 CH4 N2O CO2e
Land Use
kWh/yr tons/yr MT/yr
Apartments Low Rise
725835
194.3497
9.5500e-003
1.9800e-003
195.1626
City Park
0
0.0000
0.0000
0.0000
0.0000
Parking Lot
23936
6.4091
3.1000e-004
7.0000e-005
6.4359
Regional Shopping
Center
1.30462e+006
349.3257
0.0172
3.5500e-003
350.7868
Single Family
Housing
3.59118e+006
961.5736
0.0472
9.7700e-003
965.5954
Total 1,511.6581
0.0743
0.0154
1,517.9806
B - 195
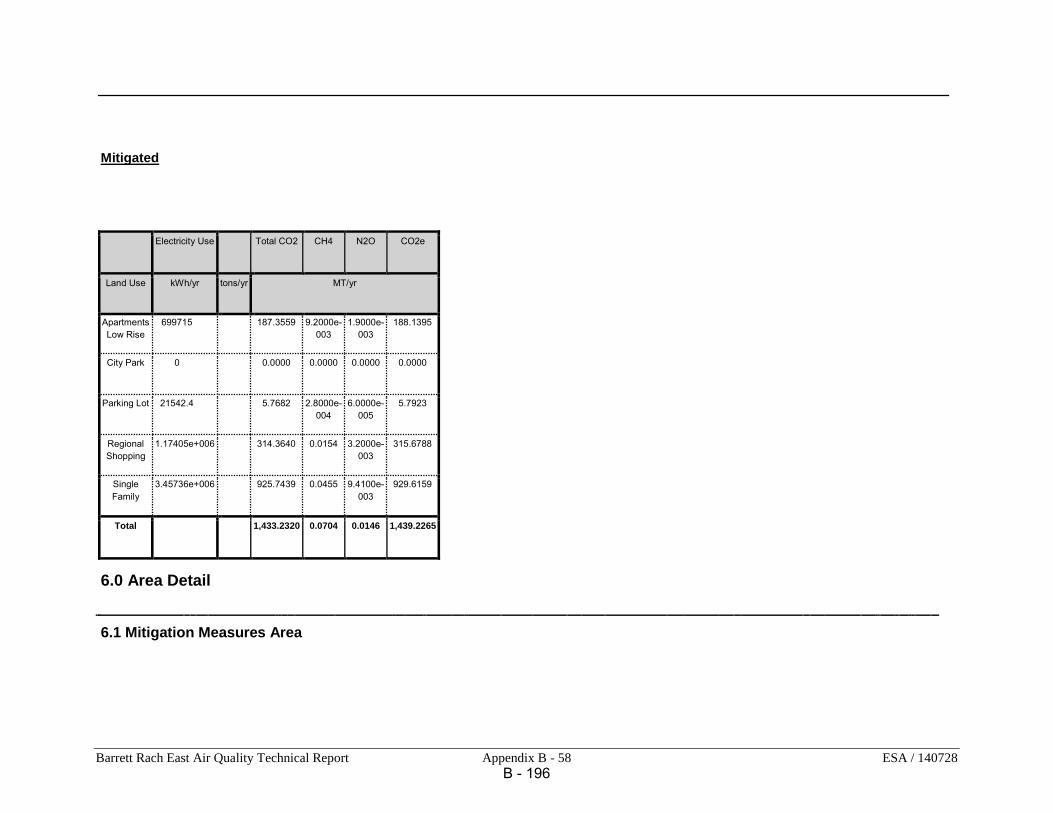
Barrett Rach East Air Quality Technical Report Appendix B - 58 ESA / 140728
Mitigated
Electricity Use Total CO2 CH4 N2O CO2e
Land Use
kWh/yr tons/yr MT/yr
Apartments Low Rise
699715
187.3559
9.2000e-003
1.9000e-003
188.1395
City Park
0
0.0000
0.0000
0.0000
0.0000
Parking Lot
21542.4
5.7682
2.8000e-004
6.0000e-005
5.7923
Regional Shopping
Center
1.17405e+006
314.3640
0.0154
3.2000e-003
315.6788
Single Family
Housing
3.45736e+006
925.7439
0.0455
9.4100e-003
929.6159
Total 1,433.2320
0.0704
0.0146
1,439.2265
6.0 Area Detail
6.1 Mitigation Measures Area
B - 196

Barrett Rach East Air Quality Technical Report Appendix B - 59 ESA / 140728
ROG NOx CO SO2 Fugitive PM10
Exhaust PM10
PM10 Total
Fugitive PM2.5
Exhaust PM2.5
PM2.5 Total
Bio- CO2 NBio- CO2
Total CO2
CH4 N2O CO2e
Category
tons/yr MT/yr
Mitigated
0.0000
11.6439
11.6439
0.0114
0.0000
11.8824
Unmitigated
0.0000
11.6439
11.6439
0.0114
0.0000
11.8824
6.2 Area by SubCategory
Unmitigated
ROG NOx CO SO2 Fugitive PM10
Exhaust PM10
PM10 Total
Fugitive PM2.5
Exhaust PM2.5
PM2.5 Total
Bio- CO2 NBio- CO2
Total CO2
CH4 N2O CO2e
SubCategory
tons/yr MT/yr
Architectural Coating
0.0000
0.0000
0.0000
0.0000
0.0000
0.0000
Consumer Products
0.0000
0.0000
0.0000
0.0000
0.0000
0.0000
Hearth
0.0000
0.0000
0.0000
0.0000
0.0000
0.0000
Landscaping
0.0000
11.6439
11.6439
0.0114
0.0000
11.8824
B - 197

Barrett Rach East Air Quality Technical Report Appendix B - 60 ESA / 140728
Total 0.0000
11.6439
11.6439
0.0114
0.0000
11.8824
B - 198

Barrett Rach East Air Quality Technical Report Appendix B - 61 ESA / 140728
Mitigated
ROG NOx CO SO2 Fugitive PM10
Exhaust PM10
PM10 Total
Fugitive PM2.5
Exhaust PM2.5
PM2.5 Total
Bio- CO2 NBio- CO2
Total CO2
CH4 N2O CO2e
SubCategory
tons/yr MT/yr
Architectural Coating
0.0000
0.0000
0.0000
0.0000
0.0000
0.0000
Consumer Products
0.0000
0.0000
0.0000
0.0000
0.0000
0.0000
Hearth
0.0000
0.0000
0.0000
0.0000
0.0000
0.0000
Landscaping
0.0000
11.6439
11.6439
0.0114
0.0000
11.8824
Total 0.0000
11.6439
11.6439
0.0114
0.0000
11.8824
7.0 Water Detail
7.1 Mitigation Measures Water
B - 199

Barrett Rach East Air Quality Technical Report Appendix B - 62 ESA / 140728
Total CO2
CH4 N2O CO2e
Category
tons/yr MT/yr
Mitigated
129.5518
0.0703
0.0420
144.0559
Unmitigated
129.5518
0.0701
0.0420
144.0349
7.2 Water by Land Use
Unmitigated
Indoor/Outdoor Use Total
CO2 CH4 N2O CO2e
Land Use
Mgal tons/yr MT/yr
Apartments Low Rise
12.7702 / 8.05077
29.1002
0.0168
0.0101
32.5755
City Park
0 / 9.29355
8.7096
4.3000e-004
9.0000e-005
8.7460
Parking Lot
0 / 0
0.0000
0.0000
0.0000
0.0000
Regional Shopping
Center
8.0665 / 4.94398
18.2491
0.0106
6.3600e-003
20.4438
B - 200

Barrett Rach East Air Quality Technical Report Appendix B - 63 ESA / 140728
Single Family
Housing
32.2512 / 20.3323
73.4929
0.0423
0.0255
82.2697
Total 129.5518
0.0701
0.0420
144.0349
B - 201
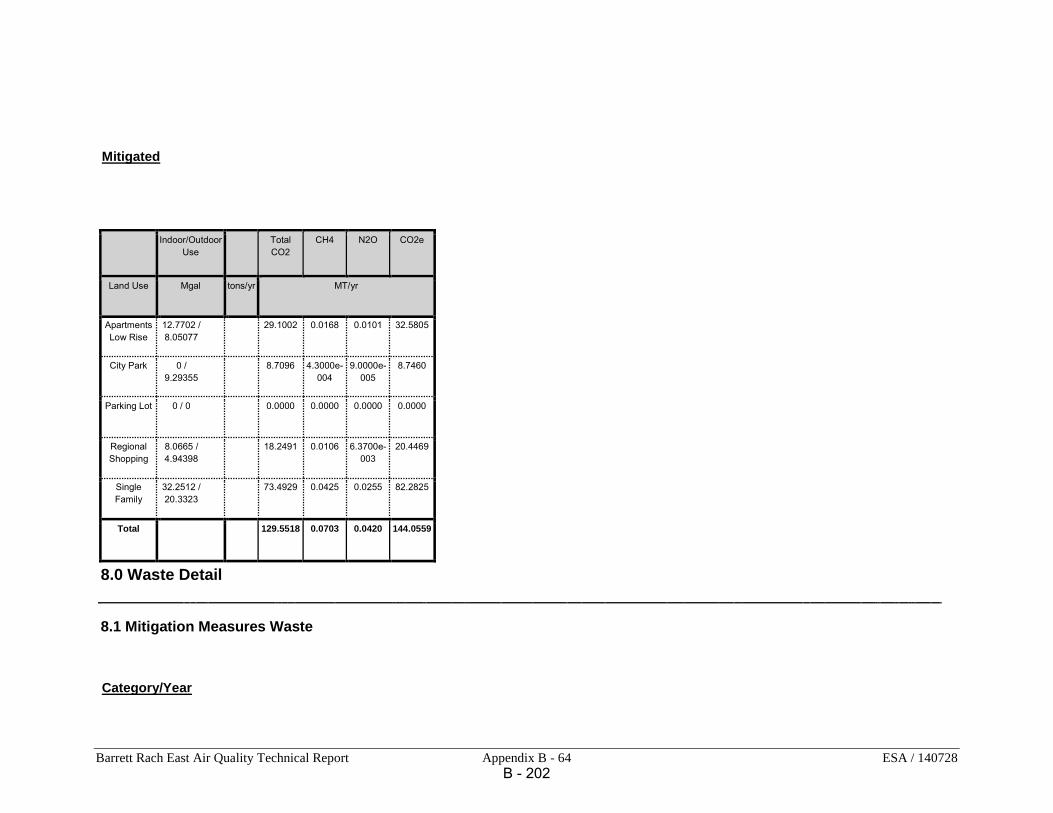
Barrett Rach East Air Quality Technical Report Appendix B - 64 ESA / 140728
Mitigated
Indoor/Outdoor Use Total
CO2 CH4 N2O CO2e
Land Use
Mgal tons/yr MT/yr
Apartments Low Rise
12.7702 / 8.05077
29.1002
0.0168
0.0101
32.5805
City Park
0 / 9.29355
8.7096
4.3000e-004
9.0000e-005
8.7460
Parking Lot
0 / 0
0.0000
0.0000
0.0000
0.0000
Regional Shopping
Center
8.0665 / 4.94398
18.2491
0.0106
6.3700e-003
20.4469
Single Family
Housing
32.2512 / 20.3323
73.4929
0.0425
0.0255
82.2825
Total 129.5518
0.0703
0.0420
144.0559
8.0 Waste Detail
8.1 Mitigation Measures Waste
Category/Year
B - 202
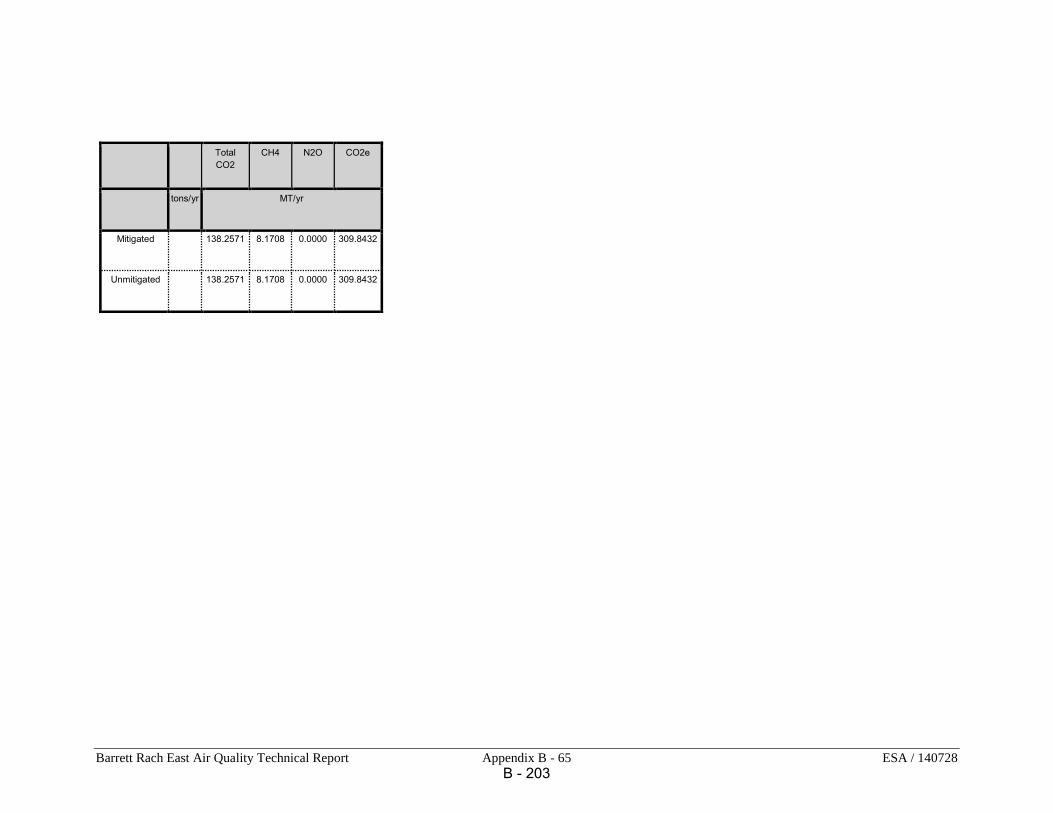
Barrett Rach East Air Quality Technical Report Appendix B - 65 ESA / 140728
Total CO2
CH4 N2O CO2e
tons/yr MT/yr
Mitigated
138.2571
8.1708
0.0000
309.8432
Unmitigated
138.2571
8.1708
0.0000
309.8432
B - 203
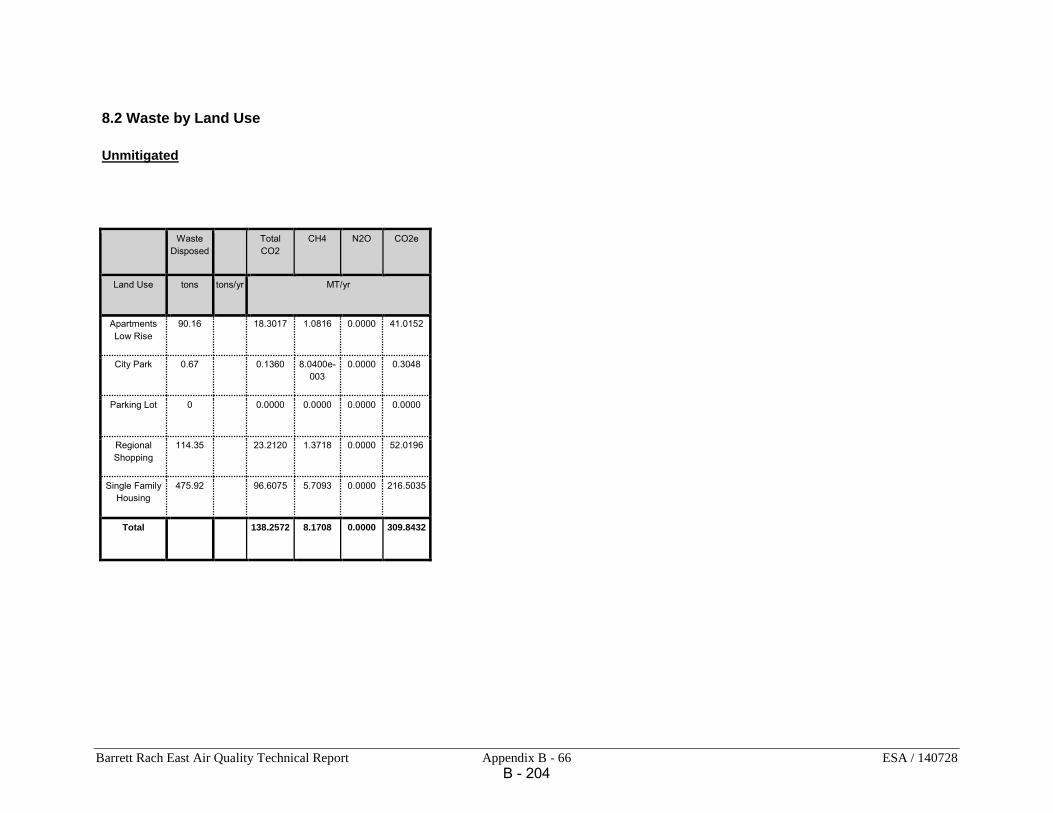
Barrett Rach East Air Quality Technical Report Appendix B - 66 ESA / 140728
8.2 Waste by Land Use
Unmitigated
Waste Disposed Total
CO2 CH4 N2O CO2e
Land Use
tons tons/yr MT/yr
Apartments Low Rise
90.16
18.3017
1.0816
0.0000
41.0152
City Park
0.67
0.1360
8.0400e-003
0.0000
0.3048
Parking Lot
0
0.0000
0.0000
0.0000
0.0000
Regional Shopping
Center
114.35
23.2120
1.3718
0.0000
52.0196
Single Family Housing
475.92
96.6075
5.7093
0.0000
216.5035
Total 138.2572
8.1708
0.0000
309.8432
B - 204

Barrett Rach East Air Quality Technical Report Appendix B - 67 ESA / 140728
Mitigated
Waste Disposed Total
CO2 CH4 N2O CO2e
Land Use
tons tons/yr MT/yr
Apartments Low Rise
90.16
18.3017
1.0816
0.0000
41.0152
City Park
0.67
0.1360
8.0400e-003
0.0000
0.3048
Parking Lot
0
0.0000
0.0000
0.0000
0.0000
Regional Shopping
Center
114.35
23.2120
1.3718
0.0000
52.0196
Single Family Housing
475.92
96.6075
5.7093
0.0000
216.5035
Total 138.2572
8.1708
0.0000
309.8432
9.0 Operational Offroad
Equipment Type Number Hours/Day Days/Year Horse Power Load Factor Fuel Type
B - 205

Barrett Rach East Air Quality Technical Report Appendix B - 68 ESA / 140728
10.0 Vegetation
B - 206

Barrett Rach East Air Quality Technical Report Appendix B - 69 ESA / 140728
Metric Tons GHG per Capita Energy Estimates
MT CO2e per Year
(Electricity)
MT CO2e per Year (Natural
Gas)
Population MT per Capita
Threshold
1,439 694 1,845 1.15 1.33
B - 207

Barrett Ranch East Air Quality Technical Report Appendix C - 1 ESA/140728
Appendix C – Operational Air Quality Mitigation Plan
Table of Contents Appendix C – Operational Air Quality Mitigation Plan ................................................................. 1
Introduction ................................................................................................................................. 2
Result Summary .......................................................................................................................... 2
Unmitigated Emission Estimate .............................................................................................. 2
Mitigated Emission Estimate ................................................................................................... 3
B - 208

Barrett Ranch East Air Quality Technical Report Appendix C - 2 ESA/140728
Introduction SMAQMD guidance recommends that projects that exceed its operational significance
thresholds should prepare and implement an Air Quality Mitigation Plan (AQMP). The AQMP
must be incorporated into the project’s environmental document and be enforced by the local
jurisdiction. The objective of the AQMP is to reduce ozone precursor emissions by 15 percent
for projects considered to be in the State Implementation Plan and 35 percent for projects not
considered to be in the State Implementation Plan1,2
. The Barrett Ranch Project is considered to
be within the SIP3.
AQMPs can include two types of measures, those included within CalEEMod (known as on-
model measures) and those located solely within this guidance (called off-model measures).
This AQMP relies on a combination of on- and off-model measures.
On a ton for ton basis, NOx reductions provide greater ozone benefits than ROG reductions.
Thus, SMAQMD recommends normalizing ozone precursors based on their ozone creation
potential in units of Equivalent Oxides of Nitrogen (NOxe). To estimate NOxe, ROG is divided
by 3 and then added to total NOx. To estimate the effectiveness of a mitigation plan, the
following equation is used:
AQMP Effectiveness = ((Unmitigated Project NOxe – Mitigated NOxe)/(Unmitigated NOxe)) x
100.
This analysis uses SMAQMD’s recommended approach to estimate AQMP effectiveness.
Result Summary For the Barrett Ranch East Project, the AQMP analysis examines whether mitigation measures
can be used to reduce unmitigated emissions by 15%. This requires two steps. The first step
involves using CalEEMod to estimate unmitigated emissions.
Unmitigated Emission Estimate
The Project’s unmitigated ROG and NOx operational emissions were estimated using the
CalEEMod model (2013.2.2 version). The unmitigated CalEEMod results are shown in
Appendix A and summarized in Table C-1 below. The average daily trip rates used to generate
the results shown in Table C-1, are based on the CalEEMod default trip rates and trip lengths for
each land use type.4 Table C-1 shows that unmitigated ROG emissions exceed the SMAQMD
ROG significance threshold, hence the need for this AQMP.
1 Sacramento Metropolitan Air Quality Management District. Operational Emissions Mitigation. http://www.airquality.org/ceqa/mitigation.shtml. Accessed November 4, 2014.
2 SMAQMD Recommended Guidance for Land Use Emission Reductions, Version 3.1. June 2014.
3 Dubose, Rachel, SMAQMD. November 6, 2014 e-mail to Tim Rimpo, ESA regarding: “RE: Air Quality SIP
Question.” 4 Philley, Paul, SMAQMD. November 5, 2015 phone conversation with Tim Rimpo, ESA regarding calculation of the
unmitigated baseline.
B - 209

Barrett Ranch East Air Quality Technical Report Appendix C - 3 ESA/140728
Table C-1. Barrett Ranch East Maximum Unmitigated Daily Ozone Precursor Emissions
Parameter ROG (ppd) NOx (ppd) NOxe (ppd)
Area Sources 40.6 0.7
Energy Sources 0.5 3.9
Mobile Sources 34.3 53.8
Total Emissions 75.4 58.3 83.4
Significance Threshold 65 65 N/A
Exceed Operational Threshold?
Yes No N/A
Mitigated Emission Estimate
The mitigated emission estimates rely on one off-model and one on-model mitigation measure.
Off Model Measure
TS: Traffic Study (meta-measure). This measure from the SMAQMD’s AQMP guidance
recognizes that site-specific information is better than information generated from a statewide
model. Consequently, it recommends that for projects that have a traffic study, that study should
be used in lieu of the CalEEMod model defaults.6 As discussed in SMAQMD’s guidance, traffic
studies typically include calculations of internal trip capture, mix of uses, distance to job centers,
and sometimes walking and cycling information. In lieu of using CalEEMod to estimate the
impact of these features on a project, the project should use the results of the traffic study. The
first step in this approach is to run CalEEMod using the proposed land uses in default mode to
establish the unmitigated baseline. This analysis was conducted and the baseline emission
results are shown above in Table C-1.
The next step is to conduct a mitigated emission run using CalEEMod, altering the defaults and
adding any mitigation not included in the traffic study. Consequently, mitigated off-model
measures were estimated by modifying the CalEEMod defaults as follows:
The trip generation rates were modified to be consistent with the trip generation rates in the
project traffic study. As part of this modification, the trip rates were also adjusted to account for
internal trip reduction, estimated at 18% for total daily trips.7
The CalEEMod default estimate of total vehicle miles traveled (VMT) was revised to be
consistent with the project specific VMT estimates.8 VMT is the product of trip generation rates
6 Sacramento Metropolitan Air Quality Management District. Operational Emissions Mitigation. http://www.airquality.org/ceqa/mitigation.shtml. Accessed November 4, 2014.
7 Kimley-Horn and Associates, Inc. 2014 Traffic Impact Analysis, Barrett Ranch East, Sacramento County, California.
Draft. October 14, 2014. 8 Weir, M., Kimley-Horn. September, 25, 2014 email to Tim Rimpo, ESA RE: Barrett Ranch East | VMT.
B - 210

Barrett Ranch East Air Quality Technical Report Appendix C - 4 ESA/140728
times trip lengths. CalEEMod’s default trip lengths were adjusted so that its VMT matched the
project specific estimates.
The trip generation rates, trip lengths, and VMT estimates for the Barrett Ranch East project
were modeled using the Sacramento Area Council of Government’s (SACOG) SACSIM travel
demand model. SACSIM accounts for several factors, including job accessibility (within a 30
minute drive or transit travel time), proximity to transit (distance to nearest light rail or bus
station, in miles), job and housing density (dwelling units and jobs per acre), jobs and housing
mix, and street pattern and urban design (intersection density for 1, 3, and 4 legged
intersections).9,10
SACSIM does not account for measures such as TMA membership, transit
subsidies, ride-sharing, low-income housing, or similar programs.
On Model Measure
One on-model measure was also identified for this project: exceedance of the Title 24 Energy
Standards by 20 percent was specified. This measure was specified because CalEEMod
generates estimates using the 2008 Title 24 standards. By specifying a 20% reduction from Title
24 standards, this will bring the project into line with the 2013 standards.
Results
As shown in Table C-2, the Operational AQMP would reduce NOxe emissions by 34.4 percent.
This reduction would easily exceed SMAQMD’s minimum emission reduction requirements of
15 percent for projects located within a SIP area. The detailed CalEEMod mitigated results can
be found in Appendix A.
Table C-2. Barrett Ranch East Maximum Mitigated Daily Ozone Precursor Emission
Parameter ROG (ppd) NOx (ppd) NOxe (ppd)
Area Sources 40.6 0.7
Energy Sources 0.4 3.3
Mobile Sources 27.1 27.8
Total Emissions 68.1 31.8 54.5 (34.4 %
reduction from unmitigated
Significance Threshold 65 65 N/A
Exceed Operational Threshold?
Yes No N/A
9 Wong, D., Kimley-Horn. November 13, 2014 e-mail to Tim Rimpo, ESA, regarding SACSIM.
10 Long, J., DKS Associates. November 6, 2014 phone conversation with Tim Rimpo, ESA, regarding SACSIM.
B - 211

1
July 13, 2016
Michael Winn - Barrett Winn, LLC & Antelope RBVP, LP
Tim Rimpo
Supplemental Air Quality Analysis (Commercial Land Use Alternative)
Barrett Ranch East – Sacramento County, California
In 2014, ESA prepared an Air Quality Technical Report (AQTR) for the Barrett Ranch East
Project (Project).1,2 The proposed Commercial Land Use Alternative (Alternative) represents
a different land use plan for the same site. The Alternative includes 496 single-family
residential units, 26 apartments, and a commercial center that includes a 45,000 square-foot
health club and a 33,000 square-foot shopping center.3,4
This memo evaluates the air emissions from the Alternative, which were not evaluated in the
2014 AQTR. Construction emissions associated with the Alternative would be similar to
those for the Project and therefore are not analyzed in this memo. Consequently, this memo
focuses on the Alternative’s operational air emissions. The criteria pollutant analysis estimates
emissions of ozone precursors – reactive organic gases (ROG) and nitrogen oxides (NOx) –
and particulate matter (PM10 and PM2.5). The operational analysis also qualitatively
evaluates the Alternative’s toxic air contaminant (TAC) and odor impacts. The greenhouse
gas (GHG) analysis estimates the Alternative’s emissions of carbon dioxide (CO2), methane
(CH4), nitrous oxide (N2O), and carbon dioxide equivalence (CO2e).5
1 Environmental Science Associates, Inc. 2014. Barrett Ranch East Project, Air Quality Technical Report. November. 2 The Project, to be located in northeastern Sacramento County, includes 495 single-family houses, 196 apartments, and a 108,900
square feet shopping center. 3 Weir, M., P.E., T.E., PTOE, Kimley-Horn, 2015. Supplemental Traffic Impact Analysis (Land Use Alternate) Barrett Ranch East –
Sacramento County, California. December 29th. 4 The Alternative would result in 3,281 fewer daily trips compared to the Project (30.7 percent fewer daily trips). 5 CO2e consists of total GHG emissions adjusted by the global warming potential of each pollutant. For this analysis, a global warming
potential of one was used for carbon dioxide, 21 for methane, and 310 for nitrous oxide.
B - 212

Supplemental Air Quality Analysis (Commercial Land Use Alternative) Barrett Ranch East – Sacramento County, California
2
Criteria Pollutant Emissions
The CalEEMod model was used to estimate criteria pollutant and GHG emissions. CalEEMod
groups criteria pollutant emissions into three categories: transportation, energy, and area sources.
Of these, transportation emissions represent the largest emission source.
The CalEEMod model estimates transportation emissions using default daily trip rates for each
land use. Those default trip rates are based on equations included in the Institute of
Transportation Engineers’ (ITE) Trip Generation Manual. 6 CalEEMod allows the trip rates to be
overridden when project-specific trip rates are available. For this analysis, CalEEMod’ default
trip rates were replaced with values included in the Alternative traffic study.7 Those rates were
developed using the Sacramento Council of Governments’ SACSIM travel demand model.
Consequently, for this analysis, the CalEEMod default trip rates were replaced with the SACSIM-
generated “mitigated” trip generation rates.8
Table 1 shows that the Alternative would result in emissions of ROG, NOx, PM10, and PM2.5
that are below the significance thresholds established by the SMAQMD.9 This impact is less
than significant.
Table 1. Operational Criteria Pollutant Emissions (mitigated, pounds per day)
Commercial Land Use
Alternative ROG NOx PM10 PM2.5
Operational Emissions 57.1 36.4 32.0 9.2
Operational Thresholds 65 65 80 82
Exceed Threshold? No No No No
Notes – All emissions estimated using CalEEMod and the trip generation rates used in the Kimley Horn
Supplemental Traffic Impact Analysis (Land Use Alternate), December 29, 2015. The Alternatives’ annual emissions
would equal 5.6 tons per year of PM10, which is below the SMAQMD threshold of 14.6 tons per year. The
Alternative’s annual emissions of PM2.5 would equal 1.6 tons per year, which is less than the SMAQMD threshold
of 15.0 tons per year.
Toxic Air Contaminant Emissions
The Alternative would not include any new stationary sources of TACs. In addition, there are
not nearby sources of TACs that represent a health concern to future residents. The Alternative
would not locate new residences within 500 feet of any high volume roads (defined as a freeway
or urban roadway with more than 100,000 vehicles per day). Consequently, the Alternative
would not result in significant health risk impacts from exposure to TACs. This impact is less
than significant.
6 Institute of Transportation Engineers, 2012. Trip Generation Manual, 9th Edition. 7 Weir, M., P.E., T.E., PTOE, Kimley-Horn, 2015. Supplemental Traffic Impact Analysis (Land Use Alternate) Barrett Ranch East –
Sacramento County, California. December 29th. 8 The “mitigated” daily trips estimated using SACSIM are 23 percent lower than the trips estimated using the ITE rates. 9 SMAQMD, 2015. SMAQMD Thresholds of Significance Table, CEQA Guide December 2009, Revised November 2014, May 2015.
B - 213
Supplemental Air Quality Analysis (Commercial Land Use Alternative) Barrett Ranch East – Sacramento County, California
3
Odors
The Alternative is not considered a source of objectionable odors. Diesel emissions during
construction would be short-term, located at a distance from sensitive receptors, and would not
be detectable. During operation, the Alternative would not generate objectionable odors. In
addition, the Alternative would not expose residents to objectionable odors from nearby land
uses. Land uses associated with odor complaints typically include agricultural uses, wastewater
treatment plants, food-processing plants, chemical plants, composting, refineries, landfills,
dairies, and fiberglass molding. No odor-generating sources are located near the Alternative.
Thus, the Alternative’s residents would not be exposed to objectionable odors. Odor impacts
would be less than significant.
Greenhouse Gas Emissions
The GHG analysis uses CalEEMod to estimate emissions for all categories except mobile
sources. Sacramento County requires that the mobile emission estimates be made using vehicle
miles traveled (VMT) by speed category. VMT by speed category was available for the Project,
but not the Alternative. Consequently, mobile source emissions for the Alternative were based on
the mobile emissions estimated for the Project, but reduced by 30.7 percent to account for the
Alternative’s lower number of daily trips as compared to the Project.10
The current version of CalEEMod (version 2013.2.2) bases building energy use on the California
Energy Commission’s 2008 California Title 24 building energy standards. The Title 24 standards
were tightened in 2013 resulting in a 25 percent reduction in energy use compared to the 2008
Title 24 standards.11 The 2016 Title 24 standards, scheduled to take effect on January 1, 2017,
will reduce emissions by 28 percent compared to the 2013 standards.12 The combined energy
efficiency reductions associated with the 2013 and 2016 Title 24 standards would reduce building
and lighting energy use and associated emissions by 46 percent compared to the CalEEMod
default values. The energy emissions shown in Table 2 account for the 46 percent reduction in
building energy use.
10 The Supplemental Traffic Impact Analysis (Land Use Alternate) Barrett Ranch East – Sacramento County, prepared by Kimley-
Horn did not include VMT estimates by speed bin. Consequently, emissions were scaled from the Project’s speed-bin based emission estimates.
11 California Energy Commission, 2013. 2013 Building Energy Efficiency Standards, Frequently Asked Questions. Available: http://www.energy.ca.gov/title24/2013standards/rulemaking/documents/2013_Building_Energy_Efficiency_Standards_FAQ.pdf
12 California Energy Commission, 2016. 2016 Building Energy Efficiency Standards, Frequently Asked Questions. Available: http://www.energy.ca.gov/title24/2016standards/rulemaking/documents/2016_Building_Energy_Efficiency_Standards_FAQ.pdf
B - 214
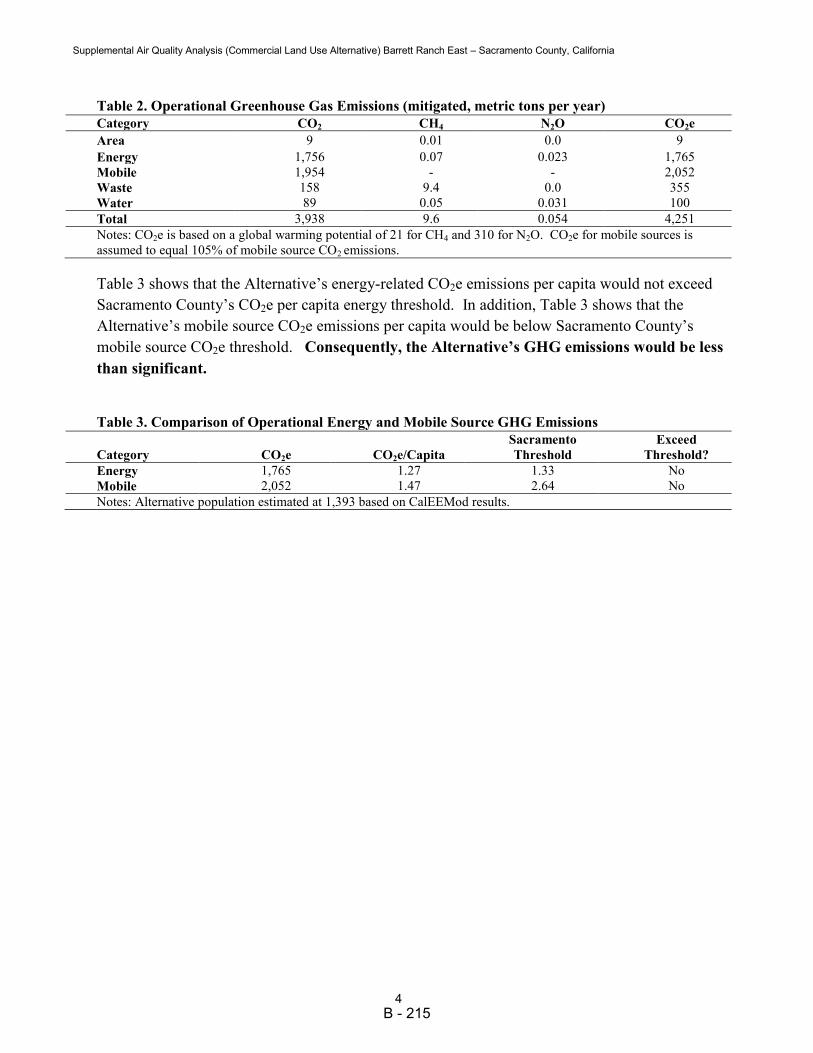
Supplemental Air Quality Analysis (Commercial Land Use Alternative) Barrett Ranch East – Sacramento County, California
4
Table 2. Operational Greenhouse Gas Emissions (mitigated, metric tons per year)
Category CO2 CH4 N2O CO2e
Area 9 0.01 0.0 9
Energy 1,756 0.07 0.023 1,765
Mobile 1,954 - - 2,052
Waste 158 9.4 0.0 355
Water 89 0.05 0.031 100
Total 3,938 9.6 0.054 4,251
Notes: CO2e is based on a global warming potential of 21 for CH4 and 310 for N2O. CO2e for mobile sources is
assumed to equal 105% of mobile source CO2 emissions.
Table 3 shows that the Alternative’s energy-related CO2e emissions per capita would not exceed
Sacramento County’s CO2e per capita energy threshold. In addition, Table 3 shows that the
Alternative’s mobile source CO2e emissions per capita would be below Sacramento County’s
mobile source CO2e threshold. Consequently, the Alternative’s GHG emissions would be less
than significant.
Table 3. Comparison of Operational Energy and Mobile Source GHG Emissions
Category CO2e CO2e/Capita
Sacramento
Threshold
Exceed
Threshold?
Energy 1,765 1.27 1.33 No
Mobile 2,052 1.47 2.64 No
Notes: Alternative population estimated at 1,393 based on CalEEMod results.
B - 215
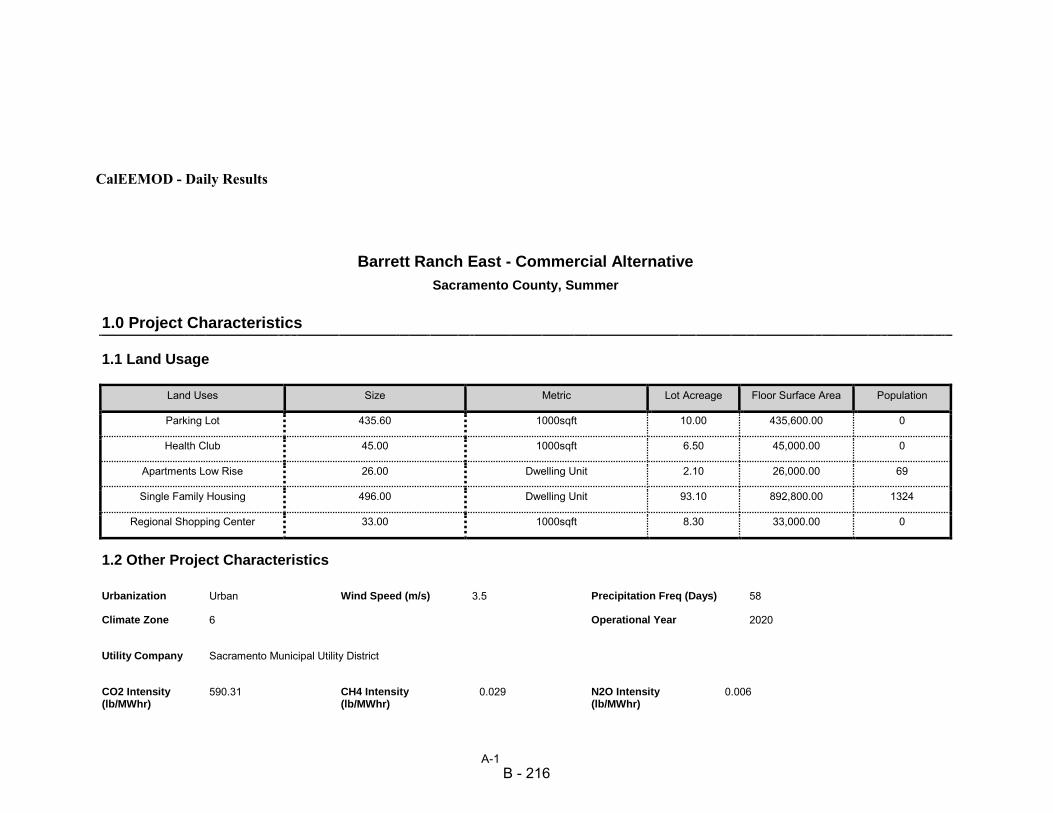
A-1
CalEEMOD - Daily Results
Barrett Ranch East - Commercial Alternative
Sacramento County, Summer
1.0 Project Characteristics
1.1 Land Usage
Land Uses Size Metric Lot Acreage Floor Surface Area Population
Parking Lot 435.60 1000sqft 10.00 435,600.00 0
Health Club 45.00 1000sqft 6.50 45,000.00 0
Apartments Low Rise 26.00 Dwelling Unit 2.10 26,000.00 69
Single Family Housing 496.00 Dwelling Unit 93.10 892,800.00 1324
Regional Shopping Center 33.00 1000sqft 8.30 33,000.00 0
1.2 Other Project Characteristics
Urbanization
Urban
Wind Speed (m/s)
3.5
Precipitation Freq (Days)
58
Climate Zone
6
Operational Year
2020
Utility Company
Sacramento Municipal Utility District
CO2 Intensity (lb/MWhr)
590.31
CH4 Intensity (lb/MWhr)
0.029
N2O Intensity (lb/MWhr)
0.006
B - 216
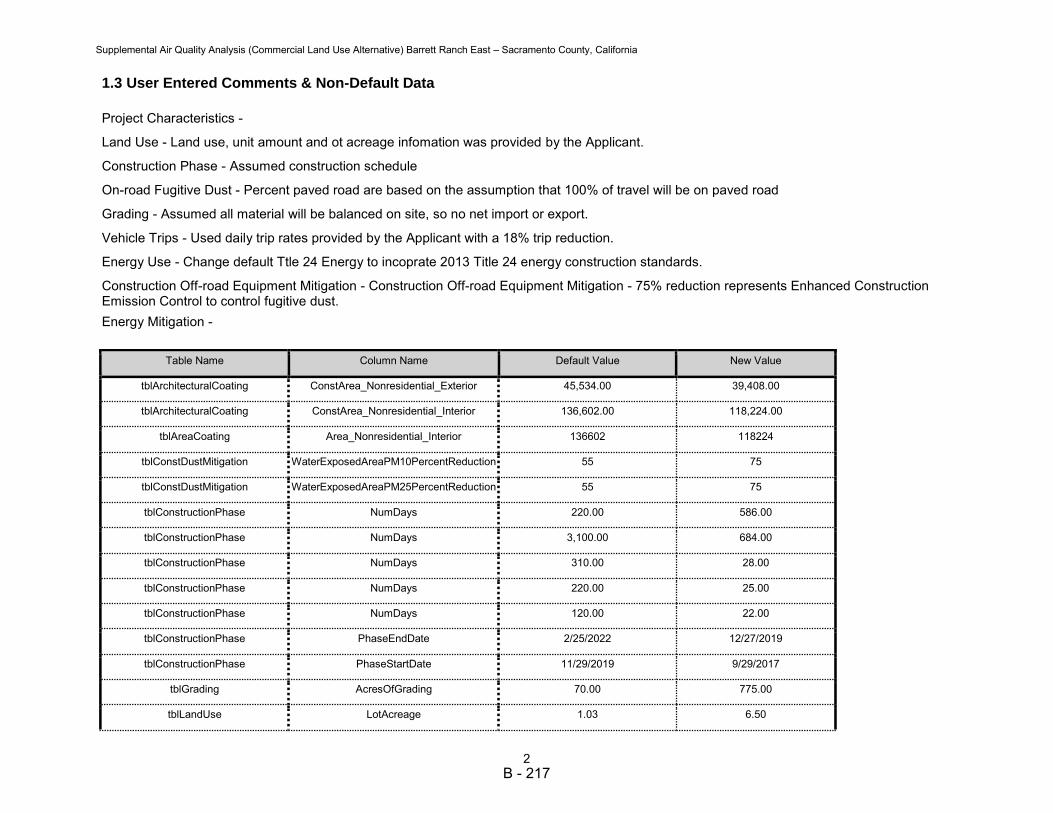
Supplemental Air Quality Analysis (Commercial Land Use Alternative) Barrett Ranch East – Sacramento County, California
2
1.3 User Entered Comments & Non-Default Data
Project Characteristics -
Land Use - Land use, unit amount and ot acreage infomation was provided by the Applicant.
Construction Phase - Assumed construction schedule
On-road Fugitive Dust - Percent paved road are based on the assumption that 100% of travel will be on paved road
Grading - Assumed all material will be balanced on site, so no net import or export.
Vehicle Trips - Used daily trip rates provided by the Applicant with a 18% trip reduction.
Energy Use - Change default Ttle 24 Energy to incoprate 2013 Title 24 energy construction standards.
Construction Off-road Equipment Mitigation - Construction Off-road Equipment Mitigation - 75% reduction represents Enhanced Construction Emission Control to control fugitive dust.
Energy Mitigation -
Table Name Column Name Default Value New Value
tblArchitecturalCoating ConstArea_Nonresidential_Exterior 45,534.00 39,408.00
tblArchitecturalCoating ConstArea_Nonresidential_Interior 136,602.00 118,224.00
tblAreaCoating Area_Nonresidential_Interior 136602 118224
tblConstDustMitigation WaterExposedAreaPM10PercentReduction 55 75
tblConstDustMitigation WaterExposedAreaPM25PercentReduction 55 75
tblConstructionPhase NumDays 220.00 586.00
tblConstructionPhase NumDays 3,100.00 684.00
tblConstructionPhase NumDays 310.00 28.00
tblConstructionPhase NumDays 220.00 25.00
tblConstructionPhase NumDays 120.00 22.00
tblConstructionPhase PhaseEndDate 2/25/2022 12/27/2019
tblConstructionPhase PhaseStartDate 11/29/2019 9/29/2017
tblGrading AcresOfGrading 70.00 775.00
tblLandUse LotAcreage 1.03 6.50
B - 217

Supplemental Air Quality Analysis (Commercial Land Use Alternative) Barrett Ranch East – Sacramento County, California
3
tblLandUse LotAcreage 1.63 2.10
tblLandUse LotAcreage 161.04 93.10
tblLandUse LotAcreage 0.76 8.30
tblProjectCharacteristics OperationalYear 2014 2020
tblTripsAndVMT VendorTripNumber 140.00 73.00
tblTripsAndVMT WorkerTripNumber 410.00 238.00
tblTripsAndVMT WorkerTripNumber 82.00 48.00
tblVehicleTrips ST_TR 7.16 8.35
tblVehicleTrips ST_TR 20.87 25.37
tblVehicleTrips ST_TR 49.97 77.10
tblVehicleTrips ST_TR 10.08 7.05
tblVehicleTrips SU_TR 6.07 8.35
tblVehicleTrips SU_TR 26.73 25.37
tblVehicleTrips SU_TR 25.24 77.10
tblVehicleTrips SU_TR 8.77 7.05
tblVehicleTrips WD_TR 6.59 8.35
tblVehicleTrips WD_TR 32.93 25.37
tblVehicleTrips WD_TR 42.94 77.10
tblVehicleTrips WD_TR 9.57 7.05
2.0 Emissions Summary
2.2 Overall Operational
Unmitigated Operational
B - 218

Supplemental Air Quality Analysis (Commercial Land Use Alternative) Barrett Ranch East – Sacramento County, California
4
ROG NOx CO SO2 Fugitive PM10
Exhaust PM10
PM10 Total
Fugitive PM2.5
Exhaust PM2.5
PM2.5 Total
Bio- CO2
NBio- CO2 Total CO2 CH4 N2O CO2e
Category
lb/day lb/day
Area
35.4362
0.5002
43.2616
2.2800e-003
0.2378
0.2378
0.2378
0.2378
0.0000
77.6567
77.6567
0.0759
0.0000
79.2509
Energy
0.5363
4.6132
2.1693
0.0293
0.3706
0.3706
0.3706
0.3706
5,851.0219
5,851.0219
0.1121
0.1073
5,886.6303
Mobile
21.3312
33.0147
182.5741
0.4685
31.0496
0.5157
31.5653
8.2947
0.4758
8.7706
35,552.7745
35,552.7745
1.2797
35,579.6484
Total 57.3037
38.1281
228.0050
0.5001
31.0496
1.1241
32.1737
8.2947
1.0842
9.3789
0.0000
41,481.4531
41,481.4531
1.4678
0.1073
41,545.5296
Mitigated Operational
ROG NOx CO SO2 Fugitive PM10
Exhaust PM10
PM10 Total
Fugitive PM2.5
Exhaust PM2.5
PM2.5 Total
Bio- CO2
NBio- CO2 Total CO2 CH4 N2O CO2e
Category
lb/day lb/day
Area
35.4362
0.5002
43.2616
2.2800e-003
0.2378
0.2378
0.2378
0.2378
0.0000
77.6567
77.6567
0.0759
0.0000
79.2509
Energy
0.3385
2.9133
1.3813
0.0185
0.2339
0.2339
0.2339
0.2339
3,692.9714
3,692.9714
0.0708
0.0677
3,715.4462
Mobile
21.3312
33.0147
182.5741
0.4685
31.0496
0.5157
31.5653
8.2947
0.4758
8.7706
35,552.7745
35,552.7745
1.2797
35,579.6484
Total 57.1059
36.4282
227.2170
0.4893
31.0496
0.9874
32.0370
8.2947
0.9475
9.2422
0.0000
39,323.4026
39,323.4026
1.4264
0.0677
39,374.3455
B - 219
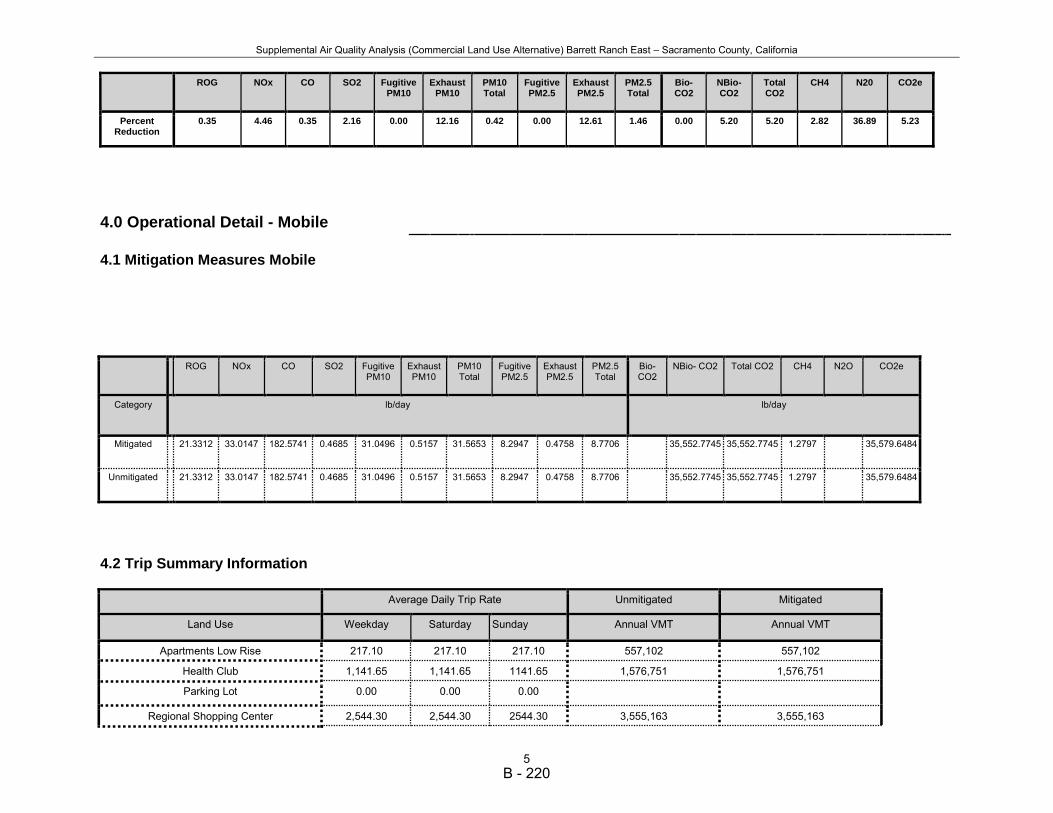
Supplemental Air Quality Analysis (Commercial Land Use Alternative) Barrett Ranch East – Sacramento County, California
5
ROG
NOx
CO
SO2
Fugitive PM10
Exhaust PM10
PM10 Total
Fugitive PM2.5
Exhaust PM2.5
PM2.5 Total
Bio- CO2
NBio-CO2
Total CO2
CH4
N20
CO2e
Percent Reduction
0.35
4.46
0.35
2.16
0.00
12.16
0.42
0.00
12.61
1.46
0.00
5.20
5.20
2.82
36.89
5.23
4.0 Operational Detail - Mobile
4.1 Mitigation Measures Mobile
ROG NOx CO SO2 Fugitive PM10
Exhaust PM10
PM10 Total
Fugitive PM2.5
Exhaust PM2.5
PM2.5 Total
Bio- CO2
NBio- CO2 Total CO2 CH4 N2O CO2e
Category
lb/day lb/day
Mitigated
21.3312
33.0147
182.5741
0.4685
31.0496
0.5157
31.5653
8.2947
0.4758
8.7706
35,552.7745
35,552.7745
1.2797
35,579.6484
Unmitigated
21.3312
33.0147
182.5741
0.4685
31.0496
0.5157
31.5653
8.2947
0.4758
8.7706
35,552.7745
35,552.7745
1.2797
35,579.6484
4.2 Trip Summary Information
Average Daily Trip Rate Unmitigated Mitigated
Land Use Weekday Saturday Sunday Annual VMT Annual VMT
Apartments Low Rise 217.10 217.10 217.10 557,102 557,102
Health Club 1,141.65 1,141.65 1141.65 1,576,751 1,576,751
Parking Lot 0.00 0.00 0.00
Regional Shopping Center 2,544.30 2,544.30 2544.30 3,555,163 3,555,163
B - 220
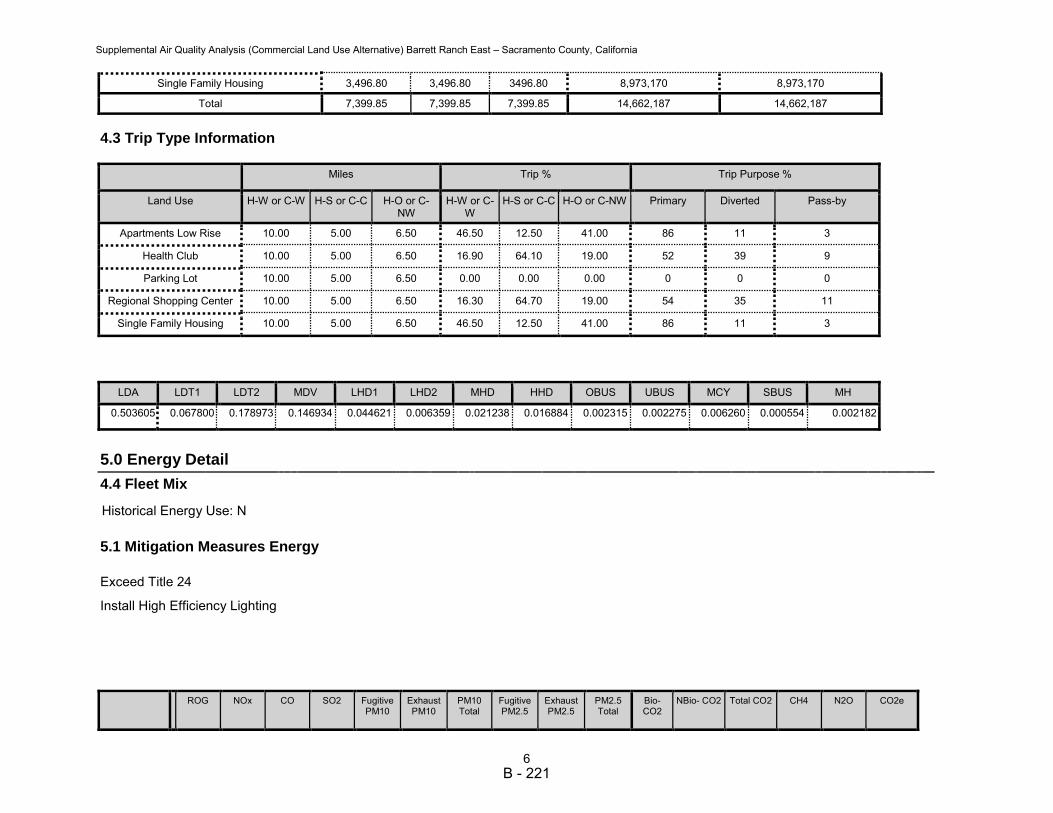
Supplemental Air Quality Analysis (Commercial Land Use Alternative) Barrett Ranch East – Sacramento County, California
6
Single Family Housing 3,496.80 3,496.80 3496.80 8,973,170 8,973,170
Total 7,399.85 7,399.85 7,399.85 14,662,187 14,662,187
4.3 Trip Type Information
Miles Trip % Trip Purpose %
Land Use H-W or C-W H-S or C-C H-O or C-NW
H-W or C-W
H-S or C-C H-O or C-NW Primary Diverted Pass-by
Apartments Low Rise
10.00
5.00
6.50
46.50
12.50
41.00
86
11
3
Health Club
10.00
5.00
6.50
16.90
64.10
19.00
52
39
9
Parking Lot
10.00
5.00
6.50
0.00
0.00
0.00
0
0
0
Regional Shopping Center
10.00
5.00
6.50
16.30
64.70
19.00
54
35
11
Single Family Housing
10.00
5.00
6.50
46.50
12.50
41.00
86
11
3
LDA LDT1 LDT2 MDV LHD1 LHD2 MHD HHD OBUS UBUS MCY SBUS MH
0.503605 0.067800 0.178973 0.146934 0.044621 0.006359 0.021238 0.016884 0.002315 0.002275 0.006260 0.000554 0.002182
5.0 Energy Detail
4.4 Fleet Mix
Historical Energy Use: N
5.1 Mitigation Measures Energy
Exceed Title 24
Install High Efficiency Lighting
ROG NOx CO SO2 Fugitive PM10
Exhaust PM10
PM10 Total
Fugitive PM2.5
Exhaust PM2.5
PM2.5 Total
Bio- CO2
NBio- CO2 Total CO2 CH4 N2O CO2e
B - 221

Supplemental Air Quality Analysis (Commercial Land Use Alternative) Barrett Ranch East – Sacramento County, California
7
Category
lb/day lb/day
NaturalGas Mitigated
0.3385
2.9133
1.3813
0.0185
0.2339
0.2339
0.2339
0.2339
3,692.9714
3,692.9714
0.0708
0.0677
3,715.4462
NaturalGas Unmitigated
0.5363
4.6132
2.1693
0.0293
0.3706
0.3706
0.3706
0.3706
5,851.0219
5,851.0219
0.1121
0.1073
5,886.6303
5.2 Energy by Land Use - NaturalGas
Unmitigated
NaturalGas Use ROG NOx CO SO2 Fugitive
PM10 Exhaust PM10
PM10 Total
Fugitive PM2.5
Exhaust PM2.5
PM2.5 Total
Bio- CO2
NBio- CO2 Total CO2 CH4 N2O CO2e
Land Use
kBTU/yr lb/day lb/day
Apartments Low Rise
966.349
0.0104
0.0891
0.0379
5.7000e-004
7.2000e-003
7.2000e-003
7.2000e-003
7.2000e-003
113.6882
113.6882
2.1800e-003
2.0800e-003
114.3801
Health Club
4565.34
0.0492
0.4476
0.3760
2.6900e-003
0.0340
0.0340
0.0340
0.0340
537.0991
537.0991
0.0103
9.8500e-003
540.3678
Parking Lot
0
0.0000
0.0000
0.0000
0.0000
0.0000
0.0000
0.0000
0.0000
0.0000
0.0000
0.0000
0.0000
0.0000
Regional Shopping
Center
510.822
5.5100e-003
0.0501
0.0421
3.0000e-004
3.8100e-003
3.8100e-003
3.8100e-003
3.8100e-003
60.0967
60.0967
1.1500e-003
1.1000e-003
60.4624
Single Family Housing
43691.2
0.4712
4.0264
1.7134
0.0257
0.3255
0.3255
0.3255
0.3255
5,140.1379
5,140.1379
0.0985
0.0942
5,171.4200
Total 0.5363
4.6132
2.1693
0.0293
0.3706
0.3706
0.3706
0.3706
5,851.0219
5,851.0219
0.1121
0.1073
5,886.6303
B - 222

Supplemental Air Quality Analysis (Commercial Land Use Alternative) Barrett Ranch East – Sacramento County, California
8
Mitigated
NaturalGas Use ROG NOx CO SO2 Fugitive
PM10 Exhaust PM10
PM10 Total
Fugitive PM2.5
Exhaust PM2.5
PM2.5 Total
Bio- CO2
NBio- CO2 Total CO2 CH4 N2O CO2e
Land Use
kBTU/yr lb/day lb/day
Health Club
3.16965
0.0342
0.3108
0.2610
1.8600e-003
0.0236
0.0236
0.0236
0.0236
372.9002
372.9002
7.1500e-003
6.8400e-003
375.1697
Parking Lot
0
0.0000
0.0000
0.0000
0.0000
0.0000
0.0000
0.0000
0.0000
0.0000
0.0000
0.0000
0.0000
0.0000
Regional Shopping
Center
0.314522
3.3900e-003
0.0308
0.0259
1.9000e-004
2.3400e-003
2.3400e-003
2.3400e-003
2.3400e-003
37.0026
37.0026
7.1000e-004
6.8000e-004
37.2277
Single Family Housing
27.3024
0.2944
2.5161
1.0707
0.0161
0.2034
0.2034
0.2034
0.2034
3,212.0473
3,212.0473
0.0616
0.0589
3,231.5953
Apartments Low Rise
0.603681
6.5100e-003
0.0556
0.0237
3.6000e-004
4.5000e-003
4.5000e-003
4.5000e-003
4.5000e-003
71.0213
71.0213
1.3600e-003
1.3000e-003
71.4535
Total 0.3385
2.9133
1.3813
0.0185
0.2339
0.2339
0.2339
0.2339
3,692.9714
3,692.9714
0.0708
0.0677
3,715.4462
6.0 Area Detail
6.1 Mitigation Measures Area
ROG NOx CO SO2 Fugitive PM10
Exhaust PM10
PM10 Total
Fugitive PM2.5
Exhaust PM2.5
PM2.5 Total
Bio- CO2 NBio- CO2
Total CO2
CH4 N2O CO2e
Category
lb/day lb/day
Mitigated
35.4362
0.5002
43.2616
2.2800e-003
0.2378
0.2378
0.2378
0.2378
0.0000
77.6567
77.6567
0.0759
0.0000
79.2509
B - 223
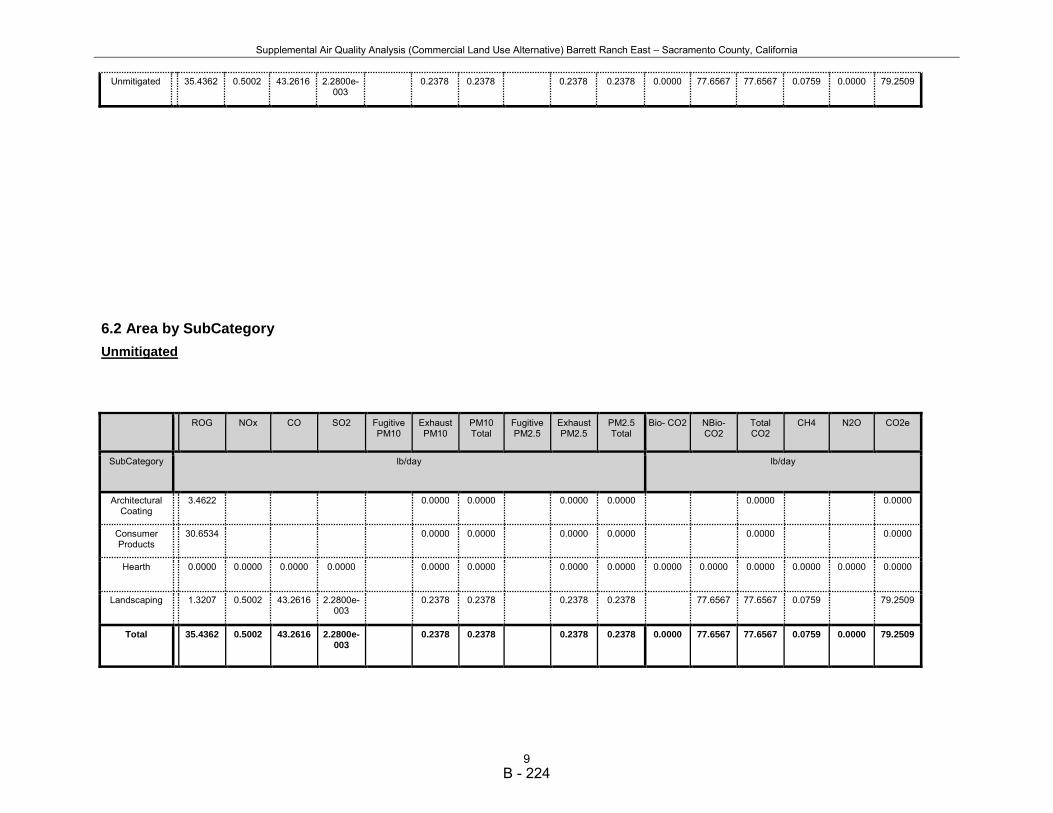
Supplemental Air Quality Analysis (Commercial Land Use Alternative) Barrett Ranch East – Sacramento County, California
9
Unmitigated
35.4362
0.5002
43.2616
2.2800e-003
0.2378
0.2378
0.2378
0.2378
0.0000
77.6567
77.6567
0.0759
0.0000
79.2509
6.2 Area by SubCategory
Unmitigated
ROG NOx CO SO2 Fugitive PM10
Exhaust PM10
PM10 Total
Fugitive PM2.5
Exhaust PM2.5
PM2.5 Total
Bio- CO2 NBio- CO2
Total CO2
CH4 N2O CO2e
SubCategory
lb/day lb/day
Architectural Coating
3.4622
0.0000
0.0000
0.0000
0.0000
0.0000
0.0000
Consumer Products
30.6534
0.0000
0.0000
0.0000
0.0000
0.0000
0.0000
Hearth
0.0000
0.0000
0.0000
0.0000
0.0000
0.0000
0.0000
0.0000
0.0000
0.0000
0.0000
0.0000
0.0000
0.0000
Landscaping
1.3207
0.5002
43.2616
2.2800e-003
0.2378
0.2378
0.2378
0.2378
77.6567
77.6567
0.0759
79.2509
Total 35.4362
0.5002
43.2616
2.2800e-003
0.2378
0.2378
0.2378
0.2378
0.0000
77.6567
77.6567
0.0759
0.0000
79.2509
B - 224

Supplemental Air Quality Analysis (Commercial Land Use Alternative) Barrett Ranch East – Sacramento County, California
10
Mitigated
ROG NOx CO SO2 Fugitive PM10
Exhaust PM10
PM10 Total
Fugitive PM2.5
Exhaust PM2.5
PM2.5 Total
Bio- CO2 NBio- CO2
Total CO2
CH4 N2O CO2e
SubCategory
lb/day lb/day
Architectural Coating
3.4622
0.0000
0.0000
0.0000
0.0000
0.0000
0.0000
Consumer Products
30.6534
0.0000
0.0000
0.0000
0.0000
0.0000
0.0000
Hearth
0.0000
0.0000
0.0000
0.0000
0.0000
0.0000
0.0000
0.0000
0.0000
0.0000
0.0000
0.0000
0.0000
0.0000
Landscaping
1.3207
0.5002
43.2616
2.2800e-003
0.2378
0.2378
0.2378
0.2378
77.6567
77.6567
0.0759
79.2509
Total 35.4362
0.5002
43.2616
2.2800e-003
0.2378
0.2378
0.2378
0.2378
0.0000
77.6567
77.6567
0.0759
0.0000
79.2509
7.0 Water Detail
7.1 Mitigation Measures Water
8.0 Waste Detail
8.1 Mitigation Measures Waste
9.0 Operational Offroad
Equipment Type Number Hours/Day Days/Year Horse Power Load Factor Fuel Type
10.0 Vegetation
B - 225
Supplemental Air Quality Analysis (Commercial Land Use Alternative) Barrett Ranch East – Sacramento County, California
11
B - 226

CalEEMod Version: CalEEMod.2013.2.2
Date: 7/11/2016 2:01 PM
A-12
CalEEMod – Annual Results
Barrett Ranch East - Commercial Alternative
Sacramento County, Annual
1.0 Project Characteristics
1.1 Land Usage
Land Uses Size Metric Lot Acreage Floor Surface Area Population
Parking Lot 435.60 1000sqft 10.00 435,600.00 0
Health Club 45.00 1000sqft 6.50 45,000.00 0
Apartments Low Rise 26.00 Dwelling Unit 2.10 26,000.00 69
Single Family Housing 496.00 Dwelling Unit 93.10 892,800.00 1324
Regional Shopping Center 33.00 1000sqft 8.30 33,000.00 0
1.2 Other Project Characteristics
Urbanization
Urban
Wind Speed (m/s)
3.5
Precipitation Freq (Days)
58
Climate Zone
6
Operational Year
2020
Utility Company
Sacramento Municipal Utility District
CO2 Intensity (lb/MWhr)
590.31
CH4 Intensity (lb/MWhr)
0.029
N2O Intensity (lb/MWhr)
0.006
1.3 User Entered Comments & Non-Default Data
Project Characteristics -
Land Use - Land use, unit amount and ot acreage infomation was provided by the Applicant.
Construction Phase - Assumed construction schedule
On-road Fugitive Dust - Percent paved road are based on the assumption that 100% of travel will be on paved road
B - 227

CalEEMod Version: CalEEMod.2013.2.2
Date: 7/11/2016 2:01 PM
13
Grading - Assumed all material will be balanced on site, so no net import or export.
Vehicle Trips - Used daily trip rates provided by the Applicant with a 18% trip reduction.
Energy Use - Change default Ttle 24 Energy to incoprate 2013 Title 24 energy construction standards.
Construction Off-road Equipment Mitigation - Construction Off-road Equipment Mitigation - 75% reduction represents Enhanced Construction Emission Control to control fugitive dust.
Energy Mitigation -
Table Name Column Name Default Value New Value
tblArchitecturalCoating ConstArea_Nonresidential_Exterior 45,534.00 39,408.00
tblArchitecturalCoating ConstArea_Nonresidential_Interior 136,602.00 118,224.00
tblAreaCoating Area_Nonresidential_Interior 136602 118224
tblConstDustMitigation WaterExposedAreaPM10PercentReduction 55 75
tblConstDustMitigation WaterExposedAreaPM25PercentReduction 55 75
tblConstructionPhase NumDays 220.00 586.00
tblConstructionPhase NumDays 3,100.00 684.00
tblConstructionPhase NumDays 310.00 28.00
tblConstructionPhase NumDays 220.00 25.00
tblConstructionPhase NumDays 120.00 22.00
tblConstructionPhase PhaseEndDate 2/25/2022 12/27/2019
tblConstructionPhase PhaseStartDate 11/29/2019 9/29/2017
tblGrading AcresOfGrading 70.00 775.00
tblLandUse LotAcreage 1.03 6.50
tblLandUse LotAcreage 1.63 2.10
tblLandUse LotAcreage 161.04 93.10
tblLandUse LotAcreage 0.76 8.30
tblProjectCharacteristics OperationalYear 2014 2020
tblTripsAndVMT VendorTripNumber 140.00 73.00
B - 228

Supplemental Air Quality Analysis (Commercial Land Use Alternative) Barrett Ranch East – Sacramento County, California
14
tblTripsAndVMT WorkerTripNumber 410.00 238.00
tblTripsAndVMT WorkerTripNumber 82.00 48.00
tblVehicleTrips ST_TR 7.16 8.35
tblVehicleTrips ST_TR 20.87 25.37
tblVehicleTrips ST_TR 49.97 77.10
tblVehicleTrips ST_TR 10.08 7.05
tblVehicleTrips SU_TR 6.07 8.35
tblVehicleTrips SU_TR 26.73 25.37
tblVehicleTrips SU_TR 25.24 77.10
tblVehicleTrips SU_TR 8.77 7.05
tblVehicleTrips WD_TR 6.59 8.35
tblVehicleTrips WD_TR 32.93 25.37
tblVehicleTrips WD_TR 42.94 77.10
tblVehicleTrips WD_TR 9.57 7.05
2.0 Emissions Summary
2.2 Overall Operational
Unmitigated Operational
ROG NOx CO SO2 Fugitive PM10
Exhaust PM10
PM10 Total
Fugitive PM2.5
Exhaust PM2.5
PM2.5 Total
Bio- CO2 NBio- CO2 Total CO2 CH4 N2O CO2e
Category
tons/yr MT/yr
Area
6.3912
0.0625
5.4077
2.8000e-004
0.0297
0.0297
0.0297
0.0297
0.0000
8.8061
8.8061
8.6100e-003
0.0000
8.9869
B - 229

CalEEMod Version: CalEEMod.2013.2.2
Date: 7/11/2016 2:01 PM
15
Energy
0.0979
0.8419
0.3959
5.3400e-003
0.0676
0.0676
0.0676
0.0676
0.0000
2,399.6086
2,399.6086
0.0889
0.0323
2,411.4888
Mobile
3.3952
6.4597
32.2611
0.0786
5.4585
0.0940
5.5525
1.4624
0.0868
1.5491
0.0000
5,437.0984
5,437.0984
0.2111
0.0000
5,441.5324
Waste
0.0000
0.0000
0.0000
0.0000
158.2822
0.0000
158.2822
9.3542
0.0000
354.7206
Water
0.0000
0.0000
0.0000
0.0000
13.8394
75.2133
89.0527
0.0513
0.0309
99.6974
Total 9.8843
7.3641
38.0647
0.0842
5.4585
0.1914
5.6499
1.4624
0.1841
1.6465
172.1216
7,920.7264
8,092.8480
9.7142
0.0632
8,316.4261
B - 230
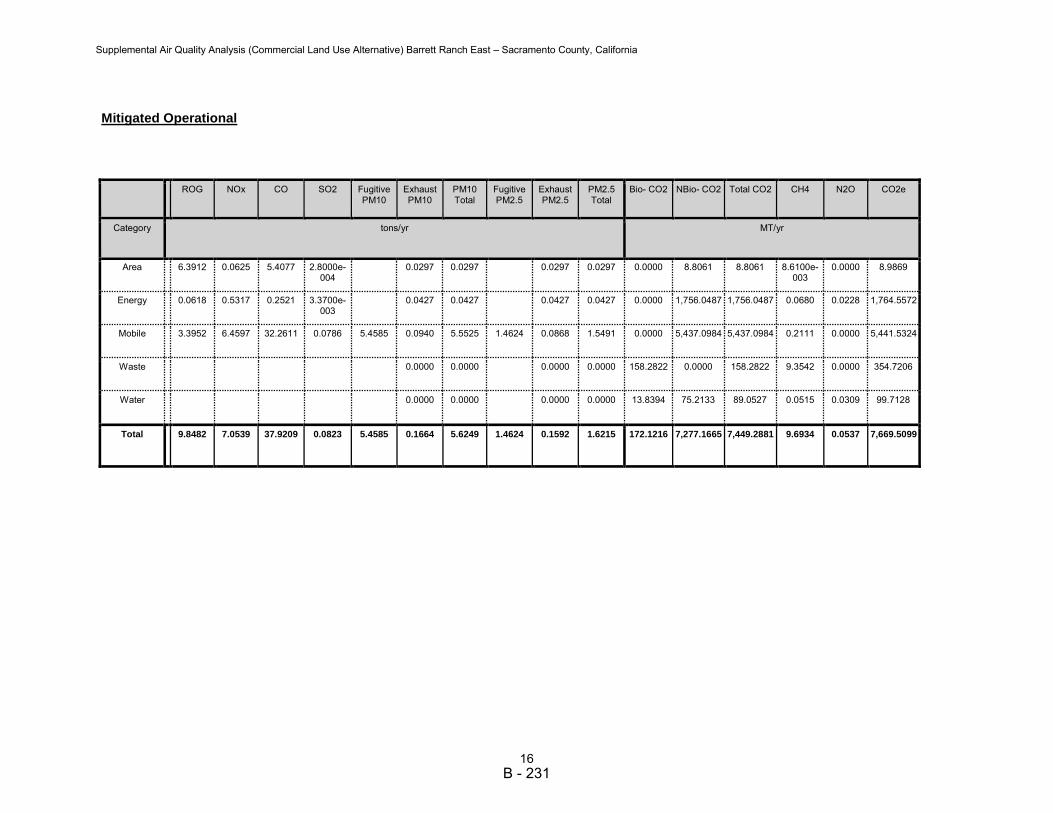
Supplemental Air Quality Analysis (Commercial Land Use Alternative) Barrett Ranch East – Sacramento County, California
16
Mitigated Operational
ROG NOx CO SO2 Fugitive PM10
Exhaust PM10
PM10 Total
Fugitive PM2.5
Exhaust PM2.5
PM2.5 Total
Bio- CO2 NBio- CO2 Total CO2 CH4 N2O CO2e
Category
tons/yr MT/yr
Area
6.3912
0.0625
5.4077
2.8000e-004
0.0297
0.0297
0.0297
0.0297
0.0000
8.8061
8.8061
8.6100e-003
0.0000
8.9869
Energy
0.0618
0.5317
0.2521
3.3700e-003
0.0427
0.0427
0.0427
0.0427
0.0000
1,756.0487
1,756.0487
0.0680
0.0228
1,764.5572
Mobile
3.3952
6.4597
32.2611
0.0786
5.4585
0.0940
5.5525
1.4624
0.0868
1.5491
0.0000
5,437.0984
5,437.0984
0.2111
0.0000
5,441.5324
Waste
0.0000
0.0000
0.0000
0.0000
158.2822
0.0000
158.2822
9.3542
0.0000
354.7206
Water
0.0000
0.0000
0.0000
0.0000
13.8394
75.2133
89.0527
0.0515
0.0309
99.7128
Total 9.8482
7.0539
37.9209
0.0823
5.4585
0.1664
5.6249
1.4624
0.1592
1.6215
172.1216
7,277.1665
7,449.2881
9.6934
0.0537
7,669.5099
B - 231
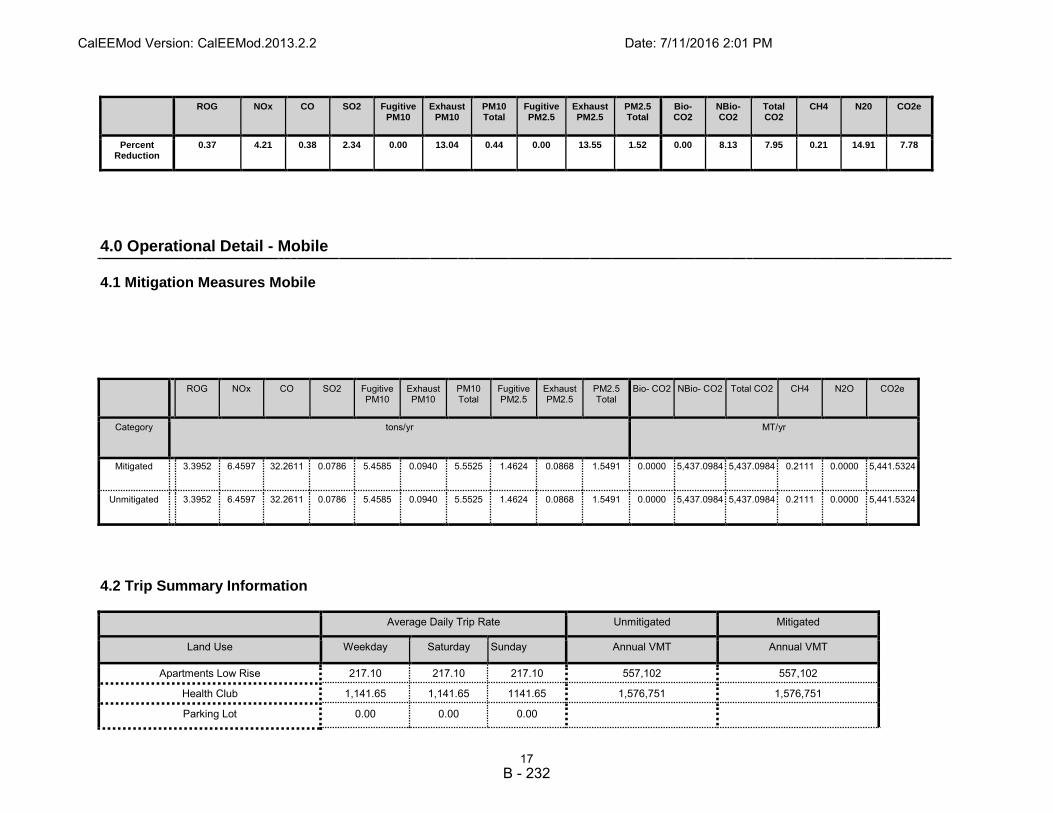
CalEEMod Version: CalEEMod.2013.2.2
Date: 7/11/2016 2:01 PM
17
ROG
NOx
CO
SO2
Fugitive PM10
Exhaust PM10
PM10 Total
Fugitive PM2.5
Exhaust PM2.5
PM2.5 Total
Bio- CO2
NBio-CO2
Total CO2
CH4
N20
CO2e
Percent Reduction
0.37
4.21
0.38
2.34
0.00
13.04
0.44
0.00
13.55
1.52
0.00
8.13
7.95
0.21
14.91
7.78
4.0 Operational Detail - Mobile
4.1 Mitigation Measures Mobile
ROG NOx CO SO2 Fugitive PM10
Exhaust PM10
PM10 Total
Fugitive PM2.5
Exhaust PM2.5
PM2.5 Total
Bio- CO2 NBio- CO2 Total CO2 CH4 N2O CO2e
Category
tons/yr MT/yr
Mitigated
3.3952
6.4597
32.2611
0.0786
5.4585
0.0940
5.5525
1.4624
0.0868
1.5491
0.0000
5,437.0984
5,437.0984
0.2111
0.0000
5,441.5324
Unmitigated
3.3952
6.4597
32.2611
0.0786
5.4585
0.0940
5.5525
1.4624
0.0868
1.5491
0.0000
5,437.0984
5,437.0984
0.2111
0.0000
5,441.5324
4.2 Trip Summary Information
Average Daily Trip Rate Unmitigated Mitigated
Land Use Weekday Saturday Sunday Annual VMT Annual VMT
Apartments Low Rise 217.10 217.10 217.10 557,102 557,102
Health Club 1,141.65 1,141.65 1141.65 1,576,751 1,576,751
Parking Lot 0.00 0.00 0.00
B - 232

Supplemental Air Quality Analysis (Commercial Land Use Alternative) Barrett Ranch East – Sacramento County, California
18
Regional Shopping Center 2,544.30 2,544.30 2544.30 3,555,163 3,555,163
Single Family Housing 3,496.80 3,496.80 3496.80 8,973,170 8,973,170
Total 7,399.85 7,399.85 7,399.85 14,662,187 14,662,187
4.3 Trip Type Information
Miles Trip % Trip Purpose %
Land Use H-W or C-W H-S or C-C H-O or C-NW
H-W or C-W
H-S or C-C H-O or C-NW Primary Diverted Pass-by
Apartments Low Rise
10.00
5.00
6.50
46.50
12.50
41.00
86
11
3
Health Club
10.00
5.00
6.50
16.90
64.10
19.00
52
39
9
Parking Lot
10.00
5.00
6.50
0.00
0.00
0.00
0
0
0
Regional Shopping Center
10.00
5.00
6.50
16.30
64.70
19.00
54
35
11
Single Family Housing
10.00
5.00
6.50
46.50
12.50
41.00
86
11
3
LDA LDT1 LDT2 MDV LHD1 LHD2 MHD HHD OBUS UBUS MCY SBUS MH
0.503605 0.067800 0.178973 0.146934 0.044621 0.006359 0.021238 0.016884 0.002315 0.002275 0.006260 0.000554 0.002182
5.0 Energy Detail
4.4 Fleet Mix
Historical Energy Use: N
5.1 Mitigation Measures Energy
Exceed Title 24
Install High Efficiency Lighting
B - 233
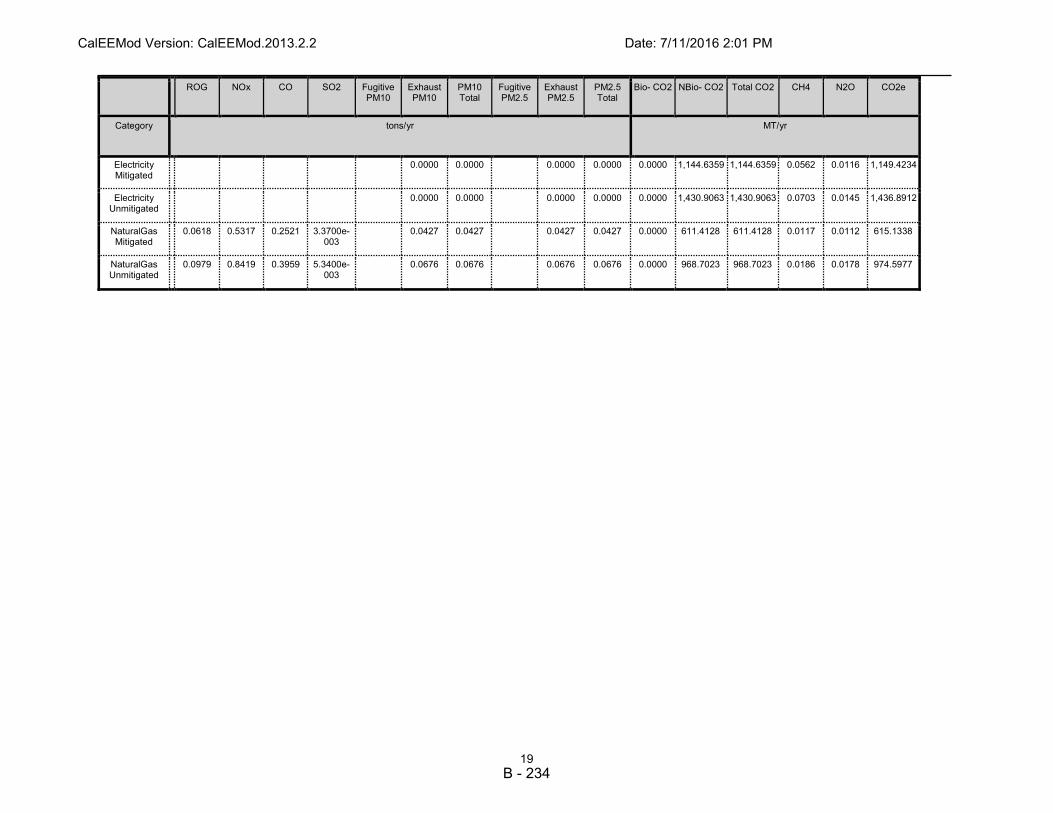
CalEEMod Version: CalEEMod.2013.2.2
Date: 7/11/2016 2:01 PM
19
ROG NOx CO SO2 Fugitive PM10
Exhaust PM10
PM10 Total
Fugitive PM2.5
Exhaust PM2.5
PM2.5 Total
Bio- CO2 NBio- CO2 Total CO2 CH4 N2O CO2e
Category
tons/yr MT/yr
Electricity Mitigated
0.0000
0.0000
0.0000
0.0000
0.0000
1,144.6359
1,144.6359
0.0562
0.0116
1,149.4234
Electricity Unmitigated
0.0000
0.0000
0.0000
0.0000
0.0000
1,430.9063
1,430.9063
0.0703
0.0145
1,436.8912
NaturalGas Mitigated
0.0618
0.5317
0.2521
3.3700e-003
0.0427
0.0427
0.0427
0.0427
0.0000
611.4128
611.4128
0.0117
0.0112
615.1338
NaturalGas Unmitigated
0.0979
0.8419
0.3959
5.3400e-003
0.0676
0.0676
0.0676
0.0676
0.0000
968.7023
968.7023
0.0186
0.0178
974.5977
B - 234

Supplemental Air Quality Analysis (Commercial Land Use Alternative) Barrett Ranch East – Sacramento County, California
20
5.2 Energy by Land Use - NaturalGas
Unmitigated
NaturalGas Use ROG NOx CO SO2 Fugitive
PM10 Exhaust PM10
PM10 Total
Fugitive PM2.5
Exhaust PM2.5
PM2.5 Total
Bio- CO2
NBio- CO2
Total CO2
CH4 N2O CO2e
Land Use
kBTU/yr tons/yr MT/yr
Apartments Low Rise
352718
1.9000e-003
0.0163
6.9200e-003
1.0000e-004
1.3100e-003
1.3100e-003
1.3100e-003
1.3100e-003
0.0000
18.8224
18.8224
3.6000e-004
3.5000e-004
18.9369
Health Club
1.66635e+006
8.9900e-003
0.0817
0.0686
4.9000e-004
6.2100e-003
6.2100e-003
6.2100e-003
6.2100e-003
0.0000
88.9228
88.9228
1.7000e-003
1.6300e-003
89.4640
Parking Lot
0
0.0000
0.0000
0.0000
0.0000
0.0000
0.0000
0.0000
0.0000
0.0000
0.0000
0.0000
0.0000
0.0000
0.0000
Regional Shopping
Center
186450
1.0100e-003
9.1400e-003
7.6800e-003
5.0000e-005
6.9000e-004
6.9000e-004
6.9000e-004
6.9000e-004
0.0000
9.9497
9.9497
1.9000e-004
1.8000e-004
10.0102
Single Family Housing
1.59473e+007
0.0860
0.7348
0.3127
4.6900e-003
0.0594
0.0594
0.0594
0.0594
0.0000
851.0075
851.0075
0.0163
0.0156
856.1866
Total 0.0979
0.8419
0.3959
5.3300e-003
0.0676
0.0676
0.0676
0.0676
0.0000
968.7023
968.7023
0.0186
0.0178
974.5977
B - 235

CalEEMod Version: CalEEMod.2013.2.2
Date: 7/11/2016 2:01 PM
21
Mitigated
NaturalGas Use ROG NOx CO SO2 Fugitive
PM10 Exhaust PM10
PM10 Total
Fugitive PM2.5
Exhaust PM2.5
PM2.5 Total
Bio- CO2
NBio- CO2
Total CO2
CH4 N2O CO2e
Land Use
kBTU/yr tons/yr MT/yr
Health Club
1.15692e+006
6.2400e-003
0.0567
0.0476
3.4000e-004
4.3100e-003
4.3100e-003
4.3100e-003
4.3100e-003
0.0000
61.7378
61.7378
1.1800e-003
1.1300e-003
62.1135
Parking Lot
0
0.0000
0.0000
0.0000
0.0000
0.0000
0.0000
0.0000
0.0000
0.0000
0.0000
0.0000
0.0000
0.0000
0.0000
Regional Shopping
Center
114800
6.2000e-004
5.6300e-003
4.7300e-003
3.0000e-005
4.3000e-004
4.3000e-004
4.3000e-004
4.3000e-004
0.0000
6.1262
6.1262
1.2000e-004
1.1000e-004
6.1635
Single Family Housing
9.96538e+006
0.0537
0.4592
0.1954
2.9300e-003
0.0371
0.0371
0.0371
0.0371
0.0000
531.7905
531.7905
0.0102
9.7500e-003
535.0268
Apartments Low Rise
220344
1.1900e-003
0.0102
4.3200e-003
6.0000e-005
8.2000e-004
8.2000e-004
8.2000e-004
8.2000e-004
0.0000
11.7584
11.7584
2.3000e-004
2.2000e-004
11.8299
Total 0.0618
0.5317
0.2521
3.3600e-003
0.0427
0.0427
0.0427
0.0427
0.0000
611.4128
611.4128
0.0117
0.0112
615.1338
B - 236

Supplemental Air Quality Analysis (Commercial Land Use Alternative) Barrett Ranch East – Sacramento County, California
22
5.3 Energy by Land Use - Electricity
Unmitigated
Electricity Use Total CO2 CH4 N2O CO2e
Land Use
kWh/yr tons/yr MT/yr
Apartments Low Rise
98547.3
26.3870
1.3000e-003
2.7000e-004
26.4974
Health Club
745200
199.5348
9.8000e-003
2.0300e-003
200.3694
Parking Lot
383328
102.6400
5.0400e-003
1.0400e-003
103.0692
Regional Shopping
Center
428010
114.6040
5.6300e-003
1.1600e-003
115.0833
Single Family
Housing
3.6889e+006
987.7405
0.0485
0.0100
991.8718
Total 1,430.9063
0.0703
0.0145
1,436.8911
B - 237

CalEEMod Version: CalEEMod.2013.2.2
Date: 7/11/2016 2:01 PM
23
Mitigated
Electricity Use Total CO2 CH4 N2O CO2e
Land Use
kWh/yr tons/yr MT/yr
Apartments Low Rise
84691.1
22.6769
1.1100e-003
2.3000e-004
22.7718
Health Club
551448
147.6558
7.2500e-003
1.5000e-003
148.2734
Parking Lot
206997
55.4256
2.7200e-003
5.6000e-004
55.6574
Regional Shopping
Center
276362
73.9987
3.6400e-003
7.5000e-004
74.3082
Single Family
Housing
3.15536e+006
844.8790
0.0415
8.5900e-003
848.4127
Total 1,144.6359
0.0562
0.0116
1,149.4234
6.0 Area Detail
6.1 Mitigation Measures Area
ROG NOx CO SO2 Fugitive PM10
Exhaust PM10
PM10 Total
Fugitive PM2.5
Exhaust PM2.5
PM2.5 Total
Bio- CO2 NBio- CO2
Total CO2
CH4 N2O CO2e
Category
tons/yr MT/yr
Mitigated
6.3912
0.0625
5.4077
2.8000e-004
0.0297
0.0297
0.0297
0.0297
0.0000
8.8061
8.8061
8.6100e-003
0.0000
8.9869
B - 238

Supplemental Air Quality Analysis (Commercial Land Use Alternative) Barrett Ranch East – Sacramento County, California
24
Unmitigated
6.3912
0.0625
5.4077
2.8000e-004
0.0297
0.0297
0.0297
0.0297
0.0000
8.8061
8.8061
8.6100e-003
0.0000
8.9869
6.2 Area by SubCategory
Unmitigated
ROG NOx CO SO2 Fugitive PM10
Exhaust PM10
PM10 Total
Fugitive PM2.5
Exhaust PM2.5
PM2.5 Total
Bio- CO2 NBio- CO2
Total CO2
CH4 N2O CO2e
SubCategory
tons/yr MT/yr
Architectural Coating
0.6318
0.0000
0.0000
0.0000
0.0000
0.0000
0.0000
0.0000
0.0000
0.0000
0.0000
Consumer Products
5.5942
0.0000
0.0000
0.0000
0.0000
0.0000
0.0000
0.0000
0.0000
0.0000
0.0000
Hearth
0.0000
0.0000
0.0000
0.0000
0.0000
0.0000
0.0000
0.0000
0.0000
0.0000
0.0000
0.0000
0.0000
0.0000
Landscaping
0.1651
0.0625
5.4077
2.8000e-004
0.0297
0.0297
0.0297
0.0297
0.0000
8.8061
8.8061
8.6100e-003
0.0000
8.9869
Total 6.3912
0.0625
5.4077
2.8000e-004
0.0297
0.0297
0.0297
0.0297
0.0000
8.8061
8.8061
8.6100e-003
0.0000
8.9869
B - 239

CalEEMod Version: CalEEMod.2013.2.2
Date: 7/11/2016 2:01 PM
25
Mitigated
ROG NOx CO SO2 Fugitive PM10
Exhaust PM10
PM10 Total
Fugitive PM2.5
Exhaust PM2.5
PM2.5 Total
Bio- CO2 NBio- CO2
Total CO2
CH4 N2O CO2e
SubCategory
tons/yr MT/yr
Architectural Coating
0.6318
0.0000
0.0000
0.0000
0.0000
0.0000
0.0000
0.0000
0.0000
0.0000
0.0000
Consumer Products
5.5942
0.0000
0.0000
0.0000
0.0000
0.0000
0.0000
0.0000
0.0000
0.0000
0.0000
Hearth
0.0000
0.0000
0.0000
0.0000
0.0000
0.0000
0.0000
0.0000
0.0000
0.0000
0.0000
0.0000
0.0000
0.0000
Landscaping
0.1651
0.0625
5.4077
2.8000e-004
0.0297
0.0297
0.0297
0.0297
0.0000
8.8061
8.8061
8.6100e-003
0.0000
8.9869
Total 6.3912
0.0625
5.4077
2.8000e-004
0.0297
0.0297
0.0297
0.0297
0.0000
8.8061
8.8061
8.6100e-003
0.0000
8.9869
7.0 Water Detail
7.1 Mitigation Measures Water
Total CO2
CH4 N2O CO2e
Category
tons/yr MT/yr
Mitigated
89.0527
0.0515
0.0309
99.7128
Unmitigated
89.0527
0.0513
0.0309
99.6974
B - 240

Supplemental Air Quality Analysis (Commercial Land Use Alternative) Barrett Ranch East – Sacramento County, California
26
7.2 Water by Land Use
Unmitigated
Indoor/Outdoor Use Total
CO2 CH4 N2O CO2e
Land Use
Mgal tons/yr MT/yr
Apartments Low Rise
1.694 / 1.06796
3.8602
2.2200e-003
1.3400e-003
4.3212
Health Club
2.66144 / 1.63121
6.0211
3.4900e-003
2.1000e-003
6.7452
Parking Lot
0 / 0
0.0000
0.0000
0.0000
0.0000
Regional Shopping
Center
2.44439 / 1.49818
5.5300
3.2100e-003
1.9300e-003
6.1951
Single Family
Housing
32.3164 / 20.3734
73.6414
0.0424
0.0255
82.4359
Total 89.0527
0.0513
0.0309
99.6974
B - 241

CalEEMod Version: CalEEMod.2013.2.2
Date: 7/11/2016 2:01 PM
27
Mitigated
Indoor/Outdoor Use Total
CO2 CH4 N2O CO2e
Land Use
Mgal tons/yr MT/yr
Apartments Low Rise
1.694 / 1.06796
3.8602
2.2300e-003
1.3400e-003
4.3219
Health Club
2.66144 / 1.63121
6.0211
3.5000e-003
2.1000e-003
6.7462
Parking Lot
0 / 0
0.0000
0.0000
0.0000
0.0000
Regional Shopping
Center
2.44439 / 1.49818
5.5300
3.2200e-003
1.9300e-003
6.1960
Single Family
Housing
32.3164 / 20.3734
73.6414
0.0426
0.0255
82.4487
Total 89.0527
0.0515
0.0309
99.7128
8.0 Waste Detail
8.1 Mitigation Measures Waste
Category/Year
Total CO2 CH4 N2O CO2e
tons/yr MT/yr
B - 242
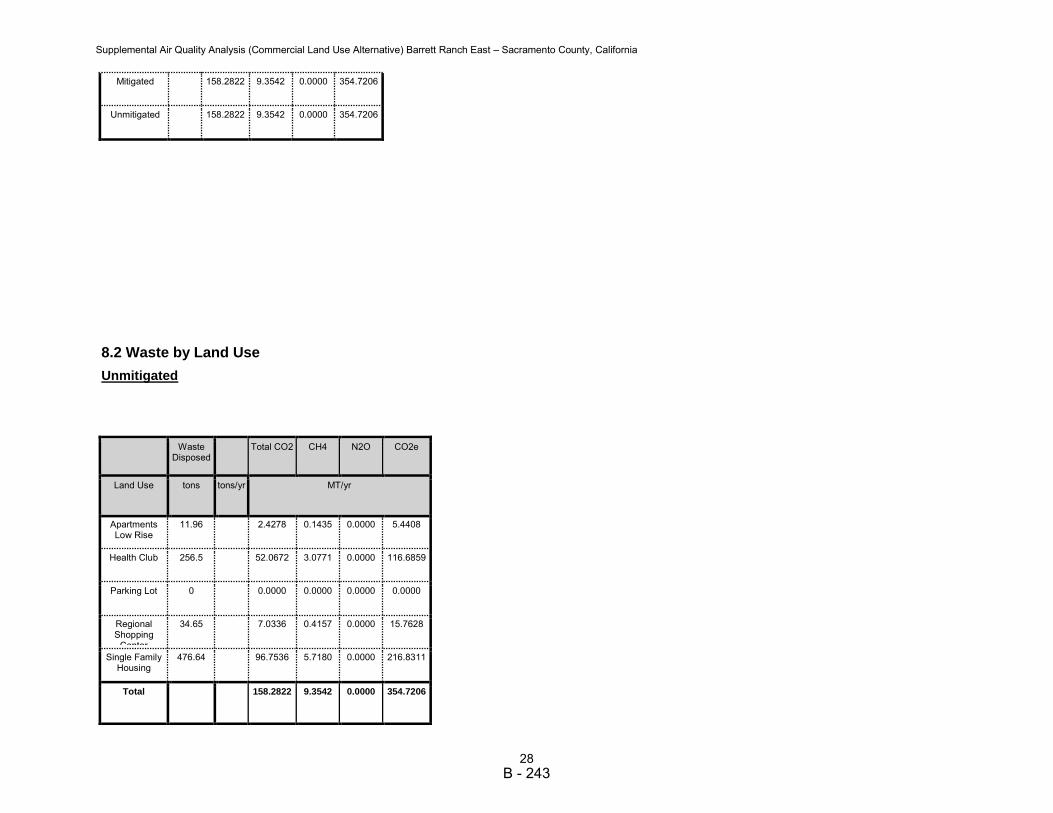
Supplemental Air Quality Analysis (Commercial Land Use Alternative) Barrett Ranch East – Sacramento County, California
28
Mitigated
158.2822
9.3542
0.0000
354.7206
Unmitigated
158.2822
9.3542
0.0000
354.7206
8.2 Waste by Land Use
Unmitigated
Waste Disposed Total CO2 CH4 N2O CO2e
Land Use
tons tons/yr MT/yr
Apartments Low Rise
11.96
2.4278
0.1435
0.0000
5.4408
Health Club
256.5
52.0672
3.0771
0.0000
116.6859
Parking Lot
0
0.0000
0.0000
0.0000
0.0000
Regional Shopping
Center
34.65
7.0336
0.4157
0.0000
15.7628
Single Family Housing
476.64
96.7536
5.7180
0.0000
216.8311
Total 158.2822
9.3542
0.0000
354.7206
B - 243

CalEEMod Version: CalEEMod.2013.2.2
Date: 7/11/2016 2:01 PM
29
Mitigated
Waste Disposed Total CO2 CH4 N2O CO2e
Land Use
tons tons/yr MT/yr
Apartments Low Rise
11.96
2.4278
0.1435
0.0000
5.4408
Health Club
256.5
52.0672
3.0771
0.0000
116.6859
Parking Lot
0
0.0000
0.0000
0.0000
0.0000
Regional Shopping
Center
34.65
7.0336
0.4157
0.0000
15.7628
Single Family Housing
476.64
96.7536
5.7180
0.0000
216.8311
Total 158.2822
9.3542
0.0000
354.7206
9.0 Operational Offroad
Equipment Type Number Hours/Day Days/Year Horse Power Load Factor Fuel Type
10.0 Vegetation
B - 244
Barrett Ranch East Air Quality Technical Report Appendix C - 1 ESA/140728
Appendix C – Operational Air Quality Mitigation Plan
Table of Contents Appendix C – Operational Air Quality Mitigation Plan ................................................................. 1
Introduction ................................................................................................................................. 2
Result Summary .......................................................................................................................... 2
Unmitigated Emission Estimate .............................................................................................. 2
Mitigated Emission Estimate ................................................................................................... 3
B - 245

Barrett Ranch East Air Quality Technical Report Appendix C - 2 ESA/140728
Introduction SMAQMD guidance recommends that projects that exceed its operational significance
thresholds should prepare and implement an Air Quality Mitigation Plan (AQMP). The AQMP
must be incorporated into the project’s environmental document and be enforced by the local
jurisdiction. The objective of the AQMP is to reduce ozone precursor emissions by 15 percent
for projects considered to be in the State Implementation Plan and 35 percent for projects not
considered to be in the State Implementation Plan1,2
. The Barrett Ranch Project is considered to
be within the SIP3.
AQMPs can include two types of measures, those included within CalEEMod (known as on-
model measures) and those located solely within this guidance (called off-model measures).
This AQMP relies on a combination of on- and off-model measures.
On a ton for ton basis, NOx reductions provide greater ozone benefits than ROG reductions.
Thus, SMAQMD recommends normalizing ozone precursors based on their ozone creation
potential in units of Equivalent Oxides of Nitrogen (NOxe). To estimate NOxe, ROG is divided
by 3 and then added to total NOx. To estimate the effectiveness of a mitigation plan, the
following equation is used:
AQMP Effectiveness = ((Unmitigated Project NOxe – Mitigated NOxe)/(Unmitigated NOxe)) x
100.
This analysis uses SMAQMD’s recommended approach to estimate AQMP effectiveness.
Result Summary For the Barrett Ranch East Project, the AQMP analysis examines whether mitigation measures
can be used to reduce unmitigated emissions by 15%. This requires two steps. The first step
involves using CalEEMod to estimate unmitigated emissions.
Unmitigated Emission Estimate
The Project’s unmitigated ROG and NOx operational emissions were estimated using the
CalEEMod model (2013.2.2 version). The unmitigated CalEEMod results are shown in
Appendix A and summarized in Table C-1 below. The average daily trip rates used to generate
the results shown in Table C-1, are based on the CalEEMod default trip rates and trip lengths for
each land use type.4 Table C-1 shows that unmitigated ROG emissions exceed the SMAQMD
ROG significance threshold, hence the need for this AQMP.
1 Sacramento Metropolitan Air Quality Management District. Operational Emissions Mitigation. http://www.airquality.org/ceqa/mitigation.shtml. Accessed November 4, 2014.
2 SMAQMD Recommended Guidance for Land Use Emission Reductions, Version 3.1. June 2014.
3 Dubose, Rachel, SMAQMD. November 6, 2014 e-mail to Tim Rimpo, ESA regarding: “RE: Air Quality SIP
Question.” 4 Philley, Paul, SMAQMD. November 5, 2015 phone conversation with Tim Rimpo, ESA regarding calculation of the
unmitigated baseline.
B - 246
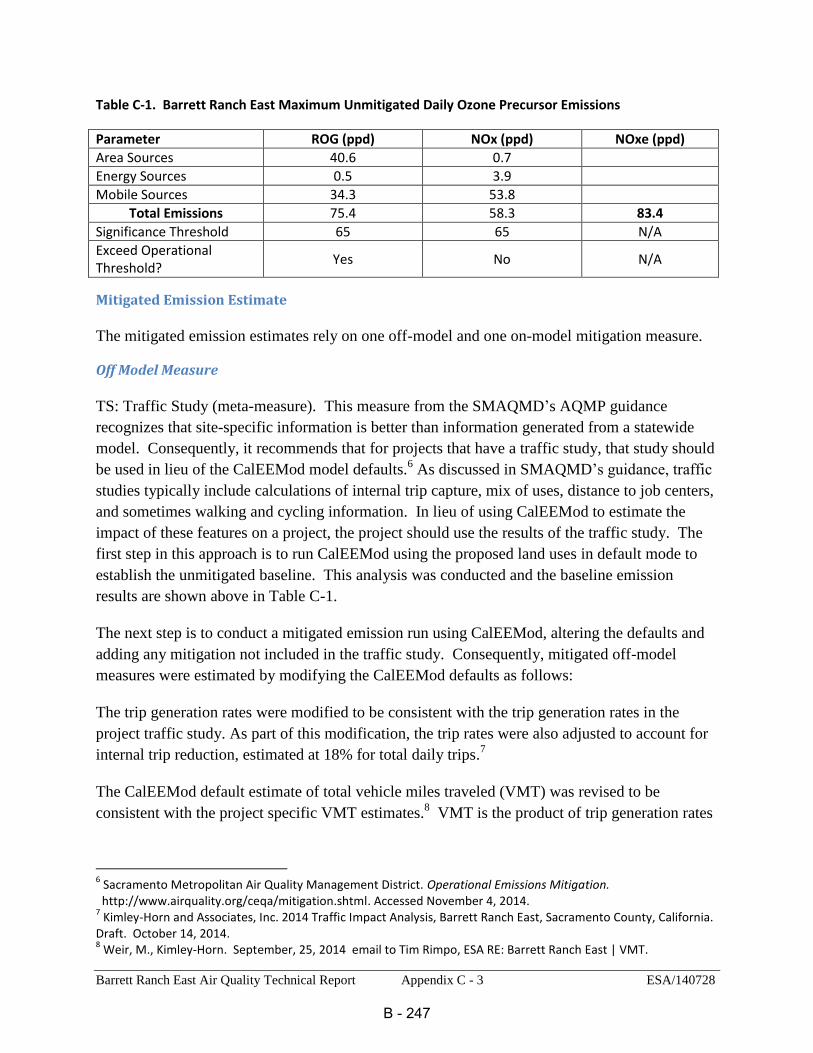
Barrett Ranch East Air Quality Technical Report Appendix C - 3 ESA/140728
Table C-1. Barrett Ranch East Maximum Unmitigated Daily Ozone Precursor Emissions
Parameter ROG (ppd) NOx (ppd) NOxe (ppd)
Area Sources 40.6 0.7
Energy Sources 0.5 3.9
Mobile Sources 34.3 53.8
Total Emissions 75.4 58.3 83.4
Significance Threshold 65 65 N/A
Exceed Operational Threshold?
Yes No N/A
Mitigated Emission Estimate
The mitigated emission estimates rely on one off-model and one on-model mitigation measure.
Off Model Measure
TS: Traffic Study (meta-measure). This measure from the SMAQMD’s AQMP guidance
recognizes that site-specific information is better than information generated from a statewide
model. Consequently, it recommends that for projects that have a traffic study, that study should
be used in lieu of the CalEEMod model defaults.6 As discussed in SMAQMD’s guidance, traffic
studies typically include calculations of internal trip capture, mix of uses, distance to job centers,
and sometimes walking and cycling information. In lieu of using CalEEMod to estimate the
impact of these features on a project, the project should use the results of the traffic study. The
first step in this approach is to run CalEEMod using the proposed land uses in default mode to
establish the unmitigated baseline. This analysis was conducted and the baseline emission
results are shown above in Table C-1.
The next step is to conduct a mitigated emission run using CalEEMod, altering the defaults and
adding any mitigation not included in the traffic study. Consequently, mitigated off-model
measures were estimated by modifying the CalEEMod defaults as follows:
The trip generation rates were modified to be consistent with the trip generation rates in the
project traffic study. As part of this modification, the trip rates were also adjusted to account for
internal trip reduction, estimated at 18% for total daily trips.7
The CalEEMod default estimate of total vehicle miles traveled (VMT) was revised to be
consistent with the project specific VMT estimates.8 VMT is the product of trip generation rates
6 Sacramento Metropolitan Air Quality Management District. Operational Emissions Mitigation. http://www.airquality.org/ceqa/mitigation.shtml. Accessed November 4, 2014.
7 Kimley-Horn and Associates, Inc. 2014 Traffic Impact Analysis, Barrett Ranch East, Sacramento County, California.
Draft. October 14, 2014. 8 Weir, M., Kimley-Horn. September, 25, 2014 email to Tim Rimpo, ESA RE: Barrett Ranch East | VMT.
B - 247
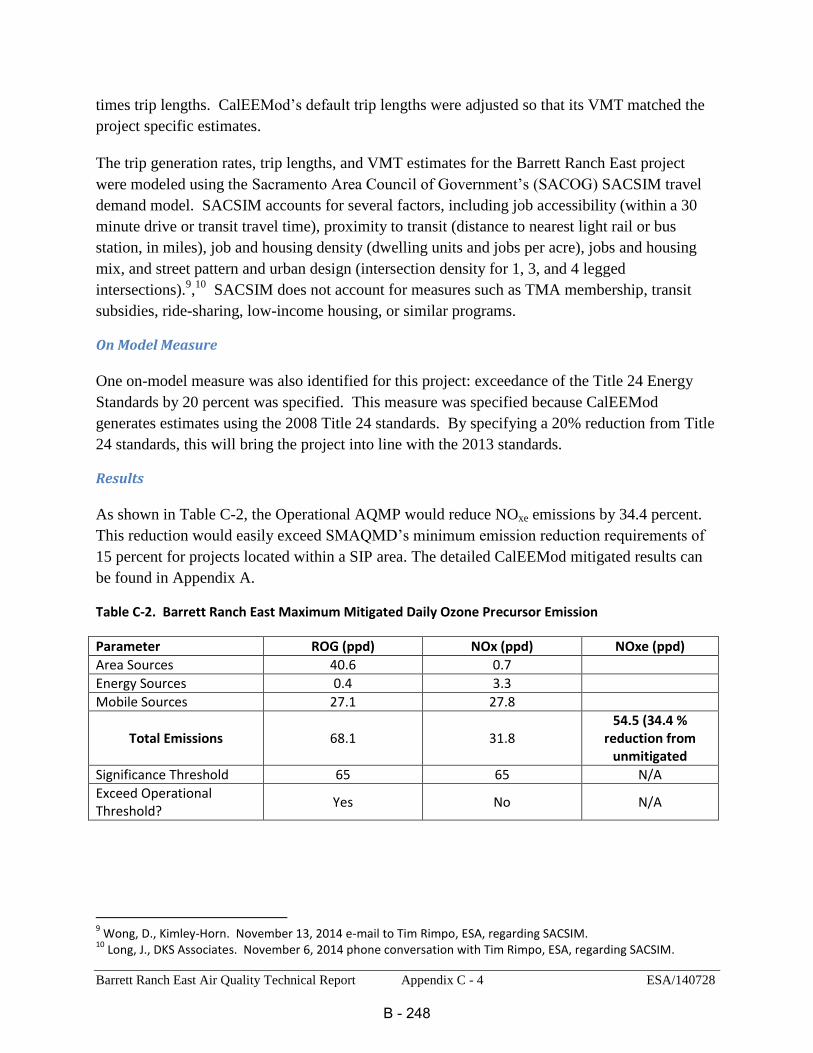
Barrett Ranch East Air Quality Technical Report Appendix C - 4 ESA/140728
times trip lengths. CalEEMod’s default trip lengths were adjusted so that its VMT matched the
project specific estimates.
The trip generation rates, trip lengths, and VMT estimates for the Barrett Ranch East project
were modeled using the Sacramento Area Council of Government’s (SACOG) SACSIM travel
demand model. SACSIM accounts for several factors, including job accessibility (within a 30
minute drive or transit travel time), proximity to transit (distance to nearest light rail or bus
station, in miles), job and housing density (dwelling units and jobs per acre), jobs and housing
mix, and street pattern and urban design (intersection density for 1, 3, and 4 legged
intersections).9,10
SACSIM does not account for measures such as TMA membership, transit
subsidies, ride-sharing, low-income housing, or similar programs.
On Model Measure
One on-model measure was also identified for this project: exceedance of the Title 24 Energy
Standards by 20 percent was specified. This measure was specified because CalEEMod
generates estimates using the 2008 Title 24 standards. By specifying a 20% reduction from Title
24 standards, this will bring the project into line with the 2013 standards.
Results
As shown in Table C-2, the Operational AQMP would reduce NOxe emissions by 34.4 percent.
This reduction would easily exceed SMAQMD’s minimum emission reduction requirements of
15 percent for projects located within a SIP area. The detailed CalEEMod mitigated results can
be found in Appendix A.
Table C-2. Barrett Ranch East Maximum Mitigated Daily Ozone Precursor Emission
Parameter ROG (ppd) NOx (ppd) NOxe (ppd)
Area Sources 40.6 0.7
Energy Sources 0.4 3.3
Mobile Sources 27.1 27.8
Total Emissions 68.1 31.8 54.5 (34.4 %
reduction from unmitigated
Significance Threshold 65 65 N/A
Exceed Operational Threshold?
Yes No N/A
9 Wong, D., Kimley-Horn. November 13, 2014 e-mail to Tim Rimpo, ESA, regarding SACSIM.
10 Long, J., DKS Associates. November 6, 2014 phone conversation with Tim Rimpo, ESA, regarding SACSIM.
B - 248