Embed Size (px)
Citation preview
Department of Transportation
National Infrastructure Investments
TIGER Discretionary Grants
Barnum Landing
Ferry Improvement Project for
CT I-95 Traffic Mitigation
Prepared by:
TIGER GRANT
APPLICATION
Project Narrative
October 31, 2011
City of Bridgeport Connecticut
Mayor Bill Finch
45 Lyon Terrace
Bridgeport, CT 06604
Barnum Landing Ferry Improvement Project TIGER II Grant Application Project Narrative
i
Project Overview
Project Name Barnum Landing Ferry Improvement Project for CT I-95 Traffic
Mitigation
Project Type Port Infrastructure Investment
Project
Location
Bridgeport, Connecticut
Fairfield County
4th
Congressional District
This project is located in an ECONOMICALLY DISTRESSED URBAN
AREA
Project
Description
This project includes the development of a new passenger ferry terminal
for the Bridgeport & Port Jefferson Steamboat Company. The terminal
will be situated in a mixed use development which will combine ferry
operations with community oriented commercial and retail uses. Site
features include ferry traffic staging areas, parking, community access
pedestrian boardwalks, street hardscape improvements, and appropriate
traffic controls. Along the shore improvements will include bulkheads,
loading ramps (link spans) and dolphins. Strategies for implementation
include sustainable storm water retention and restoration of shoreline
habitat. The facility will also preserve and enhance an existing
commercial cargo facility, warehouse facilities, and result in a domicile
for new Bridgeport-based tug and barge operation.
Funds
Requested
$14,250,000
Grant
Recipient
City of Bridgeport
ATTN:
Department of Central Grants & Community Development
Ms. Alexandra B. McGoldrick
999 Broad Street
Bridgeport, CT 06604
(203) 332 5665
DUNS number: 075404137
Other Project
Parties
The Bridgeport & Port Jefferson Steamboat Company, Barnum Landing,
LLC; and McAllister Towing and Transportation Company, Inc.
Barnum Landing Ferry Improvement Project TIGER II Grant Application Project Narrative
ii
Table of Contents
I. Project Description ................................................................................................... 1
A. Project Location & Context ................................................................................ 2
B. Transportation Investments Included .................................................................. 5
C. Transportation Challenges Addressed ................................................................ 6
D. Project Schedule................................................................................................ 11
II. Project Parties ......................................................................................................... 11
III. Grant Funds & Sources/Uses of Project Funds ................................................... 12
IV. Selection Criteria .................................................................................................... 14
A. Long-Term Outcomes ....................................................................................... 14
i. State of Good Repair ........................................................................................ 14 ii Economic Competitiveness .............................................................................. 15
iii Livability .......................................................................................................... 16 iv Environmental Sustainability ........................................................................... 17 v Summary of Benefit-Cost Analysis .................................................................. 17
B. Job Creation & Economic Stimulus .................................................................. 18 i Short-term Job Creation ................................................................................... 18
ii Long-term Job Creation .................................................................................... 19 iii Effect on an Economically Distressed Area ..................................................... 20 iv. Project Schedule ............................................................................................... 21
v. Project Approvals ............................................................................................. 21
C. Innovation ......................................................................................................... 21
D. Partnership ........................................................................................................ 21
V. Project Readiness & NEPA .................................................................................... 21
A. Environmental Reviews .................................................................................... 21
B. Legislative Approvals ....................................................................................... 23
C. State and Local Planning .................................................................................. 23
D. Technical Feasibility ......................................................................................... 23
E. Financial Feasibility .......................................................................................... 24
VII. Material Changes to Pre-Application Form ......................................................... 25
ATTACHMENTS
A – NYMTC Letter of Consistency and
Letters of Support C – Current Bridgeport Grants
B – Benefit-Cost Analysis D – Federal Wage Rate Certification
Barnum Landing Ferry Improvement Project TIGER Grant Application Project Narrative
1
I. Project Description
This Barnum Landing Ferry Improvement Project for CT I-95 Traffic Mitigation (Barnum
Landing) includes the construction of a new ferry terminal in Bridgeport, Connecticut for The
Bridgeport & Port Jefferson Steamboat Company (BPPJ Ferry). Founded in 1883, the BPPJ
Ferry provides year round ferry service across Long Island Sound between Bridgeport,
Connecticut and Port Jefferson, New York for vehicles, passengers and freight. The BPPJ Ferry
operates 20-30 trips per day (178 trips per week) in each direction using three vessels, and
carries over 400,000 cars and trucks, and more than 800,000 passengers per year.
Barnum Landing Terminal
Barnum Landing will be situated in a mixed use development which will combine ferry
operations with community-oriented commercial and retail uses. Included in the approximately
18.3 acre site will be a variety of buildings which enhance and support ferry operations (16,000-
20,000 SF) including a ferry passenger terminal and restaurant, a ferry administration building
and call center, and crew quarters. The community-oriented commercial and retail facilities
(12,000-14,000 SF) will incorporate a grocery store, small retail storefronts, and commercial
offices. Incorporating retail establishments like these into Barnum Landing is consistent with the
City of Bridgeport’s community development goals.
In addition, Barnum Landing will include improvements to land-side structures at a commercial
cargo facility adjacent to the new ferry terminal. The existing bulkheading, berth, and mooring
facilities will also be retained and rehabilitated. Under the proposed plan a freight berth could
remain available for ships at Bridgeport.
There will be adequate space for a tug to moor at Barnum Landing. Tugs, which are an important
component in the safe movement of ships and barges in and around the port, currently have
limited space to moor in Bridgeport Harbor.
Site features at Barnum Landing will include ferry vehicle staging areas, parking, community
access pedestrian boardwalks, street hardscape improvements, and appropriate traffic controls.
Shoreline improvements will include bulkhead repairs, and the addition of loading ramps (link
spans) and dolphins. Strategies for implementation include sustainable storm water retention and
restoration of shoreline habitat. Particular attention will be given to concepts of economic,
environmental and aesthetic justice for the East End community in which the project is located,
an economically distressed urban area.
Existing Terminal
Sitting on just 1.5 acres, the current Bridgeport ferry terminal has insufficient space for vehicle
staging and parking, particularly during ferry unloading, which effectively constrains the number
of passengers that can be carried daily/annually. To date, 8.9 acres of prime waterfront have
already been purchased and an adjacent 9.4 acre parcel is available, which will allow Barnum
Landing to provide additional capacity over the existing site and eliminate existing capacity
Barnum Landing Ferry Improvement Project TIGER Grant Application Project Narrative
2
problems.1 In addition, the current site has poor roadway connections to I-95, the main travel
corridor through Bridgeport and the region.
The establishment of Barnum Landing on the much larger parcel will reduce travel times for
current ferry passengers, will remove facility constraints on daily and annual ridership, and will
greatly increase the attractiveness of ferry service and increase ridership. The additional daily
and annual riders attracted to the ferry will remove significant traffic from the highly congested,
and over capacity, I-95 corridor through southern Connecticut and the New York City
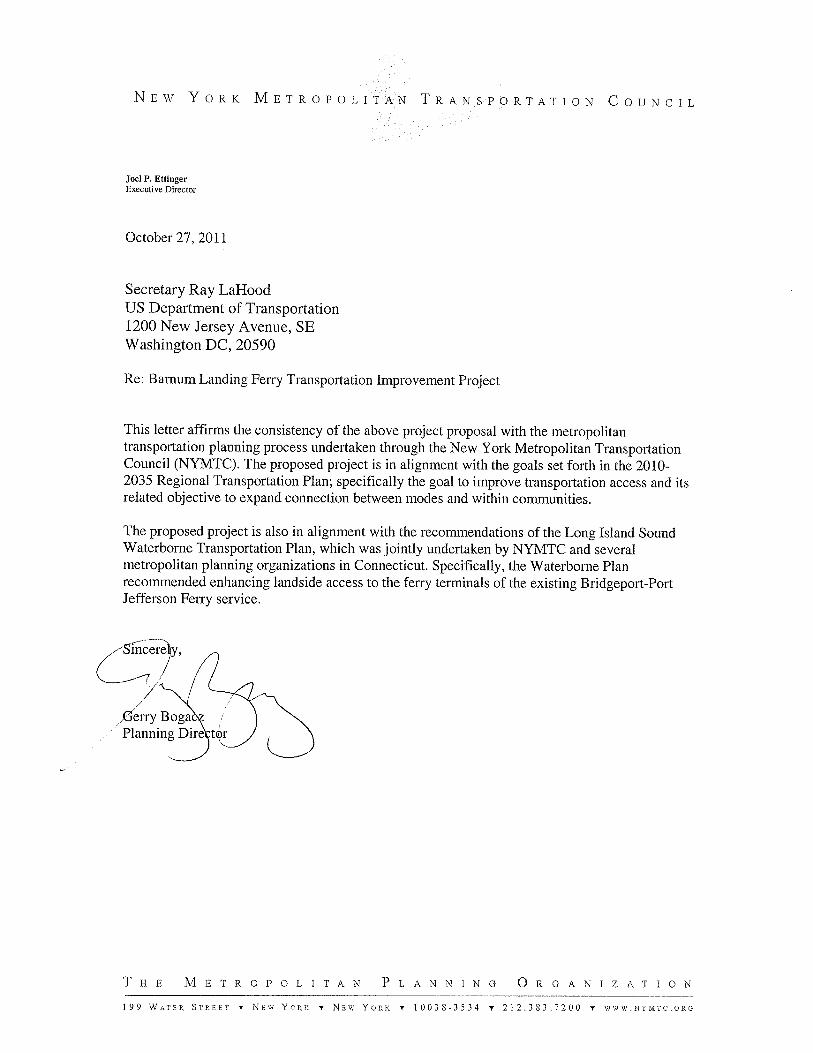
metropolitan region. By reducing traffic on already congested roadways, Barnum Landing is
consistent with the goals of the New York Metropolitan Transportation Council (NYMTC) 2010-
2035 Regional Transportation Plan. To support this assertion, NYMTC has provided a letter
stating that development of Barnum Landing is consistent with their goals as well as aligned with
the recommendations of the Long Island Sound Waterborne Transportation Plan. A copy of this
letter is provided in Attachment A.
The adjacent property, that is available for purchase and development, could be developed for
cargo operations. Negotiations are ongoing to purchase the property. The BPPJ Ferry would use
the second berth only as an emergency backup terminal for the ferry. The BPPJ Ferry currently
has no backup berth in Bridgeport. This second berth could be used by barge or other cargo
operations.
A. Project Location & Context
This project is located in the city of Bridgeport, Connecticut, in Northeast Fairfield County, on
Long Island Sound. Bridgeport is known as the “Park City” with 1,375 acres of park land in a
19.4 square-mile urban area. With 139,529 residents, Bridgeport is the largest city in
Connecticut and the fourth largest in New England; with a density of 8,720 people per square
mile; Bridgeport is also the most densely populated City in Connecticut (2000 Census).
Bridgeport is a diverse community with 31.9% of residents of Hispanic origin and 30.8% of
African American origin.
Bridgeport is an economically disadvantaged community; the city-wide poverty rate is almost
25%, with certain census tracts demonstrating poverty rates approaching 80%. In the second
quarter of 2011 the Connecticut Department of Labor reported a 14.5% unemployment rate in
Bridgeport, compared to 9.1% for the state of Connecticut as a whole. Over the last five years
unemployment in Bridgeport has typically been at least two percentage points higher than the
U.S. average unemployment rate.
The city of Bridgeport identified the revitalization of the city’s East Side with a new rail station
as its anchor as a path out of poverty for that section of the city and as an economic driver of a
city-wide renaissance. Utilizing private funds, several large property owners in this portion of
the city including Dupont and General Electric have been working diligently to remediate and
plan for the repositioning of approximately 500 acres of brownfields so that they can be
restored to productive elements of the city.
1 Stena Lines, the world’s largest car and passenger ferry operator has written a report on the existing terminal and
has concluded that the new terminal will eliminate the current capacity problems and related delays. Stena Lines
will be consulted in connection with final plans for the Barnum Landing terminal.
Barnum Landing Ferry Improvement Project TIGER Grant Application Project Narrative
3
Additionally, this proposal is connected to the regional and local context and will leverage
collaborative relationships and support existing investment in the project area. Necessary
collaboration is occurring with federal, state, and regional public agencies, including DOT,
FTA, Port Authority, HUD, Housing Authority, EPA, CT DECD and CT DEEP. Collaborators
in the private sector include the Seaview Avenue Business Alliance, a non-profit whose
membership consists of businesses and institutions located in the upper East End. GE, Dupont,
and the State Dept. of Economic and Community Development (DECD) have committed
significant resources to demolish buildings, conduct remediation, and prepare sites for
redevelopment. The proposed actions will lay the foundation for a new and stronger walkable,
mixed-use and transit-oriented neighborhood; one that will reduce automobile trips and
greenhouse gases, reclaim brownfield sites and create a sense of community and place. With an
emphasis on higher density and mixed-use land patterns, the project will support municipal, as
well as regional, efforts to promote equitable and affordable housing, work-force price housing
and a variety of household types and needs.
With a combination of commercial and residential uses and institutional anchors, the city’s East
Side presents the foundation for economic revitalization unparalleled in the city’s recent
history. Though many aspects of the final development mixture are still in the conceptual stage,
of greatest importance is the economic development and demand basis for the vision.
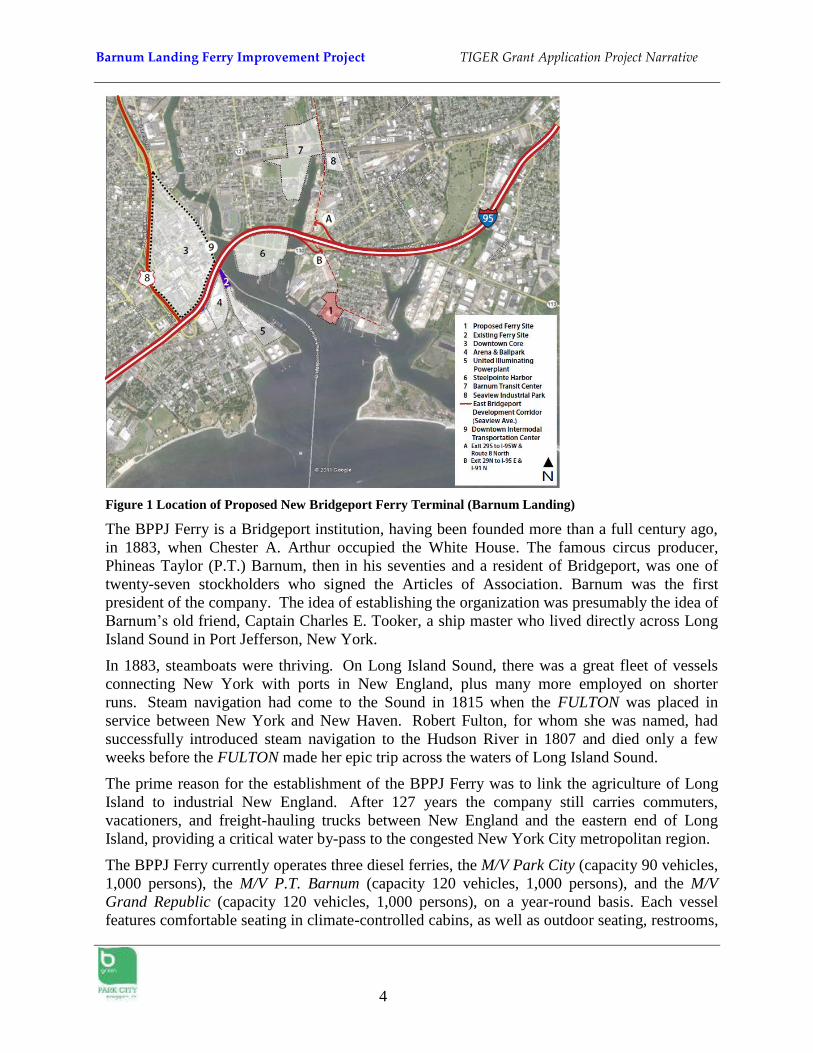
Barnum Landing will be built in the East End neighborhood of Bridgeport. The project site is
an industrial waterfront facility located at 567 Seaview Avenue. The 18.3 acre site is bounded
to the north by Seaview Avenue and to the South by Bridgeport Harbor. The site is just south
of the Steel Pointe peninsula, and across the harbor from the downtown business district and
the existing ferry terminal. See Figure 1.
Over the past 10 years the City of Bridgeport has been struggling to attract new business to
generate both jobs and tax revenues. In particular the Steel Pointe peninsula and parts of the
surrounding East End neighborhoods are in a deteriorated or blighted condition. The East End
neighborhood is also one of two significant “food deserts” in Bridgeport – areas without a local
supermarket or even small retail markets. Since many residents don’t have a car, shopping for
groceries can mean a 45 minute bus ride or a $13 cab ride2. Bridgeport has had a challenge
attracting business because of these economic and social conditions.
In addition to significantly increasing the attractiveness of the existing ferry service, Barnum
Landing will help to spur the redevelopment and improvement of the East End neighborhood
by bringing employment and retail activity. A TIGER grant will provide the essential
ingredient to develop the crucial interconnection that will move the City and this economic
development enterprise forward with crucial private investment.
2 Amanda Cuda, CT Post.com, For Those in Food Deserts, Grocery Shopping Can be a Hassle, October 15, 2011.
Barnum Landing Ferry Improvement Project TIGER Grant Application Project Narrative
4
Figure 1 Location of Proposed New Bridgeport Ferry Terminal (Barnum Landing)
The BPPJ Ferry is a Bridgeport institution, having been founded more than a full century ago,
in 1883, when Chester A. Arthur occupied the White House. The famous circus producer,
Phineas Taylor (P.T.) Barnum, then in his seventies and a resident of Bridgeport, was one of
twenty-seven stockholders who signed the Articles of Association. Barnum was the first
president of the company. The idea of establishing the organization was presumably the idea of
Barnum’s old friend, Captain Charles E. Tooker, a ship master who lived directly across Long
Island Sound in Port Jefferson, New York.
In 1883, steamboats were thriving. On Long Island Sound, there was a great fleet of vessels
connecting New York with ports in New England, plus many more employed on shorter
runs. Steam navigation had come to the Sound in 1815 when the FULTON was placed in
service between New York and New Haven. Robert Fulton, for whom she was named, had
successfully introduced steam navigation to the Hudson River in 1807 and died only a few
weeks before the FULTON made her epic trip across the waters of Long Island Sound.
The prime reason for the establishment of the BPPJ Ferry was to link the agriculture of Long
Island to industrial New England. After 127 years the company still carries commuters,
vacationers, and freight-hauling trucks between New England and the eastern end of Long
Island, providing a critical water by-pass to the congested New York City metropolitan region.
The BPPJ Ferry currently operates three diesel ferries, the M/V Park City (capacity 90 vehicles,
1,000 persons), the M/V P.T. Barnum (capacity 120 vehicles, 1,000 persons), and the M/V
Grand Republic (capacity 120 vehicles, 1,000 persons), on a year-round basis. Each vessel
features comfortable seating in climate-controlled cabins, as well as outdoor seating, restrooms,
Barnum Landing Ferry Improvement Project TIGER Grant Application Project Narrative
5
and food and beverage service. The BPPJ Ferry intends to build a fourth ferry, if the TIGER
grant is approved and increased ridership warrants adding ferry capacity.
Crossing time between the two ports is currently scheduled for 75 minutes on a run of about 15
nautical miles in length. By comparison, the road distance between Bridgeport and Port
Jefferson is approximately 100 miles, and under ideal traffic conditions takes approximately
two hours.
B. Transportation Investments Included
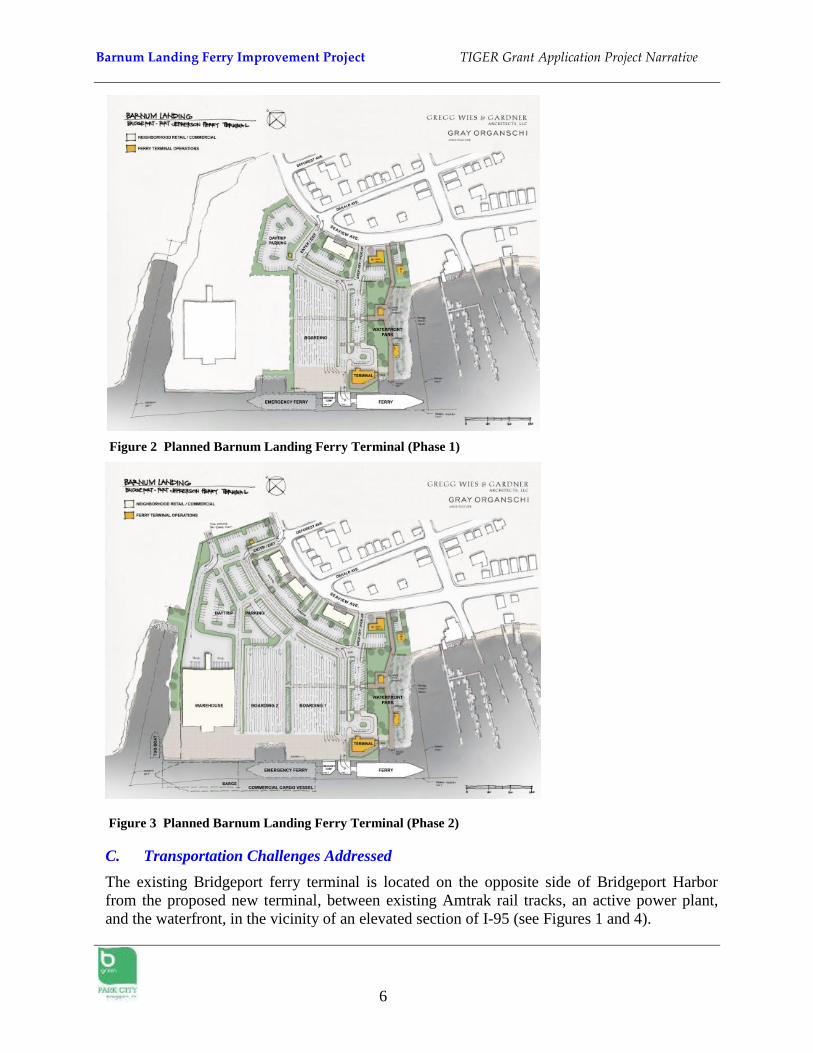
The specific transportation investments included in this project are (see Figures 2 and 3):
Ferry passenger staging/queuing/parking areas
Ferry operations building and crew quarters
Ferry passenger terminal and restaurant
Community access pedestrian boardwalks
Street hardscape improvements
Traffic controls
Commercial cargo ship and/or barge facility and associated land-side warehouse
Tug mooring
In addition, Barnum Landing will include related retail development, including a planned
grocery store or market. The overall project scope includes demolition of existing structures;
site development including construction of storm water retention facilities; shoreline
improvements, including bulkhead repairs, and construction of vehicle and passenger loading
ramps (link spans) and dolphins; and restoration of shoreline habitat. Certain of these
improvements will allow optimization and beneficial use of the commercial cargo facility,
warehouse facilities and the ability to domicile a tug in Bridgeport.
The proposed community access boardwalks will provide residents of nearby neighborhoods
with the only public waterfront access in the area. Intermodal connections will also be
incorporated, including transit bus, maintaining the existing ferry shuttle bus, on-site bicycle
facilities, and taxi drop-off/pick-up area.
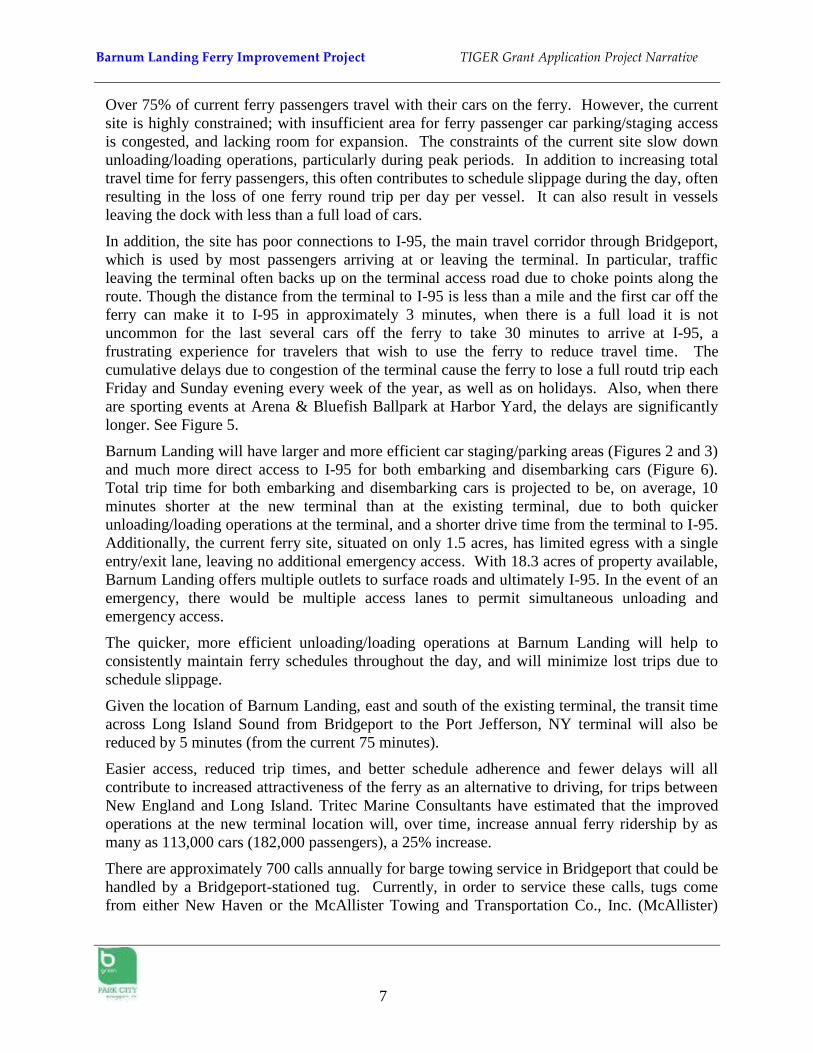
Development of Barnum Landing will proceed in two phases as shown in Figures 2 and 3.
Both phases will be designed concurrently. The BPPJ Ferry currently owns the land required
for Phase 1 (8.9 acres). If the land needed for Phase 2 (9.4 acres) can be purchased
expeditiously, construction will proceed on both phases concurrently; otherwise Phase 1 will be
constructed, followed by Phase 2 after the additional site can be acquired.
Barnum Landing Ferry Improvement Project TIGER Grant Application Project Narrative
6
Figure 2 Planned Barnum Landing Ferry Terminal (Phase 1)
Figure 3 Planned Barnum Landing Ferry Terminal (Phase 2)
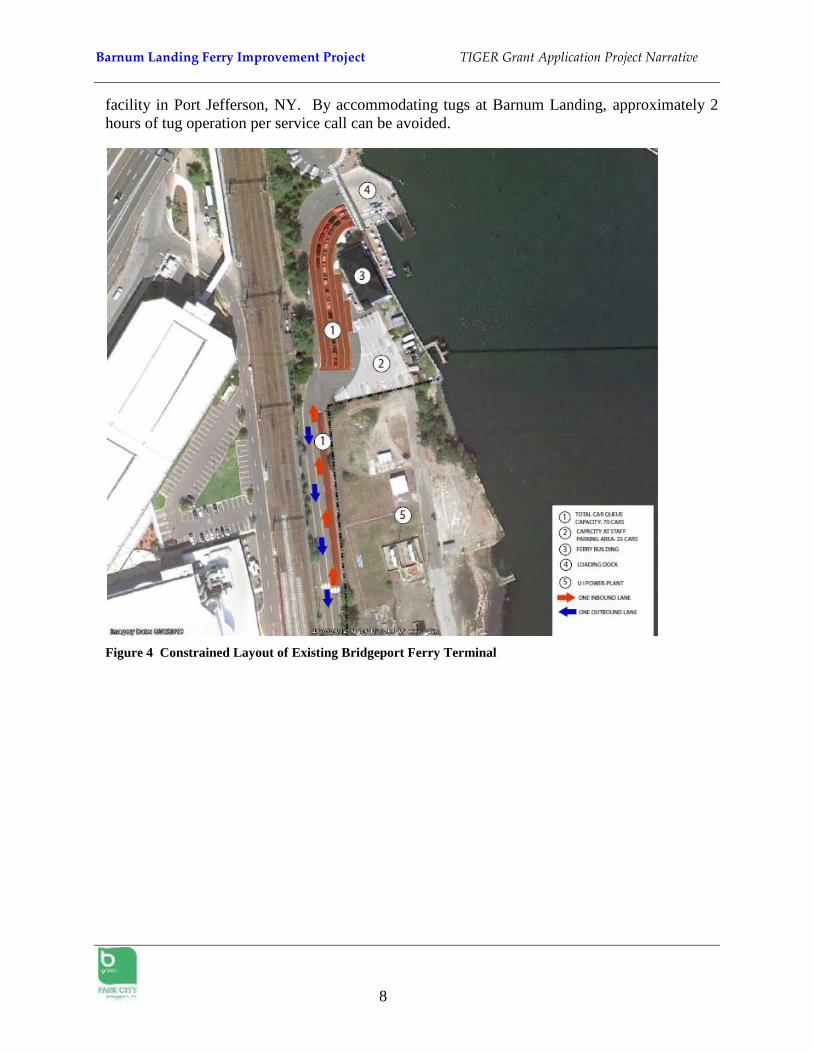
C. Transportation Challenges Addressed
The existing Bridgeport ferry terminal is located on the opposite side of Bridgeport Harbor
from the proposed new terminal, between existing Amtrak rail tracks, an active power plant,
and the waterfront, in the vicinity of an elevated section of I-95 (see Figures 1 and 4).
Barnum Landing Ferry Improvement Project TIGER Grant Application Project Narrative
7
Over 75% of current ferry passengers travel with their cars on the ferry. However, the current
site is highly constrained; with insufficient area for ferry passenger car parking/staging access
is congested, and lacking room for expansion. The constraints of the current site slow down
unloading/loading operations, particularly during peak periods. In addition to increasing total
travel time for ferry passengers, this often contributes to schedule slippage during the day, often
resulting in the loss of one ferry round trip per day per vessel. It can also result in vessels
leaving the dock with less than a full load of cars.
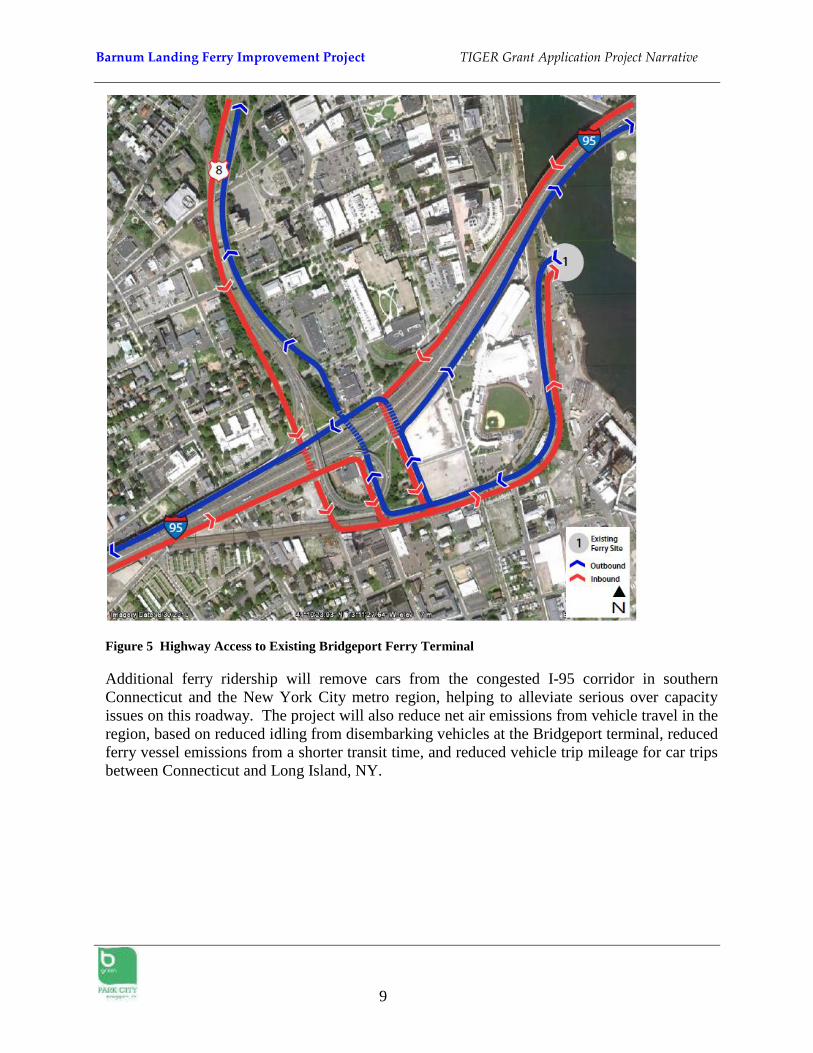
In addition, the site has poor connections to I-95, the main travel corridor through Bridgeport,
which is used by most passengers arriving at or leaving the terminal. In particular, traffic
leaving the terminal often backs up on the terminal access road due to choke points along the
route. Though the distance from the terminal to I-95 is less than a mile and the first car off the
ferry can make it to I-95 in approximately 3 minutes, when there is a full load it is not
uncommon for the last several cars off the ferry to take 30 minutes to arrive at I-95, a
frustrating experience for travelers that wish to use the ferry to reduce travel time. The
cumulative delays due to congestion of the terminal cause the ferry to lose a full routd trip each
Friday and Sunday evening every week of the year, as well as on holidays. Also, when there
are sporting events at Arena & Bluefish Ballpark at Harbor Yard, the delays are significantly
longer. See Figure 5.
Barnum Landing will have larger and more efficient car staging/parking areas (Figures 2 and 3)
and much more direct access to I-95 for both embarking and disembarking cars (Figure 6).
Total trip time for both embarking and disembarking cars is projected to be, on average, 10
minutes shorter at the new terminal than at the existing terminal, due to both quicker
unloading/loading operations at the terminal, and a shorter drive time from the terminal to I-95.
Additionally, the current ferry site, situated on only 1.5 acres, has limited egress with a single
entry/exit lane, leaving no additional emergency access. With 18.3 acres of property available,
Barnum Landing offers multiple outlets to surface roads and ultimately I-95. In the event of an
emergency, there would be multiple access lanes to permit simultaneous unloading and
emergency access.
The quicker, more efficient unloading/loading operations at Barnum Landing will help to
consistently maintain ferry schedules throughout the day, and will minimize lost trips due to
schedule slippage.
Given the location of Barnum Landing, east and south of the existing terminal, the transit time
across Long Island Sound from Bridgeport to the Port Jefferson, NY terminal will also be
reduced by 5 minutes (from the current 75 minutes).
Easier access, reduced trip times, and better schedule adherence and fewer delays will all
contribute to increased attractiveness of the ferry as an alternative to driving, for trips between
New England and Long Island. Tritec Marine Consultants have estimated that the improved
operations at the new terminal location will, over time, increase annual ferry ridership by as
many as 113,000 cars (182,000 passengers), a 25% increase.
There are approximately 700 calls annually for barge towing service in Bridgeport that could be
handled by a Bridgeport-stationed tug. Currently, in order to service these calls, tugs come
from either New Haven or the McAllister Towing and Transportation Co., Inc. (McAllister)
Barnum Landing Ferry Improvement Project TIGER Grant Application Project Narrative
8
facility in Port Jefferson, NY. By accommodating tugs at Barnum Landing, approximately 2
hours of tug operation per service call can be avoided.
Figure 4 Constrained Layout of Existing Bridgeport Ferry Terminal
Barnum Landing Ferry Improvement Project TIGER Grant Application Project Narrative
9
Figure 5 Highway Access to Existing Bridgeport Ferry Terminal
Additional ferry ridership will remove cars from the congested I-95 corridor in southern
Connecticut and the New York City metro region, helping to alleviate serious over capacity
issues on this roadway. The project will also reduce net air emissions from vehicle travel in the
region, based on reduced idling from disembarking vehicles at the Bridgeport terminal, reduced
ferry vessel emissions from a shorter transit time, and reduced vehicle trip mileage for car trips
between Connecticut and Long Island, NY.
Barnum Landing Ferry Improvement Project TIGER Grant Application Project Narrative
10
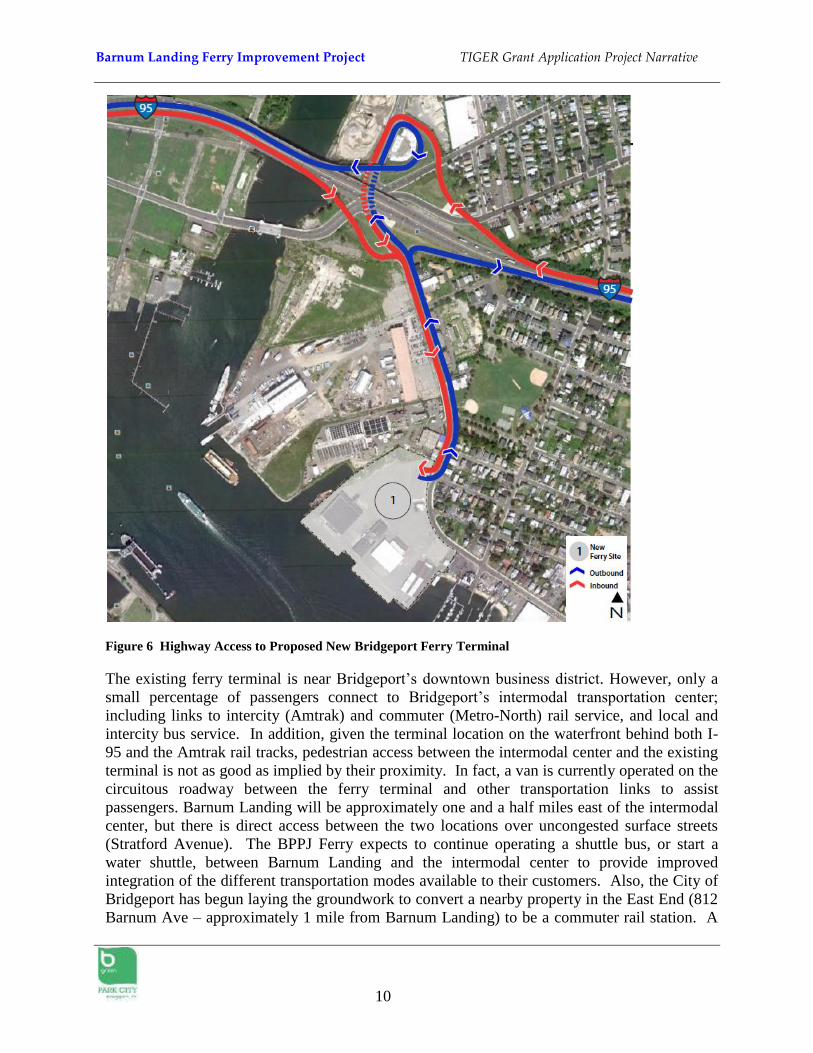
Figure 6 Highway Access to Proposed New Bridgeport Ferry Terminal
The existing ferry terminal is near Bridgeport’s downtown business district. However, only a
small percentage of passengers connect to Bridgeport’s intermodal transportation center;
including links to intercity (Amtrak) and commuter (Metro-North) rail service, and local and
intercity bus service. In addition, given the terminal location on the waterfront behind both I-
95 and the Amtrak rail tracks, pedestrian access between the intermodal center and the existing
terminal is not as good as implied by their proximity. In fact, a van is currently operated on the
circuitous roadway between the ferry terminal and other transportation links to assist
passengers. Barnum Landing will be approximately one and a half miles east of the intermodal
center, but there is direct access between the two locations over uncongested surface streets
(Stratford Avenue). The BPPJ Ferry expects to continue operating a shuttle bus, or start a
water shuttle, between Barnum Landing and the intermodal center to provide improved
integration of the different transportation modes available to their customers. Also, the City of
Bridgeport has begun laying the groundwork to convert a nearby property in the East End (812
Barnum Ave – approximately 1 mile from Barnum Landing) to be a commuter rail station. A
Barnum Landing Ferry Improvement Project TIGER Grant Application Project Narrative
11
feasibility study has begun using funding from a US Housing and Urban Development (HUD)
Sustainable Communities Initiative Grant. The commuter rail station is envisioned to act as a
central anchor to the city’s East Side redevelopment and provide a second Northeast Corridor
rail terminus for Bridgeport, promoting mixed-use, transit-oriented development and affordable
housing around the distressed East End and East Side neighborhoods.3
D. Project Schedule
The BPPJ Ferry has been working on the development of a new terminal in Bridgeport for
several years, and in 2011 completed the purchase of the proposed Phase 1 site. The company
has engaged consultants to begin design work and required environmental reviews. As
evidenced by City sponsorship of this application, and the support letters attached, the company
enjoys the support of the City of Bridgeport and numerous community organizations. Both the
City and the BPPJ Ferry are prepared and anxious to begin construction of this project as soon
as possible, with a proposed construction start date of September 2012, and opening of the new
terminal in May 2014.
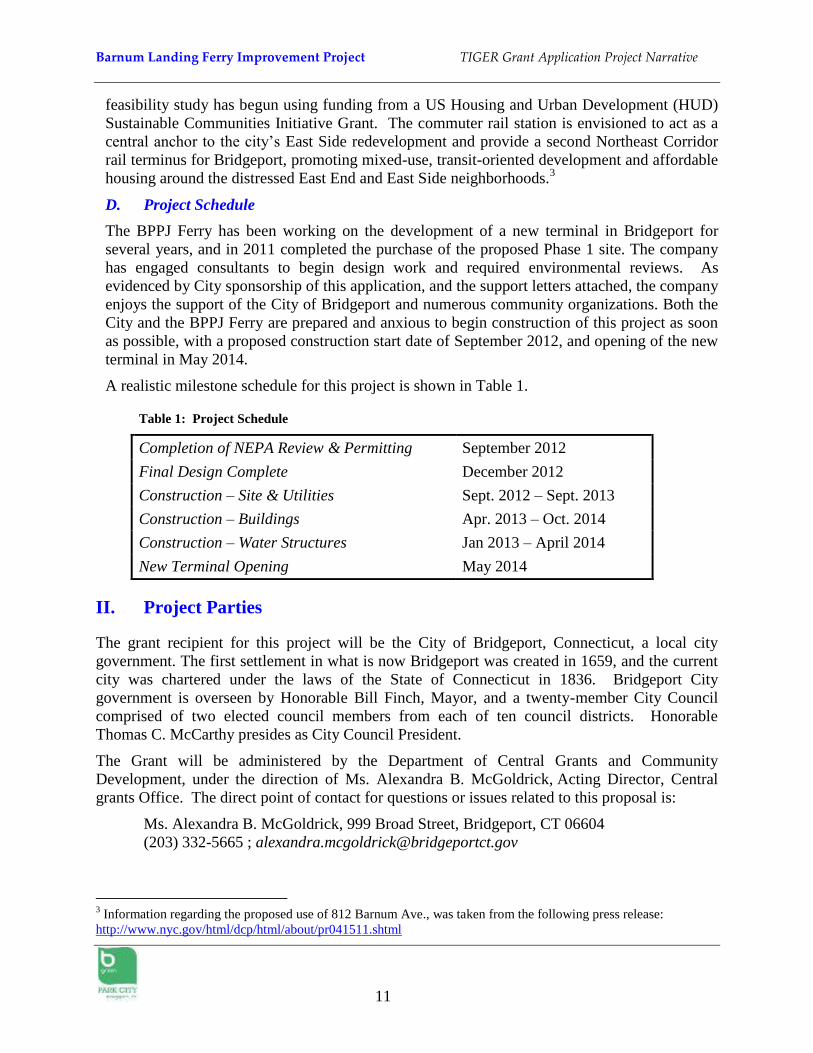
A realistic milestone schedule for this project is shown in Table 1.
Table 1: Project Schedule
Completion of NEPA Review & Permitting September 2012
Final Design Complete December 2012
Construction – Site & Utilities Sept. 2012 – Sept. 2013
Construction – Buildings Apr. 2013 – Oct. 2014
Construction – Water Structures Jan 2013 – April 2014
New Terminal Opening May 2014
II. Project Parties
The grant recipient for this project will be the City of Bridgeport, Connecticut, a local city
government. The first settlement in what is now Bridgeport was created in 1659, and the current
city was chartered under the laws of the State of Connecticut in 1836. Bridgeport City
government is overseen by Honorable Bill Finch, Mayor, and a twenty-member City Council
comprised of two elected council members from each of ten council districts. Honorable
Thomas C. McCarthy presides as City Council President.
The Grant will be administered by the Department of Central Grants and Community
Development, under the direction of Ms. Alexandra B. McGoldrick, Acting Director, Central
grants Office. The direct point of contact for questions or issues related to this proposal is:
Ms. Alexandra B. McGoldrick, 999 Broad Street, Bridgeport, CT 06604
(203) 332-5665 ; [email protected]
3 Information regarding the proposed use of 812 Barnum Ave., was taken from the following press release:
http://www.nyc.gov/html/dcp/html/about/pr041511.shtml
Barnum Landing Ferry Improvement Project TIGER Grant Application Project Narrative
12
The other project partners are Barnum Landing, LLC; The Bridgeport and Port Jefferson
Steamboat Company, and its parent company McAllister Towing and Transportation Company,
Inc. These companies will own and operate the proposed new ferry terminal to be constructed
with TIGER grant funds, and will provide all local matching funds from privately raised capital.
III. Grant Funds & Sources/Uses of Project Funds
The total cost of this project is $28,950,000, and the project partners are requesting $14,750,000
in TIGER grant funding, or 51% of total project costs.
Local matching funds of $14,200,000 (49% of total project costs) will be provided by BPPJ
Ferry from privately raised capital and include funds to be spent on Phase 2 land acquisition. In
addition to the local match for development of the new terminal facilities, BPPJ Ferry expects to
spend an additional $40 million on other related activities. This sum includes funds already
spent on Phase 1 land acquisition and pre-design activities, costs for the Barnum Landing retail
development and costs for upgrading one existing ferry and for construction of a fourth ferry to
handle expected passenger growth after 2020.
Given the current economic conditions a TIGER grant is necessary to get this important
transportation improvement for Bridgeport and the region started in a timely manner. It would
take many years before the BPPJ Ferry could raise the full project construction amount on their
own, but a TIGER grant would allow them to move forward with design in 2012, followed by a
construction start in 2013 on buildings.
Given the size of the financial need for this project the City of Bridgeport and the BPPJ Ferry
believe that the TIGER discretionary grant program is a much better fit for this project than other
Department of Transportation funding programs. In particular, the Ferry Boat Discretionary
funding program is not large enough to provide a sufficient level of grant funding to make this
project work.
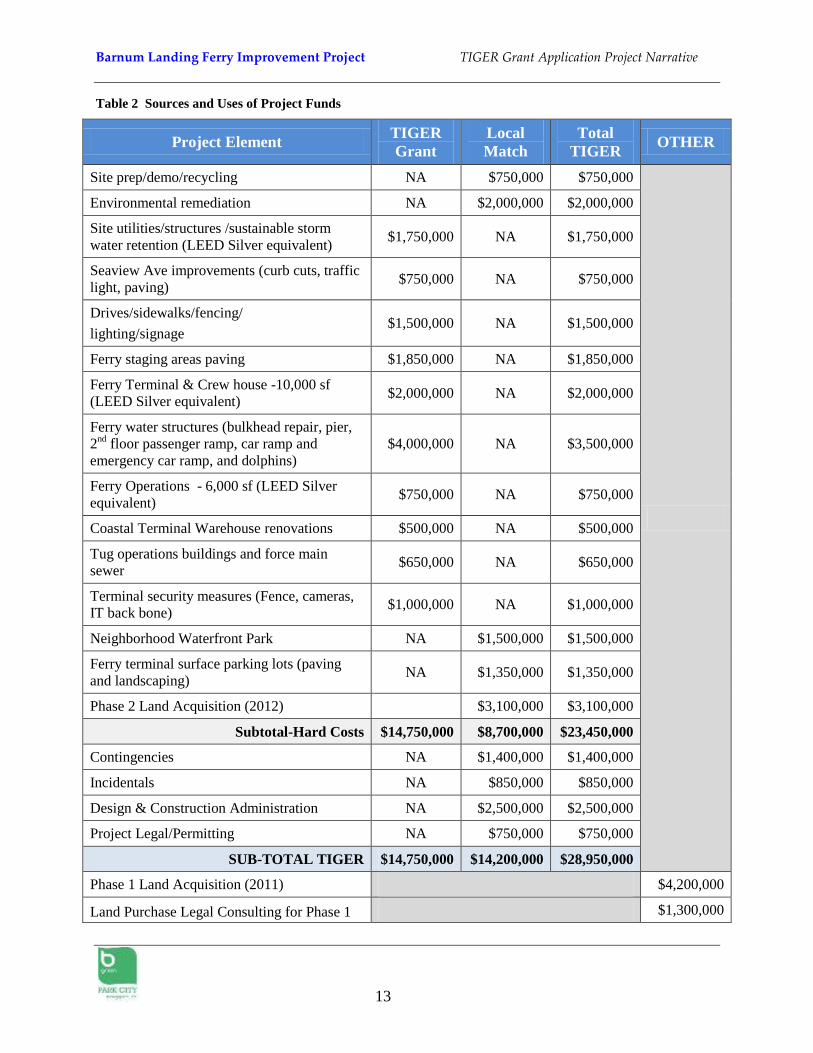
The sources and use of project funds is summarized in Table 2.
Barnum Landing Ferry Improvement Project TIGER Grant Application Project Narrative
13
Table 2 Sources and Uses of Project Funds
Project Element TIGER
Grant
Local
Match
Total
TIGER OTHER
Site prep/demo/recycling NA $750,000 $750,000
Environmental remediation NA $2,000,000 $2,000,000
Site utilities/structures /sustainable storm
water retention (LEED Silver equivalent) $1,750,000 NA $1,750,000
Seaview Ave improvements (curb cuts, traffic
light, paving) $750,000 NA $750,000
Drives/sidewalks/fencing/
lighting/signage $1,500,000 NA $1,500,000
Ferry staging areas paving $1,850,000 NA $1,850,000
Ferry Terminal & Crew house -10,000 sf
(LEED Silver equivalent) $2,000,000 NA $2,000,000
Ferry water structures (bulkhead repair, pier,
2nd
floor passenger ramp, car ramp and
emergency car ramp, and dolphins)
$4,000,000 NA $3,500,000
Ferry Operations - 6,000 sf (LEED Silver
equivalent) $750,000 NA $750,000
Coastal Terminal Warehouse renovations $500,000 NA $500,000
Tug operations buildings and force main
sewer $650,000 NA $650,000
Terminal security measures (Fence, cameras,
IT back bone) $1,000,000 NA $1,000,000
Neighborhood Waterfront Park NA $1,500,000 $1,500,000
Ferry terminal surface parking lots (paving
and landscaping) NA $1,350,000 $1,350,000
Phase 2 Land Acquisition (2012) $3,100,000 $3,100,000
Subtotal-Hard Costs $14,750,000 $8,700,000 $23,450,000
Contingencies NA $1,400,000 $1,400,000
Incidentals NA $850,000 $850,000
Design & Construction Administration NA $2,500,000 $2,500,000
Project Legal/Permitting NA $750,000 $750,000
SUB-TOTAL TIGER $14,750,000 $14,200,000 $28,950,000
Phase 1 Land Acquisition (2011) $4,200,000
Land Purchase Legal Consulting for Phase 1 $1,300,000
Barnum Landing Ferry Improvement Project TIGER Grant Application Project Narrative
14
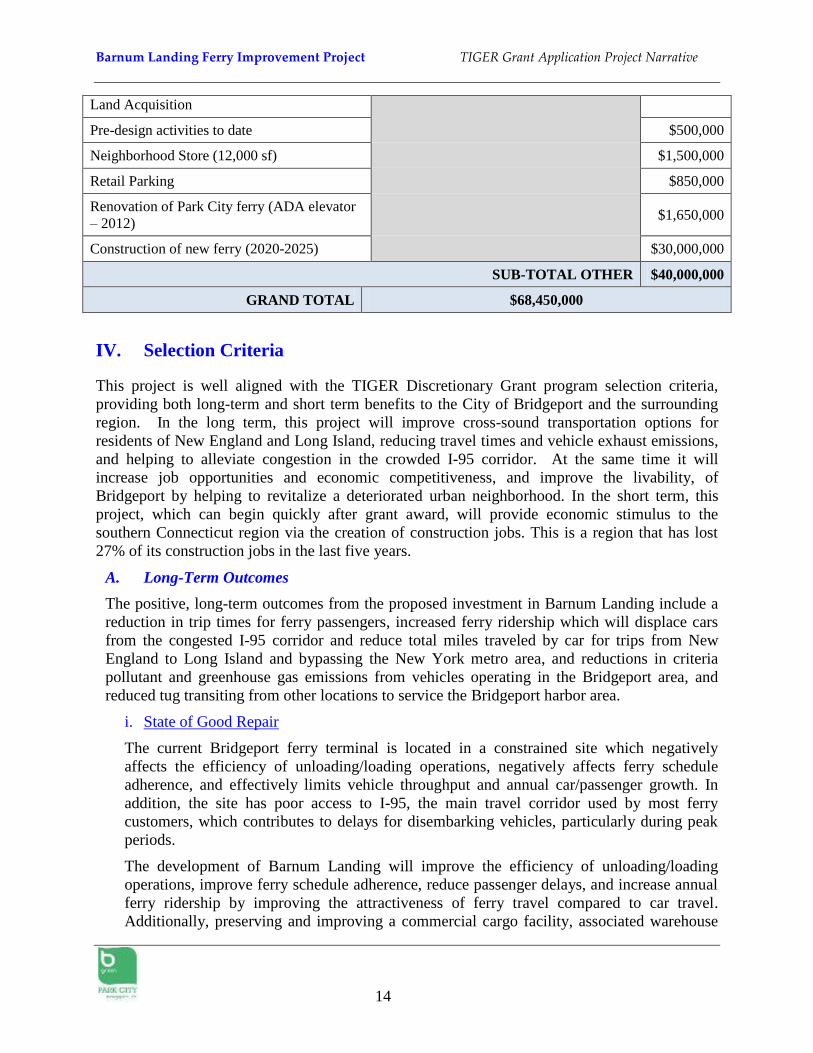
Land Acquisition
Pre-design activities to date $500,000
Neighborhood Store (12,000 sf) $1,500,000
Retail Parking $850,000
Renovation of Park City ferry (ADA elevator
– 2012) $1,650,000
Construction of new ferry (2020-2025) $30,000,000
SUB-TOTAL OTHER $40,000,000
GRAND TOTAL $68,450,000
IV. Selection Criteria
This project is well aligned with the TIGER Discretionary Grant program selection criteria,
providing both long-term and short term benefits to the City of Bridgeport and the surrounding
region. In the long term, this project will improve cross-sound transportation options for
residents of New England and Long Island, reducing travel times and vehicle exhaust emissions,
and helping to alleviate congestion in the crowded I-95 corridor. At the same time it will
increase job opportunities and economic competitiveness, and improve the livability, of
Bridgeport by helping to revitalize a deteriorated urban neighborhood. In the short term, this
project, which can begin quickly after grant award, will provide economic stimulus to the
southern Connecticut region via the creation of construction jobs. This is a region that has lost
27% of its construction jobs in the last five years.
A. Long-Term Outcomes
The positive, long-term outcomes from the proposed investment in Barnum Landing include a
reduction in trip times for ferry passengers, increased ferry ridership which will displace cars
from the congested I-95 corridor and reduce total miles traveled by car for trips from New
England to Long Island and bypassing the New York metro area, and reductions in criteria
pollutant and greenhouse gas emissions from vehicles operating in the Bridgeport area, and
reduced tug transiting from other locations to service the Bridgeport harbor area.
i. State of Good Repair
The current Bridgeport ferry terminal is located in a constrained site which negatively
affects the efficiency of unloading/loading operations, negatively affects ferry schedule
adherence, and effectively limits vehicle throughput and annual car/passenger growth. In
addition, the site has poor access to I-95, the main travel corridor used by most ferry
customers, which contributes to delays for disembarking vehicles, particularly during peak
periods.
The development of Barnum Landing will improve the efficiency of unloading/loading
operations, improve ferry schedule adherence, reduce passenger delays, and increase annual
ferry ridership by improving the attractiveness of ferry travel compared to car travel.
Additionally, preserving and improving a commercial cargo facility, associated warehouse
Barnum Landing Ferry Improvement Project TIGER Grant Application Project Narrative
15
facilities and allowing for stationing of a tug at Barnum Landing would offer opportunities
for increased utilization of the facilities.
ii Economic Competitiveness
Over the past five years, the BPPJ Ferry has carried an average of 7,900 trucks, 406,000
cars, and 861,000 passengers annually in both directions between Bridgeport and Port
Jefferson4.
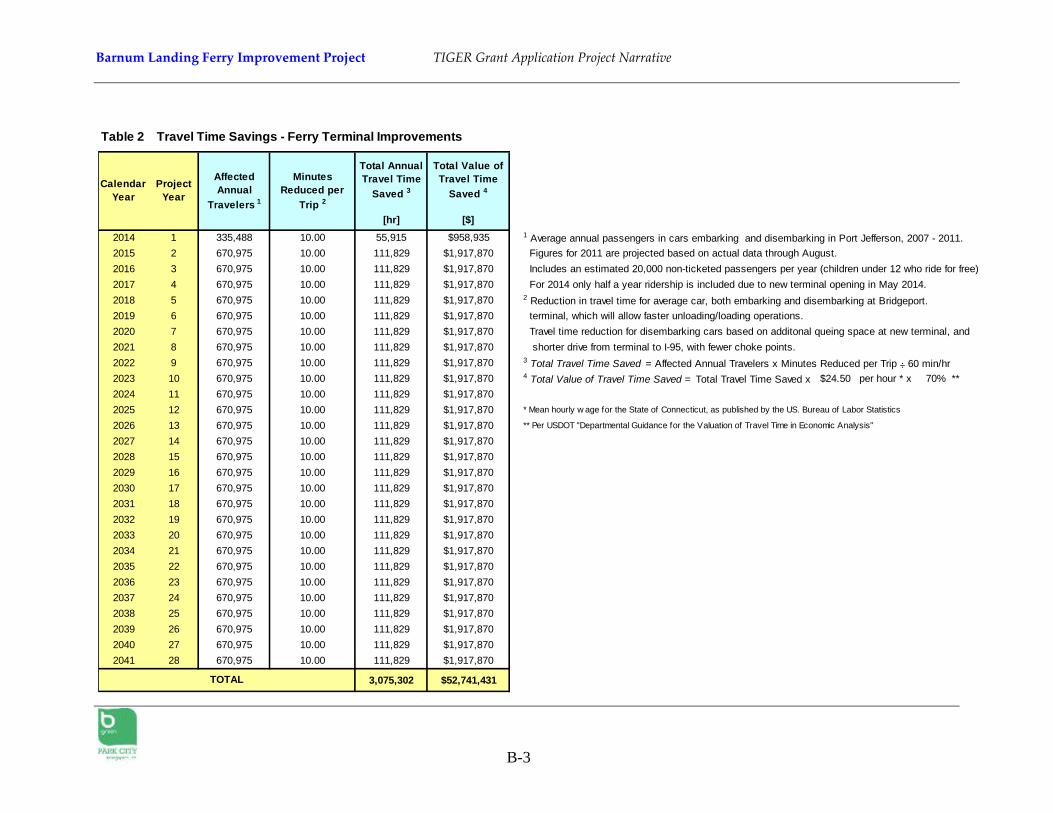
Barnum Landing is projected to reduce total trip time for existing ferry passengers
embarking and disembarking by car at Bridgeport by an average of 10 minutes. Travel time
reduction for cars embarking at Bridgeport will result from additional staging space at
Barnum Landing, which will allow faster unloading/loading operations. Travel time
reduction for disembarking cars will result from the additional staging space at Barnum
Landing, and a shorter drive time from the terminal to I-95, due to a shorter distance and
fewer choke points. The economic value of this projected travel time reduction for existing
ferry car passengers totals $1.9 million per year.
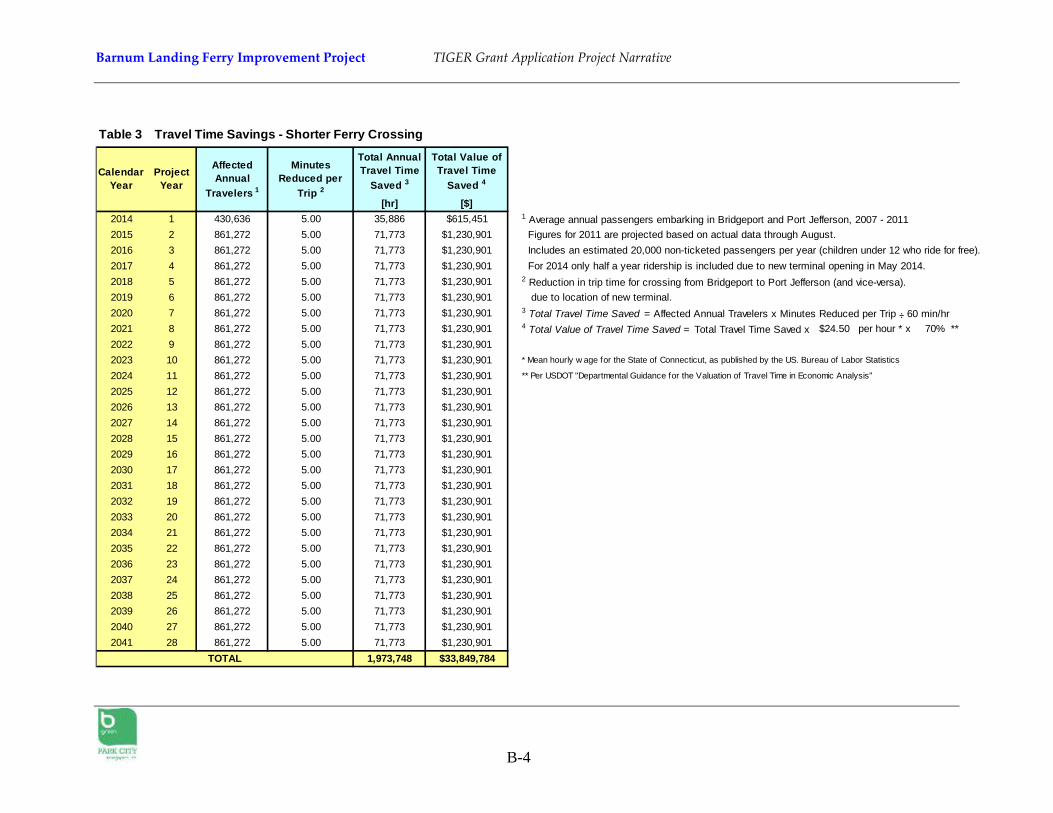
The location of Barnum Landing, east and south of the existing terminal, will also reduce
ferry transit times between Bridgeport and Port Jefferson by an estimated five minutes,
further reducing total travel time for existing ferry passengers, including passengers in cars
and walk-on passengers not in a car. The economic value of this projected travel time
reduction for existing ferry passengers is $1.2 million per year.
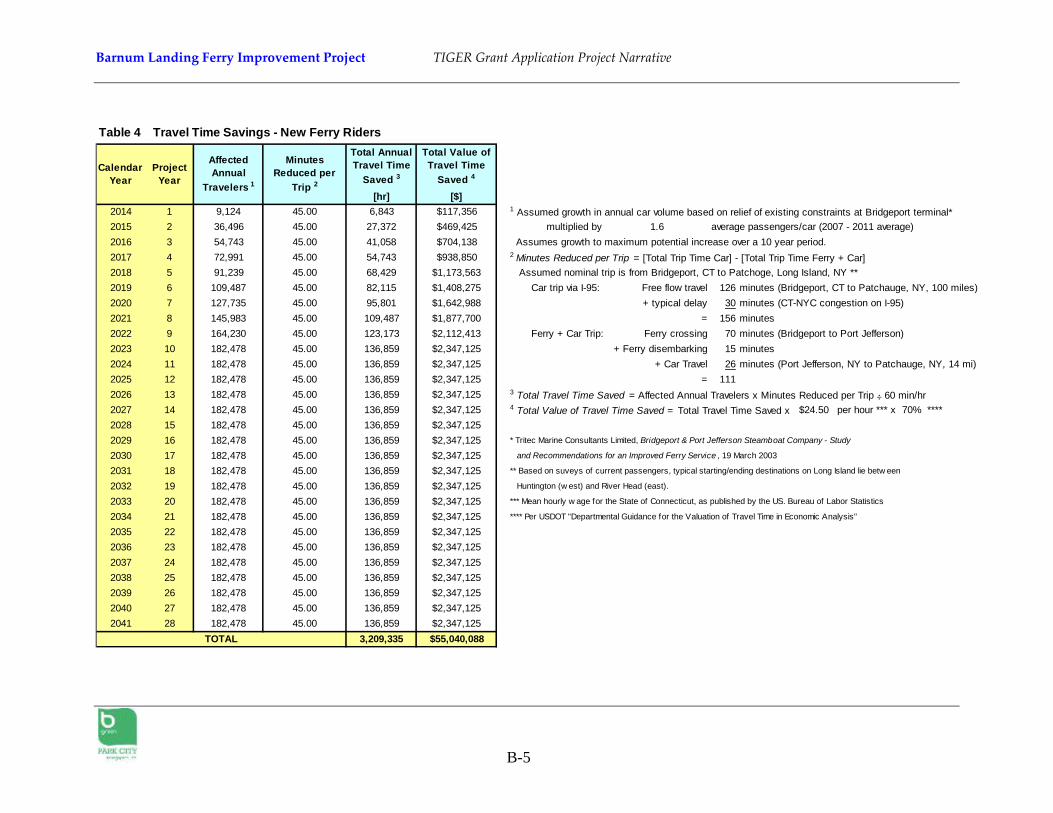
Over the next ten years, Barnum Landing is projected to increase current annual ferry
ridership by 25% - adding 114,000 more cars annually and 182,000 more passengers. Total
trip time for these passengers, for trips from Bridgeport to Long Island5, is projected to
decrease by an average of 45 minutes compared to driving south on I-95 and through New
York City. The economic value of this projected travel time reduction for new ferry
passengers is $2.3 million per year.
Increased Bridgeport to Port Jefferson ferry ridership will remove cars from the severely
congested I-95 corridor through southern Connecticut and the New York City metropolitan
region. This will reduce congestion delays and travel time for the remaining cars using the
corridor, but the economic value of this travel time reduction could not be calculated.
Improvements to land side facilities at the Barnum Landing commercial cargo facility will
allow a tug to be stationed in Bridgeport full-time, to service local ship and barge moves
(approximately 700 per year). Currently, tugs must come from New Haven or Port Jefferson
to assist these arrivals, a two hour trip. The ability to station a tug in Bridgeport full-time
will reduce barge transit time by 1400 hours per year, saving fuel and crew costs totaling
$370,000 per year.
4 Annualized Average for January 2007 – August 2011. Includes an estimate of 20,000 annual un-ticketed
passengers, under 12 years old, who ride for free. 5 Ferry passengers from Bridgeport to Port Jefferson could be transiting from New England to multiple final
destinations throughout Long Island and the boroughs of New York City. For this analysis the “average” trip was
modeled assuming that the final destination was Patchogue, NY. Customer research has shown that the majority of
ferry passengers have a start or end point on the eastern end of Long Island, between Huntington and Riverhead.
Patchogue is the approximate center of this main service area. See Attachment B, Benefit-Cost Analysis.
Barnum Landing Ferry Improvement Project TIGER Grant Application Project Narrative
16
iii Livability
This project is intermodal in nature, involving significant improvements to an existing
transportation mode that offers an alternative to travel by car and freight movement by truck
along the congested I-95 corridor, for trips from New England to Long Island and the New
York City metropolitan area. As such, this project will further the Department of
Transportation’s Marine Highway Program goals, as outlined in the America’s Marine
Highway – Report to Congress (April 2011). As articulated in that report, these goals
include:
Improving our nation‘s economic competitiveness while creating and sustaining
jobs, including through the reduction of landside traffic congestion, the ability to add
cost-effective new freight and passenger transportation capacity, the reduction of
wear-and-tear on roads and bridges, and by providing resiliency to the surface
transportation system;
Providing an environmentally sustainable transportation system that requires less
energy and reduces greenhouse gas (GHG) emissions per ton-mile of freight moved;
Adding to the nation‘s strategic sealift resources and supporting the nation‘s
shipbuilding industry; and
Improving public safety and security through the safe movement of passengers and
freight, including hazardous materials, and by enabling more effective transportation
responses to natural and manmade disasters.
The I-95 Corridor Coalition estimates that by 2040, miles traveled by all vehicles using the
corridor will increase by 70 percent. Truck volumes could nearly double even though such
volumes are probably not physically or environmentally sustainable in many regions along
the corridor. Further, ever-increasing congestion at highway and rail bottlenecks along the
Atlantic Coast constrains interstate commerce and economic productivity. The Coalition
estimates that to respond to this growth, approximately $47 billion per year would need to
be invested along the I-95 corridor on highways, $15 billion to $19 billion per year for
transit, $4 billion to $5 billion per year for passenger rail, and $2 billion per year for freight
rail.
By strengthening water-borne passenger and freight alternatives to car and truck traffic
along the corridor, the Barnum Landing project - both the new ferry terminal and the
improvement of the existing adjacent deep water freight berth - will contribute to the
creation of a marine highway that can help to alleviate current and future land-side
congestion.
In addition, this project includes construction of new pedestrian boardwalks along the
waterfront, which will provide the East End residents with their only open, public access to the
waterfront in the neighborhood. The project will also bring new retail shopping opportunities to
East End neighborhood residents, in particular a local grocery store/market. This will
significantly reduce the amount of time required for local residents without a car to shop for
groceries, and may help to promote healthier eating habits by providing easier access to fresh,
healthy foods.
Barnum Landing Ferry Improvement Project TIGER Grant Application Project Narrative
17
The creation of a local grocery store/market is vital for East End households living in poverty,
who must take a bus to purchase groceries. Each bus ride could last 30 minutes, adding
approximately one hour to the weekly shopping experience. The projected travel time
reduction, if residents no longer took the bus, has an economic value of $412,000 per year6.
This economic value is presented for illustrative purposes only and is not included in the
benefit-cost analysis.
This project directly furthers the six “livability principles” developed by DOT, HUD, and
EPA as part of the Partnership for Sustainable Communities. Specifically, this project will:
provide more transportation choices to a significant urban population.
provide greatly enhanced public access to the waterfront which has not been previously
accessible.
enhance the economic competitiveness of Bridgeport by improving the over-all
transportation system and allowing the development of new sources of employment.
iv Environmental Sustainability
This project will reduce travel times and vehicle idling for existing Bridgeport to Port
Jefferson ferry customers, will reduce ferry vessel emissions due to shorter cross-sound
transit times, will reduce total vehicle miles traveled by new ferry customers who switch to
the ferry instead of traveling from Connecticut to Long Island exclusively by car, and reduce
tug operating times for existing barge calls. All of these outcomes will contribute to a
reduction in criteria pollutant and greenhouse gas emissions from vehicles operating in the
greater Bridgeport area. Over the next 30 years projected reductions in vehicle and marine
vessel exhaust emissions are as follows7:
Particulate Matter (PM) - 17.75 ton reduction
Nitrogen Oxides (NOx) – 579 ton reduction
Carbon Monoxide (CO) – 809 ton reduction
Volatile Organic Compounds (VOC) – 53.7 ton reduction
Carbon Dioxide (CO2) – 137,000 ton reduction
Using estimates of emission damage costs used by the National Highway Traffic Safety
Administration, and EPA’s Diesel Emission Quantifier, the economic value of these
projected emission reductions is estimated to total approximately $1.0 million annually.
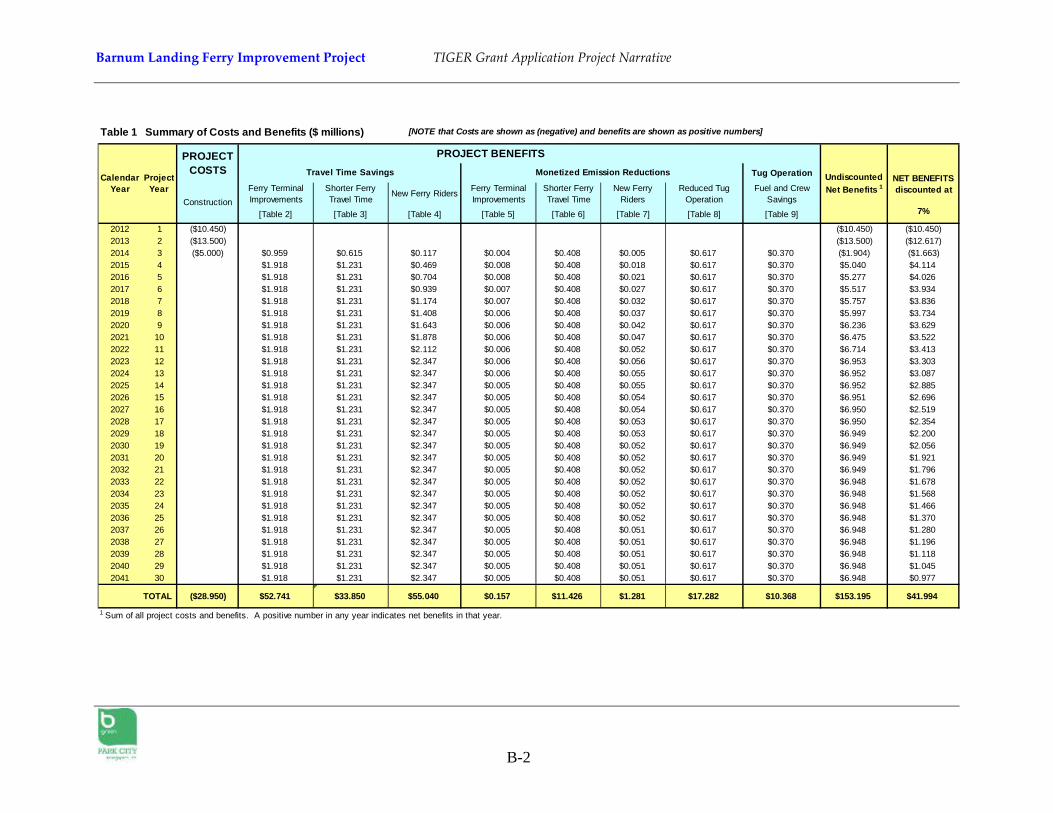
v Summary of Benefit-Cost Analysis
The projected construction cost of this project is $28.95 million, and the expected monetized
benefits that will accrue from the project over the next 30 years total $182.1 million, for a
net benefit of $153.2 million. The net present value of these net benefits over the 30-year
project analysis period is $41.9 million. The benefit-cost ratio for this project is 2.45:1.
Of the total $153.2 million in expected net benefits from this project, 78% are the result of
travel time savings, 16.5% represents the monetized value of projected emission reductions,
6 462 East End households in poverty(2000 Census) x 1 hr./trip x 52 trips/yr. x $24.50/hr. x 70%
7 See the Benefit-Cost Analysis included at Attachment B for the methodology of calculating expected emission
reductions.
Barnum Landing Ferry Improvement Project TIGER Grant Application Project Narrative
18
and 5.5% represents the direct estimated savings of fuel and crew costs associated with tug
operation.
See Attachment B for the complete benefit-cost analysis, including all major assumptions
and calculation methodology.
B. Job Creation & Economic Stimulus
This project will rapidly inject short-term economic stimulus into the economy of Connecticut
through the creation of construction jobs, and in the long term will directly contribute to the
creation of over 300 permanent new jobs in Bridgeport, by enabling an expansion of the
existing ferry service and through related retail development.
Construction jobs in the State of Connecticut have seen a decline of 27% (19,000 jobs lost)
since 20078. This project will create 181.7 job-years of the construction jobs for construction
of Barnum Landing.
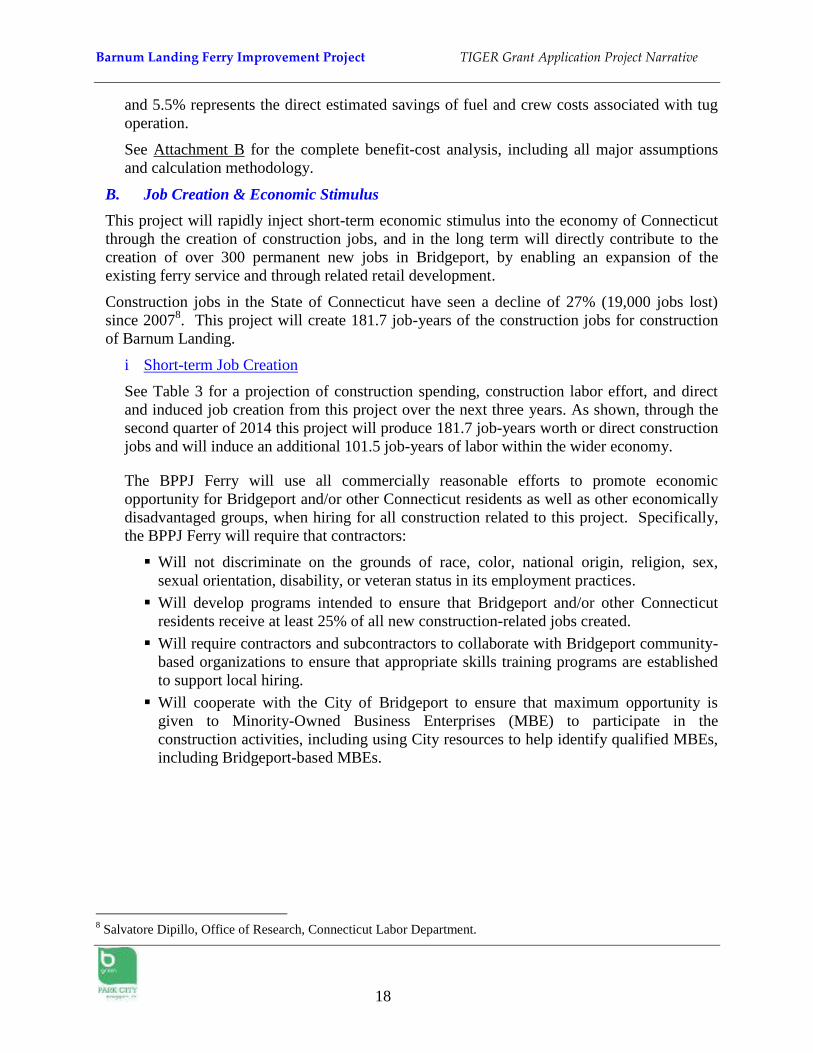
i Short-term Job Creation
See Table 3 for a projection of construction spending, construction labor effort, and direct
and induced job creation from this project over the next three years. As shown, through the
second quarter of 2014 this project will produce 181.7 job-years worth or direct construction
jobs and will induce an additional 101.5 job-years of labor within the wider economy.
The BPPJ Ferry will use all commercially reasonable efforts to promote economic
opportunity for Bridgeport and/or other Connecticut residents as well as other economically
disadvantaged groups, when hiring for all construction related to this project. Specifically,
the BPPJ Ferry will require that contractors:
Will not discriminate on the grounds of race, color, national origin, religion, sex,
sexual orientation, disability, or veteran status in its employment practices.
Will develop programs intended to ensure that Bridgeport and/or other Connecticut
residents receive at least 25% of all new construction-related jobs created.
Will require contractors and subcontractors to collaborate with Bridgeport community-
based organizations to ensure that appropriate skills training programs are established
to support local hiring.
Will cooperate with the City of Bridgeport to ensure that maximum opportunity is
given to Minority-Owned Business Enterprises (MBE) to participate in the
construction activities, including using City resources to help identify qualified MBEs,
including Bridgeport-based MBEs.
8 Salvatore Dipillo, Office of Research, Connecticut Labor Department.
Barnum Landing Ferry Improvement Project TIGER Grant Application Project Narrative
19
Table 3 Construction Spending and Short-term Job Creation
Time Frame Construction
Spending
Construction
Labor Effort
[job-hrs]
Direct Jobs
Created 9
[job-years]
Induced
Jobs
Created 10
[job-years]
1st QTR 2012 NA NA NA NA
2nd
QTR 2012 NA NA NA NA
3rd
QTR 2012 $3,350,000 50,000 24.0 13.4
4th QTR 2012 $4,000,000 59,700 28.7 16.1
1st QTR 2013 $3,750,000 56,000 26.9 15.0
2nd
QTR 2013 $3,250,000 48,500 23.3 13.0
3rd
QTR 2013 $3,250,000 48,500 23.3 13.0
4th QTR 2013 $3,250,000 48,500 23.3 13.0
1st QTR 2014 $2,500,000 37,300 17.9 10.0
2nd
QTR 2014 $2,500,000 37,300 17.9 10.0
TOTAL $25,850,000* 385,800 185.3 103.5
* Total construction spending does not include Phase 2 land acquisition costs.
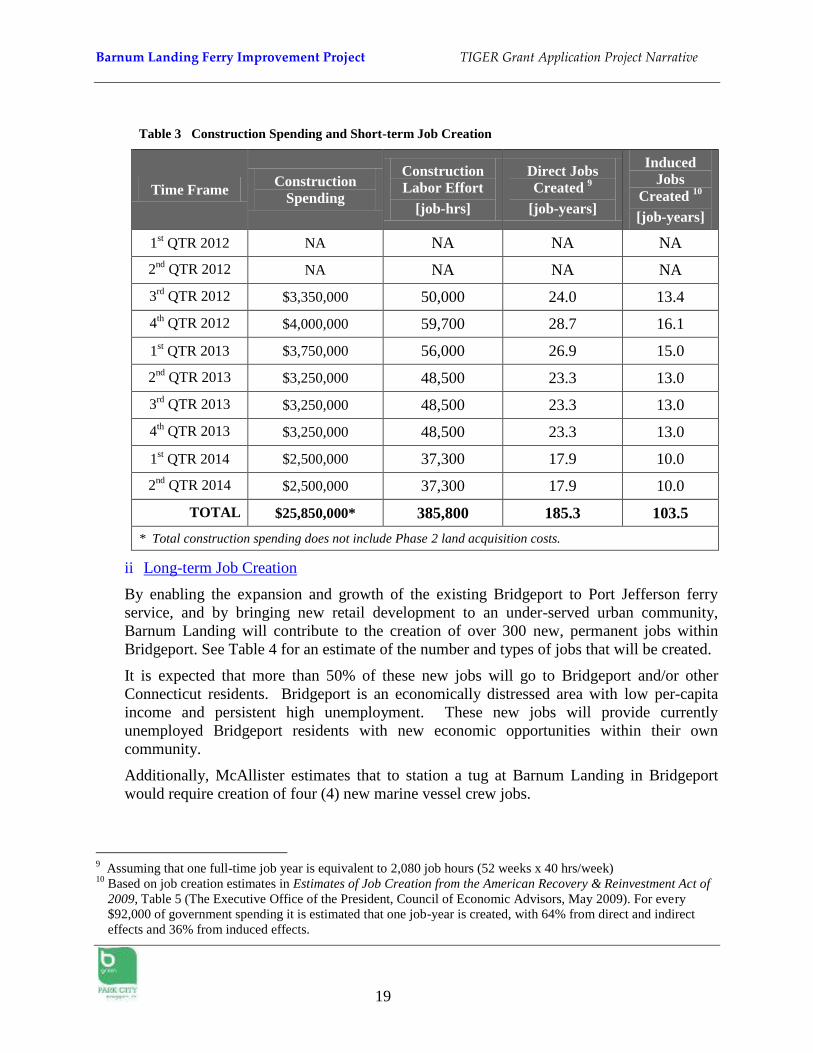
ii Long-term Job Creation
By enabling the expansion and growth of the existing Bridgeport to Port Jefferson ferry
service, and by bringing new retail development to an under-served urban community,
Barnum Landing will contribute to the creation of over 300 new, permanent jobs within
Bridgeport. See Table 4 for an estimate of the number and types of jobs that will be created.
It is expected that more than 50% of these new jobs will go to Bridgeport and/or other
Connecticut residents. Bridgeport is an economically distressed area with low per-capita
income and persistent high unemployment. These new jobs will provide currently
unemployed Bridgeport residents with new economic opportunities within their own
community.
Additionally, McAllister estimates that to station a tug at Barnum Landing in Bridgeport
would require creation of four (4) new marine vessel crew jobs.
9 Assuming that one full-time job year is equivalent to 2,080 job hours (52 weeks x 40 hrs/week)
10 Based on job creation estimates in Estimates of Job Creation from the American Recovery & Reinvestment Act of
2009, Table 5 (The Executive Office of the President, Council of Economic Advisors, May 2009). For every
$92,000 of government spending it is estimated that one job-year is created, with 64% from direct and indirect
effects and 36% from induced effects.
Barnum Landing Ferry Improvement Project TIGER Grant Application Project Narrative
20
Table 4 Projected Long-term Job Creation from Barnum Landing Development
Job Type 2013 - 2014 2015 - 2016 2017 - 2020 TOTAL
Retail 10 10 4 24
Warehouse 13 2 2 17
Office/Professional 13 13 26 52
Ferry related 5 2 27 34
Tug Operations
(Crew) 4 -- -- 4
SUB-TOTAL 45 27 59 135
Indirect Jobs 11
70 46 100 216
TOTAL
PERMANENT JOBS 115 73 159 347
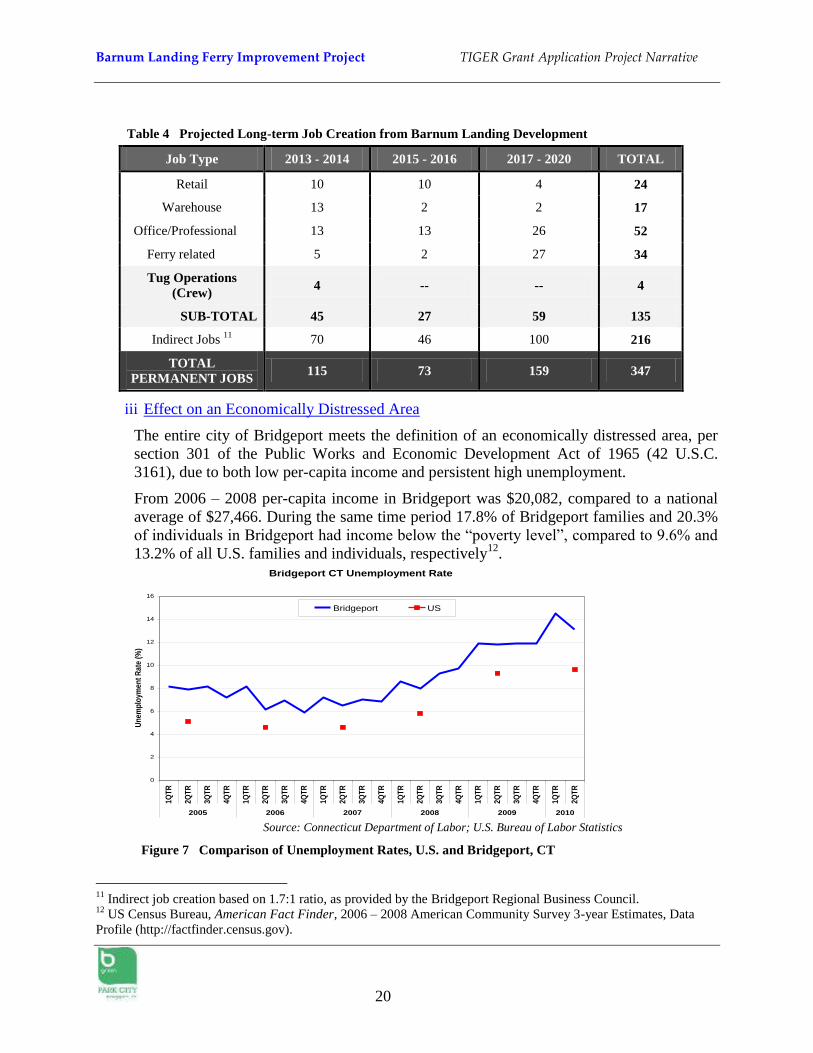
iii Effect on an Economically Distressed Area
The entire city of Bridgeport meets the definition of an economically distressed area, per
section 301 of the Public Works and Economic Development Act of 1965 (42 U.S.C.
3161), due to both low per-capita income and persistent high unemployment.
From 2006 – 2008 per-capita income in Bridgeport was $20,082, compared to a national
average of $27,466. During the same time period 17.8% of Bridgeport families and 20.3%
of individuals in Bridgeport had income below the “poverty level”, compared to 9.6% and
13.2% of all U.S. families and individuals, respectively12
.
Source: Connecticut Department of Labor; U.S. Bureau of Labor Statistics
Figure 7 Comparison of Unemployment Rates, U.S. and Bridgeport, CT
11
Indirect job creation based on 1.7:1 ratio, as provided by the Bridgeport Regional Business Council. 12
US Census Bureau, American Fact Finder, 2006 – 2008 American Community Survey 3-year Estimates, Data
Profile (http://factfinder.census.gov).
Bridgeport CT Unemployment Rate
0
2
4
6
8
10
12
14
16
1QT
R
2QT
R
3QT
R
4QT
R
1QT
R
2QT
R
3QT
R
4QT
R
1QT
R
2QT
R
3QT
R
4QT
R
1QT
R
2QT
R
3QT
R
4QT
R
1QT
R
2QT
R
3QT
R
4QT
R
1QT
R
2QT
R
2005 2006 2007 2008 2009 2010
Un
emp
loym
ent
Rat
e (%
)
Bridgeport US
Barnum Landing Ferry Improvement Project TIGER Grant Application Project Narrative
21
See Figure 7 for a comparison of unemployment rates in Bridgeport and the U.S. as a whole
from 2005 through the second quarter of 2010. As shown, for the last five years the Bridgeport
unemployment rate has typically been at least two percentage points higher than the U.S.
average.
iv. Project Schedule
See Table 1 on page 12 for the projected schedule for completion of the proposed transportation
investments under this project. As shown, construction activities are expected to begin as early
as September 2012 with construction completion and opening of Barnum Landing in May 2014.
v. Project Approvals
This project is ready to proceed to design and construction expeditiously once grant funds are
received. See below under section V for a discussion of project readiness and status of all
required project approvals.
C. Innovation
The BPPJ Ferry will actively pursue green options for the design and construction of Barnum
Landing utilizing high performance guidelines and sustainable approaches. The feasibility of
natural gas power for future new-build ferries, either as replacements for existing vessels or for
long-term service expansion will also be investigated.
D. Partnership
While a private development, Barnum Landing has the full support of the City of Bridgeport,
which views the project as an important element of its overall plan for revitalization of the East
End neighborhood.
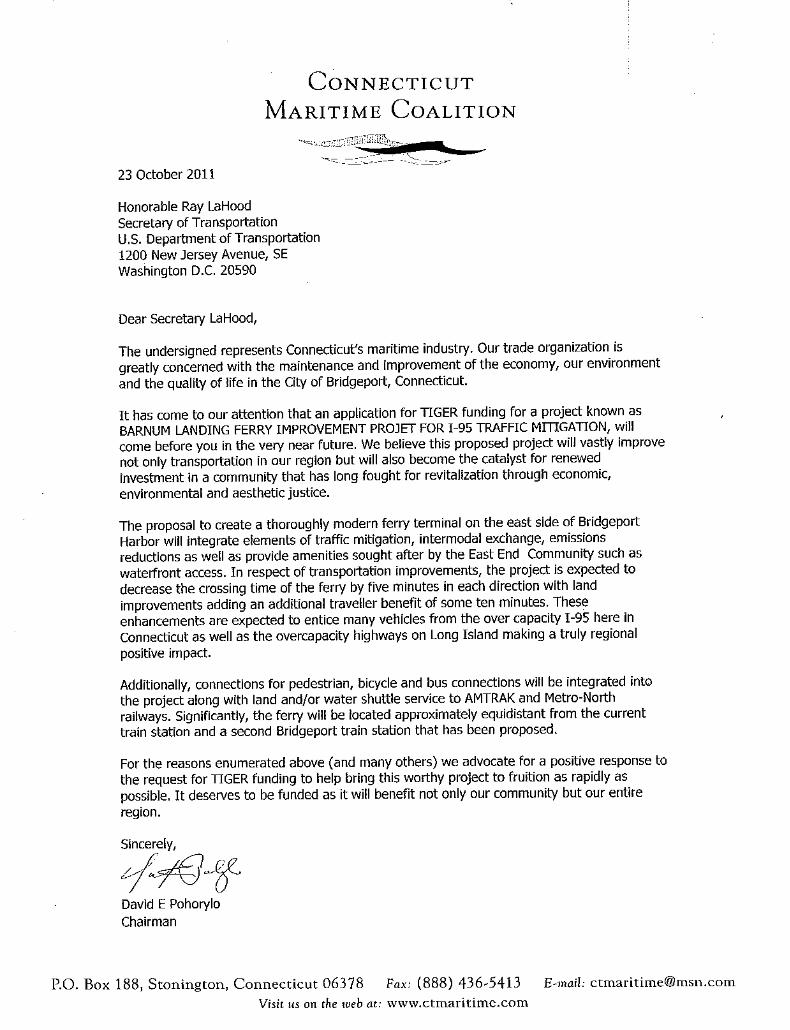
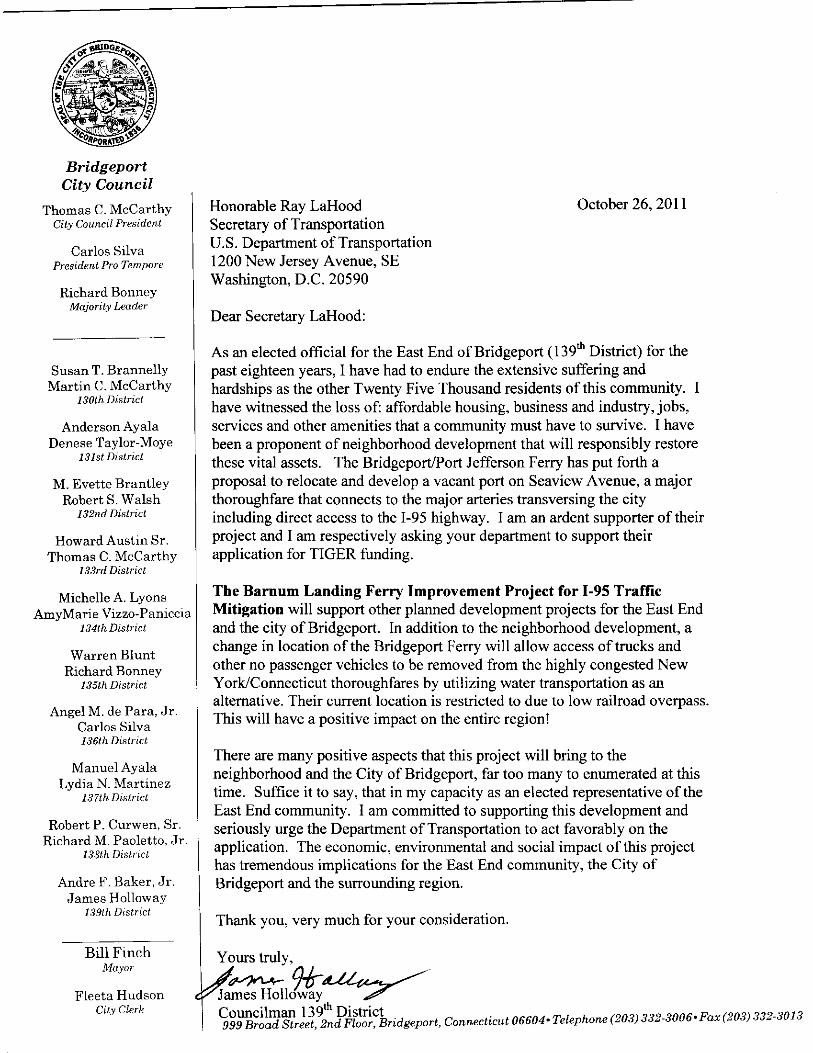
As evidenced by the Letters of Support included at Attachment A, this project also has the
formal support of the following agencies,groups and individuals:
Connecticut Maritime Coalition
The East End Neighborhood Revitalization Zone
East End Community Council
James Holloway, Councilman – 139th
District, Bridgeport City Council
Ralph R. Ford, Ph.D., Democratic District Leader – 139th
District, Bridgeport
V. Project Readiness & NEPA
This project can proceed quickly to design and construction after grant award. Phase 1 land
acquisition is complete, and the required environmental and legislative approvals are in process,
and are expected to be completed by the end of September 2012. Preliminary design work has
begun. Necessary financing for local matching funds is in place.
A. Environmental Reviews
The project will be submitted through the U.S. Department of Transportation’s Maritime
Administration (MARAD) to complete National Environmental Policy Act (NEPA) review and
processing. Barnum Landing is located directly on Bridgeport Harbor, is easily accessed by
Barnum Landing Ferry Improvement Project TIGER Grant Application Project Narrative
22
existing surface roads and Interstate 95 (I-95), and is in close proximity to other transportation
modes including the Metro North railroad station, and the Greater Bridgeport Transit (GBT) bus
terminal. As such, Barnum Landing fits nicely into the existing transportation network and will
enhance intermodal connectivity of the area; an important consideration given the increasingly
congested nature of Interstate I-95 through southwestern Connecticut.
Natural resources on and in the vicinity of Barnum Landing are scarce and only include the few
that are described below. The site proper is entirely paved with the exception of two dilapidated
buildings that will be removed. Also, the shorefront at the site is completely developed and
would require only minimal improvements to accommodate the proposed ferry service. Those
improvements would include updating bulkheads, and adding loading ramps (link spans) and
dolphins. Most importantly, dredging would not be required as the water depth at this location is
more than adequate to support unimpeded ferry operations. Since the project will include
sustainable design components/techniques and a mixed-use, community-oriented development,
the relocated ferry terminal may also provide several benefits to area residents and the City of
Bridgeport. Moreover, the proposed action is in keeping with the City’s plans to enhance the
overall image of this formerly industrialized area and to improve citizen access to the waterfront.
Based on the aforementioned facts, it is anticipated that Barnum Landing would result in
minimal impacts to the environment and the surrounding community. As such, we anticipate the
preparation of an Environmental Assessment (EA) with a finding of no significant impact
(FONSI) since the project components will not individually or cumulatively result in significant
social and/or environmental impacts. State funding will not be used for this project; therefore a
separate Connecticut Environmental Policy Act (CEPA) Environmental Impact Evaluation (EIE)
document is not required and therefore will not be prepared.
The NEPA process was begun in early October 2011, with the distribution of project information
letters to state, federal, and local maritime, transportation, environmental, and planning agencies.
To date, the following agencies have been contacted:
MARAD, Office of Infrastructure Development and Congestion Mitigation
U.S. Coast Guard
U.S. Department of the Army, New England District Corps of Engineers
U.S. Environmental Protection Agency, New England Region 1
U.S. Fish and Wildlife Service (USFWS)
NOAA – National Marine Fisheries Service
Connecticut Department of Energy and Environmental Protection (CTDEEP)
Connecticut State Historic Preservation Officer (SHPO)
Connecticut Department of Public Health, Environmental Health Section
City of Bridgeport, Connecticut
Office of the Harbormaster, Bridgeport
The NEPA process will continue through the remainder of 2011 with the screening of natural
and community resources and a draft EA prepared and ready for internal review by late February
2012. Formal agency review is then anticipated to occur in early Spring with an administrative
draft of the EA ready for public review by late Spring. It is anticipated that the entire NEPA
process will conclude with a FONSI by September 2012.
Barnum Landing Ferry Improvement Project TIGER Grant Application Project Narrative
23
Based on a preliminary review of the area surrounding the proposed site, there is the potential for
impacts to the following resources:
100-Year floodplain: Barnum Landing is located entirely within the 100-year floodplain
of Long Island Sound. A more in-depth evaluation of the potential for this project to
impact floodplains and flood elevations will be necessary. It should be noted however,
that the proposed site is currently a large, paved area
Coastal boundary and coastal resources: The proposed site is located entirely within
Connecticut’s Coastal Boundary, which generally extends inland approximately 1,000
feet from the shoreline. The proposed ferry terminal is a water-dependent use and is
therefore permitted/allowed under the statutes of the Connecticut Coastal Management
Act (CCMA) of 1980.
Neighborhoods – a large number of multi-family and single-family residences are located
to the north and east of Seaview Avenue. The EA will include an evaluation of the
potential for impacts from increased traffic along Seaview Avenue and from noise
resulting from the operation of the ferry terminal.
Environmental Justice – the City of Bridgeport is economically-distressed, therefore the
EA will evaluate the potential for disproportionate impacts (both adverse and beneficial)
to low-income and minority populations living near Barnum Landing.
Hazardous and Contaminating Conditions - Environmental investigations pursuant to
the Connecticut Property Transfer Act and in accordance with State and Federal
requirements are currently being conducted..
B. Legislative Approvals
There are no legislative approvals required for this project to proceed.
C. State and Local Planning
The City of Bridgeport is in the process of presenting this project to the Greater Bridgeport
Metropolitan Planning Organization for inclusion into the Transportation Improvement Plan
(TIP/STIP). The project will be added to the TIP/STIP once the grant application is approved
by the U.S. Department of Transportation. Barnum Landing is consistent with the region’s
long range transportation plan and once amended, the plan will include the action in its list of
recommended projects. Barnum Landing is also consistent with the goals of the New York
Metropolitan Transportation Council (NYMTC) 2010-2035 Regional Transportation Plan, and
also aligned with the recommendations of the Long Island Sound Waterborne Transportation
Plan.
D. Technical Feasibility
The following permits and approvals will be required for the proposed project:
Structures and Dredging Permit from the Army Corps of Engineers (33 USC 403)
Structures and Dredging Permit from Connecticut Department of Environmental
Protection (Section 22a-361, CT general Statutes)
Barnum Landing Ferry Improvement Project TIGER Grant Application Project Narrative
24
Special Permit/Site Plan Approval from the City of Bridgeport Planning and Zoning
Commission (Section 7-3-2 & 14-4, Bridgeport Zoning Regulations)
Building and Construction permits from the City of Bridgeport
Major Traffic Generator Certificate from the Connecticut State Traffic Commission
Encroachment Permit from the Connecticut Department of Transportation
General Permit for Stormwater and Dewatering Wastewaters from Construction
Activities from the Connecticut Department of Environmental Protection.
The processes for obtaining these permits will begin in December 2011, concurrent with
completion of the NEPA process. It is expected that all required permits will be obtained no
later than September 2012.
Preliminary design work for both site and building construction has already begun. The BPPJ
Ferry has engaged the following consultants to help with design and development of this
project:
Marine Waterfront Planning & Design - Ocean and Coastal Consultants, Inc., Trumbull,
CT
Environmental Consulting - Environ Corporation, Hartford, CT
Site Planning & Architecture - Gregg Wies & Gardner Architects, LLC (AOR), New
Haven, CT; Gray Organschi Architects, New Haven, CT
Civil & Geotechnical Engineering - Langan Engineering & Environmental Services, Inc.,
New Haven, CT
Landscape Architecture - Starr Whitehouse Landscape Architects and Planners PLLC,
New York, NY
Traffic Engineering/NEPA Consulting - Fitzgerald & Halliday, LLC, Hartford, CT
Legal/Permitting - Bryan Cave LLC, New York, NY
Local Permitting - Quatrella & Rizio, LLC , Hartford, CT
Ferry Vessel Environmental Consulting - M.J. Bradley & Associates, LLC
The preliminary design is expected to be completed in December 2011 with final design
completed in December 2012.
The BPPJ Ferry already owns the property required for Phase 1 construction. Concurrent with
the design and permitting process, the company will begin the process to acquire the property
required for Phase 2. It is expected that this process can be completed by the middle of 2012.
If Phase 2 property acquisition cannot be completed as quickly as planned, Phase 1
construction will proceed anyway, followed by Phase 2 after the additional site can be acquired.
TIGER funds will be used exclusively for construction and improvements; all land acquisition
will be accomplished using local match funding.
E. Financial Feasibility
The BPPJ Ferry has offered regular service to its customers ever since its founding in 1883.
The BPPJ Ferry is a wholly owned subsidiary of McAllister. Founded in 1864, McAllister is a
Barnum Landing Ferry Improvement Project TIGER Grant Application Project Narrative
25
diversified marine industrial company that owns or operates over 100 vessels and more than a
dozen marine terminals on the East Coast and the Caribbean.13
Local match funding for this project will be provided by BPPJ Ferry from privately raised
capital. Barnum Landing, LLC will enter into all contractual agreements regarding construction
of the facility. McAllister is a privately held company owned by the McAllister family.
McAllister does not have any outstanding public stock or bonds. Specific financial information
will be made available upon request, after execution of a mutually satisfactory confidentiality
agreement.
Through McAllister’s insurance program, the BPPJ Ferry is in a position to respond to
insurable liabilities arising out of the proposed operations. This extensive insurance program is
placed with top rated US and London insurance syndicates.
McAllister has a syndicated loan with Bank of America, N.A. This syndicated loan includes a
line of credit for the construction or purchase of vessels or facilities, including facilities such as
Barnum Landing. For bank references, please contact Patrick Cornell, Senior Vice President
Bank of America Business Capital, Bank of America Merrill Lynch, 4 Penn Center, 1600 John
F. Kennedy Blvd, Suite 1200 Philadelphia, PA 19103.
The City of Bridgeport has a demonstrated ability to effectively manage grants, with more than
30 federal grants currently under management. A summary of their major on-going grants can
be found in Attachment C.
VI. Federal Wage Rate Certification
The City of Bridgeport agrees to comply with the requirements of subchapter IV of chapter 31
of title 40, United States Code of Federal Regulations (Federal Wage Rate Requirements) for
all work associated with this project. See signed certification statement at Attachment D.
VII. Material Changes to Pre-Application Form
Since submission of the pre-application the projected project budget for this project has
increased from $20 million to $28.95 million. Requested TIGER grant funds have increased
from $12 million to $14.75 million.
13
Additional information regarding BPPJ Ferry and McAllister is available at the company websites:
http://www.88844ferry.com/Home.aspx and http://www.mcallistertowing.com/
Barnum Landing Ferry Improvement Project TIGER Grant Application Project Narrative
A-1
ATTACHMENT A
NYMTC Letter of Consistency
Letters of Support

Barnum Landing Ferry Improvement Project TIGER Grant Application Project Narrative
B-1
ATTACHMENT B Benefit-Cost Analysis
Barnum Landing Ferry Improvement Project TIGER Grant Application Project Narrative
B-2
Table 1 Summary of Costs and Benefits ($ millions) [NOTE that Costs are shown as (negative) and benefits are shown as positive numbers]
Tug Operation
Ferry Terminal Improvements
Shorter Ferry Travel Time
New Ferry Riders Ferry Terminal Improvements
Shorter Ferry Travel Time
New Ferry Riders
Reduced Tug Operation
Fuel and Crew Savings
[Table 2] [Table 3] [Table 4] [Table 5] [Table 6] [Table 7] [Table 8] [Table 9] 7%
2012 1 ($10.450) ($10.450) ($10.450)2013 2 ($13.500) ($13.500) ($12.617)2014 3 ($5.000) $0.959 $0.615 $0.117 $0.004 $0.408 $0.005 $0.617 $0.370 ($1.904) ($1.663)2015 4 $1.918 $1.231 $0.469 $0.008 $0.408 $0.018 $0.617 $0.370 $5.040 $4.1142016 5 $1.918 $1.231 $0.704 $0.008 $0.408 $0.021 $0.617 $0.370 $5.277 $4.0262017 6 $1.918 $1.231 $0.939 $0.007 $0.408 $0.027 $0.617 $0.370 $5.517 $3.9342018 7 $1.918 $1.231 $1.174 $0.007 $0.408 $0.032 $0.617 $0.370 $5.757 $3.8362019 8 $1.918 $1.231 $1.408 $0.006 $0.408 $0.037 $0.617 $0.370 $5.997 $3.7342020 9 $1.918 $1.231 $1.643 $0.006 $0.408 $0.042 $0.617 $0.370 $6.236 $3.6292021 10 $1.918 $1.231 $1.878 $0.006 $0.408 $0.047 $0.617 $0.370 $6.475 $3.5222022 11 $1.918 $1.231 $2.112 $0.006 $0.408 $0.052 $0.617 $0.370 $6.714 $3.4132023 12 $1.918 $1.231 $2.347 $0.006 $0.408 $0.056 $0.617 $0.370 $6.953 $3.3032024 13 $1.918 $1.231 $2.347 $0.006 $0.408 $0.055 $0.617 $0.370 $6.952 $3.0872025 14 $1.918 $1.231 $2.347 $0.005 $0.408 $0.055 $0.617 $0.370 $6.952 $2.8852026 15 $1.918 $1.231 $2.347 $0.005 $0.408 $0.054 $0.617 $0.370 $6.951 $2.6962027 16 $1.918 $1.231 $2.347 $0.005 $0.408 $0.054 $0.617 $0.370 $6.950 $2.5192028 17 $1.918 $1.231 $2.347 $0.005 $0.408 $0.053 $0.617 $0.370 $6.950 $2.3542029 18 $1.918 $1.231 $2.347 $0.005 $0.408 $0.053 $0.617 $0.370 $6.949 $2.2002030 19 $1.918 $1.231 $2.347 $0.005 $0.408 $0.052 $0.617 $0.370 $6.949 $2.0562031 20 $1.918 $1.231 $2.347 $0.005 $0.408 $0.052 $0.617 $0.370 $6.949 $1.9212032 21 $1.918 $1.231 $2.347 $0.005 $0.408 $0.052 $0.617 $0.370 $6.949 $1.7962033 22 $1.918 $1.231 $2.347 $0.005 $0.408 $0.052 $0.617 $0.370 $6.948 $1.6782034 23 $1.918 $1.231 $2.347 $0.005 $0.408 $0.052 $0.617 $0.370 $6.948 $1.5682035 24 $1.918 $1.231 $2.347 $0.005 $0.408 $0.052 $0.617 $0.370 $6.948 $1.4662036 25 $1.918 $1.231 $2.347 $0.005 $0.408 $0.052 $0.617 $0.370 $6.948 $1.3702037 26 $1.918 $1.231 $2.347 $0.005 $0.408 $0.051 $0.617 $0.370 $6.948 $1.2802038 27 $1.918 $1.231 $2.347 $0.005 $0.408 $0.051 $0.617 $0.370 $6.948 $1.1962039 28 $1.918 $1.231 $2.347 $0.005 $0.408 $0.051 $0.617 $0.370 $6.948 $1.1182040 29 $1.918 $1.231 $2.347 $0.005 $0.408 $0.051 $0.617 $0.370 $6.948 $1.0452041 30 $1.918 $1.231 $2.347 $0.005 $0.408 $0.051 $0.617 $0.370 $6.948 $0.977
TOTAL ($28.950) $52.741 $33.850 $55.040 $0.157 $11.426 $1.281 $17.282 $10.368 $153.195 $41.994
1 Sum of all project costs and benefits. A positive number in any year indicates net benefits in that year.
Calendar Year
Project Year
PROJECT COSTS
Construction
NET BENEFITS discounted at
Undiscounted Net Benefits 1
Travel Time Savings Monetized Emission Reductions
PROJECT BENEFITS
Barnum Landing Ferry Improvement Project TIGER Grant Application Project Narrative
B-3
Table 2 Travel Time Savings - Ferry Terminal Improvements
[hr] [$]2014 1 335,488 10.00 55,915 $958,935 1 Average annual passengers in cars embarking and disembarking in Port Jefferson, 2007 - 2011.2015 2 670,975 10.00 111,829 $1,917,870 Figures for 2011 are projected based on actual data through August.2016 3 670,975 10.00 111,829 $1,917,870 Includes an estimated 20,000 non-ticketed passengers per year (children under 12 who ride for free)2017 4 670,975 10.00 111,829 $1,917,870 For 2014 only half a year ridership is included due to new terminal opening in May 2014.2018 5 670,975 10.00 111,829 $1,917,870 2 Reduction in travel time for average car, both embarking and disembarking at Bridgeport.2019 6 670,975 10.00 111,829 $1,917,870 terminal, which will allow faster unloading/loading operations.2020 7 670,975 10.00 111,829 $1,917,870 Travel time reduction for disembarking cars based on additonal queing space at new terminal, and2021 8 670,975 10.00 111,829 $1,917,870 shorter drive from terminal to I-95, with fewer choke points.2022 9 670,975 10.00 111,829 $1,917,870 3 Total Travel Time Saved = Affected Annual Travelers x Minutes Reduced per Trip ÷ 60 min/hr2023 10 670,975 10.00 111,829 $1,917,870 4 Total Value of Travel Time Saved = Total Travel Time Saved x $24.50 per hour * x 70% **2024 11 670,975 10.00 111,829 $1,917,8702025 12 670,975 10.00 111,829 $1,917,870 * Mean hourly w age for the State of Connecticut, as published by the US. Bureau of Labor Statistics
2026 13 670,975 10.00 111,829 $1,917,870 ** Per USDOT "Departmental Guidance for the Valuation of Travel Time in Economic Analysis"
2027 14 670,975 10.00 111,829 $1,917,8702028 15 670,975 10.00 111,829 $1,917,8702029 16 670,975 10.00 111,829 $1,917,8702030 17 670,975 10.00 111,829 $1,917,8702031 18 670,975 10.00 111,829 $1,917,8702032 19 670,975 10.00 111,829 $1,917,8702033 20 670,975 10.00 111,829 $1,917,8702034 21 670,975 10.00 111,829 $1,917,8702035 22 670,975 10.00 111,829 $1,917,8702036 23 670,975 10.00 111,829 $1,917,8702037 24 670,975 10.00 111,829 $1,917,8702038 25 670,975 10.00 111,829 $1,917,8702039 26 670,975 10.00 111,829 $1,917,8702040 27 670,975 10.00 111,829 $1,917,8702041 28 670,975 10.00 111,829 $1,917,870
3,075,302 $52,741,431
Project Year
TOTAL
Total Annual Travel Time
Saved 3
Total Value of Travel Time
Saved 4Affected Annual
Travelers 1
Minutes Reduced per
Trip 2Calendar
Year
Barnum Landing Ferry Improvement Project TIGER Grant Application Project Narrative
B-4
Table 3 Travel Time Savings - Shorter Ferry Crossing
[hr] [$]2014 1 430,636 5.00 35,886 $615,451 1 Average annual passengers embarking in Bridgeport and Port Jefferson, 2007 - 20112015 2 861,272 5.00 71,773 $1,230,901 Figures for 2011 are projected based on actual data through August.2016 3 861,272 5.00 71,773 $1,230,901 Includes an estimated 20,000 non-ticketed passengers per year (children under 12 who ride for free).2017 4 861,272 5.00 71,773 $1,230,901 For 2014 only half a year ridership is included due to new terminal opening in May 2014.2018 5 861,272 5.00 71,773 $1,230,901 2 Reduction in trip time for crossing from Bridgeport to Port Jefferson (and vice-versa).2019 6 861,272 5.00 71,773 $1,230,901 due to location of new terminal.2020 7 861,272 5.00 71,773 $1,230,901 3 Total Travel Time Saved = Affected Annual Travelers x Minutes Reduced per Trip ÷ 60 min/hr2021 8 861,272 5.00 71,773 $1,230,901 4 Total Value of Travel Time Saved = Total Travel Time Saved x $24.50 per hour * x 70% **2022 9 861,272 5.00 71,773 $1,230,9012023 10 861,272 5.00 71,773 $1,230,901 * Mean hourly w age for the State of Connecticut, as published by the US. Bureau of Labor Statistics
2024 11 861,272 5.00 71,773 $1,230,901 ** Per USDOT "Departmental Guidance for the Valuation of Travel Time in Economic Analysis"
2025 12 861,272 5.00 71,773 $1,230,9012026 13 861,272 5.00 71,773 $1,230,9012027 14 861,272 5.00 71,773 $1,230,9012028 15 861,272 5.00 71,773 $1,230,9012029 16 861,272 5.00 71,773 $1,230,9012030 17 861,272 5.00 71,773 $1,230,9012031 18 861,272 5.00 71,773 $1,230,9012032 19 861,272 5.00 71,773 $1,230,9012033 20 861,272 5.00 71,773 $1,230,9012034 21 861,272 5.00 71,773 $1,230,9012035 22 861,272 5.00 71,773 $1,230,9012036 23 861,272 5.00 71,773 $1,230,9012037 24 861,272 5.00 71,773 $1,230,9012038 25 861,272 5.00 71,773 $1,230,9012039 26 861,272 5.00 71,773 $1,230,9012040 27 861,272 5.00 71,773 $1,230,9012041 28 861,272 5.00 71,773 $1,230,901
1,973,748 $33,849,784
Total Value of Travel Time
Saved 4
TOTAL
Calendar Year
Project Year
Affected Annual
Travelers 1
Minutes Reduced per
Trip 2
Total Annual Travel Time
Saved 3
Barnum Landing Ferry Improvement Project TIGER Grant Application Project Narrative
B-5
Table 4 Travel Time Savings - New Ferry Riders
[hr] [$]2014 1 9,124 45.00 6,843 $117,356 1 Assumed growth in annual car volume based on relief of existing constraints at Bridgeport terminal*2015 2 36,496 45.00 27,372 $469,425 multiplied by 1.6 average passengers/car (2007 - 2011 average)2016 3 54,743 45.00 41,058 $704,138 Assumes growth to maximum potential increase over a 10 year period.2017 4 72,991 45.00 54,743 $938,850 2 Minutes Reduced per Trip = [Total Trip Time Car] - [Total Trip Time Ferry + Car]2018 5 91,239 45.00 68,429 $1,173,563 Assumed nominal trip is from Bridgeport, CT to Patchoge, Long Island, NY **2019 6 109,487 45.00 82,115 $1,408,275 Car trip via I-95: Free flow travel 126 minutes (Bridgeport, CT to Patchauge, NY, 100 miles)2020 7 127,735 45.00 95,801 $1,642,988 + typical delay 30 minutes (CT-NYC congestion on I-95)2021 8 145,983 45.00 109,487 $1,877,700 = 156 minutes2022 9 164,230 45.00 123,173 $2,112,413 Ferry + Car Trip: Ferry crossing 70 minutes (Bridgeport to Port Jefferson)2023 10 182,478 45.00 136,859 $2,347,125 + Ferry disembarking 15 minutes2024 11 182,478 45.00 136,859 $2,347,125 + Car Travel 26 minutes (Port Jefferson, NY to Patchauge, NY, 14 mi)2025 12 182,478 45.00 136,859 $2,347,125 = 1112026 13 182,478 45.00 136,859 $2,347,125 3 Total Travel Time Saved = Affected Annual Travelers x Minutes Reduced per Trip ÷ 60 min/hr2027 14 182,478 45.00 136,859 $2,347,125 4 Total Value of Travel Time Saved = Total Travel Time Saved x $24.50 per hour *** x 70% ****2028 15 182,478 45.00 136,859 $2,347,1252029 16 182,478 45.00 136,859 $2,347,125 * Tritec Marine Consultants Limited, Bridgeport & Port Jefferson Steamboat Company - Study
2030 17 182,478 45.00 136,859 $2,347,125 and Recommendations for an Improved Ferry Service , 19 March 2003
2031 18 182,478 45.00 136,859 $2,347,125 ** Based on suveys of current passengers, typical starting/ending destinations on Long Island lie betw een
2032 19 182,478 45.00 136,859 $2,347,125 Huntington (w est) and River Head (east).
2033 20 182,478 45.00 136,859 $2,347,125 *** Mean hourly w age for the State of Connecticut, as published by the US. Bureau of Labor Statistics
2034 21 182,478 45.00 136,859 $2,347,125 **** Per USDOT "Departmental Guidance for the Valuation of Travel Time in Economic Analysis"
2035 22 182,478 45.00 136,859 $2,347,1252036 23 182,478 45.00 136,859 $2,347,1252037 24 182,478 45.00 136,859 $2,347,1252038 25 182,478 45.00 136,859 $2,347,1252039 26 182,478 45.00 136,859 $2,347,1252040 27 182,478 45.00 136,859 $2,347,1252041 28 182,478 45.00 136,859 $2,347,125
3,209,335 $55,040,088TOTAL
Calendar Year
Project Year
Affected Annual
Travelers 1
Minutes Reduced per
Trip 2
Total Annual Travel Time
Saved 3
Total Value of Travel Time
Saved 4
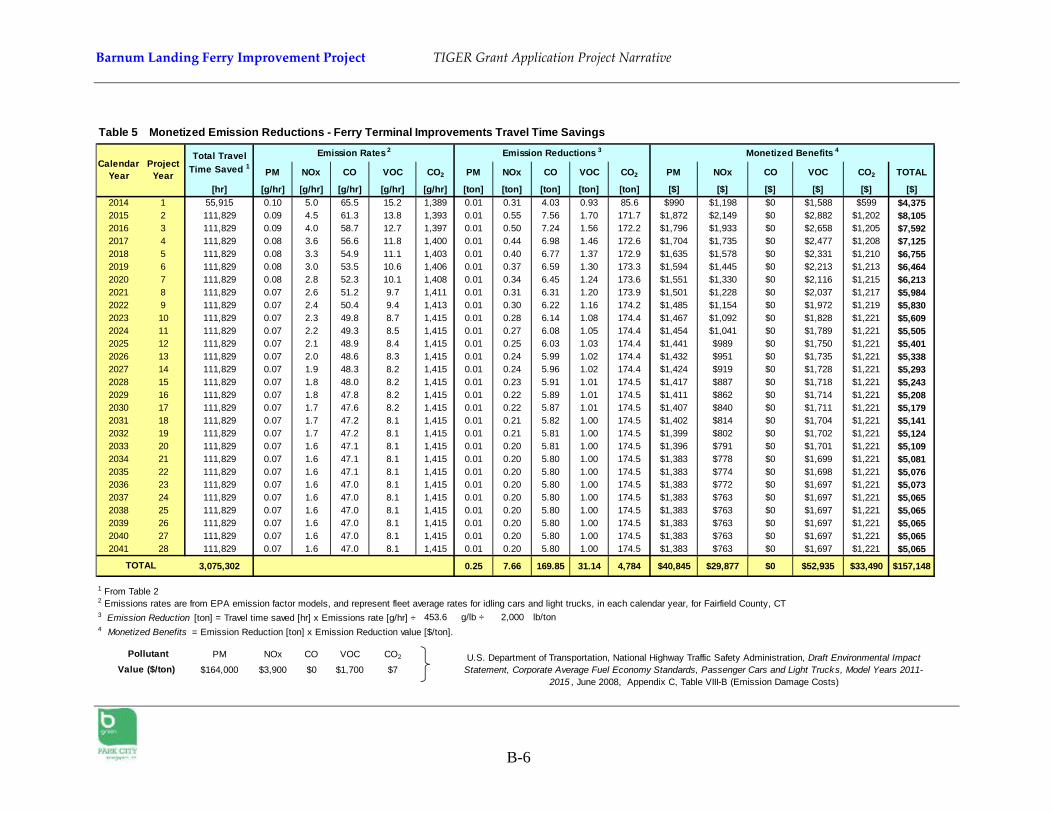
Barnum Landing Ferry Improvement Project TIGER Grant Application Project Narrative
B-6
Table 5 Monetized Emission Reductions - Ferry Terminal Improvements Travel Time Savings
PM NOx CO VOC CO2 PM NOx CO VOC CO2 PM NOx CO VOC CO2 TOTAL
[hr] [g/hr] [g/hr] [g/hr] [g/hr] [g/hr] [ton] [ton] [ton] [ton] [ton] [$] [$] [$] [$] [$] [$]2014 1 55,915 0.10 5.0 65.5 15.2 1,389 0.01 0.31 4.03 0.93 85.6 $990 $1,198 $0 $1,588 $599 $4,3752015 2 111,829 0.09 4.5 61.3 13.8 1,393 0.01 0.55 7.56 1.70 171.7 $1,872 $2,149 $0 $2,882 $1,202 $8,1052016 3 111,829 0.09 4.0 58.7 12.7 1,397 0.01 0.50 7.24 1.56 172.2 $1,796 $1,933 $0 $2,658 $1,205 $7,5922017 4 111,829 0.08 3.6 56.6 11.8 1,400 0.01 0.44 6.98 1.46 172.6 $1,704 $1,735 $0 $2,477 $1,208 $7,1252018 5 111,829 0.08 3.3 54.9 11.1 1,403 0.01 0.40 6.77 1.37 172.9 $1,635 $1,578 $0 $2,331 $1,210 $6,7552019 6 111,829 0.08 3.0 53.5 10.6 1,406 0.01 0.37 6.59 1.30 173.3 $1,594 $1,445 $0 $2,213 $1,213 $6,4642020 7 111,829 0.08 2.8 52.3 10.1 1,408 0.01 0.34 6.45 1.24 173.6 $1,551 $1,330 $0 $2,116 $1,215 $6,2132021 8 111,829 0.07 2.6 51.2 9.7 1,411 0.01 0.31 6.31 1.20 173.9 $1,501 $1,228 $0 $2,037 $1,217 $5,9842022 9 111,829 0.07 2.4 50.4 9.4 1,413 0.01 0.30 6.22 1.16 174.2 $1,485 $1,154 $0 $1,972 $1,219 $5,8302023 10 111,829 0.07 2.3 49.8 8.7 1,415 0.01 0.28 6.14 1.08 174.4 $1,467 $1,092 $0 $1,828 $1,221 $5,6092024 11 111,829 0.07 2.2 49.3 8.5 1,415 0.01 0.27 6.08 1.05 174.4 $1,454 $1,041 $0 $1,789 $1,221 $5,5052025 12 111,829 0.07 2.1 48.9 8.4 1,415 0.01 0.25 6.03 1.03 174.4 $1,441 $989 $0 $1,750 $1,221 $5,4012026 13 111,829 0.07 2.0 48.6 8.3 1,415 0.01 0.24 5.99 1.02 174.4 $1,432 $951 $0 $1,735 $1,221 $5,3382027 14 111,829 0.07 1.9 48.3 8.2 1,415 0.01 0.24 5.96 1.02 174.4 $1,424 $919 $0 $1,728 $1,221 $5,2932028 15 111,829 0.07 1.8 48.0 8.2 1,415 0.01 0.23 5.91 1.01 174.5 $1,417 $887 $0 $1,718 $1,221 $5,2432029 16 111,829 0.07 1.8 47.8 8.2 1,415 0.01 0.22 5.89 1.01 174.5 $1,411 $862 $0 $1,714 $1,221 $5,2082030 17 111,829 0.07 1.7 47.6 8.2 1,415 0.01 0.22 5.87 1.01 174.5 $1,407 $840 $0 $1,711 $1,221 $5,1792031 18 111,829 0.07 1.7 47.2 8.1 1,415 0.01 0.21 5.82 1.00 174.5 $1,402 $814 $0 $1,704 $1,221 $5,1412032 19 111,829 0.07 1.7 47.2 8.1 1,415 0.01 0.21 5.81 1.00 174.5 $1,399 $802 $0 $1,702 $1,221 $5,1242033 20 111,829 0.07 1.6 47.1 8.1 1,415 0.01 0.20 5.81 1.00 174.5 $1,396 $791 $0 $1,701 $1,221 $5,1092034 21 111,829 0.07 1.6 47.1 8.1 1,415 0.01 0.20 5.80 1.00 174.5 $1,383 $778 $0 $1,699 $1,221 $5,0812035 22 111,829 0.07 1.6 47.1 8.1 1,415 0.01 0.20 5.80 1.00 174.5 $1,383 $774 $0 $1,698 $1,221 $5,0762036 23 111,829 0.07 1.6 47.0 8.1 1,415 0.01 0.20 5.80 1.00 174.5 $1,383 $772 $0 $1,697 $1,221 $5,0732037 24 111,829 0.07 1.6 47.0 8.1 1,415 0.01 0.20 5.80 1.00 174.5 $1,383 $763 $0 $1,697 $1,221 $5,0652038 25 111,829 0.07 1.6 47.0 8.1 1,415 0.01 0.20 5.80 1.00 174.5 $1,383 $763 $0 $1,697 $1,221 $5,0652039 26 111,829 0.07 1.6 47.0 8.1 1,415 0.01 0.20 5.80 1.00 174.5 $1,383 $763 $0 $1,697 $1,221 $5,0652040 27 111,829 0.07 1.6 47.0 8.1 1,415 0.01 0.20 5.80 1.00 174.5 $1,383 $763 $0 $1,697 $1,221 $5,0652041 28 111,829 0.07 1.6 47.0 8.1 1,415 0.01 0.20 5.80 1.00 174.5 $1,383 $763 $0 $1,697 $1,221 $5,065
3,075,302 0.25 7.66 169.85 31.14 4,784 $40,845 $29,877 $0 $52,935 $33,490 $157,148
1 From Table 22 Emissions rates are from EPA emission factor models, and represent fleet average rates for idling cars and light trucks, in each calendar year, for Fairfield County, CT3 Emission Reduction [ton] = Travel time saved [hr] x Emissions rate [g/hr] ÷ 453.6 g/lb ÷ 2,000 lb/ton4 Monetized Benefits = Emission Reduction [ton] x Emission Reduction value [$/ton].
PM NOx CO VOC CO2
$164,000 $3,900 $0 $1,700 $7
TOTAL
Pollutant Value ($/ton)
U.S. Department of Transportation, National Highway Traffic Safety Administration, Draft Environmental Impact Statement, Corporate Average Fuel Economy Standards, Passenger Cars and Light Trucks, Model Years 2011-
2015 , June 2008, Appendix C, Table VIII-B (Emission Damage Costs)
Monetized Benefits 4Total Travel Time Saved 1
Emission Rates 2
Calendar Year
Project Year
Emission Reductions 3
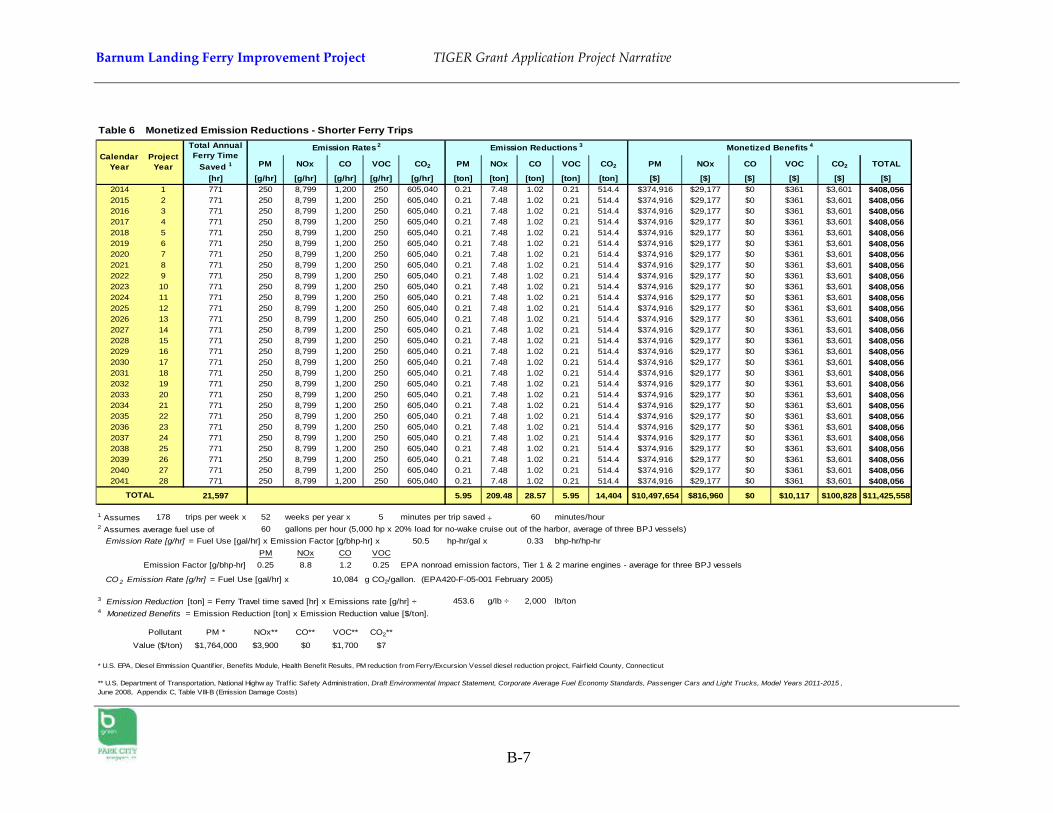
Barnum Landing Ferry Improvement Project TIGER Grant Application Project Narrative
B-7
Table 6 Monetized Emission Reductions - Shorter Ferry Trips
PM NOx CO VOC CO2 PM NOx CO VOC CO2 PM NOx CO VOC CO2 TOTAL
[hr] [g/hr] [g/hr] [g/hr] [g/hr] [g/hr] [ton] [ton] [ton] [ton] [ton] [$] [$] [$] [$] [$] [$]2014 1 771 250 8,799 1,200 250 605,040 0.21 7.48 1.02 0.21 514.4 $374,916 $29,177 $0 $361 $3,601 $408,0562015 2 771 250 8,799 1,200 250 605,040 0.21 7.48 1.02 0.21 514.4 $374,916 $29,177 $0 $361 $3,601 $408,0562016 3 771 250 8,799 1,200 250 605,040 0.21 7.48 1.02 0.21 514.4 $374,916 $29,177 $0 $361 $3,601 $408,0562017 4 771 250 8,799 1,200 250 605,040 0.21 7.48 1.02 0.21 514.4 $374,916 $29,177 $0 $361 $3,601 $408,0562018 5 771 250 8,799 1,200 250 605,040 0.21 7.48 1.02 0.21 514.4 $374,916 $29,177 $0 $361 $3,601 $408,0562019 6 771 250 8,799 1,200 250 605,040 0.21 7.48 1.02 0.21 514.4 $374,916 $29,177 $0 $361 $3,601 $408,0562020 7 771 250 8,799 1,200 250 605,040 0.21 7.48 1.02 0.21 514.4 $374,916 $29,177 $0 $361 $3,601 $408,0562021 8 771 250 8,799 1,200 250 605,040 0.21 7.48 1.02 0.21 514.4 $374,916 $29,177 $0 $361 $3,601 $408,0562022 9 771 250 8,799 1,200 250 605,040 0.21 7.48 1.02 0.21 514.4 $374,916 $29,177 $0 $361 $3,601 $408,0562023 10 771 250 8,799 1,200 250 605,040 0.21 7.48 1.02 0.21 514.4 $374,916 $29,177 $0 $361 $3,601 $408,0562024 11 771 250 8,799 1,200 250 605,040 0.21 7.48 1.02 0.21 514.4 $374,916 $29,177 $0 $361 $3,601 $408,0562025 12 771 250 8,799 1,200 250 605,040 0.21 7.48 1.02 0.21 514.4 $374,916 $29,177 $0 $361 $3,601 $408,0562026 13 771 250 8,799 1,200 250 605,040 0.21 7.48 1.02 0.21 514.4 $374,916 $29,177 $0 $361 $3,601 $408,0562027 14 771 250 8,799 1,200 250 605,040 0.21 7.48 1.02 0.21 514.4 $374,916 $29,177 $0 $361 $3,601 $408,0562028 15 771 250 8,799 1,200 250 605,040 0.21 7.48 1.02 0.21 514.4 $374,916 $29,177 $0 $361 $3,601 $408,0562029 16 771 250 8,799 1,200 250 605,040 0.21 7.48 1.02 0.21 514.4 $374,916 $29,177 $0 $361 $3,601 $408,0562030 17 771 250 8,799 1,200 250 605,040 0.21 7.48 1.02 0.21 514.4 $374,916 $29,177 $0 $361 $3,601 $408,0562031 18 771 250 8,799 1,200 250 605,040 0.21 7.48 1.02 0.21 514.4 $374,916 $29,177 $0 $361 $3,601 $408,0562032 19 771 250 8,799 1,200 250 605,040 0.21 7.48 1.02 0.21 514.4 $374,916 $29,177 $0 $361 $3,601 $408,0562033 20 771 250 8,799 1,200 250 605,040 0.21 7.48 1.02 0.21 514.4 $374,916 $29,177 $0 $361 $3,601 $408,0562034 21 771 250 8,799 1,200 250 605,040 0.21 7.48 1.02 0.21 514.4 $374,916 $29,177 $0 $361 $3,601 $408,0562035 22 771 250 8,799 1,200 250 605,040 0.21 7.48 1.02 0.21 514.4 $374,916 $29,177 $0 $361 $3,601 $408,0562036 23 771 250 8,799 1,200 250 605,040 0.21 7.48 1.02 0.21 514.4 $374,916 $29,177 $0 $361 $3,601 $408,0562037 24 771 250 8,799 1,200 250 605,040 0.21 7.48 1.02 0.21 514.4 $374,916 $29,177 $0 $361 $3,601 $408,0562038 25 771 250 8,799 1,200 250 605,040 0.21 7.48 1.02 0.21 514.4 $374,916 $29,177 $0 $361 $3,601 $408,0562039 26 771 250 8,799 1,200 250 605,040 0.21 7.48 1.02 0.21 514.4 $374,916 $29,177 $0 $361 $3,601 $408,0562040 27 771 250 8,799 1,200 250 605,040 0.21 7.48 1.02 0.21 514.4 $374,916 $29,177 $0 $361 $3,601 $408,0562041 28 771 250 8,799 1,200 250 605,040 0.21 7.48 1.02 0.21 514.4 $374,916 $29,177 $0 $361 $3,601 $408,056
21,597 5.95 209.48 28.57 5.95 14,404 $10,497,654 $816,960 $0 $10,117 $100,828 $11,425,558
1 Assumes 178 trips per week x 52 weeks per year x 5 minutes per trip saved ÷ 60 minutes/hour2 Assumes average fuel use of 60 gallons per hour (5,000 hp x 20% load for no-wake cruise out of the harbor, average of three BPJ vessels) Emission Rate [g/hr] = Fuel Use [gal/hr] x Emission Factor [g/bhp-hr] x 50.5 hp-hr/gal x 0.33 bhp-hr/hp-hr
PM NOx CO VOCEmission Factor [g/bhp-hr] 0.25 8.8 1.2 0.25 EPA nonroad emission factors, Tier 1 & 2 marine engines - average for three BPJ vessels
CO 2 Emission Rate [g/hr] = Fuel Use [gal/hr] x 10,084 g CO2/gallon. (EPA420-F-05-001 February 2005)
3 Emission Reduction [ton] = Ferry Travel time saved [hr] x Emissions rate [g/hr] ÷ 453.6 g/lb ÷ 2,000 lb/ton4 Monetized Benefits = Emission Reduction [ton] x Emission Reduction value [$/ton].
Pollutant PM * NOx** CO** VOC** CO2**
Value ($/ton) $1,764,000 $3,900 $0 $1,700 $7
* U.S. EPA, Diesel Emmission Quantif ier, Benefits Module, Health Benefit Results, PM reduction from Ferry/Excursion Vessel diesel reduction project, Fairf ield County, Connecticut
** U.S. Department of Transportation, National Highw ay Traffic Safety Administration, Draft Environmental Impact Statement, Corporate Average Fuel Economy Standards, Passenger Cars and Light Trucks, Model Years 2011-2015 , June 2008, Appendix C, Table VIII-B (Emission Damage Costs)
TOTAL
Calendar Year
Project Year
Total Annual Ferry Time
Saved 1
Emission Rates 2 Emission Reductions 3 Monetized Benefits 4
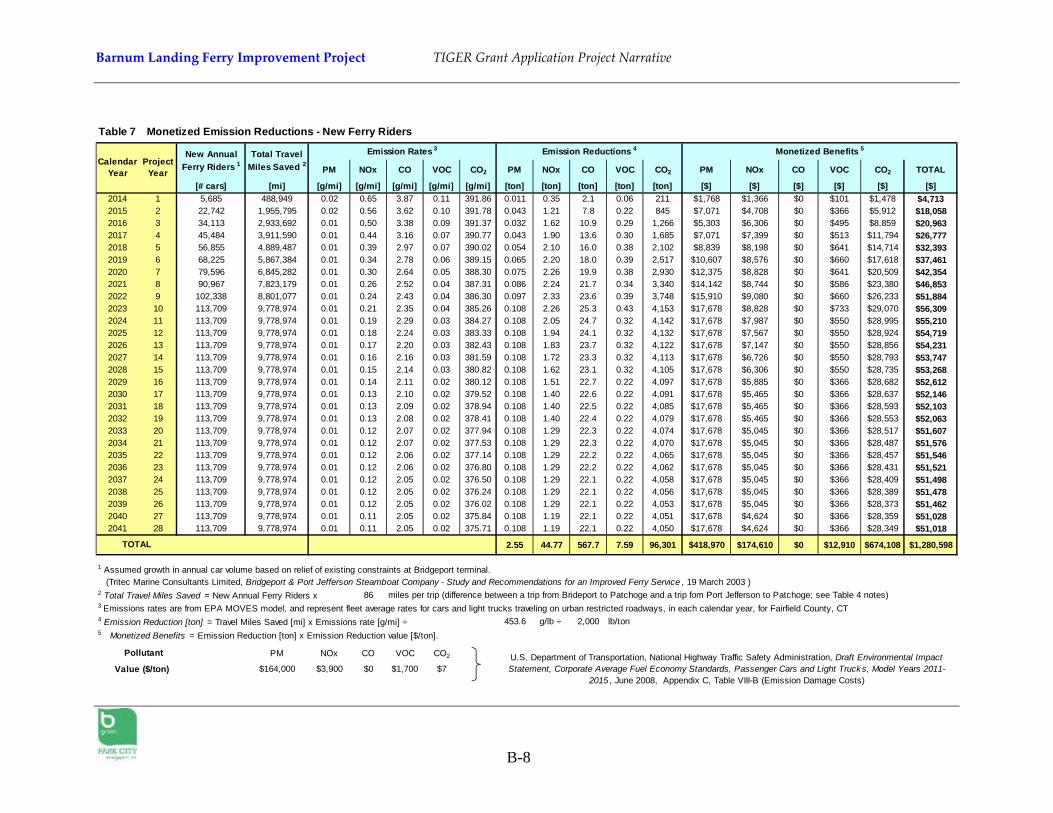
Barnum Landing Ferry Improvement Project TIGER Grant Application Project Narrative
B-8
Table 7 Monetized Emission Reductions - New Ferry Riders
PM NOx CO VOC CO2 PM NOx CO VOC CO2 PM NOx CO VOC CO2 TOTAL
[# cars] [mi] [g/mi] [g/mi] [g/mi] [g/mi] [g/mi] [ton] [ton] [ton] [ton] [ton] [$] [$] [$] [$] [$] [$]2014 1 5,685 488,949 0.02 0.65 3.87 0.11 391.86 0.011 0.35 2.1 0.06 211 $1,768 $1,366 $0 $101 $1,478 $4,7132015 2 22,742 1,955,795 0.02 0.56 3.62 0.10 391.78 0.043 1.21 7.8 0.22 845 $7,071 $4,708 $0 $366 $5,912 $18,0582016 3 34,113 2,933,692 0.01 0.50 3.38 0.09 391.37 0.032 1.62 10.9 0.29 1,266 $5,303 $6,306 $0 $495 $8,859 $20,9632017 4 45,484 3,911,590 0.01 0.44 3.16 0.07 390.77 0.043 1.90 13.6 0.30 1,685 $7,071 $7,399 $0 $513 $11,794 $26,7772018 5 56,855 4,889,487 0.01 0.39 2.97 0.07 390.02 0.054 2.10 16.0 0.38 2,102 $8,839 $8,198 $0 $641 $14,714 $32,3932019 6 68,225 5,867,384 0.01 0.34 2.78 0.06 389.15 0.065 2.20 18.0 0.39 2,517 $10,607 $8,576 $0 $660 $17,618 $37,4612020 7 79,596 6,845,282 0.01 0.30 2.64 0.05 388.30 0.075 2.26 19.9 0.38 2,930 $12,375 $8,828 $0 $641 $20,509 $42,3542021 8 90,967 7,823,179 0.01 0.26 2.52 0.04 387.31 0.086 2.24 21.7 0.34 3,340 $14,142 $8,744 $0 $586 $23,380 $46,8532022 9 102,338 8,801,077 0.01 0.24 2.43 0.04 386.30 0.097 2.33 23.6 0.39 3,748 $15,910 $9,080 $0 $660 $26,233 $51,8842023 10 113,709 9,778,974 0.01 0.21 2.35 0.04 385.26 0.108 2.26 25.3 0.43 4,153 $17,678 $8,828 $0 $733 $29,070 $56,3092024 11 113,709 9,778,974 0.01 0.19 2.29 0.03 384.27 0.108 2.05 24.7 0.32 4,142 $17,678 $7,987 $0 $550 $28,995 $55,2102025 12 113,709 9,778,974 0.01 0.18 2.24 0.03 383.33 0.108 1.94 24.1 0.32 4,132 $17,678 $7,567 $0 $550 $28,924 $54,7192026 13 113,709 9,778,974 0.01 0.17 2.20 0.03 382.43 0.108 1.83 23.7 0.32 4,122 $17,678 $7,147 $0 $550 $28,856 $54,2312027 14 113,709 9,778,974 0.01 0.16 2.16 0.03 381.59 0.108 1.72 23.3 0.32 4,113 $17,678 $6,726 $0 $550 $28,793 $53,7472028 15 113,709 9,778,974 0.01 0.15 2.14 0.03 380.82 0.108 1.62 23.1 0.32 4,105 $17,678 $6,306 $0 $550 $28,735 $53,2682029 16 113,709 9,778,974 0.01 0.14 2.11 0.02 380.12 0.108 1.51 22.7 0.22 4,097 $17,678 $5,885 $0 $366 $28,682 $52,6122030 17 113,709 9,778,974 0.01 0.13 2.10 0.02 379.52 0.108 1.40 22.6 0.22 4,091 $17,678 $5,465 $0 $366 $28,637 $52,1462031 18 113,709 9,778,974 0.01 0.13 2.09 0.02 378.94 0.108 1.40 22.5 0.22 4,085 $17,678 $5,465 $0 $366 $28,593 $52,1032032 19 113,709 9,778,974 0.01 0.13 2.08 0.02 378.41 0.108 1.40 22.4 0.22 4,079 $17,678 $5,465 $0 $366 $28,553 $52,0632033 20 113,709 9,778,974 0.01 0.12 2.07 0.02 377.94 0.108 1.29 22.3 0.22 4,074 $17,678 $5,045 $0 $366 $28,517 $51,6072034 21 113,709 9,778,974 0.01 0.12 2.07 0.02 377.53 0.108 1.29 22.3 0.22 4,070 $17,678 $5,045 $0 $366 $28,487 $51,5762035 22 113,709 9,778,974 0.01 0.12 2.06 0.02 377.14 0.108 1.29 22.2 0.22 4,065 $17,678 $5,045 $0 $366 $28,457 $51,5462036 23 113,709 9,778,974 0.01 0.12 2.06 0.02 376.80 0.108 1.29 22.2 0.22 4,062 $17,678 $5,045 $0 $366 $28,431 $51,5212037 24 113,709 9,778,974 0.01 0.12 2.05 0.02 376.50 0.108 1.29 22.1 0.22 4,058 $17,678 $5,045 $0 $366 $28,409 $51,4982038 25 113,709 9,778,974 0.01 0.12 2.05 0.02 376.24 0.108 1.29 22.1 0.22 4,056 $17,678 $5,045 $0 $366 $28,389 $51,4782039 26 113,709 9,778,974 0.01 0.12 2.05 0.02 376.02 0.108 1.29 22.1 0.22 4,053 $17,678 $5,045 $0 $366 $28,373 $51,4622040 27 113,709 9,778,974 0.01 0.11 2.05 0.02 375.84 0.108 1.19 22.1 0.22 4,051 $17,678 $4,624 $0 $366 $28,359 $51,0282041 28 113,709 9,778,974 0.01 0.11 2.05 0.02 375.71 0.108 1.19 22.1 0.22 4,050 $17,678 $4,624 $0 $366 $28,349 $51,018
2.55 44.77 567.7 7.59 96,301 $418,970 $174,610 $0 $12,910 $674,108 $1,280,598
1 Assumed growth in annual car volume based on relief of existing constraints at Bridgeport terminal. (Tritec Marine Consultants Limited, Bridgeport & Port Jefferson Steamboat Company - Study and Recommendations for an Improved Ferry Service , 19 March 2003 )2 Total Travel Miles Saved = New Annual Ferry Riders x 86 miles per trip (difference between a trip from Brideport to Patchoge and a trip fom Port Jefferson to Patchoge; see Table 4 notes)3 Emissions rates are from EPA MOVES model, and represent fleet average rates for cars and light trucks traveling on urban restricted roadways, in each calendar year, for Fairfield County, CT4 Emission Reduction [ton] = Travel Miles Saved [mi] x Emissions rate [g/mi] ÷ 453.6 g/lb ÷ 2,000 lb/ton5 Monetized Benefits = Emission Reduction [ton] x Emission Reduction value [$/ton].
PM NOx CO VOC CO2
$164,000 $3,900 $0 $1,700 $7
TOTAL
Pollutant
Value ($/ton)U.S. Department of Transportation, National Highway Traffic Safety Administration, Draft Environmental Impact Statement, Corporate Average Fuel Economy Standards, Passenger Cars and Light Trucks, Model Years 2011-
2015 , June 2008, Appendix C, Table VIII-B (Emission Damage Costs)
Monetized Benefits 5Total Travel Miles Saved 2
Emission Rates 3
Calendar Year
Project Year
Emission Reductions 4New Annual Ferry Riders 1
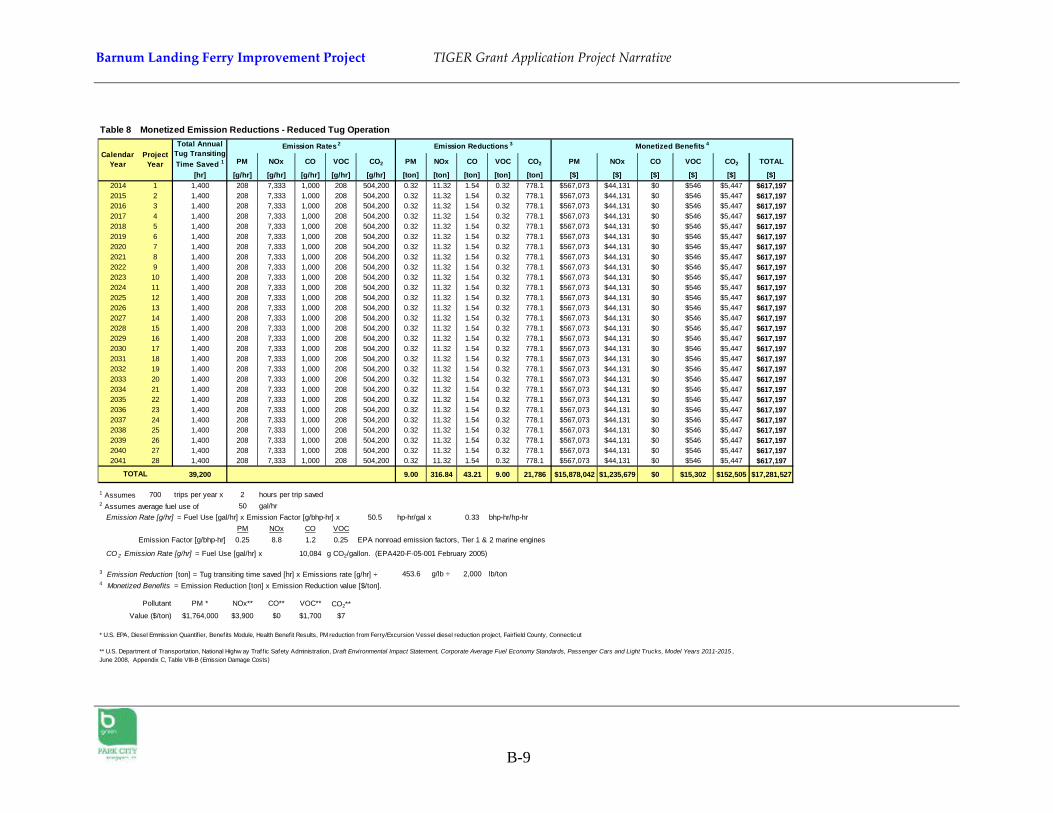
Barnum Landing Ferry Improvement Project TIGER Grant Application Project Narrative
B-9
Table 8 Monetized Emission Reductions - Reduced Tug Operation
PM NOx CO VOC CO2 PM NOx CO VOC CO2 PM NOx CO VOC CO2 TOTAL
[hr] [g/hr] [g/hr] [g/hr] [g/hr] [g/hr] [ton] [ton] [ton] [ton] [ton] [$] [$] [$] [$] [$] [$]2014 1 1,400 208 7,333 1,000 208 504,200 0.32 11.32 1.54 0.32 778.1 $567,073 $44,131 $0 $546 $5,447 $617,1972015 2 1,400 208 7,333 1,000 208 504,200 0.32 11.32 1.54 0.32 778.1 $567,073 $44,131 $0 $546 $5,447 $617,1972016 3 1,400 208 7,333 1,000 208 504,200 0.32 11.32 1.54 0.32 778.1 $567,073 $44,131 $0 $546 $5,447 $617,1972017 4 1,400 208 7,333 1,000 208 504,200 0.32 11.32 1.54 0.32 778.1 $567,073 $44,131 $0 $546 $5,447 $617,1972018 5 1,400 208 7,333 1,000 208 504,200 0.32 11.32 1.54 0.32 778.1 $567,073 $44,131 $0 $546 $5,447 $617,1972019 6 1,400 208 7,333 1,000 208 504,200 0.32 11.32 1.54 0.32 778.1 $567,073 $44,131 $0 $546 $5,447 $617,1972020 7 1,400 208 7,333 1,000 208 504,200 0.32 11.32 1.54 0.32 778.1 $567,073 $44,131 $0 $546 $5,447 $617,1972021 8 1,400 208 7,333 1,000 208 504,200 0.32 11.32 1.54 0.32 778.1 $567,073 $44,131 $0 $546 $5,447 $617,1972022 9 1,400 208 7,333 1,000 208 504,200 0.32 11.32 1.54 0.32 778.1 $567,073 $44,131 $0 $546 $5,447 $617,1972023 10 1,400 208 7,333 1,000 208 504,200 0.32 11.32 1.54 0.32 778.1 $567,073 $44,131 $0 $546 $5,447 $617,1972024 11 1,400 208 7,333 1,000 208 504,200 0.32 11.32 1.54 0.32 778.1 $567,073 $44,131 $0 $546 $5,447 $617,1972025 12 1,400 208 7,333 1,000 208 504,200 0.32 11.32 1.54 0.32 778.1 $567,073 $44,131 $0 $546 $5,447 $617,1972026 13 1,400 208 7,333 1,000 208 504,200 0.32 11.32 1.54 0.32 778.1 $567,073 $44,131 $0 $546 $5,447 $617,1972027 14 1,400 208 7,333 1,000 208 504,200 0.32 11.32 1.54 0.32 778.1 $567,073 $44,131 $0 $546 $5,447 $617,1972028 15 1,400 208 7,333 1,000 208 504,200 0.32 11.32 1.54 0.32 778.1 $567,073 $44,131 $0 $546 $5,447 $617,1972029 16 1,400 208 7,333 1,000 208 504,200 0.32 11.32 1.54 0.32 778.1 $567,073 $44,131 $0 $546 $5,447 $617,1972030 17 1,400 208 7,333 1,000 208 504,200 0.32 11.32 1.54 0.32 778.1 $567,073 $44,131 $0 $546 $5,447 $617,1972031 18 1,400 208 7,333 1,000 208 504,200 0.32 11.32 1.54 0.32 778.1 $567,073 $44,131 $0 $546 $5,447 $617,1972032 19 1,400 208 7,333 1,000 208 504,200 0.32 11.32 1.54 0.32 778.1 $567,073 $44,131 $0 $546 $5,447 $617,1972033 20 1,400 208 7,333 1,000 208 504,200 0.32 11.32 1.54 0.32 778.1 $567,073 $44,131 $0 $546 $5,447 $617,1972034 21 1,400 208 7,333 1,000 208 504,200 0.32 11.32 1.54 0.32 778.1 $567,073 $44,131 $0 $546 $5,447 $617,1972035 22 1,400 208 7,333 1,000 208 504,200 0.32 11.32 1.54 0.32 778.1 $567,073 $44,131 $0 $546 $5,447 $617,1972036 23 1,400 208 7,333 1,000 208 504,200 0.32 11.32 1.54 0.32 778.1 $567,073 $44,131 $0 $546 $5,447 $617,1972037 24 1,400 208 7,333 1,000 208 504,200 0.32 11.32 1.54 0.32 778.1 $567,073 $44,131 $0 $546 $5,447 $617,1972038 25 1,400 208 7,333 1,000 208 504,200 0.32 11.32 1.54 0.32 778.1 $567,073 $44,131 $0 $546 $5,447 $617,1972039 26 1,400 208 7,333 1,000 208 504,200 0.32 11.32 1.54 0.32 778.1 $567,073 $44,131 $0 $546 $5,447 $617,1972040 27 1,400 208 7,333 1,000 208 504,200 0.32 11.32 1.54 0.32 778.1 $567,073 $44,131 $0 $546 $5,447 $617,1972041 28 1,400 208 7,333 1,000 208 504,200 0.32 11.32 1.54 0.32 778.1 $567,073 $44,131 $0 $546 $5,447 $617,197
39,200 9.00 316.84 43.21 9.00 21,786 $15,878,042 $1,235,679 $0 $15,302 $152,505 $17,281,527
1 Assumes 700 trips per year x 2 hours per trip saved2 Assumes average fuel use of 50 gal/hr Emission Rate [g/hr] = Fuel Use [gal/hr] x Emission Factor [g/bhp-hr] x 50.5 hp-hr/gal x 0.33 bhp-hr/hp-hr
PM NOx CO VOCEmission Factor [g/bhp-hr] 0.25 8.8 1.2 0.25 EPA nonroad emission factors, Tier 1 & 2 marine engines
CO 2 Emission Rate [g/hr] = Fuel Use [gal/hr] x 10,084 g CO2/gallon. (EPA420-F-05-001 February 2005)
3 Emission Reduction [ton] = Tug transiting time saved [hr] x Emissions rate [g/hr] ÷ 453.6 g/lb ÷ 2,000 lb/ton4 Monetized Benefits = Emission Reduction [ton] x Emission Reduction value [$/ton].
Pollutant PM * NOx** CO** VOC** CO2** Value ($/ton) $1,764,000 $3,900 $0 $1,700 $7
* U.S. EPA, Diesel Emmission Quantif ier, Benefits Module, Health Benefit Results, PM reduction from Ferry/Excursion Vessel diesel reduction project, Fairf ield County, Connecticut
TOTAL
** U.S. Department of Transportation, National Highw ay Traffic Safety Administration, Draft Environmental Impact Statement, Corporate Average Fuel Economy Standards, Passenger Cars and Light Trucks, Model Years 2011-2015 , June 2008, Appendix C, Table VIII-B (Emission Damage Costs)
Calendar Year
Project Year
Total Annual Tug Transiting Time Saved 1
Emission Rates 2 Emission Reductions 3 Monetized Benefits 4
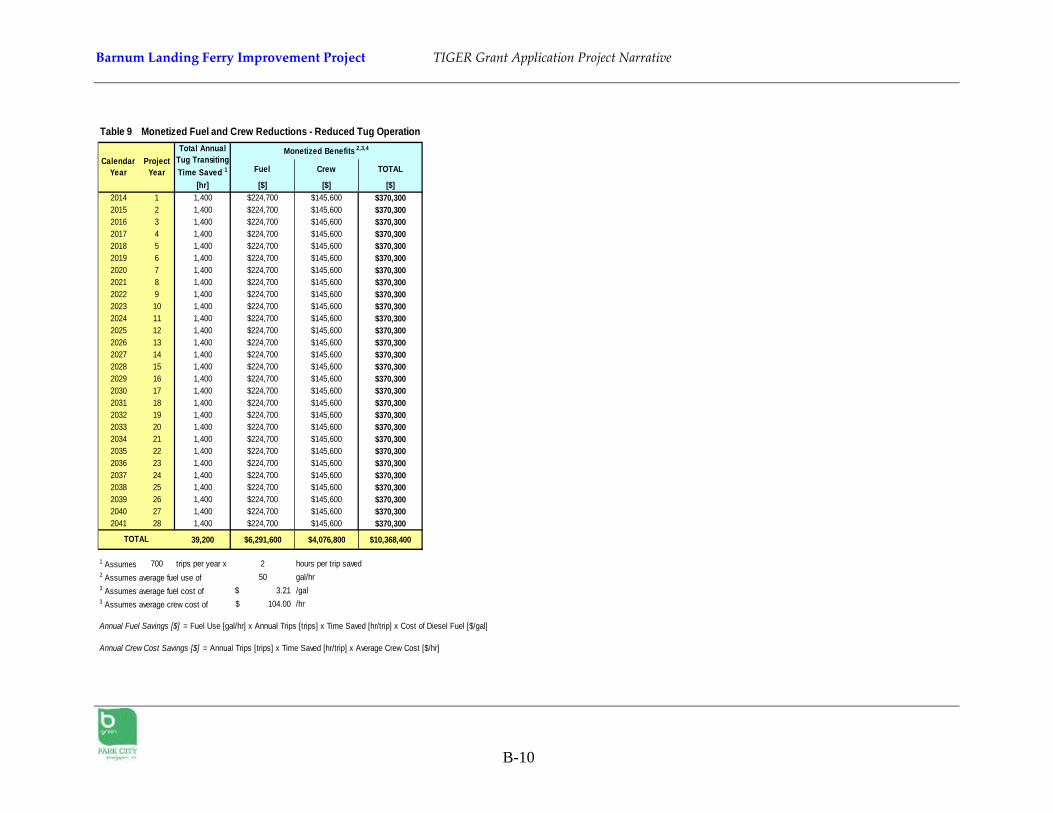
Barnum Landing Ferry Improvement Project TIGER Grant Application Project Narrative
B-10
Table 9 Monetized Fuel and Crew Reductions - Reduced Tug Operation
Fuel Crew TOTAL
[hr] [$] [$] [$]2014 1 1,400 $224,700 $145,600 $370,3002015 2 1,400 $224,700 $145,600 $370,3002016 3 1,400 $224,700 $145,600 $370,3002017 4 1,400 $224,700 $145,600 $370,3002018 5 1,400 $224,700 $145,600 $370,3002019 6 1,400 $224,700 $145,600 $370,3002020 7 1,400 $224,700 $145,600 $370,3002021 8 1,400 $224,700 $145,600 $370,3002022 9 1,400 $224,700 $145,600 $370,3002023 10 1,400 $224,700 $145,600 $370,3002024 11 1,400 $224,700 $145,600 $370,3002025 12 1,400 $224,700 $145,600 $370,3002026 13 1,400 $224,700 $145,600 $370,3002027 14 1,400 $224,700 $145,600 $370,3002028 15 1,400 $224,700 $145,600 $370,3002029 16 1,400 $224,700 $145,600 $370,3002030 17 1,400 $224,700 $145,600 $370,3002031 18 1,400 $224,700 $145,600 $370,3002032 19 1,400 $224,700 $145,600 $370,3002033 20 1,400 $224,700 $145,600 $370,3002034 21 1,400 $224,700 $145,600 $370,3002035 22 1,400 $224,700 $145,600 $370,3002036 23 1,400 $224,700 $145,600 $370,3002037 24 1,400 $224,700 $145,600 $370,3002038 25 1,400 $224,700 $145,600 $370,3002039 26 1,400 $224,700 $145,600 $370,3002040 27 1,400 $224,700 $145,600 $370,3002041 28 1,400 $224,700 $145,600 $370,300
39,200 $6,291,600 $4,076,800 $10,368,400
1 Assumes 700 trips per year x 2 hours per trip saved2 Assumes average fuel use of 50 gal/hr3 Assumes average fuel cost of 3.21$ /gal3 Assumes average crew cost of 104.00$ /hr
Annual Fuel Savings [$] = Fuel Use [gal/hr] x Annual Trips [trips] x Time Saved [hr/trip] x Cost of Diesel Fuel [$/gal]
Annual Crew Cost Savings [$] = Annual Trips [trips] x Time Saved [hr/trip] x Average Crew Cost [$/hr]
TOTAL
Monetized Benefits 2,3,4
Calendar Year
Project Year
Total Annual Tug Transiting Time Saved 1
Barnum Landing Ferry Improvement Project TIGER Grant Application Project Narrative
C-1
ATTACHMENT C Current Bridgeport Grants
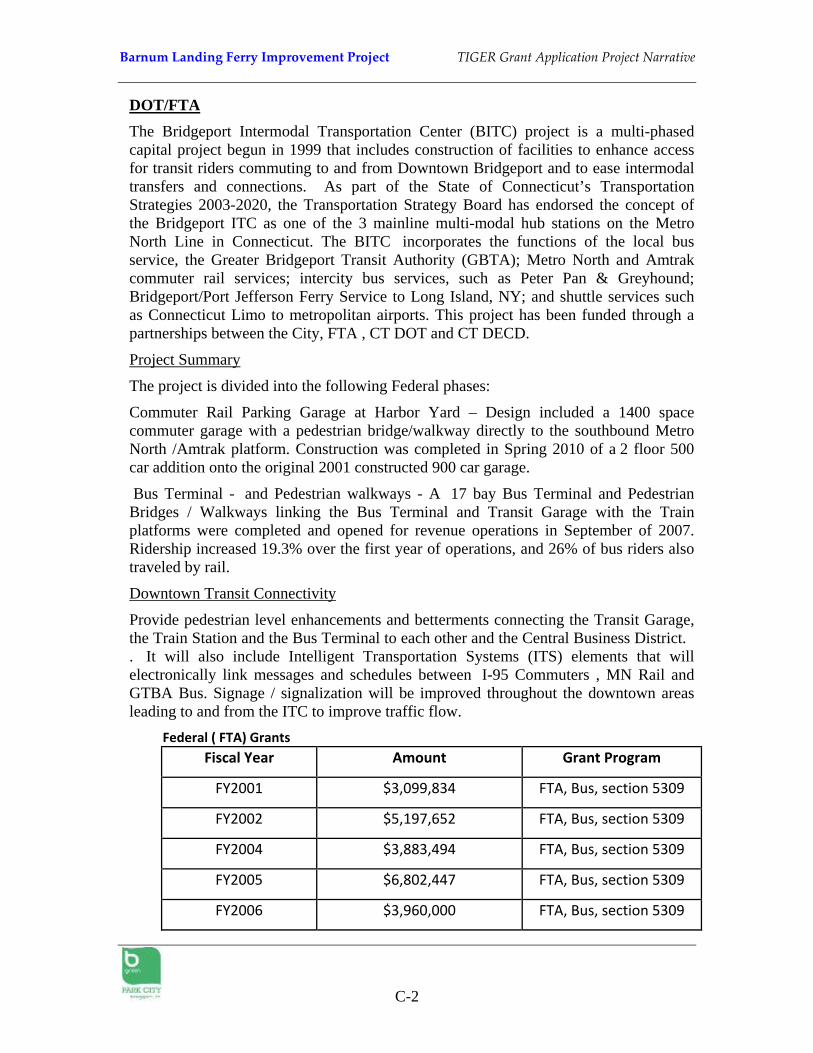
Barnum Landing Ferry Improvement Project TIGER Grant Application Project Narrative
C-2
DOT/FTA The Bridgeport Intermodal Transportation Center (BITC) project is a multi-phased capital project begun in 1999 that includes construction of facilities to enhance access for transit riders commuting to and from Downtown Bridgeport and to ease intermodal transfers and connections. As part of the State of Connecticut’s Transportation Strategies 2003-2020, the Transportation Strategy Board has endorsed the concept of the Bridgeport ITC as one of the 3 mainline multi-modal hub stations on the Metro North Line in Connecticut. The BITC incorporates the functions of the local bus service, the Greater Bridgeport Transit Authority (GBTA); Metro North and Amtrak commuter rail services; intercity bus services, such as Peter Pan & Greyhound; Bridgeport/Port Jefferson Ferry Service to Long Island, NY; and shuttle services such as Connecticut Limo to metropolitan airports. This project has been funded through a partnerships between the City, FTA , CT DOT and CT DECD.
Project Summary
The project is divided into the following Federal phases:
Commuter Rail Parking Garage at Harbor Yard – Design included a 1400 space commuter garage with a pedestrian bridge/walkway directly to the southbound Metro North /Amtrak platform. Construction was completed in Spring 2010 of a 2 floor 500 car addition onto the original 2001 constructed 900 car garage.
Bus Terminal - and Pedestrian walkways - A 17 bay Bus Terminal and Pedestrian Bridges / Walkways linking the Bus Terminal and Transit Garage with the Train platforms were completed and opened for revenue operations in September of 2007. Ridership increased 19.3% over the first year of operations, and 26% of bus riders also traveled by rail.
Downtown Transit Connectivity
Provide pedestrian level enhancements and betterments connecting the Transit Garage, the Train Station and the Bus Terminal to each other and the Central Business District. . It will also include Intelligent Transportation Systems (ITS) elements that will electronically link messages and schedules between I-95 Commuters , MN Rail and GTBA Bus. Signage / signalization will be improved throughout the downtown areas leading to and from the ITC to improve traffic flow.
Federal ( FTA) Grants Fiscal Year Amount Grant Program
FY2001 $3,099,834 FTA, Bus, section 5309
FY2002 $5,197,652 FTA, Bus, section 5309
FY2004 $3,883,494 FTA, Bus, section 5309
FY2005 $6,802,447 FTA, Bus, section 5309
FY2006 $3,960,000 FTA, Bus, section 5309
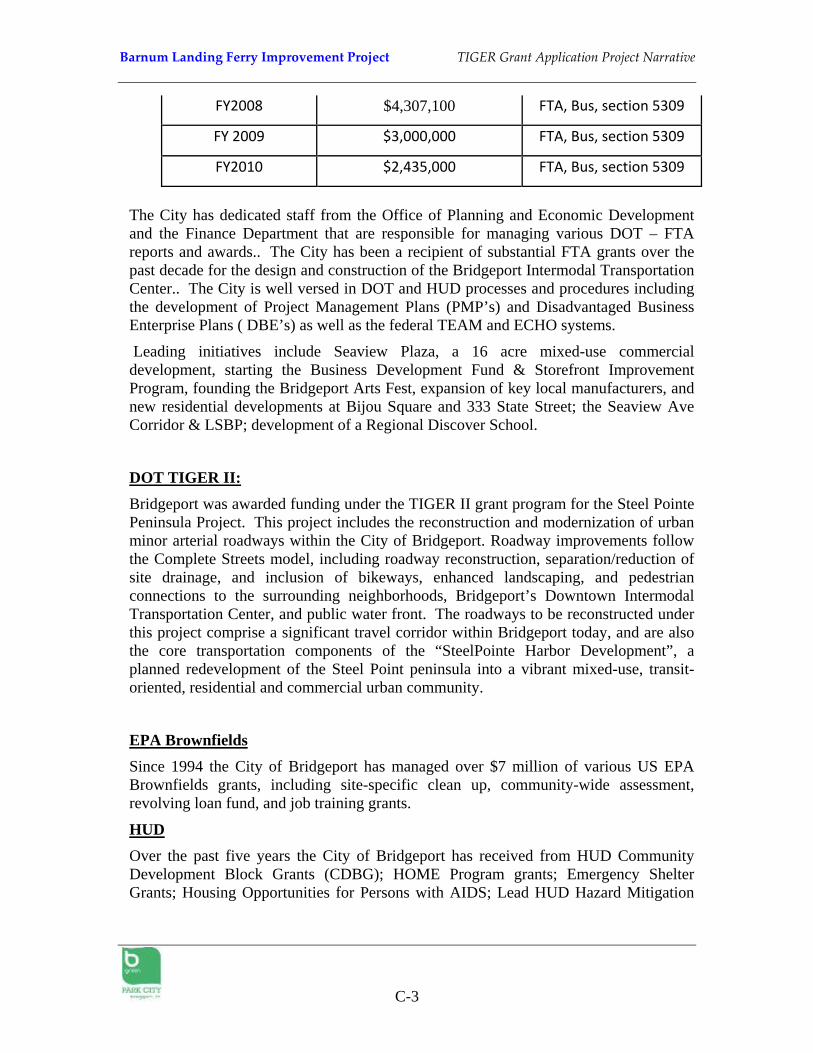
Barnum Landing Ferry Improvement Project TIGER Grant Application Project Narrative
C-3
FY2008 $4,307,100 FTA, Bus, section 5309
FY 2009 $3,000,000 FTA, Bus, section 5309
FY2010 $2,435,000 FTA, Bus, section 5309
The City has dedicated staff from the Office of Planning and Economic Development and the Finance Department that are responsible for managing various DOT – FTA reports and awards.. The City has been a recipient of substantial FTA grants over the past decade for the design and construction of the Bridgeport Intermodal Transportation Center.. The City is well versed in DOT and HUD processes and procedures including the development of Project Management Plans (PMP’s) and Disadvantaged Business Enterprise Plans ( DBE’s) as well as the federal TEAM and ECHO systems.
Leading initiatives include Seaview Plaza, a 16 acre mixed-use commercial development, starting the Business Development Fund & Storefront Improvement Program, founding the Bridgeport Arts Fest, expansion of key local manufacturers, and new residential developments at Bijou Square and 333 State Street; the Seaview Ave Corridor & LSBP; development of a Regional Discover School.
DOT TIGER II: Bridgeport was awarded funding under the TIGER II grant program for the Steel Pointe Peninsula Project. This project includes the reconstruction and modernization of urban minor arterial roadways within the City of Bridgeport. Roadway improvements follow the Complete Streets model, including roadway reconstruction, separation/reduction of site drainage, and inclusion of bikeways, enhanced landscaping, and pedestrian connections to the surrounding neighborhoods, Bridgeport’s Downtown Intermodal Transportation Center, and public water front. The roadways to be reconstructed under this project comprise a significant travel corridor within Bridgeport today, and are also the core transportation components of the “SteelPointe Harbor Development”, a planned redevelopment of the Steel Point peninsula into a vibrant mixed-use, transit-oriented, residential and commercial urban community.
EPA Brownfields Since 1994 the City of Bridgeport has managed over $7 million of various US EPA Brownfields grants, including site-specific clean up, community-wide assessment, revolving loan fund, and job training grants.
HUD
Over the past five years the City of Bridgeport has received from HUD Community Development Block Grants (CDBG); HOME Program grants; Emergency Shelter Grants; Housing Opportunities for Persons with AIDS; Lead HUD Hazard Mitigation
Barnum Landing Ferry Improvement Project TIGER Grant Application Project Narrative
C-4
Grant; and Homeless Prevention and Rapid Re-housing funds. The city has received approximately $7.3 million per year for these programs.
HUD Lead Hazard Control
The City of Bridgeport has been successful in the past 10 years in securing a HUD Lead Hazard Control Grant. The last funding for over $ 3 million was awarded in December 2010 for the grant cycle 2011-2014. Identified locally as the Bridgeport Lead Free Families Program (BLFF), an intervention and prevention program structured to reduce lead hazards for low and very low-income children (ages six and under) in targeted neighborhoods located throughout the City of Bridgeport. The City is moving to build on the existing Lead grant and expand to the Healthy Homes concept. With the 2010 Lead grant award, the City also received $100,000 for Healthy Home initiative. Homes with lead-based paint hazards often have other important health hazards that could be addressed at the same time. The concept is that it is more efficient and cost-effective to identify and mitigate multiple health hazards, rather than follow the traditional approach of addressing individual hazards.
HUD Sustainable Communities
Bridgeport is part of an unprecedented bi-state collaboration of nine cities, two counties and six regional planning organizations that have come together to form the New York-Connecticut Sustainable Communities Consortium. With support from the states of New York and Connecticut, the Consortium is designed to integrate housing, economic development, transportation and environmental planning in the metropolitan region. Working together, the Consortium will develop livable communities and growth centers around existing and planned transit to enhance affordable housing efforts, reduce congestion, improve the environment and continue to expand economic opportunities. A central goal is to link strategies, on a metropolitan scale, to develop mixed-income housing, employment and infrastructure in locations connected by the region’s two commuter rail networks – the MTA Metro-North Railroad and the MTA Long Island Rail Road. The Consortium was awarded $3.5 million in 2010. With a portion of this grant, Bridgeport will explore the feasibility of a new train station at the core of this transit-oriented development opportunity examining ridership, operations, environmental impacts, infrastructure requirements, station locations, and capital and operating costs. This project will likely be conducted jointly to increase regional collaboration and cut costs.
The SCI planning project will also complete a feasibility assessment of a new commuter rail station on the East Side of Bridgeport as part of a plan to redevelop the area as a transit oriented and supportive area. The city of Bridgeport prepared a city-wide sustainability plan (BGreen 2020) that emphasizes the revitalization of the East Side with the construction of a new commuter rail station to serve as the catalyst for redevelopment. The proposed TOD project in Bridgeport envisions the construction of a new commuter rail station on the East Side as the anchor for a revitalization and redevelopment of the area. The surrounding land use is a mix of older vacant, underutilized and deteriorated industrial buildings. The project will reuse and renovate existing structures and remediate brownfield sites and a mix of higher density
Barnum Landing Ferry Improvement Project TIGER Grant Application Project Narrative
C-5
residential units and commercial and industrial activities. The project area also encompasses the planned Seaview Avenue transitway concept. This project will link the port of Bridgeport with the Lake Success Business Park, a ±400 acre industrial site that is currently being remediated for an office park development. The new rail station will be located at the intersection of the New Haven rail line and the transitway.
ARRA In 2009, the City was awarded $22,000,000 in grant funds through the American Recovery and Reinvestment Act. Projects included purchase of public safety vehicles and equipment, and hiring of 20 additional police officers (Department of Justice); energy efficiency activities and programs (Department of Energy); Brownfield Revolving Loan Fund for remediation; Community Development Block grant funding for the demolition of the City’s Congress Street Bridge, Homelessness Prevention and Rapid Re-Housing, and Neighborhood Stabilization Program to demolish blighted properties and rehab foreclosed properties to resell as supportive housing units (HUD); Port Security funding for Police and Fire Marine Unit equipment (FEMA); and funding for re-paving various City streets.
The City is compliant with all quarterly and annual programmatic and financial reports on all cooperative agreements with federal agencies. The City currently has no adverse audit findings and is not considered “high risk”. City departments work in cooperation with the City’s Central Grants Office and the Office of the Comptroller to ensure that all contract requirements are met and that the initiatives are in administrative, programmatic and fiscal compliance.
Barnum Landing Ferry Improvement Project TIGER Grant Application Project Narrative
D-1
ATTACHMENT D Federal Wage Rate Certification